GM 533 Week 6 Part B of the Project Help B Heard Do not post these charts without my permission. Students may download one copy for personal use.

Welcome message from author
This document is posted to help you gain knowledge. Please leave a comment to let me know what you think about it! Share it to your friends and learn new things together.
Transcript

GM 533
Week 6
Part B of the Project Help
B Heard
Do not post these charts without my permission. Students may download one copy for personal use.

Part B of the Project Example
Part B of the Project Example

Part B of the Project Example
• Your manager has speculated the following:a) the average (mean) annual income was less than $50,000
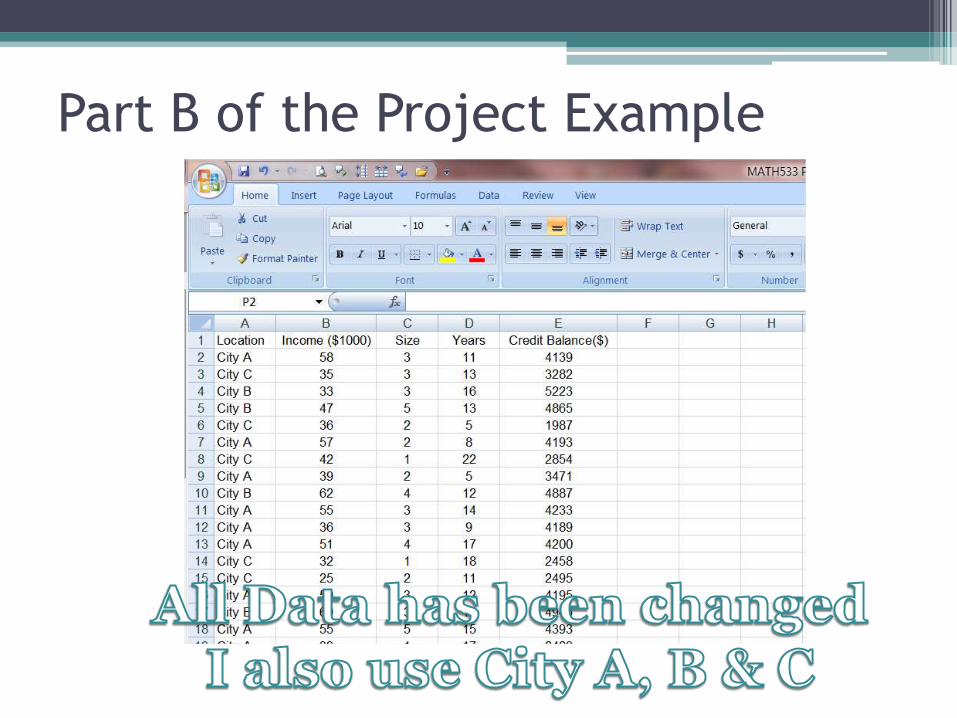
(Changed all data), b) the true population proportion of customers who live in an City C
area exceeds 40%, c) the average (mean) number of years lived in the current home is
less than 12 years, d) the average (mean) credit balance for suburban customers is more
than $4400.
1) Using the sample data, perform the hypothesis test for each of the above situations in order to see if there is evidence to support your manager’s belief in each case a.-d. In each case use the Seven Elements of a Test of Hypothesis, in Section 6.2 of your text book with α = .05, and explain your conclusion in simple terms. Also be sure to compute the p-value and interpret.

Part B of the Project Example
a) the average (mean) annual income was less than $50,000 (Changed all data)
▫ I found the average for annual incomes to be 46.06 or $46,060 and the standard deviation to be 13.712 or $13,712
▫ Set up Hypothesis Test
Ho: µ = 50 (I’m keeping in mind that’s thousands)
H1: µ < 50

Part B of the Project Example
• For α = 0.05 and “<“ in the Ha, I found z = -1.645, so the “Rejection Region” would be z < -1.645
• Now I calculate the test statistic
• z = (46.06-50)/1.939 = -2.032 because σx bar = 13.712/sqrt(50) = 1.93917 (I rounded a little)

Part B of the Project Example
• My calculated test statistic of -2.032 does fall in the rejection region of z < -1.645 therefore I would reject the null hypothesis and say there “is sufficient evidence to indicate µ < 50 or $50,000.”

Part B of the Project Example
b) the true population proportion of customers who live in City C area exceeds 40%,
• 13 of the 50 surveyed live in City C, which is 26% or 0.260, this is my point estimate for p.
• Thus I would have
▫ Ho: p = 0.40 vs. Ha: p > 0.40
Part B of the Project Example
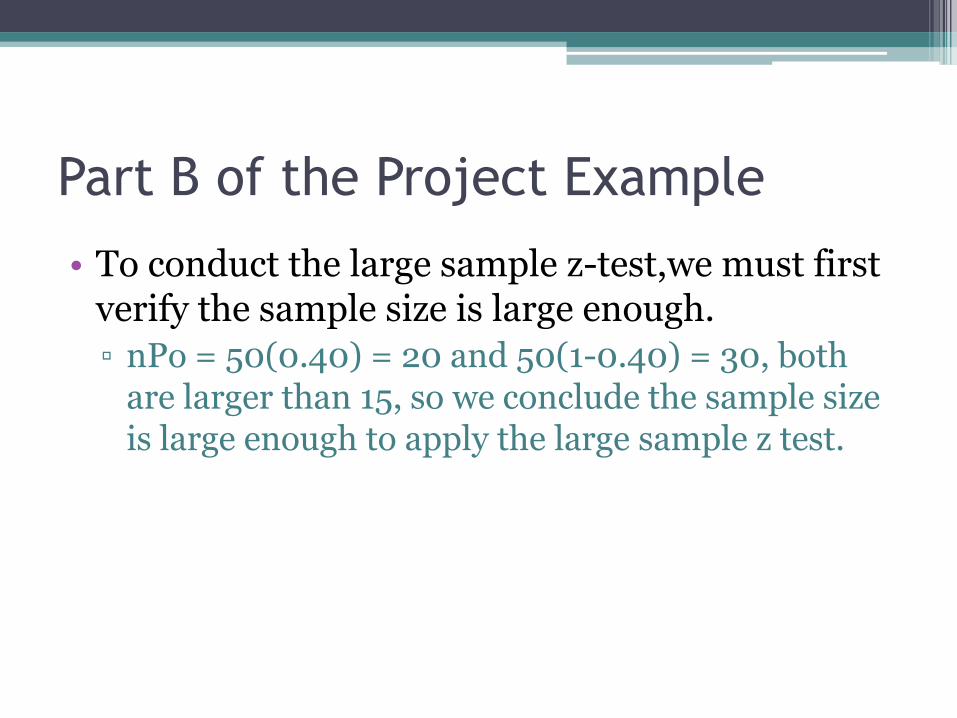
• To conduct the large sample z-test,we must first verify the sample size is large enough.
▫ nPo = 50(0.40) = 20 and 50(1-0.40) = 30, both are larger than 15, so we conclude the sample size is large enough to apply the large sample z test.

Part B of the Project Example
• z = (0.26 – 0.400)/0.69282 = -2.02 where s p hat = sqrt(((0.40)(0.60))/50) = 0.069282
• This is a one tailed (upper or right since Ha has “>”). Our rejection region would be z > 1.645
• -2.02 is definitely not greater than + 1.645 (not in the rejection region) so WE WOULD NOT Reject Ho.
• By not rejecting the Ho, we are saying there is insufficient evidence to conclude the true population of customers who live in City C is greater than 40%

Part B of the Project Example
c) the average (mean) number of years lived in the current home is less than 12 years,
▫ I found the average number of years in the current home for my survey data to be exactly 12.0 (remember I changed the data) and the standard deviation to be 5.135
▫ Set up Hypothesis Test
Ho: µ = 12
H1: µ < 12

Part B of the Project Example• For α = 0.05 and “<“ in the Ha, I found
z = -1.645, so the “Rejection Region” would be z < -1.645
• Now I calculate the test statistic
• z = (12.0-12)/0.7262 = 0 because σx bar = 5.135/sqrt(50) = 0.7262 (I rounded a little)

Part B of the Project Example
• My calculated test statistic of 0 does NOT fall in the rejection region of z < -1.645 therefore I would NOT reject the null hypothesis and say there “is insufficient evidence to indicate µ < 12.”

Part B of the Project Example
d) the average (mean) credit balance for everyone(I CHANGED) customers is more than $4400.
▫ I found the average credit balance for those surveyed $3961.08 (remember I changed the data) and the standard deviation to be 927.7
▫ Set up Hypothesis Test
Ho: µ = 4400
H1: µ > 4400

Part B of the Project Example• For α = 0.05 and “>“ in the Ha, I found z =
+1.645, so the “Rejection Region” would be z > 1.645• Now I calculate the test statistic
• z = (3961.08-4400)/131.2 = -3.346 because σx bar = 927.7/sqrt(50) = 131.2 (I rounded a little)
• The calculated z being negative on this (I changed the data), it should be obvious it is not in the rejection region.

Part B of the Project Example
• My calculated test statistic of -3.346 does NOT fall in the rejection region of z > 1.645 therefore I would NOT reject the null hypothesis and say there “is insufficient evidence to indicate µ >4400.”

Part B of the Project Example
• Don’t forget that on number 1, parts a-d, you were also asked to be sure to compute the p-value and interpret.

Part B of the Project Example
2) Follow this up with computing 95% confidence intervals for each of the variables described in a.-d., and again interpreting these intervals.

Part B of the Project Example

Part B of the Project Example
You would say that you are 95% confident that the true mean income lies between $42,260 and $49,860.

Part B of the Project Example
This would be similar for c and d.I will cover calculating the confidence limits for part b on the next chart.Please DON’T FORGET THAT YOUR PART D IS FOR SUBURBAN ONLY. I DID ALL OF MY DATA.

Part B of the Project Example
• For the confidence interval on part b, I have “p hat” which is 13/50 = 0.26 (Mine was for City C)

Part B of the Project Example
3) Write a report to your manager about the results, distilling down the results in a way that would be understandable to someone who does not know statistics. Clear explanations and interpretations are critical. Write a good report using correct grammar. Try
to find the correct symbols to use, etc. This is not a problem set, it is a report! Cover all of the questions asked, in the order they were asked, but in the FORM of a Report (not like a numbered Homework assignment).
Related Documents