Week 5 ETEC 668 Quantitative Research in Educational Technology Dr. Seungoh Paek February 12, 2014

Week 5 ETEC 668 Quantitative Research in Educational Technology
Dec 30, 2015
Week 5 ETEC 668 Quantitative Research in Educational Technology. Dr . Seungoh Paek February 12, 2014. Tonight ’ s Agenda. Continuing SPSS Introduction to PSPP Introduction to RStudio Introduction to Probability Group Discussion for Research Paper. Continuing Week 4. Using SPSS. - PowerPoint PPT Presentation
Welcome message from author
This document is posted to help you gain knowledge. Please leave a comment to let me know what you think about it! Share it to your friends and learn new things together.
Transcript

Week 5 ETEC 668 Quantitative Research in Educational Technology
Dr. Seungoh Paek
February 12, 2014
Tonight’s Agenda
Continuing SPSS Introduction to PSPP Introduction to RStudio Introduction to Probability Group Discussion for Research Paper

Continuing Week 4

Using SPSS

Using SPSS
igma Freud & Descriptive Statistics
A Picture is Really Worth a Thousand Words
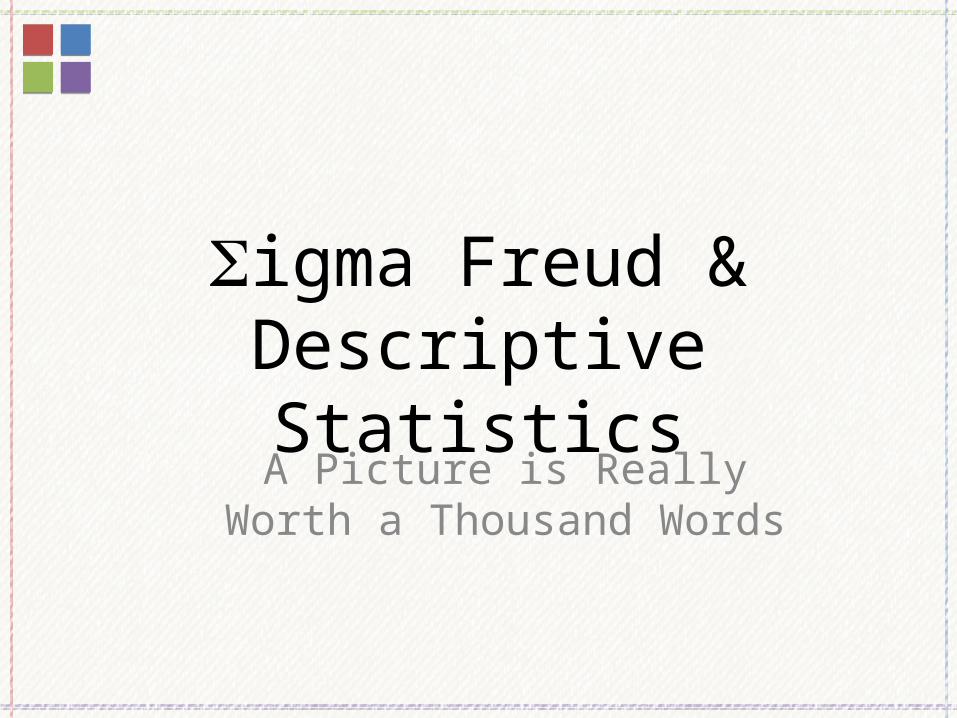
Histograms with Polygon
Hand Drawn Histogram
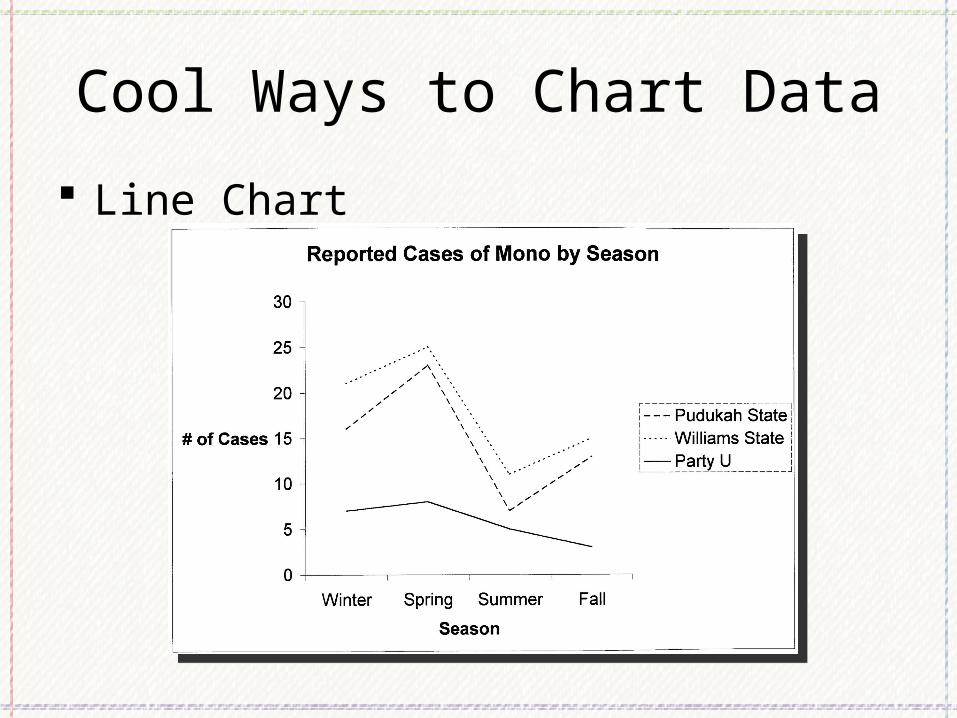
Cool Ways to Chart Data
Line Chart

Cool Ways to Chart Data
Pie Chart
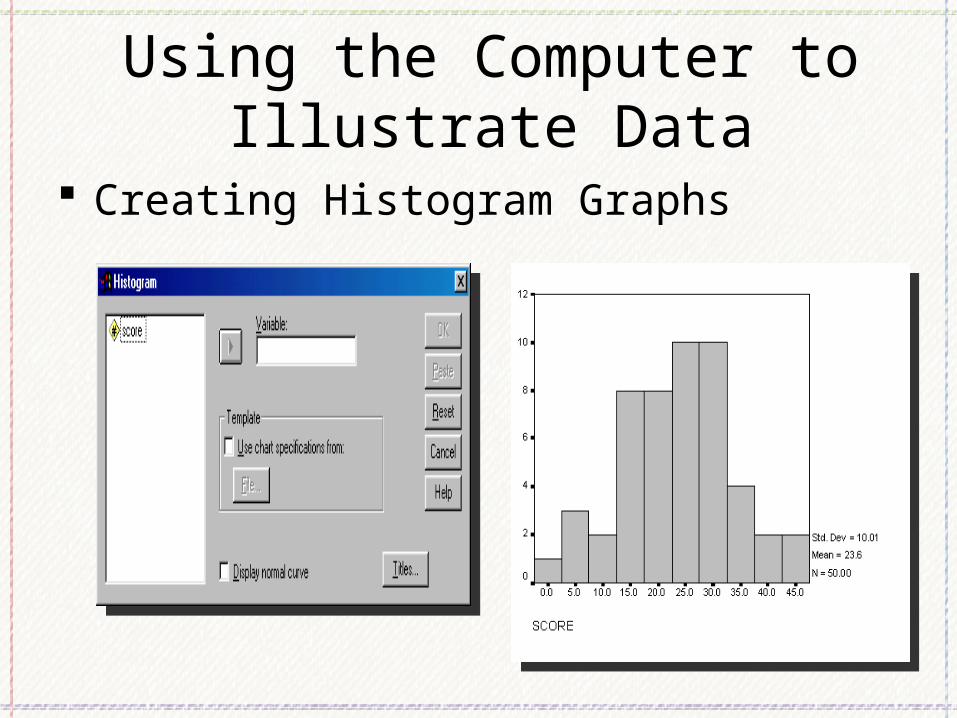
Using the Computer to Illustrate Data
Creating Histogram Graphs
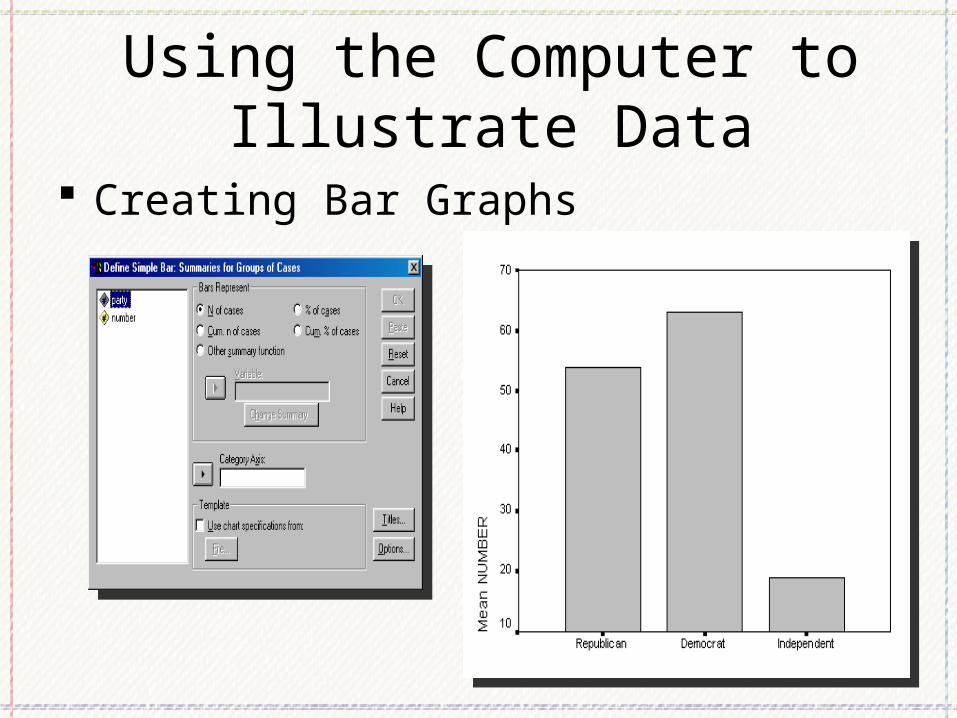
Using the Computer to Illustrate Data
Creating Bar Graphs
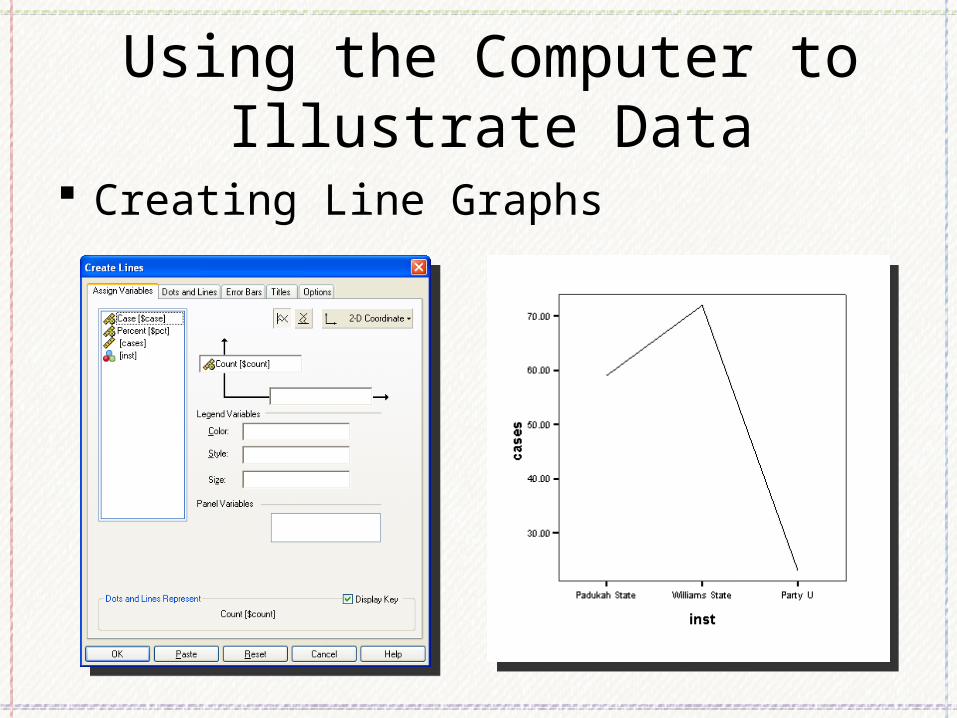
Using the Computer to Illustrate Data
Creating Line Graphs

Using the Computer to Illustrate Data
Creating Pie Graphs

A Taste of PSPP
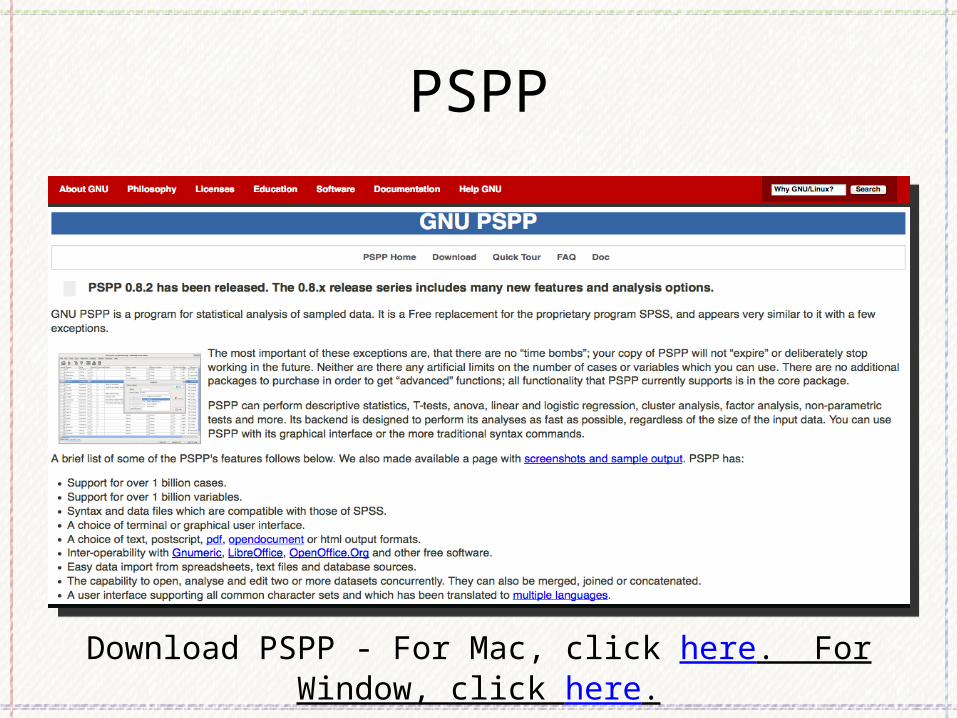
PSPP
Download PSPP - For Mac, click here. For Window, click here.

A TASTE of RSTudio
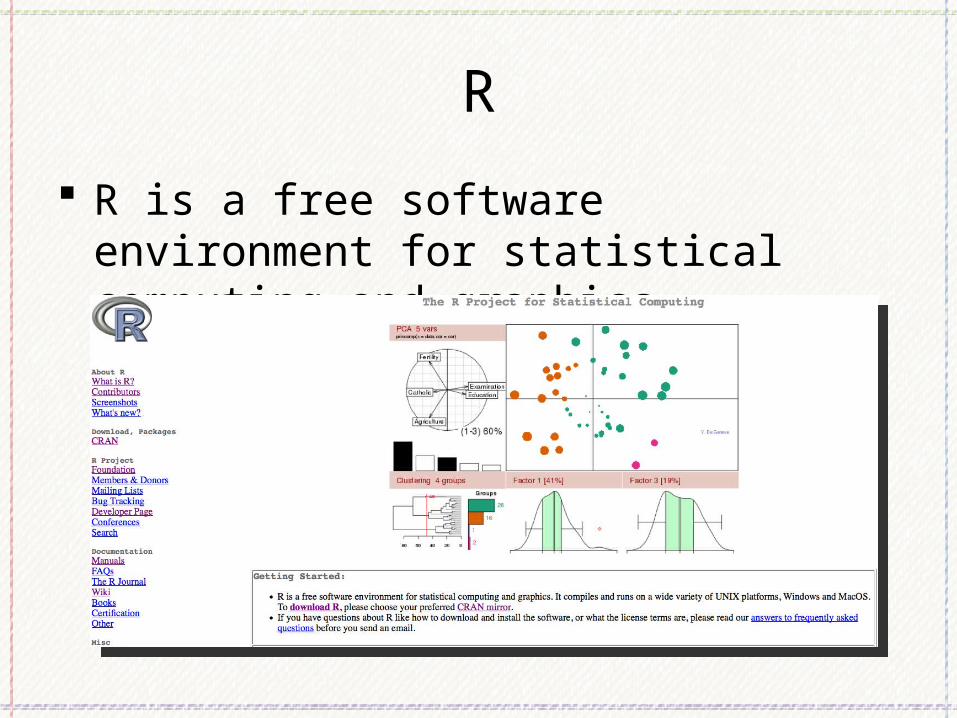
R
R is a free software environment for statistical computing and graphics.

RStudio
RStudio is a free and open source integrated development environment (IDE) for R, a programming language for statistical computing and graphics.
Probability, Samples, Bell Curve, z Scores, Hypotheses, Hypothesis Testing, &
significance
Chapter 7 & Chapter 8
Probability
Why Probability?
Describe and predict what we don’t know from current data
Basis for the Degree of confidence a Hypothesis is “true”– statistical significance
Examples
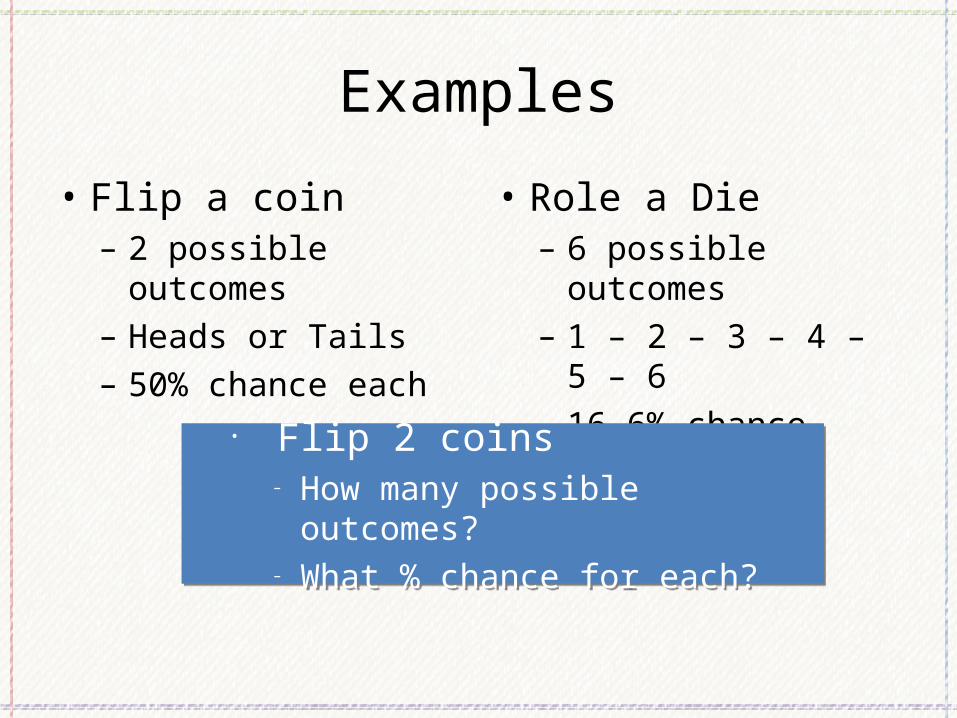
• Flip a coin– 2 possible outcomes– Heads or Tails – 50% chance each
• Role a Die – 6 possible outcomes– 1 – 2 – 3 – 4 – 5 – 6 – 16.6% chance each
• Flip 2 coins– How many possible outcomes?– What % chance for each?
• Flip 2 coins– How many possible outcomes?– What % chance for each?
Examples
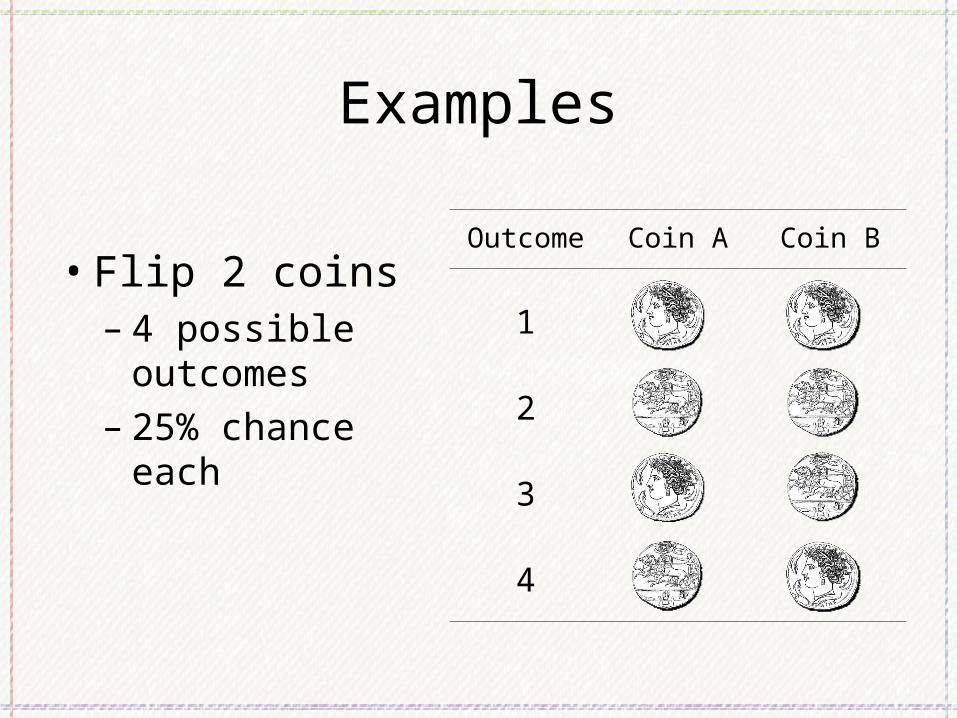
• Flip 2 coins– 4 possible outcomes– 25% chance each
Outcome Coin A Coin B
1
2
3
4
Sample v Population
Definitions
Population– The large group to which you would like to
generalize your findings
Sample– The smaller, representative group of the
population used for research.
Characteristics of a sample
Needs to be representative Truly random = representative = unbiased Sampling error – – how well the sample represents the population
Size matters – – larger sample = more representative
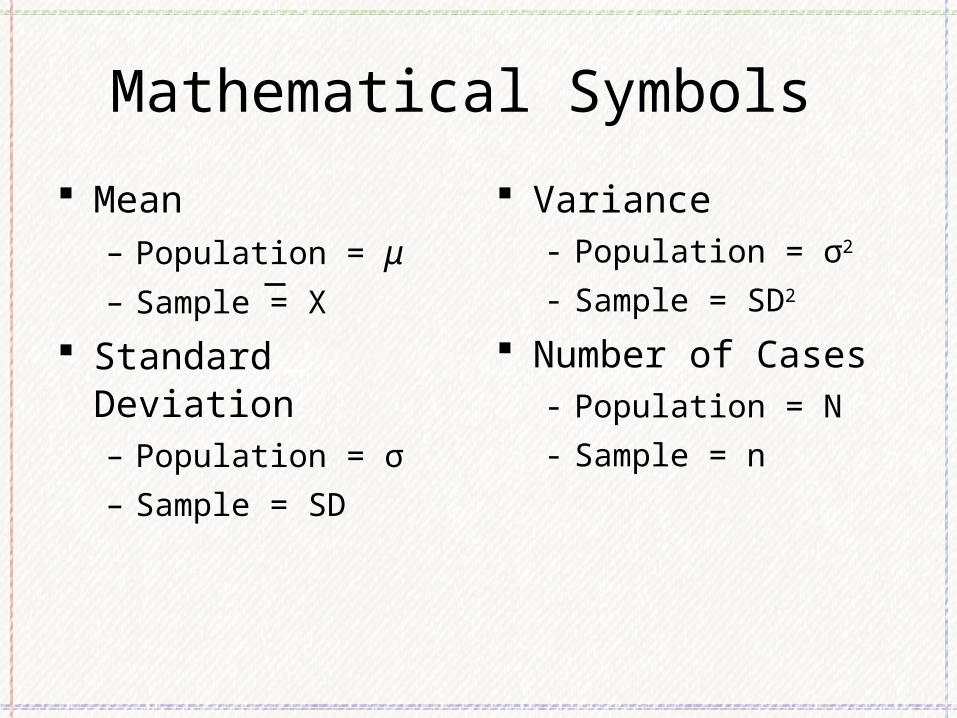
Mathematical Symbols
Mean – Population = μ– Sample = X
Standard Deviation– Population = σ
– Sample = SD
Variance- Population = σ2
- Sample = SD2
Number of Cases- Population = N
- Sample = n

The Normal Curve
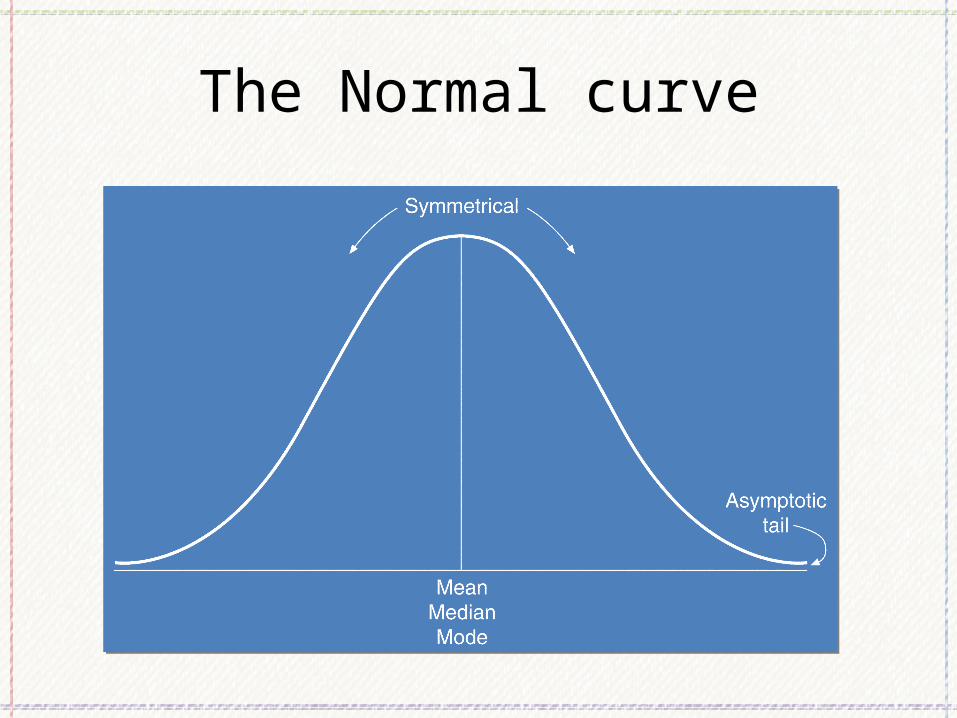
The Normal curve

More Normal Curve

About Normal Curve
Almost all scores fall between -3 and +3 SD from mean– 99.74%
Specific percentages between points on x-axis– 2 or more normal curves can be compared

Normal Curve and Percents
z Scores
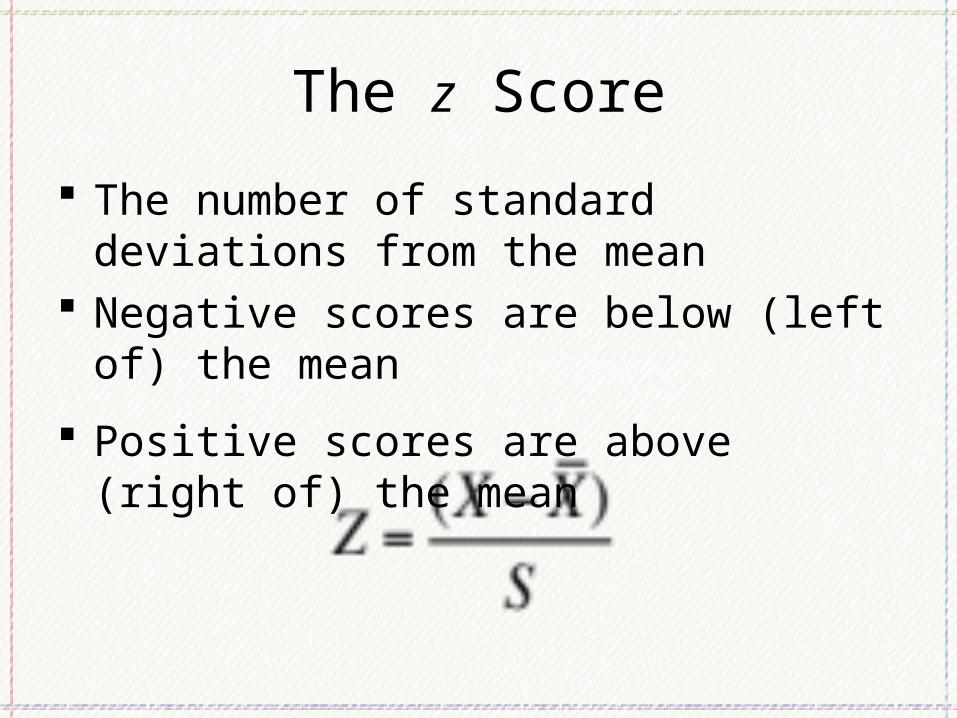
The z Score
The number of standard deviations from the mean
Negative scores are below (left of) the mean
Positive scores are above (right of) the mean
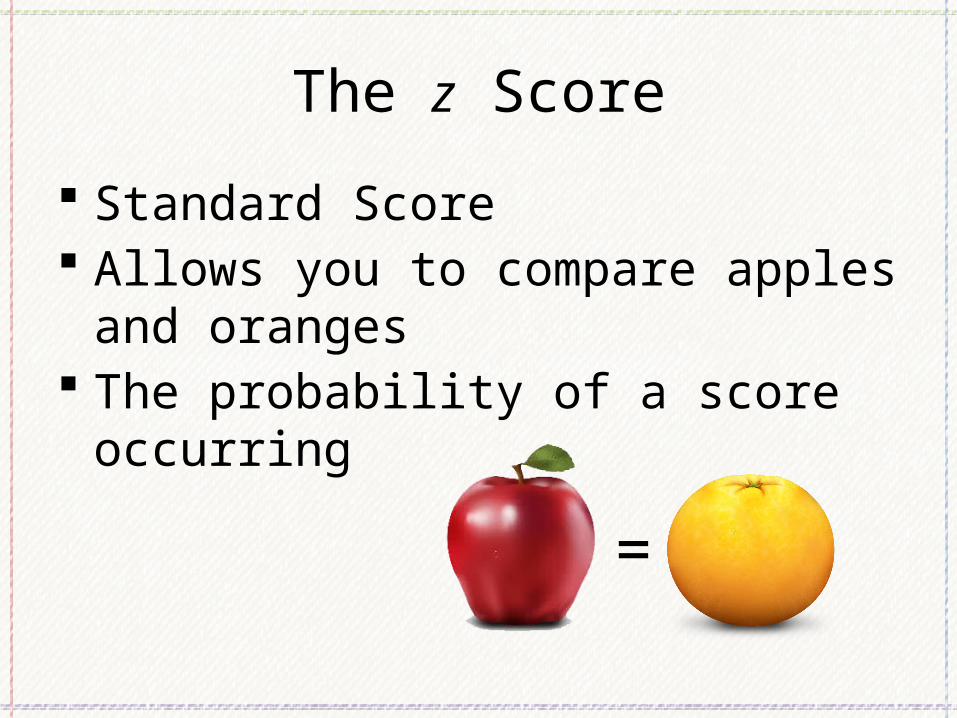
The z Score
Standard Score Allows you to compare apples and
oranges The probability of a score occurring
=

Hypotheses

What is a Hypothesis?
An “educated guess” Direct extension of the question Translates problem or research question into a
testable form Two types– Null Hypothesis
– Research Hypothesis
A Good Hypothesis
Declarative statement Expected relationship between variables Reflection of theory/literature Brief, to the point Testable
Why a Null Hypothesis?
No amount of experimentation can ever prove me right; a single experiment can prove me wrong.
~ Albert Einstein
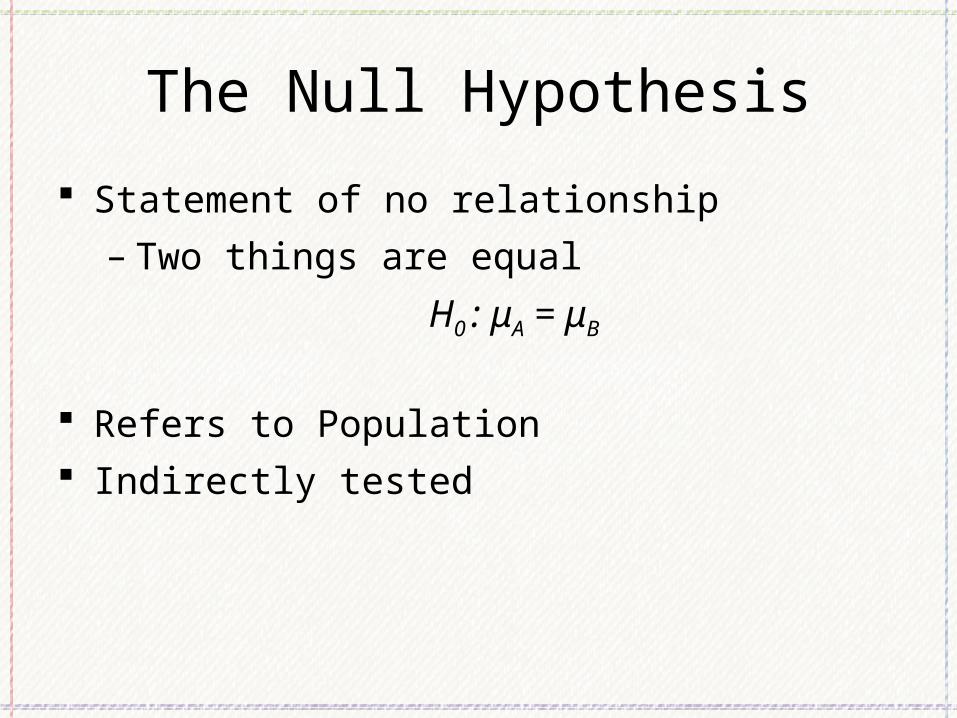
The Null Hypothesis
Statement of no relationship
– Two things are equal
H0 : μA = μB
Refers to Population Indirectly tested
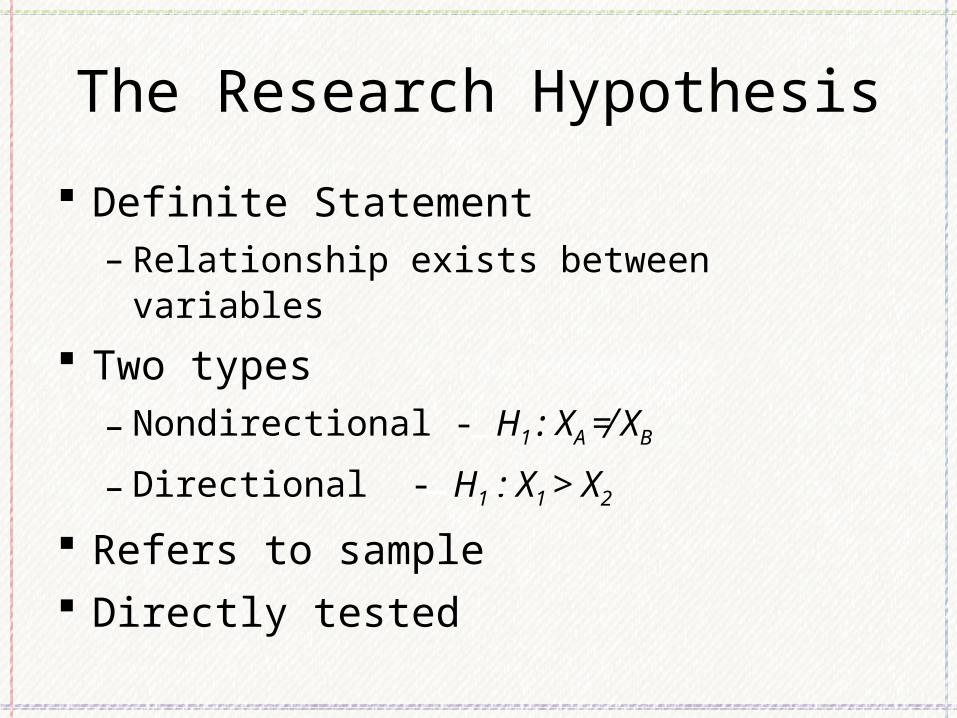
The Research Hypothesis
Definite Statement– Relationship exists between variables
Two types– Nondirectional - H1 : XA ≠ XB
– Directional - H1 : X1 > X2
Refers to sample Directly tested

Hypothesis Testing
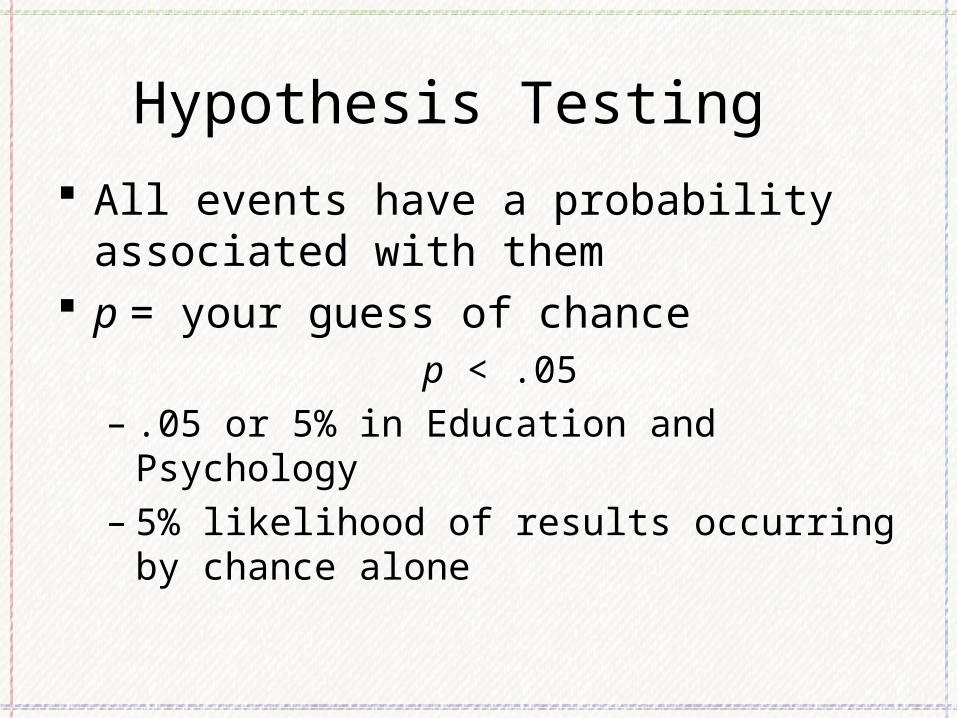
Hypothesis Testing
All events have a probability associated with them
p = your guess of chancep < .05
– .05 or 5% in Education and Psychology– 5% likelihood of results occurring by chance
alone

Error types
Type I– Reject H0 when you should not
Type II– Fail to reject H0 when you should
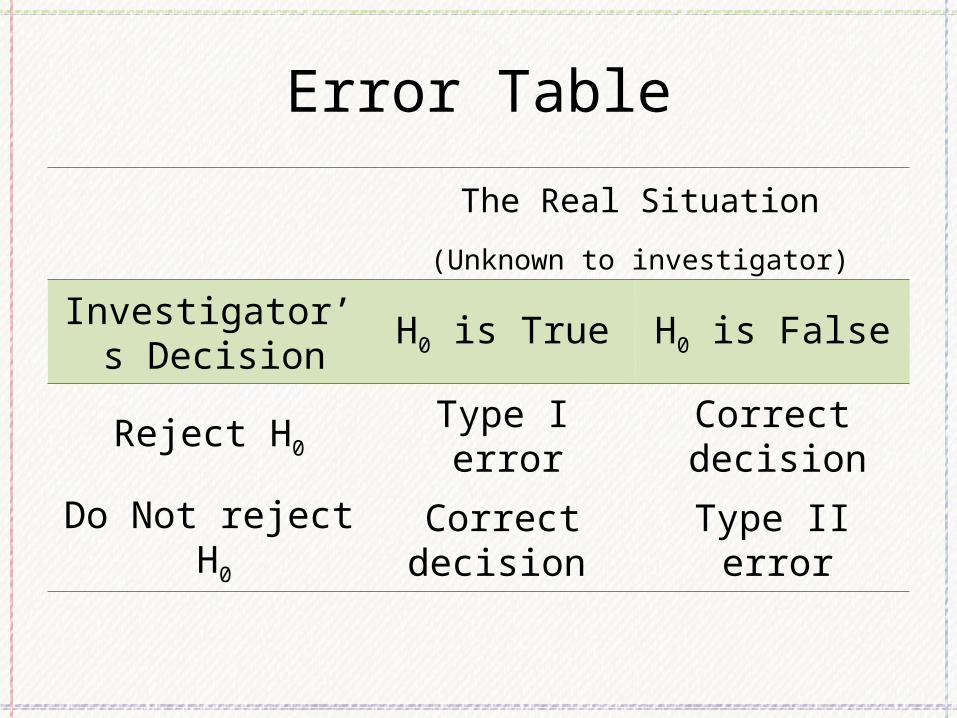
Error Table
The Real Situation
(Unknown to investigator)
Investigator’s Decision
H0 is True H0 is False
Reject H0 Type I errorCorrect decision
Do Not reject H0Correct decision
Type II error

Significance

Statistical
Based on probability Research was technically successful
H0 was rejected
P value– Education p < .05 = 5% chance
– Medical p < .01 or .001 = 1% or .1% chance

Practical
Does it mean anything to the population?– Is that new treatment worth the cost?– Are my students really doing that much better?

Questions?

Stating the Research Question
February 12, 2014
Where are we now?
Identified a problem focus Familiar with the literature Next step – determine specific questions for
your research study Research questions provide the basis for
planning research study – design, materials, data analysis

Can meaningful learning be enhanced by using a computer to personalize math word problems for each student?

Research Questions
vs
Research Hypotheses

Research Questions in Qualitative Research
Preferred when little is known about a phenomenonUsed when previous studies report conflicting resultsUsed to describe phenomena
Research Hypotheses for Quantitative Research
Educated guess or presumption based on literature
States the nature of the relationship between two or more variables
Predicts the research outcome Research study designed to test the
relationship described in the hypothesis

Null Hypotheses
Implicit complementary statement to the research hypothesis
States no relationship/difference exists between variables
Statistical test performed on the null Assumed to be true until support for the
research hypothesis is demonstrated
Alternative Hypotheses
Directional hypothesis– Precise statement indicating the nature and
direction of the relationship/difference between variables
Nondirectional hypothesis– States only that relationship/difference will
occur

Assessing Hypotheses
Simply stated? Single sentence? At least two variables? Variables clearly stated? Is the relationship/difference precisely
stated? Testable?

Types of Variables
Variable – Element that is identified in the hypothesis or
research question– Property or characteristic of people or things
that varies in quality or magnitude – Must be identified as independent or dependent

Independent Variables (IV)
Manipulation or variation of this variable is the cause of change in other variables
Technically, independent variable is the term reserved for experimental studies– Also called antecedent variable, experimental
variable, treatment variable, causal variable, predictor variable
Dependent Variables (DV)
The variable of primary interest Research question/hypothesis describes,
explains, or predicts changes in it The variable that is influenced or changed
by the independent variable– In non-experimental research, also called
criterion variable, outcome variable
Intervening or Mediating Variables
Intervening/Mediating variable– Presumed to explain or provide a link between
independent and dependent variables– Relationship between the IV and DV can only be
explained when the intervening variable is present
– E.g. effect of study prep on test scores– Organization of study ideas into a framework
(intervening/mediating)

Control Variables
Special type of IV that can potentially influence the DV
Use statistical procedures (e.g. analysis covariance) to control for these variables
May be demographic or personal variables that need to be “controlled” so that true influence of IV on DV can be determined

Confounding Variables
Confounding variable– Confuses or obscures the effect of independent
on dependent– Makes it difficult to isolate the effects of the
independent variable – Typically cannot be directly measured or
observed– Researchers comment on the influence after
study is completed
Relationship Between Independent and Dependent Variables
Cannot specify independent variables without specifying dependent variablesNumber of independent and dependent variables depends on the nature and complexity of the studyThe number and type of variables dictates which statistical test will be used
Model for Writing Descriptive Questions & Hypotheses
Identify IV, DV & any intervening/moderating variables
Specify descriptive questions for each IV, DV & intervening variable
Write inferential questions that relate variables or compare groups
Scenario
A researcher wants to study the relationship of critical thinking skills to student achievement in science classes for 8th-graders in a large metropolitan school district. The researcher controls for the effects of prior grades in science classes and parents’ educational attainment.

Step 1: Identify variables
What is the IV?
Step 1: Identify variables
What is the IV?- Critical thinking skills (measured on an
instrument)

Step 1: Identify variables
What is the DV?
Step 1: Identify variables
What is the DV?- Student achievement (measured by grades)
Step 1: Identify variables
What are the control variables?
Step 1: Identify variables
What are the control variables?– Prior grades in science class– Educational attainment of parents

Descriptive Questions
How do the students rate on critical thinking skills?
What are the students’ achievement grades in science classes?
What are the students’ prior grades in science classes?
What is the educational attainment of the parents of the 8th graders?

Inferential Questions
Does critical thinking ability relate to student achievement?
Does critical thinking ability relate to student achievement, controlling for the effects of prior grades in science and the educational attainment of the 8th-graders’ parents?

What to do Week 5
1. Do the required readings for Week 06.– Salkind, N. J. Chapter 16. Redicting Who’ll Win the Super Bowl: Using
Linear Regression– Salkind, N. J. Chapter 20. The Ten (or More) Best Internet Sites for
Statistics Stuff
2. Continue the group discussion on the final research paper, and post the 1) literature review outline and 2) research questions for your paper to the Forum in Laulima (Due by Tuesday, February 18th).
Related Documents