Week 1: Introduction to Stata Marcelo Coca Perraillon University of Colorado Anschutz Medical Campus Health Services Research Methods I HSMP 7607 2019 1

Welcome message from author
This document is posted to help you gain knowledge. Please leave a comment to let me know what you think about it! Share it to your friends and learn new things together.
Transcript

Week 1: Introduction to Stata
Marcelo Coca Perraillon
University of ColoradoAnschutz Medical Campus
Health Services Research Methods IHSMP 7607
2019
1

Outline
Log files, comments
Exploring a dataset
Exploring variables
Graphs
Other useful code
2

The big picture
Today’s class is an overview of Stata to get you started
Go over chapters 1 and 2 of Cameron and Trivedi (posted)
I’ll introduce more commands and tricks during the semester as partof the lecture examples and homeworks
Remember, I’ll always answer Stata questions
Tips:
Go over the code I use in class for slidesUse Stata help and explore command optionsUse the menus as it will write code
3

A good way of working with Stata (if you have a largemonitor)
4

Interacting with Stata
You can enter code in interactive mode in the command window
You can use DOS or Unix commands, like: pwd, ls, cd, dir, cls
Useful for quick checks and to get help but as a rule, just don’t do it
Always write a “do file” with comments to preserve your work. Selectthe text in the do-file editor and press Control+D to run the code(or use the menu)
Do files are text files with a “.do” extension (a collection of Statacode and notes)
Today’s do file file is called IntroToStata.do
We’re going to use the omnipresent auto data: auto.dta
5

An example do file
/*
Intro to Stata do file
Updated 1/20/2019
*/
// ---- Preliminaries
* Change directory
cd "H:\Teaching\Methods 2019\Lectures\stata"
set more off
set scheme s1mono
set seed 1234567
log using introtostata.log, text replace
// ----- Load data
use auto.dta, clear
* could type: sysuse auto
// ----- Explore data
* Close log
log close 6

Importing data and syntax structure
All homeworks and examples will use data in Stata format (extension.dta).
Stata has many ways of importing data. Type “help import”
Stata documentation is extensive and outstanding. You canaccess the PDF documentation by clicking on the blue text (forexample, [D] Import)
Or by using the menu: Help and then PDF documentation
Stata syntax is consistent
In general there is a command name followed by selection of variablesand then a comma followed by options (sometimes there is a prefixbefore the command)
For example: help tabulate oneway
7

Syntax
8

Explore the dataset
Always a good place to start
1 List all variables using the command describe
2 Understand more about the storage type by using the commandcoodebook
3 Use the data editor/browser to actually see the data4 Check for missing values5 Sometimes it helps to change the order: order foregin (now variable
foreign is the first variable in the dataset)
Be careful about how the data is stored versus how it is displayed
Variables can have labels; values of variables can also have labels
9

Consistency is very important at Stata Corp
Being organized and consistent is very important for Stata
This leads to some quirks from the user perspective although they arenot quirks from Stata’s perspective
For example, if you want to create new variable called newvariable tobe equal to one, you can’t just type “newvariable = 1”
Why not? Well because Stata always expects a command first sothere has to be a command that is used to create or generate avariable. So the syntax is “generate newvaraible = 1” or “gennewvariable = 1”
What about if you want to replace some of the values of a variablethat has already being defined? Well, that’s a different operation soyou can’t just type “gen newvariable = 2” because newvariablealready exists. See, it’s pretty logical
The correct syntax is “replace newvariable = 2”
10

Labels
The variable foreign is a numeric variable with values 1 or 0
. sum price if foreign == "Domestic"
type mismatch
r(109);
. label list origin
origin:
0 Domestic
1 Foreign
. sum price if foreign == 0
Variable | Obs Mean Std. Dev. Min Max
-------------+---------------------------------------------------------
price | 52 6072.423 3097.104 3291 15906
11

Explore the data
For numeric variables, use the summarize command
For categorical variables, tabulate (tab or tab1)
The command tabstat is a useful to get summary statistics by group
Examples:
tab foreign
sum price
sum price, det
by foreign, sort: sum price
tabstat price, by(foreign) stats(N mean sd min max)
tabstat price, by(foreign) stats(N mean median sd range min max)
12

Using resultsMost Stata commands save results in variables so you can use themlaterFor example, if you type help summarize, the last item in the helpwindow is a a list of stored resultsAnother way of obtaining the list is by typing return list or ereturnlist
Stata is always well organized, which is great for Stata but sometimesconfusing for users (e.g. types of commands)
. qui sum weight
. return list
scalars:
r(N) = 74
r(sum_w) = 74
r(mean) = 3019.45945945946
r(Var) = 604029.8407997037
r(sd) = 777.1935671373662
r(min) = 1760
r(max) = 4840
r(sum) = 22344013

Using results II
You can use the results for calculations. For example, obtaining therange or the variance (and display works as a calculator)
You can store results into variables
. *range
. display r(max) - r(min)
3080
. * variance
. di r(sd)^2
604029.84
. * store
. scalar variance = r(sd)^2
. di variance
604029.84
. di 2+ 2
4
14

Graphs
Making graphs is a quick way of learning about your data
Useful graphs: histograms, two-way relationships, overlays, scatterplotmatrix
We will use a lot of graphs in this class. Get used to working withgraphs with Stata
You know, a picture is worth 1,000 words...
15
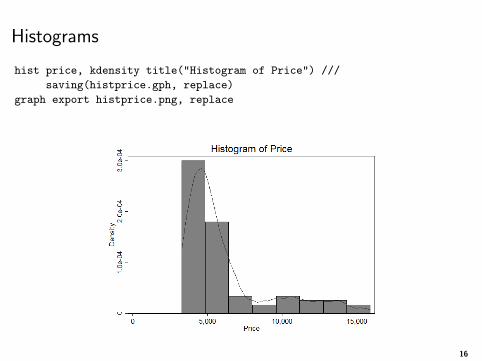
Histograms
hist price, kdensity title("Histogram of Price") ///
saving(histprice.gph, replace)
graph export histprice.png, replace
16

Box plot
graph box price, over(foreign)
* Type "help graph box" to learn about box plots
17

Two-way plots
graph twoway scatter price weight
graph twoway (scatter price weight if foreign == 0, color(red)) ///
(scatter price weight if foreign == 1, color(blue) legend(off))
18
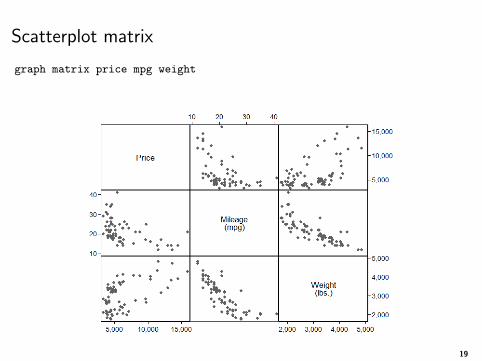
Scatterplot matrix
graph matrix price mpg weight
19

Combining graphs
graph combine scat.gph boxprice.gph, col(2) saving(combo.gph, replace)
graph export combo.png, replace
20

Useful commands
* Rename variables
rename oldname newname
* Generate/transform variables
gen newvarname = log(varname)
gen lage = log(age)
gen profession = "lawyer" if profcode == 24 & code2 ~= 4 // note the double equal sign.
* If the variable already exists, we need to use replace
gen indicator = 1 if age <=20
replace indicator = 0 if age > 20
* Careful with missing values: they are +infinity in Stata
* Egen stands for "extended generate"
egen meanage = mean(age) // meanage is a constant with the mean of age
* Sorting and "by" commands
sort state
by state: sum unemploymentrate
* Special variables
gen obsnumber = _n // see http://www.ats.ucla.edu/stat/stata/notes/countn.htm
* Dropping variables
drop var1 var2
* Dropping all except the listed variables
keep var1 var2
21

Programming
“Macros” in Stata are variables that store a string or characters ornumbers that can be used later
global myvars price weight length gear_ratio
sum $myvars
local myvars price weight length gear_ratio
sum ‘myvars’
Loops saves you typing
foreach var in $myvars {
sum ‘var’
}
forvalues i=1(2)10 {
di ‘i’
}
Loops can be nested. See:https://www.ssc.wisc.edu/sscc/pubs/stata_prog1.htm
22

Other commands to explore, etc
list, count, rename, clear, drop, keep, encode, decode, reshape
notes, esample
Simulations: Check out the simulate command (we won’t use it butit’s super helpful)
If interested, Stata has a matrix algebra language, called Mata
The newer versions have more and more Bayesian models – maybe wehave time to squeeze a bit of Bayesian stats; it’s cool
23

Miscellaneous
Many resources online. UCLA’s online help is excellent (see theirStarter Kit): http://www.ats.ucla.edu/stat/stata/
Check out the answer keys to problem sets for more tricks and otherways of doing things
Play with Stata (won’t explode)
Use the help files and examples
Google (aka the oracle) is your friend
ASK QUESTIONS!
24
Related Documents