Week 1 - Causal Theories 1 Introduction: Causal theories and interrelationships between measures of disease occurrence Lydia B. Zablotska, MD, PhD Associate Professor Department of Epidemiology and Biostatistics

Week 1 - Causal Theories 1 I ntroduction: C ausal theories and interrelationships between measures of disease occurrence Lydia B. Zablotska, MD, PhD Associate.
Dec 25, 2015
Welcome message from author
This document is posted to help you gain knowledge. Please leave a comment to let me know what you think about it! Share it to your friends and learn new things together.
Transcript

Week 1 - Causal Theories 1
Introduction: Causal theories and interrelationships between measures of
disease occurrence
Lydia B. Zablotska, MD, PhDAssociate ProfessorDepartment of Epidemiology and Biostatistics
Week 1 – Causal Theories 2
Learning Objectives
Discuss how causal inference is central to the role of epidemiology Brief history of causal thinking through the years Theories of causal inference Causal models
Sufficient-component cause model Describe (and critique) Rothman’s causal heuristic
Counterfactual model Counterfactual effect measures: rate ratios, risk ratios and odds ratios
Effect measures vs. measures of association Measures of attributable risk
Causal diagrams (eg., directed acyclic graphs)
Discuss how epidemiologic thinking leads to causal inference Discuss and critique Bradford Hill’s causal criteria
Week 1 – Causal Theories 3
Practice of Epidemiology
Example:
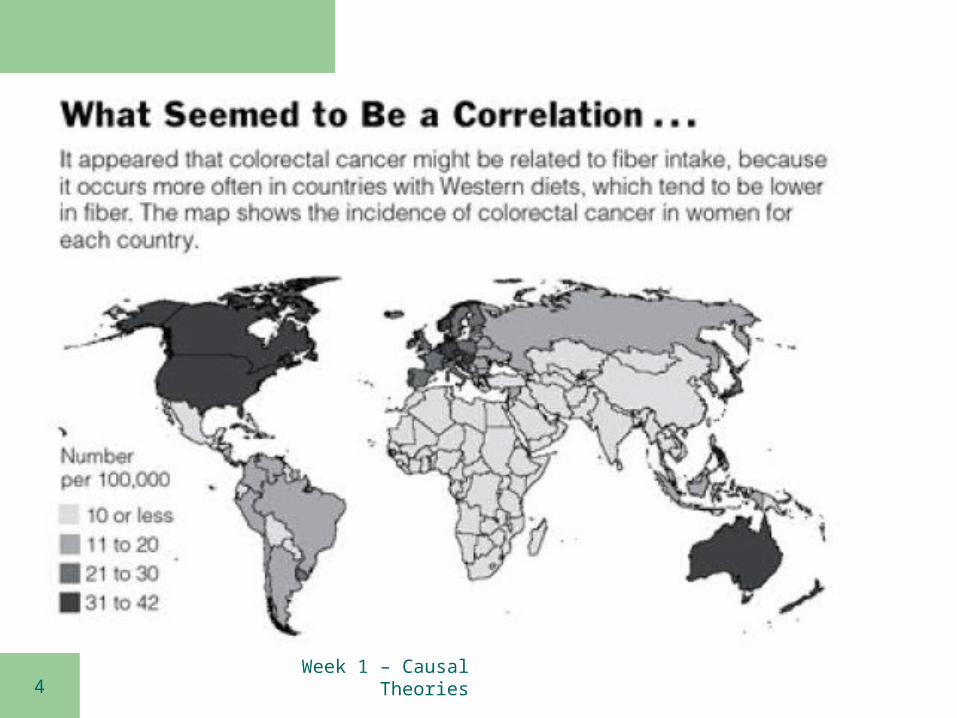
Study of the association between fiber intake and risk of colorectal cancerSEER 2008
Incidence rates of colorectal cancer per year in the U.S.:
Males – 60 per 100,000
Females – 43 per 100,000
Week 1 – Causal Theories 4
Week 1 – Causal Theories 5
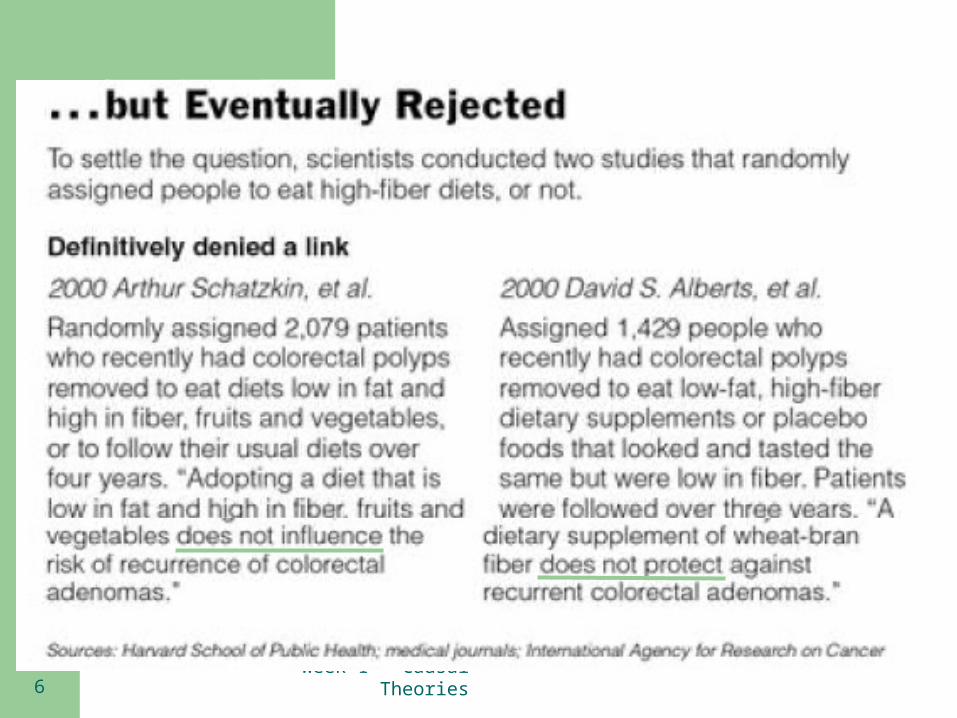
Week 1 – Causal Theories 6
Week 1 – Causal Theories 7
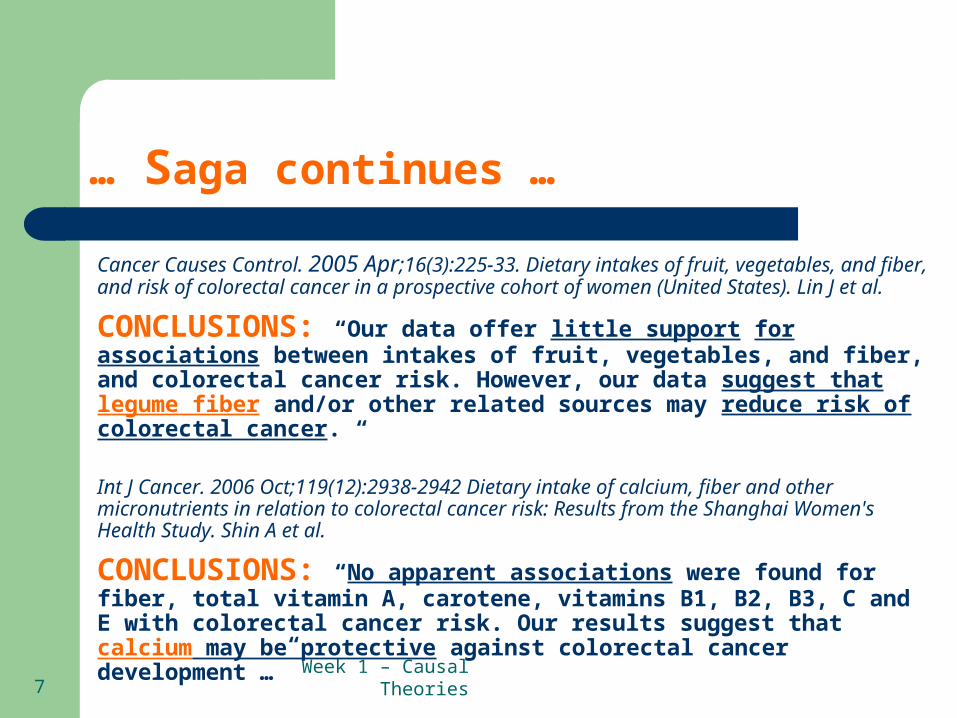
… Saga continues …
Cancer Causes Control. 2005 Apr;16(3):225-33. Dietary intakes of fruit, vegetables, and fiber, and risk of colorectal cancer in a prospective cohort of women (United States). Lin J et al.
CONCLUSIONS: “Our data offer little support for associations between intakes of fruit, vegetables, and fiber, and colorectal cancer risk. However, our data suggest that legume fiber and/or other related sources may reduce risk of colorectal cancer. “
Int J Cancer. 2006 Oct;119(12):2938-2942 Dietary intake of calcium, fiber and other micronutrients in relation to colorectal cancer risk: Results from the Shanghai Women's Health Study. Shin A et al.
CONCLUSIONS: “No apparent associations were found for fiber, total vitamin A, carotene, vitamins B1, B2, B3, C and E with colorectal cancer risk. Our results suggest that calcium may be protective against colorectal cancer development …”

Week 1 – Causal Theories 8
… and continues…
Am J Clin Nutr 2007;85:1353– 60.Dietary fiber and whole-grain consumption in relation to colorectal cancer in the NIH-AARP Diet and Health Study1–5. A. Schatzkin et al.
CONCLUSIONS: “Total dietary fiber intake was not associated with colorectal cancer. In analyses of fiber from different food sources, only fiber from grains was associated with a lower risk of colorectal cancer... Whole-grain intake was inversely associated with colorectal cancer risk...
Week 1 – Causal Theories 9
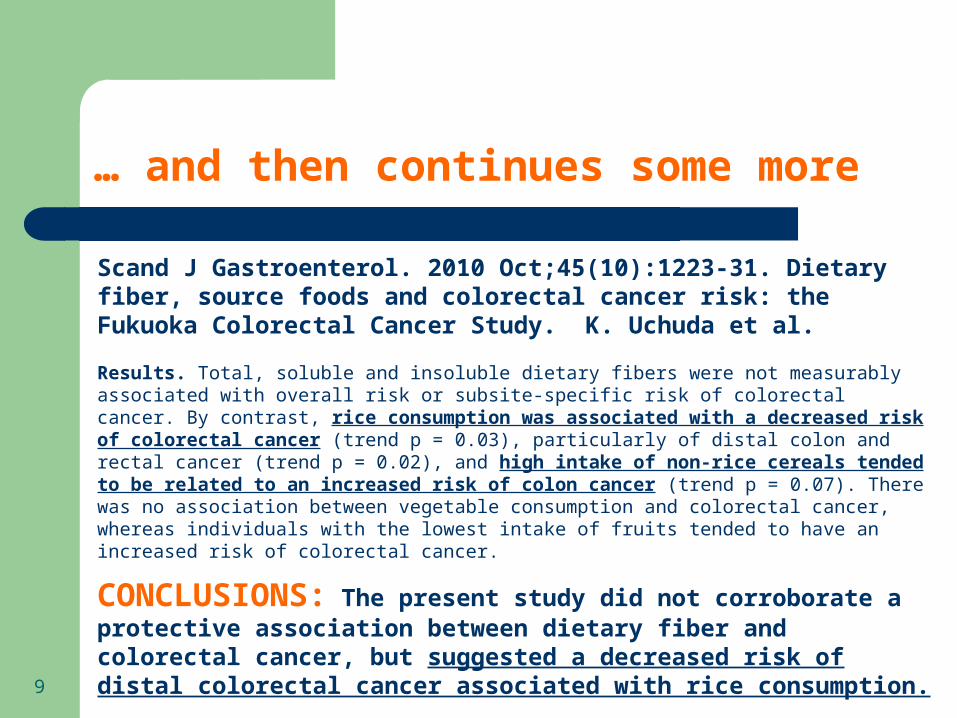
Scand J Gastroenterol. 2010 Oct;45(10):1223-31. Dietary fiber, source foods and colorectal cancer risk: the Fukuoka Colorectal Cancer Study. K. Uchuda et al.
Results. Total, soluble and insoluble dietary fibers were not measurably associated with overall risk or subsite-specific risk of colorectal cancer. By contrast, rice consumption was associated with a decreased risk of colorectal cancer (trend p = 0.03), particularly of distal colon and rectal cancer (trend p = 0.02), and high intake of non-rice cereals tended to be related to an increased risk of colon cancer (trend p = 0.07). There was no association between vegetable consumption and colorectal cancer, whereas individuals with the lowest intake of fruits tended to have an increased risk of colorectal cancer.
CONCLUSIONS: The present study did not corroborate a protective association between dietary fiber and colorectal cancer, but suggested a decreased risk of distal colorectal cancer associated with rice consumption.
… and then continues some more
Week 1 – Causal Theories 10
Epidemiology in the news…
Jennifer Kelsey on diet and nutrition articles in The New York Times, “week after week of cause after cause.”
Week 1 – Causal Theories 11
Why worry about causes?
So that we can intervene
So that we can reduce or prevent disease
Week 1 – Causal Theories 12
What is a cause?
“A cause is something that makes a difference. Insofar as epidemiology is a science...[that] aims to discover the cause of health states, the search includes all determinants of health outcomes. These may be both active agents... and static conditions such as the attributes of persons and places.”
Mervyn Susser
Week 1 – Causal Theories 13
What is a cause?
“A cause is something that makes a difference. Insofar as epidemiology is a science...[that] aims to discover the cause of health states, the search includes all determinants of health outcomes. These may be both active agents... and static conditions such as the attributes of persons and places.”
Mervyn Susser
Week 1 – Causal Theories 14
Back to basics:
Epidemiology is …
“science that focuses on the occurrence of disease rather than on the natural history or some other aspect of the disease”
K. Rothman

Week 1 – Causal Theories 15
“… the study of the distribution and determinants of disease frequency” in human populations
MacMahon and Pugh (1970)
Week 1 – Causal Theories 16
MacMahon and Pugh (1970)
We also add:
… AND the application of this study to
• control health problems
• improve public health
“… the study of the distribution and determinants of disease frequency” in human populations

Week 1 – Causal Theories 17
Epidemiology defined:
Aims to find causes of diseases and to explain varying patterns of disease occurrence across populations and groups
The basic science or one of the pillars of public health
Way of thinking and logically structuring scientific enquiry in public health
Scientific discipline with roots in biology, medicine, logic, and the philosophy of science
Week 1 – Causal Theories 18
Societal origins of epidemiology
Epidemiology affects the daily lives of most people
Comes from the Greek words epi and demos, meaning ‘the study of people’
Originated in the Sanitary Era (XIX century) out of necessity to improve the economic productivity by decreasing squalor of the industrial slums
Epidemiology is the result of the evolution of progressive thinking and our understanding of the basic human rights

Week 1 – Causal Theories 19
And since it is the purpose of epidemiology to…
Identify factors that cause the distribution of disease
Week 1 – Causal Theories 20
And since it is the purpose of epidemiology to…
Identify factors that cause the distribution of disease
This must be the most important lecture of the course…
Week 1 – Causal Theories 21
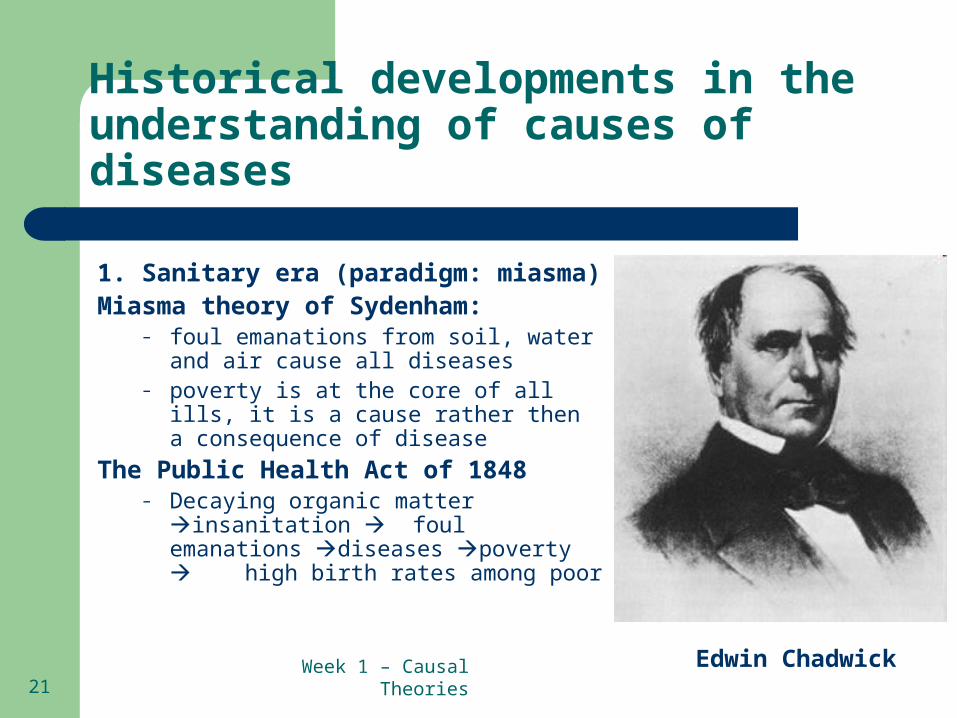
Historical developments in the understanding of causes of diseases
1. Sanitary era (paradigm: miasma) Miasma theory of Sydenham:
– foul emanations from soil, water and air cause all diseases
– poverty is at the core of all ills, it is a cause rather then a consequence of disease
The Public Health Act of 1848– Decaying organic matter insanitation
foul emanations diseases poverty high birth rates among poor
Edwin Chadwick
Week 1 – Causal Theories 22
Historical developments in the understanding of causes of diseases
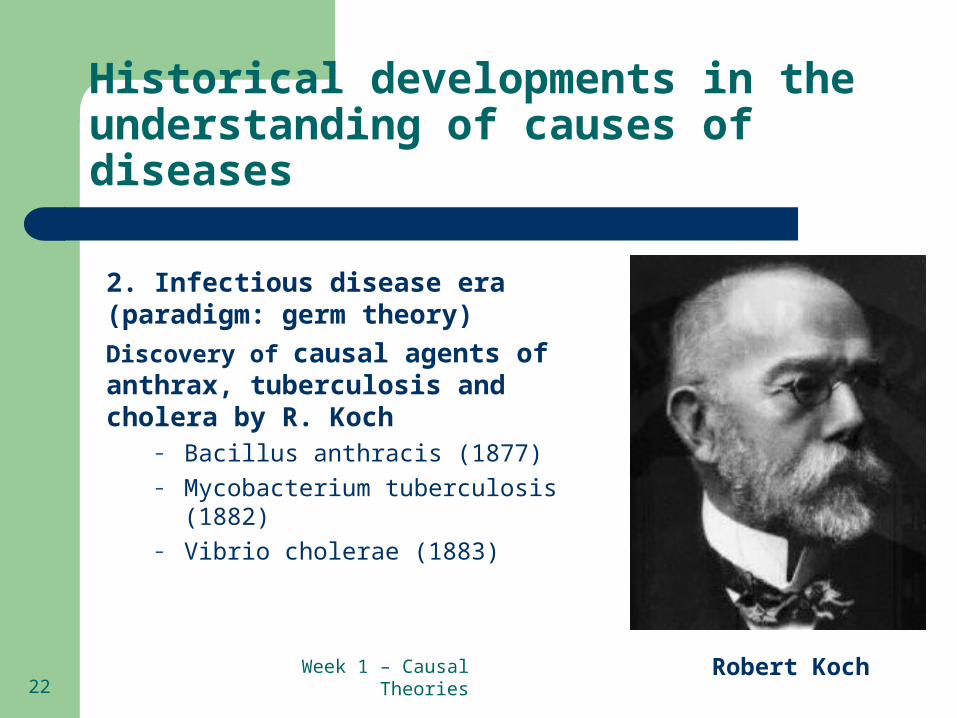
2. Infectious disease era (paradigm: germ theory)
Discovery of causal agents of anthrax, tuberculosis and cholera by R. Koch
– Bacillus anthracis (1877)– Mycobacterium tuberculosis (1882) – Vibrio cholerae (1883)
Robert Koch
Week 1 – Causal Theories 23
Causal Inference: Henle-Koch postulates for causation
The organism is always found with the disease
The organism is not found with any other disease
The organism, isolated from one who has the disease,
and cultured through several generates, produces the
disease (in experimental animals)
Week 1 – Causal Theories 24
Historical developments in the understanding of causes of diseases
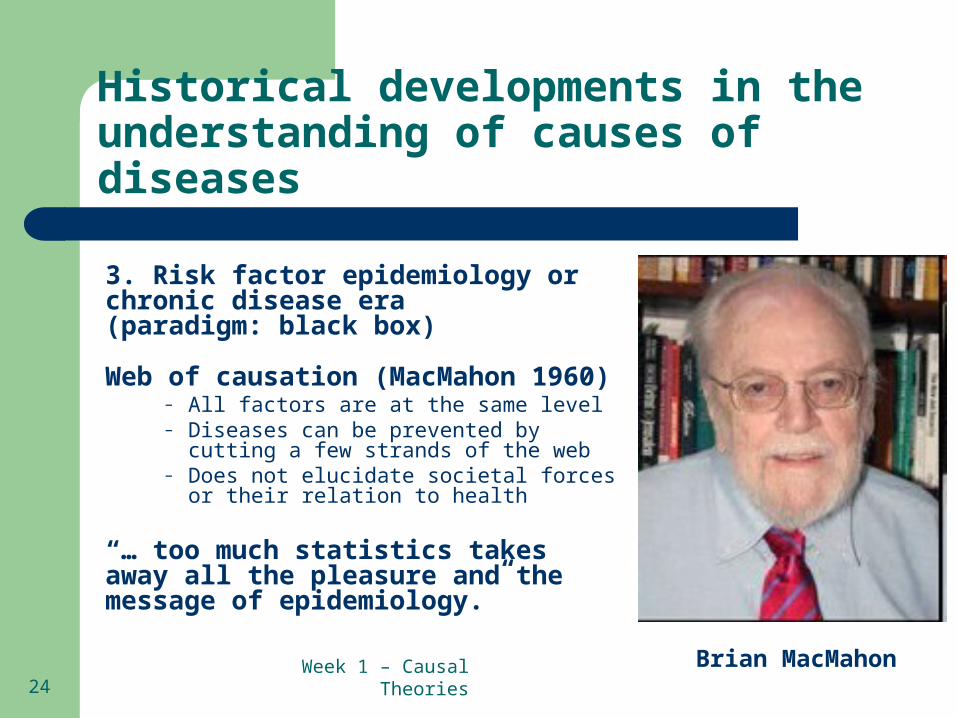
3. Risk factor epidemiology or chronic disease era(paradigm: black box)
Web of causation (MacMahon 1960)– All factors are at the same level – Diseases can be prevented by cutting a few
strands of the web– Does not elucidate societal forces or their
relation to health
“… too much statistics takes away all the pleasure and the message of epidemiology.”
Brian MacMahon

Week 1 – Causal Theories 25
Historical developments in the understanding of causes of diseases
4. Ecoepidemiology (Chinese boxes)
Eras in Epidemiology: The Evolution of Ideas (Susser 2009)
– Conceptual approach combining molecular, societal, and population-based aspects to study a health-related problem.
– People are not only individuals but also members of communities (social context)
– Helps to recognize broad dynamic patterns and disease in its social context
– Places exposure, outcome and risk in societal context.
Mervyn Susser

Week 1 – Causal Theories 26
Causal inference
Goal of epidemiology:learn causes of diseases and factors that could prevent or delay disease development
Causal inference:a process of determining causal and preventive factors

Week 1 – Causal Theories 27
Theories of causal inference
Deductive reasoning Inductivism Bayesianism

Week 1 – Causal Theories 28
George Simenon’s Inspector Maigret Arthur Conan Doyle’s Sherlock Holmes Agatha Christie's Hercule Poirot
Pull the clues together, arrive at generalization, i.e. deduct the answer

Week 1 – Causal Theories 29
Specification of alternative hypotheses
Design of crucial experiments to test these hypotheses
Exclusion of some alternatives
Adoption of what is left (for the time being)
In Epidemiology we use inductive reasoning:Francis Bacon (XVI century) suggested the conditional inductive tree:
formulate laws based on limited observations of recurring phenomenal patterns:
Week 1 – Causal Theories 30
Deductive vs. inductive reasoning
Deductive reasoning applies general principles to reach specific conclusions, whereas inductive reasoning examines specific information, perhaps many pieces of specific information, to derive a general principle.
Wikipedia

Week 1 – Causal Theories 31
Causal models
Week 1 – Causal Theories 32
What is a cause? (Rothman)
A cause of a specific disease event [is] an antecedent event, condition or characteristic that was necessary for the disease at the moment it occurred, given that other conditions are fixed.
A cause of a disease is an event, condition, or characteristic that preceded the disease event and without which the disease event would not have occurred at all or would not have occurred until some later time.

Week 1 – Causal Theories 33
What is a cause? (Rothman)
A cause of a specific disease event [is] an antecedent event, condition or characteristic that was necessary for the disease at the moment it occurred, given that other conditions are fixed.
A cause of a disease is an event, condition, or characteristic that preceded the disease event and without which the disease event would not have occurred at all or would not have occurred until some later time.
Week 1 – Causal Theories 34
What is a cause? (Rothman’s sufficient-component cause model)
A cause of a specific disease event [is] an antecedent event, condition or characteristic that was necessary for the disease at the moment it occurred, given that other conditions are fixed.
A cause of a disease is an event, condition, or characteristic that preceded the disease event and without which the disease event would not have occurred at all or would not have occurred until some later time.
Week 1 – Causal Theories 35
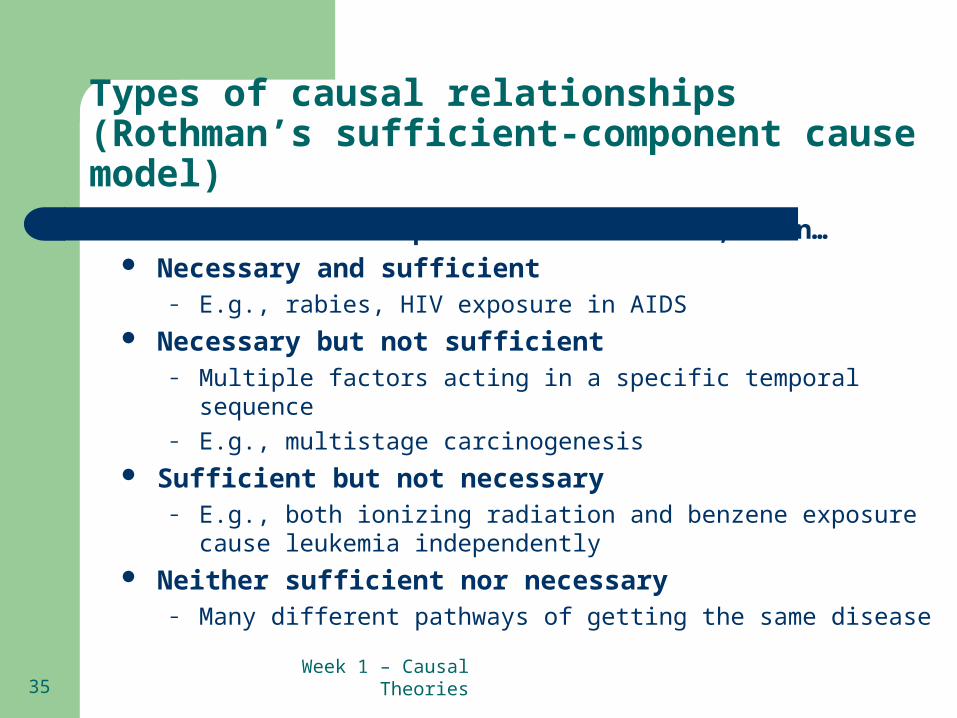
Types of causal relationships(Rothman’s sufficient-component cause model)
If a relationships is indeed causal, then… Necessary and sufficient
– E.g., rabies, HIV exposure in AIDS Necessary but not sufficient
– Multiple factors acting in a specific temporal sequence– E.g., multistage carcinogenesis
Sufficient but not necessary– E.g., both ionizing radiation and benzene exposure cause leukemia
independently Neither sufficient nor necessary
– Many different pathways of getting the same disease

Week 1 – Causal Theories 36
Types of causal relationships(Rothman’s sufficient-component cause model)
If a relationships is indeed causal, then… Necessary and sufficient
– E.g., rabies, HIV exposure in AIDS Necessary but not sufficient
– Multiple factors acting in a specific temporal sequence– E.g., multistage carcinogenesis
Sufficient but not necessary– E.g., both ionizing radiation and benzene exposure cause leukemia
independently Neither sufficient nor necessary
– Many different pathways of getting the same disease

Week 1 – Causal Theories 37
Sufficient and component causes
T
BX
U
BA
Sufficient Cause 1
Sufficient Cause 2
A sufficient cause is a set of minimal conditions or events that inevitably produce disease

Week 1 – Causal Theories 38
Sufficient and component causes
T
BX
U
BA
Sufficient Cause 1
Sufficient Cause 2
Component causes
A sufficient cause is a set of minimal conditions or events that inevitably produce disease

Week 1 – Causal Theories 39
Sufficient and component causes
T
BX
U
BA
Sufficient Cause 1
Sufficient Cause 2
Component causes A component cause is any one of a set of conditions which are necessary for the completion of a sufficient cause
A sufficient cause is a set of minimal conditions or events that inevitably produce disease

Week 1 – Causal Theories 40
Sufficient and component causes
T
BX
U
BA
Sufficient Cause 1
Sufficient Cause 2
A necessary cause is a component cause that is a member of every sufficient cause

Week 1 – Causal Theories 41
For example: Tuberculosis
Sufficient Cause 1
Sufficient Cause 2
M. tuberculosis
M. tuberculosis
Immuno-suppression
Poornutrition
Necessary but not sufficient
Neither necessary nor sufficient
Week 1 – Causal Theories 42
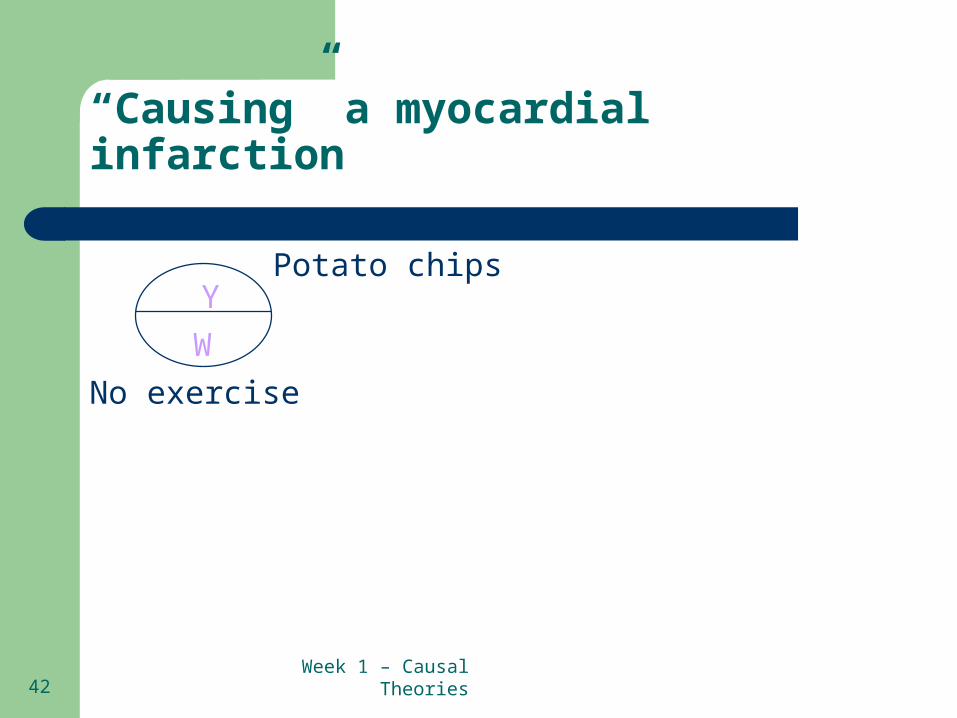
“Causing” a myocardial infarction
Y
W
Potato chips
No exercise

Week 1 – Causal Theories 43
“Causing” a myocardial infarction
A
Y
W Obesity
Potato chips
No exercise
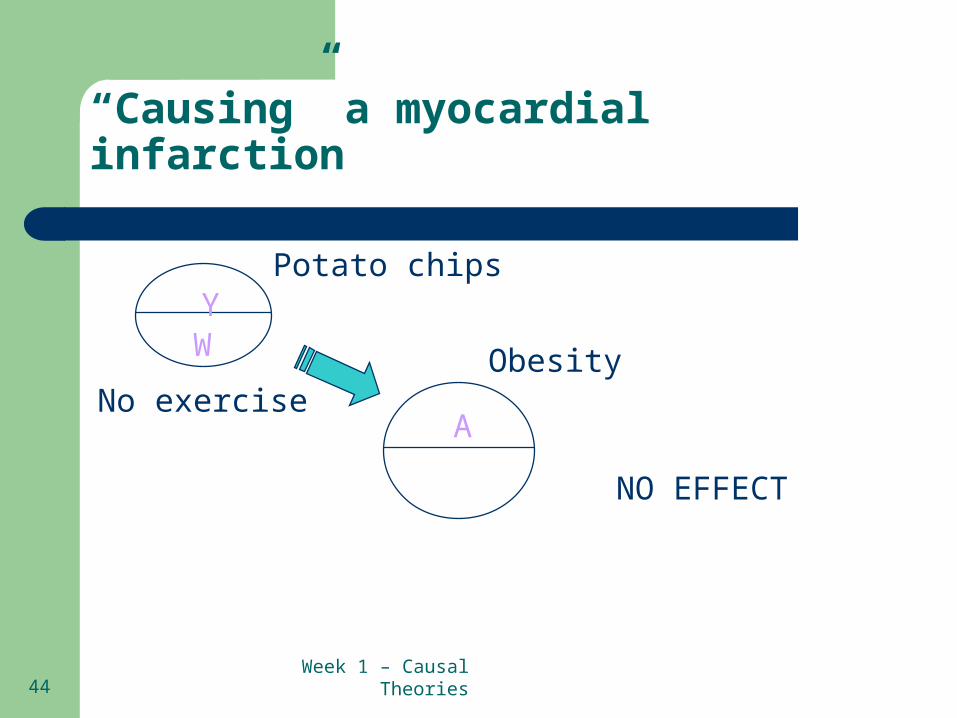
Week 1 – Causal Theories 44
“Causing” a myocardial infarction
A
YW Obesity
Potato chips
No exercise
NO EFFECT
Week 1 – Causal Theories 45
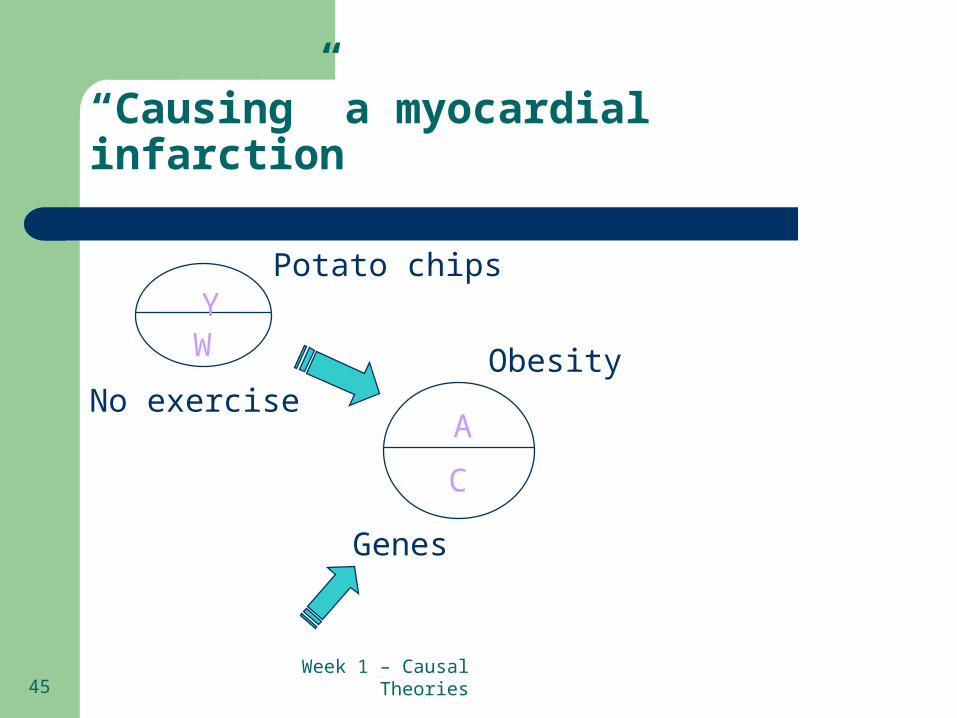
“Causing” a myocardial infarction
A
C
YW
Genes
Obesity
Potato chips
No exercise

Week 1 – Causal Theories 46
“Causing” a myocardial infarction
T
A
C
YW
Genes
Obesity
Potato chips
No exercise High cholesterol
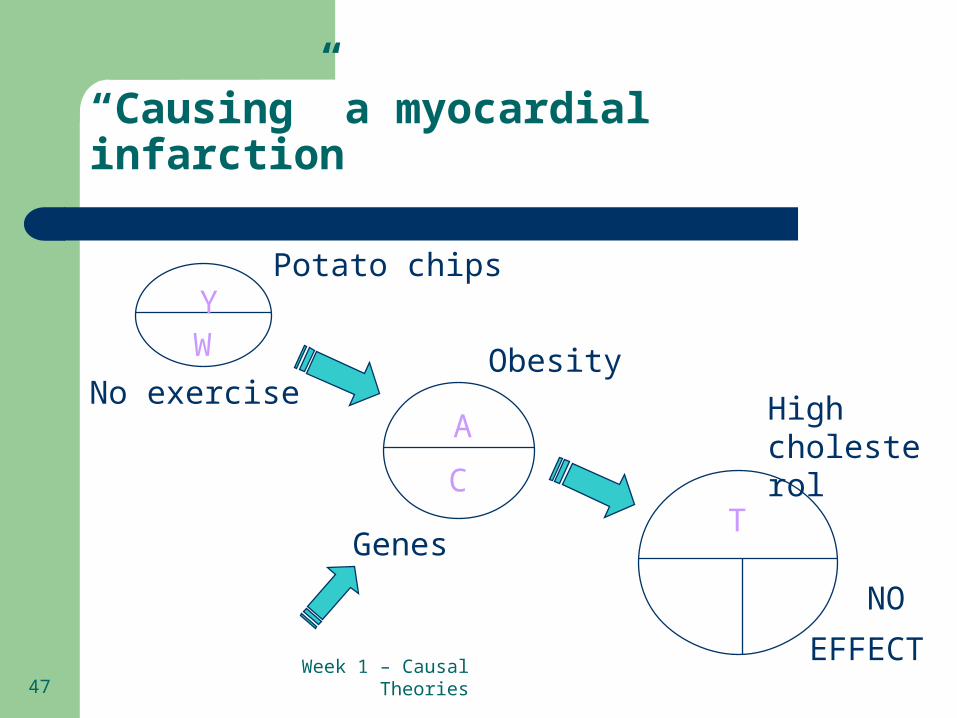
Week 1 – Causal Theories 47
“Causing” a myocardial infarction
T
A
C
YW
Genes
Obesity
Potato chips
No exercise High cholesterol
NO
EFFECT

Week 1 – Causal Theories 48
“Causing” a myocardial infarction
T
BX
A
C
Y
W
Genes
Obesity
Potato chips
No exercise High cholesterol
Smoking
Stress

Week 1 – Causal Theories 49
“Causing” a myocardial infarction
T
BX
A
C
YW
Genes
Obesity
Potato chips
No exercise High cholesterol
Smoking
Stress

Week 1 – Causal Theories 50
The trouble with Rothman
Omits discussion of origins of causes, focuses on proximal causes and ignores induction period
Specific components but not linkages among them– Ignores indirect effects (effects of some component causes
mediated by other component causes in the model)
Causes of disease in individuals but not in populations Does not consider factors that control distribution of risk
factors Ignores dynamic non-linear relations

Week 1 – Causal Theories 51
“Causing” a myocardial infarction
T
BX
A
C
YW
Genes
Obesity
Potato chips
No exercise High cholesterol
Smoking
Stress

Week 1 – Causal Theories 52
“Causing” a myocardial infarction
T
BX
A
C
Y
W
Genes
Obesity
Potato chips
No exercise High cholesterol
Smoking
Stress

Week 1 – Causal Theories 53
“Causing” a myocardial infarction
T
BX
A
C
Y
W
Genes
Obesity
Potato chips
No exercise High cholesterol
Smoking
Stress

Week 1 – Causal Theories 54
“Causing” a myocardial infarction
T
BX
A
C
YW
Genes
Obesity
Potato chips
No exercise High cholesterol
Smoking
Stress

Week 1 – Causal Theories 55
Counterfactual model (potential-outcome)
Ideal comparison to obtain a measure of effect would be of study subjects with themselves in both an exposed and an unexposed state
One of the two conditions in the definitions of the effect measures must be contrary to fact – exposures or treatment vs. a reference condition

Week 1 – Causal Theories 56
Effect measures vs. measures of association
Effect is:– The endpoint of the causal mechanism– Change in a population characteristic that is caused by the factor
being at one level versus another Effect measures:
– Can never achieve counterfactual ideal– Logically impossible to observe the population under both conditions
Measures of association– Compares what happens in two distinct populations– Constructed to equal the effect measure of interest– Absolute: differences in occurrence measures (rate or risk difference)– Relative: ratios of occurrence measures (rate or risk ratio, relative risk,
odds ratio)

Week 1 – Causal Theories 57
Comparison of absolute and relative effect measures (Rothman 2002)
Measure Numerical Range Dimensionality
Risk difference [-1, +1] None
Risk ratio [0, ] None
Incidence rate difference
[- , + ] 1/Time
Incidence rate ratio [0, ] None
Week 1 – Causal Theories 58
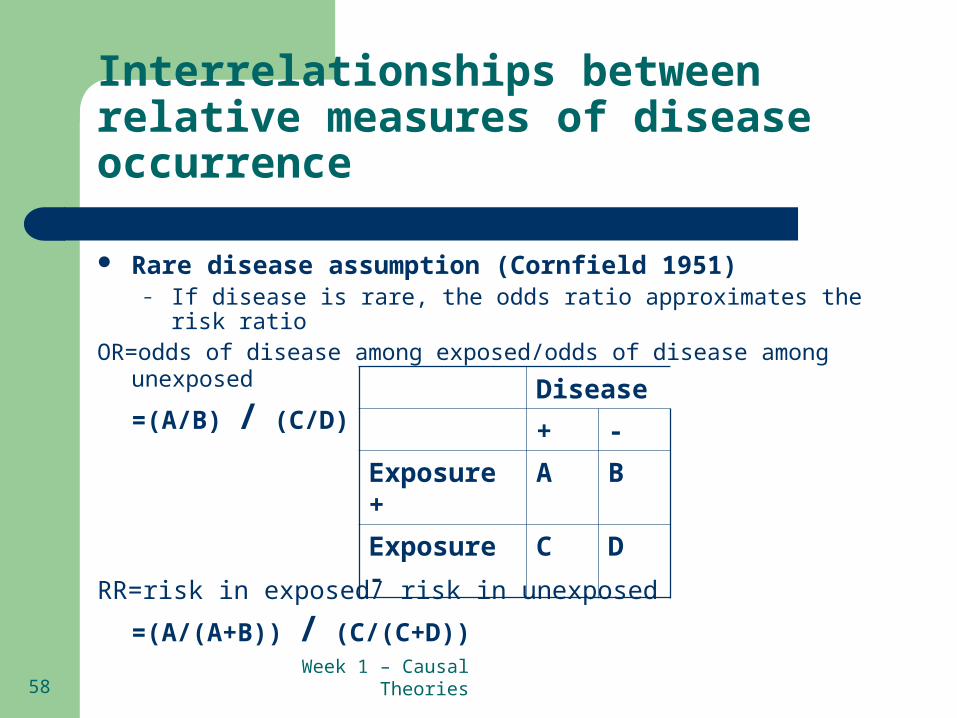
Interrelationships between relative measures of disease occurrence
Rare disease assumption (Cornfield 1951)– If disease is rare, the odds ratio approximates the risk ratio
OR=odds of disease among exposed/odds of disease among unexposed
=(A/B) / (C/D)
RR=risk in exposed/ risk in unexposed
=(A/(A+B)) / (C/(C+D))
Disease
+ -
Exposure + A B
Exposure - C D
Week 1 – Causal Theories 59
Interrelationships between relative measures of disease occurrence
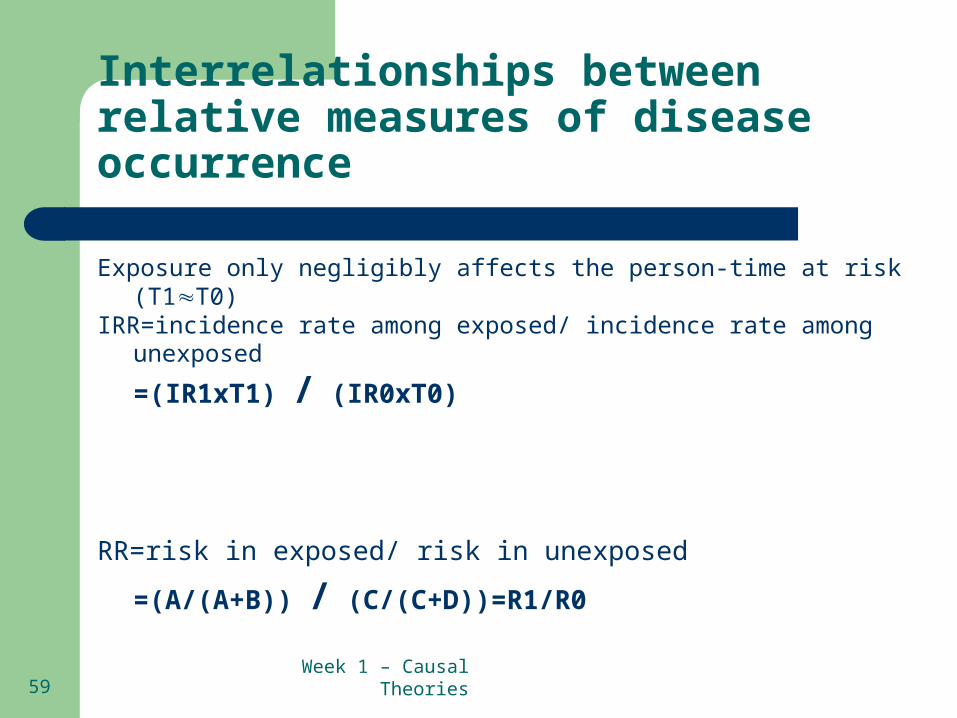
Exposure only negligibly affects the person-time at risk (T1T0)IRR=incidence rate among exposed/ incidence rate among unexposed
=(IR1xT1) / (IR0xT0)
RR=risk in exposed/ risk in unexposed
=(A/(A+B)) / (C/(C+D))=R1/R0
Week 1 – Causal Theories 60
Interrelationships between relative measures of disease occurrence
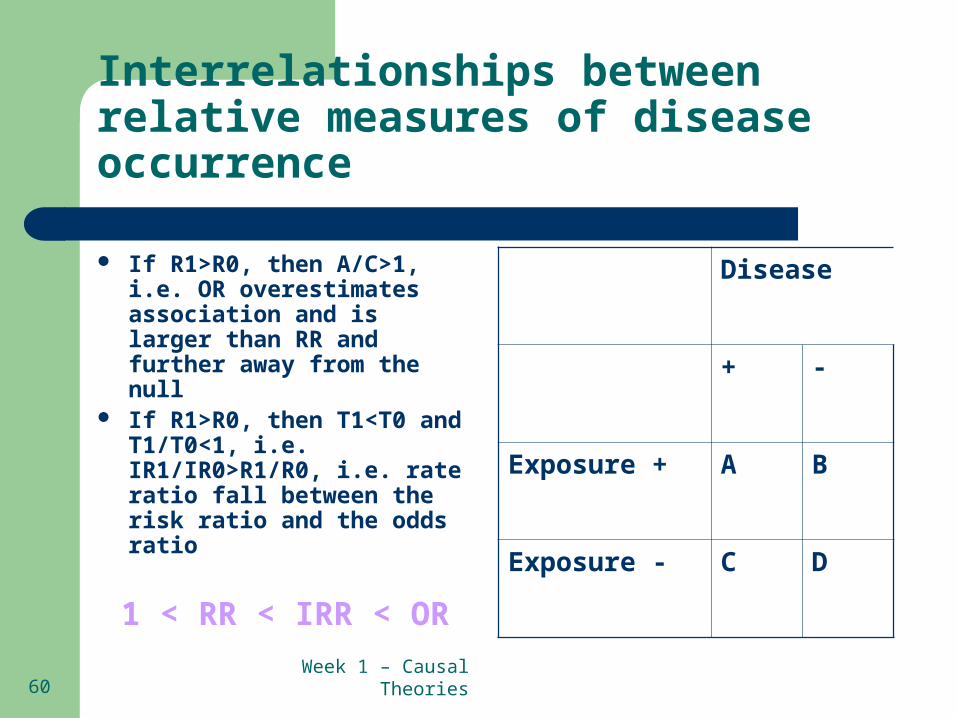
If R1>R0, then A/C>1, i.e. OR overestimates association and is larger than RR and further away from the null
If R1>R0, then T1<T0 and T1/T0<1, i.e. IR1/IR0>R1/R0, i.e. rate ratio fall between the risk ratio and the odds ratio
1 < RR < IRR < OR
Disease
+ -
Exposure + A B
Exposure - C D

Week 1 – Causal Theories 61
Measures of attributable risk
In Rothman’s model, the fraction of disease attributable to a single component cause cannot exceed 100%, but attributable fractions for individuals could sum far more than 100%
Formula for attributable fraction:For dichotomous exposure:
Risk difference/ Risk in exposed=(RR-1)/RR
For categorical (n>2) exposure:
(AFi x Pi)

Week 1 – Causal Theories 62
Causal diagrams
Provide a unified framework for evaluating design and analysis strategies for any causal question under any set of causal assumptions
Week 1 – Causal Theories 63
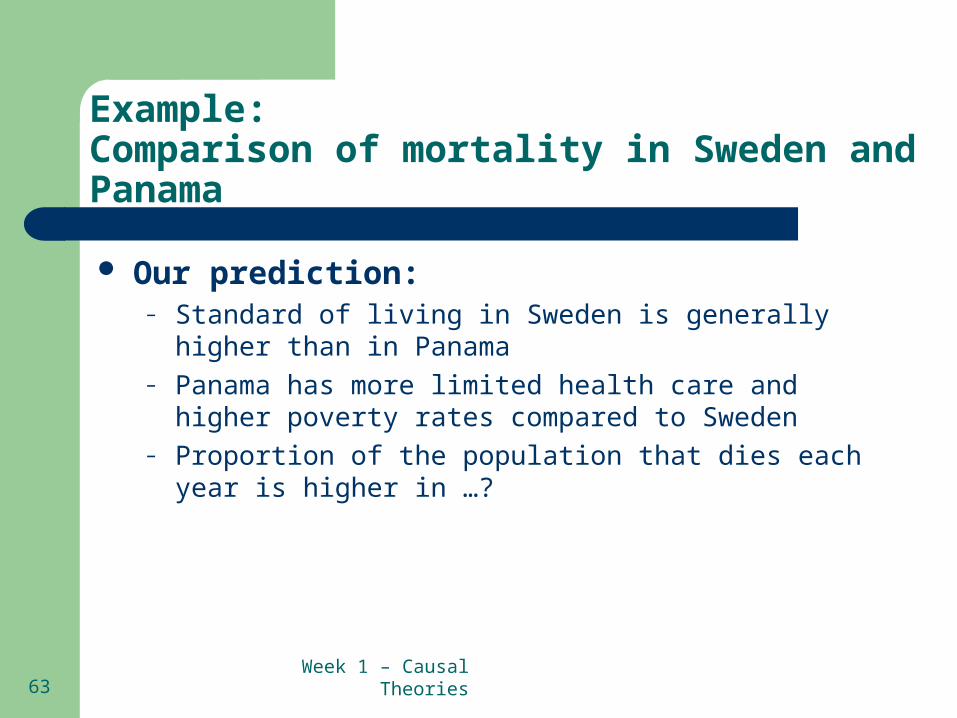
Example:Comparison of mortality in Sweden and Panama
Our prediction:– Standard of living in Sweden is generally higher than in
Panama– Panama has more limited health care and higher poverty
rates compared to Sweden– Proportion of the population that dies each year is higher in
…?

Week 1 – Causal Theories 64
Week 1 – Causal Theories 65
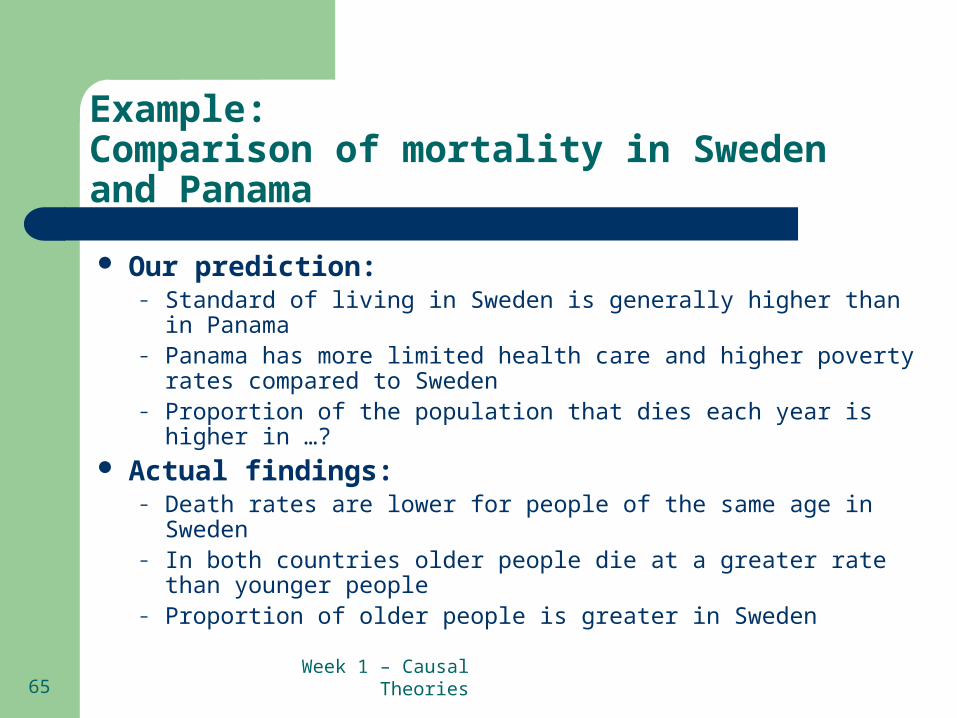
Example:Comparison of mortality in Sweden and Panama
Our prediction:– Standard of living in Sweden is generally higher than in Panama– Panama has more limited health care and higher poverty rates
compared to Sweden– Proportion of the population that dies each year is higher in …?
Actual findings:– Death rates are lower for people of the same age in Sweden– In both countries older people die at a greater rate than younger
people– Proportion of older people is greater in Sweden
Week 1 – Causal Theories 66
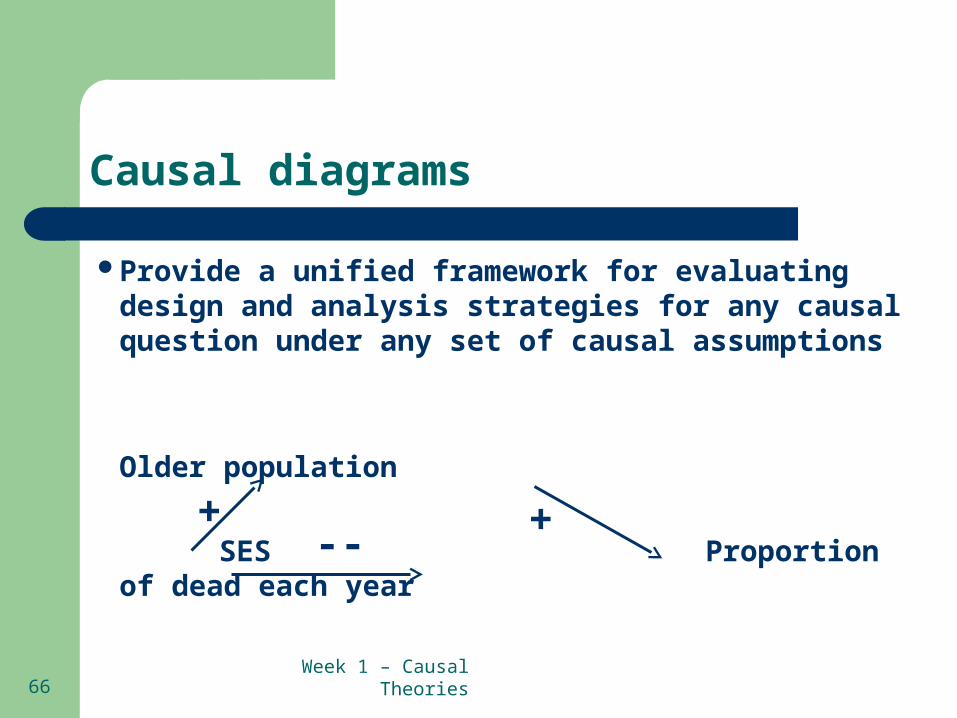
Causal diagrams
Provide a unified framework for evaluating design and analysis strategies for any causal question under any set of causal assumptions
Older population
SES Proportion of dead each year
+ +--

Week 1 – Causal Theories 67
Practice of causal inference
1. Is the observed association valid? Is it true?– Association appears causal but is due to:
Bias or systematic error (misclassification of E or D) Confounding (other variable causes the D and this variable
correlates with E) Chance or random error (just this once)
2. Did the exposure actually cause the disease?– Use causal guidelines to decide if association is truly
causal – The most important is temporality

Week 1 – Causal Theories 68
Causal InferenceA. Bradford Hill Criteria for Causal Inference (1965)
1. Strength
2. Consistency
3. Specificity
4. Temporality
5. Biological gradient
6. Plausibility
7. Coherence
8. Experiment
9. Analogy

Week 1 – Causal Theories 69
1. Strength of association
Strong associations are less likely to be caused by chance or bias
A strong association means a very high or very low relative risk
CAVEATEnvironmental associations with very low relative risks
Week 1 – Causal Theories 70
2. Consistency
Replication of findings in different populations under different circumstances, in different times, with different study designs
CAVEAT Lack of consistency does not rule out a causal association,
because some effects are produced by their causes only under unusual circumstances
Publication bias Contradictory findings across different studies are not unusual
in studies of weak effects
Week 1 – Causal Theories 71
3. Specificity of the association
Specific exposure associated with only one disease
– Arises from old Henle-Koch postulates for causation
Effect has one cause, not multiple causes
CAVEATS• Many exposures are linked to multiple diseases• Many diseases have multiple causes

Week 1 – Causal Theories 72
4. Temporality
Exposure must precede disease (cause must precede effect) Levels of evidence Cross-sectional studies (exposure and disease measured at the
same time)– e.g., NHANES (National Health and Nutrition Examination Survey) looking at the
link between obesity and coronary artery disease Case-control studies (compare exposures and risk factors among
people with and without the disease)– e.g., case-control study investigating the link between radiation exposure among
Chornobyl clean-up workers and leukemia Cohort studies (follow-up exposed and unexposed to see who
will develop the disease)– e.g., cohort study of children with thyroid activity measurements taken within 6
weeks after the Chornobyl accident and development of thyroid cancer 15-22 years later)
– In disease with long latency periods, exposures must precede latency period– In chronic diseases, often need long-term exposure for disease induction
Week 1 – Causal Theories 73
5. Biologic gradient (dose-response relationship)
Presence of a dose-response or exposure-response curve with an expected shape
Changes in exposure are related to trend in risk of disease
Strong evidence for causal relation suggesting biologic relation

Week 1 – Causal Theories 74
Tronko et al. JNCI 2006

Week 1 – Causal Theories 75
Study of the survivors of atomic bombings in Hiroshima (LSS)
Association between radiation dose received in 1945 and risk of developing cancer later in life. Source: E. Hall, Radiobiology for the Radiologist, 2000.

Week 1 – Causal Theories 76
Threshold effect?

Week 1 – Causal Theories 77
5. Biologic gradient (dose-response relationship)
Presence of a dose-response or exposure-response curve with an expected shape
Changes in exposure are related to trend in risk of disease
Strong evidence for causal relation suggesting biologic relation
CAVEATThresholds, i.e., no disease past a certain level of
exposure

Week 1 – Causal Theories 78
6. Plausibility
The proposed mechanism should be biologically (etiologically) plausible
Reference to a “coherent” body of knowledge
CAVEAT New diseases and new causes Theoretical plausibility

Week 1 – Causal Theories 79
0
1
2
3
4
5
6
7
8
0 100 200 300 400 500 600
Mean Dose, mGy
Od
ds
Rati
o
All Cases
Non-CLL Cases
CLL Cases
All Cases
Non-CLL Cases
CLL Cases
Radiation-associated risks of chronic lymphocytic leukemia vs. other types of leukemia
Romanenko et al. Rad Res 2008

Week 1 – Causal Theories 80
7. Coherence with established “facts”
A cause-and-effect interpretation for an association does not conflict with what is known of the natural history and biology of disease
Implications:– If a relation is causal, would expect observed findings to be consistent with other data– Hypothesized causal relations need to be consistent with epidemiologic and biologic
knowledge
CAVEATS Data may not be available yet to directly support proposed
mechanism Science must be prepared to reinterpret existing
understanding of disease process in the face of new evidence

Week 1 – Causal Theories 81
8. Experiment
In Hill’s article, refers to ‘cessation of exposure’, i.e., elimination of putative harmful exposure results in the decrease of the frequency of disease
CAVEATS If the pathogenic process has already started, removal of cause does not
reduce disease risk Reduction in disease frequency might not be for etiologic reason
hypothesized

Week 1 – Causal Theories 82
9. Analogy
1 2 3 4 5
Vit
amin
B1
Vit
amin
B2
Vit
amin
B3
Vit
amin
B6
Vit
amin
B1
2
Fo
lic
Aci
d
Vit
amin
A
Vit
amin
C
Vit
amin
E
0
0.2
0.4
0.6
0.8
1
1.2
1.4
1.6
Ad
just
ed O
dd
s R
atio
s .
Quintiles of vitamin intake
Figure 1. Odds Ratios for Quintiles of Vitamin Intake From the Categorical Analysis.
Vitamin B1 Vitamin B2 Vitamin B3
Vitamin B6 Vitamin B12 Folic Acid
Vitamin A Vitamin C Vitamin E
Zablotska et al. Environ Health Perspect 2008
Week 1 – Causal Theories 83
9. Analogy
Similar exposures can cause similar effects, e.g., medications and infectious agents may cause other birth defects
CAVEAT Limited by the current knowledge

Week 1 – Causal Theories 84
Overall caveats to “criteria”
“None of my ... [criteria] can bring undisputable evidence for or against the cause-and-effect hypothesis and none can be required as a sine qua non.”
Sir Austin Bradford Hill (1965)
Temporality?
Week 1 – Causal Theories 85
Summary: When is an association causal?
Theory
Hypothesis
Strategy to test the hypothesis
Interpretation of results
Design, conduct, and analysis of study
Week 1 – Causal Theories 86
Summary:When is an association causal?
Smoking is a carcinogen
Theory
Hypothesis
Strategy to test the hypothesis
Interpretation of results
Design, conduct, and analysis of study

Week 1 – Causal Theories 87
Smoking is a carcinogenSmoking causes lung cancer
Theory
Hypothesis
Strategy to test the hypothesis
Interpretation of results
Design, conduct, and analysis of study
Summary:When is an association causal?

Week 1 – Causal Theories 88
Smoking is a carcinogenSmoking causes lung cancerProspective cohort study
Theory
Hypothesis
Strategy to test the hypothesis
Interpretation of results
Design, conduct, and analysis of study
Summary:When is an association causal?

Week 1 – Causal Theories 89
Smoking is a carcinogenSmoking causes lung cancerProspective cohort study
Recruit 10,000 doctors, follow for 10 years
Theory
Hypothesis
Strategy to test the hypothesis
Interpretation of results
Design, conduct, and analysis of study
Summary:When is an association causal?

Week 1 – Causal Theories 90
Smoking is a carcinogenSmoking causes lung cancerProspective cohort study
High RR of lung cancer in smokers
Recruit 10,000 doctors, follow for 10 years
Theory
Hypothesis
Strategy to test the hypothesis
Interpretation of results
Design, conduct, and analysis of study
Summary:When is an association causal?
Week 1 – Causal Theories 91
Practice of Epidemiology
Review of the previous example:
Study of the association between fiber intake and risk of colorectal cancer
Week 1 – Causal Theories 92
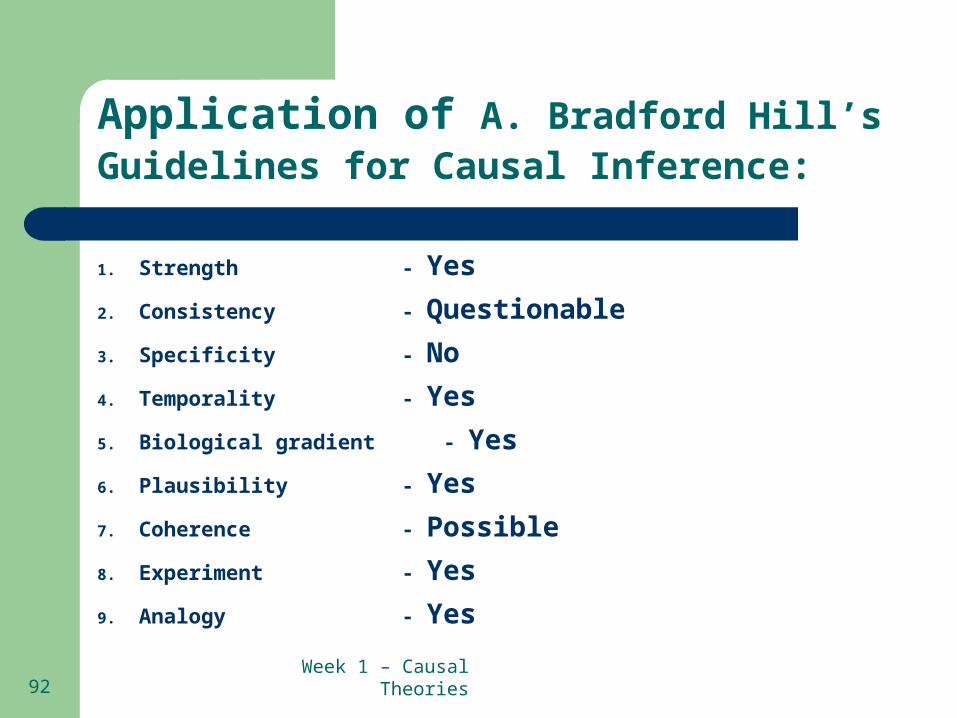
Application of A. Bradford Hill’s Guidelines for Causal Inference:
1. Strength - Yes
2. Consistency - Questionable
3. Specificity - No
4. Temporality - Yes
5. Biological gradient - Yes
6. Plausibility - Yes
7. Coherence - Possible
8. Experiment - Yes
9. Analogy - Yes

Week 1 – Causal Theories 93
Summary: When is an association causal?
Week 1 – Causal Theories 94
Example:A few well known causes of disease
SmokingHigh cholesterolM. tuberculosisS. viridansHead injury ? Poverty

Week 1 – Causal Theories 95
Smoking Lung Cancer
High cholesterol Cardiovascular Disease
M. tuberculosis Tuberculosis
S. viridans Endocarditis
Head injury Subarachnoid hemorrhage
? Poverty All-cause mortality
Example:A few well known causes of disease

Week 1 – Causal Theories 96
Ethics and the public health balance
When is there enough evidence to say something is a “cause”?
When should we decide that something is a cause and act on it?
Does “first do no harm” always apply at the population level?
Are there different guidelines for solutions where we have to DO something vs. solutions where we try to remove something?

Week 1 – Causal Theories 97
Therefore, causal inference…
Causal inference is not a simple (or quick) process No single study is sufficient in establishing causal
inference Requires critical judgment and interpretation Can one “prove” causal associations?

Week 1 – Causal Theories 98
November 26, 2001, The New Yorker.
Related Documents