Weed Management Costs, Weed Best Management Practices, and The Roundup Ready® Weed Management Program T.M. Hurley Applied Economics, University of Minnesota, St. Paul, MN Telephone: 612-625-1238, Email: [email protected] P.D. Mitchell Agricultural and Applied Economics, University of Wisconsin, Madison, WI Telephone: 608-265-6514, Email: [email protected] G. Frisvold Agricultural and Resource Economics, University of Arizona, Tucson, AZ Telephone: 520-621-6269, Email: [email protected] July 2009 Draft: Please do not quote without author’s permission * Copyright 2009 by T. M. Hurley, P. D. Mitchell, G. Frisvold. All rights reserved. Readers may make verbatim copies of this document for non-commercial purposes by any means, provide that this copyright notice appears on all such copies.

Welcome message from author
This document is posted to help you gain knowledge. Please leave a comment to let me know what you think about it! Share it to your friends and learn new things together.
Transcript
Weed Management Costs, Weed Best Management Practices, and The Roundup Ready® Weed Management Program
T.M. Hurley Applied Economics, University of Minnesota, St. Paul, MN
Telephone: 612-625-1238, Email: [email protected]
P.D. Mitchell Agricultural and Applied Economics, University of Wisconsin, Madison, WI
Telephone: 608-265-6514, Email: [email protected]
G. Frisvold Agricultural and Resource Economics, University of Arizona, Tucson, AZ
Telephone: 520-621-6269, Email: [email protected]
July 2009
Draft: Please do not quote without author’s permission*
Copyright 2009 by T. M. Hurley, P. D. Mitchell, G. Frisvold. All rights reserved. Readers may make verbatim copies of this document for non-commercial purposes by any means, provide that this copyright notice appears on all such copies.
1
Weed Management Costs, Weed Best Management Practices, and The Roundup Ready® Weed Management Program
T.M. Hurley
Applied Economics University of Minnesota
St. Paul, MN
P.D. Mitchell Agricultural and Applied Economics
University of Wisconsin Madison, WI
G. Frisvold
Agricultural and Resource Economics University of Arizona
Tucson, AZ
Abstract
Roundup ready (RR) crops have been widely adopted because they provide significant benefits
to growers, but glyphosate resistant weeds threaten the sustainability of these benefits. Several
weed best management practices (BMPs) exist to help manage resistance, but these practices
could substantially increase weed management costs and so discourage adoption. This paper
uses survey results to explore the extent of grower adoption of various weed BMPs and how this
adoption affects weed management costs in corn, cotton, and soybeans. The survey shows that
growers commonly use several weed BMPs, even those increasing costs, and regression results
suggest that adoption of RR crops reduces weed control costs. Opportunities for improving
grower adoption of weed BMPs to reduce the risk of glyphosate resistance include encouraging
more soybean growers to incorporate a residual herbicide into their RR weed management
program and corn and cotton growers to plant fewer RR acres following another RR crop.
Key Words: glyphosate, resistance management, BMP adoption, telephone survey, herbicide
2
INTRODUCTION
Roundup Ready® (RR) crop varieties that can be safely treated with glyphosate herbicide
to control weeds were first commercialized for soybeans in 1996, for cotton in 1997, and for corn
in 1998 (Green, 2007). By 2008, approximately 63% of corn, 68% of cotton, and 92% of
soybean acreage in the U.S. was planted with herbicide tolerant crop varieties, the majority of
which were RR crop varieties (USDA-NASS, 2008a). The rapid and widespread adoption of RR
crop varieties suggests that growers using these varieties enjoy substantial benefits. Research
has shown that these benefits are both pecuniary (e.g. lower production costs, higher yields,
higher profits) and non-pecuniary (e.g. increased flexibility, crop safety, reduced herbicide
toxicity), with the pecuniary benefits not significant in some cases (Bonny, 2008; Brookes &
Barfoot, 2008; Carpenter & Gianessi, 1999; Fernandez-Cornejo et al., 2002; Ferrell & Witt,
2002; Marra et al., 2002, 2004; Sydorovych & Marra, 2008). However, there is increasing
concern that these benefits may not be sustainable because of the emergence of glyphosate
resistant weeds and shifts in weed species prevalence (Benbrook, 2001; Green, 2007; Kruger et
al., 2009; Norsworthy et al., 2007; Scott & VanGessel, 2007; Legleiter & Bradley, 2008).
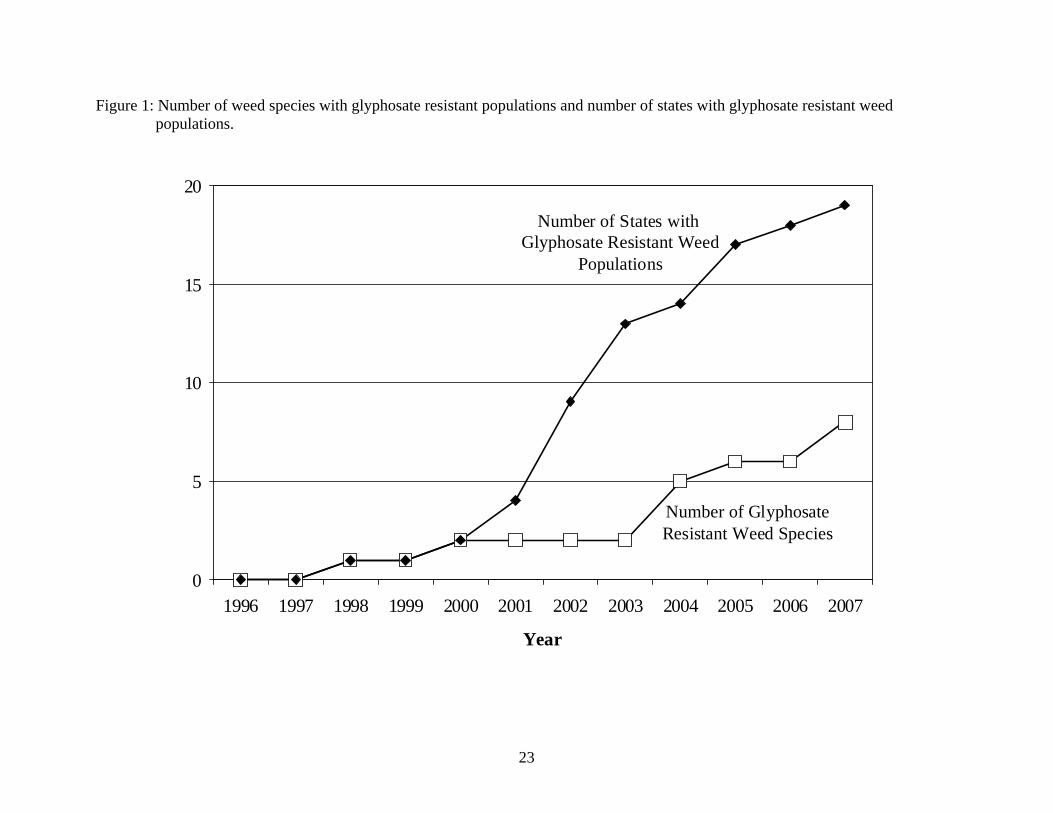
In 1996, no weed species in the United States were known to be resistant to glyphosate,
but by 2008, glyphosate resistance had been confirmed for 16 weed species around the world and
for 9 species in the U.S.: common ragweed (Ambrosia artemisiifolia), giant ragweed (Ambrosia
trifida), common waterhemp (Amaranthus rudis), Palmer amaranth (Amaranthus palmeri),
horseweed (Conyza Canadensis), hairy fleabane (Conyza bonariensis), Italian ryegrass (Lolium
multiflorum), rigid ryegrass (Lolium rigidum), and Johnsongrass (Sorghum halepense) (Heap,
2009). Figure 1 shows the trend in the number of glyphosate resistant weed species and the
number of states with glyphosate resistant weed populations since commercialization of RR crop
3
varieties. Currently, these resistant populations in the United States are spread across 19 states,
with populations in new states under investigation (e.g. Boerboom, 2009).
Weed resistance to herbicides is not a novel problem (Holt & LeBaron, 1990; Heap,
2009), so weed scientists have had the opportunity to develop and promote a variety of best
management practices (BMPs) to address it. For example, tank mixing herbicides with different
modes of action is the most common practice, as using different modes of action reduces
selection pressure (Culpepper, 2006; Diggle et al., 2003). Given the emergence of glyphosate
resistant weeds over the past decade, it is clear that growers will need to incorporate weed
resistance management BMPs into their RR weed management programs if these programs are to
remain sustainable (Green, 2007). However, growers may be unwilling to incorporate weed
BMPs into their RR weed management programs if they are too costly or if the long-term gains
do not seem to justify the short-term costs (Llewellyn et al., 2002; Weersink et al., 2005). Costs
other than just direct costs of these BMPs are also important barriers to their adoption, such as
the loss of convenience or reduced applicator safety (Mueller et al., 2005; Pannell & Zilberman,
2001). Therefore, the sustainability of the weed management program for RR and other
herbicide resistant crops hinges crucially on the identification of weed BMPs that can be
implemented without substantially increasing weed management costs.
The objective of this paper is to determine the extent to which growers are adopting
various weed BMPs and how the adoption of these weed BMPs relates to weed management
costs in corn, cotton, and soybean production systems. This objective is accomplished using data
collected from a random telephone survey of 1,205 growers in 22 states. The states selected for
the survey include the primary corn, cotton, and soybean growing regions of the U.S. The
survey collected information on a grower’s average weed control costs and their adoption of a
4
variety of weed BMPs, as well as information on the growers and their operations. Multiple
regression analysis is used to relate grower adoption of various weed BMPs to the grower’s
reported weed management costs while controlling for individual and operational differences
across growers. While a variety of studies that have looked at the profitability and benefits of
RR weed management programs (Bonny, 2008; Brookes & Barfoot, 2008; Ferrell & Witt, 2002;
Marra et al., 2002, 2004; Sydorovych & Marra, 2008), none of these studies focus explicitly on
weed management costs and their relationship with adoption of weed BMPs.
The next section of the paper details the survey design and administration and provides
an overview of the statistical methods used to analyze the survey data. We then report analysis
results and conclude with a review of the key findings and a discussion of their implications.
MATERIALS & METHODS
The primary data for this study are from a telephone survey of 1,205 randomly selected
growers who in 2007 produced at least 250 acres of the crop of interest (corn, cotton, or
soybean). The respondents included 402 corn, 401 cotton, and 402 soybean growers from 22
different states (Alabama, Arkansas, Georgia, Illinois, Indiana, Iowa, Kansas, Louisiana,
Minnesota, Mississippi, Missouri, Nebraska, North Carolina, North Dakota, Ohio, Oklahoma,
South Carolina, South Dakota, Tennessee, Texas, Virginia, and Wisconsin). The survey
instrument was designed by Monsanto and Marketing Horizons in consultation with the authors
and Marketing Horizons administered the survey in November and December of 2007.
The survey collected general information on the grower and his farming operation in
2007, including adoption of the weed BMPs listed in Table 1. In addition, growers were asked to
estimate their average weed management costs with the following question:

5
Please think about all of the time, effort, chemicals and equipment you devote to
controlling weeds in your corn/cotton/soybean crop. On average, how much per acre
would you say it costs you?
Finally, growers were asked about their plans to plant the crop of interest in 2008, including their
plans to plant RR varieties, to plant these RR varieties following RR varieties planted in 2007,
and to treat these RR varieties with a residual herbicide. This information was supplemented
with county average yield data (USDA-NASS, 2008b).
The survey and supplemental data were used to construct several variables to explain
observed differences in grower reported weed management costs. These variables can be
grouped into two categories: control variables and weed BMP variables. Control variables
included individual specific information on the grower’s education, farming experience, and
expected productivity. Growers were asked their highest level of educational attainment: high
school (12 years), some college (14 years), vocational/technical training (14 years), college
graduate (16 years), or advanced degree (18 years). For experience, growers were asked how
many years they had been farming. For expected productivity, growers were asked their
expected average yield in 2008. This expected yield was transformed into the percentage
difference from the ten-year county average yield reported by USDA-NASS (2008b). Education,
experience, and productivity variables were chosen to control for differences in weed
management costs attributable to differences in human capital that may make some growers
more productive than others.
Control variables included operation-specific information. The number of crop acres
planted in 2007 controlled for the size of the grower’s operation. A Herfindahl index based on
the proportion of crop acreage planted to corn, cotton, soybean, and other crops in 2007 was

6
constructed to control for cost differences related to the degree of crop diversification by each
farmer. The maximum value for this index is 1.0, while the minimum is 0.25 (as there are four
crops), with higher values indicating less crop diversification. An indicator variable equal to 1 if
the grower raised livestock in 2007 and 0 otherwise was also constructed to control for
differences in diversification across operations. Finally, the proportion of planted crop acreage
owned by the grower in 2007 was constructed to control for differences in stewardship incentives
across growers, since growers who rent land may have reduced incentives to invest in weed
BMPs and other practices that help sustain the long-term land productivity.
The final set of control variables were developed to control for systematic variation in
weed management costs related to unobservable geographic (e.g. climate, landscape, and soil),
cultural (e.g. conservation and stewardship norms), and political (e.g. regulatory and investments
in extension services) differences. The ten-year county average yield and yield coefficient of
variation were used to control for geographic differences, while state indicator variables were
constructed to account for cultural and political differences. Due to a limited number of
observations for some states, a single dummy variable was constructed for Louisiana and
Mississippi; North Carolina, South Carolina, and Virginia; and for the Southern Plains states of
Texas and Oklahoma.
Two groups of variables were constructed to assess the extent to which growers are
adopting various weed BMPs. The first group includes the percentage of RR acreage planned for
2008, the percentage of RR acreage planned for 2008 that would be treated with a residual
herbicide, and the percentage of RR acreage planned for 2008 that would follow 2007 RR acres.
The percentage of RR acreage planned for 2008 measures the extent to which a growers use a
range of weed management tactics within a particular growing season. The percentage of RR
7
acreage planned for 2008 that will follow 2007 RR acres measures the extent to which growers
use a range of weed management tactics overtime. Relying exclusively on RR varieties and
glyphosate for weed management within a particular season or overtime increases the risk of
glyphosate resistance, particularly if other weed BMPs are not incorporated into the management
program. The percentage of RR acres planned to be treated with a residual herbicide measures
the extent to which growers employ additional herbicides with different modes of action in their
RR program for weeds not controlled by glyphosate, which reduces the risk of glyphosate
resistance.
The second group of variables was constructed based on grower responses to direct
questions regarding how often they used each weed BMP listed in Table 1. For example, for the
first BMP – scouting fields before herbicide application (Table 1) – growers were asked
specifically:
My next set of questions will deal with weed control practices that you may follow. When
managing weeds in your corn/soybean/cotton crop, how often do you scout fields before a
herbicide application? Would you say Always, Often, Sometimes, Rarely, or Never?
The underlined section was changed for each weed BMP listed in Table 1 and grower responses
were coded as 1.0, 0.75, 0.50, 0.25, and 0.0 respectively, for Always, through to Never.
Scouting fields before an herbicide application allows growers to determine if an
application is actually necessary or when weed growth has reached the stage when they are most
effectively controlled. Scouting fields after a herbicide application allows growers to determine
if the herbicide was effective and to comeback with supplemental control if it is not. Controlling
weeds early when they are small gives better control, since smaller weeds tend to be more
susceptible to herbicides. Preventing weeds escapes using supplemental control provides an
8
opportunity to control weeds that may be resistant before they set seed and produce more
resistant weeds. Cleaning equipment between fields helps to stop the spread of weed seeds
including resistant weed seeds. Buying new seed that has been cleaned to reduce weed seed
contamination helps stop the introduction of new (possibly resistant) weeds into a field. Using
multiple herbicides reduces selection pressure by making it more difficult for weeds to survive
control. Using supplemental tillage can control weeds that have developed herbicide resistance.
Using the recommended herbicide application rate ensures that weeds are treated with enough
herbicide to control them. We hypothesized that the frequency of growers’ historic use of these
various weed BMPs could have an important influence on weed management costs.
Grower reported costs and the natural logarithm of costs were regressed on these control
and weed BMP adoption variables using ordinary least squares, with separate regression for
corn, cotton, and soybeans. The regressions using cost as the dependent variable exhibited
heteroscedasticity, while the regression using the natural logarithm of cost did not, so the natural
logarithm of cost regressions were chosen as the preferred model.
RESULTS
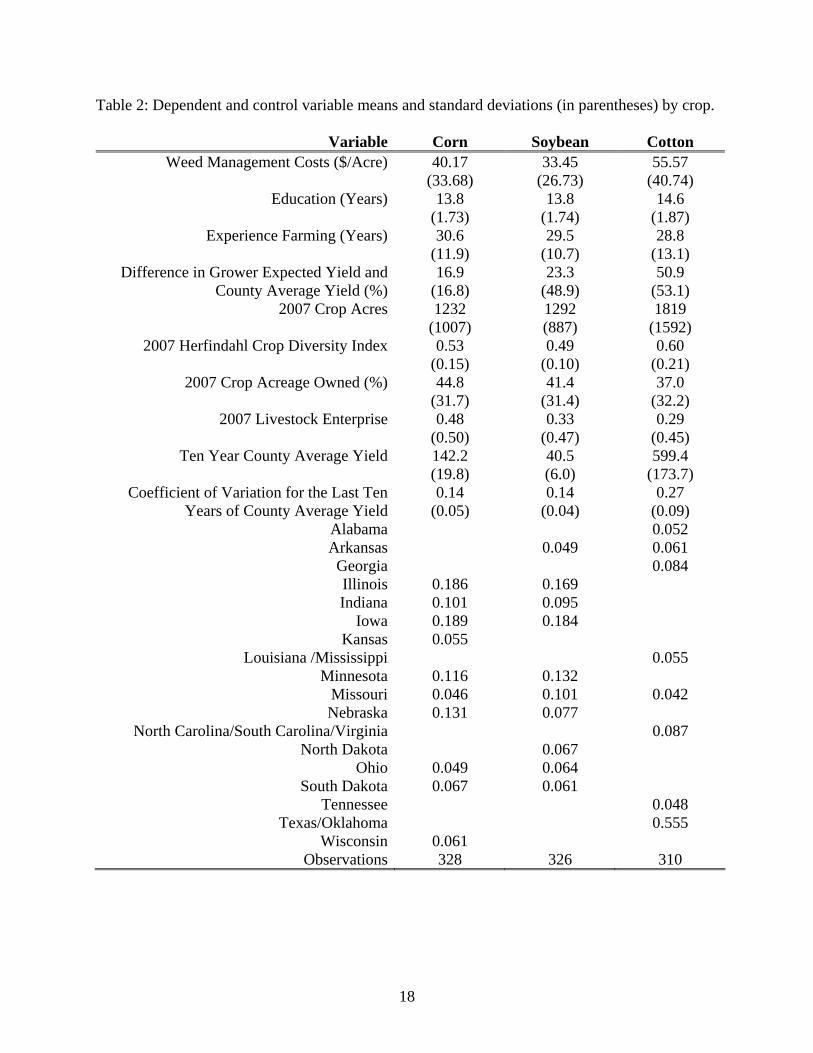
Table 2 report the means and standard deviations for reported weed management costs
and the control variables. Average reported weed management cost were highest for cotton,
followed by corn and then soybeans. Years of education and farming experience were similar
across corn, cotton, and soybean growers. The percentage difference in grower expected yield
from the ten-year county average was highest for cotton, followed by soybeans and corn. Cotton
growers operated about 700 more crop acres on average compared to corn and soybean growers,
while corn and soybean growers tended to own more of the land they operated and were more
diversified than cotton farms in terms of crops and livestock. Also, cotton farmers tend to face
9
greater year-to-year yield variability. Finally, the average of the state indicator variables
indicates the proportion of observations for each crop from each state, which because of the
survey sampling method generally follow the proportion of total U.S. crop acres in each state.
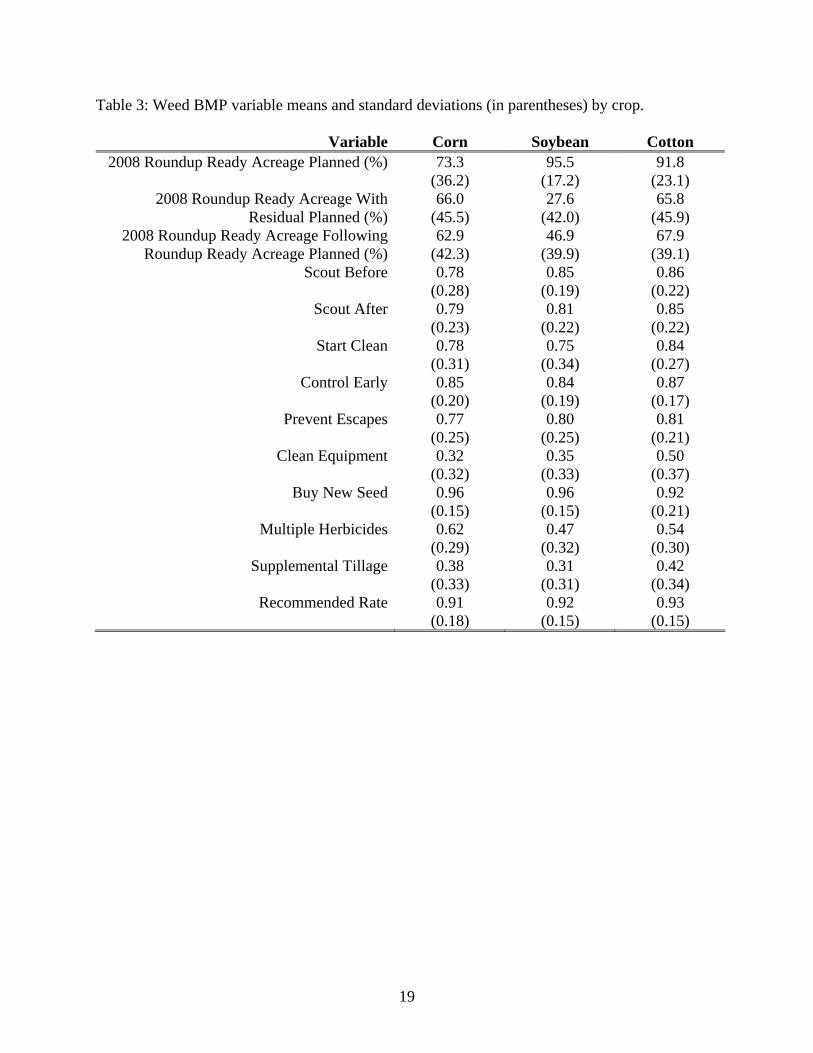
Table 3 reports the average and standard deviation for the weed BMP variables. Cotton
and soybean growers both planned to plant over 90% of their crop with RR varieties, while corn
growers planned to plant over 70% with RR varieties. Compared to soybean growers, corn and
cotton growers planned to treat a higher percentage of their RR acres with a residual herbicide
and planned to plant a higher percentage of their RR acres following a RR crop. The remaining
variables in Table 2 are the average (and standard deviation) of responses, where always, often,
sometimes, rarely, and never were coded as 1.0, 0.75, 0.50, 0.25, and 0.0, respectively. On
average, most corn, cotton, and soybean growers reported often or always scouting fields for
weeds before and after herbicide applications, starting with a clean field using a burndown
herbicide or tillage, controlling weed early when they are small, preventing weed escapes,
buying new seed, and using the recommended herbicide application rate. On average, cotton
growers reported sometimes cleaning their equipment between fields to stop the spread of weed
seeds, while corn and soybean reported sometimes or rarely cleaning their equipment. On
average, corn and cotton growers reported using multiple herbicides often or sometimes, while
soybean growers reported using multiple herbicides sometimes or rarely. Finally, on average,
most corn, cotton, and soybean growers reported using supplemental tillage to control weeds
sometimes or rarely.
Table 4 presents the regression coefficients and t-statistics for the control variables, while
Table 5 presents the regression coefficients and t-statistics for the weed BMP variables and

10
statistics for the regression fit. Since the dependent variable was the natural logarithm of costs,
these regression coefficients can be interpreted in terms of the proportional change in costs.
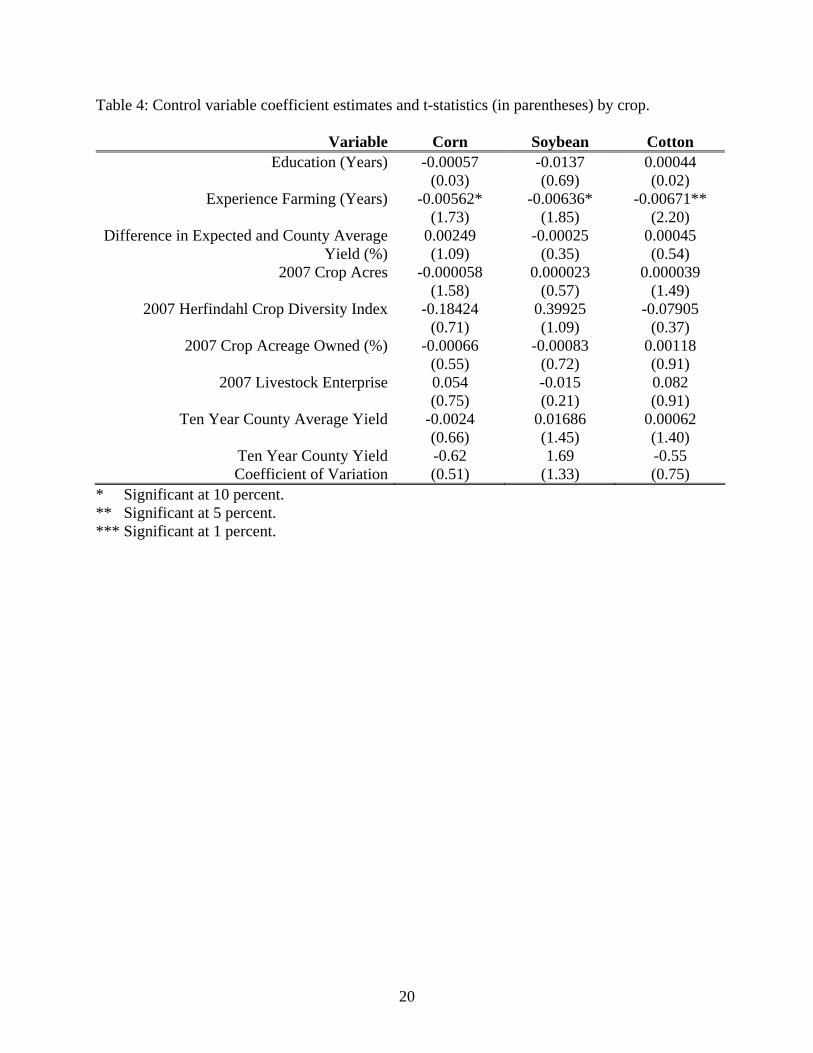
Table 4 shows that, with the one exception, none of the control variables appear to be
significantly related to reported weed control cost. Even ignoring statistical significance, the
signs of the coefficients are inconsistent across crops. The exception is years of farming
experience, which is related to significantly lower weed control costs. With the average farmer
having about 30 years of experience, these regression results suggest that the average grower has
15-18% lower weed management cost when compared to a first-year grower. This result is
consistent with the notion that growers gain valuable experience on the job that helps them
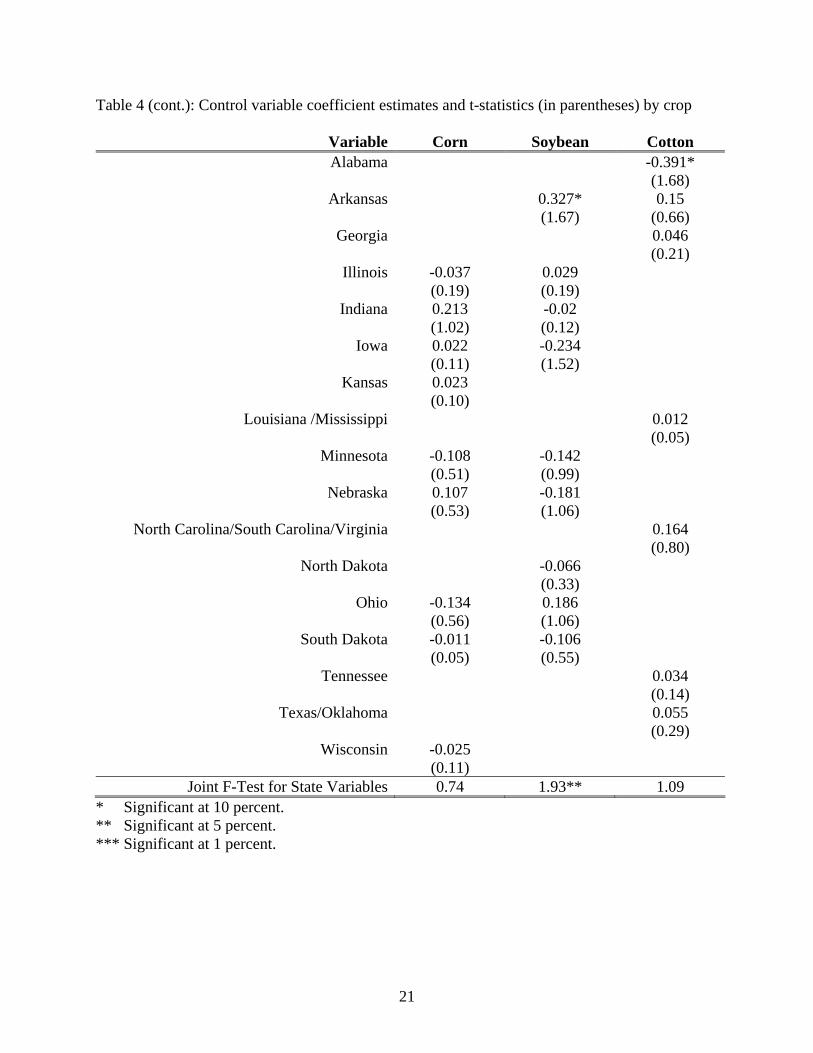
manage weeds at a lower cost. A joint test of the state indicator variables (bottom of Table 4)
suggests that no systematic differences in weed control cost exist across states for corn or cotton,
but do exist for soybeans. The excluded state in the regression is Missouri, so all coefficient
estimates are relative to Missouri. Significant coefficients imply that, compared to Missouri,
Arkansas soybean growers reported about 33% higher weed management costs and Alabama
cotton growers about 40% lower weed management costs.
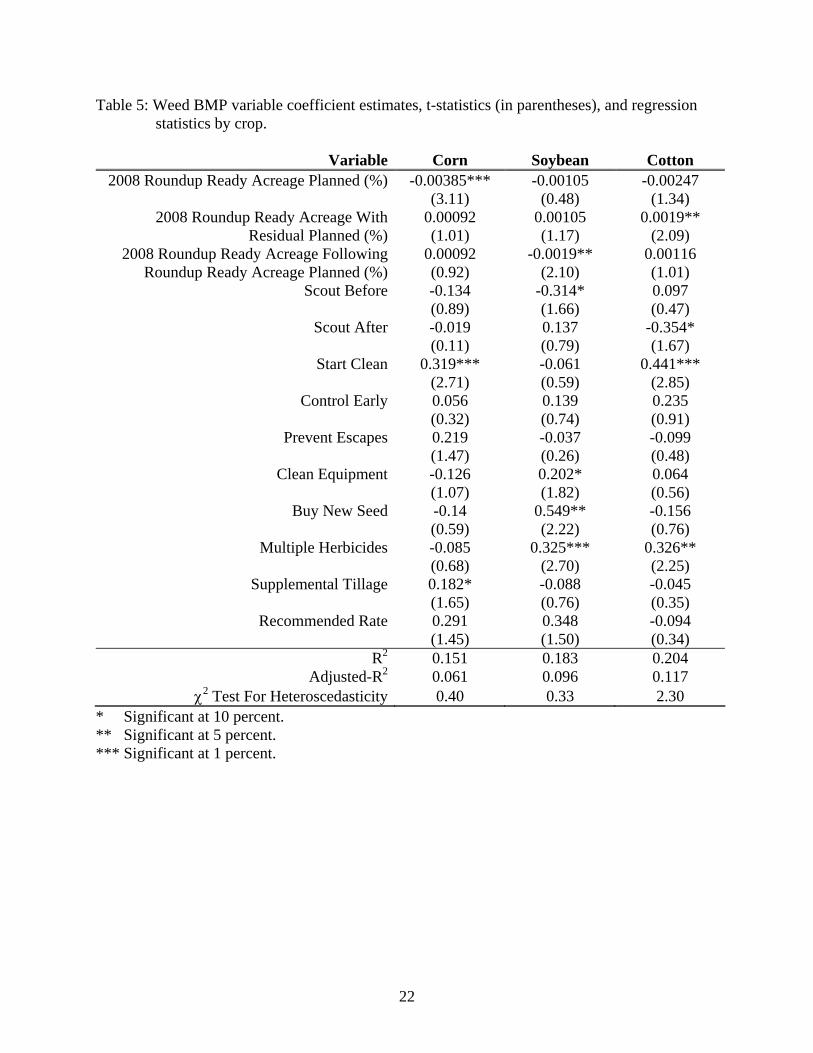
Table 5 shows that a variety of weed BMPs appear to have a significant influence on
grower reported weed management costs. The percentage of RR acreage planned for 2008 was
negatively related to weed management cost for all three crops, significantly so for corn,
suggesting that growers using RR varieties enjoy lower weed management costs. Coefficient
values imply that on average, growers exclusively planting RR varieties enjoy 39% lower weed
management costs in corn, 11% lower costs in soybean, and 25% lower costs in cotton.
The percentage of RR acreage planned to be treated with a residual herbicide was
positively related to weed management cost for all three crops, significantly so for cotton,
11
suggesting that it is indeed more costly for growers to add a residual herbicide to their RR weed
management program. Coefficient values imply that treating all RR acres with a residual
herbicide could increase weed management costs by about 10% in corn and soybean, and almost
20% in cotton. The planned percentage of RR acreage to follow a RR crop was related to higher
costs in corn and cotton, but lower costs in soybean. Coefficient estimates were only significant
for soybean and suggest a 19% cost savings for soybean growers who planned to plant all of
their RR soybean acres following RR crops.
For the weed BMP coefficients, 9 of the total 30 estimated were significant. Soybean
growers who scout fields before a herbicide application and cotton growers who scout fields after
a herbicide application more often reported significantly lower weed management cost. Corn
and cotton growers who start with a clean field more often reported significantly higher weed
management costs. Soybean growers who clean their equipment before changing fields and buy
new seed more often reported significantly higher weed management costs. Reported weed
management costs were significantly higher for soybean and cotton growers using multiple
herbicides more often and corn growers using supplemental tillage.
The R2 values range from 0.15 to 0.20, indicating that the regressions are significant, but
a substantial amount of variation in reported weed management costs remains unexplained. The
implication is that additional factors besides the control variables and weed BMP adoption
variables used here could potentially explain more of the observed variability in reported costs.
Nevertheless, results in Tables 4 and 5 indicate that several of the weed BMP adoption measures
included in these regressions had significant coefficient estimates.
DISCUSSION & CONCLUSIONS

12
RR crop varieties have been widely adopted because they provide growers with
significant benefits, both pecuniary and non-pecuniary. However, glyphosate resistance
threatens the benefits growers currently enjoy from RR crops. Weed resistance to herbicides is
not a new phenomena and weed scientist have developed a variety of weed best management
practices (BMPs) to help growers manage resistance. However, the use of these weed BMPs
could substantially increase weed management costs, which would discourage adoption.
This paper evaluated the extent to which growers are adopting various weed BMPs and
assessed how BMP adoption affects weed control costs. Results suggest that the adoption of RR
crop varieties reduces weed control costs, which is one of several reasons why so many growers
have adopted these varieties. Incorporating a residual herbicide into the RR weed management
program increases costs, which has likely discouraged adoption of this practice, particularly by
soybean growers, even though it can help reduce the risk of glyphosate resistance. About two-
thirds of RR corn and cotton acres are planted following another RR crop, which likely promotes
glyphosate resistance if other weed BMPs are not employed. Planting RR corn or cotton
following another RR crop does not appear to yield any significant weed management cost
savings, except for RR soybean growers, implying that benefits other than lower costs are
driving grower decisions to plant RR crops following RR crops.
Scouting fields before and after an herbicide application are widely adopted BMPs that
appear to yield some cost savings for cotton and soybean growers. Starting with a clean field is
also widely adopted, even though it appears to increase the cost of weed management for corn
and cotton growers, suggesting that growers receive other advantages from this practice, such as
higher yields due to reduced early weed competition. Controlling weeds early and preventing
weed escapes are two other widely adopted BMPs that do not appear to significantly increase
13
weed management costs. Cleaning equipment between fields, using multiple herbicides, and
using supplemental tillage are less widely adopted weed BMPs that also appear to be associated
with increased weed control costs for some crops, which might help explain why they are not as
widely adopted. Using the recommended herbicide application rate is the most widely adopted
weed BMP, even though there is weak evidence to suggest the practice increases weed
management costs in soybean and corn.
Overall, growers commonly use a wide variety of weed best management practices, even
when some of these widely adopted practices appear to increase costs. However, some practices
that are not as widely adopted, possibly because they raise weed management costs. Two
opportunities for improving grower adoption of key weed BMPs to reduce the risk of glyphosate
resistance would seem to be encouraging corn and cotton growers to not plant as many of their
RR acres following another RR crop and encouraging more soybean growers to incorporate a
residual herbicide into their RR weed management program.
ACKNOWLEDGEMENTS
Support for this project was provided by the Arizona, Minnesota, and Wisconsin
Agricultural Experiment Stations, Harvest Choice (http://harvestchoice.org/) and Monsanto. The
authors gratefully acknowledge the helpful comments and data collection efforts of Michelle
Obermeier-Starke, John Soteres, and other researchers at Monsanto. All conclusions and any
remaining errors are the authors’.
14
REFERENCES
Benbrook, C. (2001). Troubled times amid commercial success for roundup ready soybeans.
AgBioTech InfoNet Technical Paper 4, Sandpoint Idaho. Available on the World Wide Web:
http://www.mindfully.org/GE/GE2/RRS-Troubled-Benbrook.htm.
Boerboom, C. (2009). Giant ragweed with suspected glyphosate resistance. Wisconsin Crop
Manager 16(16):63-64. Available on the World Wide Web:
http://ipcm.wisc.edu/WCMNews/tabid/53/BlogID/17/Default.aspx.
Bonny, S. (2008). Genetically modified glyphosate-tolerant soybean in the USA: Adoption
factors, impacts and prospects. A review. Agronomy for Sustainable Development 28(1):21-
32.
Brookes, G., & Barfoot, P. (2008). Global impact of biotech crops: Socio-economic and
environmental effects, 1996-2006. AgBioForum 11(1):21-38.
Carpenter, J., & Gianessi, L. (1999). Herbicide tolerant soybeans: Why growers are adopting
roundup ready varieties. AgBioForum 2(2):65-72.
Culpepper, A.S. (2006). Glyphosate-induced weed shifts. Weed Technology 20(2):277-281.
Diggle, A.J., Neve, P.B., & Smith, E.P. (2003). Herbicides used in combination can reduce the
probability of herbicide resistance in finite weed populations. Weed Research 43 (5):371-
382.
Fernandez-Cornejo, J., Klotz-Ingram, C., & Jans, S. (2002). Farm-level effects of adopting
herbicide-tolerant soybeans in the U.S.A. Journal of Agricultural and Applied Economics
34(1):149-163.
Ferrell, J.A., & Witt, W.W. (2002). Comparison of glyphosate and other herbicides for weed
control in corn (Zea mays): Efficacy and economics. Weed Technology 16(4):701-706.
15
Green, J. (2007). Review of glyphosate and ALS-inhibiting herbicide crop resistance and
resistant weed management. Weed Technology 21(2):547-58.
Heap, I.M. (2009). The international survey of herbicide resistant weeds. Available on the World
Wide Web: http://www.weedscience.org/.
Holt, J.S., & LeBaron, H.M. (1990). Significance and distribution of herbicide resistance. Weed
Technology 4(1):141-149.
Kruger, G.R., Johnson, W.G., Weller, S.C., Owen, M.D.K., Shaw, D.R., Wilcut, J.W., Jordan,
D.L., Wilson, R.G., Bernards, M.L., & Young, B.G. (2009). U.S. grower views on
problematic weeds and changes in weed pressure in glyphosate-resistant corn, cotton, and
soybean cropping systems. Weed Technology 23(1):162-166.
Legleiter, T.R., & Bradley, K.W. 2008. Glyphosate and multiple herbicide resistance in common
waterhemp (Amaranthus rudis) populations from Missouri. Weed Science 56(4):582-587.
Llewellyn, R.S., Lindner, R.K., Pannell, D.J., & Powles, S.B. (2002). Resistance and the
herbicide resource: perceptions of Western Australian grain growers. Crop Protection
21(10):1067-1075.
Marra, M., Pardey, P., & Alston, J. (2002). The payoffs to transgenic field crops: An assessment
of the evidence. AgBioForum 5(2):43-50.
Marra, M.C., Piggott, N.E., & Carlson, G.A. (2004). The net benefits, including convenience, of
roundup ready® soybeans: Results from a national survey. Technical Bulletin 2004-3. NSF
Center for IPM. Raleigh, NC.
Mueller, T.C., Mitchell, P.D., Young, B.G., & Culpepper, A.S. (2005). Proactive versus reactive
management of glyphosate-resistant or tolerant weeds. Weed Technology 19(4):924-933.
16
Norsworthy, J.K., Smith, K.L., Scott, R.C., & Gbur, E.E. (2007). Consultant perspectives on
weed management needs in Arkansas cotton. Weed Technology 21(3):825-831.
Pannell, D.J., & Zilberman, D. (2001). Economic and sociological factors affecting growers’
decision making on herbicide resistance. In S. Powles & D. Shaner (Eds.), Herbicide
Resistance and World Grains (pp. 252-277). Boca Raton: CRC Press.
Scott, B.A., & VanGessel, M.J. (2007). Delaware soybean grower survey on glyphosate-resistant
horseweed (Conyza canadensis). Weed Technology 21(2):270-274.
Sydorovych, O., & Marra, M. (2008). Valuing the change in herbicide risks resulting from
adoption of roundup ready soybeans by U.S. farmers: A revealed preference approach.
Journal of Agricultural and Applied Economics 40(3):777-787.
United States Department of Agriculture, National Agricultural Statistics Service. (2008a).
Acreage. Available on the World Wide Web:
http://usda.mannlib.cornell.edu/usda/current/Acre/Acre-06-30-2008.pdf.
United States Department of Agriculture, National Agricultural Statistics Service. (2008b).
Quick Stats: State and County Data. Available on the World Wide Web:
http://www.nass.usda.gov/.
Weersink, A., Llewellyn, R.S., & Pannell, D.J. (2005). Economics of pre-emptive management
to avoid weed resistance to glyphosate in Australia. Crop Protection 24(7):659-665.
17
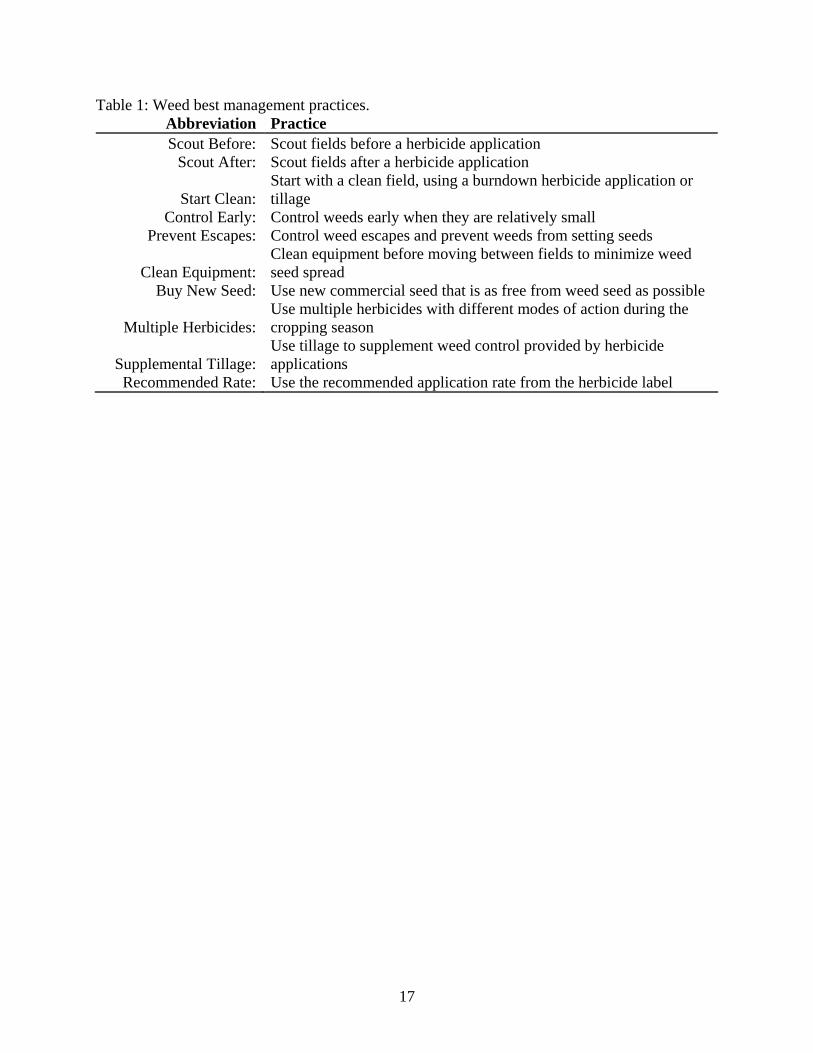
Table 1: Weed best management practices. Abbreviation Practice Scout Before: Scout fields before a herbicide application
Scout After: Scout fields after a herbicide application
Start Clean: Start with a clean field, using a burndown herbicide application or tillage
Control Early: Control weeds early when they are relatively small Prevent Escapes: Control weed escapes and prevent weeds from setting seeds
Clean Equipment: Clean equipment before moving between fields to minimize weed seed spread
Buy New Seed: Use new commercial seed that is as free from weed seed as possible
Multiple Herbicides: Use multiple herbicides with different modes of action during the cropping season
Supplemental Tillage: Use tillage to supplement weed control provided by herbicide applications
Recommended Rate: Use the recommended application rate from the herbicide label
18
Table 2: Dependent and control variable means and standard deviations (in parentheses) by crop.
Variable Corn Soybean Cotton Weed Management Costs ($/Acre) 40.17 33.45 55.57
(33.68) (26.73) (40.74) Education (Years) 13.8 13.8 14.6
(1.73) (1.74) (1.87) Experience Farming (Years) 30.6 29.5 28.8
(11.9) (10.7) (13.1) Difference in Grower Expected Yield and 16.9 23.3 50.9
County Average Yield (%) (16.8) (48.9) (53.1) 2007 Crop Acres 1232 1292 1819
(1007) (887) (1592) 2007 Herfindahl Crop Diversity Index 0.53 0.49 0.60
(0.15) (0.10) (0.21) 2007 Crop Acreage Owned (%) 44.8 41.4 37.0
(31.7) (31.4) (32.2) 2007 Livestock Enterprise 0.48 0.33 0.29
(0.50) (0.47) (0.45) Ten Year County Average Yield 142.2 40.5 599.4
(19.8) (6.0) (173.7) Coefficient of Variation for the Last Ten 0.14 0.14 0.27
Years of County Average Yield (0.05) (0.04) (0.09) Alabama 0.052 Arkansas 0.049 0.061 Georgia 0.084 Illinois 0.186 0.169 Indiana 0.101 0.095
Iowa 0.189 0.184 Kansas 0.055
Louisiana /Mississippi 0.055 Minnesota 0.116 0.132
Missouri 0.046 0.101 0.042 Nebraska 0.131 0.077
North Carolina/South Carolina/Virginia 0.087 North Dakota 0.067
Ohio 0.049 0.064 South Dakota 0.067 0.061
Tennessee 0.048 Texas/Oklahoma 0.555
Wisconsin 0.061 Observations 328 326 310
19
Table 3: Weed BMP variable means and standard deviations (in parentheses) by crop.
Variable Corn Soybean Cotton 2008 Roundup Ready Acreage Planned (%) 73.3 95.5 91.8
(36.2) (17.2) (23.1) 2008 Roundup Ready Acreage With 66.0 27.6 65.8
Residual Planned (%) (45.5) (42.0) (45.9) 2008 Roundup Ready Acreage Following 62.9 46.9 67.9
Roundup Ready Acreage Planned (%) (42.3) (39.9) (39.1) Scout Before 0.78 0.85 0.86
(0.28) (0.19) (0.22) Scout After 0.79 0.81 0.85
(0.23) (0.22) (0.22) Start Clean 0.78 0.75 0.84
(0.31) (0.34) (0.27) Control Early 0.85 0.84 0.87
(0.20) (0.19) (0.17) Prevent Escapes 0.77 0.80 0.81
(0.25) (0.25) (0.21) Clean Equipment 0.32 0.35 0.50
(0.32) (0.33) (0.37) Buy New Seed 0.96 0.96 0.92
(0.15) (0.15) (0.21) Multiple Herbicides 0.62 0.47 0.54
(0.29) (0.32) (0.30) Supplemental Tillage 0.38 0.31 0.42
(0.33) (0.31) (0.34) Recommended Rate 0.91 0.92 0.93
(0.18) (0.15) (0.15)
20
Table 4: Control variable coefficient estimates and t-statistics (in parentheses) by crop.
Variable Corn Soybean Cotton Education (Years) -0.00057 -0.0137 0.00044
(0.03) (0.69) (0.02) Experience Farming (Years) -0.00562* -0.00636* -0.00671**
(1.73) (1.85) (2.20) Difference in Expected and County Average 0.00249 -0.00025 0.00045
Yield (%) (1.09) (0.35) (0.54) 2007 Crop Acres -0.000058 0.000023 0.000039
(1.58) (0.57) (1.49) 2007 Herfindahl Crop Diversity Index -0.18424 0.39925 -0.07905
(0.71) (1.09) (0.37) 2007 Crop Acreage Owned (%) -0.00066 -0.00083 0.00118
(0.55) (0.72) (0.91) 2007 Livestock Enterprise 0.054 -0.015 0.082
(0.75) (0.21) (0.91) Ten Year County Average Yield -0.0024 0.01686 0.00062
(0.66) (1.45) (1.40) Ten Year County Yield -0.62 1.69 -0.55 Coefficient of Variation (0.51) (1.33) (0.75)
* Significant at 10 percent. ** Significant at 5 percent. *** Significant at 1 percent.
21
Table 4 (cont.): Control variable coefficient estimates and t-statistics (in parentheses) by crop
Variable Corn Soybean Cotton Alabama -0.391*
(1.68) Arkansas 0.327* 0.15
(1.67) (0.66) Georgia 0.046
(0.21) Illinois -0.037 0.029
(0.19) (0.19) Indiana 0.213 -0.02
(1.02) (0.12) Iowa 0.022 -0.234
(0.11) (1.52) Kansas 0.023
(0.10) Louisiana /Mississippi 0.012
(0.05) Minnesota -0.108 -0.142
(0.51) (0.99) Nebraska 0.107 -0.181
(0.53) (1.06) North Carolina/South Carolina/Virginia 0.164
(0.80) North Dakota -0.066
(0.33) Ohio -0.134 0.186
(0.56) (1.06) South Dakota -0.011 -0.106
(0.05) (0.55) Tennessee 0.034
(0.14) Texas/Oklahoma 0.055
(0.29) Wisconsin -0.025
(0.11) Joint F-Test for State Variables 0.74 1.93** 1.09
* Significant at 10 percent. ** Significant at 5 percent. *** Significant at 1 percent.
22
Table 5: Weed BMP variable coefficient estimates, t-statistics (in parentheses), and regression statistics by crop.
Variable Corn Soybean Cotton
2008 Roundup Ready Acreage Planned (%) -0.00385*** -0.00105 -0.00247 (3.11) (0.48) (1.34)
2008 Roundup Ready Acreage With 0.00092 0.00105 0.0019** Residual Planned (%) (1.01) (1.17) (2.09)
2008 Roundup Ready Acreage Following 0.00092 -0.0019** 0.00116 Roundup Ready Acreage Planned (%) (0.92) (2.10) (1.01)
Scout Before -0.134 -0.314* 0.097 (0.89) (1.66) (0.47)
Scout After -0.019 0.137 -0.354* (0.11) (0.79) (1.67)
Start Clean 0.319*** -0.061 0.441*** (2.71) (0.59) (2.85)
Control Early 0.056 0.139 0.235 (0.32) (0.74) (0.91)
Prevent Escapes 0.219 -0.037 -0.099 (1.47) (0.26) (0.48)
Clean Equipment -0.126 0.202* 0.064 (1.07) (1.82) (0.56)
Buy New Seed -0.14 0.549** -0.156 (0.59) (2.22) (0.76)
Multiple Herbicides -0.085 0.325*** 0.326** (0.68) (2.70) (2.25)
Supplemental Tillage 0.182* -0.088 -0.045 (1.65) (0.76) (0.35)
Recommended Rate 0.291 0.348 -0.094 (1.45) (1.50) (0.34)
R2 0.151 0.183 0.204 Adjusted-R2 0.061 0.096 0.117
χ2 Test For Heteroscedasticity 0.40 0.33 2.30 * Significant at 10 percent. ** Significant at 5 percent. *** Significant at 1 percent.
23
Figure 1: Number of weed species with glyphosate resistant populations and number of states with glyphosate resistant weed populations.
0
5
10
15
20
1996 1997 1998 1999 2000 2001 2002 2003 2004 2005 2006 2007
Year
Number of States with Glyphosate Resistant Weed
Populations
Number of GlyphosateResistant Weed Species
Related Documents