WebStar: a visualization model for hyperlink structures Jin Zhang a, * , Tien Nguyen b a School of Information Studies, University of Wisconsin––Milwaukee, P.O. Box 413, Bolton Hall 532, Milwaukee, WI 53201, USA b Department of Computer Science, University of Wisconsin––Milwaukee, EMS Building, 3200 North Cramer Ave, Milwaukee, WI 53201, USA Received 15 June 2003; accepted 24 March 2004 Available online 10 May 2004 Abstract The authors introduce an information visualization model, WebStar, for hyperlink-based information systems. Hyperlinks within a hyperlink-based document can be visualized in a two-dimensional visual space. All links are projected within a display sphere in the visual space. The relationship between a specified central document and its hyperlinked documents is visually presented in the visual space. In addition, users are able to define a group of subjects and to observe relevance between each subject and all hyperlinked documents via movement of that subject around the display sphere center. WebStar allows users to dynamically change an interest center during navigation. A retrieval mechanism is developed to control retrieved results in the visual space. Impact of movement of a subject on the visual document distribution is analyzed. An ambiguity problem caused by projection is discussed. Potential applications of this visualization model in information retrieval are included. Future research directions on the topic are addressed. Ó 2004 Elsevier Ltd. All rights reserved. Keywords: Visualization of information; Information retrieval; Retrieval system; Hyperlink structure 1. Introduction Information visualization offers a unique means to enable users to handle invisible abstract information by taking advantage of their visual perception capabilities. By presenting information visually, it is possible for human beings to use more of their perceptual abilities in understanding information. This ability of the human mind to rapidly perceive visual information makes information visualization not only useful, but also powerful and necessary tool for information discovery. Information visualization is a highly efficient way for people to directly perceive data and discover knowledge and insight from it. The application of the visualization technique to information retrieval really broadens the horizon of information retrieval. * Corresponding author. Tel.: +1-414-229-2712; fax: +1-414-229-4848. E-mail addresses: [email protected] (J. Zhang), [email protected] (T. Nguyen). 0306-4573/$ - see front matter Ó 2004 Elsevier Ltd. All rights reserved. doi:10.1016/j.ipm.2004.03.005 Information Processing and Management 41 (2005) 1003–1018 www.elsevier.com/locate/infoproman

Welcome message from author
This document is posted to help you gain knowledge. Please leave a comment to let me know what you think about it! Share it to your friends and learn new things together.
Transcript
Information Processing and Management 41 (2005) 1003–1018
www.elsevier.com/locate/infoproman
WebStar: a visualization model for hyperlink structures
Jin Zhang a,*, Tien Nguyen b
a School of Information Studies, University of Wisconsin––Milwaukee, P.O. Box 413, Bolton Hall 532,
Milwaukee, WI 53201, USAb Department of Computer Science, University of Wisconsin––Milwaukee, EMS Building,
3200 North Cramer Ave, Milwaukee, WI 53201, USA
Received 15 June 2003; accepted 24 March 2004
Available online 10 May 2004
Abstract
The authors introduce an information visualization model, WebStar, for hyperlink-based information systems.
Hyperlinks within a hyperlink-based document can be visualized in a two-dimensional visual space. All links are
projected within a display sphere in the visual space. The relationship between a specified central document and its
hyperlinked documents is visually presented in the visual space. In addition, users are able to define a group of subjects
and to observe relevance between each subject and all hyperlinked documents via movement of that subject around the
display sphere center. WebStar allows users to dynamically change an interest center during navigation. A retrieval
mechanism is developed to control retrieved results in the visual space. Impact of movement of a subject on the visual
document distribution is analyzed. An ambiguity problem caused by projection is discussed. Potential applications of
this visualization model in information retrieval are included. Future research directions on the topic are addressed.
� 2004 Elsevier Ltd. All rights reserved.
Keywords: Visualization of information; Information retrieval; Retrieval system; Hyperlink structure
1. Introduction
Information visualization offers a unique means to enable users to handle invisible abstract information
by taking advantage of their visual perception capabilities. By presenting information visually, it is possiblefor human beings to use more of their perceptual abilities in understanding information. This ability of the
human mind to rapidly perceive visual information makes information visualization not only useful, but
also powerful and necessary tool for information discovery. Information visualization is a highly efficient
way for people to directly perceive data and discover knowledge and insight from it. The application of the
visualization technique to information retrieval really broadens the horizon of information retrieval.
* Corresponding author. Tel.: +1-414-229-2712; fax: +1-414-229-4848.
E-mail addresses: [email protected] (J. Zhang), [email protected] (T. Nguyen).
0306-4573/$ - see front matter � 2004 Elsevier Ltd. All rights reserved.
doi:10.1016/j.ipm.2004.03.005
1004 J. Zhang, T. Nguyen / Information Processing and Management 41 (2005) 1003–1018
Visualization for information is not merely a simple way to present information and search for results, it
also provides an interactive environment for people to explore, discover, analyze, and tap into information.
The visual environments contain richer information than traditional information systems due to two- or
three-dimensional characteristics. Visualization environment offers an intuitive context with which peoplecan make a decision on whether objects are relevant or irrelevant. It deals more easily with highly hete-
rogeneous and noisy data, and requires no understanding of complex mathematical algorithms
(Keim, 2001). In summary, it extends a system’s capacity beyond what a traditional information system can
reach.
1.1. Hyperlink structure analysis
A hyperlink structure employs a linked concept, keyword, phrase, etc. as an anchor within a document.
For this research a document is defined broadly as a traditional article, webpage, or electronic textual
object. Hyperlinks enable users to jump from one document to another document very easily. They inte-
grate and connect related concepts, keywords, or phrases in a very natural way. The application of a
hyperlink structure in a full text context fits people’s reading behavior. However, a hyperlink structure can
also create problems if not applied properly. The ability to discriminate and distinguish among hyperlink-
based documents in the ever-increasing volume of information available through the networks is becoming
more and more difficult (Berghel, Berleant, Foy, & McGuire, 1999). These problems are summarized asfollows:
(a) A major concern in hyperlink-based systems is disoriented in the hyperlink-based information space.
Because hyperlinked information is organized in interlinked fragments and is accessed nonlinearly
(Marchionini & Shneiderman, 1993), users can become easily disoriented and therefore lose control
while navigating the hyperlink-based information space.
(b) There is no mechanism that can indicate the extent to which a linking document and its linked (outgo-
ing) documents are relevant. It is clear that people can arbitrarily and easily hyperlink anything within adocument if they want. In addition, the existence of a hyperlink itself does not reveal any information
about whether a linking object and a linked object are relevant or not. Basically, a hyperlink is merely a
pointer that refers to an address. Although the context of a hyperlink within a document can tell users
something about their relationship, the influence is limited (Fraser & Locatis, 2001). However, some-
times this relevance information is crucial for users to make a decision as to whether they are going to
further explore linked documents or not.
(c) With an increase of hyperlinks within a single document, especially within a diverse and comprehensive
environment like the Internet, it becomes necessary to give users an overview of relationships among alloutgoing documents. Notice that all hyperlinks within a document may not address the same topic.
Providing a semantic picture of relationships among all linked documents would help users to facilitate
navigation in the hyperlink-based space.
(d) Users cannot know whether all linked documents are sensitive or related to some subjects or topics that
users may be interested in. A document may cover multiple topics or subject issues while users may be
interested in only part of them. It is necessary to offer a way to distinguish the hyperlinked documents
related to specified subjects from others, and to identify semantically clustered hyperlinked documents
within a document.
These problems prevent users from effectively and efficiently utilizing hyperlink-based information re-
sources and they cannot be solved via using traditional means and methods. The situation calls for new
methods, means, avenues, and techniques to solve the problems.
J. Zhang, T. Nguyen / Information Processing and Management 41 (2005) 1003–1018 1005
1.2. Related prior works
There is a great deal of research addressing visualization for hyperlink-based WWW information and
describing various models. A hierarchy of hyperlinks among pages within a website is visualized, where thevisual spaces are presented as interlinked local maps to facilitate navigation on the Internet (Durand &
Kahn, 1998; Hightower, Ring, Helfman, Bederson, & Hollan, 1998). Hyperbolic technique is widely used to
present hyperlink structures (Eick, 2001; Munzner, 1998; Robert & Lecolinet, 1998) because of its dynamic
and flexible feature for information representation.
Graphic and other features are usually employed to express semantic information in development of a
visualization model. For instance, some systems use position along a scale (Hochheiser & Shneiderman,
2001; Olsen, Korfhage, Sochats, Spring, & Williams, 1993), angle (Zhang, 2001; Zhang & Korfhage, 1999),
distance (Havre, Hetzler, Perrine, Jurrus, & Miller, 2001; Nuchprayoon & Korfhage, 1994; Zhang &Korfhage, 1999), area (Ding, Chowdhury, Foo, & Qian, 2000; Rorvig & Fitzpatrick, 2000; Wise, 1999),
volume (Young & Shneiderman, 1993), citation (Noyons, Buter, & van Raan, 2000; Small, 1999; White,
2003), hierarchy relationships (Kleiberg, van de Wetering, & van Wijk, 2001; van Ham & van Wijk, 2002;
Yang, Ward, & Rundensteiner, 2002), and so on.
Visual information systems, such as VIBE (Morse, Lewis, & Olsen, 2000, 2002; Olsen & Korfhage, 1994;
Olsen et al., 1993), InfoCrystal (Spoerri, 1993), LyberWorld (Hemmje, 1995; Hemmje, Kunkel, & Willett,
1994), and VR-VIBE (Benford, Greenhalgh, Snowdon, Ingram, & Knox, 1995; Churchill, Snowdon,
Benford, & Dhanda, 1997), define points of interest (reference points) (Korfhage, 1997) and use the sim-ilarity ratios between an object and the defined reference points to position that object in a two- or three-
dimensional visual space. This similarity ratio-based algorithm is expected to achieve a good controllability
for projected objects in a visual space because of the manipulability of the reference points in the visual
spaces. The major advantages of this projection model reside in flexibility of visual information presen-
tation, simplicity of the algorithm, and manipulability of defined reference points. Notice that in these
systems the defined reference points can only be manipulated manually. Observe that there is no central
interest point within the visual spaces and role of the reference points are the same. The systems must work
within a multiple reference point environment.In summary, the analyses show that most of the hyperlink-based information visual tools only visualize
hyperlinks between connected pages and they rarely distinguish the extent to which they are related.
Current visual information systems hardly use object movement and object speed as the means to express
semantic relationships among projected objects, and no similarity ratio algorithm has been applied to
hyperlink structures.
The objectives of the proposed visualization model are to provide users with a visual browsing and
retrieval environment, to visualize hyperlink structures, to display the extent to which a linking document
and its linked documents are relevant, to adopt the similarity ratio algorithm to the hyperlink structureprojection, to develop a retrieval mechanism for hyperlink structures, and to facilitate users’ decision-
making during navigation.
It is worth pointing out that the proposed model can be applied to various link-based environments. It is
apparent that the model can be used to visualize a hyperlink-based website. In this case, the hyperlink-
based information space is the Internet and documents are webpages. The WebStar model can also be
employed for bibliographic citation analysis in a bibliographic document database, where citations in a
publication are regarded as links. This model also can be applied to hyperlink-based help file systems within
applications or hypertext document authoring systems such as Storyspace (Bernstein, 2002). Anotherinteresting potential application is that the WebStar model can be used to visualize results of a search
engine when the relevance between a query and a retrieved webpage is treated as a semantic link or virtual
‘‘link’’.
1006 J. Zhang, T. Nguyen / Information Processing and Management 41 (2005) 1003–1018
2. Definition of the visual space and visualization algorithm analysis
2.1. Data structure description
TheWebStar visualization model is built on a vector-based data structure. Suppose there is a hyperlink-
based document space. A central document can be specified by users. This central document is a starting
point. It hyperlinks multiple documents. A vector-based space can be defined based on the central docu-
ment and connected documents. In other words, all keywords in the vector-based space will be extracted
from both the specified central document and all connected documents. They are then normalized based on
a standard lexical database. Notice that since users can arbitrarily select a specified central document, it
suggests that the content of this vector-based database is dynamic. It requires that the database contents be
updated immediately when users browse a different central document of interest. However, updating thedatabase would not be a major concern because the number of connected documents is relatively small, and
therefore the number of extracted keywords is not significantly large. This makes the database update
manageable.
V ¼
t11 t12 � � � t1nt21 t22 � � � t2n� � � � � � � � � � � �tm1 tm2 � � � tmn
8>><>>:
9>>=>>; ð1Þ
Eq. (1) is defined as the vector-based space. The columns of the matrix V are indexing terms from
documents. The rows of the matrix are the central document and its outgoing documents that are indexedby indexing terms (or keywords). In other words, the central document and its outgoing documents are
treated equally in Eq. (1). The number of different indexing terms in V is n and the number of documents ism. Here tij is defined as the weight of term j in document i. The above analysis shows that contents of thematrix V , including the two parameters n and m, are changeable due to the fact that when a centraldocument can be replaced by any of its hyperlinked documents or other documents. Since this vector space
only covers a limited number of documents, the value of either parameter n or m is not significantly large,which will assure that the model responds to a user’s request in a tolerable time when database is updated.
The webpage term matrix in WebStar is dynamic. That is, when the central document changes, thismatrix must be reconstructed accordingly. Notice that each of connected documents within the central
document is not added to the matrix one by one. Instead, all terms from all related documents are extracted
and normalized first. The weight of an extracted term is then calculated. After that it is compared with a
predefined threshold: If its weight is larger than or equal to the threshold, it will be selected for the matrix.
Otherwise, it will be eliminated. It suggests that the matrix is not built until all keywords from related
documents are extracted, normalized, weighted and selected. That is, the number of the matrix columns is
exactly equal to the number of selected keywords from connected documents, and therefore, an extracted
keyword from any related document (regardless of its size) can fit in the matrix properly.
2.2. Description of the visual space
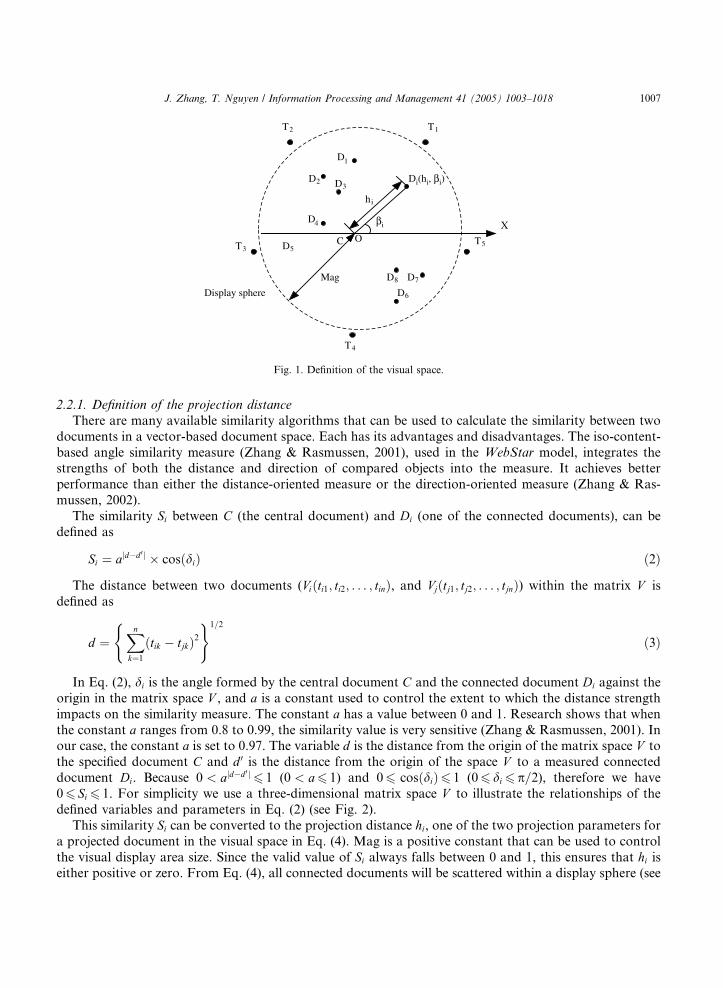
The visual space of the WebStar model is defined in a two-dimensional space (see Fig. 1). The origin of
the visual space (O) is the central document (C) specified or selected by users. It is always located at thecenter of the visual space. The X -axis is a horizontal line passing through the origin of the visual space. Anydocument (Di) connected to this central document will be projected onto this visual space. Its position in the
visual space is determined by two parameters hi and bi. The projection distance hi is computed based on thesimilarity between the central point C and that document Di whereas the projection angle bi is an angleaffected by a group of selected subjects (Ti) (to be discussed later).
hi
βi
Di(hi, βi)
OX
T1T2
T3
T4
T5
Mag
Display sphere
C
D1
D2 D3
D4
D5
D6
D7D8
Fig. 1. Definition of the visual space.
J. Zhang, T. Nguyen / Information Processing and Management 41 (2005) 1003–1018 1007
2.2.1. Definition of the projection distance
There are many available similarity algorithms that can be used to calculate the similarity between two
documents in a vector-based document space. Each has its advantages and disadvantages. The iso-content-
based angle similarity measure (Zhang & Rasmussen, 2001), used in the WebStar model, integrates thestrengths of both the distance and direction of compared objects into the measure. It achieves better
performance than either the distance-oriented measure or the direction-oriented measure (Zhang & Ras-
mussen, 2002).
The similarity Si between C (the central document) and Di (one of the connected documents), can be
defined as
Si ¼ ajd�d 0 j � cosðdiÞ ð2Þ
The distance between two documents (Viðti1; ti2; . . . ; tinÞ, and Vjðtj1; tj2; . . . ; tjnÞ) within the matrix V is
defined as
d ¼Xn
k¼1ðtik
(� tjkÞ2
)1=2
ð3Þ
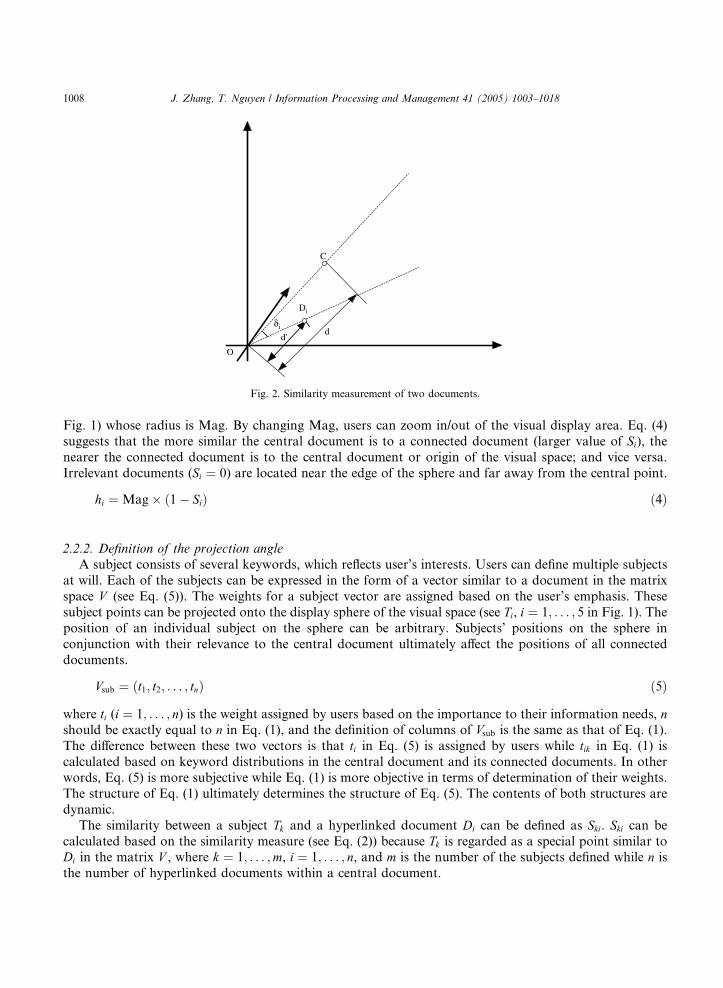
In Eq. (2), di is the angle formed by the central document C and the connected document Di against the
origin in the matrix space V , and a is a constant used to control the extent to which the distance strengthimpacts on the similarity measure. The constant a has a value between 0 and 1. Research shows that whenthe constant a ranges from 0.8 to 0.99, the similarity value is very sensitive (Zhang & Rasmussen, 2001). Inour case, the constant a is set to 0.97. The variable d is the distance from the origin of the matrix space V tothe specified document C and d 0 is the distance from the origin of the space V to a measured connecteddocument Di. Because 0 < ajd�d 0 j
6 1 (0 < a6 1) and 06 cosðdiÞ6 1 (06 di 6 p=2), therefore we have06 Si 6 1. For simplicity we use a three-dimensional matrix space V to illustrate the relationships of thedefined variables and parameters in Eq. (2) (see Fig. 2).
This similarity Si can be converted to the projection distance hi, one of the two projection parameters fora projected document in the visual space in Eq. (4). Mag is a positive constant that can be used to control
the visual display area size. Since the valid value of Si always falls between 0 and 1, this ensures that hi iseither positive or zero. From Eq. (4), all connected documents will be scattered within a display sphere (see
O
δi d
C
Di
d'
Fig. 2. Similarity measurement of two documents.
1008 J. Zhang, T. Nguyen / Information Processing and Management 41 (2005) 1003–1018
Fig. 1) whose radius is Mag. By changing Mag, users can zoom in/out of the visual display area. Eq. (4)
suggests that the more similar the central document is to a connected document (larger value of Si), thenearer the connected document is to the central document or origin of the visual space; and vice versa.
Irrelevant documents (Si ¼ 0) are located near the edge of the sphere and far away from the central point.
hi ¼Mag� ð1� SiÞ ð4Þ
2.2.2. Definition of the projection angle
A subject consists of several keywords, which reflects user’s interests. Users can define multiple subjects
at will. Each of the subjects can be expressed in the form of a vector similar to a document in the matrix
space V (see Eq. (5)). The weights for a subject vector are assigned based on the user’s emphasis. These
subject points can be projected onto the display sphere of the visual space (see Ti, i ¼ 1; . . . ; 5 in Fig. 1). Theposition of an individual subject on the sphere can be arbitrary. Subjects’ positions on the sphere in
conjunction with their relevance to the central document ultimately affect the positions of all connected
documents.
Vsub ¼ ðt1; t2; . . . ; tnÞ ð5Þ
where ti (i ¼ 1; . . . ; n) is the weight assigned by users based on the importance to their information needs, nshould be exactly equal to n in Eq. (1), and the definition of columns of Vsub is the same as that of Eq. (1).The difference between these two vectors is that ti in Eq. (5) is assigned by users while tik in Eq. (1) iscalculated based on keyword distributions in the central document and its connected documents. In other
words, Eq. (5) is more subjective while Eq. (1) is more objective in terms of determination of their weights.
The structure of Eq. (1) ultimately determines the structure of Eq. (5). The contents of both structures are
dynamic.
The similarity between a subject Tk and a hyperlinked document Di can be defined as Ski. Ski can becalculated based on the similarity measure (see Eq. (2)) because Tk is regarded as a special point similar toDi in the matrix V , where k ¼ 1; . . . ;m, i ¼ 1; . . . ; n, and m is the number of the subjects defined while n isthe number of hyperlinked documents within a central document.
J. Zhang, T. Nguyen / Information Processing and Management 41 (2005) 1003–1018 1009
The angle of subject Tk and the X -axis against the origin of the visual space is ak. It is apparent that the
parameter ak is always available after subject Tk is positioned on the display sphere.After the subjects are positioned on the sphere, the projection angle of a projected document Di is de-
fined as
bi ¼
Pmk¼1ðak � SkiÞPm
k¼1 Ski;
Xmk¼1
Ski 6¼ 0
0;Pm
k¼1 Ski ¼ 0
8><>: ð6Þ
If a connected document Di is irrelevant to any of the selected subjects (Pm
k¼1 Ski ¼ 0), then the angle bi is
defined as zero to avoid the meaningless bi from Eq. (6). It is obvious that connected documents that are
not relevant to any of the defined subjects will be projected onto the X -axis. Their distances, which aredetermined by the relevance between them and the central document to the origin, may vary.According to Eqs. (4) and (6), both the projection distance and projection angle of a connected docu-
ment to the central document in the visual space are clearly defined, and therefore any of the connected
documents can be accurately projected onto the visual space.
It is worth noting out that the WebStar model does not have to operate under a multiple-subject
environment due to the constant presence of the central point in the visual space. The model uses a central
focus point which is always available and then projects its outgoing documents. The central point is always
available. The central point plus one single subject point can determine the position of any connected
documents in the visual space (see both Eqs. (4) and (6)). It is this unique characteristic that distinguishesthe WebStar model from the other similarity-ratio-based visualization models.
2.3. Impact of a moving subject point on the document distribution in the visual space
In this model, users can activate one of the defined subjects on the display sphere and make it rotate
evenly around the display sphere. Since a subject affects the projection angle of a connected document in the
visual space (Eq. (6)), a subject rotation would have an impact on the visual distribution of projected
documents. This distribution change can be used to judge whether connected documents are relevant to a
moving subject. Now let us address the impact of a moving subject point on each connected documentwithin the visual space.
Given the moving speed of a selected subject Tr (its initial angle in the visual space is ar, 16 r6m, m isthe number of defined subjects) is h degrees per second.Dynamic angle of a document Di is defined as
b0i ¼
Pmk¼1;k 6¼rðak � SkiÞ þ ðh � t þ h0Þ � SriPm
k¼1 Skið7Þ
where t is a time variable and h0 is the initial angle of Di in the visual space.
From Eq. (7), we have
db0i
dt¼ h � SriPm
k¼1 Skið8Þ
Eq. (8) indicates that the rotation speed of a connected document angle, caused by a moving subject, is
linear. In other words, all affected documents will move evenly around the central point of the visual space.
Different documents may correspond to different moving speeds and orbits. Velocity of a connected doc-
ument is affected primarily by the similarity (or relevance) between the moving subject and that document.Since the relevance between the central document and a connected document is a constant, the orbit of
the moving document should be a circle and its central point is the origin of the visual space.
1010 J. Zhang, T. Nguyen / Information Processing and Management 41 (2005) 1003–1018
According to Eq. (7), after the selected subject point Tr moves 2p, a document rotates the followingdegrees from its original position:
bi ¼2p � SriPm
k¼1 Skið9Þ
It is clear that when there is no relevance between a moving subject and a connected document (or the
similarity between them is zero), that document stays in the same position as the subject moves. If a
document is only relevant to the specified moving subject and it is not relevant to other defined subjects,then it has the same moving speed as the moving subject and it is always located on the line formed by the
central point and the moving subject. Eq. (7) suggests that the more relevant a connected document to a
moving subject point, the faster the document moves; and vice versa. The maximum speed of a relevant
document is same as the moving subject.
It is evident that the relevance of a document to other subjects not only affects its initial position in the
visual space but also affects its moving speed because the sum of all similarities between the document and
all subjects is the divisor in Eq. (7). This divisorPm
k¼1 Ski in conjunction with the similarity between thedocument and the moving subject (Sri) as well as the subject moving speed h ultimately determines themoving speed of a connected document in the visual space.
2.4. Ambiguity analysis
Projection ambiguity in a visual space refers to the phenomena that multiple objects (documents, in this
case) in a high-dimensional space are scattered onto one point in a low-dimensional space. Projection
ambiguity is inevitable due to spatial dimensionality reduction. It is no exception for this model. In fact,
projection ambiguity raises two basic questions: (1) Whether objects (documents) close to each other in the
high-dimensional document matrix space are still close in the visual space after the projection. (2) Whether
projected objects close to each other in the visual space are also close to each other in the high-dimensionaldocument matrix space V .The answer to the first question is straightforward and explicit. Eqs. (4) and (6) imply that as long as
objects are located together in the matrix space V , they would be clustered together in the visual space afterprojection.
The answer to the second question is more complicated. The crux of this question is how to identify
projected points with the same position in the visual space but that have quite different locations in the
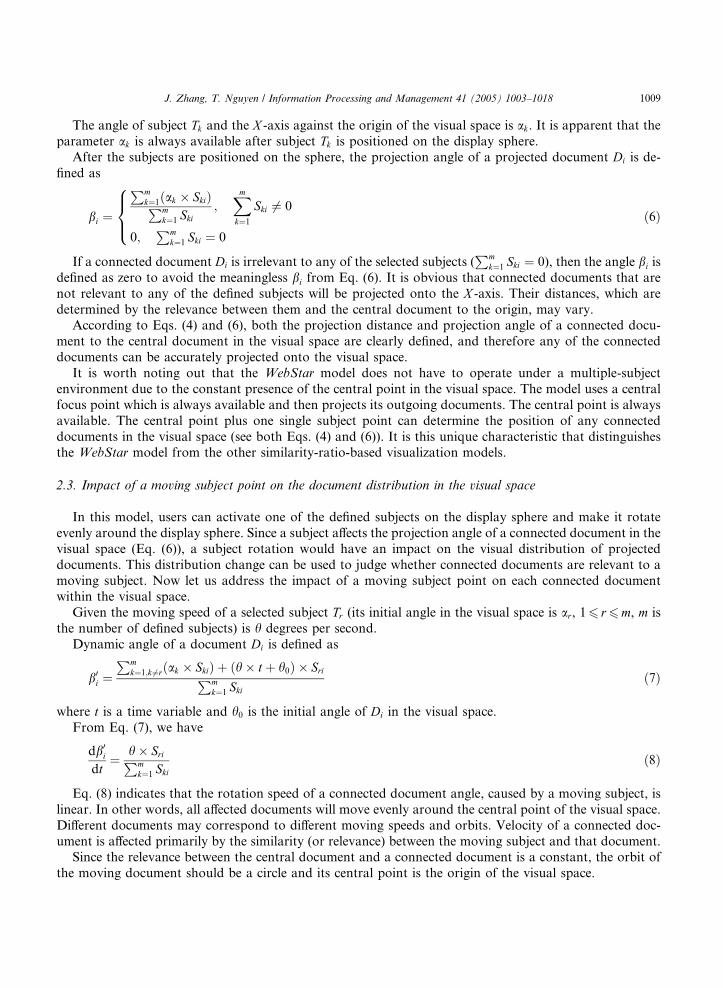
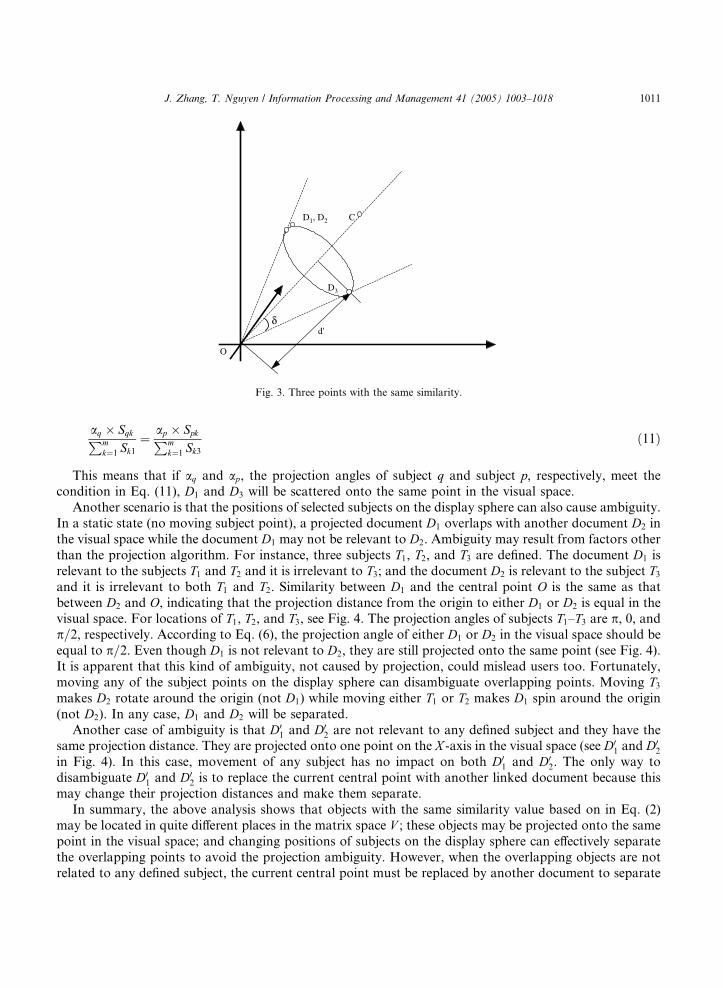
matrix space V . Observe that, based on the similarity algorithm (Eq. (2)), points on a circle (see Fig. 3) havethe same similarity value even though they may be far away from each other in terms of the distance in thematrix space V . To illustrate this, suppose there is in a three-dimensional matrix space V , C is the centralpoint, and documents D1, D2, and D3 on a circle have the same similarity value in terms of the definedsimilarity measure (Eq. (2)) because these three points have the same angle d and the same distance d 0 (see
Fig. 3). It is clear that points D1 and D2 are very close while D3 is far away from both of them in the matrixspace V . However, the three points have the same projection distance value via the conversion procedure(Eqs. (3) and (4)).
According to Eq. (6), if the points D1 and D3 have the same projection angle, the following equationshould be satisfied:
Pmk¼1ðak � Sk1ÞPmk¼1 Sk1
¼Pm
k¼1ðak � Sk3ÞPmk¼1 Sk3
ð10Þ
In this equation, both Sk1 and Sk3 are constants if subjects are selected and ak is a variable. For instance,if D1 and D3 are only relevant to subject q and subject p (16 q, p6m, and p 6¼ q), respectively, then we have
O
D1, D2 C
D3
δ d'
Fig. 3. Three points with the same similarity.
J. Zhang, T. Nguyen / Information Processing and Management 41 (2005) 1003–1018 1011
aq � SqkPmk¼1 Sk1
¼ ap � SpkPmk¼1 Sk3
ð11Þ
This means that if aq and ap, the projection angles of subject q and subject p, respectively, meet thecondition in Eq. (11), D1 and D3 will be scattered onto the same point in the visual space.Another scenario is that the positions of selected subjects on the display sphere can also cause ambiguity.
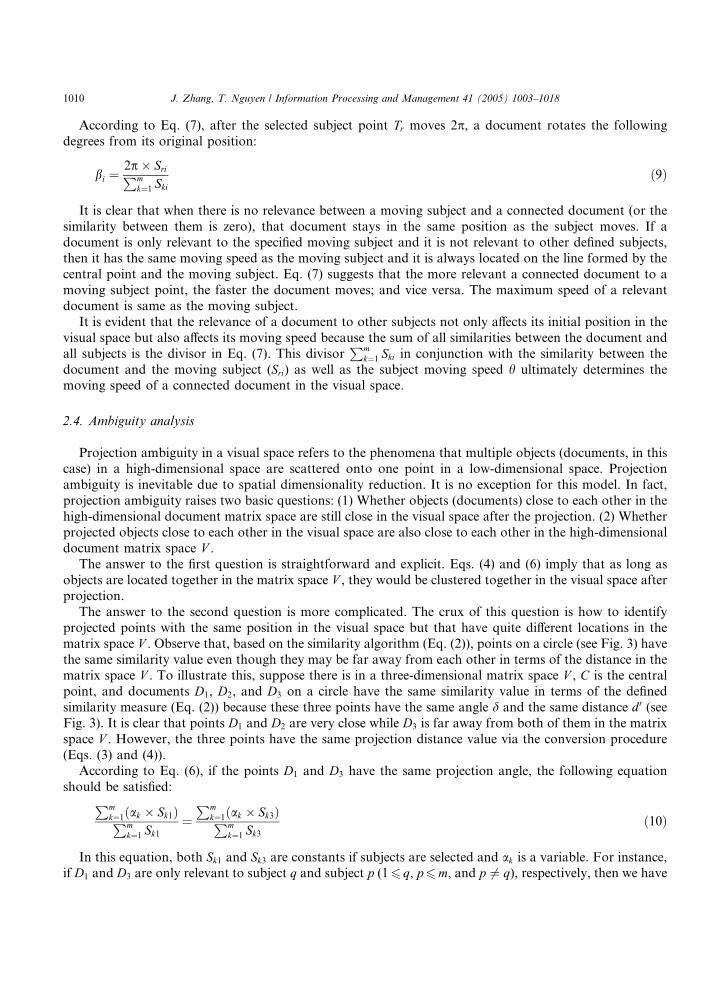
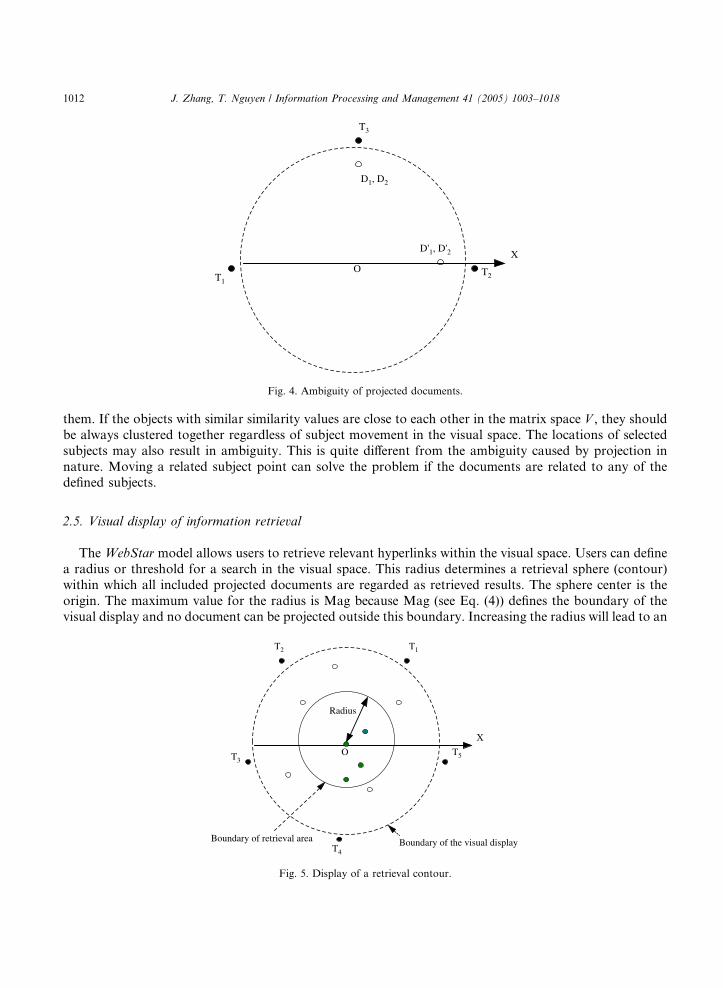
In a static state (no moving subject point), a projected document D1 overlaps with another document D2 inthe visual space while the document D1 may not be relevant to D2. Ambiguity may result from factors otherthan the projection algorithm. For instance, three subjects T1, T2, and T3 are defined. The document D1 isrelevant to the subjects T1 and T2 and it is irrelevant to T3; and the document D2 is relevant to the subject T3and it is irrelevant to both T1 and T2. Similarity between D1 and the central point O is the same as that
between D2 and O, indicating that the projection distance from the origin to either D1 or D2 is equal in thevisual space. For locations of T1, T2, and T3, see Fig. 4. The projection angles of subjects T1–T3 are p, 0, andp=2, respectively. According to Eq. (6), the projection angle of either D1 or D2 in the visual space should beequal to p=2. Even though D1 is not relevant to D2, they are still projected onto the same point (see Fig. 4).It is apparent that this kind of ambiguity, not caused by projection, could mislead users too. Fortunately,
moving any of the subject points on the display sphere can disambiguate overlapping points. Moving T3makes D2 rotate around the origin (not D1) while moving either T1 or T2 makes D1 spin around the origin(not D2). In any case, D1 and D2 will be separated.Another case of ambiguity is that D0
1 and D02 are not relevant to any defined subject and they have the
same projection distance. They are projected onto one point on the X -axis in the visual space (see D01 and D
02
in Fig. 4). In this case, movement of any subject has no impact on both D01 and D0
2. The only way to
disambiguate D01 and D0
2 is to replace the current central point with another linked document because this
may change their projection distances and make them separate.
In summary, the above analysis shows that objects with the same similarity value based on in Eq. (2)
may be located in quite different places in the matrix space V ; these objects may be projected onto the samepoint in the visual space; and changing positions of subjects on the display sphere can effectively separate
the overlapping points to avoid the projection ambiguity. However, when the overlapping objects are notrelated to any defined subject, the current central point must be replaced by another document to separate
X
T3
T1T2
O
D1, D2
D'1, D'2
Fig. 4. Ambiguity of projected documents.
1012 J. Zhang, T. Nguyen / Information Processing and Management 41 (2005) 1003–1018
them. If the objects with similar similarity values are close to each other in the matrix space V , they shouldbe always clustered together regardless of subject movement in the visual space. The locations of selected
subjects may also result in ambiguity. This is quite different from the ambiguity caused by projection in
nature. Moving a related subject point can solve the problem if the documents are related to any of thedefined subjects.
2.5. Visual display of information retrieval
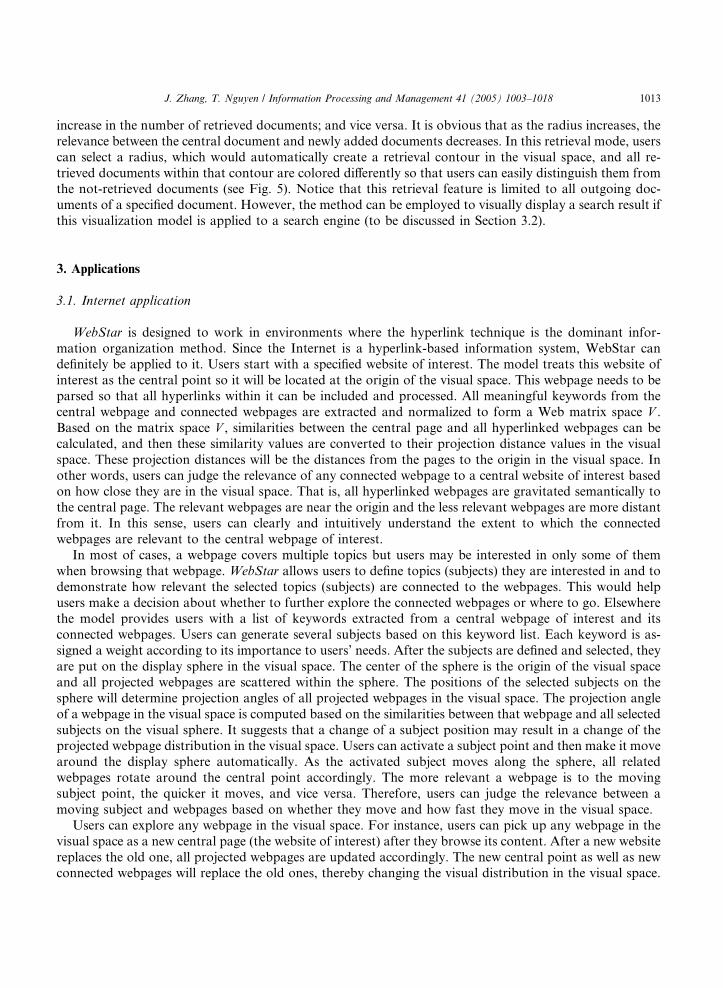
TheWebStar model allows users to retrieve relevant hyperlinks within the visual space. Users can define
a radius or threshold for a search in the visual space. This radius determines a retrieval sphere (contour)
within which all included projected documents are regarded as retrieved results. The sphere center is the
origin. The maximum value for the radius is Mag because Mag (see Eq. (4)) defines the boundary of thevisual display and no document can be projected outside this boundary. Increasing the radius will lead to an
O
X
T1T2
T3
T4
T5
Radius
Boundary of the visual displayBoundary of retrieval area
Fig. 5. Display of a retrieval contour.
J. Zhang, T. Nguyen / Information Processing and Management 41 (2005) 1003–1018 1013
increase in the number of retrieved documents; and vice versa. It is obvious that as the radius increases, the
relevance between the central document and newly added documents decreases. In this retrieval mode, users
can select a radius, which would automatically create a retrieval contour in the visual space, and all re-
trieved documents within that contour are colored differently so that users can easily distinguish them fromthe not-retrieved documents (see Fig. 5). Notice that this retrieval feature is limited to all outgoing doc-
uments of a specified document. However, the method can be employed to visually display a search result if
this visualization model is applied to a search engine (to be discussed in Section 3.2).
3. Applications
3.1. Internet application
WebStar is designed to work in environments where the hyperlink technique is the dominant infor-
mation organization method. Since the Internet is a hyperlink-based information system, WebStar candefinitely be applied to it. Users start with a specified website of interest. The model treats this website of
interest as the central point so it will be located at the origin of the visual space. This webpage needs to be
parsed so that all hyperlinks within it can be included and processed. All meaningful keywords from the
central webpage and connected webpages are extracted and normalized to form a Web matrix space V .Based on the matrix space V , similarities between the central page and all hyperlinked webpages can becalculated, and then these similarity values are converted to their projection distance values in the visual
space. These projection distances will be the distances from the pages to the origin in the visual space. In
other words, users can judge the relevance of any connected webpage to a central website of interest basedon how close they are in the visual space. That is, all hyperlinked webpages are gravitated semantically to
the central page. The relevant webpages are near the origin and the less relevant webpages are more distant
from it. In this sense, users can clearly and intuitively understand the extent to which the connected
webpages are relevant to the central webpage of interest.
In most of cases, a webpage covers multiple topics but users may be interested in only some of them
when browsing that webpage.WebStar allows users to define topics (subjects) they are interested in and to
demonstrate how relevant the selected topics (subjects) are connected to the webpages. This would help
users make a decision about whether to further explore the connected webpages or where to go. Elsewherethe model provides users with a list of keywords extracted from a central webpage of interest and its
connected webpages. Users can generate several subjects based on this keyword list. Each keyword is as-
signed a weight according to its importance to users’ needs. After the subjects are defined and selected, they
are put on the display sphere in the visual space. The center of the sphere is the origin of the visual space
and all projected webpages are scattered within the sphere. The positions of the selected subjects on the
sphere will determine projection angles of all projected webpages in the visual space. The projection angle
of a webpage in the visual space is computed based on the similarities between that webpage and all selected
subjects on the visual sphere. It suggests that a change of a subject position may result in a change of theprojected webpage distribution in the visual space. Users can activate a subject point and then make it move
around the display sphere automatically. As the activated subject moves along the sphere, all related
webpages rotate around the central point accordingly. The more relevant a webpage is to the moving
subject point, the quicker it moves, and vice versa. Therefore, users can judge the relevance between a
moving subject and webpages based on whether they move and how fast they move in the visual space.
Users can explore any webpage in the visual space. For instance, users can pick up any webpage in the
visual space as a new central page (the website of interest) after they browse its content. After a new website
replaces the old one, all projected webpages are updated accordingly. The new central point as well as newconnected webpages will replace the old ones, thereby changing the visual distribution in the visual space.
1014 J. Zhang, T. Nguyen / Information Processing and Management 41 (2005) 1003–1018
In the retrieval mode, users can select a meaningful retrieval contour to narrow down or expand the
results of a search. After the contour is generated, all projected webpages are divided into two groups: those
retrieved and those not retrieved. In addition, the number of the retrieved webpages and their titles can be
presented to users. The icon color of retrieved webpages changes so that users can easily identify them in thevisual space.
3.2. Other potential applications
Basically, the model is designed to visualize link structures. It suggests that if information is organized
using a link-structural or a similar method, then the WebStar model can be applied to it. For instance, it
can visualize a hypertext-based help system where topics are hyperlinked. This kind of help system is widely
implemented in applications or hypertext document authoring systems. In these cases, the WebStar model
would offer users a visual environment to explore a help information space.
WebStar can be employed for bibliographic citation analysis in a bibliographic document database asfollows: Consider a scenario where there are references in a standard publication and each reference acts as
a physical link that can be directed to a cited paper. If the model picks up a publication as the central point
of the visual space and users define several subjects of interest and project them on the display sphere, then
all cited papers can be visually presented in the visual space. It will offer a unique way for users to do a
visual bibliographic citation analysis. Visual display of cited papers in the visual space shows which cited
papers are most relevant to the citing paper, which cited papers are semantically clustered together, and
which cited papers are relevant to a defined subject. In addition, the model enables users to retrieve the
most relevant cited papers and to discover new related topics by changing the central point within the visualspace.
Another potential application is that the model can be used to visualize results from a search engine.
When users submit a query to a search engine, it returns a linear results list. If we treat that query as the
central point in the visual space, then all returned webpages can be regarded as ‘‘connected’’ webpages.
Notice that although there are no physical hyperlinks between that query and returned webpages, there are
definitely semantic connections between them. The semantic strength between a query and a returned
webpage can be treated as a ‘‘virtual’’ or invisible link between them. It is the invisible semantic connections
that we can use to calculate their projection distances for projection. Similarly, users can define a group ofsubjects and position them on the display sphere as described in the previous discussion, which are em-
ployed to generate the projection angles for the returned webpages. So, any returned webpage can have the
two parameters: projection distance and projection angle. This implies that a returned webpage can be
effectively projected onto the visual space like a hyperlinked webpage. One concerns of this application is
how to control the number of returned webpages visualized in the visual space. The number of the returned
hits for a search may reach hundreds or even more. However, it is not necessary to visualize all of them in
the visual space. Research findings have shown that most searchers only browse one or two pages of a result
list, in fact, 90% of search engine traffic comes from the first 30 hits retrieved (http://www.imarketing-masters.com/graphs.htm). Therefore, the model can select the first 20–50 returned webpages and display
them in the visual space.
4. Discussion
4.1. Display of multiple levels of hyperlinks in the visual space
A hyperlink structure can be viewed as a hierarchy if a specified document is regarded as a root of thatstructure and all connected documents as its children nodes. That is, all connected documents are siblings at
J. Zhang, T. Nguyen / Information Processing and Management 41 (2005) 1003–1018 1015
the first level of the hierarchy. Similarly, all their hyperlinks (of the first level) can be positioned at the
second level of the hierarchy and each of them can be expanded in the same way, and so on. It is apparent
that this proposed visualization model displays only one level of a hyperlink hierarchy within the visual
space. If this model expands to visualize multiple levels of a hyperlink hierarchy, it would offer richer anddeeper information for users. However, it may raise a new question: How does one effectively display
numerous documents within a limited display area after the multiple levels of a hyperlink hierarchy are
visually presented? It is quite clear that as the number of presented hierarchy levels increases, the number of
all visualized documents increases dramatically. Another concern is that this expansion is at expense of the
dynamic subject control feature. If multiple hyperlink levels are applied, hyperlinked documents have to be
connected to their parent node. The relevance will be calculated based on a document and its parent page
rather than the root node (the center) of the hierarchy. If that is the case, it is impossible to compute the
projection angle parameter for that document.
4.2. Automatically extracting keywords for the subject group
In this model, users are able to yield a group of subjects based on their interests and use them to analyze
linked documents. It requires human intervention. If the model could automatically generate a group of
subjects based on keyword distributions within a central page and its connected documents, it would de-
crease human intervention and improve system use convenience. For this to happen, the model has to add a
new algorithm to automatically generate subjects. This group of subjects will be put on the display sphere
by default after the visual distribution is generated. In the meantime, the model still preserves the feature
that users can customize these subjects via revising contents of subjects or create new subjects.
4.3. An option for subject content
Usually, there are a variety of information media types within a document, for instance, textual
information, images, audio, video, animation, and so on. A document may be associated with multiple
information media types. If these types are employed as the subjects and put on the display sphere, users
can easily understand the connected documents from the perspective of information media type. Notice
that in this case keywords (information media types), used to form a subject, are no longer dynamic and it is
relatively easy for the model to obtain the information automatically by parsing related documents.
4.4. Multiple subject movement
In the present model, only one subject point is allowed to rotate around the center. If multiple subjects
are allowed to orbit around the center, then the impact of multiple subjects on the document distributioncan be observed simultaneously. We even can set two opposite moving directions for two moving subject
points: one clockwise and the other counterclockwise. Objects related to one subject are easily compared
with those related to the other subject because their moving directions are different in the visual space.
4.5. Effective display of projected objects in the visual space
In the original VIBE system, the projected objects in the system visual space are documents in the
system. In this case, the VIBE system as a visualization tool cannot visualize all documents in a database
because overwhelming display of an enormous amount of documents in a limited visual space would make
presented documents indistinguishable in the visual space. Therefore, the system has to filter documents or
narrow down projected documents to a relatively smaller topic to maintain a reasonable size of presenteddocuments in the visual space. However, in the WebStar system, projected objects are citing hyperlinks
1016 J. Zhang, T. Nguyen / Information Processing and Management 41 (2005) 1003–1018
within a document (For instance, a website). These links are designed to connect relevant documents rather
than to limit websites. Notice that the number of citing hyperlinks within a document is very small com-
pared to the number of all documents in a database. Citing hyperlinks within a document is manageable in
the WebStar space.
4.6. Usability studies for this model
In this paper, our emphasis is the theoretical proof of the WebStar model. Theoretical proof of a model
is fundamental and essential. It is crucial for a system’s development. Without a solid theoretical foun-dation, potential loopholes would lead to not only system malfunction but also system failure. We
understand that theoretical soundness of a model does not mean that it can assure a system developed from
that model can achieve good usability performance. There are many other factors that would affect system
usability performance such as system interface design. This issue is to be addressed in another paper.
5. Conclusions
In this paper, an information visualization model is introduced to visualize hyperlink-based information
systems. WebStar is designed to visualize hyperlink structures. All projected documents are within a two-
dimensional visual space. The position of a projected document in the visual space is determined by both
the similarity between the document and a specified central document and the similarities between that
document and a group of selected subjects. The specified central point is dynamic and it can be replaced byany hyperlinked document. Replacement of the central point can lead to change of the visual distribution in
the visual space. Changing to other subject contents also can cause a change in the visual distribution.
Relocation of subject positions on the display contour in the visual space can change the visual distribution.
However, change of a central point results in change of projected documents while change of either subject
contents or subject positions on the display sphere just results in relocation of projected documents in the
visual space.
The model provides users with an interactive retrieval option. In the retrieval mode, users can define a
retrieval sphere at will within which documents are regarded as retrieved results. By changing the radius ofthe sphere, users can control retrieved results.
Like other information visualization models, this projection algorithm can cause ambiguity within the
visual space. There are two kinds of the projection ambiguities: one from semantic relationships of pro-
jected objects in a database and the other from positions of selected subjects on the display sphere. Analysis
shows that moving a related subject on the display sphere can effectively disambiguate overlapping pro-
jected points in the visual space.
The visualization model has potential to be applied to the Internet, hypertext-based help file systems,
hypertext document authoring systems, and bibliographic citation analysis as well. The model can expandto visualize a returned hits list from an Internet search engine.
The uniqueness of this visualization model is not only the use of spatial features of projected objects but
also their movements and speeds to demonstrate relevance among objects. In the visual space, locations of
objects and distances between objects reflect their internal semantic connections. In addition, movement
and speed of projected objects within the visual space adds a new dimension to illustrate semantic rela-
tionships between projected objects and specified subjects.
Future research directions include, but not are limited to, the display of multiple levels of hyperlinks in
the visual space, automatic extraction of keywords for the subject group, other alternatives for subjectgroup contents, and usability studies.
J. Zhang, T. Nguyen / Information Processing and Management 41 (2005) 1003–1018 1017
References
Benford, S., Greenhalgh, C., Snowdon, D., Ingram, R., & Knox, I. (1995). VR-VIBE: A virtual environment for co-operative
information retrieval. In Eurographics 95 (pp. 123–134).
Berghel, H., Berleant, D., Foy, T., & McGuire, M. (1999). Cyberbrowsing: Information customization on the web. Journal of the
American Society for Information Science, 50(6), 505–513.
Bernstein, M. (2002). Storyspace 1. In Proceedings of the 13th ACM conference on hypertext and hypermedia (pp. 172–181). Maryland:
ACM.
Churchill, E. F., Snowdon, D., Benford, S., & Dhanda, P. (1997). Using VR-VIBE; browsing and searching for documents in 3D-
space. In Proceedings of HCI international’97 7th international conference on human–computer interaction (pp. 857–860). San
Francisco: ACM.
Ding, Y., Chowdhury, G. G., Foo, S., & Qian, W. (2000). Bibliometric information retrieval system (BIRS): A Web search interface
utilizing bibliometric research results. Journal of the American Society for Information Science, 51(13), 1190–1204.
Durand, D., & Kahn, P. (1998). MAPA: A system for inducing and visualizing hierarchy in websites. In Proceedings of the ninth ACM
conference on hypertext and hypermedia (pp. 66–76). Pittsburgh: ACM.
Eick, S. G. (2001). Visualizing online activity. Communication of ACM, 44(8), 45–50.
Fraser, L., & Locatis, C. (2001). Effects of link annotations on search performance in layered and unlayered hierarchically organized
information spaces. Journal of the American Society for Information Science, 52(14), 1255–1261.
Havre, S., Hetzler, E., Perrine, K., Jurrus, E., & Miller, N. (2001). Interactive visualization of multiple query results. In Proceedings of
the IEEE symposium on information visualization (InfoVis’01) (pp. 105–112). California: IEEE CS Press.
Hemmje, M. (1995). LyberWorld: A 3D graphical user interface for fulltext retrieval. In Proceedings of conference companion on human
factors in computing systems (pp. 417–418). Denver, CO: ACM.
Hemmje, M., Kunkel, C., & Willett, A. (1994). LyberWorld: A visualization user interface supporting full text retrieval. In Proceedings
of the seventeenth annual international ACM SIGIR conference on research and development in information retrieval (pp. 249–258).
Dublin: ACM.
Hightower, R. R., Ring, L. T., Helfman, J. I., Bederson, B. B., & Hollan, J. D. (1998). Graphical multiscale Web histories: A study of
PadPrints. In Proceedings of the ninth ACM conference on hypertext and hypermedia (pp. 58–65). Pittsburgh: ACM.
Hochheiser, H., & Shneiderman, B. (2001). Using interactive visualizations of WWW log data to characterize access pattern and
inform site design. Journal of the American Society for Information Science and Technology, 52(4), 331–343.
Keim, D. A. (2001). Visual exploration of large data sets. Communication of ACM, 44(8), 39–44.
Kleiberg, E., van de Wetering, H., & van Wijk, J. J. (2001). Botanical visualization of huge hierarchies. In Proceedings of the IEEE
symposium on information visualization (InfoVis’01) (pp. 87–94). California: IEEE CS Press.
Korfhage, R. R. (1997). Information storage and retrieval. New York: Wiley Computer Pub.
Marchionini, G., & Shneiderman, B. (1993). Finding facts vs. browsing knowledge in hypertext systems. In B. Shneiderman (Ed.),
Sparks of innovation in human–computer interaction (pp. 103–121). Norwood, NJ: Ablex Publishing.
Morse, E. L., Lewis, M., & Olsen, K. A. (2000). Evaluating visualizations: Using a taxonomic guide. International Journal of Human–
Computer Studies, 53(5), 637–662.
Morse, E. L., Lewis, M., & Olsen, K. A. (2002). Testing visual information retrieval methodologies case study: Comparative analysis of
textual, icon, graphical, and ‘spring’ displays. Journal of the American Society for Information Science, 53(1), 28–40.
Munzner, T. (1998). Exploring large graphs in 3D hyperbolic space. IEEE Computer Graphics and Applications, 18(4), 18–23.
Noyons, C. M. E., Buter, K. R., & van Raan, F. J. A. (2000). The Role of Europe in World-Wide Science and Technology: Monitoring
and Evaluation in a Context of Global Competition. Available: http://www.cwts.nl/cwts/publications_2002.pdf.
Nuchprayoon, A., & Korfhage, R. R. (1994). GUIDO: A visual tool for retrieving documents. In Proceedings 1994 IEEE computer
society workshop on visual languages (pp. 64–71). St. Louis, MO: IEEE.
Olsen, K. A., & Korfhage, R. R. (1994). Desktop visualization. In Proceedings 1994 IEEE symposium on visual languages (pp. 239–
244). St. Louis, MO: IEEE.
Olsen, K. A., Korfhage, R. R., Sochats, K. M., Spring, M. B., & Williams, J. G. (1993). Visualization of a document collection: The
VIBE system. Information Processing & Management, 29(1), 69–81.
Robert, L., & Lecolinet, E. (1998). Browsing hyperdocuments with multiple focus+ content view. In Proceedings of the ninth ACM
conference on hypertext and hypermedia (pp. 293–294). Pittsburgh: ACM.
Rorvig, M., & Fitzpatrick, S. (2000). Shape recovery: A visual method for evaluation of information retrieval experiments. Journal of
the American Society for Information Science, 51(13), 1205–1210.
Small, H. (1999). Visualizing science by citation mapping. Journal of the American Society for Information Science, 50(9), 799–813.
Spoerri, A. (1993). InfoCrystal: A visual tool for information retrieval interface. In Proceedings of the second international conference on
Information and knowledge management (pp. 11–20). Washington D.C.: ACM.
van Ham, F., & van Wijk, J. J. (2002). Beamtrees: Compact visualization of large hierarchies. In Proceedings of the IEEE symposium on
information visualization (InfoVis’02) (pp. 93–100). Massachusetts: IEEE CS Press.
1018 J. Zhang, T. Nguyen / Information Processing and Management 41 (2005) 1003–1018
White, H. D. (2003). Patherfinder networks and author cocitation analysis: A remapping of paradigmatic information scientists.
Journal of the American Society for Information Science, 54(5), 423–434.
Wise, J. A. (1999). The ecological approach to textual visualization. Journal of the American Society for Information Science, 50(13),
1224–1233.
Yang, J., Ward, M. O., & Rundensteiner, E. A. (2002). InterRing: An interactive tool for visually navigating and manipulating
hierarchical structures. In Proceedings of the IEEE symposium on information visualization (InfoVis’02) (pp. 77–84). Massachusetts:
IEEE CS Press.
Young, D., & Shneiderman, B. (1993). A graphical filter/flow representation of Boolean queries: A prototype implementation and
evaluation. Journal of the American Society for Information Science, 44(6), 327–339.
Zhang, J. (2001). TOFIR: A tool of facilitating information retrieval––introducing a visual retrieval model. Information Processing &
Management, 37(4), 639–657.
Zhang, J., & Korfhage, R. (1999). DARE, distance and angle retrieval environment: A tale of the two measures. Journal of the
American Society for Information Science, 50(9), 779–787.
Zhang, J., & Rasmussen, E. (2001). Developing a new similarity measure from two different perspectives. Information Processing &
Management, 37(2), 279–294.
Zhang, J., & Rasmussen, E. (2002). An experimental study on the iso-content-based angle similarity measure. Information Processing &
Management, 38(3), 325–342.
Related Documents