2005 P R O X Y S T A T E M E N T A N D A N N U A L R E P O R T Rigs that stand out DISCOVERER SPIRIT DRILLS WORLD’S DEEPEST OFFSHORE WELL

Welcome message from author
This document is posted to help you gain knowledge. Please leave a comment to let me know what you think about it! Share it to your friends and learn new things together.
Transcript
2005P R O X Y S T A T E M E N T A N D A N N U A L R E P O R T
Rigs that stand out
D I S C O V E R E R S P I R I T D R I L L S W O R L D ’ S D E E P E S T
O F F S H O R E W E L L
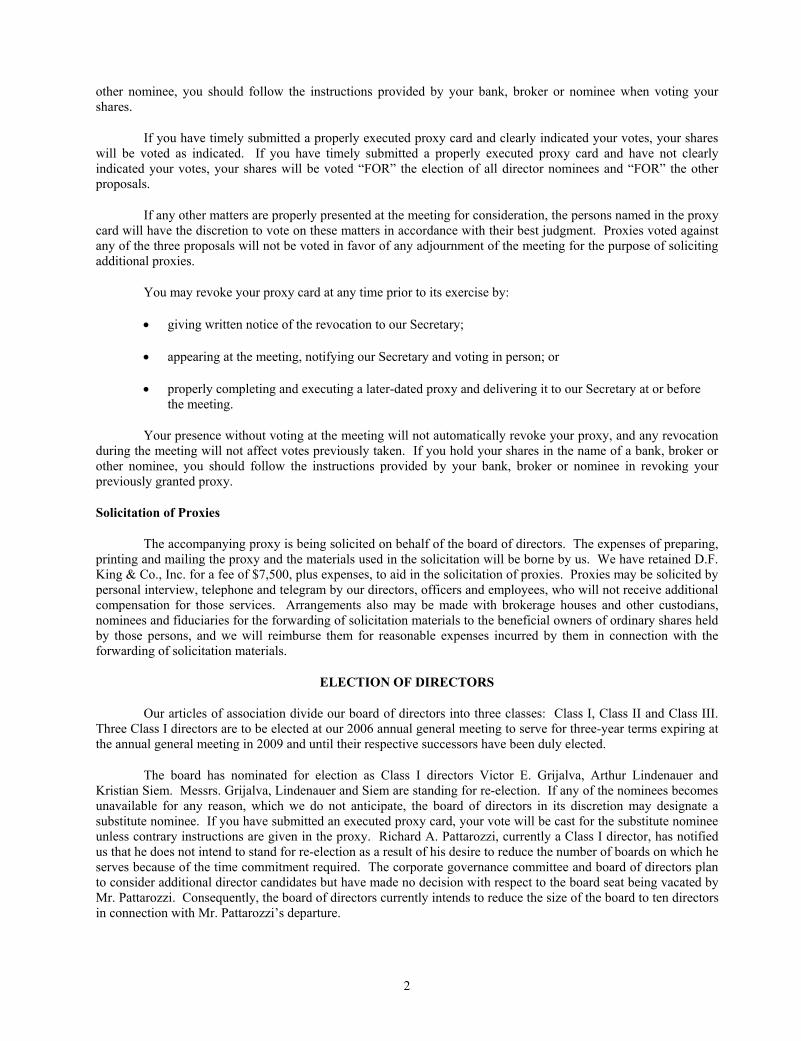
5th-Generation Deepwater Drillships
5th-Generation Deepwater Semisubmersibles Tenders
BargesOther Deepwater Drillships
Other Deepwater Semisubmersibles
Other High-Specification Semisubmersibles
Jackups
Other Semisubmersibles
1
2
2
1
E. Canada
2 2
Norway
10
UK
2
Italy 1
Caspian
Australia
7
India
Brazil
1
334
2
US Gulf of Mexico
1
Trinidad
11
2
229
SE Asia
1
222
3 21
West Africa
4
1
Korea
1
3
Egypt
1
1
2
C O N T E N T S
Shareholders’ Letter
Notice of 2006 Annual General Meeting and Proxy Statement
2005 Annual Report to Shareholders
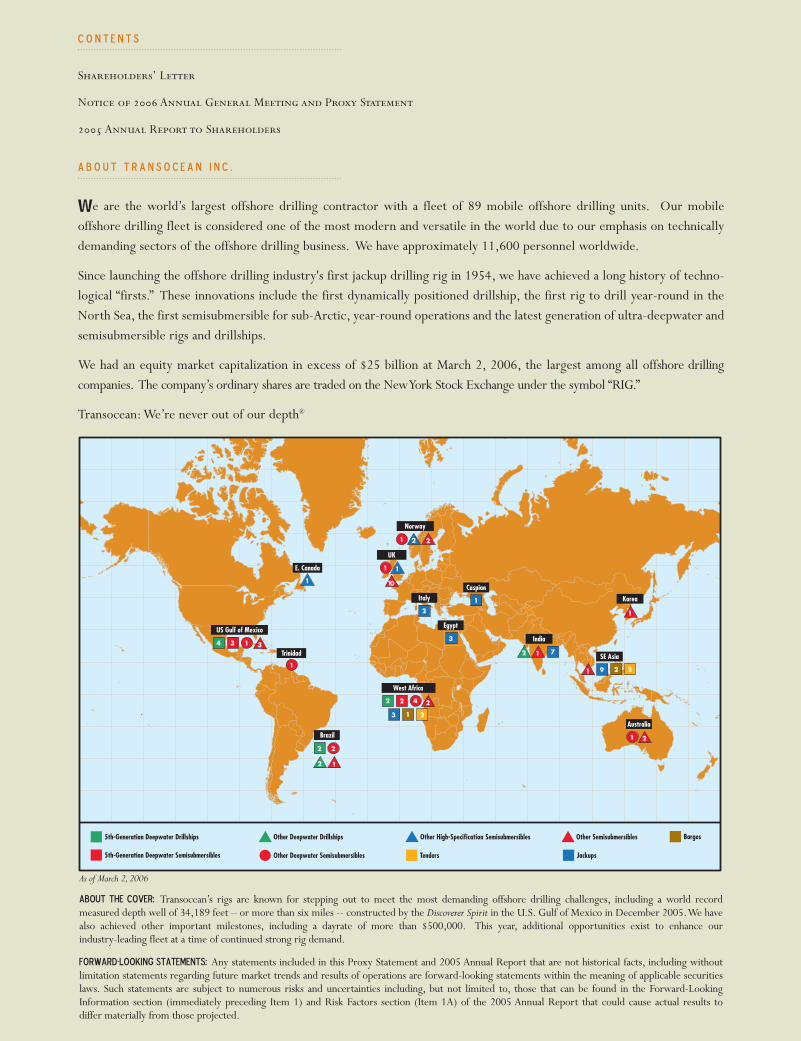
A B O U T T R A N S O C E A N I N C .
We are the world’s largest offshore drilling contractor with a fleet of 89 mobile offshore drilling units. Our mobile offshore drilling fleet is considered one of the most modern and versatile in the world due to our emphasis on technicallydemanding sectors of the offshore drilling business. We have approximately 11,600 personnel worldwide.
Since launching the offshore drilling industry's first jackup drilling rig in 1954, we have achieved a long history of techno-logical “firsts.” These innovations include the first dynamically positioned drillship, the first rig to drill year-round in theNorth Sea, the first semisubmersible for sub-Arctic, year-round operations and the latest generation of ultra-deepwater andsemisubmersible rigs and drillships.
We had an equity market capitalization in excess of $25 billion at March 2, 2006, the largest among all offshore drilling companies. The company’s ordinary shares are traded on the New York Stock Exchange under the symbol “RIG.”
Transocean: We’re never out of our depth®
As of March 2,2006
About the Cover: Transocean’s rigs are known for stepping out to meet the most demanding offshore drilling challenges, including a world record measured depth well of 34,189 feet – or more than six miles -- constructed by the Discoverer Spirit in the U.S. Gulf of Mexico in December 2005.We havealso achieved other important milestones, including a dayrate of more than $500,000. This year, additional opportunities exist to enhance our industry-leading fleet at a time of continued strong rig demand.
Forward-Looking Statements: Any statements included in this Proxy Statement and 2005 Annual Report that are not historical facts, including without limitation statements regarding future market trends and results of operations are forward-looking statements within the meaning of applicable securitieslaws. Such statements are subject to numerous risks and uncertainties including, but not limited to, those that can be found in the Forward-LookingInformation section (immediately preceding Item 1) and Risk Factors section (Item 1A) of the 2005 Annual Report that could cause actual results to differ materially from those projected.
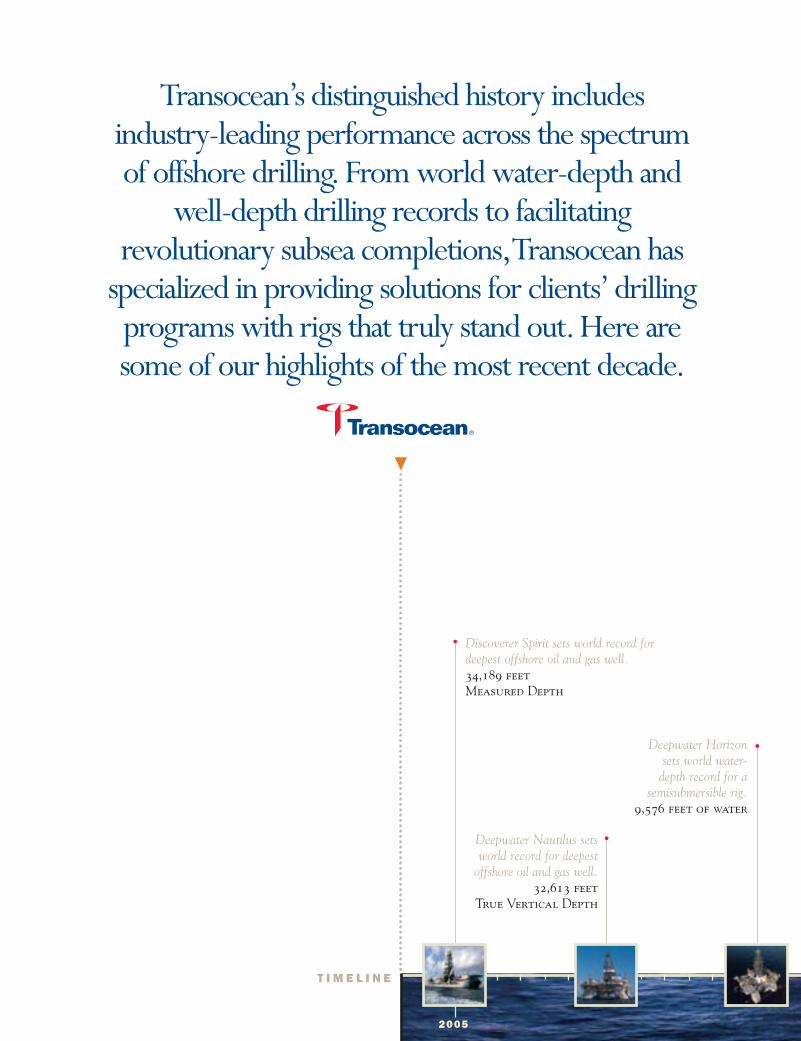
Transocean’s distinguished history includes industry-leading performance across the spectrum of offshore drilling. From world water-depth and
well-depth drilling records to facilitating revolutionary subsea completions,Transocean has
specialized in providing solutions for clients’ drillingprograms with rigs that truly stand out. Here aresome of our highlights of the most recent decade.
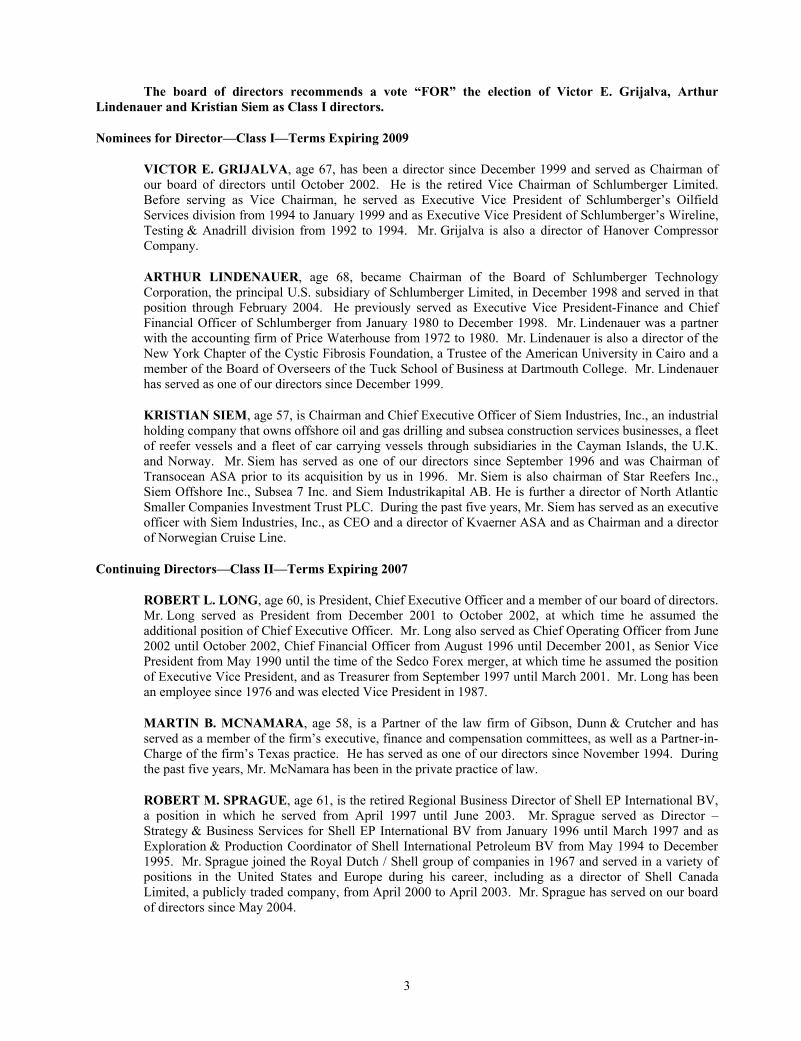
T I M E L I N E
Discoverer Spirit sets world record for deepest offshore oil and gas well.34,189 feet Measured Depth
Deepwater Horizon sets world water-
depth record for a semisubmersible rig.
9,576 feet of water
Deepwater Nautilus setsworld record for deepest
offshore oil and gas well.32,613 feet
True Vertical Depth
2005
ur anticipation of an exciting year in 2005 was certainly fulfilled. The busi-ness recovery that began to signal its presence during mid-2004 proceededwith impressive strength and resilience through 2005 and continues in early2006. The past 12 months will best be remembered as a period of excep-
tional industry fundamentals, characterized by strong customer demand for mobileoffshore drilling units, some shortages of rigs, especially among the most technicallyadvanced assets, and record dayrates. Our people worked hard to make the most ofthe opportunities that these improved conditions offered. We would be remiss if wedid not highlight the exceptional achievements in safety, operational efficiency andadvancement of the company’s technical leadership that occurred in 2005, and wethank all of our employees for the tremendous efforts and accomplishments.
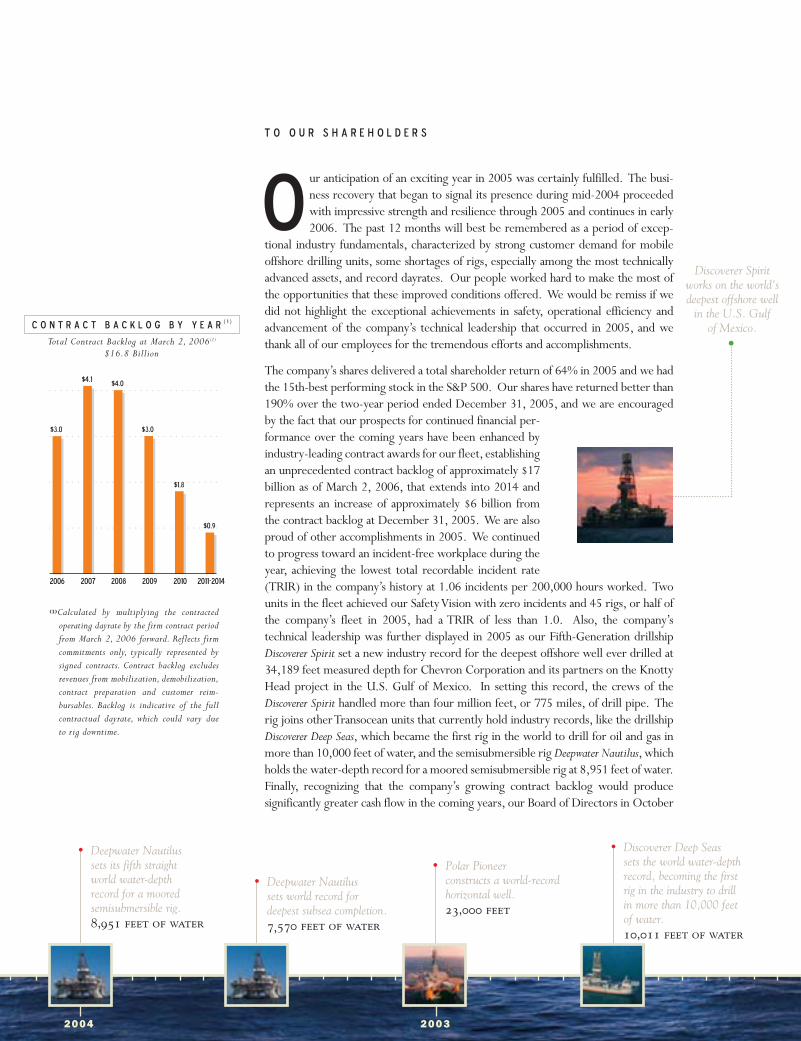
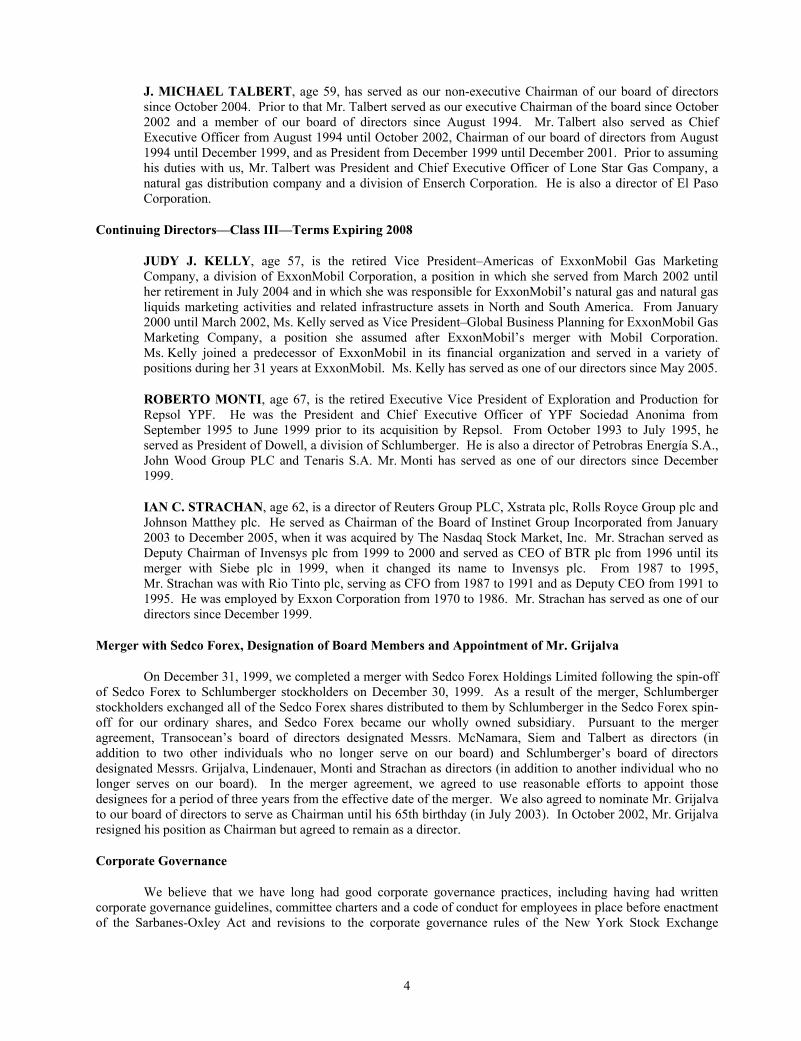
The company’s shares delivered a total shareholder return of 64% in 2005 and we hadthe 15th-best performing stock in the S&P 500. Our shares have returned better than190% over the two-year period ended December 31, 2005, and we are encouragedby the fact that our prospects for continued financial per-formance over the coming years have been enhanced byindustry-leading contract awards for our fleet, establishingan unprecedented contract backlog of approximately $17billion as of March 2, 2006, that extends into 2014 andrepresents an increase of approximately $6 billion fromthe contract backlog at December 31, 2005. We are alsoproud of other accomplishments in 2005. We continuedto progress toward an incident-free workplace during theyear, achieving the lowest total recordable incident rate(TRIR) in the company’s history at 1.06 incidents per 200,000 hours worked. Twounits in the fleet achieved our Safety Vision with zero incidents and 45 rigs, or half ofthe company’s fleet in 2005, had a TRIR of less than 1.0. Also, the company’s technical leadership was further displayed in 2005 as our Fifth-Generation drillshipDiscoverer Spirit set a new industry record for the deepest offshore well ever drilled at34,189 feet measured depth for Chevron Corporation and its partners on the KnottyHead project in the U.S. Gulf of Mexico. In setting this record, the crews of theDiscoverer Spirit handled more than four million feet, or 775 miles, of drill pipe. Therig joins other Transocean units that currently hold industry records, like the drillshipDiscoverer Deep Seas, which became the first rig in the world to drill for oil and gas inmore than 10,000 feet of water, and the semisubmersible rig Deepwater Nautilus, whichholds the water-depth record for a moored semisubmersible rig at 8,951 feet of water.Finally, recognizing that the company’s growing contract backlog would produce significantly greater cash flow in the coming years, our Board of Directors in October
2006 2007 2008 2009 2010 2011-2014
$4.1$4.0
$3.0$3.0
$1.8
$0.9
O
T o O u r S h a r e h o l d e r s
Discoverer Spirit works on the world'sdeepest offshore well
in the U.S. Gulf of Mexico.
Deepwater Nautilus sets its fifth straight world water-depth record for a moored semisubmersible rig.8,951 feet of water
Deepwater Nautilus sets world record for deepest subsea completion.7,570 feet of water
Polar Pioneer constructs a world-recordhorizontal well.23,000 feet
Discoverer Deep Seas sets the world water-depthrecord, becoming the firstrig in the industry to drill in more than 10,000 feetof water.10,011 feet of water
2004 2003
C O N T R A C T B A C K L O G B Y Y E A R( 1 )
(1)Calculated by multiplying the contractedoperating dayrate by the firm contract periodfrom March 2, 2006 forward. Reflects firmcommitments only, typically represented bysigned contracts. Contract backlog excludesrevenues from mobilization, demobilization,contract preparation and customer reim-bursables. Backlog is indicative of the fullcontractual dayrate, which could vary due to rig downtime.
Total Contract Backlog at March 2, 2006(1)
$16.8 Billion
2005 authorized a $2 billion share repurchase program as a vehicle for returning cash to our shareholders. ThroughDecember 31,2005,we had repurchased $400 million,or 6,014,751 ordinary shares,at an average price of $66.50 per share.
As of March 2, 2006, we have a record contract backlog and are positioned to benefit from having 22 of our High-Specification Floaters contracted at dayrates at or exceeding $300,000, including 10 with dayrates exceeding $400,000scheduled to commence in late 2006 through early 2009. An industry-leading dayrate on our dual-activity drillshipDiscoverer Enterprise of $520,000 per day over a three-year contract period is expected to commence in late 2007. We suc-ceeded in expanding our position in the High-Specification Floaters market sector by capturing contracts that support theupgrade of two of our Other Floaters to deepwater capability. Also, we were recently awarded a contract by Chevron forthe construction of an enhanced Enterprise-class drillship. The contract is for a term of five years with a dayrate for the firstthree years of $450,000, while the dayrate for the final two years of the contract will range from $400,000 to $500,000depending on the price of standard West Texas Intermediate crude oil. These upgrades and the rig construction programwill expand our industry-leading High-Specification Floaters fleet from 32 to 35 units.
In our Other Floaters fleet, comprised of 23 semisubmersible rigs that primarily address the industry’s mid-water drillingopportunities, utilization and dayrates in 2005 improved significantly as customers increased activity in such regions asthe North Sea and the U.S. Gulf of Mexico. The company entered 2005 with seven of our Other Floaters stacked. Atpresent, only three units are without contracts, as two stacked rigs commenced the process of reactivation, one unit wasselected for upgrade to deepwater capability and one stacked unit was sold. Like the High-Specification Floaters fleet,dayrates in the Other Floaters fleet experienced substantial improvement during the year and continue to move higher inearly 2006. As of March 2, 2006, eight of our Other Floaters have signed contracts with dayrates at or above $200,000,with a contract award in early 2006 on the semisubmersible rig Sedco 704 reaching $310,000 per day.These contracts have commenced or are scheduled to commence over the next 20 months.
Finally, our 25-rig Jackup fleet experienced better than 90% utilization in 2005 and entered 2006 with all units on contract. Seven have been awarded contracts that are scheduled to extend to or go beyond 2009, including five unitsrecently awarded three-year contracts for operations in India. Dayrates for our Jackups remain buoyant into 2006, with11 units awarded contracts in 2005 and 2006 with dayrates in excess of $100,000.
We believe the prospects for a sustained cycle are increasingly evident, especially for the deepwater sector of our business. As evidenced by the 17 High-Specification Floaters in our fleet with contract awards into or beyond 2010, ourcustomers are increasingly signing long-term contracts that secure rig availability for multiple years. Including our OtherFloaters and Jackups, the company currently has 24 rigs, or 30% of our shallow, mid- and deepwater fleet under contractinto 2010. We are also witnessing a broadening of our customer base, with greater activity from independents andnational oil companies, as deepwater geologic results remain strong and global access to offshore areas improves. Also,established deepwater regions like the U.S. Gulf of Mexico, Brazil and some parts of West Africa are expanding as newgeologic structures are pursued. Additionally, exploration interest is building in emerging deepwater regions like theEastern Mediterranean, India and Southeast Asia, coupled with a longer term potential for such deepwater frontier areasas the southern Gulf of Mexico, South China Sea and Eastern Canada, where the Orphan Basin northeast ofNewfoundland represents what may be the largest undrilled geologic structure in the world.
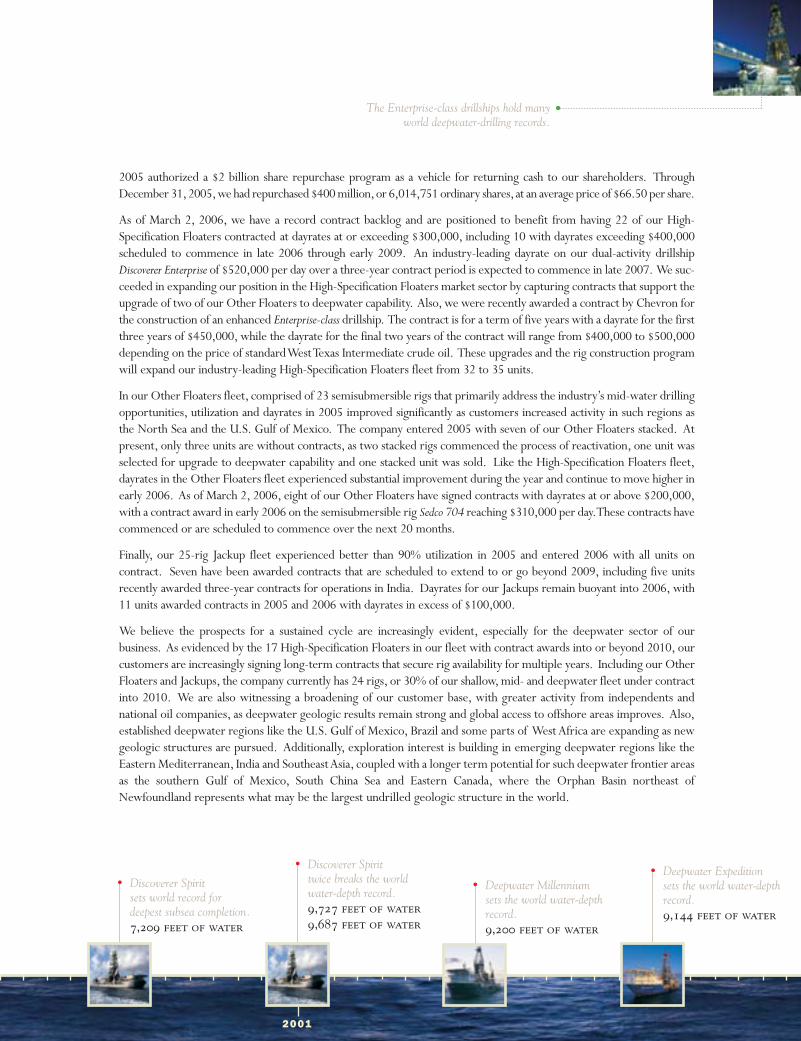
The Enterprise-class drillships hold many world deepwater-drilling records.
Discoverer Spirit sets world record for deepest subsea completion.7,209 feet of water
Discoverer Spirit twice breaks the worldwater-depth record.9,727 feet of water9,687 feet of water
Deepwater Expedition sets the world water-depthrecord.9,144 feet of water
Deepwater Millennium sets the world water-depthrecord.9,200 feet of water
2001
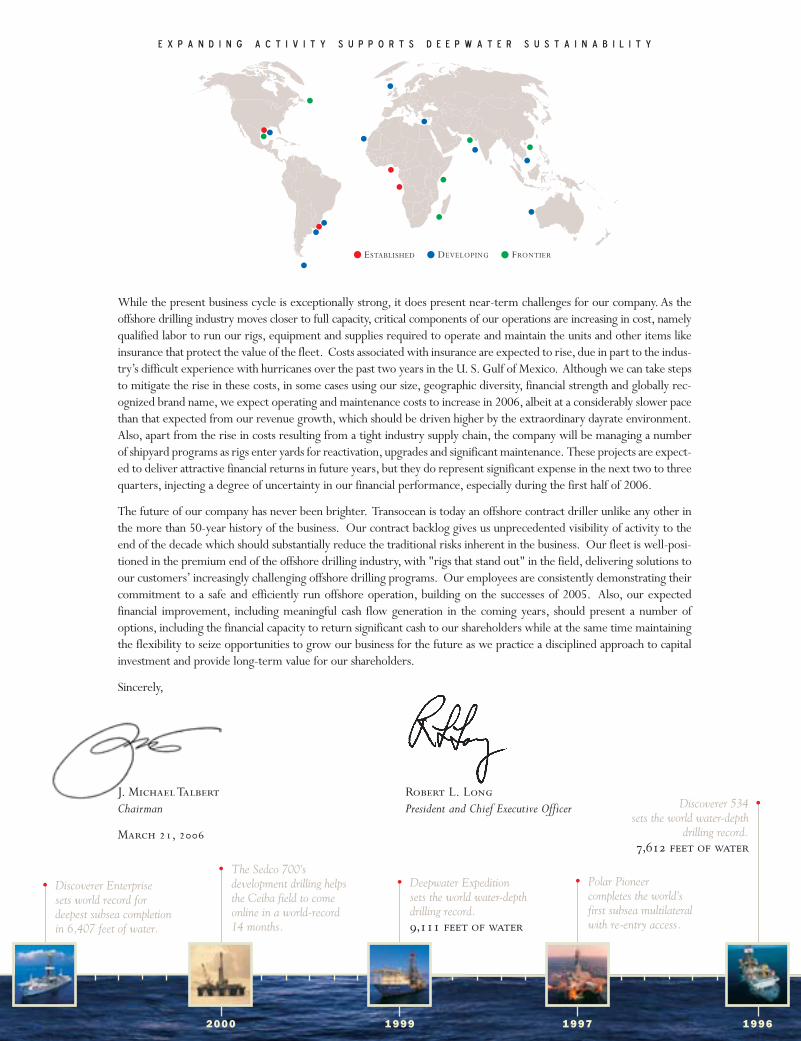
While the present business cycle is exceptionally strong, it does present near-term challenges for our company. As theoffshore drilling industry moves closer to full capacity, critical components of our operations are increasing in cost, namelyqualified labor to run our rigs, equipment and supplies required to operate and maintain the units and other items likeinsurance that protect the value of the fleet. Costs associated with insurance are expected to rise, due in part to the indus-try’s difficult experience with hurricanes over the past two years in the U. S. Gulf of Mexico. Although we can take stepsto mitigate the rise in these costs, in some cases using our size, geographic diversity, financial strength and globally rec-ognized brand name, we expect operating and maintenance costs to increase in 2006, albeit at a considerably slower pacethan that expected from our revenue growth, which should be driven higher by the extraordinary dayrate environment.Also, apart from the rise in costs resulting from a tight industry supply chain, the company will be managing a numberof shipyard programs as rigs enter yards for reactivation, upgrades and significant maintenance. These projects are expect-ed to deliver attractive financial returns in future years, but they do represent significant expense in the next two to threequarters, injecting a degree of uncertainty in our financial performance, especially during the first half of 2006.
The future of our company has never been brighter. Transocean is today an offshore contract driller unlike any other inthe more than 50-year history of the business. Our contract backlog gives us unprecedented visibility of activity to theend of the decade which should substantially reduce the traditional risks inherent in the business. Our fleet is well-posi-tioned in the premium end of the offshore drilling industry, with "rigs that stand out" in the field, delivering solutions toour customers’ increasingly challenging offshore drilling programs. Our employees are consistently demonstrating theircommitment to a safe and efficiently run offshore operation, building on the successes of 2005. Also, our expected financial improvement, including meaningful cash flow generation in the coming years, should present a number ofoptions, including the financial capacity to return significant cash to our shareholders while at the same time maintainingthe flexibility to seize opportunities to grow our business for the future as we practice a disciplined approach to capitalinvestment and provide long-term value for our shareholders.
Sincerely,
J. Michael Talbert Robert L. LongChairman President and Chief Executive Officer
March 21, 2006
Discoverer Enterprise sets world record for deepest subsea completionin 6,407 feet of water.
The Sedco 700’s development drilling helpsthe Ceiba field to comeonline in a world-record 14 months.
Deepwater Expedition sets the world water-depthdrilling record.9,111 feet of water
Polar Pioneer completes the world’s first subsea multilateralwith re-entry access.
Discoverer 534 sets the world water-depth
drilling record.7,612 feet of water
2000 1999 1997 1996
ESTABLISHED DEVELOPING FRONTIER
E X P A N D I N G A C T I V I T Y S U P P O R T S D E E P W A T E R S U S T A I N A B I L I T Y
March 21, 2006
Dear Shareholder:
The 2006 annual general meeting of Transocean Inc. will be held on Thursday, May 11, 2006 at 9:00 a.m., Bahamas time, at the British Colonial Hilton Nassau, Nassau, Bahamas. The Secretary’s notice of annual general meeting, the proxy statement and a proxy card areenclosed and describe the matters to be acted upon at the meeting.
It is important that your shares be represented and voted at the meeting. Please read the enclosed notice of annual general meeting andproxy statement and date, sign and promptly return the proxy card in the enclosed self-addressed envelope.
Sincerely,
This proxy statement and the accompanying proxy card are dated March 21, 2006 and are first being mailed on or about March 29, 2006 to record shareholders as of March 20, 2006.
J. Michael Talbert Robert L. LongChairman of the Board President & Chief Executive Officer

NOTICE OF ANNUAL GENERAL MEETING OF TRANSOCEAN INC.TO BE HELD MAY 11, 2006
The annual general meeting of Transocean Inc., a Cayman Islands exempted company limited by shares, will be held at the British ColonialHilton Nassau, Nassau, Bahamas at 9:00 a.m., Bahamas time, on May 11, 2006 for the following purposes:
This constitutes notice of the meeting as required by Cayman Islands law and our articles of association.
Only record holders of ordinary shares at the close of business on March 20, 2006 will be entitled to notice of, and to vote at, the meeting.
The meeting may generally be adjourned from time to time without advance notice other than announcement at the meeting, or any adjournment thereof, and any and all business for which the meeting is hereby noticed may be transacted at any such adjournment.
Houston, TexasMarch 21, 2006
YOUR VOTE IS IMPORTANTPlease complete, sign and promptly return your proxy card in the enclosed return envelope.
1. To elect three directors as members of our board of directors to serve until the 2009 annual general meeting and until their respectivesuccessors have been duly elected.
2. To approve the appointment of Ernst & Young LLP as our independent registered public accounting firm for 2006.
3. To transact such other business as may properly be brought before the meeting.
By order of the Board of Directors,
Eric B. BrownSecretary

1
PROXY STATEMENT FOR ANNUAL GENERAL MEETING OF TRANSOCEAN INC.
MAY 11, 2006
This proxy statement is furnished in connection with the solicitation of proxies by Transocean Inc., on behalf of our board of directors, to be voted at our annual general meeting to be held on May 11, 2006 at 9:00 a.m., Bahamas time, at the British Colonial Hilton Nassau, Nassau, Bahamas.
Proposals
At the annual general meeting, shareholders will be asked to vote upon the following:
• A proposal to elect three nominees as directors to serve three-year terms. These directors will bemembers of a class of directors that will serve until the 2009 annual general meeting and until their respective successors have been duly elected.
• A proposal to approve the appointment of Ernst & Young LLP as our independent registered publicaccounting firm for 2006.
• Any other matters that may properly come before the meeting.
We know of no other matters that are likely to be brought before the annual general meeting.
Quorum
The presence, in person or by proxy, of shareholders holding a majority of our outstanding ordinary shares will constitute a quorum. Abstentions and “broker non-votes” will be counted as present for purposes ofdetermining whether there is a quorum at the meeting.
Record Date
Only shareholders of record at the close of business on March 20, 2006 are entitled to notice of and to vote, or to grant proxies to vote, at the meeting.
Votes Required
Approval of the proposal to elect the three nominees as directors requires the affirmative vote of a pluralityof the votes cast. Abstentions and “broker non-votes” will not be counted in that vote.
Approval of the proposal to appoint Ernst & Young LLP as our independent registered public accounting firm for 2006 requires the affirmative vote of holders of at least a majority of the ordinary shares present in person or by proxy at the meeting and entitled to vote on the matter. Abstentions and “broker non-votes” on the proposal have the effect of a vote against the proposal.
As of the record date for the meeting, there were 326,411,524 ordinary shares outstanding and entitled tonotice of and to vote at the meeting. Holders of ordinary shares on the record date are entitled to one vote for eachshare held.
Proxies
A proxy card is being sent to each shareholder as of the record date. If you properly received a proxy card, you may grant a proxy to vote on each of the proposals by marking your proxy card appropriately, executing it in the space provided, dating it and returning it to us. We may accept your proxy by any form of communication permittedby Cayman Islands law and our articles of association. If you hold your shares in the name of a bank, broker or
2
other nominee, you should follow the instructions provided by your bank, broker or nominee when voting yourshares.
If you have timely submitted a properly executed proxy card and clearly indicated your votes, your shares will be voted as indicated. If you have timely submitted a properly executed proxy card and have not clearlyindicated your votes, your shares will be voted “FOR” the election of all director nominees and “FOR” the other proposals.
If any other matters are properly presented at the meeting for consideration, the persons named in the proxy card will have the discretion to vote on these matters in accordance with their best judgment. Proxies voted againstany of the three proposals will not be voted in favor of any adjournment of the meeting for the purpose of soliciting additional proxies.
You may revoke your proxy card at any time prior to its exercise by:
• giving written notice of the revocation to our Secretary;
• appearing at the meeting, notifying our Secretary and voting in person; or
• properly completing and executing a later-dated proxy and delivering it to our Secretary at or before the meeting.
Your presence without voting at the meeting will not automatically revoke your proxy, and any revocation during the meeting will not affect votes previously taken. If you hold your shares in the name of a bank, broker orother nominee, you should follow the instructions provided by your bank, broker or nominee in revoking yourpreviously granted proxy.
Solicitation of Proxies
The accompanying proxy is being solicited on behalf of the board of directors. The expenses of preparing, printing and mailing the proxy and the materials used in the solicitation will be borne by us. We have retained D.F. King & Co., Inc. for a fee of $7,500, plus expenses, to aid in the solicitation of proxies. Proxies may be solicited bypersonal interview, telephone and telegram by our directors, officers and employees, who will not receive additional compensation for those services. Arrangements also may be made with brokerage houses and other custodians,nominees and fiduciaries for the forwarding of solicitation materials to the beneficial owners of ordinary shares heldby those persons, and we will reimburse them for reasonable expenses incurred by them in connection with the forwarding of solicitation materials.
ELECTION OF DIRECTORS
Our articles of association divide our board of directors into three classes: Class I, Class II and Class III. Three Class I directors are to be elected at our 2006 annual general meeting to serve for three-year terms expiring atthe annual general meeting in 2009 and until their respective successors have been duly elected.
The board has nominated for election as Class I directors Victor E. Grijalva, Arthur Lindenauer and Kristian Siem. Messrs. Grijalva, Lindenauer and Siem are standing for re-election. If any of the nominees becomesunavailable for any reason, which we do not anticipate, the board of directors in its discretion may designate asubstitute nominee. If you have submitted an executed proxy card, your vote will be cast for the substitute nominee unless contrary instructions are given in the proxy. Richard A. Pattarozzi, currently a Class I director, has notified us that he does not intend to stand for re-election as a result of his desire to reduce the number of boards on which heserves because of the time commitment required. The corporate governance committee and board of directors planto consider additional director candidates but have made no decision with respect to the board seat being vacated byMr. Pattarozzi. Consequently, the board of directors currently intends to reduce the size of the board to ten directorsin connection with Mr. Pattarozzi’s departure.
3
The board of directors recommends a vote “FOR” the election of Victor E. Grijalva, Arthur Lindenauer and Kristian Siem as Class I directors.
Nominees for Director—Class I—Terms Expiring 2009
VICTOR E. GRIJALVA, age 67, has been a director since December 1999 and served as Chairman ofour board of directors until October 2002. He is the retired Vice Chairman of Schlumberger Limited.Before serving as Vice Chairman, he served as Executive Vice President of Schlumberger’s Oilfield Services division from 1994 to January 1999 and as Executive Vice President of Schlumberger’s Wireline,Testing & Anadrill division from 1992 to 1994. Mr. Grijalva is also a director of Hanover Compressor Company.
ARTHUR LINDENAUER, age 68, became Chairman of the Board of Schlumberger TechnologyCorporation, the principal U.S. subsidiary of Schlumberger Limited, in December 1998 and served in thatposition through February 2004. He previously served as Executive Vice President-Finance and Chief Financial Officer of Schlumberger from January 1980 to December 1998. Mr. Lindenauer was a partner with the accounting firm of Price Waterhouse from 1972 to 1980. Mr. Lindenauer is also a director of the New York Chapter of the Cystic Fibrosis Foundation, a Trustee of the American University in Cairo and a member of the Board of Overseers of the Tuck School of Business at Dartmouth College. Mr. Lindenauerhas served as one of our directors since December 1999.
KRISTIAN SIEM, age 57, is Chairman and Chief Executive Officer of Siem Industries, Inc., an industrial holding company that owns offshore oil and gas drilling and subsea construction services businesses, a fleetof reefer vessels and a fleet of car carrying vessels through subsidiaries in the Cayman Islands, the U.K. and Norway. Mr. Siem has served as one of our directors since September 1996 and was Chairman ofTransocean ASA prior to its acquisition by us in 1996. Mr. Siem is also chairman of Star Reefers Inc., Siem Offshore Inc., Subsea 7 Inc. and Siem Industrikapital AB. He is further a director of North AtlanticSmaller Companies Investment Trust PLC. During the past five years, Mr. Siem has served as an executiveofficer with Siem Industries, Inc., as CEO and a director of Kvaerner ASA and as Chairman and a directorof Norwegian Cruise Line.
Continuing Directors—Class II—Terms Expiring 2007
ROBERT L. LONG, age 60, is President, Chief Executive Officer and a member of our board of directors.Mr. Long served as President from December 2001 to October 2002, at which time he assumed theadditional position of Chief Executive Officer. Mr. Long also served as Chief Operating Officer from June2002 until October 2002, Chief Financial Officer from August 1996 until December 2001, as Senior Vice President from May 1990 until the time of the Sedco Forex merger, at which time he assumed the positionof Executive Vice President, and as Treasurer from September 1997 until March 2001. Mr. Long has beenan employee since 1976 and was elected Vice President in 1987.
MARTIN B. MCNAMARA, age 58, is a Partner of the law firm of Gibson, Dunn & Crutcher and hasserved as a member of the firm’s executive, finance and compensation committees, as well as a Partner-in-Charge of the firm’s Texas practice. He has served as one of our directors since November 1994. Duringthe past five years, Mr. McNamara has been in the private practice of law.
ROBERT M. SPRAGUE, age 61, is the retired Regional Business Director of Shell EP International BV, a position in which he served from April 1997 until June 2003. Mr. Sprague served as Director – Strategy & Business Services for Shell EP International BV from January 1996 until March 1997 and asExploration & Production Coordinator of Shell International Petroleum BV from May 1994 to December1995. Mr. Sprague joined the Royal Dutch / Shell group of companies in 1967 and served in a variety ofpositions in the United States and Europe during his career, including as a director of Shell CanadaLimited, a publicly traded company, from April 2000 to April 2003. Mr. Sprague has served on our boardof directors since May 2004.
4
J. MICHAEL TALBERT, age 59, has served as our non-executive Chairman of our board of directorssince October 2004. Prior to that Mr. Talbert served as our executive Chairman of the board since October2002 and a member of our board of directors since August 1994. Mr. Talbert also served as ChiefExecutive Officer from August 1994 until October 2002, Chairman of our board of directors from August 1994 until December 1999, and as President from December 1999 until December 2001. Prior to assuminghis duties with us, Mr. Talbert was President and Chief Executive Officer of Lone Star Gas Company, a natural gas distribution company and a division of Enserch Corporation. He is also a director of El PasoCorporation.
Continuing Directors—Class III—Terms Expiring 2008
JUDY J. KELLY, age 57, is the retired Vice President–Americas of ExxonMobil Gas Marketing Company, a division of ExxonMobil Corporation, a position in which she served from March 2002 untilher retirement in July 2004 and in which she was responsible for ExxonMobil’s natural gas and natural gas liquids marketing activities and related infrastructure assets in North and South America. From January 2000 until March 2002, Ms. Kelly served as Vice President–Global Business Planning for ExxonMobil Gas Marketing Company, a position she assumed after ExxonMobil’s merger with Mobil Corporation. Ms. Kelly joined a predecessor of ExxonMobil in its financial organization and served in a variety of positions during her 31 years at ExxonMobil. Ms. Kelly has served as one of our directors since May 2005.
ROBERTO MONTI, age 67, is the retired Executive Vice President of Exploration and Production for Repsol YPF. He was the President and Chief Executive Officer of YPF Sociedad Anonima from September 1995 to June 1999 prior to its acquisition by Repsol. From October 1993 to July 1995, heserved as President of Dowell, a division of Schlumberger. He is also a director of Petrobras Energía S.A.,John Wood Group PLC and Tenaris S.A. Mr. Monti has served as one of our directors since December1999.
IAN C. STRACHAN, age 62, is a director of Reuters Group PLC, Xstrata plc, Rolls Royce Group plc and Johnson Matthey plc. He served as Chairman of the Board of Instinet Group Incorporated from January2003 to December 2005, when it was acquired by The Nasdaq Stock Market, Inc. Mr. Strachan served asDeputy Chairman of Invensys plc from 1999 to 2000 and served as CEO of BTR plc from 1996 until itsmerger with Siebe plc in 1999, when it changed its name to Invensys plc. From 1987 to 1995, Mr. Strachan was with Rio Tinto plc, serving as CFO from 1987 to 1991 and as Deputy CEO from 1991 to1995. He was employed by Exxon Corporation from 1970 to 1986. Mr. Strachan has served as one of ourdirectors since December 1999.
Merger with Sedco Forex, Designation of Board Members and Appointment of Mr. Grijalva
On December 31, 1999, we completed a merger with Sedco Forex Holdings Limited following the spin-off of Sedco Forex to Schlumberger stockholders on December 30, 1999. As a result of the merger, Schlumberger stockholders exchanged all of the Sedco Forex shares distributed to them by Schlumberger in the Sedco Forex spin-off for our ordinary shares, and Sedco Forex became our wholly owned subsidiary. Pursuant to the merger agreement, Transocean’s board of directors designated Messrs. McNamara, Siem and Talbert as directors (in addition to two other individuals who no longer serve on our board) and Schlumberger’s board of directors designated Messrs. Grijalva, Lindenauer, Monti and Strachan as directors (in addition to another individual who nolonger serves on our board). In the merger agreement, we agreed to use reasonable efforts to appoint thosedesignees for a period of three years from the effective date of the merger. We also agreed to nominate Mr. Grijalvato our board of directors to serve as Chairman until his 65th birthday (in July 2003). In October 2002, Mr. Grijalvaresigned his position as Chairman but agreed to remain as a director.
Corporate Governance
We believe that we have long had good corporate governance practices, including having had written corporate governance guidelines, committee charters and a code of conduct for employees in place before enactment of the Sarbanes-Oxley Act and revisions to the corporate governance rules of the New York Stock Exchange
5
(NYSE). Furthermore, the board held separate meetings of the non-management directors for several years beforeexecutive sessions were required by the NYSE.
The corporate governance committee of the board has continued to evaluate the Company’s and the board’sgovernance practices and formally reviews all committee charters and the board’s governance principles at least annually. This committee further receives updates at each meeting regarding new developments in the corporate governance arena. Our committee charters also require, among other things, that the committees and the boardannually evaluate their own performance.
In 2005, we adopted ownership guidelines for directors that require each current nonmanagement director to, over a five year period, acquire a number of our shares and/or deferred units equal in value to an amount five times the annual director retainer. Each new director is to acquire such number of shares and/or deferred units over their initial five years as a director. In connection with such ownership requirement, the board currently grants deferred units to directors and requires directors to hold such units until a director leaves the board.
Our current governance documents may be found on our website at www.deepwater.com under “CorporateGovernance.” Among the information you can find there is the following:
• Corporate Governance Guidelines;
• Audit Committee Charter;
• Corporate Governance Committee Charter;
• Executive Compensation Committee Charter;
• Finance and Benefits Committee Charter; and
• Code of Ethics.
Information contained on our website is not part of this proxy statement. You may also request this information in print by writing to our General Counsel, Transocean Inc., 4 Greenway Plaza, Houston, Texas 77046.
We will continue to monitor our governance practices in order to maintain our high standards. Somespecific governance issues are addressed below.
Independence of Board Members/Committee Structure. Our corporate governance guidelines require thatat least a majority of the directors meet the independence requirements of the NYSE. The director independencestandards of the New York Stock Exchange require a board determination that the director has no material relationship with the listed company and has no specific relationships that preclude independence. Our boardconsiders all relevant facts and circumstances in assessing whether a director is independent.
The board has carefully considered the criteria of the NYSE and believes that our directors Judy J. Kelly, Arthur Lindenauer, Martin B. McNamara, Roberto Monti, Richard A. Pattarozzi, Robert M. Sprague and Ian C.Strachan meet the NYSE independence requirements. We believe that our executive compensation, audit and corporate governance committees are composed solely of directors who meet the NYSE independence requirements. Also, Victor E. Grijalva has under NYSE criteria been precluded from being determined to be independent by the board because of a prior consulting agreement with us that terminated in 2003. However, by the time of our nextscheduled board of directors meeting in May 2006, Mr. Grijalva should be eligible for a finding of independence bythe board.
The board has also considered what types of disclosure should be made relating to the process ofdetermining director independence. To assist the board in making disclosures regarding its determinations ofindependence, the board has adopted categorical standards as permitted under the listing standards of the NYSE. These categorical standards deal only with what types of relationships need to be disclosed and not whether a

6
particular director is independent. The board considers all relevant facts and circumstances in determining whether a director is independent. However, the relationships satisfying the categorical standards are not required to bedisclosed or separately discussed in our proxy statement.
A relationship satisfies the categorical standards adopted by the board if it:
• is a type of relationship addressed in:
Item 404 of Regulation S-K of the Securities and Exchange Commission (containing requirements for proxy statement disclosure), but under those rules, disclosure is not required, or
Section 303A.02(b) of the NYSE Listed Company Manual (listing relationships that preclude adetermination of independence), but under those rules, a determination of independence is notprecluded; or
• results from charitable contributions by the Company to an organization where a director is anexecutive officer and such contributions do not exceed the greater of $100,000 or 1% of the organization’s gross revenue in any of the last three years.
Executive Sessions. The nonmanagement directors met in executive session at each regularly scheduled board meeting in 2005. During 2006, they are again scheduled to meet in executive session without management ateach regularly scheduled board meeting. In addition, the independent directors met as a group in executive session on one occasion during 2005. The nonmanagement and independent directors have designated Ian C. Strachan as the presiding director for their respective meetings. Shareholders or other interested persons may send communications to the presiding director by writing to him c/o Mr. Eric B. Brown, Corporate Secretary, P.O. Box 2765, Houston, TX77252-2765.
Director Nomination Process. The board has designated the corporate governance committee as the committee authorized to consider and recommend nominees for the board. We believe that all members of the committee meet the NYSE independence requirements.
Our Corporate Governance Guidelines require that the corporate governance committee assess the needs of our Company and the board so as to recommend candidates who will further our goals. In making that assessment,the committee has determined that a candidate must have the following minimum qualifications:
• high professional and personal ethics and values;
• a record of professional accomplishment in his/her chosen field;
• relevant expertise and experience; and
• a reputation, both personal and professional, consistent with our core values.
In addition to these minimum qualities, the committee considers other qualities that may be desirable. Inparticular, the board is committed to having a majority of independent directors and, accordingly, the committeeevaluates the independence status of any potential director. The committee evaluates whether or not a candidate contributes to the board’s overall diversity and whether or not the candidate can contribute positively to the existing chemistry and culture among the board members. Also, the committee considers whether or not the candidate may have professional or personal experiences and expertise relevant to our business and position as the leadinginternational provider of offshore drilling services.
The committee has several methods of identifying candidates. First, the committee considers and evaluates whether or not the existing directors whose terms are expiring remain appropriate candidates for the board. Second,the committee requests from time to time that its members and the other board members identify possiblecandidates. Third, the committee has the authority to retain one or more search firms to aid in its search. The search

7
firm assists the board in identifying potential board candidates, interviewing those candidates and conductinginvestigations relative to their background and qualifications.
The corporate governance committee will consider nominees for director recommended by shareholders. Please submit your recommendations in writing, along with:
• the name of and contact information for the candidate;
• a statement detailing the candidate’s qualifications and business and educational experience;
• information regarding the qualifications and qualities described under “Director Nomination Process” above;
• a signed statement of the proposed candidate consenting to be named as a candidate and, if nominatedand elected, to serve as a director;
• a statement that the writer is a shareholder and is proposing a candidate for consideration by thecommittee;
• a statement detailing any relationship between the candidate and any customer, supplier or competitor of ours;
• financial and accounting background, to enable the committee to determine whether the candidatewould be suitable for audit committee membership; and
• detailed information about any relationship or understanding between the proposing shareholder and the candidate.
Submit nominations to Eric B. Brown, Corporate Secretary, Transocean Inc., 4 Greenway Plaza, Houston, Texas 77046. The extent to which the committee dedicates time and resources to the consideration and evaluation of any potential nominee brought to its attention depends on the information available to the committee about thequalifications and suitability of the individual, viewed in light of the needs of the board, and is at the committee’sdiscretion. The committee evaluates the desirability for incumbent directors to continue on the board following the expiration of their respective terms, taking into account their contributions as board members and the benefit thatresults from the increasing insight and experience developed over a period of time. Although the corporategovernance committee will consider candidates for director recommended by shareholders, it may determine not torecommend that the board, and the board may determine not to, nominate those candidates for election to our board.
In addition to recommending director nominees to the corporate governance committee, any shareholder may nominate directors at an annual general meeting of shareholders. For more information on this topic, see“Proposals of Shareholders.”
Process for Shareholder Communications with the Board. The board has established a process wherebyinterested parties may communicate with the board and/or with any individual director. Shareholders may sendcommunications in writing, addressed to the board or an individual director, c/o Mr. Eric B. Brown, Corporate Secretary, P.O. Box 2765, Houston, TX 77252-2765. The Corporate Secretary will forward these communicationsto the addressee.
Director Attendance at Annual Meeting. We expect all of our directors to attend our annual generalmeeting of shareholders other than Mr. Pattarozzi, who is not standing for re-election at this year’s meeting. At the2005 meeting, all directors were in attendance.
8
Compensation of Directors
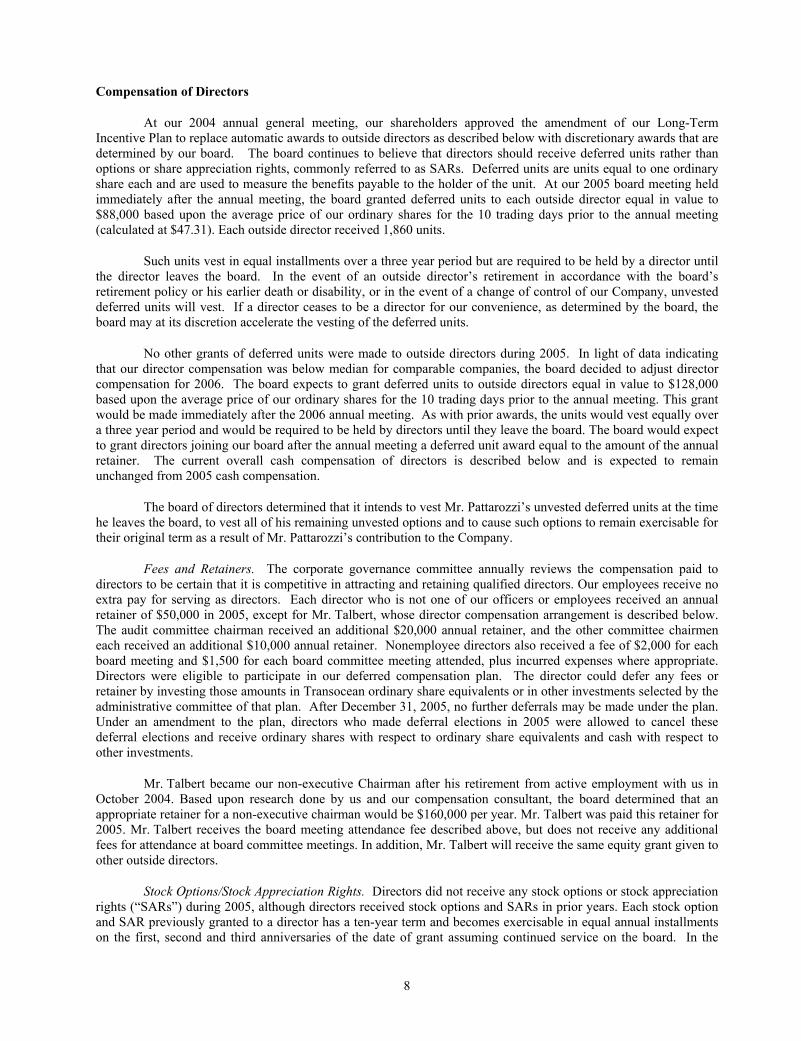
At our 2004 annual general meeting, our shareholders approved the amendment of our Long-TermIncentive Plan to replace automatic awards to outside directors as described below with discretionary awards that aredetermined by our board. The board continues to believe that directors should receive deferred units rather thanoptions or share appreciation rights, commonly referred to as SARs. Deferred units are units equal to one ordinaryshare each and are used to measure the benefits payable to the holder of the unit. At our 2005 board meeting heldimmediately after the annual meeting, the board granted deferred units to each outside director equal in value to$88,000 based upon the average price of our ordinary shares for the 10 trading days prior to the annual meeting(calculated at $47.31). Each outside director received 1,860 units.
Such units vest in equal installments over a three year period but are required to be held by a director untilthe director leaves the board. In the event of an outside director’s retirement in accordance with the board’sretirement policy or his earlier death or disability, or in the event of a change of control of our Company, unvested deferred units will vest. If a director ceases to be a director for our convenience, as determined by the board, the board may at its discretion accelerate the vesting of the deferred units.
No other grants of deferred units were made to outside directors during 2005. In light of data indicating that our director compensation was below median for comparable companies, the board decided to adjust director compensation for 2006. The board expects to grant deferred units to outside directors equal in value to $128,000based upon the average price of our ordinary shares for the 10 trading days prior to the annual meeting. This grant would be made immediately after the 2006 annual meeting. As with prior awards, the units would vest equally over a three year period and would be required to be held by directors until they leave the board. The board would expectto grant directors joining our board after the annual meeting a deferred unit award equal to the amount of the annualretainer. The current overall cash compensation of directors is described below and is expected to remainunchanged from 2005 cash compensation.
The board of directors determined that it intends to vest Mr. Pattarozzi’s unvested deferred units at the timehe leaves the board, to vest all of his remaining unvested options and to cause such options to remain exercisable fortheir original term as a result of Mr. Pattarozzi’s contribution to the Company.
Fees and Retainers. The corporate governance committee annually reviews the compensation paid todirectors to be certain that it is competitive in attracting and retaining qualified directors. Our employees receive no extra pay for serving as directors. Each director who is not one of our officers or employees received an annual retainer of $50,000 in 2005, except for Mr. Talbert, whose director compensation arrangement is described below. The audit committee chairman received an additional $20,000 annual retainer, and the other committee chairmen each received an additional $10,000 annual retainer. Nonemployee directors also received a fee of $2,000 for each board meeting and $1,500 for each board committee meeting attended, plus incurred expenses where appropriate. Directors were eligible to participate in our deferred compensation plan. The director could defer any fees orretainer by investing those amounts in Transocean ordinary share equivalents or in other investments selected by the administrative committee of that plan. After December 31, 2005, no further deferrals may be made under the plan. Under an amendment to the plan, directors who made deferral elections in 2005 were allowed to cancel thesedeferral elections and receive ordinary shares with respect to ordinary share equivalents and cash with respect to other investments.
Mr. Talbert became our non-executive Chairman after his retirement from active employment with us inOctober 2004. Based upon research done by us and our compensation consultant, the board determined that an appropriate retainer for a non-executive chairman would be $160,000 per year. Mr. Talbert was paid this retainer for 2005. Mr. Talbert receives the board meeting attendance fee described above, but does not receive any additional fees for attendance at board committee meetings. In addition, Mr. Talbert will receive the same equity grant given to other outside directors.
Stock Options/Stock Appreciation Rights. Directors did not receive any stock options or stock appreciation rights (“SARs”) during 2005, although directors received stock options and SARs in prior years. Each stock option and SAR previously granted to a director has a ten-year term and becomes exercisable in equal annual installmentson the first, second and third anniversaries of the date of grant assuming continued service on the board. In the
9
event of an outside director’s retirement in accordance with the board’s retirement policy or his earlier death or disability, or in the event of a change of control of our Company as described under “Compensation of Executive Officers—Change of Control Provisions of Benefit Plans,” options and SARs will become immediately exercisable and will remain exercisable for the remainder of their ten-year term. Options and SARs will terminate 60 days after an outside director leaves the board for any other reason. However, if that person ceases to be a director for our convenience, as determined by the board, the board may at its discretion accelerate the exercisability and retain theoriginal term of those options and SARs.
We have reserved an aggregate of 600,000 ordinary shares for issuance to outside directors under ourLong-Term Incentive Plan, of which 188,625 remained available for grant as of March 1, 2006.
Reimbursement of Expenses. Directors are reimbursed for travel, food, lodging, activities and other expenses incurred in connection with attending board, committee and shareholder meetings and other corporate functions. From time to time, we have held a corporate strategy meeting in conjunction with a board meeting.Spouses of directors are occasionally invited to this meeting for appropriate business purposes, and we reimbursedirectors for expenses incurred in connection with their attendance. During 2005, certain spouses of directors attended our corporate strategy meeting, and we accordingly reimbursed for the associated expenses. We currentlyintend to invite spouses to such meetings on a periodic (but less than annual) basis.
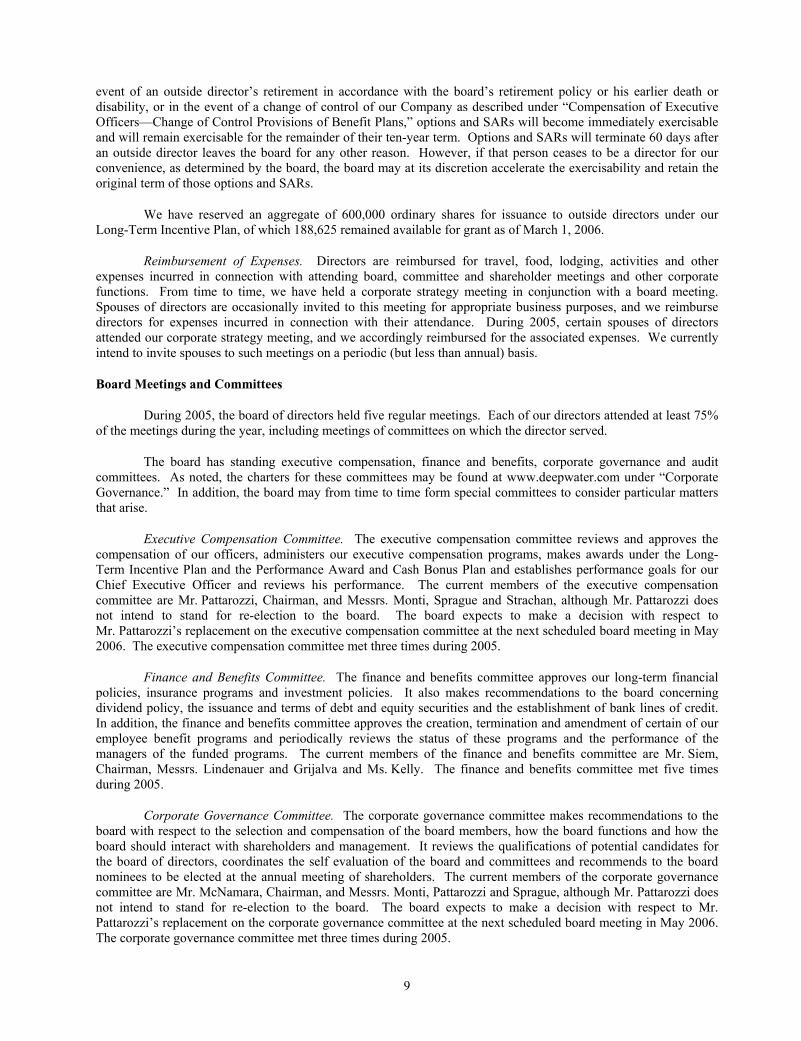
Board Meetings and Committees
During 2005, the board of directors held five regular meetings. Each of our directors attended at least 75% of the meetings during the year, including meetings of committees on which the director served.
The board has standing executive compensation, finance and benefits, corporate governance and auditcommittees. As noted, the charters for these committees may be found at www.deepwater.com under “CorporateGovernance.” In addition, the board may from time to time form special committees to consider particular mattersthat arise.
Executive Compensation Committee. The executive compensation committee reviews and approves thecompensation of our officers, administers our executive compensation programs, makes awards under the Long-Term Incentive Plan and the Performance Award and Cash Bonus Plan and establishes performance goals for our Chief Executive Officer and reviews his performance. The current members of the executive compensation committee are Mr. Pattarozzi, Chairman, and Messrs. Monti, Sprague and Strachan, although Mr. Pattarozzi does not intend to stand for re-election to the board. The board expects to make a decision with respect to Mr. Pattarozzi’s replacement on the executive compensation committee at the next scheduled board meeting in May 2006. The executive compensation committee met three times during 2005.
Finance and Benefits Committee. The finance and benefits committee approves our long-term financialpolicies, insurance programs and investment policies. It also makes recommendations to the board concerningdividend policy, the issuance and terms of debt and equity securities and the establishment of bank lines of credit. In addition, the finance and benefits committee approves the creation, termination and amendment of certain of ouremployee benefit programs and periodically reviews the status of these programs and the performance of the managers of the funded programs. The current members of the finance and benefits committee are Mr. Siem, Chairman, Messrs. Lindenauer and Grijalva and Ms. Kelly. The finance and benefits committee met five times during 2005.
Corporate Governance Committee. The corporate governance committee makes recommendations to theboard with respect to the selection and compensation of the board members, how the board functions and how the board should interact with shareholders and management. It reviews the qualifications of potential candidates forthe board of directors, coordinates the self evaluation of the board and committees and recommends to the boardnominees to be elected at the annual meeting of shareholders. The current members of the corporate governancecommittee are Mr. McNamara, Chairman, and Messrs. Monti, Pattarozzi and Sprague, although Mr. Pattarozzi does not intend to stand for re-election to the board. The board expects to make a decision with respect to Mr.Pattarozzi’s replacement on the corporate governance committee at the next scheduled board meeting in May 2006. The corporate governance committee met three times during 2005.
10
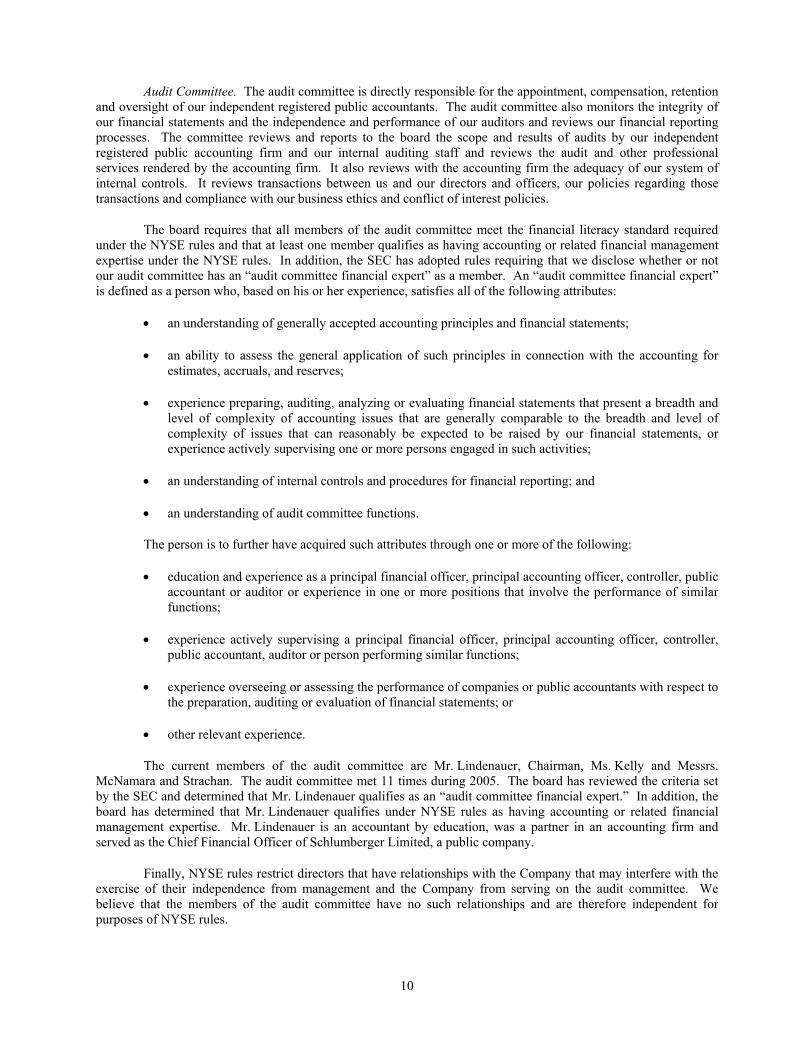
Audit Committee. The audit committee is directly responsible for the appointment, compensation, retentionand oversight of our independent registered public accountants. The audit committee also monitors the integrity of our financial statements and the independence and performance of our auditors and reviews our financial reporting processes. The committee reviews and reports to the board the scope and results of audits by our independentregistered public accounting firm and our internal auditing staff and reviews the audit and other professionalservices rendered by the accounting firm. It also reviews with the accounting firm the adequacy of our system of internal controls. It reviews transactions between us and our directors and officers, our policies regarding thosetransactions and compliance with our business ethics and conflict of interest policies.
The board requires that all members of the audit committee meet the financial literacy standard requiredunder the NYSE rules and that at least one member qualifies as having accounting or related financial managementexpertise under the NYSE rules. In addition, the SEC has adopted rules requiring that we disclose whether or notour audit committee has an “audit committee financial expert” as a member. An “audit committee financial expert”is defined as a person who, based on his or her experience, satisfies all of the following attributes:
• an understanding of generally accepted accounting principles and financial statements;
• an ability to assess the general application of such principles in connection with the accounting for estimates, accruals, and reserves;
• experience preparing, auditing, analyzing or evaluating financial statements that present a breadth and level of complexity of accounting issues that are generally comparable to the breadth and level ofcomplexity of issues that can reasonably be expected to be raised by our financial statements, orexperience actively supervising one or more persons engaged in such activities;
• an understanding of internal controls and procedures for financial reporting; and
• an understanding of audit committee functions.
The person is to further have acquired such attributes through one or more of the following:
• education and experience as a principal financial officer, principal accounting officer, controller, publicaccountant or auditor or experience in one or more positions that involve the performance of similarfunctions;
• experience actively supervising a principal financial officer, principal accounting officer, controller, public accountant, auditor or person performing similar functions;
• experience overseeing or assessing the performance of companies or public accountants with respect to the preparation, auditing or evaluation of financial statements; or
• other relevant experience.
The current members of the audit committee are Mr. Lindenauer, Chairman, Ms. Kelly and Messrs. McNamara and Strachan. The audit committee met 11 times during 2005. The board has reviewed the criteria set by the SEC and determined that Mr. Lindenauer qualifies as an “audit committee financial expert.” In addition, the board has determined that Mr. Lindenauer qualifies under NYSE rules as having accounting or related financialmanagement expertise. Mr. Lindenauer is an accountant by education, was a partner in an accounting firm and served as the Chief Financial Officer of Schlumberger Limited, a public company.
Finally, NYSE rules restrict directors that have relationships with the Company that may interfere with the exercise of their independence from management and the Company from serving on the audit committee. Webelieve that the members of the audit committee have no such relationships and are therefore independent forpurposes of NYSE rules.
11
AUDIT COMMITTEE REPORT
Our audit committee has reviewed and discussed the audited financial statements of the Company for the year ended December 31, 2005 with management, our internal auditors and Ernst & Young LLP. In addition, we have discussed with Ernst & Young LLP, the independent registered public accounting firm for the Company, the matters required by Codification of Statements on Auditing Standards No. 61 (SAS 61). The Sarbanes-Oxley Act of2002 requires certifications by the Company’s chief executive officer and chief financial officer in certain of the Company’s filings with the Securities and Exchange Commission (“SEC”). The committee discussed the review ofthe Company’s reporting and internal controls undertaken in connection with these certifications with the Company’s management and independent registered public accounting firm. The committee also reviewed and discussed with the Company’s management and independent registered public accounting firm, management’sreport and Ernst & Young LLP’s report and attestation on internal control over financial reporting in accordance with Section 404 of the Sarbanes-Oxley Act of 2002. The audit committee has further periodically reviewed suchother matters as it deemed appropriate, including other provisions of the Sarbanes-Oxley Act of 2002 and rules adopted or proposed to be adopted by the SEC and the NYSE.
The committee also has received the written disclosures and the letter from Ernst & Young LLP required by Independence Standards Board Standard No. 1, and we have reviewed, evaluated and discussed the written disclosures with that firm and its independence from the Company. We also have discussed with our managementof the Company and the independent registered public accounting firm such other matters and received suchassurances from them as we deemed appropriate.
Based on the foregoing review and discussions and relying thereon, we have recommended to the Company’s Board of Directors the inclusion of the Company’s audited financial statements for the year endedDecember 31, 2005 in the Company’s Annual Report on Form 10-K for such year filed with the SEC.
ARTHUR LINDENAUER, CHAIRMAN JUDY J. KELLY
MARTIN B. MCNAMARA IAN C. STRACHAN
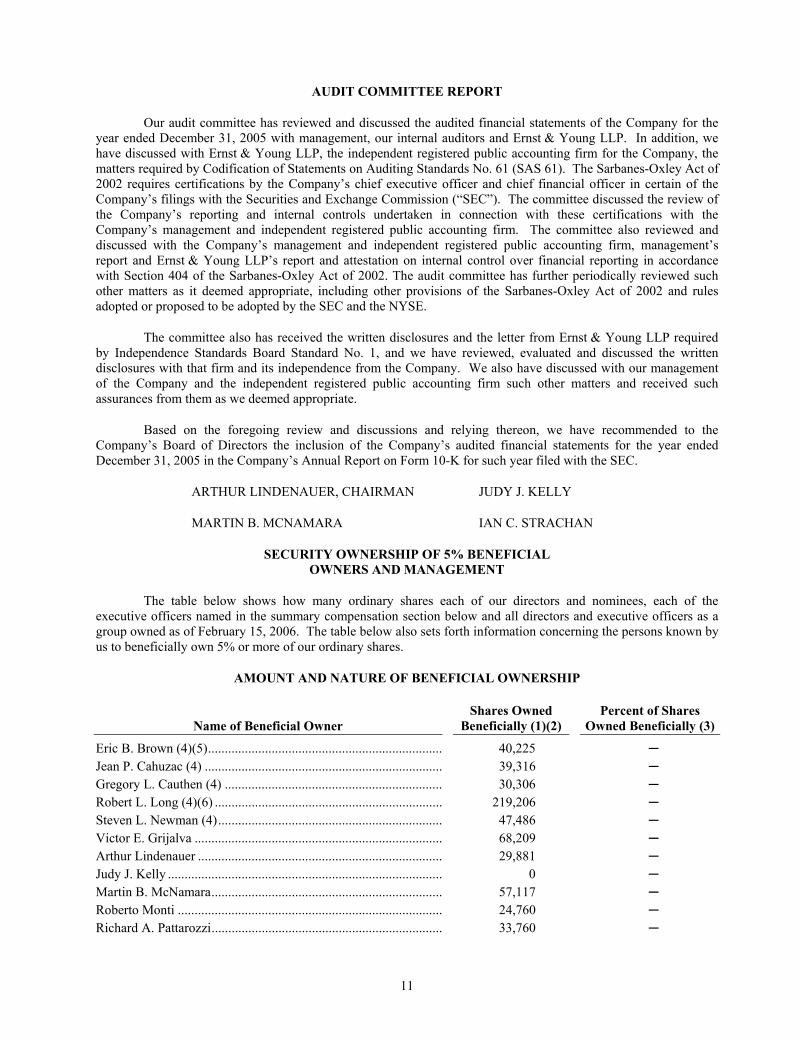
SECURITY OWNERSHIP OF 5% BENEFICIAL OWNERS AND MANAGEMENT
The table below shows how many ordinary shares each of our directors and nominees, each of the executive officers named in the summary compensation section below and all directors and executive officers as agroup owned as of February 15, 2006. The table below also sets forth information concerning the persons known by us to beneficially own 5% or more of our ordinary shares.
AMOUNT AND NATURE OF BENEFICIAL OWNERSHIP
Name of Beneficial Owner Shares Owned
Beneficially (1)(2) Percent of Shares
Owned Beneficially (3)
Eric B. Brown (4)(5)...................................................................... 40,225 ─Jean P. Cahuzac (4) ....................................................................... 39,316 ─Gregory L. Cauthen (4) ................................................................. 30,306 ─Robert L. Long (4)(6) .................................................................... 219,206 ─Steven L. Newman (4)................................................................... 47,486 ─Victor E. Grijalva .......................................................................... 68,209 ─Arthur Lindenauer ......................................................................... 29,881 ─Judy J. Kelly .................................................................................. 0 ─Martin B. McNamara..................................................................... 57,117 ─Roberto Monti ............................................................................... 24,760 ─Richard A. Pattarozzi..................................................................... 33,760 ─

12
Kristian Siem (7) ........................................................................... 35,601 ─Robert M. Sprague (8) ................................................................... 3,760 ─Ian C. Strachan .............................................................................. 25,260 ─J. Michael Talbert (9) .................................................................... 748,113 ─All directors and executive officers as a group (16 persons) (4) ... 1,405,733 ─Capital Research and Management Company (10)........................ 16,730,800 5.1% _____________
(1) The business address of each director and executive officer is c/o Transocean Inc., 4 Greenway Plaza, Houston, Texas 77046.
(2) Includes options exercisable within 60 days held by Messrs. Brown (15,209), Grijalva (24,000), Lindenauer(24,000), Long (133,017), McNamara (39,672), Monti (24,000), Newman (36,449), Pattarozzi (33,000), Siem(34,841), Strachan (24,000), Talbert (667,000) and all directors and executive officers as a group (1,055,188).Also includes (i) rights to acquire ordinary shares under our deferred compensation plan held by Messrs.Grijalva (17,977) and McNamara (12,513), and all directors and executive officers as a group (30,490), and (ii)unvested restricted shares held by Messrs. Brown (6,396), Cahuzac (15,992), Cauthen (11,993), Newman (4,200) and all directors and executive officers as a group (40,194) over which such individuals have solevoting power but no dispositive power.
(3) As of February 15, 2006, each listed individual and our directors and executive officers as a group beneficially owned less than 1.0% of the outstanding ordinary shares.
(4) Includes:
Mr. Brown Mr. Cahuzac Mr. Cauthen Mr. Long Mr. Newman
All directorsand executiveofficers as a
group Shares held inEmployee Stock Purchase Plan......... 1,699 1,294 1,325 6,138 624 11,073
(5) Includes 7,595 shares held in a joint account with his wife. (6) Includes 34,322 shares held in a joint account with his wife. (7) Excludes 1,423,720 of our ordinary shares held by Siem Industries, Inc. Mr. Siem is the Chairman and Chief
Executive Officer of Siem Industries, Inc. As a result, he may be deemed a beneficial owner of those ordinaryshares.
(8) Includes 3,000 shares held in a joint account with his wife. (9) Includes 78,536 shares held in a joint account with his wife. (10) Based on a Schedule 13G filed with the SEC on February 10, 2006. According to the filing, Capital Research
and Management Company has sole voting power over 4,080,900 shares, sole dispositive power over 16,730,000 shares, and shared voting or dispositive power over no shares. The address of Capital Research andManagement Company is 333 South Hope Street, Los Angeles, California 90071.
Section 16(a) Beneficial Ownership Reporting Compliance
We believe all Section 16(a) reporting requirements related to our directors and executive officers weretimely fulfilled during 2005. This belief is based solely on a review of the reports required to be filed under Section 16(a) of the U.S. Securities Exchange Act of 1934 that have been furnished to us and written representations fromthose with filing obligations that all reports were timely filed.
13
COMPENSATION OF EXECUTIVE OFFICERS
Executive Compensation Committee Report
Introduction
The executive compensation committee’s primary responsibility is to ensure that our executive compensation program aligns the interests of management with those of our shareholders. The committee iscomposed solely of independent directors.
Our report covers the following topics:
• the role of the executive compensation committee
• our executive compensation guiding principles
• the components of our executive compensation program
• our stock ownership guidelines
• the limitations on deductibility of non-performance based compensation
Role of the Executive Compensation Committee
The executive compensation committee’s role is to assist the board of directors in developing a fair and competitive compensation program for our executives. Our objective is to attract and retain a highly qualified and motivated management team and appropriately reward individual executives for their contributions to the attainmentof key strategic goals. We regularly review the compensation guiding principles for the executive officers. Annually,we review and establish the individual compensation levels for the executive officers, and we also review the value of benefits and perquisites provided to the executive officers under alternative scenarios. We have considered theadvice of outside consultants retained by the committee in determining whether the amounts and types ofcompensation we pay and the benefits and perquisites provided are appropriate. We also review the servicesprovided by and the fees paid to the outside consultant to ensure that these are appropriate.
Executive Compensation Guiding Principles
The goal of the compensation program is to attract, motivate and retain the talented individuals we need tobe a leader in our highly competitive industry. The following are the guiding principles of our program:
Align the interests of executives with those of our shareholders.
We believe that executive compensation should be linked to results delivered to the shareholder. The basepay and cash bonus and long term incentive programs should ultimately deliver total compensation to executives that is predominantly determined by the Company’s success, both in absolute terms and as measured against peercompanies.
Performance-based compensation.
We believe that executive compensation, including base pay, cash bonus and equity-based compensation,should be a function of Company and individual performance, so that when performance meets or exceeds goals, ourexecutives are compensated at the levels set for such goals, and when performance does not meet goals, cash bonusand equity-based awards for our executives are reduced accordingly or eliminated entirely.
14
Compensation should be set at competitive levels.
The committee believes that executive compensation must be monitored to ensure that we maintaincompetitive compensation levels. We meet with outside consultants at least annually to review and compare the level of compensation we pay or award to executives to the compensation practices of a peer group of companies. For 2005, the primary peer group of companies used to determine compensation (base salary, cash bonus incentive opportunity and long-term equity incentive opportunity) for executives consisted of 15 publicly held companies (including Transocean) that the committee believes are generally of comparable financial size, business focus and scope; however, as described below, we use a narrower group of companies for comparisons based on return oncapital.
Incentive compensation should be a greater part of total compensation for more senior positions.
The portion of an executive’s total compensation that varies based on Company performance and individual performance should increase as the individual’s business responsibilities increase. Incentive performance-based compensation has always been a major component of the CEO’s compensation. For 2005, over 86% ofMr. Long’s compensation was subject to the achievement of performance objectives set forth under the annual cashbonus program and long-term incentive plan.
Components of Our Executive Compensation Program
The three components of our compensation program are:
• base salary
• cash bonus incentives
• long-term equity incentives
Base Salary
We set base salaries for executive officers so that they approximate the median salaries of comparable executives in our peer group. We adjust base salaries when warranted by an individual’s experience and performance, and when our market surveys or other similar information show that base salaries within the peergroup are being adjusted. In line with this approach, Mr. Long’s base salary was adjusted from $700,000 to$750,000 in July 2005.
Cash Bonus Incentives
We award annual cash bonus incentives under the Performance Award and Cash Bonus Plan. The amountof an executive’s bonus opportunity, which is expressed as a percentage of base salary, depends primarily upon thatindividual’s position and responsibilities and bonus opportunities provided to comparable positions within our peer group. At the beginning of each year, the committee reviews and approves annual performance goals. Shortly after the end of the year, the committee determines the appropriate bonus payout levels based on the degree to whichthese goals have been achieved. The cash bonus incentive program is designed to pay total annual cash compensation, which is base salary plus cash bonus, above the median of our peer group when we meet substantially all of the goals established for an executive’s bonus opportunity. Similarly, when these goals are not achieved, the program is intended to result in total annual cash compensation below the median of our peer group. The committee also has the discretion to award performance-based cash bonuses under our Long-Term Incentive Plan.
The committee determined that the payout for an executive’s 2005 bonus opportunity was to be based on the level of achievement of Company-wide financial goals and specific corporate goals, as described below. In order to emphasize the importance of operational performance during 2005, the weighting on the financial goal wasreduced to 30% from 50% and the weighting on the corporate goals was increased to 70% from 50%. For 2005,bonus opportunities ranged from 30% to 90% of base pay. The actual percentage payment can range from 0% to
15
200% of the bonus opportunity. The overall bonus payout was also subject to the application of a reduction factorbased on our cash flow return on market capitalization (“CFROMC”), the effect of which can reduce the bonuspayment by 0 to 50%. The committee may also use its discretion to adjust payments downward from these amounts or to make additional cash bonus awards beyond the bonus opportunity to recognize exceptional individualperformance or to take account of other factors.
The financial goals included in the 2005 bonus program under our Performance Award and Cash Bonus Plan for executive officers were our 2005 earnings per share (“EPS”), relative to a return on equity target, and our cash flow return on capital (“CFROC”) compared to a group of companies within our peer group. The corporate goals for all executives included in the 2005 bonus program included safety, fleet downtime, marketing, humanresource development, and cost containment. The committee met in December 2005 and February 2006 to reviewthe EPS and CFROC performance and the attainment of the corporate goals and objectives for the year 2005. Based on this review and in light of the Company’s overall performance during 2005, the committee determined that Mr. Long would receive a bonus of $750,000, which represented 115% of his 2005 bonus opportunity under our Performance Award Cash Bonus Plan.
The committee has determined that the payout for an executive’s 2006 bonus opportunity would similarly be based on the level of achievement of Company-wide financial goals and corporate goals. For 2006, the weightingon the financial goals has been restored to its historical 50% (from 30% in 2005), with the corporate goalscomprising the remaining 50% (from 70% in 2005). Bonus opportunities currently range from 30% to 90% of base pay. The committee will consider adjusting individual bonus opportunities during the annual review of executive compensation. The actual percentage payment can range from 0% to 200% of the bonus opportunity, depending on the committee’s evaluation of performance against these goals. For 2006, the CFROMC factor has been modified tobetter align the interests of executives with those of our shareholders. As in 2005, the CFROMC factor can reduce the overall bonus payout by up to 50%. Additionally, in the event that CFROMC exceeds a threshold target, overallbonus payouts can be increased by up to 50%.
The financial goals included in the 2006 bonus program under our Performance Award and Cash Bonus Plan for executives are our 2006 EPS as determined by return on equity targets and CFROC compared to a group ofcompanies within our peer group. The basis for our EPS objective is a long-term target, established several years ago, of 11% cash flow return on equity. The Company’s ability to meet this return target is heavily influenced byindustry and market conditions. In a depressed market, it is unlikely that the Company would be able to meet this 11% return target; conversely, under favorable industry conditions, it is possible for the Company to significantlyexceed this target. The corporate goals for all executives included in the 2006 bonus program include goals related to safety, project execution, and human resource development.
Long–Term Incentives: Stock Options, Contingent Stock Options and Contingent Restricted Stock
Our program for the earning of equity awards by executives is administered such that the annual awardsgranted under the program are entirely contingent on performance goals which significantly improves our ability to align the interests of management with those of our shareholders. We also occasionally grant non-contingent special awards to recognize individual performance. The program rewards executives for the attainment of a totalshareholder return (“TSR”) and a cash flow return on capital that ranks favorably within our peer group. In yearsprior to 2003, we principally granted time-vested stock options to our executives as long-term equity incentives and occasionally granted time-vested restricted stock awards when specific results were achieved. In an effort to further align executive and shareholder interests, beginning in 2003 we fundamentally changed our equity awards throughthe granting of contingent stock options and contingent restricted stock, the attainment of which is based onCompany performance.
The committee currently intends to administer the long-term equity incentive program through annualgrants of these contingent stock options, contingent restricted shares or contingent deferred units to designatedexecutives. Performance goals and maximum grant parameters are established by the committee in the first quarterof the year. The committee may also make special awards including non-contingent awards to individual executivesduring the year on a discretionary basis. The peer group of companies used to measure our relative TSR consists of 15 publicly traded companies with a focus on contract drilling and oilfield services. The peer group of companies used to measure our relative CFROC rank is a more narrowly defined group of 10 companies composed primarily of
16
contract drillers. Pursuant to the previously established performance goals and award parameters, in July 2005, the committee made grants of contingent stock options and contingent restricted stock to executives, including Mr. Long, in order to further the goal of aligning the executives’ interests with those of our shareholders and toencourage management continuity. No non-contingent time-vested stock option awards were granted in 2005.
Each executive is given a target grant opportunity based on the executive’s individual position and compensation survey data of our peer group. Each executive is granted a combination of contingent stock optionsand contingent restricted shares or contingent deferred units that in total combined value approximate 1.75 times the median for comparable positions in our peer group. The committee has discretion to grant more or fewer of suchawards. The actual awards earned are based upon a two-year performance period at the end of which the number ofcontingent shares/deferred units received and/or options retained is determined based on the Company’sperformance relative to peer groups using TSR and CFROC rankings. In general terms, performance resulting in thenumber one position of the relevant peer groups for both measures results in the executive retaining all of the contingent options and receiving all of the contingent restricted shares. Conversely, performance generally within the approximate bottom third results in all contingent options being forfeited and no restricted stock/deferred unitsbeing received. Performance between these limits results in partial retention of the contingent options and partial receipt of the restricted stock/deferred units. One-third of the earned award vests at the end of the performance period (year 2), with the remainder vesting in years 3 and 4. For the two-year performance period which ended onDecember 31, 2004, the Company ranked fourth out of 15 in the TSR peer group and fourth out of 10 in the CFROCpeer group, which resulted in Mr. Long retaining 74% of the contingent options and receiving 74% of the restrictedshares which were the subject of his contingent, performance-based grant awarded in July 2003.
Based upon the above guidelines, in July 2005, we granted Mr. Long 104,027 contingent options topurchase ordinary shares at an exercise price of $56.34 and 58,411 contingent restricted shares. Both the contingent option and contingent restricted share grants are subject to a two-year performance period ending December 31, 2006, at which time the determination of how many, if any, of these options will be retained and shares received by Mr. Long will be made on the basis of TSR and CFROC performance relative to peer groups.
Stock Ownership Guidelines
The committee believes that it is important for our executives to build and maintain a significant minimum equity stake in our Company and that these ownership requirements should be an integral part of our performance-based incentive program. Our ownership policy for executives is based on the restricted shares awarded under the Long-Term Incentive Plan beginning with the 2003 grants. In order to sell any of these shares of the Company, our ownership policy requires executives to hold and maintain after the sale vested shares with a value equal to orgreater than the following:
• our Chief Executive Officer — five times annual base salary;
• an Executive or Senior Vice President — three times annual base salary;
• a Vice President — two times annual base salary.
Executives are given a period in which to accumulate the required amount of stock. During this period, the amount of stock an executive must hold will be no less than the number of shares which have been granted, earned and vested since 2003 under the Long-Term Incentive Plan. Should the share price later decline whereby an executive falls below the required value threshold, the executive is precluded from further sales of restricted shares granted under the program until such time as the executive again meets the ownership requirements. Compliancewith this policy by each executive is reviewed by the committee on an annual basis, and the committee will consider the size of and/or eligibility for any future awards to any executive found to have knowingly violated the policy.
For a discussion of our stock ownership guidelines for our directors, see “—Corporate Governance.”
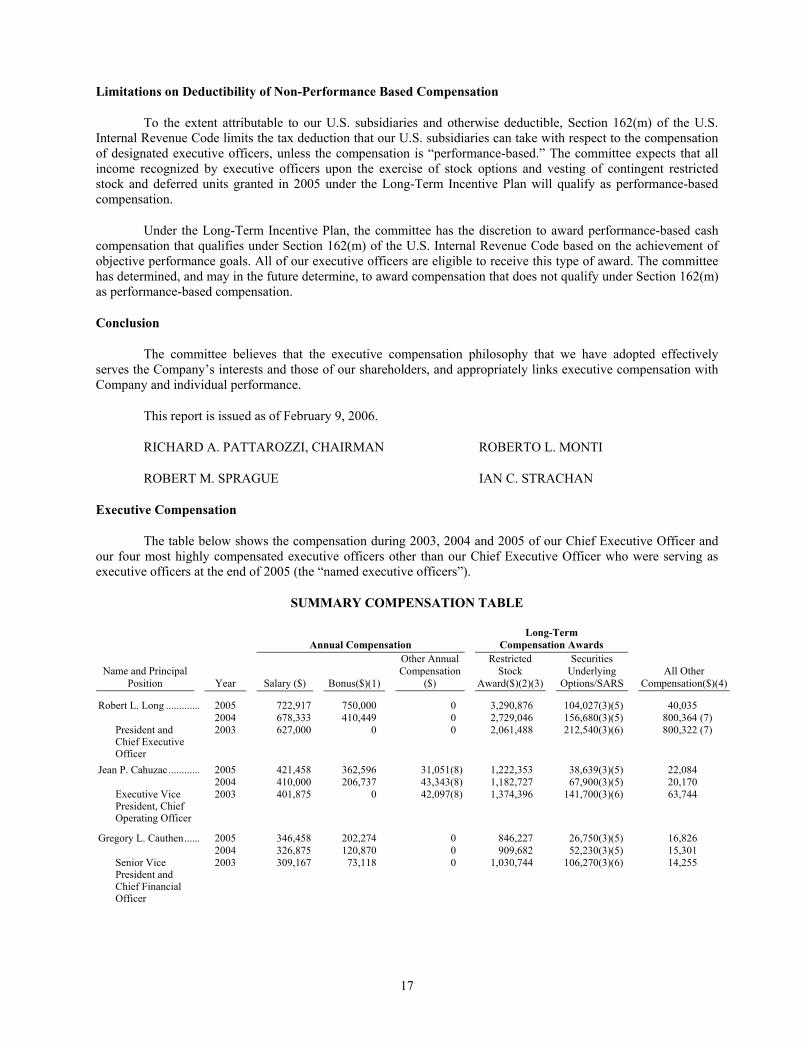
17
Limitations on Deductibility of Non-Performance Based Compensation
To the extent attributable to our U.S. subsidiaries and otherwise deductible, Section 162(m) of the U.S. Internal Revenue Code limits the tax deduction that our U.S. subsidiaries can take with respect to the compensationof designated executive officers, unless the compensation is “performance-based.” The committee expects that all income recognized by executive officers upon the exercise of stock options and vesting of contingent restrictedstock and deferred units granted in 2005 under the Long-Term Incentive Plan will qualify as performance-basedcompensation.
Under the Long-Term Incentive Plan, the committee has the discretion to award performance-based cashcompensation that qualifies under Section 162(m) of the U.S. Internal Revenue Code based on the achievement ofobjective performance goals. All of our executive officers are eligible to receive this type of award. The committeehas determined, and may in the future determine, to award compensation that does not qualify under Section 162(m)as performance-based compensation.
Conclusion
The committee believes that the executive compensation philosophy that we have adopted effectivelyserves the Company’s interests and those of our shareholders, and appropriately links executive compensation with Company and individual performance.
This report is issued as of February 9, 2006.
RICHARD A. PATTAROZZI, CHAIRMAN ROBERTO L. MONTI
ROBERT M. SPRAGUE IAN C. STRACHAN
Executive Compensation
The table below shows the compensation during 2003, 2004 and 2005 of our Chief Executive Officer and our four most highly compensated executive officers other than our Chief Executive Officer who were serving as executive officers at the end of 2005 (the “named executive officers”).
SUMMARY COMPENSATION TABLE
Annual Compensation Long-Term
Compensation Awards
Name and Principal Position Year Salary ($) Bonus($)(1)
Other Annual Compensation
($)
Restricted Stock
Award($)(2)(3)
Securities Underlying
Options/SARS All Other
Compensation($)(4)
Robert L. Long ............. 2005 722,917 750,000 0 3,290,876 104,027(3)(5) 40,035 2004 678,333 410,449 0 2,729,046 156,680(3)(5) 800,364 (7) President and
Chief Executive Officer
2003 627,000 0 0 2,061,488 212,540(3)(6) 800,322 (7)
Jean P. Cahuzac............ 2005 421,458 362,596 31,051(8) 1,222,353 38,639(3)(5) 22,084 2004 410,000 206,737 43,343(8) 1,182,727 67,900(3)(5) 20,170 Executive Vice
President, Chief Operating Officer
2003 401,875 0 42,097(8) 1,374,396 141,700(3)(6) 63,744
Gregory L. Cauthen...... 2005 346,458 202,274 0 846,227 26,750(3)(5) 16,826 2004 326,875 120,870 0 909,682 52,230(3)(5) 15,301 Senior Vice
President and Chief Financial Officer
2003 309,167 73,118 0 1,030,744 106,270(3)(6) 14,255
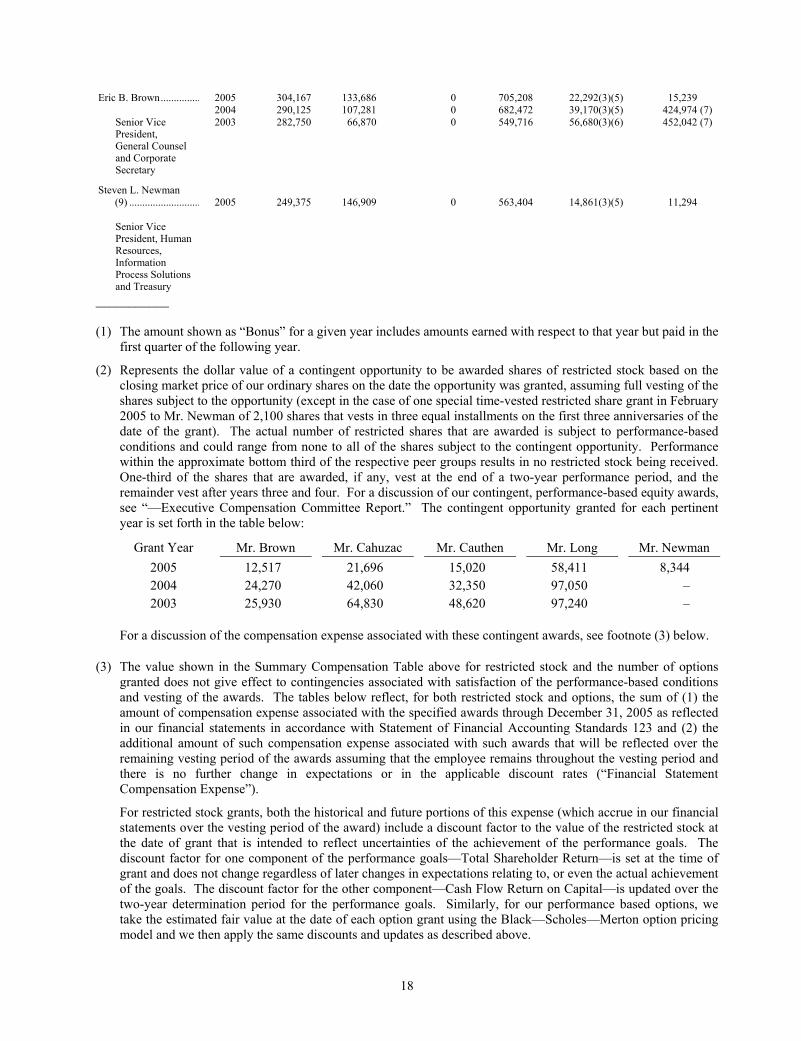
18
Eric B. Brown............... 2005 304,167 133,686 0 705,208 22,292(3)(5) 15,239 2004 290,125 107,281 0 682,472 39,170(3)(5) 424,974 (7) Senior Vice
President, General Counsel and Corporate Secretary
2003 282,750 66,870 0 549,716 56,680(3)(6) 452,042 (7)
Steven L. Newman(9) ........................... 2005 249,375 146,909 0 563,404 14,861(3)(5) 11,294
Senior Vice President, Human Resources,Information Process Solutions and Treasury
___________
(1) The amount shown as “Bonus” for a given year includes amounts earned with respect to that year but paid in the first quarter of the following year.
(2) Represents the dollar value of a contingent opportunity to be awarded shares of restricted stock based on the closing market price of our ordinary shares on the date the opportunity was granted, assuming full vesting of the shares subject to the opportunity (except in the case of one special time-vested restricted share grant in February 2005 to Mr. Newman of 2,100 shares that vests in three equal installments on the first three anniversaries of the date of the grant). The actual number of restricted shares that are awarded is subject to performance-based conditions and could range from none to all of the shares subject to the contingent opportunity. Performance within the approximate bottom third of the respective peer groups results in no restricted stock being received. One-third of the shares that are awarded, if any, vest at the end of a two-year performance period, and the remainder vest after years three and four. For a discussion of our contingent, performance-based equity awards,see “—Executive Compensation Committee Report.” The contingent opportunity granted for each pertinent year is set forth in the table below:
Grant Year Mr. Brown Mr. Cahuzac Mr. Cauthen Mr. Long Mr. Newman 2005 12,517 21,696 15,020 58,411 8,3442004 24,270 42,060 32,350 97,050 –2003 25,930 64,830 48,620 97,240 –
For a discussion of the compensation expense associated with these contingent awards, see footnote (3) below.
(3) The value shown in the Summary Compensation Table above for restricted stock and the number of options granted does not give effect to contingencies associated with satisfaction of the performance-based conditions and vesting of the awards. The tables below reflect, for both restricted stock and options, the sum of (1) the amount of compensation expense associated with the specified awards through December 31, 2005 as reflected in our financial statements in accordance with Statement of Financial Accounting Standards 123 and (2) the additional amount of such compensation expense associated with such awards that will be reflected over the remaining vesting period of the awards assuming that the employee remains throughout the vesting period and there is no further change in expectations or in the applicable discount rates (“Financial StatementCompensation Expense”).
For restricted stock grants, both the historical and future portions of this expense (which accrue in our financialstatements over the vesting period of the award) include a discount factor to the value of the restricted stock at the date of grant that is intended to reflect uncertainties of the achievement of the performance goals. The discount factor for one component of the performance goals—Total Shareholder Return—is set at the time ofgrant and does not change regardless of later changes in expectations relating to, or even the actual achievement of the goals. The discount factor for the other component—Cash Flow Return on Capital—is updated over thetwo-year determination period for the performance goals. Similarly, for our performance based options, we take the estimated fair value at the date of each option grant using the Black—Scholes—Merton option pricing model and we then apply the same discounts and updates as described above.
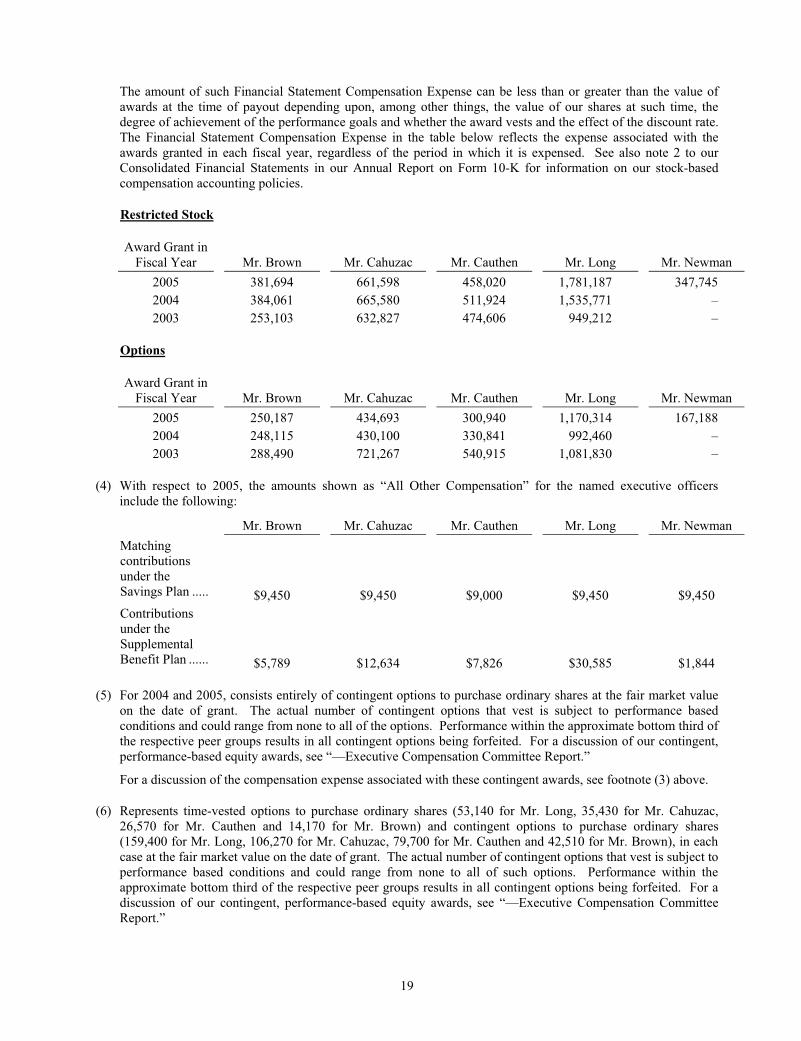
19
The amount of such Financial Statement Compensation Expense can be less than or greater than the value of
awards at the time of payout depending upon, among other things, the value of our shares at such time, the
degree of achievement of the performance goals and whether the award vests and the effect of the discount rate.
The Financial Statement Compensation Expense in the table below reflects the expense associated with the
awards granted in each fiscal year, regardless of the period in which it is expensed. See also note 2 to our
Consolidated Financial Statements in our Annual Report on Form 10-K for information on our stock-based
compensation accounting policies.
Restricted Stock
Award Grant in
Fiscal Year Mr. Brown Mr. Cahuzac Mr. Cauthen Mr. Long Mr. Newman
2005 381,694 661,598 458,020 1,781,187 347,745
2004 384,061 665,580 511,924 1,535,771 –
2003 253,103 632,827 474,606 949,212 –
Options
Award Grant in
Fiscal Year Mr. Brown Mr. Cahuzac Mr. Cauthen Mr. Long Mr. Newman
2005 250,187 434,693 300,940 1,170,314 167,188
2004 248,115 430,100 330,841 992,460 –
2003 288,490 721,267 540,915 1,081,830 –
(4) With respect to 2005, the amounts shown as “All Other Compensation” for the named executive officers
include the following:
Mr. Brown Mr. Cahuzac Mr. Cauthen Mr. Long Mr. Newman
Matching
contributions
under the
Savings Plan ..... $9,450 $9,450 $9,000 $9,450 $9,450
Contributions
under the
Supplemental
Benefit Plan ...... $5,789 $12,634 $7,826 $30,585 $1,844
(5) For 2004 and 2005, consists entirely of contingent options to purchase ordinary shares at the fair market value
on the date of grant. The actual number of contingent options that vest is subject to performance based
conditions and could range from none to all of the options. Performance within the approximate bottom third of
the respective peer groups results in all contingent options being forfeited. For a discussion of our contingent,
performance-based equity awards, see “—Executive Compensation Committee Report.”
For a discussion of the compensation expense associated with these contingent awards, see footnote (3) above.
(6) Represents time-vested options to purchase ordinary shares (53,140 for Mr. Long, 35,430 for Mr. Cahuzac,
26,570 for Mr. Cauthen and 14,170 for Mr. Brown) and contingent options to purchase ordinary shares
(159,400 for Mr. Long, 106,270 for Mr. Cahuzac, 79,700 for Mr. Cauthen and 42,510 for Mr. Brown), in each
case at the fair market value on the date of grant. The actual number of contingent options that vest is subject to
performance based conditions and could range from none to all of such options. Performance within the
approximate bottom third of the respective peer groups results in all contingent options being forfeited. For a
discussion of our contingent, performance-based equity awards, see “—Executive Compensation Committee
Report.”
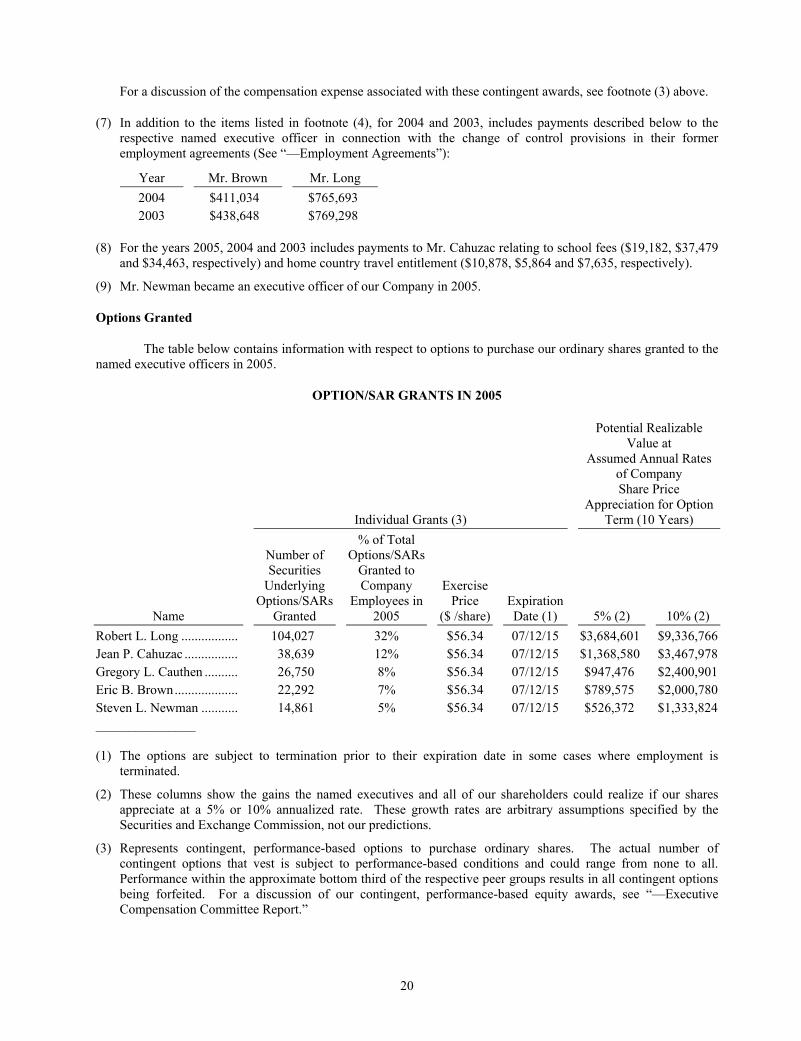
20
For a discussion of the compensation expense associated with these contingent awards, see footnote (3) above.
(7) In addition to the items listed in footnote (4), for 2004 and 2003, includes payments described below to the respective named executive officer in connection with the change of control provisions in their former employment agreements (See “—Employment Agreements”):
Year Mr. Brown Mr. Long 2004 $411,034 $765,6932003 $438,648 $769,298
(8) For the years 2005, 2004 and 2003 includes payments to Mr. Cahuzac relating to school fees ($19,182, $37,479and $34,463, respectively) and home country travel entitlement ($10,878, $5,864 and $7,635, respectively).
(9) Mr. Newman became an executive officer of our Company in 2005.
Options Granted
The table below contains information with respect to options to purchase our ordinary shares granted to thenamed executive officers in 2005.
OPTION/SAR GRANTS IN 2005
Individual Grants (3)
Potential Realizable Value at
Assumed Annual Rates of CompanyShare Price
Appreciation for Option Term (10 Years)
Name
Number ofSecurities
Underlying Options/SARs
Granted
% of Total Options/SARs
Granted toCompany
Employees in2005
ExercisePrice
($ /share) Expiration Date (1) 5% (2) 10% (2)
Robert L. Long ................. 104,027 32% $56.34 07/12/15 $3,684,601 $9,336,766 Jean P. Cahuzac ................ 38,639 12% $56.34 07/12/15 $1,368,580 $3,467,978 Gregory L. Cauthen .......... 26,750 8% $56.34 07/12/15 $947,476 $2,400,901 Eric B. Brown................... 22,292 7% $56.34 07/12/15 $789,575 $2,000,780 Steven L. Newman ........... 14,861 5% $56.34 07/12/15 $526,372 $1,333,824 _______________
(1) The options are subject to termination prior to their expiration date in some cases where employment isterminated.
(2) These columns show the gains the named executives and all of our shareholders could realize if our sharesappreciate at a 5% or 10% annualized rate. These growth rates are arbitrary assumptions specified by theSecurities and Exchange Commission, not our predictions.
(3) Represents contingent, performance-based options to purchase ordinary shares. The actual number ofcontingent options that vest is subject to performance-based conditions and could range from none to all.Performance within the approximate bottom third of the respective peer groups results in all contingent optionsbeing forfeited. For a discussion of our contingent, performance-based equity awards, see “—ExecutiveCompensation Committee Report.”
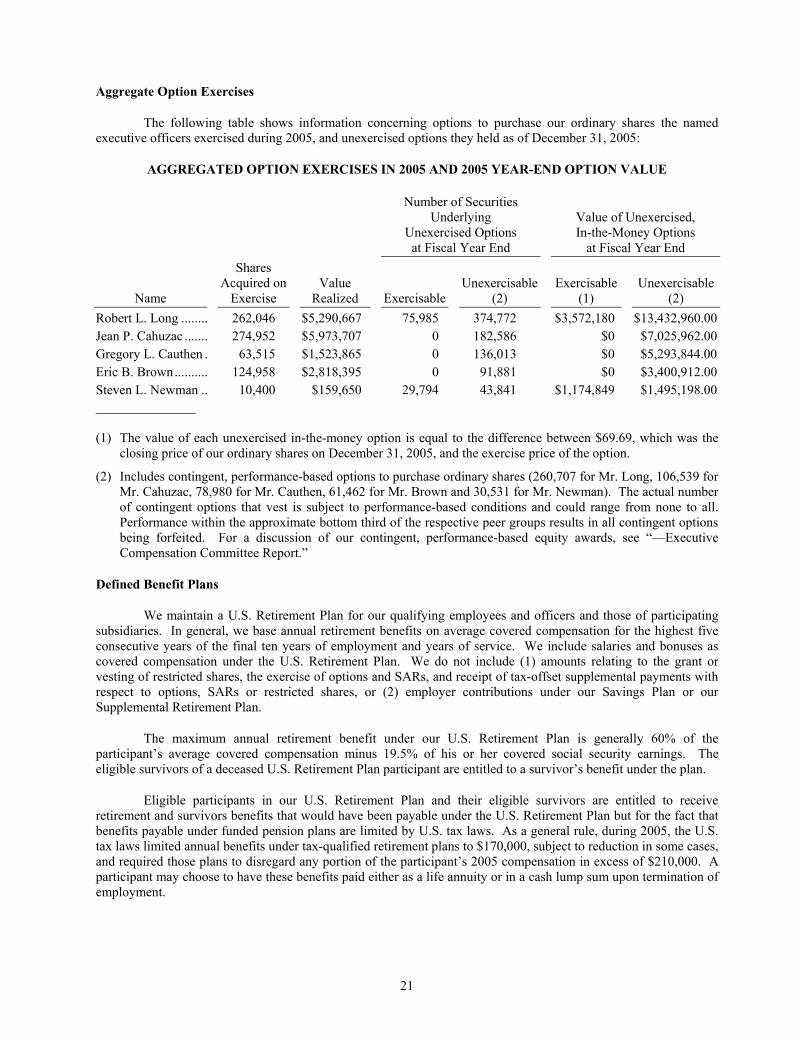
21
Aggregate Option Exercises
The following table shows information concerning options to purchase our ordinary shares the namedexecutive officers exercised during 2005, and unexercised options they held as of December 31, 2005:
AGGREGATED OPTION EXERCISES IN 2005 AND 2005 YEAR-END OPTION VALUE
Number of Securities Underlying
Unexercised Optionsat Fiscal Year End
Value of Unexercised, In-the-Money Options
at Fiscal Year End
Name
Shares Acquired on
Exercise Value
Realized Exercisable Unexercisable
(2) Exercisable
(1) Unexercisable
(2) Robert L. Long ........ 262,046 $5,290,667 75,985 374,772 $3,572,180 $13,432,960.00 Jean P. Cahuzac ....... 274,952 $5,973,707 0 182,586 $0 $7,025,962.00 Gregory L. Cauthen . 63,515 $1,523,865 0 136,013 $0 $5,293,844.00 Eric B. Brown.......... 124,958 $2,818,395 0 91,881 $0 $3,400,912.00 Steven L. Newman .. 10,400 $159,650 29,794 43,841 $1,174,849 $1,495,198.00_______________
(1) The value of each unexercised in-the-money option is equal to the difference between $69.69, which was theclosing price of our ordinary shares on December 31, 2005, and the exercise price of the option.
(2) Includes contingent, performance-based options to purchase ordinary shares (260,707 for Mr. Long, 106,539 forMr. Cahuzac, 78,980 for Mr. Cauthen, 61,462 for Mr. Brown and 30,531 for Mr. Newman). The actual number of contingent options that vest is subject to performance-based conditions and could range from none to all. Performance within the approximate bottom third of the respective peer groups results in all contingent optionsbeing forfeited. For a discussion of our contingent, performance-based equity awards, see “—ExecutiveCompensation Committee Report.”
Defined Benefit Plans
We maintain a U.S. Retirement Plan for our qualifying employees and officers and those of participatingsubsidiaries. In general, we base annual retirement benefits on average covered compensation for the highest five consecutive years of the final ten years of employment and years of service. We include salaries and bonuses as covered compensation under the U.S. Retirement Plan. We do not include (1) amounts relating to the grant orvesting of restricted shares, the exercise of options and SARs, and receipt of tax-offset supplemental payments with respect to options, SARs or restricted shares, or (2) employer contributions under our Savings Plan or our Supplemental Retirement Plan.
The maximum annual retirement benefit under our U.S. Retirement Plan is generally 60% of the participant’s average covered compensation minus 19.5% of his or her covered social security earnings. Theeligible survivors of a deceased U.S. Retirement Plan participant are entitled to a survivor’s benefit under the plan.
Eligible participants in our U.S. Retirement Plan and their eligible survivors are entitled to receive retirement and survivors benefits that would have been payable under the U.S. Retirement Plan but for the fact thatbenefits payable under funded pension plans are limited by U.S. tax laws. As a general rule, during 2005, the U.S.tax laws limited annual benefits under tax-qualified retirement plans to $170,000, subject to reduction in some cases,and required those plans to disregard any portion of the participant’s 2005 compensation in excess of $210,000. Aparticipant may choose to have these benefits paid either as a life annuity or in a cash lump sum upon termination ofemployment.
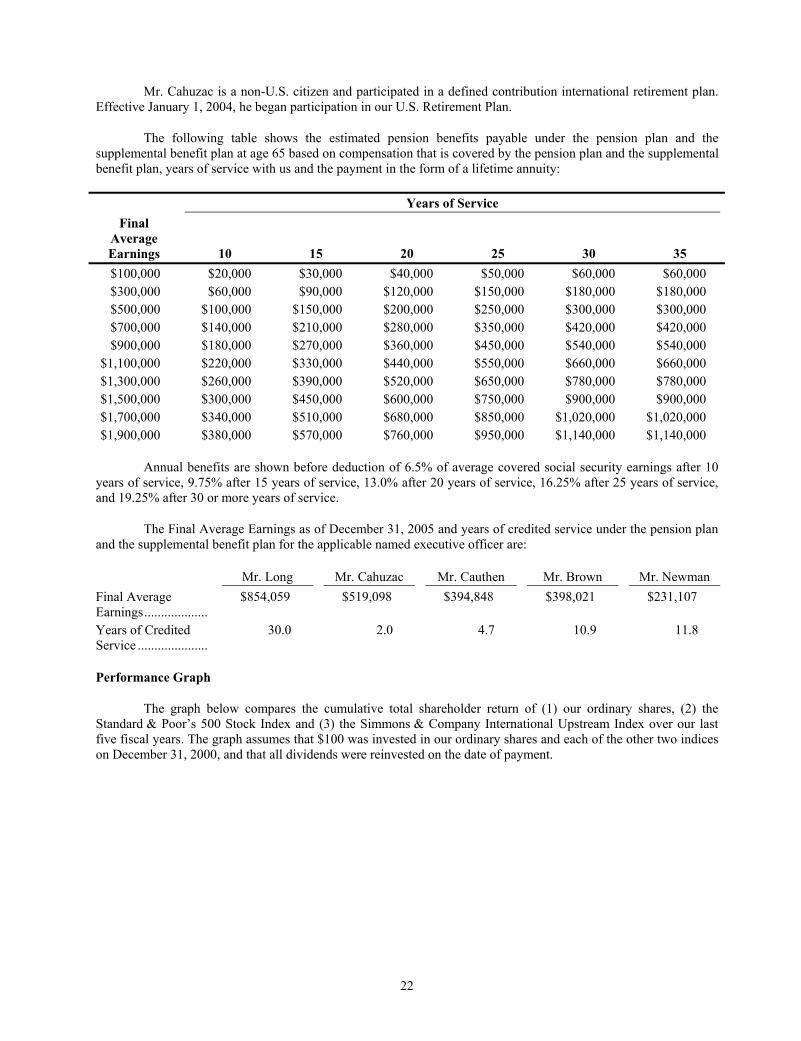
22
Mr. Cahuzac is a non-U.S. citizen and participated in a defined contribution international retirement plan. Effective January 1, 2004, he began participation in our U.S. Retirement Plan.
The following table shows the estimated pension benefits payable under the pension plan and thesupplemental benefit plan at age 65 based on compensation that is covered by the pension plan and the supplementalbenefit plan, years of service with us and the payment in the form of a lifetime annuity:
Years of Service
Final Average Earnings 10 15 20 25 30 35
$100,000 $20,000 $30,000 $40,000 $50,000 $60,000 $60,000 $300,000 $60,000 $90,000 $120,000 $150,000 $180,000 $180,000$500,000 $100,000 $150,000 $200,000 $250,000 $300,000 $300,000$700,000 $140,000 $210,000 $280,000 $350,000 $420,000 $420,000$900,000 $180,000 $270,000 $360,000 $450,000 $540,000 $540,000
$1,100,000 $220,000 $330,000 $440,000 $550,000 $660,000 $660,000$1,300,000 $260,000 $390,000 $520,000 $650,000 $780,000 $780,000$1,500,000 $300,000 $450,000 $600,000 $750,000 $900,000 $900,000$1,700,000 $340,000 $510,000 $680,000 $850,000 $1,020,000 $1,020,000$1,900,000 $380,000 $570,000 $760,000 $950,000 $1,140,000 $1,140,000
Annual benefits are shown before deduction of 6.5% of average covered social security earnings after 10years of service, 9.75% after 15 years of service, 13.0% after 20 years of service, 16.25% after 25 years of service, and 19.25% after 30 or more years of service.
The Final Average Earnings as of December 31, 2005 and years of credited service under the pension plan and the supplemental benefit plan for the applicable named executive officer are:
Mr. Long Mr. Cahuzac Mr. Cauthen Mr. Brown Mr. Newman Final Average Earnings...................
$854,059 $519,098 $394,848 $398,021 $231,107
Years of Credited Service .....................
30.0 2.0 4.7 10.9 11.8
Performance Graph
The graph below compares the cumulative total shareholder return of (1) our ordinary shares, (2) the Standard & Poor’s 500 Stock Index and (3) the Simmons & Company International Upstream Index over our lastfive fiscal years. The graph assumes that $100 was invested in our ordinary shares and each of the other two indices on December 31, 2000, and that all dividends were reinvested on the date of payment.
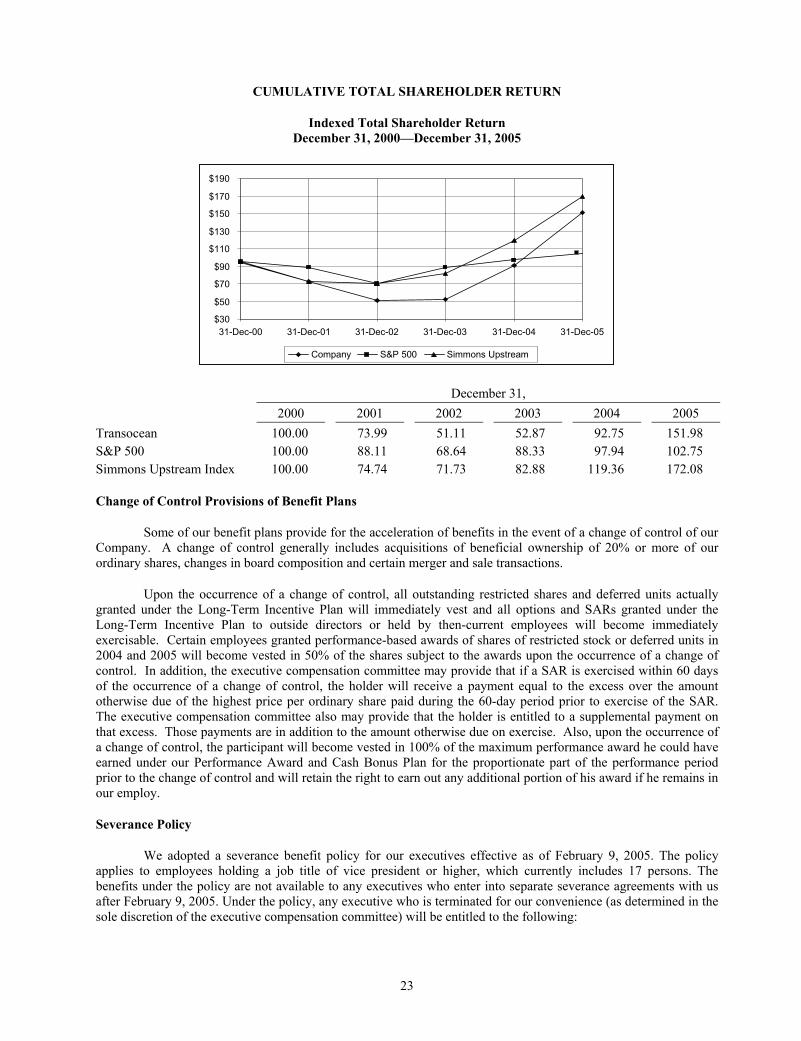
23
CUMULATIVE TOTAL SHAREHOLDER RETURN
Indexed Total Shareholder Return December 31, 2000—December 31, 2005
December 31, 2000 2001 2002 2003 2004 2005
Transocean 100.00 73.99 51.11 52.87 92.75 151.98S&P 500 100.00 88.11 68.64 88.33 97.94 102.75Simmons Upstream Index 100.00 74.74 71.73 82.88 119.36 172.08
Change of Control Provisions of Benefit Plans
Some of our benefit plans provide for the acceleration of benefits in the event of a change of control of our Company. A change of control generally includes acquisitions of beneficial ownership of 20% or more of ourordinary shares, changes in board composition and certain merger and sale transactions.
Upon the occurrence of a change of control, all outstanding restricted shares and deferred units actuallygranted under the Long-Term Incentive Plan will immediately vest and all options and SARs granted under the Long-Term Incentive Plan to outside directors or held by then-current employees will become immediately exercisable. Certain employees granted performance-based awards of shares of restricted stock or deferred units in2004 and 2005 will become vested in 50% of the shares subject to the awards upon the occurrence of a change of control. In addition, the executive compensation committee may provide that if a SAR is exercised within 60 days of the occurrence of a change of control, the holder will receive a payment equal to the excess over the amount otherwise due of the highest price per ordinary share paid during the 60-day period prior to exercise of the SAR.The executive compensation committee also may provide that the holder is entitled to a supplemental payment onthat excess. Those payments are in addition to the amount otherwise due on exercise. Also, upon the occurrence ofa change of control, the participant will become vested in 100% of the maximum performance award he could haveearned under our Performance Award and Cash Bonus Plan for the proportionate part of the performance periodprior to the change of control and will retain the right to earn out any additional portion of his award if he remains inour employ.
Severance Policy
We adopted a severance benefit policy for our executives effective as of February 9, 2005. The policyapplies to employees holding a job title of vice president or higher, which currently includes 17 persons. The benefits under the policy are not available to any executives who enter into separate severance agreements with usafter February 9, 2005. Under the policy, any executive who is terminated for our convenience (as determined in thesole discretion of the executive compensation committee) will be entitled to the following:
$30
$50
$70
$90
$110
$130
$150
$170
$190
31-Dec-00 31-Dec-01 31-Dec-02 31-Dec-03 31-Dec-04 31-Dec-05
Company S&P 500 Simmons Upstream
24
• a cash payment for his base salary up to the date of termination;
• a cash payment of a pro rata share of his bonus opportunity up to the date of termination at the thenprojected year-end rate of payout, in an amount, if any, determined by the Executive Compensation Committee in its sole discretion;
• a cash payment equal to his annual base salary in effect at the date of termination; and
• certain outplacement services not to exceed a cost to us of 5% of the base annual salary of theexecutive.
An executive is required to sign a release in favor of Transocean in order to receive benefits under the policy.
Any executive terminated under the provisions of this policy will also be deemed to have been terminated for our convenience for purposes of any awards under our long-term incentive plan. Currently, our performance-based option awards and our contingent restricted ordinary share awards provide that a holder of an award who isterminated for our convenience before the end of a performance period will be granted a pro rata share of the total potential award to the date of termination, and our time-vested equity awards provide all unvested time-vested awards vest in the event the participant is terminated for our convenience.
Executive Change of Control Severance Policy
Effective as of July 15, 2005, we also established an executive change of control severance benefit policyfor executives who are designated by the board. The policy provides for severance benefits to designated executiveswho, within 24 months after a change of control are terminated for other than cause or who leave for good reason. The board designated Mr. Long, Mr. Brown, Mr. Cahuzac and Mr. Cauthen as being eligible to receive benefitsunder the policy. Executives entitled to benefits under this policy are not entitled to benefits under the severance benefit policy described above.
Under the policy, a designated executive who is subject to termination described in the prior paragraph will be entitled to the following:
• a cash payment for his base salary up to the date of termination;
• a cash payment of a pro rata share of his bonus opportunity up to the date of termination at the thenprojected year-end rate of payout, in an amount, if any, determined by the executive compensation committee of the board of directors in its sole discretion;
• a cash severance payment equal to 2.99 times the sum of (a) the base salary of the executive calculated using the higher of the annual base salary in effect at the time of termination of employment or that ineffect on the date of the change of control and (b) any target bonus at the 100% level for which theexecutive is eligible for the fiscal year in which termination occurs;
• certain outplacement services not to exceed a cost to us of 5% of the base annual salary of theexecutive used to determine the severance payment described in the bullet above; and
• certain gross-up payments for any applicable excise tax such that the net amount received would be thesame as without the application of the excise tax, subject to specified limits described in the policy.
A designated executive who is subject to such a termination will also be deemed to have been terminated for our convenience for purposes of any awards under our long-term incentive plan. Currently, our performance-based option awards and our contingent restricted ordinary share awards provide that a holder of an award who isterminated for our convenience before the end of a performance period will be granted a pro rata share of the total potential award to the date of termination. Any such executive will further be assumed to have three additional years of age and service credits for the purposes of our supplemental retirement plan.
25
Employment Agreements
During September and October 2000, we entered into agreements with some of our executive officers, including Messrs. Long and Brown. These agreements replaced agreements entered into prior to the Sedco Forex merger. The prior agreements provided that the occurrence of a change in control triggered employment agreementswhich contained provisions that allowed executives to leave for any reason during a specified period following thechange of control and receive the payments defined in the employment agreements, which generally guaranteed aminimum salary and bonus for a period of three years. The Sedco Forex merger triggered these provisions, and as aresult, the executives could have left for any reason during January 2001 and received the payments under the employment agreements. In order to induce the executives to remove such right and remain with our Company, we offered the executives either (a) a cash payment equivalent to the amount otherwise due under the employmentagreement as if the executive left in January 2001 to be vested and paid, with interest, over a three year period inequal annual installments commencing January 2002, in exchange for termination of the employment agreement (such amounts would become payable if the executive remained employed, and would become payable in a lumpsum if the executive’s termination occurred due to death, disability or termination without cause, or due to certain reductions in authority or base salary), or (b) an extension of the existing employment agreement for three yearsbeyond the current one month trigger period with a first term of 18 months during which the employee commits toremain with our Company, followed by an additional term of 18 months (commencing July 1, 2002) during whichthe employee can self trigger the payment rights to predetermined amounts, with interest, under the employmentagreement by terminating his or her employment. Mr. Brown entered into an agreement described in clause (a) ofthe foregoing sentence, and Mr. Long entered into the agreement described in clause (b) of the foregoing sentence.None of the replacement agreements contain change of control provisions. The agreement with Mr. Long providedthat in the event the payments called for under the agreement would subject Mr. Long to an excise tax under Section 4999 of the U.S. Internal Revenue Code, he will be entitled to receive an additional “gross-up” payment in somecircumstances.
Mr. Brown received payments of $466,263, $438,648 and $411,034 in 2002, 2003 and 2004, respectively, under the provisions described in the preceding paragraph.
In May 2002, Mr. Long entered into an agreement revoking his employment agreement described above, which had provided him a right to leave for any reason and receive his change of control payments. The new agreement provided for a cash payment of $2,142,756 to be vested and paid, with interest, over a three year periodin equal annual installments beginning June 1, 2002. The amount of this payment was approximately equal to the amount Mr. Long would have been entitled to receive under his employment agreement if his employment had been terminated in January 2001.
All scheduled payments have now been made under these agreements to Messrs. Long and Brown, andnone of these individuals is a party to any other employment agreement with us. None of Messrs. Cahuzac, Cauthenor Newman is a party to an employment agreement with us.
The charter of the executive compensation committee has now been changed to prohibit “single-trigger”change of control employment agreements that are triggered solely by a change of control.
Compensation Committee Interlocks and Insider Participation
The members of the executive compensation committee of the board of directors during the last completedfiscal year were Mr. Pattarozzi, Chairman and Messrs. Monti, Sprague and Strachan. There are no matters relatingto interlocks or insider participation that we are required to report.
CERTAIN TRANSACTIONS
We own a 50 percent interest in an unconsolidated joint venture company, Overseas Drilling Limited (“ODL”), which owns the drillship Joides Resolution. Siem Offshore Inc. owns the other 50 percent interest inODL. Our director, Kristian Siem, is the chairman of Siem Offshore Inc. and is also a director and officer of ODL. We provide operational and management services to ODL, and we earned $1.4 million for these services in 2005.
26
ODL also reimburses us for costs which we incur in connection with these services, and we were reimbursed $5.6 million for these services in 2005. In November 2005, we entered into a loan agreement with ODL under whichODL may grant multiple loans to us at its discretion in amounts up to $8 million. ODL may demand repayment at any time upon five business days prior written notice given to us, and any amount due from ODL may be offsetagainst the loan amount at the time of repayment. ODL distributed dividends of approximately $3.0 million to us in2005. Mr. Siem is also chairman and chief executive officer of Siem Industries, Inc., which owns an approximate 45 percent interest in Siem Offshore Inc.
EQUITY COMPENSATION PLAN INFORMATION
The following table provides information concerning securities authorized for issuance under our equity compensation plans as of December 31, 2005.
Plan Category
Number of securities to beissued upon exercise of
outstanding options,warrants and rights
(a)
Weighted-average exerciseprice of outstanding
options, warrants and rights
(b)
Number of securities remaining available for future issuance under
equity compensation plans(excluding securities
reflected in column (a))(c)
Equity compensation plansapproved by securityholders (1) (2) (3) ............. 7,616,808 $30.09 10,846,912Equity compensation plansnot approved by securityholders (4)......................... — — — Total.................................. 7,616,808 $30.09 10,846,912_____________
(1) Includes 2,864,583 shares to be issued upon exercise of options with a weighted average exercise price of $24.79 that were granted under (a) our Sedco Forex Employees Option Plan in connection with the Sedco Forexmerger, which was approved by our shareholders, and (b) equity compensation plans of R&B Falcon assumed by us in connection with the R&B Falcon merger, which was approved by our shareholders.
(2) In addition to stock options, we are authorized to grant awards of restricted stock and deferred units under our Long-Term Incentive Plan, and 4,280,646 ordinary shares are available for future issuance pursuant to grants ofrestricted stock and deferred units under this plan. As of December 31, 2005, 1,381,107 contingentperformance-based restricted share and deferred unit awards granted in 2004 and 2005 are earnable based on theachievement of certain performance targets.
(3) Includes 1,253,125 contingent, performance-based options granted in 2004 and 2005 that are earnable based onthe achievement of certain performance targets. The actual number of options retained and restricted shares tobe issued will be determined upon completion of the two-year performance period.
(4) Does not include any shares that may be distributed under our deferred compensation plan, which has not beenapproved by our shareholders. Under this plan, our directors could defer any fees or retainers by investing thoseamounts in Transocean ordinary share equivalents or in other investments selected by the administrative committee. Amounts that are invested in the ordinary share equivalents at the time of distribution aredistributed in ordinary shares. As of December 31, 2005, our directors had purchased 36,856 Transocean ordinary share equivalents under this plan. After December 31, 2005, no further deferrals may be made under the plan. Under an amendment to the plan, directors who made deferral elections in 2005 were allowed tocancel their deferral elections and receive ordinary shares with respect to ordinary share equivalents and cash with respect to other investments.

27
SELECTION OF INDEPENDENT REGISTERED PUBLIC ACCOUNTING FIRM
Our audit committee has selected Ernst & Young LLP as our independent registered public accounting firmfor the 2006 calendar year. Ernst & Young LLP served as our independent registered public accounting firm for the 2005 calendar year. Although the selection and appointment of an independent registered public accounting firm isnot required to be submitted to a vote of shareholders, the audit committee recommended that this appointment besubmitted to our shareholders for approval. Approval of our appointment of Ernst & Young LLP to serve as independent registered public accounting firm for the year 2006 requires the affirmative vote of holders of at least amajority of the ordinary shares present in person or by proxy at the meeting and entitled to vote on the matter. If theshareholders do not approve the appointment of Ernst & Young LLP, our audit committee will consider theappointment of another independent registered public accounting firm. A representative of Ernst & Young LLP is expected to be present at the annual general meeting with the opportunity to make a statement if so desired and torespond to appropriate questions.
FEES PAID TO ERNST & YOUNG LLP
Ernst & Young LLP Audit Fees for each of the fiscal years 2005 and 2004 and Audit-Related Fees, TaxFees and Total of All Other Fees for services rendered in 2005 and 2004 are as follows, as described below:
Audit Fees (1) Audit-Related
Fees (2) Tax Fees (3) Total of
All Other Fees (4)
Fiscal year 2005 $4,651,247 $66,748 $1,479,101 $2,250
Fiscal year 2004 $6,506,012 $562,888 $1,984,788 —
_____________
(1) The audit fees include those associated with our annual audit, reviews of our quarterly reports on Form 10-Q,statutory audits of our subsidiaries, services associated with documents filed with the SEC and audit consultations. They include approximately $2.5 million and $4.1 million of fees related to the Section 404 attestation of management reports on internal controls for the fiscal years 2005 and 2004, respectively. The audit fees for fiscal year 2004 have been updated because our proxy statement for our 2005 annual meeting contained certain estimated amounts relating to statutory audits that were not yet completed as of the date ofthat proxy statement. The audit fees for fiscal year 2005 also include certain estimated amounts relating tostatutory audits that are not yet completed.
(2) The audit-related fees include TODCO audits and related accounting consultations until its deconsolidation inDecember 2004, other non-statutory audits of subsidiaries or companies in which we have an investment, otheraccounting consultations and employee benefit plan audits.
(3) Tax fees were for tax preparation, compliance and tax advice. We incurred approximately $0.9 million of tax compliance and preparation fees for each of the years 2005 and 2004.
(4) All other fees were for certain legislative updates.
The audit committee pre-approves all auditing services, review or attest engagements and permitted non-audit services to be performed by our independent registered public accounting firm, subject to some de minimis exceptions for non-audit services which are approved by the audit committee prior to the completion of the annualaudit. No non-audit services were performed under the de minimis exception during 2005. The audit committee has considered whether the provision of services rendered in 2005 other than the audit of our financial statements and reviews of quarterly financial statements was compatible with maintaining the independence of Ernst & Young LLP and determined that the provision of such services was compatible with maintaining such independence.
The audit committee has adopted policies and procedures for pre-approving all audit and non-audit servicesperformed by the independent registered public accounting firm. The policy requires advance approval by the audit
28
committee of all audit and non-audit work. Unless the specific service has been previously pre-approved withrespect to the 12-month period following the advance approval, the audit committee must approve a service before the independent registered public accounting firm is engaged to perform the service. The audit committee has given advance approval for specified audit, audit-related and tax services for 2006. Requests for services that havereceived this pre-approval are subject to specified fee or budget restrictions as well as internal management controls.
HOUSEHOLDING
The SEC permits a single set of annual reports and proxy statements to be sent to any household at which two or more stockholders reside if they appear to be members of the same family. Each stockholder continues toreceive a separate proxy card. This procedure, referred to as householding, reduces the volume of duplicate information stockholders receive and reduces mailing and printing expenses. A number of brokerage firms have instituted householding.
As a result, if you hold your shares through a broker and you reside at an address at which two or more stockholders reside, you will likely be receiving only one annual report and proxy statement unless any stockholder at that address has given the broker contrary instructions. However, if any such beneficial stockholder residing atsuch an address wishes to receive a separate annual report or proxy statement in the future, or if any such beneficial stockholder that elected to continue to receive separate annual reports or proxy statements wishes to receive a single annual report or proxy statement in the future, that stockholder should contact their broker or send a request to our corporate secretary at Eric B. Brown, Secretary, Transocean Inc., 4 Greenway Plaza, Houston, Texas 77046, telephone number (713) 232-7500. We will deliver, promptly upon written or oral request to the corporatesecretary, a separate copy of the 2005 annual report and this proxy statement to a beneficial stockholder at a sharedaddress to which a single copy of the documents was delivered.
2005 ANNUAL GENERAL MEETING OF SHAREHOLDERS
At our last Annual General Meeting held on May 12, 2005, our shareholders:
• elected Judy J. Kelly, Roberto Monti and Ian C. Strachan as directors;
• approved the amendment of our Employee Stock Purchase Plan to increase the number of ordinaryshares reserved for issuance under the plan from 2,500,000 to 3,500,000; and
• approved the appointment of Ernst & Young LLP as our independent registered public accounting firmfor 2005.
Since the 2005 Annual General Meeting, our articles and memorandum of association have not been amended and no meetings of shareholders have been held.
PROPOSALS OF SHAREHOLDERS
Shareholder Proposals in the Proxy Statement. Rule 14a-8 under the Securities Exchange Act of 1934addresses when a company must include a shareholder’s proposal in its proxy statement and identify the proposal inits form of proxy when the company holds an annual or special meeting of shareholders. Under Rule 14a-8, in order for your proposals to be considered for inclusion in the proxy statement and proxy card relating to our 2007 annualgeneral meeting, your proposals must be received at our principal executive offices, 4 Greenway Plaza, Houston, Texas 77046, by no later than November 29, 2006. However, if the date of the 2007 annual general meetingchanges by more than 30 days from the anniversary of the 2006 annual general meeting, the deadline is a reasonabletime before we begin to print and mail our proxy materials. We will notify you of this deadline in a Quarterly Report on Form 10-Q or in another communication to you. Shareholder proposals must also be otherwise eligiblefor inclusion.
Shareholder Proposals and Nominations for Directors to Be Presented at Meetings. If you desire to bring a matter before an annual general meeting and the proposal is submitted outside the process of Rule 14a-8, you must
29
follow the procedures set forth in our articles of association. Our articles of association provide generally that, if you desire to propose any business at an annual general meeting, you must give us written notice not less than 90 days prior to the anniversary of the originally scheduled date of the immediately preceding annual general meeting. However, if the date of the forthcoming annual general meeting is more than 30 days before or after that anniversarydate, the deadline is the close of business on the tenth day after we publicly disclose the meeting date. The deadlineunder our articles of association for submitting proposals will be February 10, 2007 for the 2007 annual generalmeeting unless it is more than 30 days before or after the anniversary of the 2006 annual general meeting. Yournotice must set forth:
• a brief description of the business desired to be brought before the meeting and the reasons for conducting the business at the meeting;
• your name and address;
• a representation that you are a holder of record of our ordinary shares entitled to vote at the meeting, or if the record date for the meeting is subsequent to the date required for shareholder notice, a representation that you are a holder of record at the time of the notice and intend to be a holder ofrecord on the date of the meeting, and, in either case, intend to appear in person or by proxy at the meeting to propose that business; and
• any material interest you have in the business.
If you desire to nominate directors at an annual general meeting, you must give us written notice within thetime period described in the preceding paragraph. If you desire to nominate directors at an extraordinary generalmeeting at which the board of directors has determined that directors will be elected, you must give us written notice by the close of business on the tenth day following our public disclosure of the meeting date. Notice must set forth:
• your name and address and the name and address of the person or persons to be nominated;
• a representation that you are a holder of record of our ordinary shares entitled to vote at the meeting or, if the record date for the meeting is subsequent to the date required for that shareholder notice, a representation that you are a holder of record at the time of the notice and intend to be a holder ofrecord on the date of the meeting and, in either case, setting forth the class and number of shares soheld, including shares held beneficially;
• a representation that you intend to appear in person or by proxy as a holder of record at the meeting tonominate the person or persons specified in the notice;
• a description of all arrangements or understandings between you and each nominee you proposed and any other person or persons under which the nomination or nominations are to be made by you;
• any other information regarding each nominee you proposed that would be required to be included in a proxy statement filed pursuant to the proxy rules of the Securities and Exchange Commission; and
• the consent of each nominee to serve as a director if so elected.
The chairman of the meeting may refuse to transact any business or to acknowledge the nomination of any person if you fail to comply with the foregoing procedures.
You may obtain a copy of our articles of association, in which these procedures are set forth, upon written request to Eric B. Brown, Secretary, Transocean Inc., 4 Greenway Plaza, Houston, Texas 77046.

30


--- A-1
UNITED STATES SECURITIES AND EXCHANGE COMMISSION
Washington, D.C. 20549 _________________
FORM 10-K (Mark One) [X] ANNUAL REPORT PURSUANT TO SECTION 13 OR 15(d) OF THE SECURITIES EXCHANGE ACT OF 1934
For the fiscal year ended December 31, 2005 OR[ ] TRANSITION REPORT PURSUANT TO SECTION 13 OR 15(d) OF THE SECURITIES EXCHANGE ACT OF 1934
For the transition period from _____ to ______.
Commission file number 333-75899 _________________
TRANSOCEAN INC.(Exact name of registrant as specified in its charter)
_________________
Cayman Islands 66-0582307(State or other jurisdiction (I.R.S. Employer
of incorporation or organization) Identification No.)
4 Greenway Plaza 77046 Houston, Texas (Zip Code)
(Address of principal executive offices)
Registrant's telephone number, including area code: (713) 232-7500
Securities registered pursuant to Section 12(b) of the Act:
Title of class Exchange on which registeredOrdinary Shares, par value $0.01 per share New York Stock Exchange, Inc.
Securities registered pursuant to Section 12(g) of the Act: None
Indicate by check mark whether the registrant is a well-known seasoned issuer, as defined in Rule 405 of the Securities Act. Yes [x] No [ ]
Indicate by check mark if the registrant is not required to file reports pursuant to Section 13 or Section 15(d) of the Exchange Act. Yes [ ] No [x]
Indicate by check mark whether the registrant (1) has filed all reports required to be filed by Section 13 or 15(d) of the Securities ExchangeAct of 1934 during the preceding 12 months (or for such shorter period that the registrant was required to file such reports), and (2) has been subject to such filing requirements for the past 90 days. Yes [x] No [ ]
Indicate by check mark if disclosure of delinquent filers pursuant to Item 405 of Regulation S-K is not contained herein, and will not be contained, to the best of registrant's knowledge, in definitive proxy or information statements incorporated by reference in Part III of this Form 10-Kor any amendment to this Form 10-K. [x]
Indicate by check mark whether the registrant is a large accelerated filer, an accelerated filer, or a non-accelerated filer. See definition of “accelerated filer and large accelerated filer” in Rule 12b-2 of the Exchange Act.
Large accelerated filer [x] Accelerated filer [ ] Non-accelerated filer [ ]
Indicate by check mark whether the registrant is a shell company (as defined by Rule 12b-2 of the Exchange Act). Yes [ ] No [x]
As of June 30, 2005, 328,508,472 ordinary shares were outstanding and the aggregate market value of such shares held by non-affiliateswas approximately $17.7 billion (based on the reported closing market price of the ordinary shares on such date of $53.97 and assuming that all directors and executive officers of the Company are “affiliates,” although the Company does not acknowledge that any such person is actually an “affiliate” within the meaning of the federal securities laws). As of February 28, 2006, 325,966,986 ordinary shares were outstanding.
DOCUMENTS INCORPORATED BY REFERENCE
Portions of the registrant's definitive Proxy Statement to be filed with the Securities and Exchange Commission within 120 days of December 31, 2005, for its 2006 annual general meeting of shareholders, are incorporated by reference into Part III of this Form 10-K.
A-2
TRANSOCEAN INC. AND SUBSIDIARIES INDEX TO ANNUAL REPORT ON FORM 10-K FOR THE YEAR ENDED DECEMBER 31, 2005
Item Page
PART I ITEM 1. Business .................................................................................................................................... A-4 Background of Transocean. ....................................................................................................... A-4 Drilling Fleet.............................................................................................................................. A-5 Markets ...................................................................................................................................... A-11
Operating Revenues and Long-Lived Assets by Country.......................................................... A-12 Integrated Services..................................................................................................................... A-12 Drilling Contracts ...................................................................................................................... A-13 Significant Clients ..................................................................................................................... A-13 Regulation.................................................................................................................................. A-13 Employees ................................................................................................................................. A-14 Available Information................................................................................................................ A-14 ITEM 1A. Risk Factors ............................................................................................................................... A-15 ITEM 1B. Unresolved Staff Comments....................................................................................................... A-19 ITEM 2. Properties .................................................................................................................................. A-19 ITEM 3. Legal Proceedings ..................................................................................................................... A-19 ITEM 4. Submission of Matters to a Vote of Security Holders ................................................................ A-21 Executive Officers of the Registrant.......................................................................................... A-21
PART II ITEM 5. Market for Registrant’s Common Equity, Related Shareholder Matters and
Issuer Purchases of Equity Securities .................................................................................... A-23 ITEM 6. Selected Financial Data............................................................................................................. A-24 ITEM 7. Management’s Discussion and Analysis of Financial Condition and Results of Operations ... A-26 ITEM 7A. Quantitative and Qualitative Disclosures About Market Risk ................................................... A-58 ITEM 8. Financial Statements and Supplementary Data......................................................................... F-1 ITEM 9. Changes in and Disagreements with Accountants on Accounting and Financial Disclosure ... F-51 ITEM 9A. Controls and Procedures ........................................................................................................... F-51 ITEM 9B. Other Information ...................................................................................................................... F-51
PART III ITEM 10. Directors and Executive Officers of the Registrant ................................................................... F-51 ITEM 11. Executive Compensation............................................................................................................ F-51 ITEM 12. Security Ownership of Certain Beneficial Owners and Management
and Related Shareholder Matters .......................................................................................... F-51 ITEM 13. Certain Relationships and Related Transactions....................................................................... F-51 ITEM 14. Principal Accounting Fees and Services ................................................................................... F-51
PART IV ITEM 15. Exhibit and Financial Statement Schedules............................................................................... F-52
A-3
Forward-Looking Information
The statements included in this annual report regarding future financial performance and results of operations andother statements that are not historical facts are forward-looking statements within the meaning of Section 27A of the Securities Act of 1933 and Section 21E of the Securities Exchange Act of 1934. Statements to the effect that we or management “anticipates,” “believes,” “budgets,” “estimates,” “expects,” “forecasts,” “intends,” “plans,” “predicts,” or “projects” a particular result or course of events, or that such result or course of events “could,” “might,” “may,” “scheduled” or “should” occur, and similar expressions, are also intended to identify forward-looking statements. Forward-looking statements in this annual report include, but are not limited to, statements involving contract commencements, contract option exercises, revenues, expenses, results of operations, commodity prices, customer drilling programs, supply and demand,utilization rates, dayrates, contract backlog, planned shipyard projects and rig mobilizations and their effects, newbuild projects and opportunities, the upgrade projects for the Sedco 700–series semisubmersible rigs, other major upgrades, rig reactivations, expected downtime (including downtime with respect to the Deepwater Nautilus and Transocean Marianas), the impact of the hurricane damage to the Deepwater Nautilus and Transocean Marianas on operating income, capital expenditures and insurance proceeds, PetroJack ASA options, future activity in the deepwater, mid-water and the shallow andinland water market sectors, market outlook for our various geographical operating sectors, capacity constraints for fifth-generation rigs, rig classes and business segments, effects of new rigs on the market, income related to the TODCO tax sharing agreement, the TODCO tax sharing agreement dispute, intended reduction of debt and other uses of excess cash,including ordinary share repurchases, the timing and funding of share repurchases, planned asset sales, timing of asset sales, proceeds from asset sales, our effective tax rate, changes in tax laws, treaties and regulations, our other expectations withregard to market outlook, operations in international markets, expected capital expenditures, results and effects of legalproceedings and governmental audits and assessments, adequacy of insurance, liabilities for tax issues, liquidity, cash flowfrom operations, adequacy of cash flow for our obligations, effects of accounting changes, adoption of accounting policies,pension plan and other postretirement benefit plan contributions and benefit payments and the timing and cost of completionof capital projects. Such statements are subject to numerous risks, uncertainties and assumptions, including, but not limited to, those described under “Item 1A. Risk Factors,” the adequacy of sources of liquidity, the effect and results of litigation,audits and contingencies and other factors discussed in this annual report and in the Company's other filings with the SEC,which are available free of charge on the SEC's website at www.sec.gov. Should one or more of these risks or uncertainties materialize, or should underlying assumptions prove incorrect, actual results may vary materially from those indicated. Allsubsequent written and oral forward-looking statements attributable to the Company or to persons acting on our behalf are expressly qualified in their entirety by reference to these risks and uncertainties. You should not place undue reliance onforward-looking statements. Each forward-looking statement speaks only as of the date of the particular statement, and weundertake no obligation to publicly update or revise any forward-looking statements.
A-4
PART I ITEM 1. Business
Transocean Inc. (together with its subsidiaries and predecessors, unless the context requires otherwise, “Transocean,” the “Company,” “we,” “us” or “our”) is a leading international provider of offshore contract drilling servicesfor oil and gas wells. As of March 2, 2006, we owned, had partial ownership interests in or operated 89 mobile offshore andbarge drilling units. As of this date, our fleet included 32 High-Specification semisubmersibles and drillships (“floaters”), 23 Other Floaters, 25 Jackup Rigs and 9 Other Rigs.
Our mobile offshore drilling fleet is considered one of the most modern and versatile fleets in the world. Ourprimary business is to contract these drilling rigs, related equipment and work crews primarily on a dayrate basis to drill oiland gas wells. We specialize in technically demanding sectors of the offshore drilling business with a particular focus ondeepwater and harsh environment drilling services. We also provide additional services, including integrated services. Ourordinary shares are listed on the New York Stock Exchange under the symbol “RIG.”
Transocean Inc. is a Cayman Islands exempted company with principal executive offices in the U.S. located at 4 Greenway Plaza, Houston, Texas 77046. Our telephone number at that address is (713) 232-7500.
Background of Transocean
In June 1993, the Company, then known as “Sonat Offshore Drilling Inc.,” completed an initial public offering of approximately 60 percent of the outstanding shares of its common stock as part of its separation from Sonat Inc., and in July1995 Sonat Inc. sold its remaining 40 percent interest in the Company through a secondary public offering. In September1996, the Company acquired Transocean ASA, a Norwegian offshore drilling company, and changed its name to“Transocean Offshore Inc.” On May 14, 1999, we completed a corporate reorganization by which we changed our place of incorporation from Delaware to the Cayman Islands.
In December 1999, we completed our merger with Sedco Forex Holdings Limited (“Sedco Forex”), the formeroffshore contract drilling business of Schlumberger Limited (“Schlumberger”). Effective upon the merger, we changed our name to “Transocean Sedco Forex Inc.” On January 31, 2001, we completed our merger transaction (the “R&B Falconmerger”) with R&B Falcon Corporation (“R&B Falcon”). At the time of the merger, R&B Falcon operated a diverse globaldrilling rig fleet, consisting of drillships, semisubmersibles, jackup rigs and other units in addition to the Gulf of Mexico Shallow and Inland Water segment fleet. R&B Falcon and the Gulf of Mexico Shallow and Inland Water segment later became known as TODCO (together with its subsidiaries and predecessors, unless the context requires otherwise,“TODCO”), a publicly traded company and a former wholly-owned subsidiary. In preparation for the initial public offeringdiscussed below, we transferred all assets and subsidiaries out of R&B Falcon that were unrelated to the Gulf of Mexico Shallow and Inland Water business. In May 2002, we changed our name to “Transocean Inc.”
In February 2004, we completed an initial public offering (the “TODCO IPO”) of common stock of TODCO inwhich we sold 13.8 million shares of TODCO class A common stock, representing 23 percent of TODCO’s totaloutstanding shares. In September 2004 and December 2004, respectively, we completed additional public offerings of TODCO common stock (respectively referred to as the “September 2004 Offering” and “December 2004 Offering” and, together with the TODCO IPO, the “2004 Offerings”). We sold 17.9 million shares of TODCO’s class A common stock (30 percent of TODCO’s total outstanding shares) in the September 2004 Offering and 15.0 million shares of TODCO’s class Acommon stock (25 percent of TODCO’s total outstanding shares) in the December 2004 Offering. Prior to the December 2004 Offering, we held TODCO class B common stock, which was entitled to five votes per share (compared to one vote per share of TODCO class A common stock) and converted automatically into class A common stock upon any sale by us toa third party. In conjunction with the December 2004 Offering, we converted all of our remaining TODCO class B common stock not sold in the 2004 Offerings into shares of class A common stock. After the 2004 Offerings, we held a 22 percentownership and voting interest in TODCO, represented by 13.3 million shares of class A common stock.
We consolidated TODCO in our financial statements through December 16, 2004 and that portion of TODCO that we did not own was reported as minority interest in our consolidated statements of operations and balance sheets. As a resultof the conversion of the TODCO class B common stock into class A common stock, we no longer had a majority votinginterest in TODCO and no longer consolidated TODCO in our financial statements but accounted for our remaininginvestment using the equity method of accounting.
In May 2005 and June 2005, respectively, we completed a public offering of TODCO common stock and a sale ofTODCO common stock pursuant to Rule 144 under the Securities Act of 1933, as amended (respectively referred to as the “May Offering” and the “June Sale,” collectively referred to as the “2005 Offering and Sale,” and, collectively with the
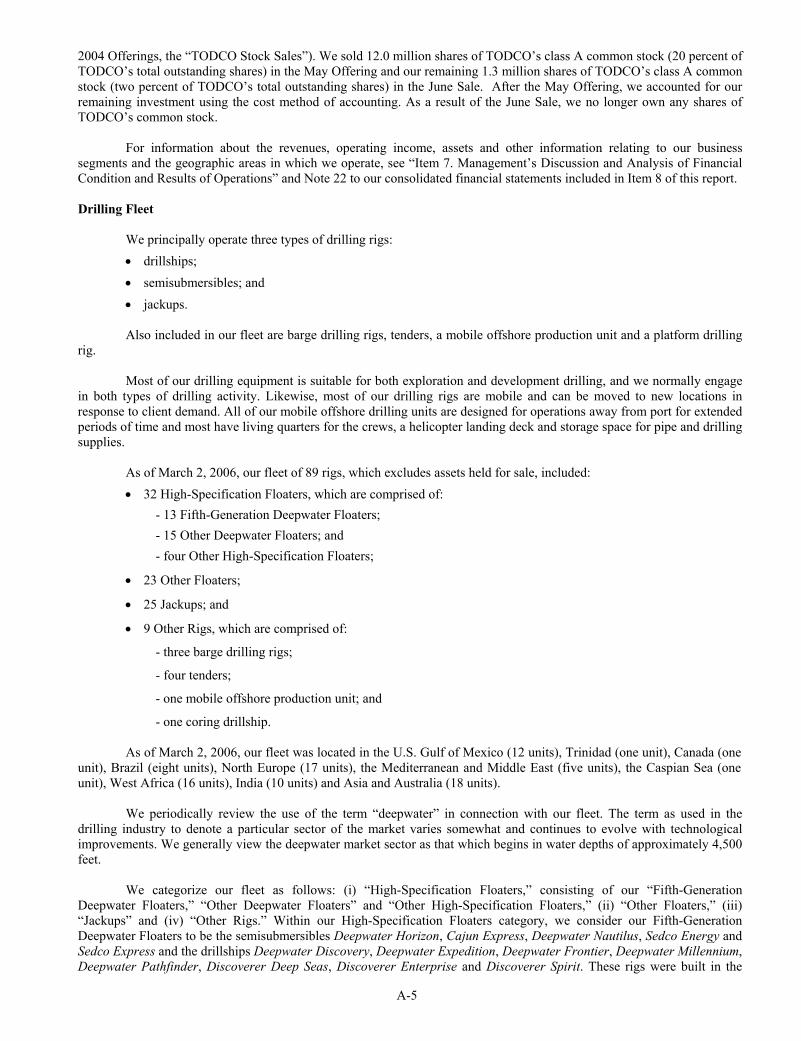
A-5
2004 Offerings, the “TODCO Stock Sales”). We sold 12.0 million shares of TODCO’s class A common stock (20 percent ofTODCO’s total outstanding shares) in the May Offering and our remaining 1.3 million shares of TODCO’s class A common stock (two percent of TODCO’s total outstanding shares) in the June Sale. After the May Offering, we accounted for our remaining investment using the cost method of accounting. As a result of the June Sale, we no longer own any shares ofTODCO’s common stock.
For information about the revenues, operating income, assets and other information relating to our businesssegments and the geographic areas in which we operate, see “Item 7. Management’s Discussion and Analysis of FinancialCondition and Results of Operations” and Note 22 to our consolidated financial statements included in Item 8 of this report.
Drilling Fleet
We principally operate three types of drilling rigs: • drillships; • semisubmersibles; and • jackups.
Also included in our fleet are barge drilling rigs, tenders, a mobile offshore production unit and a platform drillingrig.
Most of our drilling equipment is suitable for both exploration and development drilling, and we normally engagein both types of drilling activity. Likewise, most of our drilling rigs are mobile and can be moved to new locations inresponse to client demand. All of our mobile offshore drilling units are designed for operations away from port for extended periods of time and most have living quarters for the crews, a helicopter landing deck and storage space for pipe and drilling supplies.
As of March 2, 2006, our fleet of 89 rigs, which excludes assets held for sale, included: • 32 High-Specification Floaters, which are comprised of:
- 13 Fifth-Generation Deepwater Floaters; - 15 Other Deepwater Floaters; and - four Other High-Specification Floaters;
• 23 Other Floaters;
• 25 Jackups; and
• 9 Other Rigs, which are comprised of:
- three barge drilling rigs;
- four tenders;
- one mobile offshore production unit; and
- one coring drillship.
As of March 2, 2006, our fleet was located in the U.S. Gulf of Mexico (12 units), Trinidad (one unit), Canada (oneunit), Brazil (eight units), North Europe (17 units), the Mediterranean and Middle East (five units), the Caspian Sea (one unit), West Africa (16 units), India (10 units) and Asia and Australia (18 units).
We periodically review the use of the term “deepwater” in connection with our fleet. The term as used in thedrilling industry to denote a particular sector of the market varies somewhat and continues to evolve with technologicalimprovements. We generally view the deepwater market sector as that which begins in water depths of approximately 4,500feet.
We categorize our fleet as follows: (i) “High-Specification Floaters,” consisting of our “Fifth-Generation Deepwater Floaters,” “Other Deepwater Floaters” and “Other High-Specification Floaters,” (ii) “Other Floaters,” (iii) “Jackups” and (iv) “Other Rigs.” Within our High-Specification Floaters category, we consider our Fifth-GenerationDeepwater Floaters to be the semisubmersibles Deepwater Horizon, Cajun Express, Deepwater Nautilus, Sedco Energy and Sedco Express and the drillships Deepwater Discovery, Deepwater Expedition, Deepwater Frontier, Deepwater Millennium, Deepwater Pathfinder, Discoverer Deep Seas, Discoverer Enterprise and Discoverer Spirit. These rigs were built in the
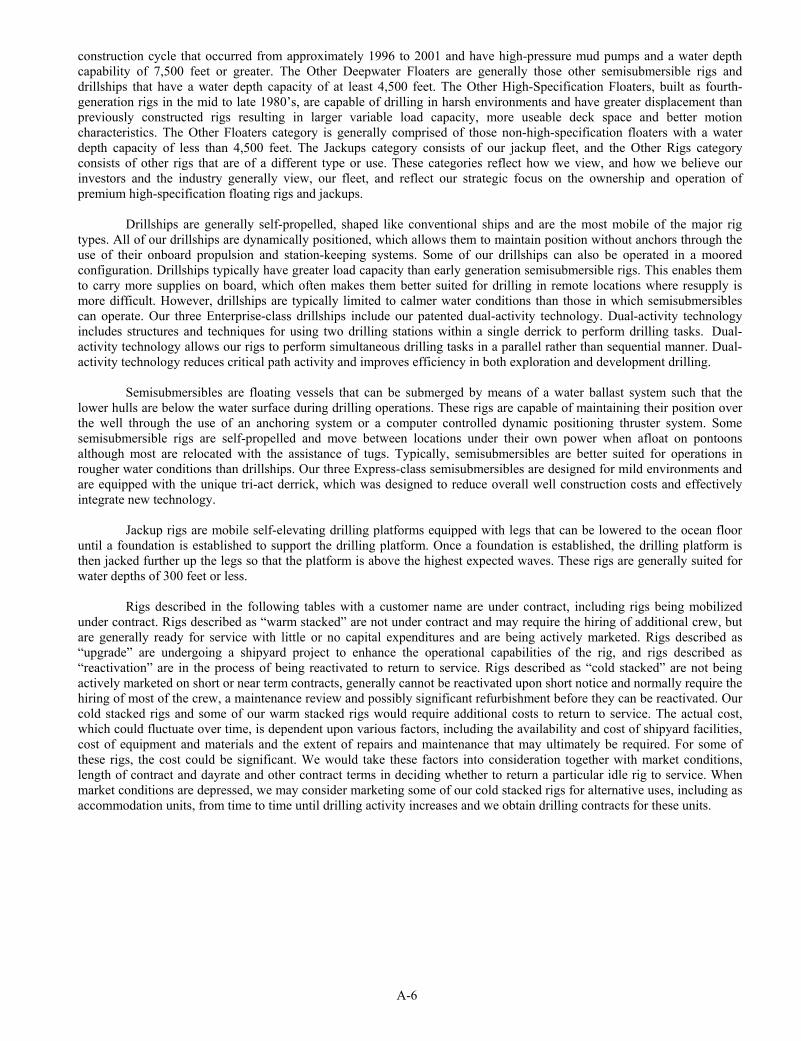
A-6
construction cycle that occurred from approximately 1996 to 2001 and have high-pressure mud pumps and a water depth capability of 7,500 feet or greater. The Other Deepwater Floaters are generally those other semisubmersible rigs anddrillships that have a water depth capacity of at least 4,500 feet. The Other High-Specification Floaters, built as fourth-generation rigs in the mid to late 1980’s, are capable of drilling in harsh environments and have greater displacement than previously constructed rigs resulting in larger variable load capacity, more useable deck space and better motioncharacteristics. The Other Floaters category is generally comprised of those non-high-specification floaters with a waterdepth capacity of less than 4,500 feet. The Jackups category consists of our jackup fleet, and the Other Rigs categoryconsists of other rigs that are of a different type or use. These categories reflect how we view, and how we believe ourinvestors and the industry generally view, our fleet, and reflect our strategic focus on the ownership and operation ofpremium high-specification floating rigs and jackups.
Drillships are generally self-propelled, shaped like conventional ships and are the most mobile of the major rigtypes. All of our drillships are dynamically positioned, which allows them to maintain position without anchors through the use of their onboard propulsion and station-keeping systems. Some of our drillships can also be operated in a moored configuration. Drillships typically have greater load capacity than early generation semisubmersible rigs. This enables them to carry more supplies on board, which often makes them better suited for drilling in remote locations where resupply is more difficult. However, drillships are typically limited to calmer water conditions than those in which semisubmersibles can operate. Our three Enterprise-class drillships include our patented dual-activity technology. Dual-activity technologyincludes structures and techniques for using two drilling stations within a single derrick to perform drilling tasks. Dual-activity technology allows our rigs to perform simultaneous drilling tasks in a parallel rather than sequential manner. Dual-activity technology reduces critical path activity and improves efficiency in both exploration and development drilling.
Semisubmersibles are floating vessels that can be submerged by means of a water ballast system such that thelower hulls are below the water surface during drilling operations. These rigs are capable of maintaining their position overthe well through the use of an anchoring system or a computer controlled dynamic positioning thruster system. Somesemisubmersible rigs are self-propelled and move between locations under their own power when afloat on pontoons although most are relocated with the assistance of tugs. Typically, semisubmersibles are better suited for operations inrougher water conditions than drillships. Our three Express-class semisubmersibles are designed for mild environments andare equipped with the unique tri-act derrick, which was designed to reduce overall well construction costs and effectively integrate new technology.
Jackup rigs are mobile self-elevating drilling platforms equipped with legs that can be lowered to the ocean floor until a foundation is established to support the drilling platform. Once a foundation is established, the drilling platform isthen jacked further up the legs so that the platform is above the highest expected waves. These rigs are generally suited forwater depths of 300 feet or less.
Rigs described in the following tables with a customer name are under contract, including rigs being mobilized under contract. Rigs described as “warm stacked” are not under contract and may require the hiring of additional crew, butare generally ready for service with little or no capital expenditures and are being actively marketed. Rigs described as“upgrade” are undergoing a shipyard project to enhance the operational capabilities of the rig, and rigs described as “reactivation” are in the process of being reactivated to return to service. Rigs described as “cold stacked” are not being actively marketed on short or near term contracts, generally cannot be reactivated upon short notice and normally require the hiring of most of the crew, a maintenance review and possibly significant refurbishment before they can be reactivated. Our cold stacked rigs and some of our warm stacked rigs would require additional costs to return to service. The actual cost, which could fluctuate over time, is dependent upon various factors, including the availability and cost of shipyard facilities,cost of equipment and materials and the extent of repairs and maintenance that may ultimately be required. For some ofthese rigs, the cost could be significant. We would take these factors into consideration together with market conditions,length of contract and dayrate and other contract terms in deciding whether to return a particular idle rig to service. Whenmarket conditions are depressed, we may consider marketing some of our cold stacked rigs for alternative uses, including asaccommodation units, from time to time until drilling activity increases and we obtain drilling contracts for these units.
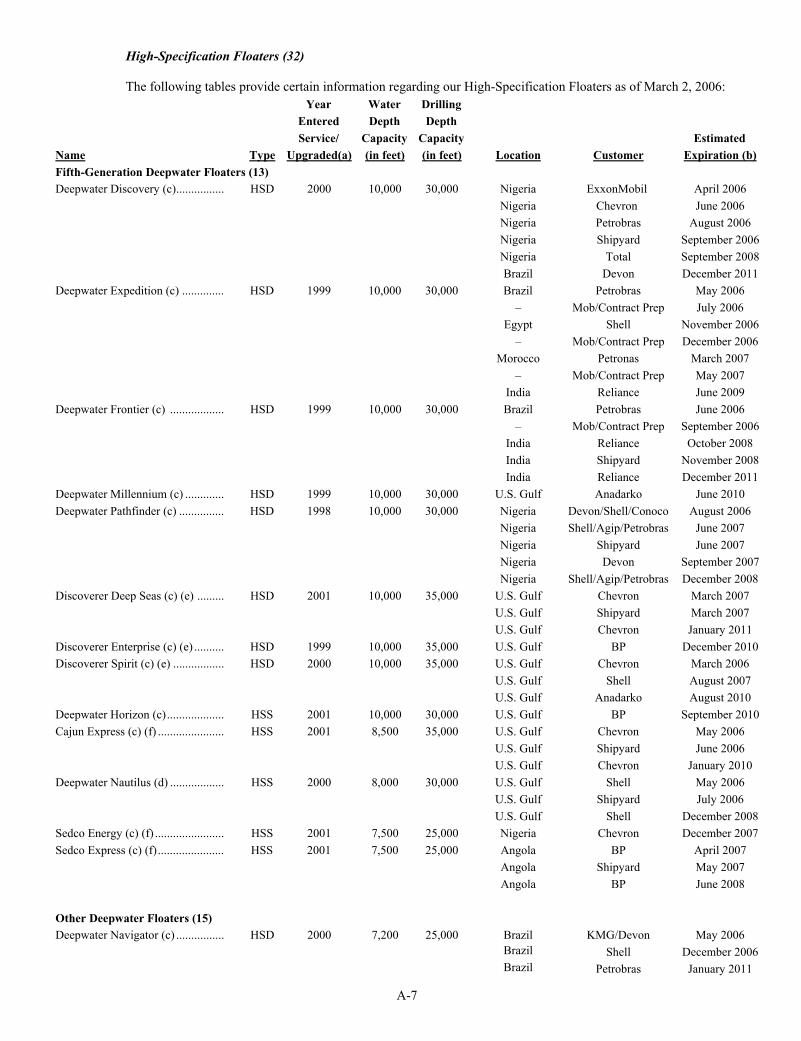
A-7
High-Specification Floaters (32)
The following tables provide certain information regarding our High-Specification Floaters as of March 2, 2006: Year Water Drilling Entered Depth Depth Service/ Capacity Capacity Estimated
Name Type Upgraded(a) (in feet) (in feet) Location Customer Expiration (b)Fifth-Generation Deepwater Floaters (13)Deepwater Discovery (c)................ HSD 2000 10,000 30,000 Nigeria ExxonMobil April 2006
Nigeria Chevron June 2006 Nigeria Petrobras August 2006 Nigeria Shipyard September 2006Nigeria Total September 2008Brazil Devon December 2011
Deepwater Expedition (c) .............. HSD 1999 10,000 30,000 Brazil Petrobras May 2006 – Mob/Contract Prep July 2006
Egypt Shell November 2006 – Mob/Contract Prep December 2006
Morocco Petronas March 2007 – Mob/Contract Prep May 2007
India Reliance June 2009 Deepwater Frontier (c) .................. HSD 1999 10,000 30,000 Brazil Petrobras June 2006
– Mob/Contract Prep September 2006India Reliance October 2008 India Shipyard November 2008 India Reliance December 2011
Deepwater Millennium (c) ............. HSD 1999 10,000 30,000 U.S. Gulf Anadarko June 2010 Deepwater Pathfinder (c) ............... HSD 1998 10,000 30,000 Nigeria Devon/Shell/Conoco August 2006
Nigeria Shell/Agip/Petrobras June 2007 Nigeria Shipyard June 2007 Nigeria Devon September 2007Nigeria Shell/Agip/Petrobras December 2008
Discoverer Deep Seas (c) (e) ......... HSD 2001 10,000 35,000 U.S. Gulf Chevron March 2007 U.S. Gulf Shipyard March 2007 U.S. Gulf Chevron January 2011
Discoverer Enterprise (c) (e) .......... HSD 1999 10,000 35,000 U.S. Gulf BP December 2010Discoverer Spirit (c) (e) ................. HSD 2000 10,000 35,000 U.S. Gulf Chevron March 2006
U.S. Gulf Shell August 2007 U.S. Gulf Anadarko August 2010
Deepwater Horizon (c)................... HSS 2001 10,000 30,000 U.S. Gulf BP September 2010Cajun Express (c) (f) ...................... HSS 2001 8,500 35,000 U.S. Gulf Chevron May 2006
U.S. Gulf Shipyard June 2006 U.S. Gulf Chevron January 2010
Deepwater Nautilus (d) .................. HSS 2000 8,000 30,000 U.S. Gulf Shell May 2006 U.S. Gulf Shipyard July 2006 U.S. Gulf Shell December 2008
Sedco Energy (c) (f) ....................... HSS 2001 7,500 25,000 Nigeria Chevron December 2007Sedco Express (c) (f)...................... HSS 2001 7,500 25,000 Angola BP April 2007
Angola Shipyard May 2007 Angola BP June 2008
Other Deepwater Floaters (15)Deepwater Navigator (c) ................ HSD 2000 7,200 25,000 Brazil KMG/Devon May 2006
Brazil Shell December 2006Brazil Petrobras January 2011
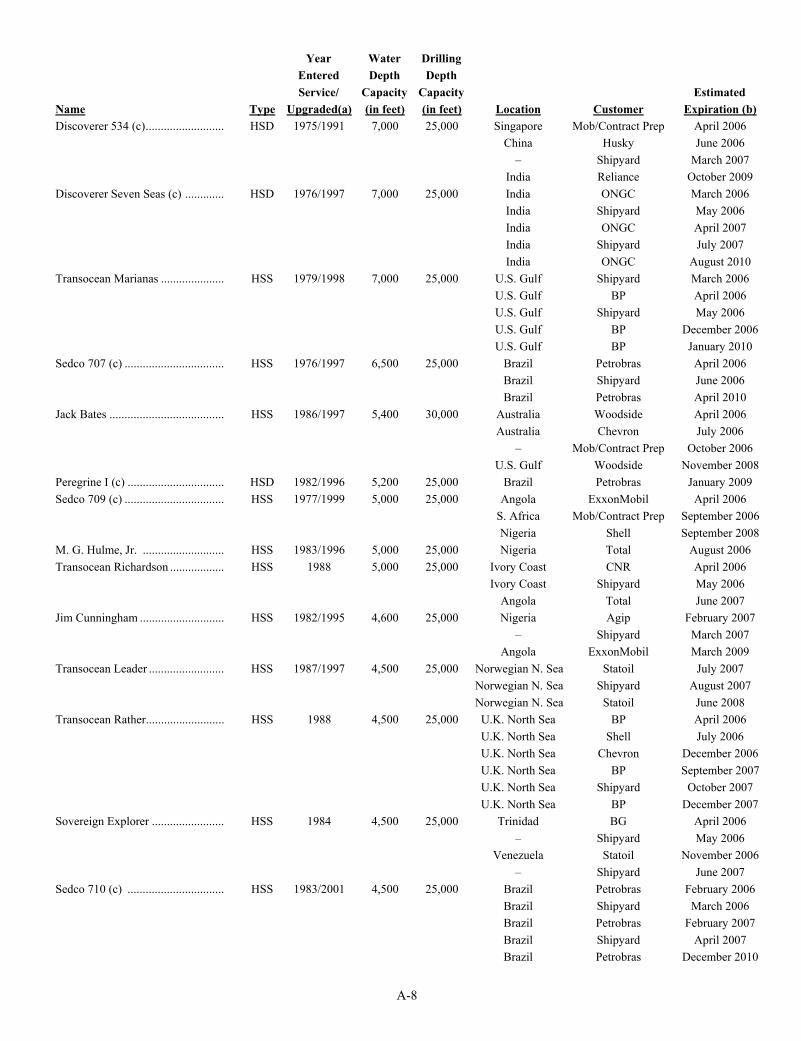
A-8
Year Water Drilling Entered Depth Depth Service/ Capacity Capacity Estimated
Name Type Upgraded(a) (in feet) (in feet) Location Customer Expiration (b)Discoverer 534 (c).......................... HSD 1975/1991 7,000 25,000 Singapore Mob/Contract Prep April 2006
China Husky June 2006 – Shipyard March 2007
India Reliance October 2009 Discoverer Seven Seas (c) ............. HSD 1976/1997 7,000 25,000 India ONGC March 2006
India Shipyard May 2006 India ONGC April 2007 India Shipyard July 2007 India ONGC August 2010
Transocean Marianas ..................... HSS 1979/1998 7,000 25,000 U.S. Gulf Shipyard March 2006 U.S. Gulf BP April 2006 U.S. Gulf Shipyard May 2006 U.S. Gulf BP December 2006U.S. Gulf BP January 2010
Sedco 707 (c) ................................. HSS 1976/1997 6,500 25,000 Brazil Petrobras April 2006 Brazil Shipyard June 2006 Brazil Petrobras April 2010
Jack Bates ...................................... HSS 1986/1997 5,400 30,000 Australia Woodside April 2006 Australia Chevron July 2006
– Mob/Contract Prep October 2006 U.S. Gulf Woodside November 2008
Peregrine I (c) ................................ HSD 1982/1996 5,200 25,000 Brazil Petrobras January 2009 Sedco 709 (c) ................................. HSS 1977/1999 5,000 25,000 Angola ExxonMobil April 2006
S. Africa Mob/Contract Prep September 2006Nigeria Shell September 2008
M. G. Hulme, Jr. ........................... HSS 1983/1996 5,000 25,000 Nigeria Total August 2006 Transocean Richardson .................. HSS 1988 5,000 25,000 Ivory Coast CNR April 2006
Ivory Coast Shipyard May 2006 Angola Total June 2007
Jim Cunningham ............................ HSS 1982/1995 4,600 25,000 Nigeria Agip February 2007 – Shipyard March 2007
Angola ExxonMobil March 2009 Transocean Leader ......................... HSS 1987/1997 4,500 25,000 Norwegian N. Sea Statoil July 2007
Norwegian N. Sea Shipyard August 2007 Norwegian N. Sea Statoil June 2008
Transocean Rather.......................... HSS 1988 4,500 25,000 U.K. North Sea BP April 2006 U.K. North Sea Shell July 2006 U.K. North Sea Chevron December 2006U.K. North Sea BP September 2007U.K. North Sea Shipyard October 2007 U.K. North Sea BP December 2007
Sovereign Explorer ........................ HSS 1984 4,500 25,000 Trinidad BG April 2006 – Shipyard May 2006
Venezuela Statoil November 2006 – Shipyard June 2007
Sedco 710 (c) ................................ HSS 1983/2001 4,500 25,000 Brazil Petrobras February 2006 Brazil Shipyard March 2006 Brazil Petrobras February 2007 Brazil Shipyard April 2007 Brazil Petrobras December 2010
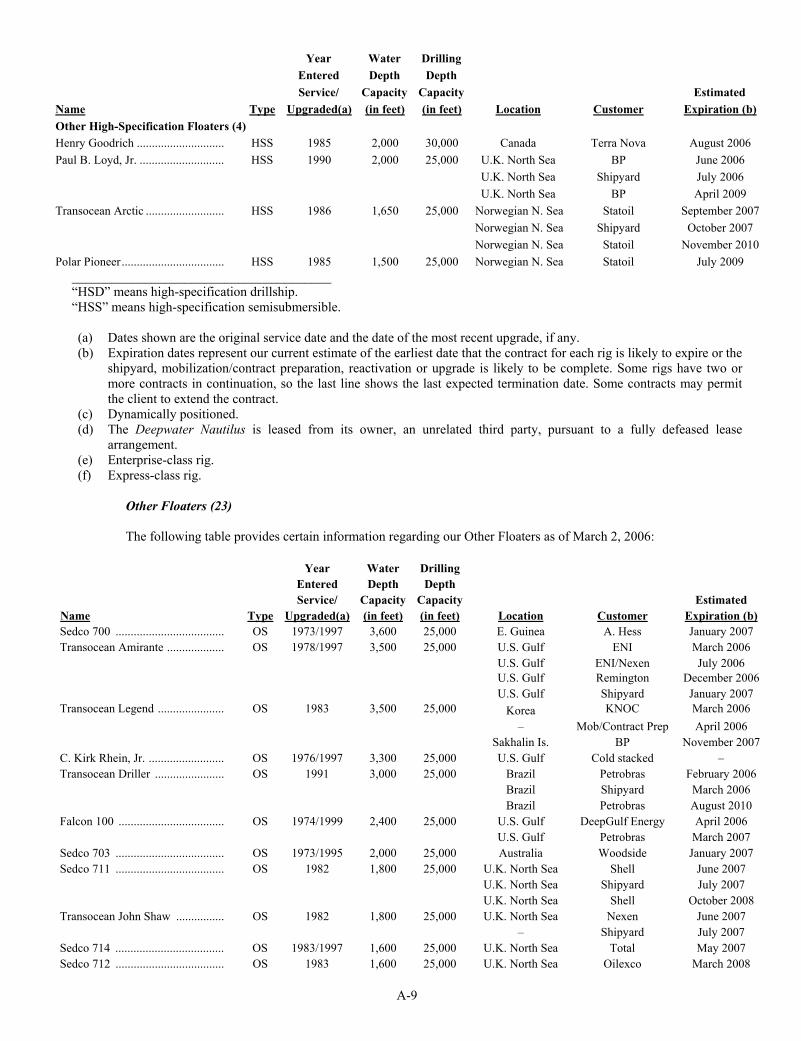
A-9
Year Water Drilling Entered Depth Depth Service/ Capacity Capacity Estimated
Name Type Upgraded(a) (in feet) (in feet) Location Customer Expiration (b)Other High-Specification Floaters (4)Henry Goodrich ............................. HSS 1985 2,000 30,000 Canada Terra Nova August 2006 Paul B. Loyd, Jr. ............................ HSS 1990 2,000 25,000 U.K. North Sea BP June 2006
U.K. North Sea Shipyard July 2006 U.K. North Sea BP April 2009
Transocean Arctic .......................... HSS 1986 1,650 25,000 Norwegian N. Sea Statoil September 2007Norwegian N. Sea Shipyard October 2007 Norwegian N. Sea Statoil November 2010
Polar Pioneer.................................. HSS 1985 1,500 25,000 Norwegian N. Sea Statoil July 2009 _______________________________________“HSD” means high-specification drillship.“HSS” means high-specification semisubmersible.
(a) Dates shown are the original service date and the date of the most recent upgrade, if any. (b) Expiration dates represent our current estimate of the earliest date that the contract for each rig is likely to expire or the
shipyard, mobilization/contract preparation, reactivation or upgrade is likely to be complete. Some rigs have two ormore contracts in continuation, so the last line shows the last expected termination date. Some contracts may permitthe client to extend the contract.
(c) Dynamically positioned. (d) The Deepwater Nautilus is leased from its owner, an unrelated third party, pursuant to a fully defeased lease
arrangement. (e) Enterprise-class rig.(f) Express-class rig.
Other Floaters (23)
The following table provides certain information regarding our Other Floaters as of March 2, 2006:
Year Water Drilling Entered Depth DepthService/ Capacity Capacity Estimated
Name Type Upgraded(a) (in feet) (in feet) Location Customer Expiration (b)Sedco 700 .................................... OS 1973/1997 3,600 25,000 E. Guinea A. Hess January 2007 Transocean Amirante ................... OS 1978/1997 3,500 25,000 U.S. Gulf ENI March 2006
U.S. Gulf ENI/Nexen July 2006 U.S. Gulf Remington December 2006U.S. Gulf Shipyard January 2007
Transocean Legend ...................... OS 1983 3,500 25,000 Korea KNOC March 2006 – Mob/Contract Prep April 2006
Sakhalin Is. BP November 2007 C. Kirk Rhein, Jr. ......................... OS 1976/1997 3,300 25,000 U.S. Gulf Cold stacked −Transocean Driller ....................... OS 1991 3,000 25,000 Brazil Petrobras February 2006
Brazil Shipyard March 2006 Brazil Petrobras August 2010
Falcon 100 ................................... OS 1974/1999 2,400 25,000 U.S. Gulf DeepGulf Energy April 2006 U.S. Gulf Petrobras March 2007
Sedco 703 .................................... OS 1973/1995 2,000 25,000 Australia Woodside January 2007 Sedco 711 .................................... OS 1982 1,800 25,000 U.K. North Sea Shell June 2007
U.K. North Sea Shipyard July 2007 U.K. North Sea Shell October 2008
Transocean John Shaw ................ OS 1982 1,800 25,000 U.K. North Sea Nexen June 2007 – Shipyard July 2007
Sedco 714 .................................... OS 1983/1997 1,600 25,000 U.K. North Sea Total May 2007 Sedco 712 .................................... OS 1983 1,600 25,000 U.K. North Sea Oilexco March 2008
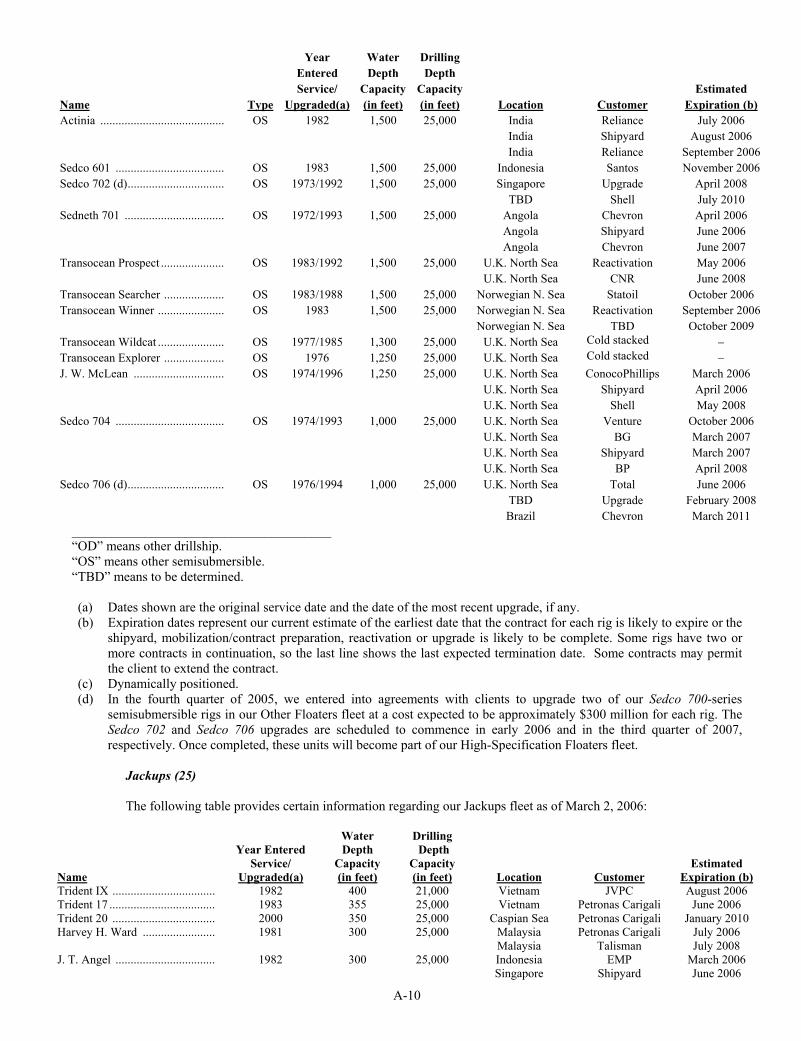
A-10
Year Water Drilling Entered Depth DepthService/ Capacity Capacity Estimated
Name Type Upgraded(a) (in feet) (in feet) Location Customer Expiration (b)Actinia ......................................... OS 1982 1,500 25,000 India Reliance July 2006
India Shipyard August 2006 India Reliance September 2006
Sedco 601 .................................... OS 1983 1,500 25,000 Indonesia Santos November 2006 Sedco 702 (d)................................ OS 1973/1992 1,500 25,000 Singapore Upgrade April 2008
TBD Shell July 2010 Sedneth 701 ................................. OS 1972/1993 1,500 25,000 Angola Chevron April 2006
Angola Shipyard June 2006 Angola Chevron June 2007
Transocean Prospect ..................... OS 1983/1992 1,500 25,000 U.K. North Sea Reactivation May 2006 U.K. North Sea CNR June 2008
Transocean Searcher .................... OS 1983/1988 1,500 25,000 Norwegian N. Sea Statoil October 2006 Transocean Winner ...................... OS 1983 1,500 25,000 Norwegian N. Sea Reactivation September 2006
Norwegian N. Sea TBD October 2009 Transocean Wildcat ...................... OS 1977/1985 1,300 25,000 U.K. North Sea Cold stacked −Transocean Explorer .................... OS 1976 1,250 25,000 U.K. North Sea Cold stacked −J. W. McLean .............................. OS 1974/1996 1,250 25,000 U.K. North Sea ConocoPhillips March 2006
U.K. North Sea Shipyard April 2006 U.K. North Sea Shell May 2008
Sedco 704 .................................... OS 1974/1993 1,000 25,000 U.K. North Sea Venture October 2006 U.K. North Sea BG March 2007 U.K. North Sea Shipyard March 2007 U.K. North Sea BP April 2008
Sedco 706 (d)................................ OS 1976/1994 1,000 25,000 U.K. North Sea Total June 2006 TBD Upgrade February 2008 Brazil Chevron March 2011
_______________________________________“OD” means other drillship.“OS” means other semisubmersible. “TBD” means to be determined.
(a) Dates shown are the original service date and the date of the most recent upgrade, if any. (b) Expiration dates represent our current estimate of the earliest date that the contract for each rig is likely to expire or the
shipyard, mobilization/contract preparation, reactivation or upgrade is likely to be complete. Some rigs have two ormore contracts in continuation, so the last line shows the last expected termination date. Some contracts may permitthe client to extend the contract.
(c) Dynamically positioned. (d) In the fourth quarter of 2005, we entered into agreements with clients to upgrade two of our Sedco 700-series
semisubmersible rigs in our Other Floaters fleet at a cost expected to be approximately $300 million for each rig. The Sedco 702 and Sedco 706 upgrades are scheduled to commence in early 2006 and in the third quarter of 2007, respectively. Once completed, these units will become part of our High-Specification Floaters fleet.
Jackups (25)
The following table provides certain information regarding our Jackups fleet as of March 2, 2006:
Year Entered Water Depth
Drilling Depth
Service/ Capacity Capacity Estimated Name Upgraded(a) (in feet) (in feet) Location Customer Expiration (b)Trident IX .................................. 1982 400 21,000 Vietnam JVPC August 2006 Trident 17 ................................... 1983 355 25,000 Vietnam Petronas Carigali June 2006 Trident 20 .................................. 2000 350 25,000 Caspian Sea Petronas Carigali January 2010 Harvey H. Ward ........................ 1981 300 25,000 Malaysia Petronas Carigali July 2006
Malaysia Talisman July 2008 J. T. Angel ................................. 1982 300 25,000 Indonesia EMP March 2006
Singapore Shipyard June 2006
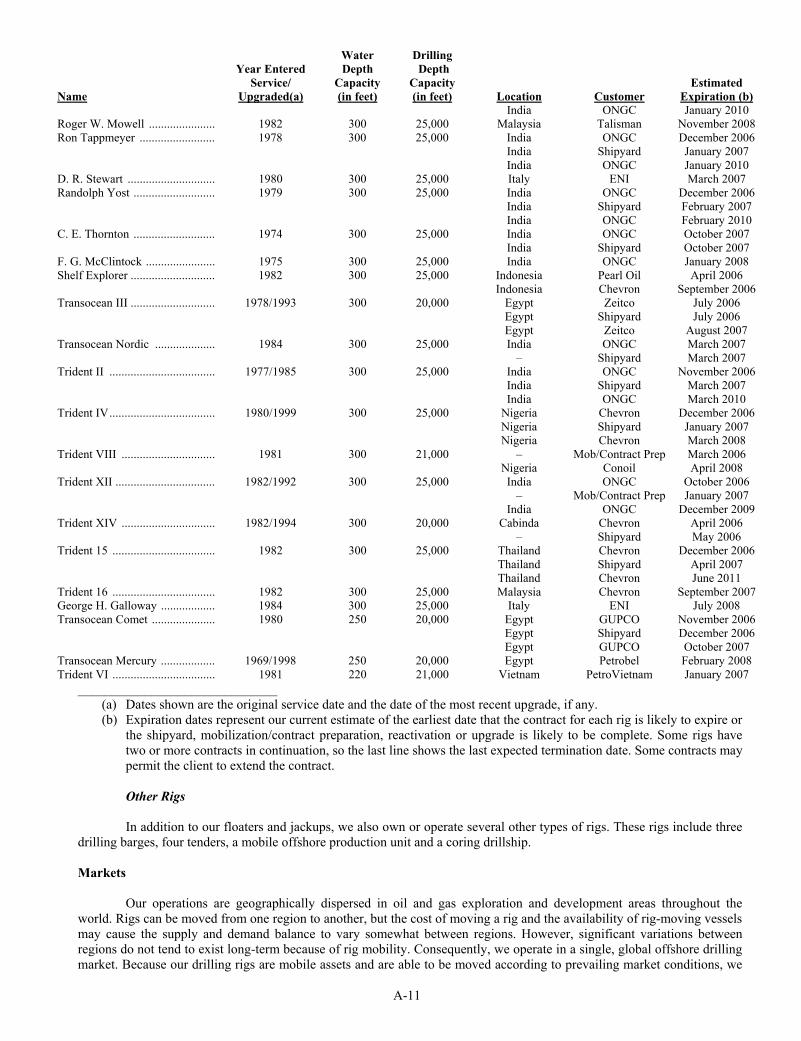
A-11
Year Entered Water Depth
Drilling Depth
Service/ Capacity Capacity Estimated Name Upgraded(a) (in feet) (in feet) Location Customer Expiration (b)
India ONGC January 2010 Roger W. Mowell ...................... 1982 300 25,000 Malaysia Talisman November 2008 Ron Tappmeyer ......................... 1978 300 25,000 India ONGC December 2006
India Shipyard January 2007 India ONGC January 2010
D. R. Stewart ............................. 1980 300 25,000 Italy ENI March 2007 Randolph Yost ........................... 1979 300 25,000 India ONGC December 2006
India Shipyard February 2007 India ONGC February 2010
C. E. Thornton ........................... 1974 300 25,000 India ONGC October 2007 India Shipyard October 2007
F. G. McClintock ....................... 1975 300 25,000 India ONGC January 2008 Shelf Explorer ............................ 1982 300 25,000 Indonesia Pearl Oil April 2006
Indonesia Chevron September 2006Transocean III ............................ 1978/1993 300 20,000 Egypt Zeitco July 2006
Egypt Shipyard July 2006 Egypt Zeitco August 2007
Transocean Nordic .................... 1984 300 25,000 India ONGC March 2007 – Shipyard March 2007
Trident II ................................... 1977/1985 300 25,000 India ONGC November 2006 India Shipyard March 2007 India ONGC March 2010
Trident IV................................... 1980/1999 300 25,000 Nigeria Chevron December 2006Nigeria Shipyard January 2007 Nigeria Chevron March 2008
Trident VIII ............................... 1981 300 21,000 – Mob/Contract Prep March 2006 Nigeria Conoil April 2008
Trident XII ................................. 1982/1992 300 25,000 India ONGC October 2006 – Mob/Contract Prep January 2007
India ONGC December 2009Trident XIV ............................... 1982/1994 300 20,000 Cabinda Chevron April 2006
– Shipyard May 2006 Trident 15 .................................. 1982 300 25,000 Thailand Chevron December 2006
Thailand Shipyard April 2007 Thailand Chevron June 2011
Trident 16 .................................. 1982 300 25,000 Malaysia Chevron September 2007George H. Galloway .................. 1984 300 25,000 Italy ENI July 2008 Transocean Comet ..................... 1980 250 20,000 Egypt GUPCO November 2006
Egypt Shipyard December 2006Egypt GUPCO October 2007
Transocean Mercury .................. 1969/1998 250 20,000 Egypt Petrobel February 2008 Trident VI .................................. 1981 220 21,000 Vietnam PetroVietnam January 2007
______________________________(a) Dates shown are the original service date and the date of the most recent upgrade, if any. (b) Expiration dates represent our current estimate of the earliest date that the contract for each rig is likely to expire or
the shipyard, mobilization/contract preparation, reactivation or upgrade is likely to be complete. Some rigs have two or more contracts in continuation, so the last line shows the last expected termination date. Some contracts maypermit the client to extend the contract.
Other Rigs
In addition to our floaters and jackups, we also own or operate several other types of rigs. These rigs include three drilling barges, four tenders, a mobile offshore production unit and a coring drillship.
Markets
Our operations are geographically dispersed in oil and gas exploration and development areas throughout the world. Rigs can be moved from one region to another, but the cost of moving a rig and the availability of rig-moving vesselsmay cause the supply and demand balance to vary somewhat between regions. However, significant variations betweenregions do not tend to exist long-term because of rig mobility. Consequently, we operate in a single, global offshore drilling market. Because our drilling rigs are mobile assets and are able to be moved according to prevailing market conditions, we

A-12
cannot predict the percentage of our revenues that will be derived from particular geographic or political areas in future periods.
In recent years, there has been increased emphasis by oil companies on exploring for hydrocarbons in deeperwaters. This is, in part, because of technological developments that have made such exploration more feasible and cost-effective. For this reason, water-depth capability is a key component in determining rig suitability for a particular drilling project. Another distinguishing feature in some drilling market sectors is a rig’s ability to operate in harsh environments, including extreme marine and climatic conditions and temperatures.
The deepwater and mid-water market sectors are serviced by our semisubmersibles and drillships. While the use of the term “deepwater” as used in the drilling industry to denote a particular sector of the market can vary and continues to evolve with technological improvements, we generally view the deepwater market sector as that which begins in water depths of approximately 4,500 feet and extends to the maximum water depths in which rigs are capable of drilling, which is currently approximately 10,000 feet. We view the mid-water market sector as that which covers water depths of about 300feet to approximately 4,500 feet.
The global shallow water market sector begins at the outer limit of the transition zone and extends to water depthsof about 300 feet. We service this sector with our jackups and drilling tenders. This sector has been developed to a significantly greater degree than the deepwater market sector because the shallower water depths have made it much moreaccessible than the deeper water market sectors.
The “transition zone” market sector is characterized by marshes, rivers, lakes, shallow bay and coastal water areas. We operate in this sector using our drilling barges located in Southeast Asia.
Operating Revenues and Long-Lived Assets by Country
Operating revenues and long-lived assets by country are as follows (in millions):
Years ended December 31, 2005 2004 2003
Operating Revenues United States.......................................................................................... $ 648 $ 856 $ 753Brazil ..................................................................................................... 265 278 317 India ....................................................................................................... 296 271 120 United Kingdom .................................................................................... 335 209 212 Other Countries (a) ................................................................................ 1,348 1,000 1,032
Total Operating Revenues................................................................. $ 2,892 $2,614 $2,434
As of December 31, 2005 2004
Long-Lived Assets United States.......................................................................................... $ 2,311 $2,397 Brazil ..................................................................................................... 762 865 Nigeria ................................................................................................... 980 811 Other Countries (a) ................................................................................ 2,695 2,932
Total Long-Lived Assets................................................................... $ 6,748 $7,005 ______________________(a) Other Countries represents countries in which we operate that individually had operating revenues or long-lived assets
representing less than 10 percent of total operating revenues earned or total long-lived assets.
Integrated Services
From time to time, we provide well services in addition to our normal drilling services through third partycontractors. We refer to these other services as integrated services. The work generally consists of individual contractual agreements to meet specific client needs and may be provided on either a dayrate or fixed price basis depending on the dailyactivity. As of March 2, 2006, we were performing such services in the North Sea and India. These integrated servicerevenues did not represent a material portion of our revenues for any period presented.
A-13
Drilling Contracts
Our contracts to provide offshore drilling services are individually negotiated and vary in their terms andprovisions. We obtain most of our contracts through competitive bidding against other contractors. Drilling contracts generally provide for payment on a dayrate basis, with higher rates while the drilling unit is operating and lower rates forperiods of mobilization or when drilling operations are interrupted or restricted by equipment breakdowns, adverse environmental conditions or other conditions beyond our control.
A dayrate drilling contract generally extends over a period of time covering either the drilling of a single well or group of wells or covering a stated term. These contracts typically can be terminated by the client under variouscircumstances such as the loss or destruction of the drilling unit or the suspension of drilling operations for a specifiedperiod of time as a result of a breakdown of major equipment. Many of these events are beyond our control. The contractterm in some instances may be extended by the client exercising options for the drilling of additional wells or for an additional term. Our contracts also typically include a provision that allows the client to extend the contract to finish drilling a well-in-progress. In reaction to depressed market conditions, our clients may seek renegotiation of firm drilling contracts to reduce their obligations or may seek to suspend or terminate their contracts. Some drilling contracts permit the customer to terminate the contract at the customer's option without paying a termination fee. Suspension of drilling contracts results in the reduction in or loss of dayrate for the period of the suspension. If our customers cancel some of our significant contractsand we are unable to secure new contracts on substantially similar terms, or if contracts are suspended for an extendedperiod of time, it could adversely affect our results of operations.
Significant Clients
We engage in offshore drilling for most of the leading international oil companies (or their affiliates), as well as for many government-controlled and independent oil companies. Major clients included BP, Shell, Petrobras, Chevron and ONGC. Our largest clients in 2005 were Chevron and BP accounting for 12.1 percent and 11.7 percent, respectively, of our 2005 operating revenues. No other client accounted for 10 percent or more of our 2005 operating revenues. The loss of any of these significant clients could, at least in the short term, have a material adverse effect on our results of operations.
Regulation
Our operations are affected from time to time in varying degrees by governmental laws and regulations. Thedrilling industry is dependent on demand for services from the oil and gas exploration industry and, accordingly, is affected by changing tax and other laws generally relating to the energy business.
International contract drilling operations are subject to various laws and regulations in countries in which we operate, including laws and regulations relating to the equipping and operation of drilling units, currency conversions and repatriation, oil and gas exploration and development, taxation of offshore earnings and earnings of expatriate personnel and use of local employees and suppliers by foreign contractors. Governments in some foreign countries are active in regulatingand controlling the ownership of concessions and companies holding concessions, the exportation of oil and gas and other aspects of the oil and gas industries in their countries. In addition, government action, including initiatives by theOrganization of Petroleum Exporting Countries (“OPEC”), may continue to cause oil price volatility. In some areas of the world, this governmental activity has adversely affected the amount of exploration and development work done by major oil companies and may continue to do so.
In the U.S., regulations applicable to our operations include certain regulations controlling the discharge ofmaterials into the environment and requiring the removal and cleanup of materials that may harm the environment orotherwise relating to the protection of the environment.
The U.S. Oil Pollution Act of 1990 (“OPA”) and related regulations impose a variety of requirements on “responsible parties” related to the prevention of oil spills and liability for damages resulting from such spills. Few defenses exist to the liability imposed by OPA, and such liability could be substantial. Failure to comply with ongoing requirements or inadequate cooperation in a spill event could subject a responsible party to civil or criminal enforcement action.
The U.S. Outer Continental Shelf Lands Act authorizes regulations relating to safety and environmental protection applicable to lessees and permittees operating on the outer continental shelf. Included among these are regulations that require the preparation of spill contingency plans and establish air quality standards for certain pollutants, including particulate matter, volatile organic compounds, sulfur dioxide, carbon monoxide and nitrogen oxides. Specific design and operational standards may apply to outer continental shelf vessels, rigs, platforms, vehicles and structures. Violations ofenvironmental related lease conditions or regulations issued pursuant to the U.S. Outer Continental Shelf Lands Act can
A-14
result in substantial civil and criminal penalties, as well as potential court injunctions curtailing operations and canceling leases. Such enforcement liabilities can result from either governmental or citizen prosecution.
The U.S. Comprehensive Environmental Response Compensation and Liability Act (“CERCLA”), also known as the “Superfund” law, imposes liability without regard to fault or the legality of the original conduct on some classes of persons that are considered to have contributed to the release of a “hazardous substance” into the environment. Thesepersons include the owner or operator of a facility where a release occurred and companies that disposed or arranged for the disposal of the hazardous substances found at a particular site. Persons who are or were responsible for releases ofhazardous substances under CERCLA may be subject to joint and several liability for the costs of cleaning up the hazardous substances that have been released into the environment and for damages to natural resources. It is not uncommon for thirdparties to file claims for personal injury and property damage allegedly caused by the hazardous substances released into the environment.
Many of the other countries in whose waters we are presently operating or may operate in the future haveregulations covering the discharge of oil and other contaminants in connection with drilling operations.
Governmental authorities in the U.S. are also reviewing various regulations relating to rig mooring requirements, particularly in the aftermath of the hurricane activity in 2005 in the Gulf of Mexico. We and the drilling industry areworking with the pertinent authorities as part of this process.
Although significant capital expenditures may be required to comply with various governmental laws and regulations, such compliance to date has not materially adversely affected our earnings or competitive position.
Employees
We require highly skilled personnel to operate our drilling units. As a result, we conduct extensive personnelrecruiting, training and safety programs. At January 31, 2006, we had approximately 9,600 employees and we also utilized approximately 2,000 persons through contract labor providers. As of such date, approximately 14 percent of our employees and contract labor worldwide worked under collective bargaining agreements, most of whom worked in Norway, U.K. andNigeria. Of these represented individuals, virtually all are working under agreements that are subject to salary negotiation in2006. These negotiations could result in higher personnel expenses, other increased costs or increased operating restrictions.
Available Information
Our website address is www.deepwater.com. We make our website content available for information purposes only. It should not be relied upon for investment purposes, nor is it incorporated by reference in this Form 10-K. We makeavailable on this website under “Investor Relations-Financial Reports,” free of charge, our annual reports on Form 10-K,quarterly reports on Form 10-Q, current reports on Form 8-K and amendments to those reports as soon as reasonablypracticable after we electronically file those materials with, or furnish those materials to, the Securities and ExchangeCommission (“SEC”). The SEC also maintains a website at www.sec.gov that contains reports, proxy statements and otherinformation regarding SEC registrants, including us.
You may also find information related to our corporate governance, board committees and company code of ethics at our website. Among the information you can find there is the following:
• Corporate Governance Guidelines; • Audit Committee Charter; • Corporate Governance Committee Charter; • Executive Compensation Committee Charter; • Finance and Benefits Committee Charter; and • Code of Ethics. We intend to satisfy the requirement under Item 5.05 of Form 8-K to disclose any amendments to our Code of
Ethics and any waiver from a provision of our Code of Ethics by posting such information in the Corporate Governancesection of our website at www.deepwater.com.
A-15
ITEM 1A. Risk Factors
Our business depends on the level of activity in the oil and gas industry, which is significantly affected by
volatile oil and gas prices.
Our business depends on the level of activity in oil and gas exploration, development and production in market sectors worldwide, with the U.S. and international offshore areas being our primary market sectors. Oil and gas prices and market expectations of potential changes in these prices significantly affect this level of activity. However, higher commodity prices do not necessarily translate into increased drilling activity since our customers' expectations of future commodity prices typically drive demand for our rigs. Worldwide military, political and economic events have contributed to oil and gas price volatility and are likely to do so in the future. Oil and gas prices are extremely volatile and are affected by numerous factors, including the following:
• worldwide demand for oil and gas,
• the ability of OPEC to set and maintain production levels and pricing,
• the level of production in non-OPEC countries,
• the policies of various governments regarding exploration and development of their oil and gas reserves,
• advances in exploration and development technology, and
• the worldwide military and political environment, including uncertainty or instability resulting from anescalation or additional outbreak of armed hostilities or other crises in the Middle East or other geographicareas or further acts of terrorism in the United States, or elsewhere.
Our industry is highly competitive and cyclical, with intense price competition.
The offshore contract drilling industry is highly competitive with numerous industry participants, none of which has a dominant market share. Drilling contracts are traditionally awarded on a competitive bid basis. Intense price competition is often the primary factor in determining which qualified contractor is awarded a job, although rig availabilityand the quality and technical capability of service and equipment may also be considered. Mergers among oil and natural gas exploration and production companies have reduced the number of available customers.
Our industry has historically been cyclical and is impacted by oil and gas price levels and volatility. There havebeen periods of high demand, short rig supply and high dayrates, followed by periods of low demand, excess rig supply andlow dayrates. Changes in commodity prices can have a dramatic effect on rig demand, and periods of excess rig supplyintensify the competition in the industry and often result in rigs being idle for long periods of time. We may be required toidle rigs or enter into lower rate contracts in response to market conditions in the future.
During prior periods of high utilization and dayrates, industry participants have increased the supply of rigs byordering the construction of new units. This has typically resulted in an oversupply of drilling units and has caused asubsequent decline in utilization and dayrates, sometimes for extended periods of time. As of March 2, 2006, there are approximately 21 high-specification rigs and 51 jackup rigs under contract for construction with delivery dates ranging from2006 to approximately 2010. There are also a number of mid-water semisubmersibles that are being upgraded to enhance their operating capability. The entry into service of these new and upgraded units will increase supply and could curtail a further strengthening of dayrates, or reduce them, in the affected markets or result in a softening of the affected markets asrigs are absorbed into the active fleet. Any further increase in construction of new drilling units would likely exacerbate thenegative impact on utilization and dayrates. Lower utilization and dayrates in one or more of the regions in which weoperate could adversely affect our revenues and profitability. Prolonged periods of low utilization and dayrates could alsoresult in the recognition of impairment charges on certain classes of our drilling rigs or our goodwill balance if future cashflow estimates, based upon information available to management at the time, indicate that the carrying value of these rigs, or the goodwill balance, may not be recoverable.
A-16
Our drilling contracts may be terminated due to a number of events.
Our customers may terminate or suspend some of our term drilling contracts under various circumstances such as the loss or destruction of the drilling unit, downtime or impaired performance caused by equipment or operational issues, some of which are beyond our control, or sustained periods of downtime due to force majeure events. Some drillingcontracts permit the customer to terminate the contract at the customer's option without paying a termination fee. Suspensionof drilling contracts results in loss of the dayrate for the period of the suspension. If our customers cancel some of oursignificant contracts and we are unable to secure new contracts on substantially similar terms, it could adversely affect our results of operations. In reaction to depressed market conditions, our customers may also seek renegotiation of firm drilling contracts to reduce their obligations.
Our business involves numerous operating hazards.
Our operations are subject to the usual hazards inherent in the drilling of oil and gas wells, such as blowouts, reservoir damage, loss of production, loss of well control, punch-throughs, craterings, fires and natural disasters such as hurricanes and tropical storms. The occurrence of these events could result in the suspension of drilling operations, damageto or destruction of the equipment involved and injury or death to rig personnel. We may also be subject to personal injuryand other claims of rig personnel as a result of our drilling operations. Operations also may be suspended because ofmachinery breakdowns, abnormal drilling conditions, and failure of subcontractors to perform or supply goods or services or personnel shortages. In addition, offshore drilling operations are subject to perils peculiar to marine operations, includingcapsizing, grounding, collision and loss or damage from severe weather. Damage to the environment could also result fromour operations, particularly through oil spillage or extensive uncontrolled fires. We may also be subject to property,environmental and other damage claims by oil and gas companies. Our insurance policies and contractual rights toindemnity may not adequately cover losses, and we do not have insurance coverage or rights to indemnity for all risks.
Consistent with standard industry practice, our clients generally assume, and indemnify us against, well control and subsurface risks under dayrate contracts. These risks are those associated with the loss of control of a well, such as blowoutor cratering, the cost to regain control or redrill the well and associated pollution. However, there can be no assurance thatthese clients will necessarily be financially able to indemnify us against all these risks. Also, we may be effectively prevented from enforcing these indemnities because of the nature of our relationship with some of our larger clients.
We have historically maintained broad insurance coverages, including coverages for property damage, occupational injury and illness, and general and marine third-party liabilities. Property damage insurance covers against marine and other perils, including losses due to capsizing, grounding, collision, fire, lightning, hurricanes, wind, storms, action of waves, punch-throughs, cratering, blowouts, explosion and war risks. We currently insure all of our offshoredrilling equipment for general and third party liabilities, occupational and illness risks, and property damage. We alsogenerally insure all of our offshore drilling rigs against property damage for amounts that take into account a number of factors including their approximate fair market value, replacement cost and net carrying value for financial reporting purposes.
In accordance with industry practices, we believe we are adequately insured for normal risks in our operations;however, such insurance coverage would not in all situations provide sufficient funds to protect us from all liabilities thatcould result from our drilling operations. Although our current practice is generally to insure all of our rigs as describedabove, our insurance would not completely cover the costs that would be required to replace certain of our units, including certain High-Specification Floaters. However, we may in the future take significant self-insured retentions for these coverages, and we may also decide to partially or fully self-insure our drilling rigs with respect to property damage. We do not carry insurance for loss of revenue and certain other claims may not be reimbursed by insurance carriers. Such lack ofreimbursement may cause us to incur substantial costs.
Our non-U.S. operations involve additional risks not associated with our U.S. operations.
We operate in various regions throughout the world that may expose us to political and other uncertainties, including risks of:
• terrorist acts, war and civil disturbances;
• expropriation or nationalization of equipment; and
• the inability to repatriate income or capital.
A-17
We are protected to a substantial extent against loss of capital assets, but generally not loss of revenue, from mostof these risks through insurance, indemnity provisions in our drilling contracts, or both. The necessity of insurance coverage for risks associated with political unrest, expropriation and environmental remediation for operating areas not covered underour existing insurance policies is evaluated on an individual contract basis. Although we maintain insurance in the areas inwhich we operate, pollution and environmental risks generally are not totally insurable. If a significant accident or other event occurs and is not fully covered by insurance or an enforceable or recoverable indemnity from a client, it could adversely affect our consolidated financial position, results of operations or cash flows. Moreover, no assurance can bemade that we will be able to maintain adequate insurance in the future at rates we consider reasonable or be able to obtaininsurance against certain risks, particularly in light of the instability and developments in the insurance markets followingthe terrorist attacks of September 11, 2001. As of March 2, 2006, all areas in which we were operating were covered byexisting insurance policies.
Many governments favor or effectively require the awarding of drilling contracts to local contractors or require foreign contractors to employ citizens of, or purchase supplies from, a particular jurisdiction. These practices may adversely affect our ability to compete.
Our non-U.S. contract drilling operations are subject to various laws and regulations in countries in which we operate, including laws and regulations relating to the equipment and operation of drilling units, currency conversions and repatriation, oil and gas exploration and development and taxation of offshore earnings and earnings of expatriate personnel.Governments in some foreign countries have become increasingly active in regulating and controlling the ownership ofconcessions and companies holding concessions, the exploration for oil and gas and other aspects of the oil and gas industries in their countries. In addition, government action, including initiatives by OPEC, may continue to cause oil or gas price volatility. In some areas of the world, this governmental activity has adversely affected the amount of exploration and development work done by major oil companies and may continue to do so.
Another risk inherent in our operations is the possibility of currency exchange losses where revenues are received and expenses are paid in nonconvertible currencies. We may also incur losses as a result of an inability to collect revenues because of a shortage of convertible currency available in the country of operation.
A change in tax laws of any country in which we operate could result in a higher tax rate on our worldwide
earnings.
We operate worldwide through our various subsidiaries. Consequently, we are subject to changing tax laws and policies in the jurisdictions in which we operate, which could include laws or policies directed toward companies organized in jurisdictions with low tax rates. A material change in the tax laws or policies of any country in which we have significantoperations could result in a higher effective tax rate on our worldwide earnings. In addition, our income tax returns are subject to review and examination in various jurisdictions in which we operate. See “Item 7. Management’s Discussion andAnalysis of Financial Condition and Results of Operations—Outlook–Tax Matters” and “—Critical Accounting Estimates–Income Taxes.”
Our shipyard projects are subject to delays and cost overruns.
We have scheduled one deepwater newbuild rig project, two Sedco 700-series rig upgrades and two reactivation projects in our Other Floaters fleet, and we are discussing other potential newbuild opportunities with several clients. Wealso have a variety of other more limited shipyard projects at any given time. Our shipyard projects are subject to the risksof delay or cost overruns inherent in any such construction project resulting from numerous factors, including the following:
• shipyard unavailability;
• shortages of equipment, materials or skilled labor;
• unscheduled delays in the delivery of ordered materials and equipment;
• engineering problems, including those relating to the commissioning of newly designed equipment;
• work stoppages;
• weather interference or storm damage;
• unanticipated cost increases; and
• difficulty in obtaining necessary permits or approvals.
A-18
These factors may contribute to cost variations and delays in the delivery of our upgraded and newbuild units and other rigs undergoing shipyard projects. Delays in the delivery of these units would result in delay in contractcommencement, resulting in a loss of revenue to us, and may also cause our customer to terminate or shorten the term of the drilling contract for the rig pursuant to applicable late delivery clauses. In the event of termination of one of these contracts, we may not be able to secure a replacement contract on as favorable terms.
Failure to retain key personnel could hurt our operations.
We require highly skilled personnel to operate and provide technical services and support for our drilling units. Tothe extent that demand for drilling services and the size of the worldwide industry fleet increase, shortages of qualifiedpersonnel could arise, creating upward pressure on wages. We are continuing our recruitment and training programs as required to meet our anticipated personnel needs.
On January 31, 2006, approximately 14 percent of our employees and contracted labor worldwide worked undercollective bargaining agreements, most of whom worked in Norway, U.K. and Nigeria. Of these represented individuals,virtually all are working under agreements that are subject to salary negotiation in 2006. These negotiations could result inhigher personnel expenses, other increased costs or increased operating restrictions.
Public health threats could have a material adverse effect on our operations and our financial results.
Public health threats, such as the bird flu, Severe Acute Respiratory Syndrome (SARS), and other highlycommunicable diseases, outbreaks of which have already occurred in various parts of the world in which we operate, could adversely impact our operations, the operations of our clients and the global economy including the worldwide demand for oil and natural gas and the level of demand for our services. Any quarantine of personnel or inability to access our offices orrigs could adversely affect our operations. Travel restrictions or operational problems in any part of the world in which weoperate, or any reduction in the demand for drilling services caused by public health threats in the future, may materially impact operations and adversely affect our financial results.
Compliance with or breach of environmental laws can be costly and could limit our operations.
Our operations are subject to regulations controlling the discharge of materials into the environment, requiring removal and cleanup of materials that may harm the environment or otherwise relating to the protection of the environment.For example, as an operator of mobile offshore drilling units in navigable U.S. waters and some offshore areas, we may beliable for damages and costs incurred in connection with oil spills related to those operations. Laws and regulationsprotecting the environment have become more stringent in recent years, and may in some cases impose strict liability,rendering a person liable for environmental damage without regard to negligence. These laws and regulations may expose usto liability for the conduct of or conditions caused by others or for acts that were in compliance with all applicable laws atthe time they were performed. The application of these requirements or the adoption of new requirements could have amaterial adverse effect on our consolidated financial position, results of operations or cash flows.
We have generally been able to obtain some degree of contractual indemnification pursuant to which our clientsagree to protect and indemnify us against liability for pollution, well and environmental damages; however, there is noassurance that we can obtain such indemnities in all of our contracts or that, in the event of extensive pollution andenvironmental damages, our clients will have the financial capability to fulfill their contractual obligations to us. Also, these indemnities may not be enforceable in all instances. In addition, we may be effectively prevented from enforcing these indemnities because of the nature of our relationship with some of our larger clients.
World political events could affect the markets for drilling services.
In the past several years, world political events have resulted in military action in Afghanistan and Iraq and terrorist attacks and related unrest. Military action by the U.S. or other nations could escalate and further acts of terrorism may occurin the U.S. or elsewhere. Such acts of terrorism could be directed against companies such as ours. Such developments have caused instability in the world's financial and insurance markets in the past. In addition, these developments could lead toincreased volatility in prices for crude oil and natural gas and could affect the markets for drilling services. Insurance premiums have increased and could rise further and coverages may be unavailable in the future.
U.S. government regulations may effectively preclude us from actively engaging in business activities in certain countries. These regulations could be amended to cover countries where we currently operate or where we may wish tooperate in the future.
A-19
ITEM 1B. Unresolved Staff Comments
None.
ITEM 2. Properties
The description of our property included under “Item 1. Business” is incorporated by reference herein.
We maintain offices, land bases and other facilities worldwide, including our principal executive offices inHouston, Texas and regional operational offices in the U.S., France and Singapore. Our remaining offices and bases arelocated in various countries in North America, South America, the Caribbean, Europe, Africa, Russia, the Middle East, India, Asia and Australia. We lease most of these facilities.
ITEM 3. Legal Proceedings
Several of our subsidiaries have been named, along with other defendants, in several complaints that have been filed in the Circuit Courts of the State of Mississippi involving over 700 persons that allege personal injury arising out ofasbestos exposure in the course of their employment by some of these defendants between 1965 and 1986. The complaintsalso name as defendants certain of TODCO's subsidiaries to whom we may owe indemnity and other unaffiliated defendantcompanies, including companies that allegedly manufactured drilling related products containing asbestos that are thesubject of the complaints. The number of unaffiliated defendant companies involved in each complaint ranges fromapproximately 20 to 70. The complaints allege that the defendant drilling contractors used those asbestos-containing products in offshore drilling operations, land based drilling operations and in drilling structures, drilling rigs, vessels andother equipment and assert claims based on, among other things, negligence and strict liability, and claims authorized under the Jones Act. The plaintiffs seek, among other things, awards of unspecified compensatory and punitive damages. The trial court has ordered that the plaintiffs provide additional information regarding their employment histories. We have not yethad an opportunity to conduct extensive discovery nor have we been able to definitively determine the number of plaintiffs that were employed by our subsidiaries or otherwise have any connection with our drilling operations. We intend to defendourselves vigorously and, based on the limited information available to us at this time, we do not expect the liability, if any, resulting from these matters to have a material adverse effect on our consolidated financial position, results of operations orcash flows.
In 1990 and 1991, two of our subsidiaries were served with various assessments collectively valued atapproximately $10 million from the municipality of Rio de Janeiro, Brazil to collect a municipal tax on services. We believethat neither subsidiary is liable for the taxes and have contested the assessments in the Brazilian administrative and courtsystems. We have received several adverse rulings by various courts with respect to a June 1991 assessment, which is valued at approximately $9 million. We are continuing to challenge the assessment, however, and have an action to stay execution of a related tax foreclosure proceeding. We expect that the government will attempt to enforce the judgment onthis assessment and that the amount claimed may exceed the amounts we believe are at issue. We received a favorableruling in connection with a disputed August 1990 assessment and the government has lost what is expected to be its finalappeal with respect to that ruling. We also are awaiting a ruling from the Taxpayer's Council in connection with an October1990 assessment. If our defenses are ultimately unsuccessful, we believe that the Brazilian government-controlled oilcompany, Petrobras, has a contractual obligation to reimburse us for these municipal tax payments. We do not expect theliability, if any, resulting from these assessments to have a material adverse effect on our consolidated financial position,results of operations or cash flows.
The Indian Customs Department, Mumbai, filed a "show cause notice" against one of our subsidiaries and various third parties in July 1999. The show cause notice alleged that the initial entry into India in 1988 and other subsequentmovements of the Trident II jackup rig operated by the subsidiary constituted imports and exports for which proper customs procedures were not followed and sought payment of customs duties of approximately $31 million based on an alleged 1998 rig value of $49 million, plus interest and penalties, and confiscation of the rig. In January 2000, the Customs Departmentissued its order, which found that we had imported the rig improperly and intentionally concealed the import from the authorities, and directed us to pay a redemption fee of approximately $3 million for the rig in lieu of confiscation and to paypenalties of approximately $1 million in addition to the amount of customs duties owed. In February 2000, we filed an appeal with the Customs, Excise and Service Tax Appellate Tribunal (“CESTAT”), together with an application to have the confiscation of the rig stayed pending the outcome of the appeal. In March 2000, the CESTAT ruled on the stay application, directing that the confiscation be stayed pending the appeal. The CESTAT issued its order on our appeal on February 2,2001, and while it found that the rig was imported in 1988 without proper documentation or payment of duties, theredemption fee and penalties were reduced to less than $0.1 million in view of the ambiguity surrounding the importpractice at the time and the lack of intentional concealment by us. The CESTAT further sustained our position regarding thevalue of the rig at the time of import as $13 million and ruled that subsequent movements of the rig were not liable to import
A-20
documentation or duties in view of the prevailing practice of the Customs Department, thus limiting our exposure as to custom duties to approximately $6 million. Although CESTAT did not grant us the benefit of a customs duty exemption due to the absence of the required documentation, CESTAT left it open for our subsidiary to seek such documentation from the Ministry of Petroleum. Following the CESTAT order, we tendered payment of redemption, penalty and duty in the amount specified by the order by offset against a $0.6 million deposit and $10.7 million guarantee previously made by us. TheCustoms Department attempted to draw the entire guarantee, alleging the actual duty payable is approximately $22 million based on an interpretation of the CESTAT order that we believe is incorrect. This action was stopped by an interim ruling of the High Court, Mumbai on writ petition filed by us. We and the Customs Department both filed appeals with the SupremeCourt of India against the order of the CESTAT, and both appeals were admitted. The Supreme Court has dismissed theCustoms Department appeal and affirmed the CESTAT order but the Customs Department has not agreed with ourinterpretation of that order. We are contesting their interpretation. We and our customer agreed to pursue and obtained theissuance of the required documentation from the Ministry of Petroleum that, if accepted by the Customs Department, would reduce the duty to nil. The Customs Department did not accept the documentation or agree to refund the duties already paid. We are pursuing our remedies against the Customs Department and our customer. We do not expect the liability, if any, resulting from this matter to have a material adverse effect on our consolidated financial position, results of operations orcash flows.
In October 2001, TODCO was notified by the U.S. Environmental Protection Agency ("EPA") that the EPA hadidentified a subsidiary as a potentially responsible party in connection with the Palmer Barge Line superfund site located inPort Arthur, Texas. Based upon the information provided by the EPA and a review of TODCO's internal records to date, TODCO disputes its designation as a potentially responsible party. Pursuant to the master separation agreement withTODCO, we are responsible and will indemnify TODCO for any losses TODCO incurs in connection with this action. Wedo not expect the liability, if any, resulting from this matter to have a material adverse effect on our consolidated financialposition, results of operations or cash flows.
In August 2003, a judgment of approximately $9.5 million was entered by the Labor Division of the ProvincialCourt of Luanda, Angola, against us and one of our labor contractors, Hull Blyth, in favor of certain former workers on several of our drilling rigs. The workers were employed by Hull Blyth to work on several drilling rigs while the rigs were located in Angola. When the drilling contracts concluded and the rigs left Angola, the workers' employment ended. The workers brought suit claiming that they were not properly compensated when their employment ended. In addition to the monetary judgment, the Labor Division ordered the workers to be hired by us. We believe that this judgment is withoutsufficient legal foundation and have appealed the matter to the Angola Supreme Court. We further believe that Hull Blyth has an obligation to protect us from any judgment. We do not expect the liability, if any, resulting from this matter to have amaterial adverse effect on our consolidated financial position, results of operations or cash flows.
One of our subsidiaries is involved in an action with respect to customs penalties relating to the Sedco 710semisubmersible drilling rig. Prior to the Sedco Forex merger, this drilling rig, which was working for Petrobras in Brazil atthe time, had been admitted into the country on a temporary basis under authority granted to a Schlumberger entity. Prior tothe Sedco Forex merger, the drilling contract was moved to an entity that would become one of our subsidiaries. In early 2000, the drilling contract was extended for another year. On January 10, 2000, the temporary import permit granted to theSchlumberger entity expired, and renewal filings were not made until later that January. In April 2000, the Braziliancustoms authorities cancelled the import permit. The Schlumberger entity filed an action in the Brazilian federal court ofCampos for the purpose of extending the temporary admission. Other proceedings were also initiated in order to secure thetransfer of the temporary admission to our subsidiary. Ultimately, the court permitted the transfer to our entity but has notruled that the temporary admission could be extended without the payment of a financial penalty. During the first quarter of 2004, the customs office renewed its efforts to collect a penalty and issued a second assessment for this penalty but has nowdone so against our subsidiary. The assessment is for approximately $71 million. We believe that the amount of theassessment, even if it were appropriate, should only be approximately $7 million and should in any event be assessedagainst the Schlumberger entity. We and Schlumberger are contesting our respective assessments. We have putSchlumberger on notice that we consider any assessment to be the responsibility of Schlumberger. We do not expect theliability, if any, resulting from this matter to have a material adverse effect on our consolidated financial position, results of operations or cash flows.
We have a dispute with TODCO concerning payment to us under our tax sharing agreement with TODCO for thetax benefit that TODCO derives from exercises of options to purchase our ordinary shares held by employees of TODCO.An arbitration proceeding was initiated in January 2006, and the parties are in the process of appointing an arbitrator. Weare seeking payment of the amount of tax benefits derived from exercises of options to purchase our ordinary shares byemployees of TODCO who were not on the payroll of TODCO at the time of exercise and a declaration that TODCO pay us for the benefit derived from such exercises in the future. TODCO is seeking to avoid such payment and is asking that the entire tax sharing agreement be voided. TODCO also filed suit in Houston in the district court of the State of Texas inJanuary 2006 seeking to set aside the arbitration provision and to void the entire tax sharing agreement. We believe
A-21
TODCO owes us approximately $10.7 million based on options exercised through December 31, 2005, and we do notbelieve TODCO’s attempts to void the tax sharing agreement have merit. We do not expect the outcome of this matter tohave a material adverse effect on our consolidated financial position, results of operations or cash flows.
We are involved in various tax matters as described in "Item 7. Management's Discussion and Analysis ofFinancial Condition and Results of Operations—Outlook—Tax Matters." We are also involved in a number of other lawsuits, all of which have arisen in the ordinary course of our business. We do not expect the liability, if any, resulting from these other matters to have a material adverse effect on our consolidated financial position, results of operations orcash flows. We cannot predict with certainty the outcome or effect of any of the litigation matters specifically describedabove or of any such other pending or threatened litigation. There can be no assurance that our beliefs or expectations as to the outcome or effect of any lawsuit or other litigation matter will prove correct and the eventual outcome of these matters could materially differ from management's current estimates.
ITEM 4. Submission of Matters to a Vote of Security Holders
The Company did not submit any matter to a vote of its security holders during the fourth quarter of 2005.
Executive Officers of the Registrant
Age as ofOfficer Office March 1, 2006
Robert L. Long..................... President and Chief Executive Officer 60 Jean P. Cahuzac ................... Executive Vice President and Chief Operating Officer 52 Eric B. Brown ...................... Senior Vice President, General Counsel and Corporate Secretary 54 Gregory L. Cauthen ............. Senior Vice President and Chief Financial Officer 48 Steven L. Newman............... Senior Vice President, Human Resources, Information Process
Solutions and Treasury41
David A. Tonnel .................. Vice President and Controller 36
The officers of the Company are elected annually by the board of directors. There is no family relationship betweenany of the above-named executive officers.
Robert L. Long is President, Chief Executive Officer and a member of the board of directors of the Company. Mr. Long served as President of the Company from December 2001 to October 2002, at which time he assumed the additionalposition of Chief Executive Officer and became a member of the board of directors. Mr. Long served as Chief FinancialOfficer of the Company from August 1996 until December 2001. Mr. Long served as Senior Vice President of the Company from May 1990 until the time of the Sedco Forex merger, at which time he assumed the position of Executive Vice President. Mr. Long also served as Treasurer of the Company from September 1997 until March 2001. Mr. Long has been employed by the Company since 1976 and was elected Vice President in 1987.
Jean P. Cahuzac is Executive Vice President and Chief Operating Officer of the Company. Mr. Cahuzac served asExecutive Vice President, Operations of the Company from February 2001 until October 2002, at which time he assumedhis current position. Mr. Cahuzac served as President of Sedco Forex from January 1999 until the time of the Sedco Forex merger, at which time he assumed the positions of Executive Vice President and President, Europe, Middle East and Africa with the Company. Mr. Cahuzac served as Vice President-Operations Manager of Sedco Forex from May 1998 to January 1999, Region Manager-Europe, Africa and CIS of Sedco Forex from September 1994 to May 1998 and Vice President/General Manager-North Sea Region of Sedco Forex from February 1994 to September 1994. He had beenemployed by Schlumberger since 1979.
Eric B. Brown is Senior Vice President, General Counsel and Corporate Secretary of the Company. Mr. Brownserved as Vice President and General Counsel of the Company since February 1995 and Corporate Secretary of theCompany since September 1995. He assumed the position of Senior Vice President in February 2001. Prior to assuming his duties with the Company, Mr. Brown served as General Counsel of Coastal Gas Marketing Company.
Gregory L. Cauthen is Senior Vice President and Chief Financial Officer of the Company. He was also Treasurerof the Company until July 2003. Mr. Cauthen served as Vice President, Chief Financial Officer and Treasurer fromDecember 2001 until he was elected in July 2002 as Senior Vice President. Mr. Cauthen served as Vice President, Finance from March 2001 to December 2001. Prior to joining the Company, he served as President and Chief Executive Officer of WebCaskets.com, Inc., a provider of death care services, from June 2000 until February 2001. Prior to June 2000, he was employed at Service Corporation International, a provider of death care services, where he served as Senior Vice President,Financial Services from July 1998 to August 1999, Vice President, Treasurer from July 1995 to July 1998, was assigned to
A-22
various special projects from August 1999 to May 2000 and had been employed in various other positions since February1991.
Steven L. Newman is Senior Vice President of Human Resources, Information Process Solutions and Treasury. Mr.Newman served as Vice President of Performance and Technology of the Company from August 2003 until March 2005, atwhich time he assumed his current position. Mr. Newman served as Regional Manager, Asia Australia from May 2001 untilAugust 2003. From December 2000 to May 2001, Mr. Newman served as Region Operations Manager of the Africa-Mediterranean Region of the Company. From April 1999 to December 2000, Mr. Newman served in various operational and marketing roles in the Africa-Mediterranean and U.K. region offices. Mr. Newman has been employed by the Company since 1994.
David A. Tonnel is Vice President and Controller of the Company. Mr. Tonnel served as Assistant Controller of the Company from May 2003 to February 2005, at which time he assumed his current position. Mr. Tonnel served as Finance Manager, Asia Australia Region from October 2000 to May 2003 and as Controller, Nigeria from April 1999 toOctober 2000. Mr. Tonnel joined the Company in 1996 after working for Ernst & Young in France as Senior Auditor.
A-23
PART II
ITEM 5. Market for Registrant's Common Equity, Related Shareholder Matters and Issuer Purchases of Equity
Securities
Our ordinary shares are listed on the New York Stock Exchange (the “NYSE”) under the symbol “RIG.” Thefollowing table sets forth the high and low sales prices of our ordinary shares for the periods indicated as reported on the NYSE Composite Tape.
Price High Low
2004 First Quarter ........................................................................ $31.94 $23.10 Second Quarter.................................................................... 29.27 24.49 Third Quarter ...................................................................... 36.24 25.94 Fourth Quarter..................................................................... 43.25 33.70
2005 First Quarter ........................................................................ $51.97 $39.79 Second Quarter.................................................................... 58.19 43.16 Third Quarter ...................................................................... 63.11 53.52 Fourth Quarter..................................................................... 70.93 52.34
On February 28, 2006, the last reported sales price of our ordinary shares on the NYSE Composite Tape was$74.18 per share. On such date, there were 12,747 holders of record of our ordinary shares and 325,966,986 ordinary shares outstanding.
We paid quarterly cash dividends of $0.03 per ordinary share from the fourth quarter of 1993 to the second quarterof 2002. Any future declaration and payment of dividends will (i) depend on our results of operations, financial condition,cash requirements and other relevant factors, (ii) be subject to the discretion of the board of directors, (iii) be subject torestrictions contained in our revolving credit agreement and other debt covenants and (iv) be payable only out of our profitsor share premium account in accordance with Cayman Islands law.
There is currently no reciprocal tax treaty between the Cayman Islands and the United States. Under current Cayman Islands law, there is no withholding tax on dividends.
We are a Cayman Islands exempted company. Our authorized share capital is $13,000,000, divided into800,000,000 ordinary shares, par value $0.01, and 50,000,000 preference shares, par value $0.10, of which shares may bedesignated and created as shares of any other classes or series of shares with the respective rights and restrictionsdetermined by action of our board of directors. On February 28, 2006, no preference shares were outstanding.
The holders of ordinary shares are entitled to one vote per share other than on the election of directors.
With respect to the election of directors, each holder of ordinary shares entitled to vote at the election has the rightto vote, in person or by proxy, the number of shares held by him for as many persons as there are directors to be elected and for whose election that holder has a right to vote. The directors are divided into three classes, with only one class being upfor election each year. Directors are elected by a plurality of the votes cast in the election. Cumulative voting for the election of directors is prohibited by our articles of association.
There are no limitations imposed by Cayman Islands law or our articles of association on the right of nonresident shareholders to hold or vote their ordinary shares.
The rights attached to any separate class or series of shares, unless otherwise provided by the terms of the shares ofthat class or series, may be varied only with the consent in writing of the holders of all of the issued shares of that class or series or by a special resolution passed at a separate general meeting of holders of the shares of that class or series. The necessary quorum for that meeting is the presence of holders of at least a majority of the shares of that class or series. Eachholder of shares of the class or series present, in person or by proxy, will have one vote for each share of the class or series of which he is the holder. Outstanding shares will not be deemed to be varied by the creation or issuance of additional shares that rank in any respect prior to or equivalent with those shares.
A-24
Under Cayman Islands law, some matters, like altering the memorandum or articles of association, changing thename of a company, voluntarily winding up a company or resolving to be registered by way of continuation in a jurisdictionoutside the Cayman Islands, require approval of shareholders by a special resolution. A special resolution is a resolution (1)passed by the holders of two-thirds of the shares voted at a general meeting or (2) approved in writing by all shareholdersentitled to vote at a general meeting of the company.
The presence of shareholders, in person or by proxy, holding at least a majority of the issued shares generallyentitled to vote at a meeting, is a quorum for the transaction of most business. However, different quorums are required insome cases to approve a change in our articles of association.
Our board of directors is authorized, without obtaining any vote or consent of the holders of any class or series ofshares unless expressly provided by the terms of issue of that class or series, to provide from time to time for the issuance of classes or series of preference shares and to establish the characteristics of each class or series, including the number ofshares, designations, relative voting rights, dividend rights, liquidation and other rights, redemption, repurchase or exchangerights and any other preferences and relative, participating, optional or other rights and limitations not inconsistent withapplicable law.
Our articles of association contain provisions that could prevent or delay an acquisition of our Company by means of a tender offer, proxy contest or otherwise.
The foregoing description is a summary. This summary is not complete and is subject to the complete text of our memorandum and articles of association. For more information regarding our ordinary shares and our preference shares, see our Current Report on Form 8-K dated May 14, 1999 and our memorandum and articles of association. Our memorandumand articles of association are filed as exhibits to this annual report.
Issuer Purchases of Equity Securities
Period
(a) Total Number
of Shares Purchased (1)
(b) AveragePrice
Paid PerShare
(c) Total Number ofShares Purchased as
Part of PubliclyAnnounced Plans or
Programs (2)
(d) Maximum Number (or Approximate Dollar
Value) of Shares that May Yet Be Purchased Under the Plans or Programs (2)
(in millions) October 2005...... (149) $52.01 N/A $2,000.0November 2005.. — — N/A N/A December 2005 .. 6,040,230 66.44 6,014,751 1,600.0 Total ................... 6,040,081 $66.44 6,014,751 $1,600.0
_________________(1) Total number of shares purchased in December 2005 includes 25,479 shares withheld by us in satisfaction of
withholding taxes due upon the vesting of restricted shares granted to our employees under our Long-Term Incentive Plan to pay withholding taxes due upon vesting of a restricted share award.
(2) In October 2005, our board of directors authorized the repurchase of up to $2 billion of our ordinary shares. The shares may be repurchased from time to time in open market or private transactions. The repurchase program does not have an established expiration date and may be suspended or discontinued at any time. Under the program, repurchased shares are retired and returned to unissued status. From inception through December 31, 2005, we haverepurchased a total of 6,014,751 of our ordinary shares at a total cost of $400 million ($66.50 per share).
ITEM 6. Selected Financial Data
The selected financial data as of December 31, 2005 and 2004 and for each of the three years in the period ended December 31, 2005 has been derived from the audited consolidated financial statements included elsewhere herein. Theselected financial data as of December 31, 2003, 2002 and 2001, and for the years ended December 31, 2002 and 2001 hasbeen derived from audited consolidated financial statements not included herein. The following data should be read inconjunction with “Item 7. Management's Discussion and Analysis of Financial Condition and Results of Operations” and the audited consolidated financial statements and the notes thereto included under “Item 8. Financial Statements and Supplementary Data.”
On January 31, 2001, we completed a merger transaction with R&B Falcon. As a result of the merger, R&B Falconbecame our indirect wholly owned subsidiary. The merger was accounted for as a purchase and we were treated as the
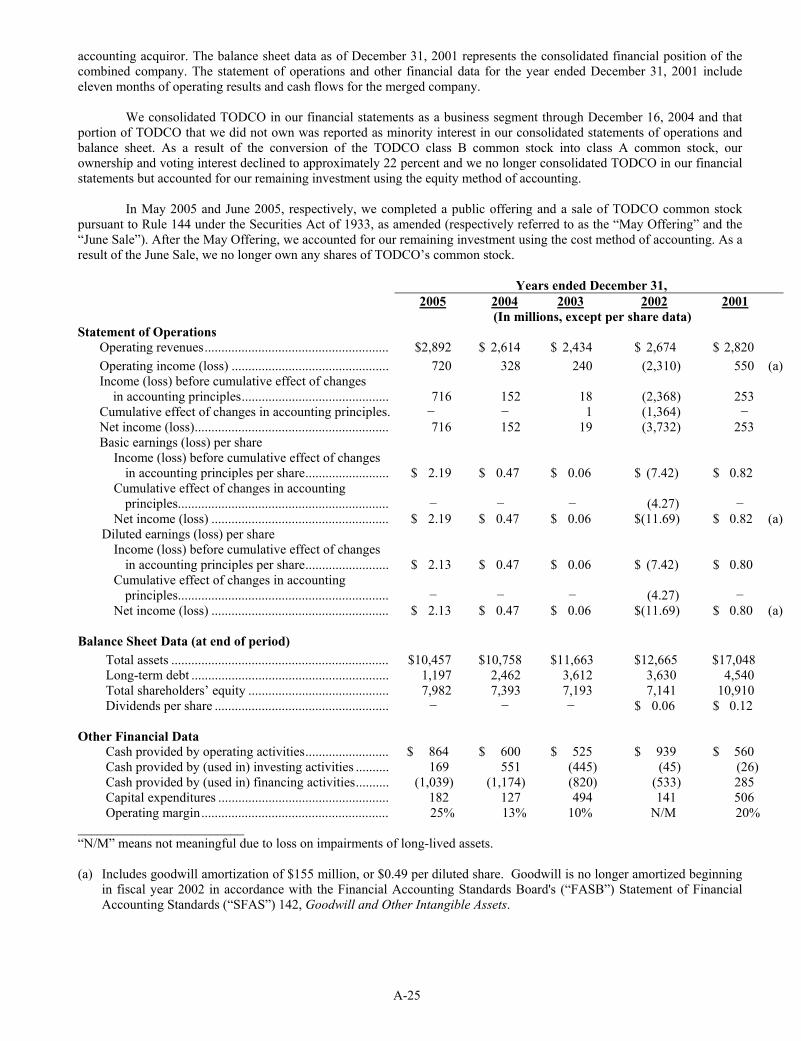
A-25
accounting acquiror. The balance sheet data as of December 31, 2001 represents the consolidated financial position of the combined company. The statement of operations and other financial data for the year ended December 31, 2001 include eleven months of operating results and cash flows for the merged company.
We consolidated TODCO in our financial statements as a business segment through December 16, 2004 and that portion of TODCO that we did not own was reported as minority interest in our consolidated statements of operations and balance sheet. As a result of the conversion of the TODCO class B common stock into class A common stock, ourownership and voting interest declined to approximately 22 percent and we no longer consolidated TODCO in our financialstatements but accounted for our remaining investment using the equity method of accounting.
In May 2005 and June 2005, respectively, we completed a public offering and a sale of TODCO common stockpursuant to Rule 144 under the Securities Act of 1933, as amended (respectively referred to as the “May Offering” and the“June Sale”). After the May Offering, we accounted for our remaining investment using the cost method of accounting. As a result of the June Sale, we no longer own any shares of TODCO’s common stock.
Years ended December 31, 2005 2004 2003 2002 2001
(In millions, except per share data) Statement of Operations
Operating revenues....................................................... $2,892 $ 2,614 $ 2,434 $ 2,674 $ 2,820 Operating income (loss) ............................................... 720 328 240 (2,310) 550 (a)Income (loss) before cumulative effect of changes in accounting principles............................................ 716 152 18 (2,368) 253 Cumulative effect of changes in accounting principles. − − 1 (1,364) −Net income (loss).......................................................... 716 152 19 (3,732) 253 Basic earnings (loss) per share
Income (loss) before cumulative effect of changes in accounting principles per share......................... $ 2.19 $ 0.47 $ 0.06 $ (7.42) $ 0.82 Cumulative effect of changes in accounting
principles............................................................... − − − (4.27) −Net income (loss) ..................................................... $ 2.19 $ 0.47 $ 0.06 $(11.69) $ 0.82 (a)
Diluted earnings (loss) per share Income (loss) before cumulative effect of changes in accounting principles per share......................... $ 2.13 $ 0.47 $ 0.06 $ (7.42) $ 0.80 Cumulative effect of changes in accounting
principles............................................................... − − − (4.27) −Net income (loss) ..................................................... $ 2.13 $ 0.47 $ 0.06 $(11.69) $ 0.80 (a)
Balance Sheet Data (at end of period)Total assets ................................................................. $10,457 $10,758 $11,663 $12,665 $17,048 Long-term debt ........................................................... 1,197 2,462 3,612 3,630 4,540 Total shareholders’ equity .......................................... 7,982 7,393 7,193 7,141 10,910 Dividends per share .................................................... − − − $ 0.06 $ 0.12
Other Financial Data Cash provided by operating activities......................... $ 864 $ 600 $ 525 $ 939 $ 560 Cash provided by (used in) investing activities .......... 169 551 (445) (45) (26) Cash provided by (used in) financing activities.......... (1,039) (1,174) (820) (533) 285 Capital expenditures ................................................... 182 127 494 141 506 Operating margin........................................................ 25% 13% 10% N/M 20%
_________________________“N/M” means not meaningful due to loss on impairments of long-lived assets.
(a) Includes goodwill amortization of $155 million, or $0.49 per diluted share. Goodwill is no longer amortized beginningin fiscal year 2002 in accordance with the Financial Accounting Standards Board's (“FASB”) Statement of Financial Accounting Standards (“SFAS”) 142, Goodwill and Other Intangible Assets.
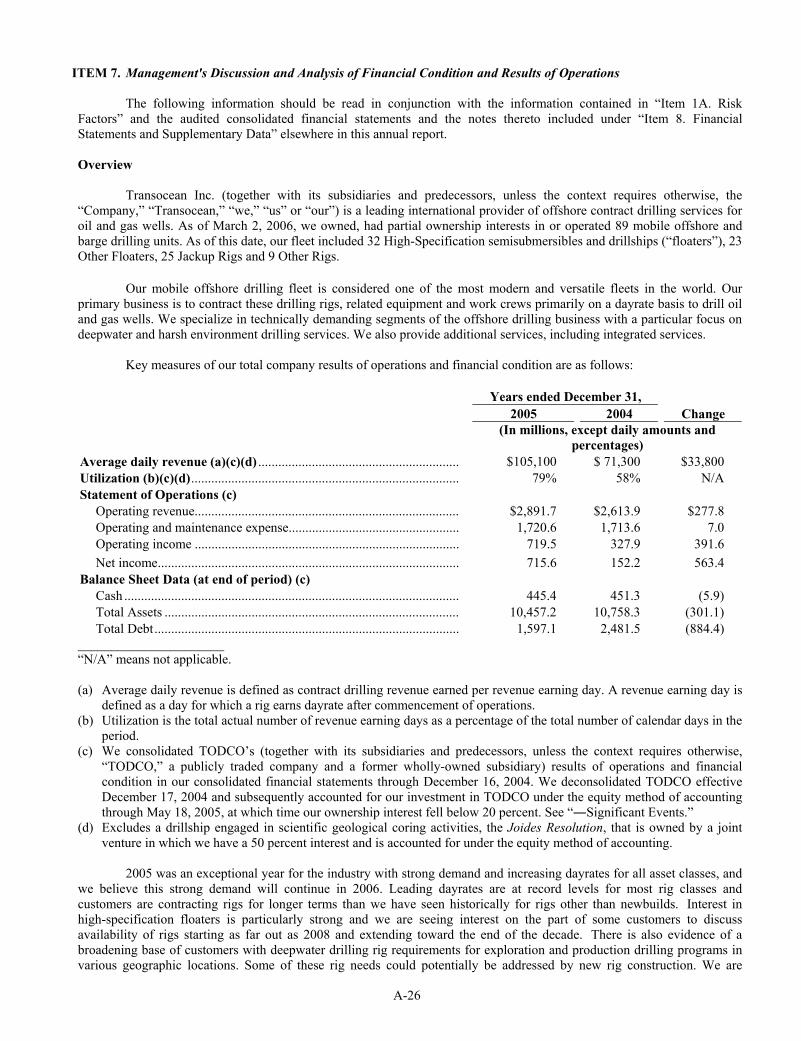
A-26
ITEM 7. Management's Discussion and Analysis of Financial Condition and Results of Operations
The following information should be read in conjunction with the information contained in “Item 1A. Risk Factors” and the audited consolidated financial statements and the notes thereto included under “Item 8. FinancialStatements and Supplementary Data” elsewhere in this annual report.
Overview
Transocean Inc. (together with its subsidiaries and predecessors, unless the context requires otherwise, the “Company,” “Transocean,” “we,” “us” or “our”) is a leading international provider of offshore contract drilling services for oil and gas wells. As of March 2, 2006, we owned, had partial ownership interests in or operated 89 mobile offshore andbarge drilling units. As of this date, our fleet included 32 High-Specification semisubmersibles and drillships (“floaters”), 23 Other Floaters, 25 Jackup Rigs and 9 Other Rigs.
Our mobile offshore drilling fleet is considered one of the most modern and versatile fleets in the world. Our primary business is to contract these drilling rigs, related equipment and work crews primarily on a dayrate basis to drill oiland gas wells. We specialize in technically demanding segments of the offshore drilling business with a particular focus on deepwater and harsh environment drilling services. We also provide additional services, including integrated services.
Key measures of our total company results of operations and financial condition are as follows:
Years ended December 31, 2005 2004 Change
(In millions, except daily amounts and percentages)
Average daily revenue (a)(c)(d) ............................................................ $105,100 $ 71,300 $33,800 Utilization (b)(c)(d)................................................................................ 79% 58% N/A Statement of Operations (c)
Operating revenue............................................................................... $2,891.7 $2,613.9 $277.8Operating and maintenance expense................................................... 1,720.6 1,713.6 7.0 Operating income ............................................................................... 719.5 327.9 391.6 Net income.......................................................................................... 715.6 152.2 563.4
Balance Sheet Data (at end of period) (c) Cash .................................................................................................... 445.4 451.3 (5.9) Total Assets ........................................................................................ 10,457.2 10,758.3 (301.1)Total Debt........................................................................................... 1,597.1 2,481.5 (884.4)
______________________“N/A” means not applicable.
(a) Average daily revenue is defined as contract drilling revenue earned per revenue earning day. A revenue earning day is defined as a day for which a rig earns dayrate after commencement of operations.
(b) Utilization is the total actual number of revenue earning days as a percentage of the total number of calendar days in the period.
(c) We consolidated TODCO’s (together with its subsidiaries and predecessors, unless the context requires otherwise,“TODCO,” a publicly traded company and a former wholly-owned subsidiary) results of operations and financial condition in our consolidated financial statements through December 16, 2004. We deconsolidated TODCO effectiveDecember 17, 2004 and subsequently accounted for our investment in TODCO under the equity method of accounting through May 18, 2005, at which time our ownership interest fell below 20 percent. See “―Significant Events.”
(d) Excludes a drillship engaged in scientific geological coring activities, the Joides Resolution, that is owned by a joint venture in which we have a 50 percent interest and is accounted for under the equity method of accounting.
2005 was an exceptional year for the industry with strong demand and increasing dayrates for all asset classes, andwe believe this strong demand will continue in 2006. Leading dayrates are at record levels for most rig classes andcustomers are contracting rigs for longer terms than we have seen historically for rigs other than newbuilds. Interest inhigh-specification floaters is particularly strong and we are seeing interest on the part of some customers to discuss availability of rigs starting as far out as 2008 and extending toward the end of the decade. There is also evidence of a broadening base of customers with deepwater drilling rig requirements for exploration and production drilling programs invarious geographic locations. Some of these rig needs could potentially be addressed by new rig construction. We are
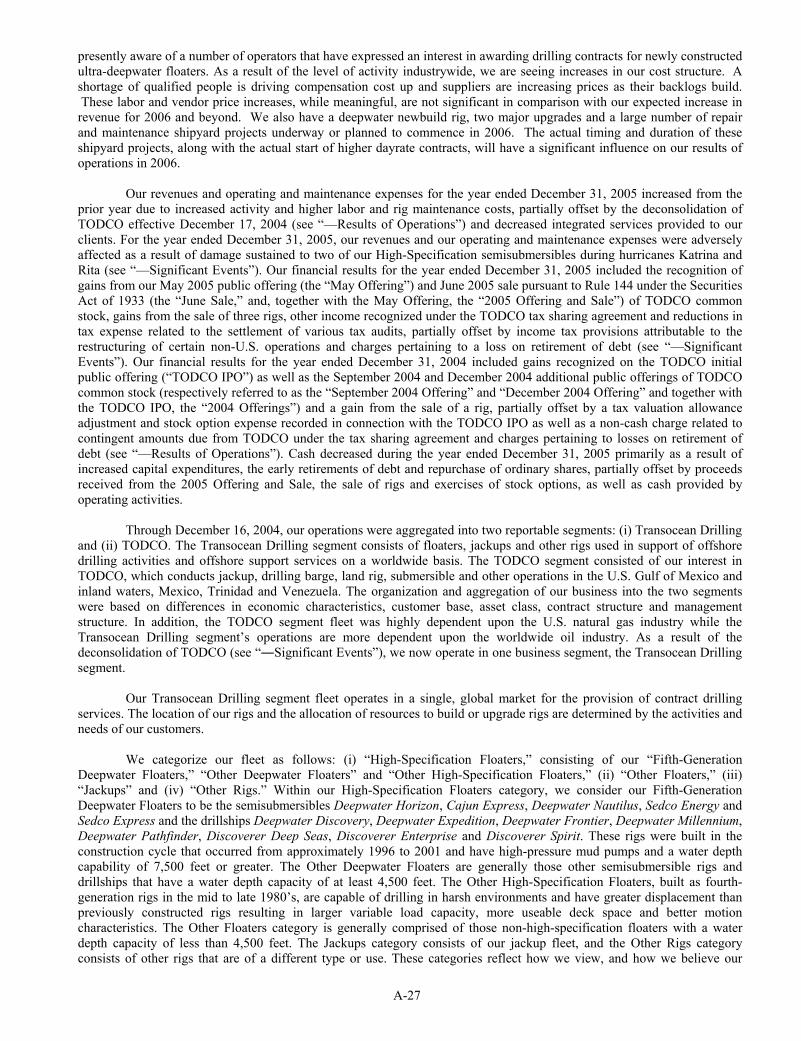
A-27
presently aware of a number of operators that have expressed an interest in awarding drilling contracts for newly constructedultra-deepwater floaters. As a result of the level of activity industrywide, we are seeing increases in our cost structure. A shortage of qualified people is driving compensation cost up and suppliers are increasing prices as their backlogs build. These labor and vendor price increases, while meaningful, are not significant in comparison with our expected increase in
revenue for 2006 and beyond. We also have a deepwater newbuild rig, two major upgrades and a large number of repairand maintenance shipyard projects underway or planned to commence in 2006. The actual timing and duration of these shipyard projects, along with the actual start of higher dayrate contracts, will have a significant influence on our results ofoperations in 2006.
Our revenues and operating and maintenance expenses for the year ended December 31, 2005 increased from theprior year due to increased activity and higher labor and rig maintenance costs, partially offset by the deconsolidation ofTODCO effective December 17, 2004 (see “—Results of Operations”) and decreased integrated services provided to our clients. For the year ended December 31, 2005, our revenues and our operating and maintenance expenses were adverselyaffected as a result of damage sustained to two of our High-Specification semisubmersibles during hurricanes Katrina and Rita (see “—Significant Events”). Our financial results for the year ended December 31, 2005 included the recognition of gains from our May 2005 public offering (the “May Offering”) and June 2005 sale pursuant to Rule 144 under the Securities Act of 1933 (the “June Sale,” and, together with the May Offering, the “2005 Offering and Sale”) of TODCO common stock, gains from the sale of three rigs, other income recognized under the TODCO tax sharing agreement and reductions intax expense related to the settlement of various tax audits, partially offset by income tax provisions attributable to therestructuring of certain non-U.S. operations and charges pertaining to a loss on retirement of debt (see “—SignificantEvents”). Our financial results for the year ended December 31, 2004 included gains recognized on the TODCO initialpublic offering (“TODCO IPO”) as well as the September 2004 and December 2004 additional public offerings of TODCO common stock (respectively referred to as the “September 2004 Offering” and “December 2004 Offering” and together with the TODCO IPO, the “2004 Offerings”) and a gain from the sale of a rig, partially offset by a tax valuation allowanceadjustment and stock option expense recorded in connection with the TODCO IPO as well as a non-cash charge related tocontingent amounts due from TODCO under the tax sharing agreement and charges pertaining to losses on retirement of debt (see “—Results of Operations”). Cash decreased during the year ended December 31, 2005 primarily as a result of increased capital expenditures, the early retirements of debt and repurchase of ordinary shares, partially offset by proceedsreceived from the 2005 Offering and Sale, the sale of rigs and exercises of stock options, as well as cash provided byoperating activities.
Through December 16, 2004, our operations were aggregated into two reportable segments: (i) Transocean Drillingand (ii) TODCO. The Transocean Drilling segment consists of floaters, jackups and other rigs used in support of offshoredrilling activities and offshore support services on a worldwide basis. The TODCO segment consisted of our interest inTODCO, which conducts jackup, drilling barge, land rig, submersible and other operations in the U.S. Gulf of Mexico and inland waters, Mexico, Trinidad and Venezuela. The organization and aggregation of our business into the two segments were based on differences in economic characteristics, customer base, asset class, contract structure and management structure. In addition, the TODCO segment fleet was highly dependent upon the U.S. natural gas industry while the Transocean Drilling segment’s operations are more dependent upon the worldwide oil industry. As a result of thedeconsolidation of TODCO (see “―Significant Events”), we now operate in one business segment, the Transocean Drillingsegment.
Our Transocean Drilling segment fleet operates in a single, global market for the provision of contract drillingservices. The location of our rigs and the allocation of resources to build or upgrade rigs are determined by the activities and needs of our customers.
We categorize our fleet as follows: (i) “High-Specification Floaters,” consisting of our “Fifth-Generation Deepwater Floaters,” “Other Deepwater Floaters” and “Other High-Specification Floaters,” (ii) “Other Floaters,” (iii) “Jackups” and (iv) “Other Rigs.” Within our High-Specification Floaters category, we consider our Fifth-GenerationDeepwater Floaters to be the semisubmersibles Deepwater Horizon, Cajun Express, Deepwater Nautilus, Sedco Energy and Sedco Express and the drillships Deepwater Discovery, Deepwater Expedition, Deepwater Frontier, Deepwater Millennium, Deepwater Pathfinder, Discoverer Deep Seas, Discoverer Enterprise and Discoverer Spirit. These rigs were built in the construction cycle that occurred from approximately 1996 to 2001 and have high-pressure mud pumps and a water depth capability of 7,500 feet or greater. The Other Deepwater Floaters are generally those other semisubmersible rigs anddrillships that have a water depth capacity of at least 4,500 feet. The Other High-Specification Floaters, built as fourth-generation rigs in the mid to late 1980’s, are capable of drilling in harsh environments and have greater displacement than previously constructed rigs resulting in larger variable load capacity, more useable deck space and better motioncharacteristics. The Other Floaters category is generally comprised of those non-high-specification floaters with a waterdepth capacity of less than 4,500 feet. The Jackups category consists of our jackup fleet, and the Other Rigs categoryconsists of other rigs that are of a different type or use. These categories reflect how we view, and how we believe our
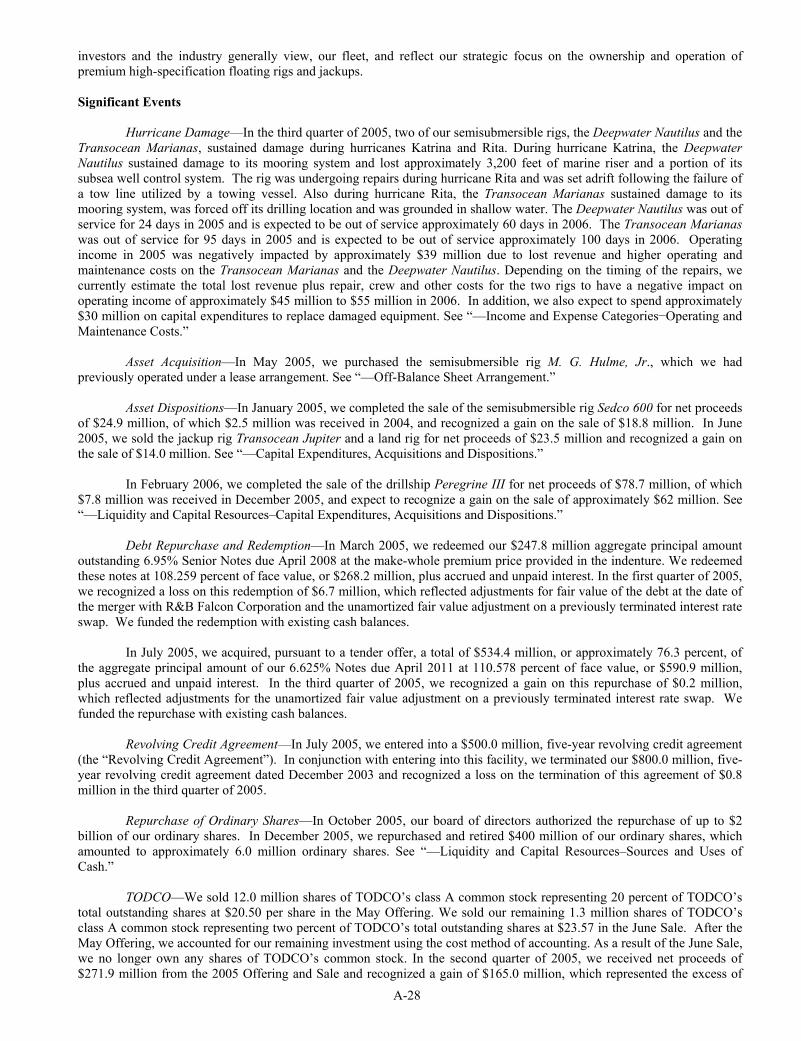
A-28
investors and the industry generally view, our fleet, and reflect our strategic focus on the ownership and operation ofpremium high-specification floating rigs and jackups.
Significant Events
Hurricane Damage—In the third quarter of 2005, two of our semisubmersible rigs, the Deepwater Nautilus and the Transocean Marianas, sustained damage during hurricanes Katrina and Rita. During hurricane Katrina, the Deepwater Nautilus sustained damage to its mooring system and lost approximately 3,200 feet of marine riser and a portion of itssubsea well control system. The rig was undergoing repairs during hurricane Rita and was set adrift following the failure ofa tow line utilized by a towing vessel. Also during hurricane Rita, the Transocean Marianas sustained damage to itsmooring system, was forced off its drilling location and was grounded in shallow water. The Deepwater Nautilus was out of service for 24 days in 2005 and is expected to be out of service approximately 60 days in 2006. The Transocean Marianaswas out of service for 95 days in 2005 and is expected to be out of service approximately 100 days in 2006. Operating income in 2005 was negatively impacted by approximately $39 million due to lost revenue and higher operating andmaintenance costs on the Transocean Marianas and the Deepwater Nautilus. Depending on the timing of the repairs, we currently estimate the total lost revenue plus repair, crew and other costs for the two rigs to have a negative impact onoperating income of approximately $45 million to $55 million in 2006. In addition, we also expect to spend approximately $30 million on capital expenditures to replace damaged equipment. See “—Income and Expense Categories−Operating andMaintenance Costs.”
Asset Acquisition—In May 2005, we purchased the semisubmersible rig M. G. Hulme, Jr., which we hadpreviously operated under a lease arrangement. See “—Off-Balance Sheet Arrangement.”
Asset Dispositions—In January 2005, we completed the sale of the semisubmersible rig Sedco 600 for net proceedsof $24.9 million, of which $2.5 million was received in 2004, and recognized a gain on the sale of $18.8 million. In June 2005, we sold the jackup rig Transocean Jupiter and a land rig for net proceeds of $23.5 million and recognized a gain on the sale of $14.0 million. See “—Capital Expenditures, Acquisitions and Dispositions.”
In February 2006, we completed the sale of the drillship Peregrine III for net proceeds of $78.7 million, of which$7.8 million was received in December 2005, and expect to recognize a gain on the sale of approximately $62 million. See“—Liquidity and Capital Resources–Capital Expenditures, Acquisitions and Dispositions.”
Debt Repurchase and Redemption—In March 2005, we redeemed our $247.8 million aggregate principal amountoutstanding 6.95% Senior Notes due April 2008 at the make-whole premium price provided in the indenture. We redeemed these notes at 108.259 percent of face value, or $268.2 million, plus accrued and unpaid interest. In the first quarter of 2005, we recognized a loss on this redemption of $6.7 million, which reflected adjustments for fair value of the debt at the date ofthe merger with R&B Falcon Corporation and the unamortized fair value adjustment on a previously terminated interest rateswap. We funded the redemption with existing cash balances.
In July 2005, we acquired, pursuant to a tender offer, a total of $534.4 million, or approximately 76.3 percent, ofthe aggregate principal amount of our 6.625% Notes due April 2011 at 110.578 percent of face value, or $590.9 million, plus accrued and unpaid interest. In the third quarter of 2005, we recognized a gain on this repurchase of $0.2 million, which reflected adjustments for the unamortized fair value adjustment on a previously terminated interest rate swap. Wefunded the repurchase with existing cash balances.
Revolving Credit Agreement—In July 2005, we entered into a $500.0 million, five-year revolving credit agreement (the “Revolving Credit Agreement”). In conjunction with entering into this facility, we terminated our $800.0 million, five-year revolving credit agreement dated December 2003 and recognized a loss on the termination of this agreement of $0.8 million in the third quarter of 2005.
Repurchase of Ordinary Shares—In October 2005, our board of directors authorized the repurchase of up to $2billion of our ordinary shares. In December 2005, we repurchased and retired $400 million of our ordinary shares, which amounted to approximately 6.0 million ordinary shares. See “—Liquidity and Capital Resources–Sources and Uses of Cash.”
TODCO—We sold 12.0 million shares of TODCO’s class A common stock representing 20 percent of TODCO’s total outstanding shares at $20.50 per share in the May Offering. We sold our remaining 1.3 million shares of TODCO’sclass A common stock representing two percent of TODCO’s total outstanding shares at $23.57 in the June Sale. After theMay Offering, we accounted for our remaining investment using the cost method of accounting. As a result of the June Sale,we no longer own any shares of TODCO’s common stock. In the second quarter of 2005, we received net proceeds of$271.9 million from the 2005 Offering and Sale and recognized a gain of $165.0 million, which represented the excess of
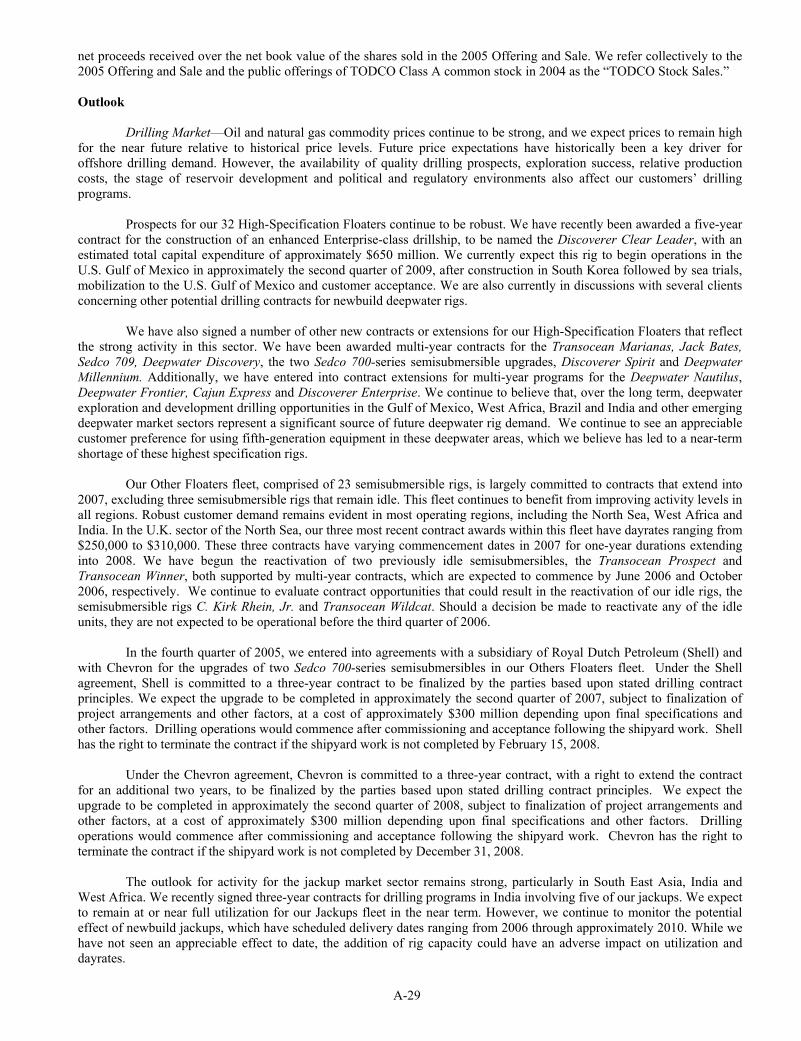
A-29
net proceeds received over the net book value of the shares sold in the 2005 Offering and Sale. We refer collectively to the 2005 Offering and Sale and the public offerings of TODCO Class A common stock in 2004 as the “TODCO Stock Sales.”
Outlook
Drilling Market—Oil and natural gas commodity prices continue to be strong, and we expect prices to remain highfor the near future relative to historical price levels. Future price expectations have historically been a key driver for offshore drilling demand. However, the availability of quality drilling prospects, exploration success, relative production costs, the stage of reservoir development and political and regulatory environments also affect our customers’ drilling programs.
Prospects for our 32 High-Specification Floaters continue to be robust. We have recently been awarded a five-yearcontract for the construction of an enhanced Enterprise-class drillship, to be named the Discoverer Clear Leader, with anestimated total capital expenditure of approximately $650 million. We currently expect this rig to begin operations in theU.S. Gulf of Mexico in approximately the second quarter of 2009, after construction in South Korea followed by sea trials,mobilization to the U.S. Gulf of Mexico and customer acceptance. We are also currently in discussions with several clients concerning other potential drilling contracts for newbuild deepwater rigs.
We have also signed a number of other new contracts or extensions for our High-Specification Floaters that reflectthe strong activity in this sector. We have been awarded multi-year contracts for the Transocean Marianas, Jack Bates, Sedco 709, Deepwater Discovery, the two Sedco 700-series semisubmersible upgrades, Discoverer Spirit and DeepwaterMillennium. Additionally, we have entered into contract extensions for multi-year programs for the Deepwater Nautilus, Deepwater Frontier, Cajun Express and Discoverer Enterprise. We continue to believe that, over the long term, deepwater exploration and development drilling opportunities in the Gulf of Mexico, West Africa, Brazil and India and other emergingdeepwater market sectors represent a significant source of future deepwater rig demand. We continue to see an appreciable customer preference for using fifth-generation equipment in these deepwater areas, which we believe has led to a near-term shortage of these highest specification rigs.
Our Other Floaters fleet, comprised of 23 semisubmersible rigs, is largely committed to contracts that extend into2007, excluding three semisubmersible rigs that remain idle. This fleet continues to benefit from improving activity levels in all regions. Robust customer demand remains evident in most operating regions, including the North Sea, West Africa andIndia. In the U.K. sector of the North Sea, our three most recent contract awards within this fleet have dayrates ranging from$250,000 to $310,000. These three contracts have varying commencement dates in 2007 for one-year durations extending into 2008. We have begun the reactivation of two previously idle semisubmersibles, the Transocean Prospect andTransocean Winner, both supported by multi-year contracts, which are expected to commence by June 2006 and October 2006, respectively. We continue to evaluate contract opportunities that could result in the reactivation of our idle rigs, thesemisubmersible rigs C. Kirk Rhein, Jr. and Transocean Wildcat. Should a decision be made to reactivate any of the idleunits, they are not expected to be operational before the third quarter of 2006.
In the fourth quarter of 2005, we entered into agreements with a subsidiary of Royal Dutch Petroleum (Shell) andwith Chevron for the upgrades of two Sedco 700-series semisubmersibles in our Others Floaters fleet. Under the Shell agreement, Shell is committed to a three-year contract to be finalized by the parties based upon stated drilling contract principles. We expect the upgrade to be completed in approximately the second quarter of 2007, subject to finalization of project arrangements and other factors, at a cost of approximately $300 million depending upon final specifications andother factors. Drilling operations would commence after commissioning and acceptance following the shipyard work. Shellhas the right to terminate the contract if the shipyard work is not completed by February 15, 2008.
Under the Chevron agreement, Chevron is committed to a three-year contract, with a right to extend the contractfor an additional two years, to be finalized by the parties based upon stated drilling contract principles. We expect the upgrade to be completed in approximately the second quarter of 2008, subject to finalization of project arrangements andother factors, at a cost of approximately $300 million depending upon final specifications and other factors. Drillingoperations would commence after commissioning and acceptance following the shipyard work. Chevron has the right toterminate the contract if the shipyard work is not completed by December 31, 2008.
The outlook for activity for the jackup market sector remains strong, particularly in South East Asia, India andWest Africa. We recently signed three-year contracts for drilling programs in India involving five of our jackups. We expectto remain at or near full utilization for our Jackups fleet in the near term. However, we continue to monitor the potential effect of newbuild jackups, which have scheduled delivery dates ranging from 2006 through approximately 2010. While wehave not seen an appreciable effect to date, the addition of rig capacity could have an adverse impact on utilization anddayrates.
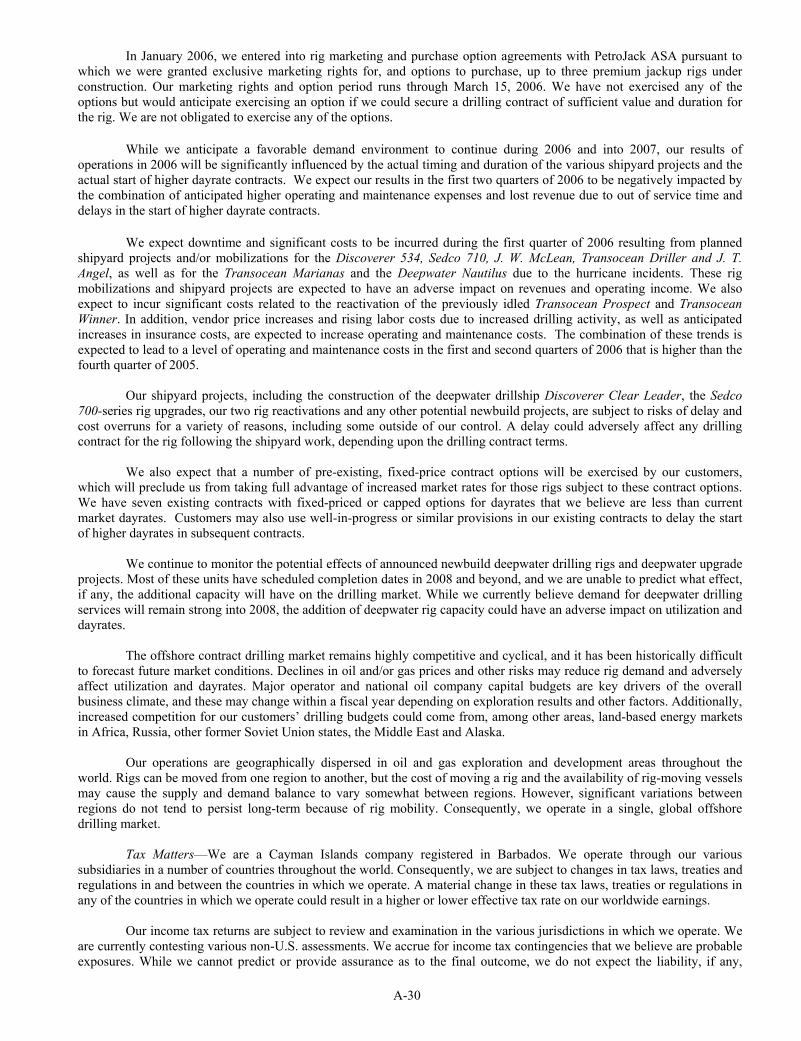
A-30
In January 2006, we entered into rig marketing and purchase option agreements with PetroJack ASA pursuant towhich we were granted exclusive marketing rights for, and options to purchase, up to three premium jackup rigs underconstruction. Our marketing rights and option period runs through March 15, 2006. We have not exercised any of theoptions but would anticipate exercising an option if we could secure a drilling contract of sufficient value and duration for the rig. We are not obligated to exercise any of the options.
While we anticipate a favorable demand environment to continue during 2006 and into 2007, our results of operations in 2006 will be significantly influenced by the actual timing and duration of the various shipyard projects and the actual start of higher dayrate contracts. We expect our results in the first two quarters of 2006 to be negatively impacted bythe combination of anticipated higher operating and maintenance expenses and lost revenue due to out of service time anddelays in the start of higher dayrate contracts.
We expect downtime and significant costs to be incurred during the first quarter of 2006 resulting from planned shipyard projects and/or mobilizations for the Discoverer 534, Sedco 710, J. W. McLean, Transocean Driller and J. T. Angel, as well as for the Transocean Marianas and the Deepwater Nautilus due to the hurricane incidents. These rig mobilizations and shipyard projects are expected to have an adverse impact on revenues and operating income. We alsoexpect to incur significant costs related to the reactivation of the previously idled Transocean Prospect and Transocean Winner. In addition, vendor price increases and rising labor costs due to increased drilling activity, as well as anticipatedincreases in insurance costs, are expected to increase operating and maintenance costs. The combination of these trends isexpected to lead to a level of operating and maintenance costs in the first and second quarters of 2006 that is higher than thefourth quarter of 2005.
Our shipyard projects, including the construction of the deepwater drillship Discoverer Clear Leader, the Sedco700-series rig upgrades, our two rig reactivations and any other potential newbuild projects, are subject to risks of delay andcost overruns for a variety of reasons, including some outside of our control. A delay could adversely affect any drillingcontract for the rig following the shipyard work, depending upon the drilling contract terms.
We also expect that a number of pre-existing, fixed-price contract options will be exercised by our customers, which will preclude us from taking full advantage of increased market rates for those rigs subject to these contract options. We have seven existing contracts with fixed-priced or capped options for dayrates that we believe are less than currentmarket dayrates. Customers may also use well-in-progress or similar provisions in our existing contracts to delay the start of higher dayrates in subsequent contracts.
We continue to monitor the potential effects of announced newbuild deepwater drilling rigs and deepwater upgrade projects. Most of these units have scheduled completion dates in 2008 and beyond, and we are unable to predict what effect, if any, the additional capacity will have on the drilling market. While we currently believe demand for deepwater drilling services will remain strong into 2008, the addition of deepwater rig capacity could have an adverse impact on utilization anddayrates.
The offshore contract drilling market remains highly competitive and cyclical, and it has been historically difficultto forecast future market conditions. Declines in oil and/or gas prices and other risks may reduce rig demand and adversely affect utilization and dayrates. Major operator and national oil company capital budgets are key drivers of the overallbusiness climate, and these may change within a fiscal year depending on exploration results and other factors. Additionally,increased competition for our customers’ drilling budgets could come from, among other areas, land-based energy marketsin Africa, Russia, other former Soviet Union states, the Middle East and Alaska.
Our operations are geographically dispersed in oil and gas exploration and development areas throughout the world. Rigs can be moved from one region to another, but the cost of moving a rig and the availability of rig-moving vesselsmay cause the supply and demand balance to vary somewhat between regions. However, significant variations betweenregions do not tend to persist long-term because of rig mobility. Consequently, we operate in a single, global offshoredrilling market.
Tax Matters—We are a Cayman Islands company registered in Barbados. We operate through our various subsidiaries in a number of countries throughout the world. Consequently, we are subject to changes in tax laws, treaties and regulations in and between the countries in which we operate. A material change in these tax laws, treaties or regulations inany of the countries in which we operate could result in a higher or lower effective tax rate on our worldwide earnings.
Our income tax returns are subject to review and examination in the various jurisdictions in which we operate. Weare currently contesting various non-U.S. assessments. We accrue for income tax contingencies that we believe are probableexposures. While we cannot predict or provide assurance as to the final outcome, we do not expect the liability, if any,
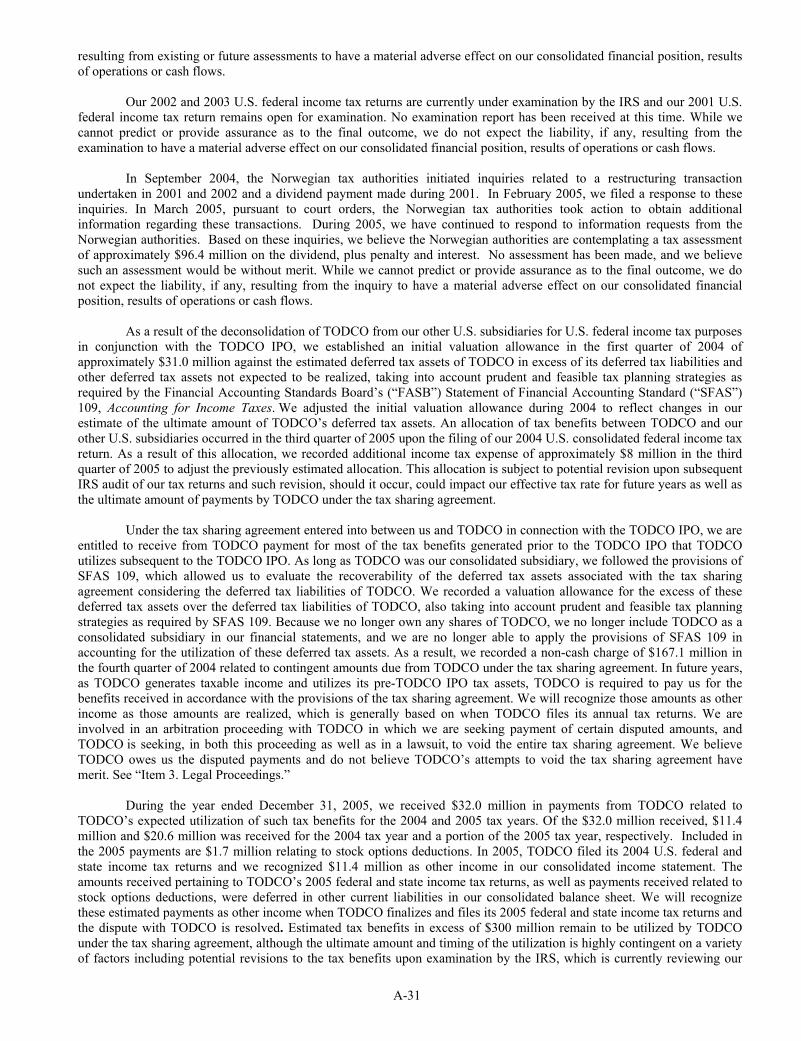
A-31
resulting from existing or future assessments to have a material adverse effect on our consolidated financial position, resultsof operations or cash flows.
Our 2002 and 2003 U.S. federal income tax returns are currently under examination by the IRS and our 2001 U.S. federal income tax return remains open for examination. No examination report has been received at this time. While wecannot predict or provide assurance as to the final outcome, we do not expect the liability, if any, resulting from theexamination to have a material adverse effect on our consolidated financial position, results of operations or cash flows.
In September 2004, the Norwegian tax authorities initiated inquiries related to a restructuring transaction undertaken in 2001 and 2002 and a dividend payment made during 2001. In February 2005, we filed a response to theseinquiries. In March 2005, pursuant to court orders, the Norwegian tax authorities took action to obtain additional information regarding these transactions. During 2005, we have continued to respond to information requests from the Norwegian authorities. Based on these inquiries, we believe the Norwegian authorities are contemplating a tax assessmentof approximately $96.4 million on the dividend, plus penalty and interest. No assessment has been made, and we believe such an assessment would be without merit. While we cannot predict or provide assurance as to the final outcome, we do not expect the liability, if any, resulting from the inquiry to have a material adverse effect on our consolidated financialposition, results of operations or cash flows.
As a result of the deconsolidation of TODCO from our other U.S. subsidiaries for U.S. federal income tax purposes in conjunction with the TODCO IPO, we established an initial valuation allowance in the first quarter of 2004 of approximately $31.0 million against the estimated deferred tax assets of TODCO in excess of its deferred tax liabilities andother deferred tax assets not expected to be realized, taking into account prudent and feasible tax planning strategies asrequired by the Financial Accounting Standards Board’s (“FASB”) Statement of Financial Accounting Standard (“SFAS”)109, Accounting for Income Taxes. We adjusted the initial valuation allowance during 2004 to reflect changes in our estimate of the ultimate amount of TODCO’s deferred tax assets. An allocation of tax benefits between TODCO and our other U.S. subsidiaries occurred in the third quarter of 2005 upon the filing of our 2004 U.S. consolidated federal income taxreturn. As a result of this allocation, we recorded additional income tax expense of approximately $8 million in the thirdquarter of 2005 to adjust the previously estimated allocation. This allocation is subject to potential revision upon subsequentIRS audit of our tax returns and such revision, should it occur, could impact our effective tax rate for future years as well as the ultimate amount of payments by TODCO under the tax sharing agreement.
Under the tax sharing agreement entered into between us and TODCO in connection with the TODCO IPO, we are entitled to receive from TODCO payment for most of the tax benefits generated prior to the TODCO IPO that TODCO utilizes subsequent to the TODCO IPO. As long as TODCO was our consolidated subsidiary, we followed the provisions of SFAS 109, which allowed us to evaluate the recoverability of the deferred tax assets associated with the tax sharing agreement considering the deferred tax liabilities of TODCO. We recorded a valuation allowance for the excess of these deferred tax assets over the deferred tax liabilities of TODCO, also taking into account prudent and feasible tax planningstrategies as required by SFAS 109. Because we no longer own any shares of TODCO, we no longer include TODCO as aconsolidated subsidiary in our financial statements, and we are no longer able to apply the provisions of SFAS 109 inaccounting for the utilization of these deferred tax assets. As a result, we recorded a non-cash charge of $167.1 million in the fourth quarter of 2004 related to contingent amounts due from TODCO under the tax sharing agreement. In future years,as TODCO generates taxable income and utilizes its pre-TODCO IPO tax assets, TODCO is required to pay us for the benefits received in accordance with the provisions of the tax sharing agreement. We will recognize those amounts as other income as those amounts are realized, which is generally based on when TODCO files its annual tax returns. We areinvolved in an arbitration proceeding with TODCO in which we are seeking payment of certain disputed amounts, and TODCO is seeking, in both this proceeding as well as in a lawsuit, to void the entire tax sharing agreement. We believeTODCO owes us the disputed payments and do not believe TODCO’s attempts to void the tax sharing agreement havemerit. See “Item 3. Legal Proceedings.”
During the year ended December 31, 2005, we received $32.0 million in payments from TODCO related toTODCO’s expected utilization of such tax benefits for the 2004 and 2005 tax years. Of the $32.0 million received, $11.4 million and $20.6 million was received for the 2004 tax year and a portion of the 2005 tax year, respectively. Included inthe 2005 payments are $1.7 million relating to stock options deductions. In 2005, TODCO filed its 2004 U.S. federal andstate income tax returns and we recognized $11.4 million as other income in our consolidated income statement. Theamounts received pertaining to TODCO’s 2005 federal and state income tax returns, as well as payments received related to stock options deductions, were deferred in other current liabilities in our consolidated balance sheet. We will recognize these estimated payments as other income when TODCO finalizes and files its 2005 federal and state income tax returns andthe dispute with TODCO is resolved. Estimated tax benefits in excess of $300 million remain to be utilized by TODCO under the tax sharing agreement, although the ultimate amount and timing of the utilization is highly contingent on a varietyof factors including potential revisions to the tax benefits upon examination by the IRS, which is currently reviewing our
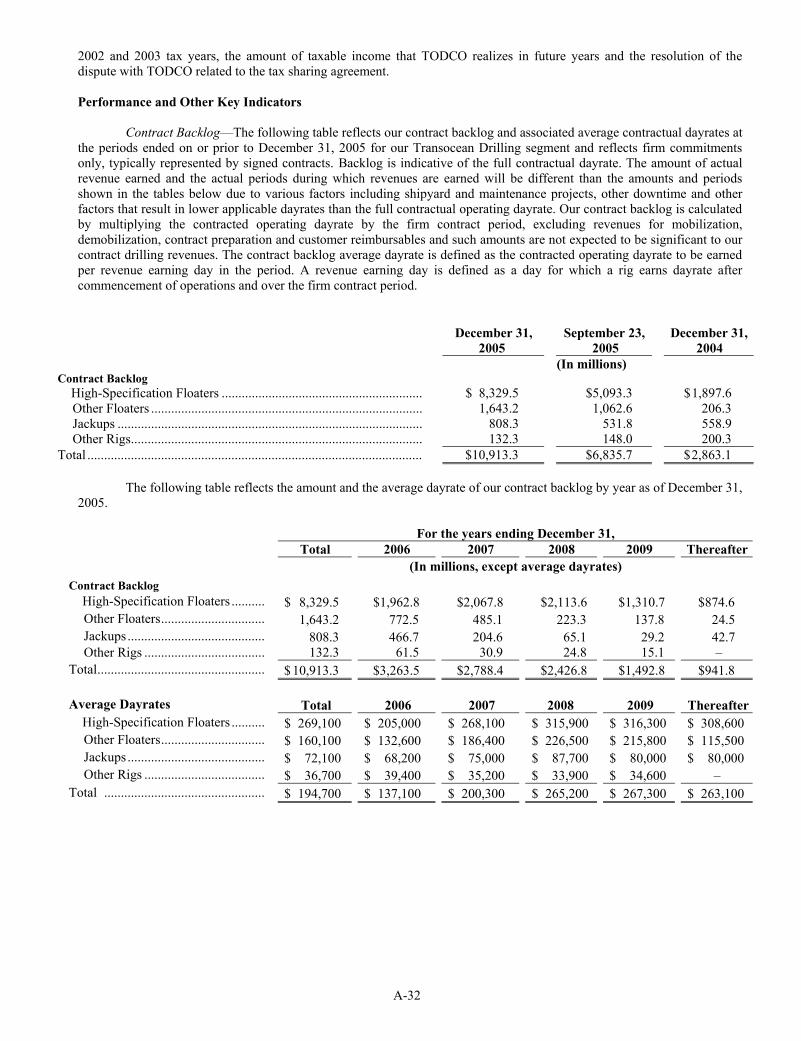
A-32
2002 and 2003 tax years, the amount of taxable income that TODCO realizes in future years and the resolution of the dispute with TODCO related to the tax sharing agreement.
Performance and Other Key Indicators
Contract Backlog—The following table reflects our contract backlog and associated average contractual dayrates at the periods ended on or prior to December 31, 2005 for our Transocean Drilling segment and reflects firm commitmentsonly, typically represented by signed contracts. Backlog is indicative of the full contractual dayrate. The amount of actualrevenue earned and the actual periods during which revenues are earned will be different than the amounts and periodsshown in the tables below due to various factors including shipyard and maintenance projects, other downtime and other factors that result in lower applicable dayrates than the full contractual operating dayrate. Our contract backlog is calculated by multiplying the contracted operating dayrate by the firm contract period, excluding revenues for mobilization,demobilization, contract preparation and customer reimbursables and such amounts are not expected to be significant to ourcontract drilling revenues. The contract backlog average dayrate is defined as the contracted operating dayrate to be earnedper revenue earning day in the period. A revenue earning day is defined as a day for which a rig earns dayrate after commencement of operations and over the firm contract period.
December 31, 2005
September 23,2005
December 31, 2004
(In millions) Contract Backlog
High-Specification Floaters ............................................................ $ 8,329.5 $5,093.3 $ 1,897.6 Other Floaters ................................................................................. 1,643.2 1,062.6 206.3 Jackups ........................................................................................... 808.3 531.8 558.9 Other Rigs....................................................................................... 132.3 148.0 200.3
Total .................................................................................................... $10,913.3 $6,835.7 $2,863.1
The following table reflects the amount and the average dayrate of our contract backlog by year as of December 31,2005.
For the years ending December 31, Total 2006 2007 2008 2009 Thereafter
(In millions, except average dayrates) Contract Backlog
High-Specification Floaters .......... $ 8,329.5 $1,962.8 $2,067.8 $2,113.6 $1,310.7 $874.6 Other Floaters............................... 1,643.2 772.5 485.1 223.3 137.8 24.5 Jackups......................................... 808.3 466.7 204.6 65.1 29.2 42.7 Other Rigs .................................... 132.3 61.5 30.9 24.8 15.1 –
Total.................................................. $ 10,913.3 $3,263.5 $2,788.4 $2,426.8 $1,492.8 $941.8
Average Dayrates Total 2006 2007 2008 2009 ThereafterHigh-Specification Floaters .......... $ 269,100 $ 205,000 $ 268,100 $ 315,900 $ 316,300 $ 308,600 Other Floaters............................... $ 160,100 $ 132,600 $ 186,400 $ 226,500 $ 215,800 $ 115,500 Jackups......................................... $ 72,100 $ 68,200 $ 75,000 $ 87,700 $ 80,000 $ 80,000 Other Rigs .................................... $ 36,700 $ 39,400 $ 35,200 $ 33,900 $ 34,600 –
Total ................................................ $ 194,700 $ 137,100 $ 200,300 $ 265,200 $ 267,300 $ 263,100
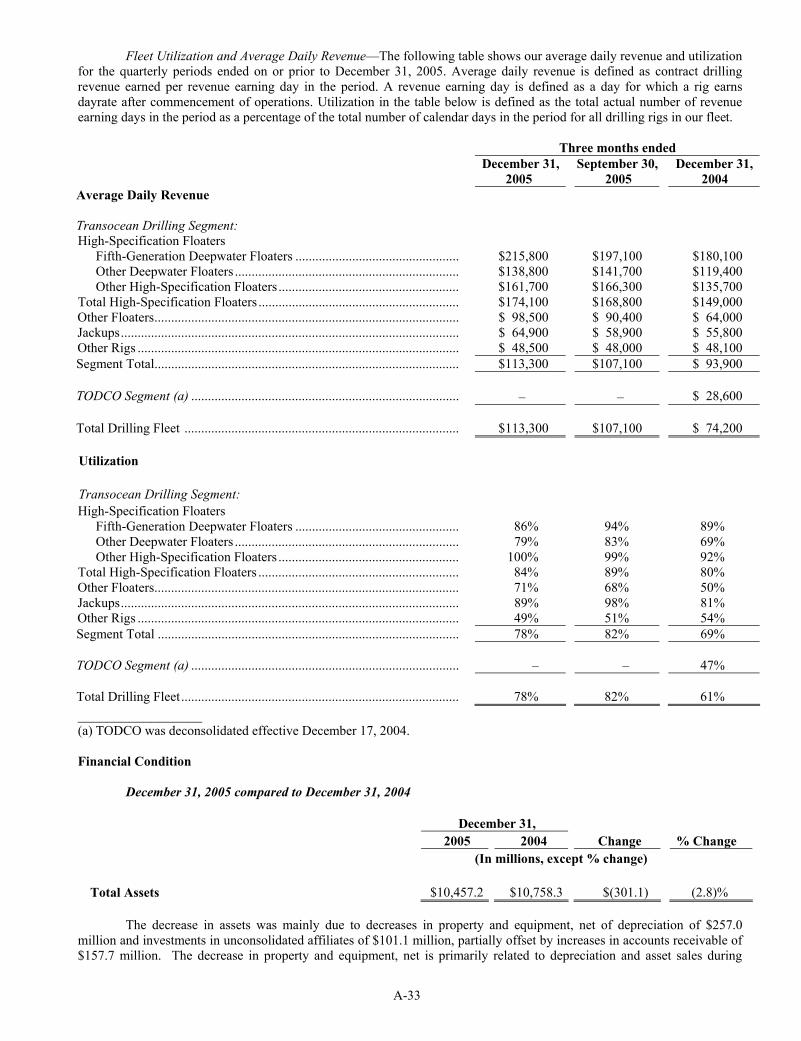
A-33
Fleet Utilization and Average Daily Revenue—The following table shows our average daily revenue and utilization for the quarterly periods ended on or prior to December 31, 2005. Average daily revenue is defined as contract drilling revenue earned per revenue earning day in the period. A revenue earning day is defined as a day for which a rig earnsdayrate after commencement of operations. Utilization in the table below is defined as the total actual number of revenue earning days in the period as a percentage of the total number of calendar days in the period for all drilling rigs in our fleet.
Three months ended December 31,
2005September 30,
2005December 31,
2004Average Daily Revenue
Transocean Drilling Segment: High-Specification Floaters
Fifth-Generation Deepwater Floaters ................................................. $215,800 $197,100 $180,100 Other Deepwater Floaters ................................................................... $138,800 $141,700 $119,400 Other High-Specification Floaters ...................................................... $161,700 $166,300 $135,700
Total High-Specification Floaters ............................................................ $174,100 $168,800 $149,000 Other Floaters........................................................................................... $ 98,500 $ 90,400 $ 64,000Jackups..................................................................................................... $ 64,900 $ 58,900 $ 55,800Other Rigs ................................................................................................ $ 48,500 $ 48,000 $ 48,100Segment Total........................................................................................... $113,300 $107,100 $ 93,900
TODCO Segment (a) ................................................................................ – – $ 28,600
Total Drilling Fleet .................................................................................. $113,300 $107,100 $ 74,200
Utilization
Transocean Drilling Segment: High-Specification Floaters
Fifth-Generation Deepwater Floaters ................................................. 86% 94% 89% Other Deepwater Floaters ................................................................... 79% 83% 69% Other High-Specification Floaters ...................................................... 100% 99% 92%
Total High-Specification Floaters ............................................................ 84% 89% 80% Other Floaters........................................................................................... 71% 68% 50% Jackups..................................................................................................... 89% 98% 81% Other Rigs ................................................................................................ 49% 51% 54% Segment Total .......................................................................................... 78% 82% 69%
TODCO Segment (a) ................................................................................ – – 47%
Total Drilling Fleet................................................................................... 78% 82% 61% _________________ (a) TODCO was deconsolidated effective December 17, 2004.
Financial Condition
December 31, 2005 compared to December 31, 2004
December 31, 2005 2004 Change % Change
(In millions, except % change)
Total Assets $10,457.2 $10,758.3 $(301.1) (2.8)%
The decrease in assets was mainly due to decreases in property and equipment, net of depreciation of $257.0million and investments in unconsolidated affiliates of $101.1 million, partially offset by increases in accounts receivable of$157.7 million. The decrease in property and equipment, net is primarily related to depreciation and asset sales during
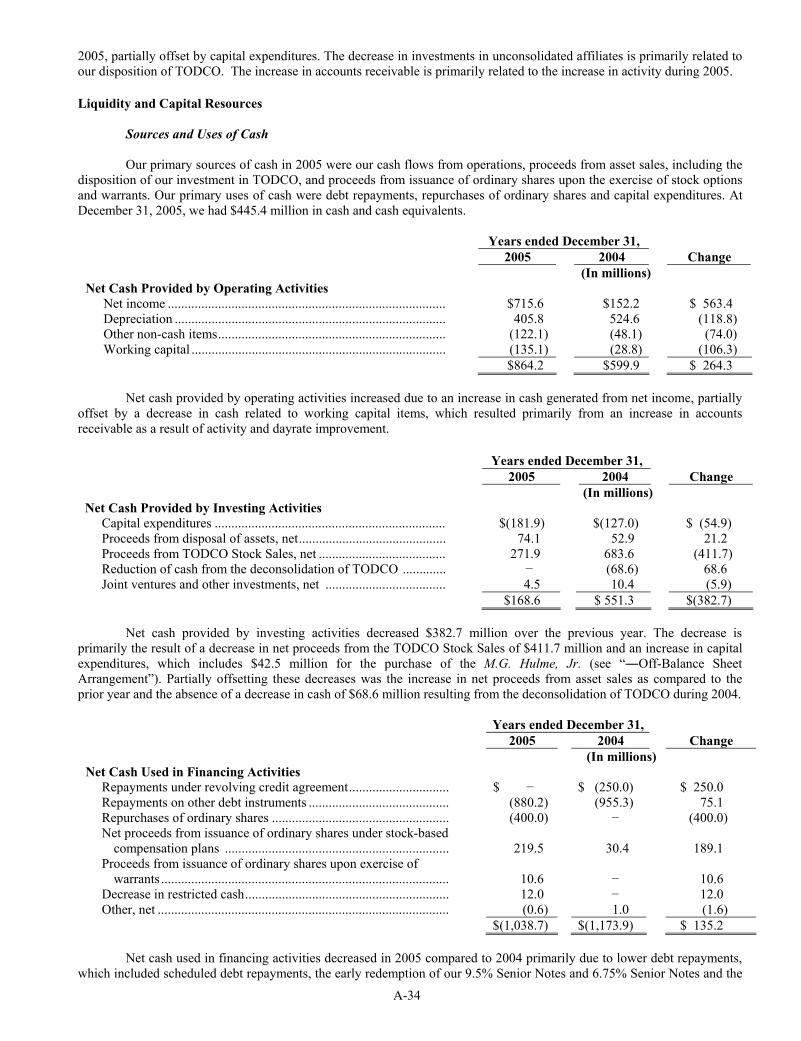
A-34
2005, partially offset by capital expenditures. The decrease in investments in unconsolidated affiliates is primarily related to our disposition of TODCO. The increase in accounts receivable is primarily related to the increase in activity during 2005.
Liquidity and Capital Resources
Sources and Uses of Cash
Our primary sources of cash in 2005 were our cash flows from operations, proceeds from asset sales, including thedisposition of our investment in TODCO, and proceeds from issuance of ordinary shares upon the exercise of stock optionsand warrants. Our primary uses of cash were debt repayments, repurchases of ordinary shares and capital expenditures. AtDecember 31, 2005, we had $445.4 million in cash and cash equivalents.
Years ended December 31, 2005 2004 Change
(In millions) Net Cash Provided by Operating Activities
Net income ................................................................................... $715.6 $152.2 $ 563.4 Depreciation ................................................................................. 405.8 524.6 (118.8) Other non-cash items.................................................................... (122.1) (48.1) (74.0) Working capital ............................................................................ (135.1) (28.8) (106.3)
$864.2 $599.9 $ 264.3
Net cash provided by operating activities increased due to an increase in cash generated from net income, partiallyoffset by a decrease in cash related to working capital items, which resulted primarily from an increase in accounts receivable as a result of activity and dayrate improvement.
Years ended December 31, 2005 2004 Change
(In millions) Net Cash Provided by Investing Activities
Capital expenditures ..................................................................... $(181.9) $(127.0) $ (54.9) Proceeds from disposal of assets, net............................................ 74.1 52.9 21.2 Proceeds from TODCO Stock Sales, net ...................................... 271.9 683.6 (411.7) Reduction of cash from the deconsolidation of TODCO ............. − (68.6) 68.6 Joint ventures and other investments, net .................................... 4.5 10.4 (5.9)
$168.6 $ 551.3 $(382.7)
Net cash provided by investing activities decreased $382.7 million over the previous year. The decrease is primarily the result of a decrease in net proceeds from the TODCO Stock Sales of $411.7 million and an increase in capitalexpenditures, which includes $42.5 million for the purchase of the M.G. Hulme, Jr. (see “―Off-Balance Sheet Arrangement”). Partially offsetting these decreases was the increase in net proceeds from asset sales as compared to theprior year and the absence of a decrease in cash of $68.6 million resulting from the deconsolidation of TODCO during 2004.
Years ended December 31, 2005 2004 Change
(In millions) Net Cash Used in Financing Activities
Repayments under revolving credit agreement.............................. $ − $ (250.0) $ 250.0Repayments on other debt instruments .......................................... (880.2) (955.3) 75.1 Repurchases of ordinary shares ..................................................... (400.0) − (400.0)Net proceeds from issuance of ordinary shares under stock-based
compensation plans ................................................................... 219.5 30.4 189.1 Proceeds from issuance of ordinary shares upon exercise of
warrants ...................................................................................... 10.6 − 10.6 Decrease in restricted cash............................................................. 12.0 − 12.0 Other, net ....................................................................................... (0.6) 1.0 (1.6)
$(1,038.7) $(1,173.9) $ 135.2
Net cash used in financing activities decreased in 2005 compared to 2004 primarily due to lower debt repayments,which included scheduled debt repayments, the early redemption of our 9.5% Senior Notes and 6.75% Senior Notes and the
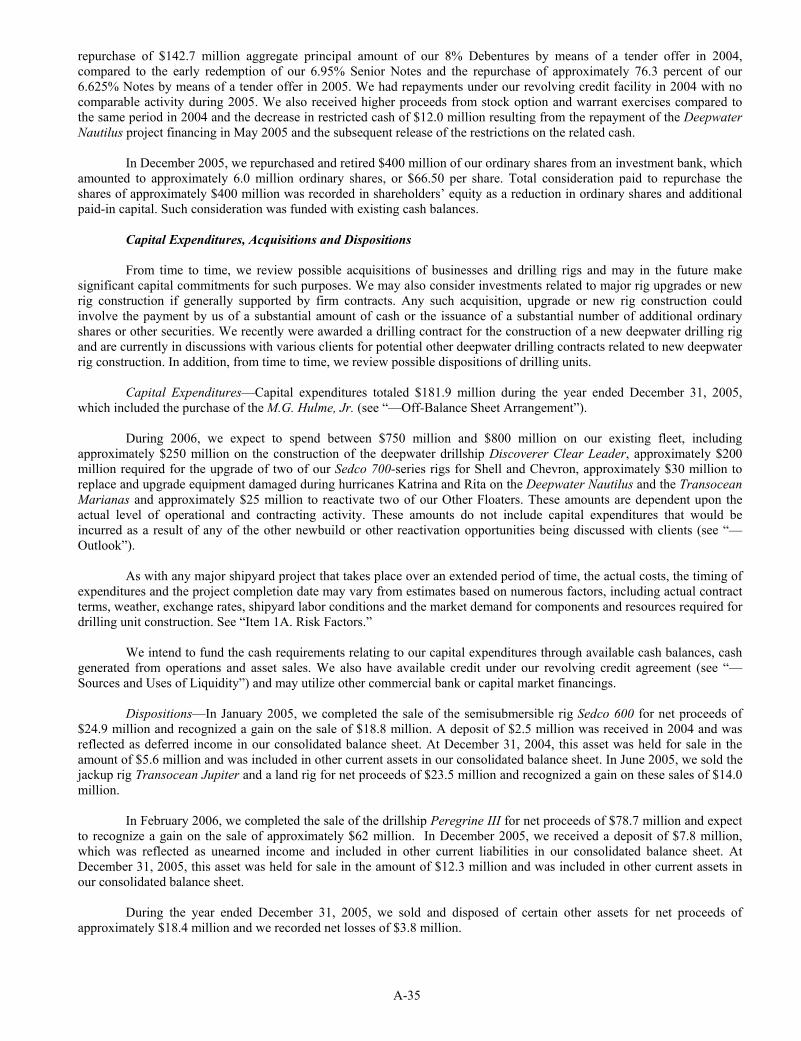
A-35
repurchase of $142.7 million aggregate principal amount of our 8% Debentures by means of a tender offer in 2004,compared to the early redemption of our 6.95% Senior Notes and the repurchase of approximately 76.3 percent of our 6.625% Notes by means of a tender offer in 2005. We had repayments under our revolving credit facility in 2004 with no comparable activity during 2005. We also received higher proceeds from stock option and warrant exercises compared tothe same period in 2004 and the decrease in restricted cash of $12.0 million resulting from the repayment of the Deepwater Nautilus project financing in May 2005 and the subsequent release of the restrictions on the related cash.
In December 2005, we repurchased and retired $400 million of our ordinary shares from an investment bank, which amounted to approximately 6.0 million ordinary shares, or $66.50 per share. Total consideration paid to repurchase the shares of approximately $400 million was recorded in shareholders’ equity as a reduction in ordinary shares and additional paid-in capital. Such consideration was funded with existing cash balances.
Capital Expenditures, Acquisitions and Dispositions
From time to time, we review possible acquisitions of businesses and drilling rigs and may in the future makesignificant capital commitments for such purposes. We may also consider investments related to major rig upgrades or newrig construction if generally supported by firm contracts. Any such acquisition, upgrade or new rig construction could involve the payment by us of a substantial amount of cash or the issuance of a substantial number of additional ordinary shares or other securities. We recently were awarded a drilling contract for the construction of a new deepwater drilling rig and are currently in discussions with various clients for potential other deepwater drilling contracts related to new deepwaterrig construction. In addition, from time to time, we review possible dispositions of drilling units.
Capital Expenditures—Capital expenditures totaled $181.9 million during the year ended December 31, 2005, which included the purchase of the M.G. Hulme, Jr. (see “—Off-Balance Sheet Arrangement”).
During 2006, we expect to spend between $750 million and $800 million on our existing fleet, including approximately $250 million on the construction of the deepwater drillship Discoverer Clear Leader, approximately $200million required for the upgrade of two of our Sedco 700-series rigs for Shell and Chevron, approximately $30 million to replace and upgrade equipment damaged during hurricanes Katrina and Rita on the Deepwater Nautilus and the TransoceanMarianas and approximately $25 million to reactivate two of our Other Floaters. These amounts are dependent upon theactual level of operational and contracting activity. These amounts do not include capital expenditures that would be incurred as a result of any of the other newbuild or other reactivation opportunities being discussed with clients (see “—Outlook”).
As with any major shipyard project that takes place over an extended period of time, the actual costs, the timing of expenditures and the project completion date may vary from estimates based on numerous factors, including actual contractterms, weather, exchange rates, shipyard labor conditions and the market demand for components and resources required for drilling unit construction. See “Item 1A. Risk Factors.”
We intend to fund the cash requirements relating to our capital expenditures through available cash balances, cashgenerated from operations and asset sales. We also have available credit under our revolving credit agreement (see “—Sources and Uses of Liquidity”) and may utilize other commercial bank or capital market financings.
Dispositions—In January 2005, we completed the sale of the semisubmersible rig Sedco 600 for net proceeds of$24.9 million and recognized a gain on the sale of $18.8 million. A deposit of $2.5 million was received in 2004 and was reflected as deferred income in our consolidated balance sheet. At December 31, 2004, this asset was held for sale in the amount of $5.6 million and was included in other current assets in our consolidated balance sheet. In June 2005, we sold thejackup rig Transocean Jupiter and a land rig for net proceeds of $23.5 million and recognized a gain on these sales of $14.0million.
In February 2006, we completed the sale of the drillship Peregrine III for net proceeds of $78.7 million and expect to recognize a gain on the sale of approximately $62 million. In December 2005, we received a deposit of $7.8 million, which was reflected as unearned income and included in other current liabilities in our consolidated balance sheet. AtDecember 31, 2005, this asset was held for sale in the amount of $12.3 million and was included in other current assets in our consolidated balance sheet.
During the year ended December 31, 2005, we sold and disposed of certain other assets for net proceeds ofapproximately $18.4 million and we recorded net losses of $3.8 million.
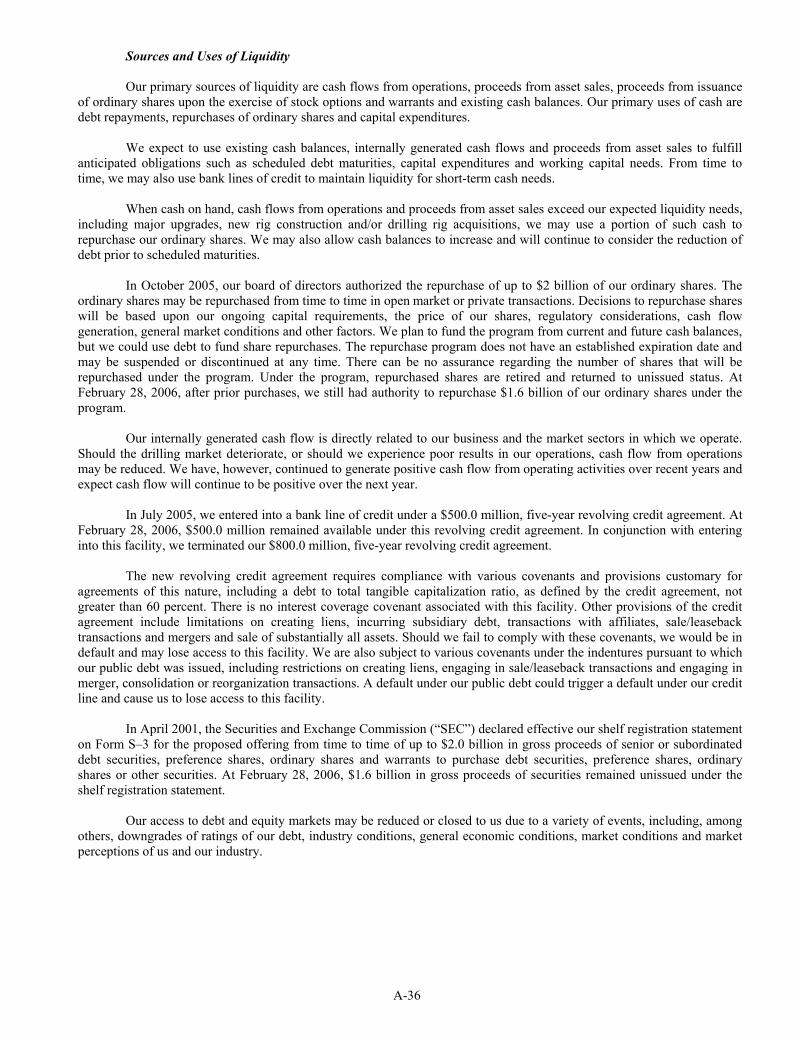
A-36
Sources and Uses of Liquidity
Our primary sources of liquidity are cash flows from operations, proceeds from asset sales, proceeds from issuance of ordinary shares upon the exercise of stock options and warrants and existing cash balances. Our primary uses of cash aredebt repayments, repurchases of ordinary shares and capital expenditures.
We expect to use existing cash balances, internally generated cash flows and proceeds from asset sales to fulfill anticipated obligations such as scheduled debt maturities, capital expenditures and working capital needs. From time totime, we may also use bank lines of credit to maintain liquidity for short-term cash needs.
When cash on hand, cash flows from operations and proceeds from asset sales exceed our expected liquidity needs,including major upgrades, new rig construction and/or drilling rig acquisitions, we may use a portion of such cash torepurchase our ordinary shares. We may also allow cash balances to increase and will continue to consider the reduction of debt prior to scheduled maturities.
In October 2005, our board of directors authorized the repurchase of up to $2 billion of our ordinary shares. Theordinary shares may be repurchased from time to time in open market or private transactions. Decisions to repurchase shareswill be based upon our ongoing capital requirements, the price of our shares, regulatory considerations, cash flowgeneration, general market conditions and other factors. We plan to fund the program from current and future cash balances, but we could use debt to fund share repurchases. The repurchase program does not have an established expiration date and may be suspended or discontinued at any time. There can be no assurance regarding the number of shares that will berepurchased under the program. Under the program, repurchased shares are retired and returned to unissued status. AtFebruary 28, 2006, after prior purchases, we still had authority to repurchase $1.6 billion of our ordinary shares under the program.
Our internally generated cash flow is directly related to our business and the market sectors in which we operate. Should the drilling market deteriorate, or should we experience poor results in our operations, cash flow from operations may be reduced. We have, however, continued to generate positive cash flow from operating activities over recent years and expect cash flow will continue to be positive over the next year.
In July 2005, we entered into a bank line of credit under a $500.0 million, five-year revolving credit agreement. AtFebruary 28, 2006, $500.0 million remained available under this revolving credit agreement. In conjunction with entering into this facility, we terminated our $800.0 million, five-year revolving credit agreement.
The new revolving credit agreement requires compliance with various covenants and provisions customary foragreements of this nature, including a debt to total tangible capitalization ratio, as defined by the credit agreement, not greater than 60 percent. There is no interest coverage covenant associated with this facility. Other provisions of the credit agreement include limitations on creating liens, incurring subsidiary debt, transactions with affiliates, sale/leasebacktransactions and mergers and sale of substantially all assets. Should we fail to comply with these covenants, we would be indefault and may lose access to this facility. We are also subject to various covenants under the indentures pursuant to whichour public debt was issued, including restrictions on creating liens, engaging in sale/leaseback transactions and engaging inmerger, consolidation or reorganization transactions. A default under our public debt could trigger a default under our creditline and cause us to lose access to this facility.
In April 2001, the Securities and Exchange Commission (“SEC”) declared effective our shelf registration statement on Form S–3 for the proposed offering from time to time of up to $2.0 billion in gross proceeds of senior or subordinateddebt securities, preference shares, ordinary shares and warrants to purchase debt securities, preference shares, ordinaryshares or other securities. At February 28, 2006, $1.6 billion in gross proceeds of securities remained unissued under theshelf registration statement.
Our access to debt and equity markets may be reduced or closed to us due to a variety of events, including, among others, downgrades of ratings of our debt, industry conditions, general economic conditions, market conditions and market perceptions of us and our industry.
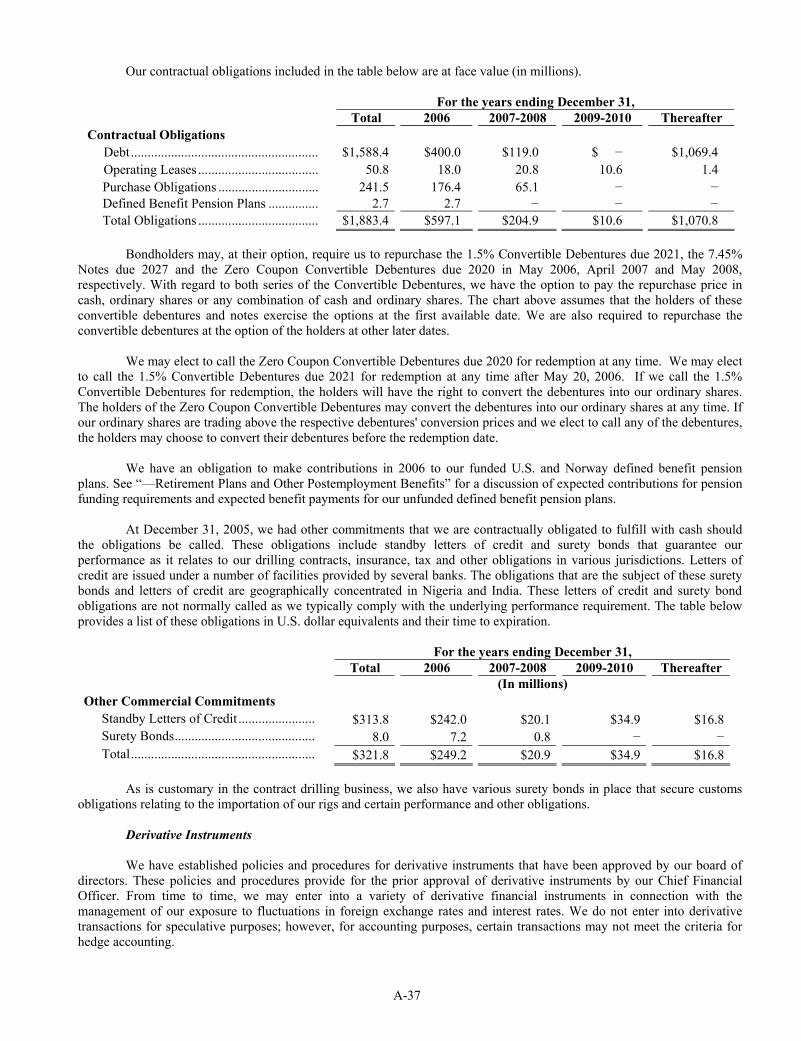
A-37
Our contractual obligations included in the table below are at face value (in millions).
For the years ending December 31, Total 2006 2007-2008 2009-2010 Thereafter
Contractual Obligations Debt........................................................ $1,588.4 $400.0 $119.0 $ − $1,069.4Operating Leases .................................... 50.8 18.0 20.8 10.6 1.4 Purchase Obligations .............................. 241.5 176.4 65.1 − −Defined Benefit Pension Plans ............... 2.7 2.7 − − −Total Obligations .................................... $1,883.4 $597.1 $204.9 $10.6 $1,070.8
Bondholders may, at their option, require us to repurchase the 1.5% Convertible Debentures due 2021, the 7.45%Notes due 2027 and the Zero Coupon Convertible Debentures due 2020 in May 2006, April 2007 and May 2008, respectively. With regard to both series of the Convertible Debentures, we have the option to pay the repurchase price incash, ordinary shares or any combination of cash and ordinary shares. The chart above assumes that the holders of these convertible debentures and notes exercise the options at the first available date. We are also required to repurchase the convertible debentures at the option of the holders at other later dates.
We may elect to call the Zero Coupon Convertible Debentures due 2020 for redemption at any time. We may elect to call the 1.5% Convertible Debentures due 2021 for redemption at any time after May 20, 2006. If we call the 1.5% Convertible Debentures for redemption, the holders will have the right to convert the debentures into our ordinary shares. The holders of the Zero Coupon Convertible Debentures may convert the debentures into our ordinary shares at any time. If our ordinary shares are trading above the respective debentures' conversion prices and we elect to call any of the debentures, the holders may choose to convert their debentures before the redemption date.
We have an obligation to make contributions in 2006 to our funded U.S. and Norway defined benefit pensionplans. See “—Retirement Plans and Other Postemployment Benefits” for a discussion of expected contributions for pension funding requirements and expected benefit payments for our unfunded defined benefit pension plans.
At December 31, 2005, we had other commitments that we are contractually obligated to fulfill with cash should the obligations be called. These obligations include standby letters of credit and surety bonds that guarantee our performance as it relates to our drilling contracts, insurance, tax and other obligations in various jurisdictions. Letters of credit are issued under a number of facilities provided by several banks. The obligations that are the subject of these suretybonds and letters of credit are geographically concentrated in Nigeria and India. These letters of credit and surety bondobligations are not normally called as we typically comply with the underlying performance requirement. The table below provides a list of these obligations in U.S. dollar equivalents and their time to expiration.
For the years ending December 31, Total 2006 2007-2008 2009-2010 Thereafter
(In millions) Other Commercial Commitments
Standby Letters of Credit ....................... $313.8 $242.0 $20.1 $34.9 $16.8Surety Bonds.......................................... 8.0 7.2 0.8 − −Total....................................................... $321.8 $249.2 $20.9 $34.9 $16.8
As is customary in the contract drilling business, we also have various surety bonds in place that secure customsobligations relating to the importation of our rigs and certain performance and other obligations.
Derivative Instruments
We have established policies and procedures for derivative instruments that have been approved by our board ofdirectors. These policies and procedures provide for the prior approval of derivative instruments by our Chief Financial Officer. From time to time, we may enter into a variety of derivative financial instruments in connection with the management of our exposure to fluctuations in foreign exchange rates and interest rates. We do not enter into derivative transactions for speculative purposes; however, for accounting purposes, certain transactions may not meet the criteria for hedge accounting.
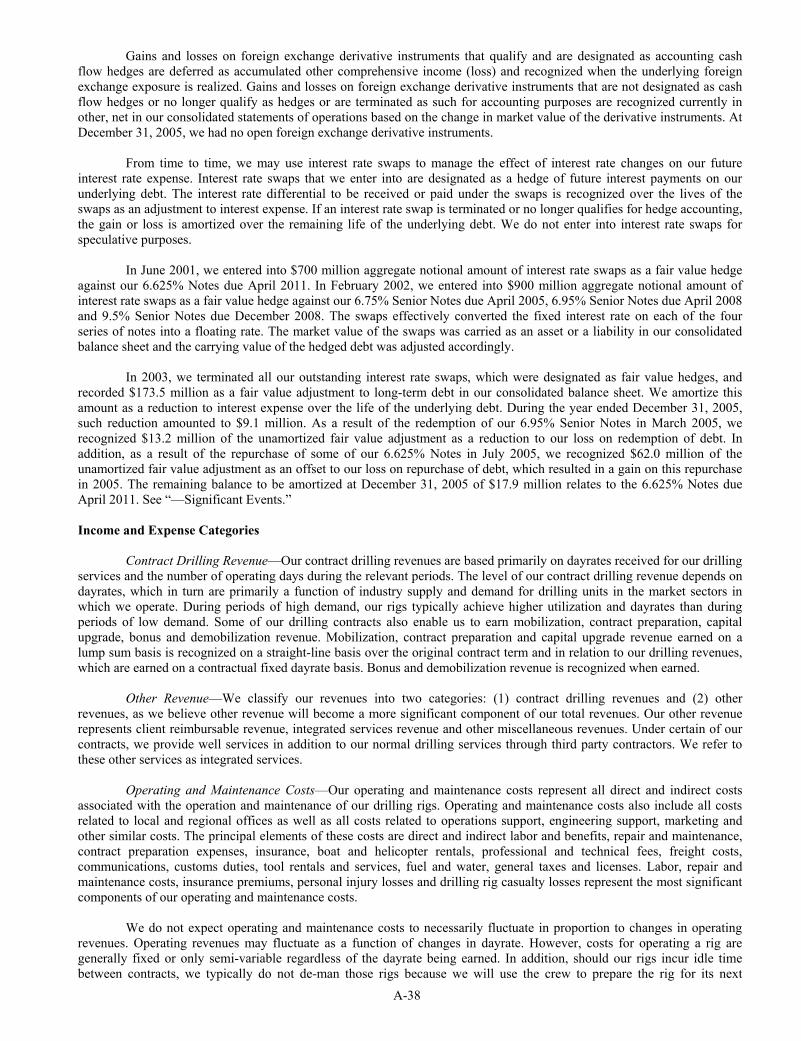
A-38
Gains and losses on foreign exchange derivative instruments that qualify and are designated as accounting cash flow hedges are deferred as accumulated other comprehensive income (loss) and recognized when the underlying foreignexchange exposure is realized. Gains and losses on foreign exchange derivative instruments that are not designated as cash flow hedges or no longer qualify as hedges or are terminated as such for accounting purposes are recognized currently in other, net in our consolidated statements of operations based on the change in market value of the derivative instruments. AtDecember 31, 2005, we had no open foreign exchange derivative instruments.
From time to time, we may use interest rate swaps to manage the effect of interest rate changes on our future interest rate expense. Interest rate swaps that we enter into are designated as a hedge of future interest payments on ourunderlying debt. The interest rate differential to be received or paid under the swaps is recognized over the lives of theswaps as an adjustment to interest expense. If an interest rate swap is terminated or no longer qualifies for hedge accounting,the gain or loss is amortized over the remaining life of the underlying debt. We do not enter into interest rate swaps for speculative purposes.
In June 2001, we entered into $700 million aggregate notional amount of interest rate swaps as a fair value hedgeagainst our 6.625% Notes due April 2011. In February 2002, we entered into $900 million aggregate notional amount ofinterest rate swaps as a fair value hedge against our 6.75% Senior Notes due April 2005, 6.95% Senior Notes due April 2008 and 9.5% Senior Notes due December 2008. The swaps effectively converted the fixed interest rate on each of the four series of notes into a floating rate. The market value of the swaps was carried as an asset or a liability in our consolidated balance sheet and the carrying value of the hedged debt was adjusted accordingly.
In 2003, we terminated all our outstanding interest rate swaps, which were designated as fair value hedges, and recorded $173.5 million as a fair value adjustment to long-term debt in our consolidated balance sheet. We amortize this amount as a reduction to interest expense over the life of the underlying debt. During the year ended December 31, 2005,such reduction amounted to $9.1 million. As a result of the redemption of our 6.95% Senior Notes in March 2005, we recognized $13.2 million of the unamortized fair value adjustment as a reduction to our loss on redemption of debt. Inaddition, as a result of the repurchase of some of our 6.625% Notes in July 2005, we recognized $62.0 million of the unamortized fair value adjustment as an offset to our loss on repurchase of debt, which resulted in a gain on this repurchase in 2005. The remaining balance to be amortized at December 31, 2005 of $17.9 million relates to the 6.625% Notes dueApril 2011. See “—Significant Events.”
Income and Expense Categories
Contract Drilling Revenue—Our contract drilling revenues are based primarily on dayrates received for our drilling services and the number of operating days during the relevant periods. The level of our contract drilling revenue depends ondayrates, which in turn are primarily a function of industry supply and demand for drilling units in the market sectors inwhich we operate. During periods of high demand, our rigs typically achieve higher utilization and dayrates than during periods of low demand. Some of our drilling contracts also enable us to earn mobilization, contract preparation, capitalupgrade, bonus and demobilization revenue. Mobilization, contract preparation and capital upgrade revenue earned on alump sum basis is recognized on a straight-line basis over the original contract term and in relation to our drilling revenues,which are earned on a contractual fixed dayrate basis. Bonus and demobilization revenue is recognized when earned.
Other Revenue—We classify our revenues into two categories: (1) contract drilling revenues and (2) other revenues, as we believe other revenue will become a more significant component of our total revenues. Our other revenuerepresents client reimbursable revenue, integrated services revenue and other miscellaneous revenues. Under certain of ourcontracts, we provide well services in addition to our normal drilling services through third party contractors. We refer to these other services as integrated services.
Operating and Maintenance Costs—Our operating and maintenance costs represent all direct and indirect costsassociated with the operation and maintenance of our drilling rigs. Operating and maintenance costs also include all costsrelated to local and regional offices as well as all costs related to operations support, engineering support, marketing andother similar costs. The principal elements of these costs are direct and indirect labor and benefits, repair and maintenance,contract preparation expenses, insurance, boat and helicopter rentals, professional and technical fees, freight costs, communications, customs duties, tool rentals and services, fuel and water, general taxes and licenses. Labor, repair and maintenance costs, insurance premiums, personal injury losses and drilling rig casualty losses represent the most significant components of our operating and maintenance costs.
We do not expect operating and maintenance costs to necessarily fluctuate in proportion to changes in operatingrevenues. Operating revenues may fluctuate as a function of changes in dayrate. However, costs for operating a rig are generally fixed or only semi-variable regardless of the dayrate being earned. In addition, should our rigs incur idle time between contracts, we typically do not de-man those rigs because we will use the crew to prepare the rig for its next
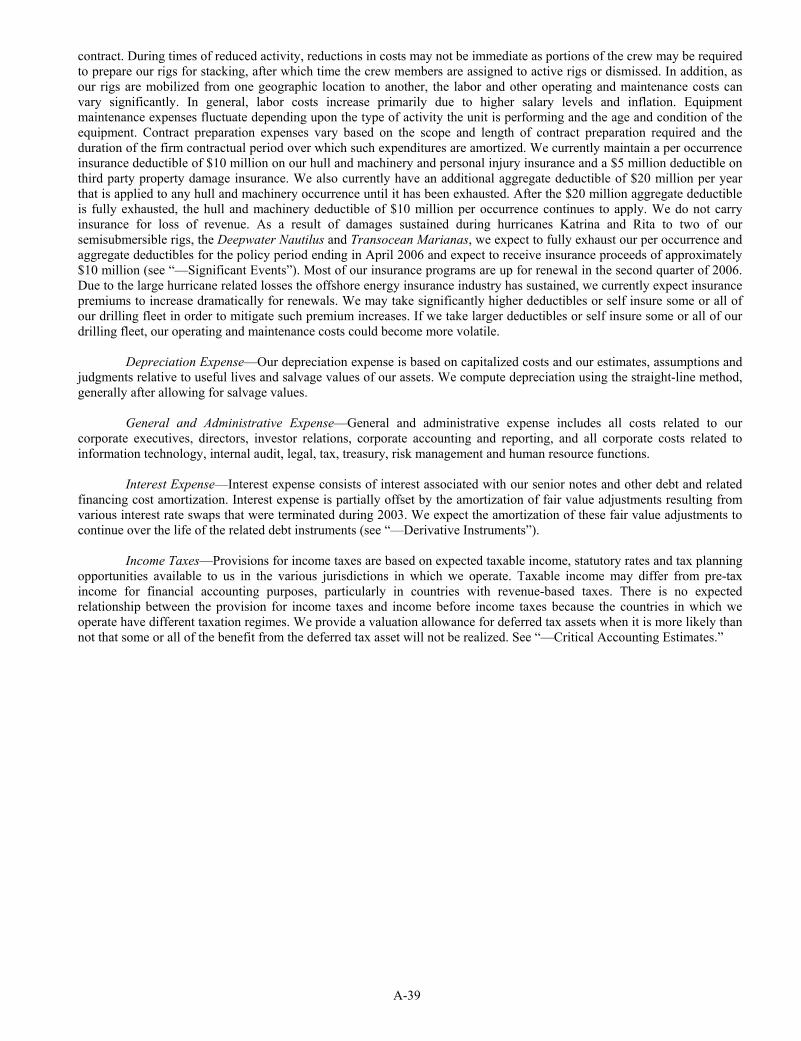
A-39
contract. During times of reduced activity, reductions in costs may not be immediate as portions of the crew may be requiredto prepare our rigs for stacking, after which time the crew members are assigned to active rigs or dismissed. In addition, as our rigs are mobilized from one geographic location to another, the labor and other operating and maintenance costs canvary significantly. In general, labor costs increase primarily due to higher salary levels and inflation. Equipment maintenance expenses fluctuate depending upon the type of activity the unit is performing and the age and condition of theequipment. Contract preparation expenses vary based on the scope and length of contract preparation required and theduration of the firm contractual period over which such expenditures are amortized. We currently maintain a per occurrence insurance deductible of $10 million on our hull and machinery and personal injury insurance and a $5 million deductible on third party property damage insurance. We also currently have an additional aggregate deductible of $20 million per year that is applied to any hull and machinery occurrence until it has been exhausted. After the $20 million aggregate deductible is fully exhausted, the hull and machinery deductible of $10 million per occurrence continues to apply. We do not carryinsurance for loss of revenue. As a result of damages sustained during hurricanes Katrina and Rita to two of oursemisubmersible rigs, the Deepwater Nautilus and Transocean Marianas, we expect to fully exhaust our per occurrence and aggregate deductibles for the policy period ending in April 2006 and expect to receive insurance proceeds of approximately $10 million (see “—Significant Events”). Most of our insurance programs are up for renewal in the second quarter of 2006.Due to the large hurricane related losses the offshore energy insurance industry has sustained, we currently expect insurancepremiums to increase dramatically for renewals. We may take significantly higher deductibles or self insure some or all ofour drilling fleet in order to mitigate such premium increases. If we take larger deductibles or self insure some or all of ourdrilling fleet, our operating and maintenance costs could become more volatile.
Depreciation Expense—Our depreciation expense is based on capitalized costs and our estimates, assumptions and judgments relative to useful lives and salvage values of our assets. We compute depreciation using the straight-line method,generally after allowing for salvage values.
General and Administrative Expense—General and administrative expense includes all costs related to our corporate executives, directors, investor relations, corporate accounting and reporting, and all corporate costs related toinformation technology, internal audit, legal, tax, treasury, risk management and human resource functions.
Interest Expense—Interest expense consists of interest associated with our senior notes and other debt and relatedfinancing cost amortization. Interest expense is partially offset by the amortization of fair value adjustments resulting fromvarious interest rate swaps that were terminated during 2003. We expect the amortization of these fair value adjustments to continue over the life of the related debt instruments (see “—Derivative Instruments”).
Income Taxes—Provisions for income taxes are based on expected taxable income, statutory rates and tax planningopportunities available to us in the various jurisdictions in which we operate. Taxable income may differ from pre-taxincome for financial accounting purposes, particularly in countries with revenue-based taxes. There is no expectedrelationship between the provision for income taxes and income before income taxes because the countries in which we operate have different taxation regimes. We provide a valuation allowance for deferred tax assets when it is more likely thannot that some or all of the benefit from the deferred tax asset will not be realized. See “—Critical Accounting Estimates.”
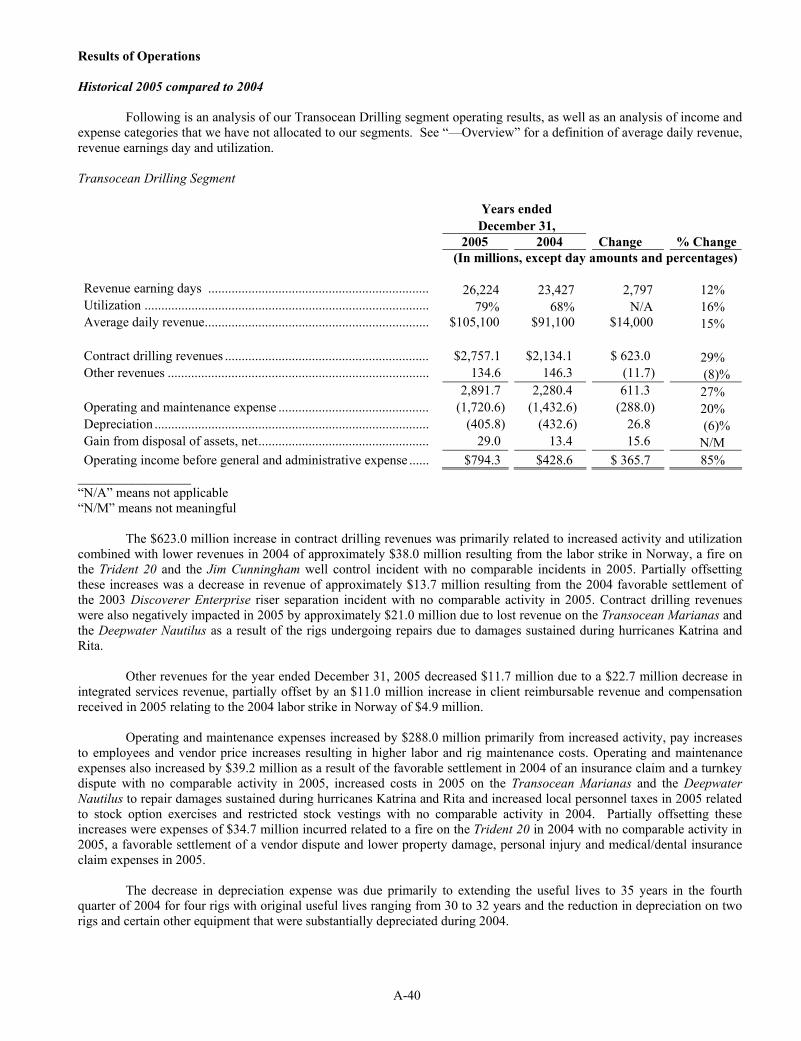
A-40
Results of Operations
Historical 2005 compared to 2004
Following is an analysis of our Transocean Drilling segment operating results, as well as an analysis of income and expense categories that we have not allocated to our segments. See “—Overview” for a definition of average daily revenue,revenue earnings day and utilization.
Transocean Drilling Segment
Years ended December 31,
2005 2004 Change % Change(In millions, except day amounts and percentages)
Revenue earning days .................................................................. 26,224 23,427 2,797 12% Utilization ..................................................................................... 79% 68% N/A 16% Average daily revenue................................................................... $105,100 $91,100 $14,000 15%
Contract drilling revenues ............................................................. $2,757.1 $2,134.1 $ 623.0 29% Other revenues .............................................................................. 134.6 146.3 (11.7) (8)% 2,891.7 2,280.4 611.3 27% Operating and maintenance expense ............................................. (1,720.6) (1,432.6) (288.0) 20% Depreciation .................................................................................. (405.8) (432.6) 26.8 (6)% Gain from disposal of assets, net................................................... 29.0 13.4 15.6 N/MOperating income before general and administrative expense ...... $794.3 $428.6 $ 365.7 85%
_________________“N/A” means not applicable “N/M” means not meaningful
The $623.0 million increase in contract drilling revenues was primarily related to increased activity and utilizationcombined with lower revenues in 2004 of approximately $38.0 million resulting from the labor strike in Norway, a fire onthe Trident 20 and the Jim Cunningham well control incident with no comparable incidents in 2005. Partially offsettingthese increases was a decrease in revenue of approximately $13.7 million resulting from the 2004 favorable settlement ofthe 2003 Discoverer Enterprise riser separation incident with no comparable activity in 2005. Contract drilling revenues were also negatively impacted in 2005 by approximately $21.0 million due to lost revenue on the Transocean Marianas andthe Deepwater Nautilus as a result of the rigs undergoing repairs due to damages sustained during hurricanes Katrina and Rita.
Other revenues for the year ended December 31, 2005 decreased $11.7 million due to a $22.7 million decrease in integrated services revenue, partially offset by an $11.0 million increase in client reimbursable revenue and compensationreceived in 2005 relating to the 2004 labor strike in Norway of $4.9 million.
Operating and maintenance expenses increased by $288.0 million primarily from increased activity, pay increasesto employees and vendor price increases resulting in higher labor and rig maintenance costs. Operating and maintenanceexpenses also increased by $39.2 million as a result of the favorable settlement in 2004 of an insurance claim and a turnkey dispute with no comparable activity in 2005, increased costs in 2005 on the Transocean Marianas and the Deepwater Nautilus to repair damages sustained during hurricanes Katrina and Rita and increased local personnel taxes in 2005 relatedto stock option exercises and restricted stock vestings with no comparable activity in 2004. Partially offsetting these increases were expenses of $34.7 million incurred related to a fire on the Trident 20 in 2004 with no comparable activity in2005, a favorable settlement of a vendor dispute and lower property damage, personal injury and medical/dental insurance claim expenses in 2005.
The decrease in depreciation expense was due primarily to extending the useful lives to 35 years in the fourthquarter of 2004 for four rigs with original useful lives ranging from 30 to 32 years and the reduction in depreciation on tworigs and certain other equipment that were substantially depreciated during 2004.
A-41
During 2005, we recognized net gains of $29.0 million related to the sale of the semisubmersible rig Sedco 600, thejackup rig Transocean Jupiter, a land rig and the sales and disposal of other assets. During 2004, we recognized net gains of$13.4 million related to the sale of the semisubmersible rig Sedco 602 and the sales and disposal of other assets.
Total Company Results of Operations
Years ended December 31, 2005 2004 Change % Change
(In millions, except % change)
General and Administrative Expense .................................... $ 74.8 $ 67.0 $ 7.8 12% Other (Income) Expense, net
Equity in earnings of unconsolidated affiliates ................ (10.1) (9.2) (0.9) 10% Interest income................................................................. (19.6) (9.3) (10.3) N/MInterest expense................................................................ 111.2 171.7 (60.5) 35% Gain from TODCO Stock Sales ....................................... (165.0) (308.8) (143.8) 47% Non-cash TODCO tax sharing agreement charge............ – 167.1 (167.1) N/MLoss on retirement of debt ............................................... 7.3 76.5 (69.2) 90% Other, net.......................................................................... (6.7) (0.4) (6.3) N/M
Income Tax Expense ............................................................. 86.8 91.3 4.5 5% Minority Interest.................................................................... – (3.2) 3.2 N/M
The increase in general and administrative expense was primarily attributable to increases of approximately $6.0million in accounting, legal and professional fees as well as $4.1 million in increased personnel cost, rent expense, computerequipment and pension and other post-employment retirement plan expense, partially offset by decreased stockcompensation expense of $3.3 million.
The increase in interest income was primarily due to an increase in average cash balances for 2005 compared to 2004 and an increase in interest rates on cash investments, the combination of which resulted in an increase in interestincome of $8.4 million.
Approximately $56.0 million of the decrease in interest expense was attributable to debt that was redeemed, retiredor repurchased during or subsequent to 2004. An additional decrease of approximately $4.0 million related to interestexpense in 2004 on TODCO’s debt as a result of the TODCO deconsolidation in December 2004.
Gains from TODCO Stock Sales decreased $143.8 million during 2005 compared to 2004 (see “―SignificantEvents”).
During 2004, we recognized a $167.1 million non-cash charge related to contingent amounts due from TODCOunder a tax sharing agreement between us and TODCO (see “―Historical 2004 compared to 2003–Significant Events”).
During 2005, we recognized losses of $7.3 million related to the early redemption and repurchase of $782.2 million aggregate principal amount of our debt (see “―Significant Events”). During 2004, we recognized losses of $76.5 millionrelated to the early retirements of $774.8 million aggregate principal amount of our debt (see “―Historical 2004 comparedto 2003–Significant Events”).
The $6.3 million favorable change in other, net primarily relates to $11.4 million of income recognized under the tax sharing agreement with TODCO (see “―Significant Events”), partially offset by the effect of foreign currency exchangerate changes on our monetary assets and liabilities denominated in currencies other than the U.S. dollar.
We operate internationally and provide for income taxes based on the tax laws and rates in the countries in whichwe operate and earn income. There is no expected relationship between the provision for income taxes and income before income taxes. The effective tax rate for 2005 and 2004 was 16.8 percent and 49.7 percent, respectively, based on 2005 and 2004 income before income taxes and minority interest after adjusting for certain items such as a portion of net gains on sales of assets, items related to the disposition of TODCO and losses on retirements of debt. The tax effect of the excluded items as well as settlements of prior year tax liabilities and changes in estimates of prior year tax are all treated as discrete period tax expenses or benefits. The impact of the various discrete period tax items was a net benefit of $14.1 million in2005, resulting in a tax rate of 10.8 percent on earnings before income taxes and minority interest. The discrete items
A-42
included a benefit of $16.8 million for the reduction in a valuation allowance related to U.K. net operating losses and a benefit related to the resolution of various tax audits partially offset by expenses related to asset dispositions, a deferred tax charge attributable to the restructuring of certain non-U.S. operations and changes related to the disposition of TODCO. For2004, the impact of the various discrete items was a net expense of $11.6 million, including a provision for a valuation allowance of approximately $32.4 million related to the TODCO IPO.
The decrease in minority interest was primarily attributable to the deconsolidation of TODCO.
TODCO Segment
The results discussed below for the TODCO segment are through December 16, 2004 as a result of the TODCOStock Sales and the deconsolidation of TODCO. See “—Significant Events.” See “—Overview” for a definition of average daily revenue, revenue earning days and utilization.
Years ended December 31, 2005 2004 Change % Change
(In millions, except day amounts and percentages)
Revenue earning days ......................................................... − 10,476 (10,476) N/MUtilization ........................................................................... − 43% N/A N/MAverage daily revenue ........................................................ − $26,900 $(26,900) N/M
Contract drilling revenues ................................................... − $ 282.3 $ (282.3) N/MOther revenues..................................................................... − 51.2 (51.2) N/M
333.5 333.5 (333.5) N/MOperating and maintenance expense ................................... − (281.0) 281.0 N/MDepreciation ........................................................................ − (92.0) 92.0 N/MGain from disposal of assets, net ......................................... − 5.8 (5.8) N/MOperating loss before general and administrative expense.. − $ (33.7) $ 33.7 N/M
___________________________“N/A” means not applicable “N/M” means not meaningful
Historical 2004 compared to 2003
Overview
Our revenue and operating and maintenance expenses for the year ended December 31, 2004 increased from theprior year due to the current year effect of including the operations of the drillships Deepwater Pathfinder and DeepwaterFrontier as a result of the 2003 acquisitions of the ownership interests in the Deepwater Drilling L.L.C. (“DD LLC”) and Deepwater Drilling II L.L.C. (“DDII LLC”) joint ventures and the subsequent payoff of the synthetic lease financing arrangements in late December 2003, as well as from increased integrated services provided to our clients in 2004. In 2003, the Discoverer Enterprise riser incident, an electrical fire on the Peregrine I and a labor strike and restructuring of a benefitplan in Nigeria negatively impacted revenues and operating and maintenance expense. In 2004, the Discoverer Enterpriseoperating and maintenance expense was partially reduced by an insurance settlement related to the riser incident (see “—Significant Events”). Adding to the increase in operating and maintenance expense were repairs resulting from a fire on thejackup rig Trident 20 and a well control incident on the semisubmersible rig Jim Cunningham that occurred in the thirdquarter of 2004 (see “―Significant Events”), while a well control incident on TODCO’s inland barge Rig 62 and a fire onTODCO’s inland barge Rig 20 negatively impacted operating and maintenance expense in 2003. Revenues were negativelyimpacted by suspended operations due to the strike in Norway (see “―Significant Events”), the fire on the Trident 20 andthe well control incident on the semisubmersible rig Jim Cunningham, all of which occurred during the third quarter of2004. Our year ended December 31, 2004 financial results included non-cash charges pertaining to losses on retirement ofdebt partially offset by the recognition of a gain on the sale of a semisubmersible rig. We also recognized gains on the 2004 Offerings, which were partially offset by a tax valuation allowance adjustment and stock option expense recorded inconnection with the TODCO IPO, as well as a non-cash charge related to contingent amounts due from TODCO under thetax sharing agreement between us and TODCO (see “—Significant Events”). Cash decreased during the year ended December 31, 2004 primarily as a result of the early retirements of debt instruments resulting from our continued focus ondebt reduction, partially offset by proceeds received from the 2004 Offerings and cash provided by operating activities.
A-43
Significant Events
Transocean Drilling Segment
Operational Incidents—In May 2003, a drilling riser separated on our deepwater drillship Discoverer Enterpriseand the rig temporarily suspended drilling operations for our customer. The rig resumed operations in July 2003 and we resolved a disagreement with our customer regarding the incident in early 2004, which had no significant effect on ourresults of operations. In June 2004, we finalized discussions with our insurers relating to an insurance claim for a portion ofour losses stemming from this incident and received an insurance settlement during 2004, the majority of which wasreceived in June 2004, which had a favorable effect on pre-tax earnings of $13.4 million.
In July 2004, members of the OFS, one of three unions representing offshore workers in Norway, called a strike onour semisubmersible units operating in the country. OFS called the strike after it was unable to reach an agreement with the Norwegian Shipowners Association, which represents rig owners in Norway. The strike affected the semisubmersible rigs Polar Pioneer, Transocean Searcher and Transocean Leader. The strike ended in late October 2004 following government intervention, and the Transocean Searcher and Transocean Leader resumed operations in the Norwegian sector of the NorthSea in November 2004. The Polar Pioneer commenced operations in December 2004 following the completion of planned survey and upgrade work. Operating income would have been an estimated $9.0 million higher absent the labor strike.
In July 2004, the jackup rig Trident 20 suffered damage resulting from a fire in the rig's engine room whileoperating offshore Turkmenistan in the Caspian Sea. The rig, which was under a three-well contract, was out of service a majority of the third and fourth quarters and returned to work in December 2004. Total repair, crew and other costs resulted in approximately $12.5 million of additional operating and maintenance expense. Operating income would have been an estimated $26.4 million higher absent the incident.
In August 2004, the semisubmersible rig Jim Cunningham experienced a well control incident that resulted in a firewhile operating offshore Egypt. The rig was out of service all of the fourth quarter and returned to work in February 2005. Repair, crew and other costs totaled approximately $12.0 million of which approximately $7.0 was incurred in 2004.Operating income would have been an estimated $14.4 million higher absent the incident.
Asset Dispositions—In March 2004, we entered into an agreement to sell a semisubmersible rig, the Sedco 600, for net proceeds of approximately $25.0 million. At December 31, 2004, the rig was classified as an asset held for sale andincluded in other current assets in our consolidated balance sheet. We completed the sale of the rig in January 2005 for netproceeds of $24.9 million and recognized a gain on the sale of $18.8 million in the first quarter of 2005.
In June 2004, we completed the sale of a semisubmersible rig, the Sedco 602, for net proceeds of approximately $28.0 million and recognized a gain on the sale of $21.7 million.
Debt Redemptions and Repurchases
In March 2004, we completed the redemption of our $289.8 million aggregate principal amount outstanding 9.5%Senior Notes due December 2008 at the make-whole premium price provided in the indenture. We redeemed these notes at 127.796 percent of face value or $370.3 million, plus accrued and unpaid interest. We recognized a loss on the redemption of debt of $28.1 million, which reflected adjustments for fair value of the debt at the date of the merger with R&B Falconand the unamortized fair value adjustment on a previously terminated interest rate swap. We funded the redemption withexisting cash balances, which included proceeds from the TODCO IPO.
In October 2004, we redeemed our $342.3 million aggregate principal amount outstanding 6.75% Senior Notes due April 2005 at the make-whole premium price provided in the indenture. We redeemed these notes at 102.127 percent of facevalue or $349.5 million, plus accrued and unpaid interest. We recognized a loss on the redemption of $3.3 million, which reflected adjustments for fair value of the debt at the date of the R&B Falcon merger and the unamortized fair value adjustment on a previously terminated interest rate swap. We funded the redemption with existing cash on hand, whichincluded proceeds from the September 2004 Offering.
In December 2004, we acquired, pursuant to a tender offer, a total of $142.7 million, or 71.3 percent, aggregate principal amount of our 8% Debentures due April 2027 at 130.449 percent of face value, or $186.1 million, plus accrued and unpaid interest. We recognized a loss on the repurchase of $45.1 million. We funded the repurchase with existing cashbalances.
A-44
In December 2004, the previously discussed deconsolidation of TODCO resulted in the elimination from our consolidated balance sheets of TODCO’s 6.75% Senior Notes due April 2005, 6.95% Senior Notes due April 2008, 9.5% Senior Notes due December 2008 and 7.375% Senior Notes due April 2018, which had an aggregate principal amount outstanding of $7.7 million, $2.2 million, $10.2 million and $3.5 million, respectively.
TODCO Tax Sharing Agreement Charge
Under the tax sharing agreement entered into between us and TODCO in connection with the TODCO IPO, we are entitled to receive from TODCO payment for most of the tax benefits generated prior to the TODCO IPO that TODCO utilizes subsequent to the TODCO IPO. As long as TODCO was our consolidated subsidiary, we followed the provisions of SFAS 109, which allowed us to evaluate the recoverability of the deferred tax assets associated with the tax sharing agreement considering the deferred tax liabilities of TODCO. We recorded a valuation allowance for the excess of these deferred tax assets over the deferred tax liabilities of TODCO, also taking into account prudent and feasible tax planningstrategies as required by SFAS 109. Because we no longer own a majority voting interest in TODCO, we no longer includeTODCO as a consolidated subsidiary in our financial statements, and we are no longer able to apply the provisions of SFAS109 in accounting for the utilization of these deferred tax assets. As a result, we recorded a non-cash charge of $167.1 million in the fourth quarter of 2004 related to contingent amounts due from TODCO under the tax sharing agreement. In future years, as TODCO generates income and utilizes its pre-TODCO IPO tax assets, TODCO is required to pay us for the benefits received in accordance with the provisions of the tax sharing agreement. We will recognize those amounts as other income as those amounts are realized, which is generally based on when TODCO files its annual tax returns. See “—Outlook–Tax Matters.”
TODCO Segment
Delta Towing—As a result of the adoption of FASB Interpretation (“FIN”) 46 and a determination that TODCO was the primary beneficiary for accounting purposes of TODCO’s joint venture, Delta Towing Holdings, LLC (“DeltaTowing”), TODCO consolidated Delta Towing at December 31, 2003. Due to the consolidation of Delta Towing, other revenues and operating and maintenance expense increased during the year ended December 31, 2004 by $29.3 million and $24.5 million, respectively.
TODCO Stock Sales
In February 2004, we completed the TODCO IPO in which we sold 13.8 million shares of TODCO class Acommon stock representing 23 percent of TODCO’s total outstanding shares, at $12.00 per share. We received net proceeds of $155.7 million from the TODCO IPO and recognized a gain of $39.4 million in the first quarter of 2004, and representedthe excess of net proceeds received over the net book value of the TODCO shares sold in the TODCO IPO. TODCO was formerly known as R&B Falcon Corporation (“R&B Falcon”). Before the closing of the TODCO IPO, TODCO transferredto us all assets and subsidiaries unrelated to TODCO’s business (see “Item 1. Business”). R&B Falcon’s business waspreviously considerably broader than TODCO’s ongoing business.
As a result of the deconsolidation of TODCO from our other U.S. subsidiaries for U.S. federal income tax purposes in conjunction with the TODCO IPO, we established an initial valuation allowance in the first quarter of 2004 of approximately $31.0 million against the estimated deferred tax assets of TODCO in excess of its deferred tax liabilities andother deferred tax assets not expected to be realized, taking into account prudent and feasible tax planning strategies asrequired by SFAS 109. We adjusted the initial valuation allowance during the year to reflect changes in our estimate of the ultimate amount of TODCO’s deferred tax assets.
In conjunction with the closing of the TODCO IPO, TODCO granted restricted stock and stock options to certainof its employees under its long-term incentive plan and certain of these awards vested at the time of grant. In accordancewith the provisions of SFAS 123, Accounting for Stock-Based Compensation, TODCO recognized compensation expense of$5.6 million in the first quarter of 2004 as a result of the immediate vesting of certain awards. TODCO amortized $4.6 million to compensation expense subsequent to the TODCO IPO and prior to our deconsolidation of TODCO from ourconsolidated financial statements at December 17, 2004. In addition, certain of TODCO’s employees held options that weregranted prior to the TODCO IPO to acquire our ordinary shares. In accordance with the employee matters agreement, theseoptions were modified, which resulted in the accelerated vesting of the options and the extension of the term of the options through the original contractual life. In connection with the modification of these options, TODCO recognized $1.5 million additional compensation expense in the first quarter of 2004.
In September 2004, we completed the September 2004 Offering, in which we sold 17.9 million shares of TODCO’s class A common stock, representing 30 percent of TODCO’s total outstanding shares, at $15.75 per share. We received net
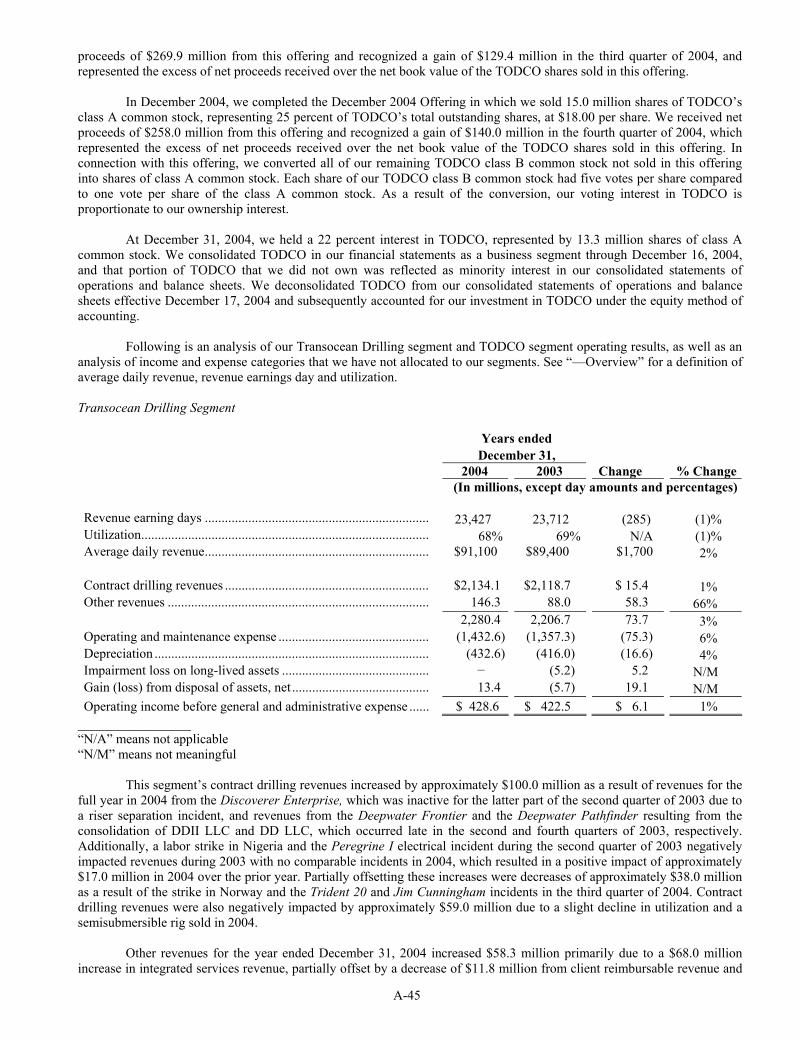
A-45
proceeds of $269.9 million from this offering and recognized a gain of $129.4 million in the third quarter of 2004, andrepresented the excess of net proceeds received over the net book value of the TODCO shares sold in this offering.
In December 2004, we completed the December 2004 Offering in which we sold 15.0 million shares of TODCO’s class A common stock, representing 25 percent of TODCO’s total outstanding shares, at $18.00 per share. We received net proceeds of $258.0 million from this offering and recognized a gain of $140.0 million in the fourth quarter of 2004, which represented the excess of net proceeds received over the net book value of the TODCO shares sold in this offering. Inconnection with this offering, we converted all of our remaining TODCO class B common stock not sold in this offeringinto shares of class A common stock. Each share of our TODCO class B common stock had five votes per share compared to one vote per share of the class A common stock. As a result of the conversion, our voting interest in TODCO is proportionate to our ownership interest.
At December 31, 2004, we held a 22 percent interest in TODCO, represented by 13.3 million shares of class A common stock. We consolidated TODCO in our financial statements as a business segment through December 16, 2004, and that portion of TODCO that we did not own was reflected as minority interest in our consolidated statements ofoperations and balance sheets. We deconsolidated TODCO from our consolidated statements of operations and balancesheets effective December 17, 2004 and subsequently accounted for our investment in TODCO under the equity method of accounting.
Following is an analysis of our Transocean Drilling segment and TODCO segment operating results, as well as ananalysis of income and expense categories that we have not allocated to our segments. See “—Overview” for a definition ofaverage daily revenue, revenue earnings day and utilization.
Transocean Drilling Segment
Years ended December 31,
2004 2003 Change % Change(In millions, except day amounts and percentages)
Revenue earning days ................................................................... 23,427 23,712 (285) (1)%Utilization...................................................................................... 68% 69% N/A (1)% Average daily revenue................................................................... $91,100 $89,400 $1,700 2%
Contract drilling revenues ............................................................. $2,134.1 $2,118.7 $ 15.4 1% Other revenues .............................................................................. 146.3 88.0 58.3 66% 2,280.4 2,206.7 73.7 3% Operating and maintenance expense ............................................. (1,432.6) (1,357.3) (75.3) 6% Depreciation .................................................................................. (432.6) (416.0) (16.6) 4% Impairment loss on long-lived assets ............................................ − (5.2) 5.2 N/MGain (loss) from disposal of assets, net ......................................... 13.4 (5.7) 19.1 N/MOperating income before general and administrative expense ...... $ 428.6 $ 422.5 $ 6.1 1%
_________________“N/A” means not applicable “N/M” means not meaningful
This segment’s contract drilling revenues increased by approximately $100.0 million as a result of revenues for the full year in 2004 from the Discoverer Enterprise, which was inactive for the latter part of the second quarter of 2003 due toa riser separation incident, and revenues from the Deepwater Frontier and the Deepwater Pathfinder resulting from the consolidation of DDII LLC and DD LLC, which occurred late in the second and fourth quarters of 2003, respectively.Additionally, a labor strike in Nigeria and the Peregrine I electrical incident during the second quarter of 2003 negativelyimpacted revenues during 2003 with no comparable incidents in 2004, which resulted in a positive impact of approximately$17.0 million in 2004 over the prior year. Partially offsetting these increases were decreases of approximately $38.0 millionas a result of the strike in Norway and the Trident 20 and Jim Cunningham incidents in the third quarter of 2004. Contractdrilling revenues were also negatively impacted by approximately $59.0 million due to a slight decline in utilization and asemisubmersible rig sold in 2004.
Other revenues for the year ended December 31, 2004 increased $58.3 million primarily due to a $68.0 million increase in integrated services revenue, partially offset by a decrease of $11.8 million from client reimbursable revenue and
A-46
the absence of revenue from management fees as a result of the consolidation of DDII LLC and DD LLC late in the secondand fourth quarters, respectively, of 2003.
This segment’s operating and maintenance expenses increased by approximately $83.0 million primarily from costs associated with higher personal injury claim losses, integrated services, additional expenses related to the DeepwaterPathfinder as a result of the consolidation of DD LLC late in the fourth quarter of 2003 and the Trident 20 and Jim Cunningham incidents in 2004. Expenses also increased approximately $25.0 million due to increased expenses primarilyrelated to activity and the reactivation of rigs, a loss on retirement of rig equipment and higher provisions for local taxmatters in 2004. Additional increases of $8.0 million resulted from favorable litigation and turnkey settlements during 2003with no comparable activity during 2004. Partially offsetting these increases were decreased operating and maintenance expenses of approximately $42.0 million primarily related to the settlement of the Discoverer Enterprise May 2003 riserincident, the favorable insurance settlement related to a prior year Peregrine I riser incident, the favorable settlement of a turnkey dispute during 2004 and costs incurred in 2003 related to the restructuring of the Nigeria defined benefit plan andthe Peregrine I electrical incident with no comparable activity in 2004.
The increase in this segment’s depreciation expense resulted primarily from $19.5 million of additional depreciation expense related to the Deepwater Frontier and Deepwater Pathfinder as a result of the late December 2003 payoff of the synthetic lease financing arrangements and the purchase of tensioner system equipment for the DiscovererEnterprise. An additional increase of approximately $2.0 million resulted from depreciation on other asset additions, net of retirements. These increases were partially offset by a $4.7 million decrease resulting from extending the useful lives of fourrigs from 30 to 32 years to 35 years in the fourth quarter of 2004 and $0.6 million resulting from rigs sold during andsubsequent to 2003.
During 2003, we recorded non-cash impairment charges in this segment of $5.2 million associated with the removal of two rigs from drilling service and the value assigned to leases on oil and gas properties that we intended to discontinue. The determination of fair market value was based on an offer from a potential buyer, in the case of the two rigs,and management’s assessment of fair value, in the case of the leases on oil and gas properties, where third party valuations were not available.
During 2004, this segment recognized net gains of $13.4 million related to the sales of the semisubmersible rig Sedco 602 and the sales and disposal of other assets. During the year ended December 31, 2003, this segment recognized net losses of $5.7 million related to the sales and disposal of other assets, partially offset by gains related to the sale of the jackup rig RBF 160, the sale of the Searex 15 and the settlement of an insurance claim.
Total Company Results of Operations
Years ended December 31, 2004 2003 Change % Change
(In millions, except % change)
General and Administrative Expense .................................... $ 67.0 $ 65.3 $ 1.7 3% Other (Income) Expense, net
Equity in earnings of unconsolidated affiliates ................ (9.2) (5.1) (4.1) 80% Interest income................................................................. (9.3) (18.8) 9.5 (51)% Interest expense................................................................ 171.7 202.0 (30.3) (15)% Gain from TODCO Stock Sales ....................................... (308.8) – (308.8) N/MNon-cash TODCO tax sharing agreement charge............ 167.1 – 167.1 N/MLoss on retirement of debt ............................................... 76.5 15.7 60.8 N/MImpairment loss on note receivable from related party .... – 21.3 (21.3) N/MOther, net.......................................................................... (0.4) 3.0 (3.4) N/M
Income Tax Expense ............................................................. 91.3 3.0 88.3 N/MMinority Interest.................................................................... (3.2) 0.2 (3.4) N/MCumulative Effect of a Change in Accounting Principle ...... – (0.8) 0.8 N/M
_________________________“N/M” means not meaningful
The increase in general and administrative expense was attributable to increases of approximately $10.0 million instock compensation expense, primarily related to the retirement of an executive officer, and professional fees related to
A-47
compliance with the Sarbanes-Oxley Act effective for 2004. The increase was partially offset by decreases attributable to the recognition in 2003 of $8.8 million of expenses relating to the TODCO IPO.
Equity in earnings of unconsolidated affiliates increased $5.8 million primarily related to our 50 percent share of earnings from Overseas Drilling Limited (“ODL”), which owns the drillship Joides Resolution, combined with $6.5 millionresulting from the absence of our share of losses from Delta Towing in 2003 due to TODCO’s consolidation of the joint venture at December 31, 2003 as a result of the adoption of FIN 46. Offsetting these increases was the absence of equity in earnings of $8.0 million related to our consolidation of DD LLC and DDII LLC in 2003, which resulted from the completion of the buyout of ConocoPhillips’ share of the joint ventures.
The decrease in interest income was primarily related to a decrease in average cash balances for 2004 compared to 2003 as cash was utilized for debt reduction and capital expenditures, which resulted in a reduction of interest income of$5.9 million. Additional decreases resulted from the absence in 2004 of $3.4 million of interest earned in 2003 on the notes receivable from Delta Towing, which was consolidated by TODCO at December 31, 2003 as a result of the adoption of FIN46.
The decrease in interest expense was primarily attributable to reductions in interest expense of $42.9 million associated with debt that was redeemed, retired or repurchased during or subsequent to 2003. Partially offsetting these decreases was the termination of our fixed to floating interest rate swaps in the first quarter of 2003, which resulted in a net increase in interest expense of $4.4 million (see “—Derivative Instruments”) and primarily from borrowings underrevolving credit agreements late in 2003 and in 2004, which resulted in an increase in interest expense of $5.8 million. In addition, we received a refund of interest from a taxing authority that resulted in a reduction of interest expense of $1.1 million in 2003, with no comparable activity for the same period in 2004.
During 2004, we recognized a $308.8 million gain from the TODCO Stock Sales (see “—Significant Events”).
During 2004, we recognized a $167.1 million non-cash charge related to contingent amounts due from TODCOunder a tax sharing agreement between us and TODCO (see “—Significant Events”).
During 2004, we recognized a $76.5 million loss related to the early retirements of $774.8 million aggregateprincipal amount of our debt (see “—Significant Events”). During 2003, we recognized a $15.7 million loss related to the early retirements of $888.6 million aggregate principal amount of our debt.
During 2003, we recognized a $21.3 million impairment loss on TODCO’s notes receivable from Delta Towing.
We recognized a $3.9 million favorable change in other, net relating to the effect of foreign currency exchange rate changes on our monetary assets and liabilities denominated in non-U.S. currencies, partially offset by proceeds receivedfrom the sale of a patent in 2003 with no comparable activity for the same period in 2004.
We operate internationally and provide for income taxes based on the tax laws and rates in the countries in whichwe operate and earn income. There is no expected relationship between the provision for income taxes and income before income taxes. Income tax expense for the year ended December 31, 2004 was $88.3 million higher than in the same period in 2003. Excluding other partially offsetting adjustments to our overall valuation allowance, which were included in thecomputation of the tax rate, the year ended December 31, 2004 included a provision for a valuation allowance of approximately $32 million related to the TODCO IPO (see “—Significant Events”). Income tax expense was reduced byapproximately $9 million, which related to changes in estimates of prior year taxes, and by approximately $13 million related to our U.K. net operating loss carryforwards and related valuation allowance. The year ended December 31, 2003included the impact of an approximate $15 million foreign tax benefit attributed to a favorable resolution of a non-U.S. income tax liability and income tax benefits of approximately $13 million resulting from non-cash impairments and loss on debt retirements. The higher income tax expense in 2004 compared to 2003 resulted in an annual effective tax rate adjustedfor various discrete items that was 20 percentage points higher for the year ended December 31, 2004 compared to the sameperiod in 2003.
The increase in minority interest was primarily attributable to the minority interest owners’ share of TODCO resulting from the TODCO Stock Sales in 2004 (see “—Significant Events”).
During 2003, we recognized a $0.8 million gain as a cumulative effect of a change in accounting principle related to TODCO’s consolidation of Delta Towing at December 31, 2003 as a result of the early adoption of the FIN 46.

A-48
TODCO Segment
The results discussed below for the TODCO segment are through December 16, 2004 as a result of the TODCOStock Sales and the deconsolidation of TODCO. See “—Significant Events.” See “—Overview” for a definition of average daily revenue, revenue earnings day and utilization.
Years ended December 31,
2004 2003 Change % Change(In millions, except day amounts and percentages)
Revenue earning days (a) .................................................... 10,476 10,953 (477) (4)%Utilization (a) ...................................................................... 43% 41% N/A 5% Average daily revenue (a) ................................................... $ 26,900 $19,200 $7,700 40%
Contract drilling revenues ................................................... $ 282.3 $ 209.8 $ 72.5 35% Other revenues..................................................................... 51.2 17.8 33.4 N/M
333.5 227.6 105.9 47% Operating and maintenance expense ................................... (281.0) (233.9) (47.1) 20% Depreciation ........................................................................ (92.0) (92.2) 0.2 N/MImpairment loss on long-lived assets................................... − (11.3) 11.3 N/MGain (loss) from disposal of assets, net ............................... 5.8 (7.7) 13.5 N/MOperating loss before general and administrative expense.. $ (33.7) $(117.5) $ 83.8 71%
___________________________“N/A” means not applicable “N/M” means not meaningful
(a) TODCO was deconsolidated effective December 17, 2004. Statistics for the TODCO segment are throughDecember 16, 2004 for the year ended December 31, 2004.
This segment’s contract drilling revenues increased by $72.5 million due to an increase in average daily revenue and utilization, which included the operations of a jackup rig in Venezuela and two jackup rigs in Mexico after the rigs were transferred from the Gulf of Mexico during the fourth quarter of 2003.
Other revenues for the year ended December 31, 2004 increased $33.4 million due primarily to the consolidation of Delta Towing at December 31, 2003 and increased client reimbursable revenue.
The increase in this segment’s operating and maintenance expense was primarily due to $24.5 million of costsassociated with the consolidation of Delta Towing at December 31, 2003, $14.7 million of operating and maintenanceexpense related to the operations of a jackup rig in Venezuela and two jackup rigs in Mexico after the rigs were transferredfrom the Gulf of Mexico and $11.8 million of higher compensation expense related to stock option and restricted stockgrants in connection with the TODCO IPO. Partially offsetting the above increases were decreases primarily due toapproximately $11.0 million of costs associated with the fire incident on inland barge Rig 20 and the well control incidenton inland barge Rig 62 during 2003 with no comparable activity during 2004.
During 2003, we recorded non-cash impairment charges in this segment of $11.3 million associated with the removal of five jackup rigs from drilling service and the write down in the value of an investment in a joint venture to fair value. The determination of fair market value was based on third party valuations, in the case of the jackup rigs, and management’s assessment of fair value, in the case of the investment in a joint venture, where third party valuations were not available.
During 2004, this segment recognized net gains of $5.8 million primarily related to the sale of marine supportvessels by Delta Towing, as well as the sales and disposal of other assets and the settlement of an October 2000 insuranceclaim. During 2003, this segment recognized net losses of $7.7 million primarily related to loss on retirements.
A-49
Critical Accounting Estimates
Our discussion and analysis of our financial condition and results of operations are based upon our consolidatedfinancial statements. This discussion should be read in conjunction with disclosures included in the notes to our consolidatedfinancial statements related to estimates, contingencies and new accounting pronouncements. Significant accounting policies are discussed in Note 2 to our consolidated financial statements. The preparation of our financial statements requires us tomake estimates and judgments that affect the reported amounts of assets, liabilities, revenues, expenses and related disclosure of contingent assets and liabilities. On an on-going basis, we evaluate our estimates, including those related tobad debts, materials and supplies obsolescence, investments, property and equipment, intangible assets and goodwill, income taxes, workers’ insurance, pensions and other post-retirement and employment benefits and contingent liabilities.We base our estimates on historical experience and on various other assumptions that we believe are reasonable under the circumstances, the results of which form the basis for making judgments about the carrying values of assets and liabilitiesthat are not readily apparent from other sources. Actual results may differ from these estimates under different assumptionsor conditions.
We believe the following are our most critical accounting policies. These policies require significant judgments and estimates used in the preparation of our consolidated financial statements. Management has discussed each of these criticalaccounting policies and estimates with the audit committee of the board of directors.
Income taxes—We are a Cayman Islands company registered in Barbados, and we are not subject to income tax inthe Cayman Islands. We operate through our various subsidiaries in a number of countries throughout the world. Incometaxes have been provided based upon the tax laws and rates in the countries in which operations are conducted and incomeis earned. There is no expected relationship between the provision for or benefit from income taxes and income or lossbefore taxes because the countries have taxation regimes that vary not only with respect to the nominal tax rate, but also interms of the availability of deductions, credits and other benefits. Variations also arise when income earned and taxed in a particular country or countries fluctuates from year to year.
Our annual tax provision is based on expected taxable income, statutory rates and tax planning opportunitiesavailable to us in the various jurisdictions in which we operate. The determination and evaluation of our annual taxprovision and tax positions involves the interpretation of the tax laws in the various jurisdictions in which we operate andrequires significant judgment and the use of estimates and assumptions regarding significant future events such as theamount, timing and character of income, deductions and tax credits. Changes in tax laws, regulations, agreements, and treaties, foreign currency exchange restrictions or our level of operations or profitability in each jurisdiction would impact our tax liability in any given year. We also operate in many jurisdictions where the tax laws relating to the offshore drillingindustry are not well developed. While our annual tax provision is based on the best information available at the time, a number of years may elapse before the ultimate tax liabilities in the various jurisdictions are determined.
We maintain liabilities for estimated tax exposures in jurisdictions of operation. Our annual tax provision includes the impact of income tax provisions and benefits for changes to liabilities that we consider appropriate, as well as relatedinterest. Tax exposure items primarily include potential challenges to intercompany pricing, disposition transactions and the applicability or rate of various withholding taxes. These exposures are resolved primarily through the settlement of audits within these tax jurisdictions or by judicial means, but can also be affected by changes in applicable tax law or other factors, which could cause us to conclude a revision of past estimates is appropriate. We are currently undergoing examinations in a number of taxing jurisdictions for various fiscal years. We believe that an appropriate liability has been established for estimated exposures. However, actual results may differ materially from these estimates. We review these liabilitiesquarterly and to the extent the audits or other events result in an adjustment to the liability accrued for a prior year, the effectwill be recognized in the period of the event.
As the result of changes in our estimates of certain tax exposures upon the settlement of income tax audits invarious tax jurisdictions during 2005, we recognized a decrease of $43.0 million in goodwill related to tax liabilities arisingprior to our December 31, 1999 merger with Sedco Forex Holdings Limited (“Sedco Forex”) and an income tax benefit of$48.7 million related to post-acquisition tax liabilities.
We do not believe it is possible to reasonably estimate the potential impact of changes to the assumptions andestimates identified because the resulting change to our tax liability, if any, is dependent on numerous factors which cannotbe reasonably estimated. These include, among others, the amount and nature of additional taxes potentially asserted bylocal tax authorities; the willingness of local tax authorities to negotiate a fair settlement through an administrative process;the impartiality of the local courts; and the potential for changes in the tax paid to one country to either produce, or fail to produce, an offsetting tax change in other countries.
A-50
Judgment is required in determining whether deferred tax assets will be realized in full or in part. When it isestimated to be more likely than not that all or some portion of specific deferred tax assets, such as foreign tax creditcarryovers or net operating loss carryforwards will not be realized, a valuation allowance must be established for the amountof the deferred tax assets that are estimated to not be realizable. As of December 31, 2003, we had established a valuation allowance against certain deferred tax assets, primarily U.S. foreign tax credit carryforwards and certain net operating losses, in the amount of $181.8 million. We decreased the valuation allowance to $48.5 million and $115.3 million, as of December 31, 2005 and 2004, respectively. If our facts or financial results were to change, thereby impacting the likelihood of realizing the deferred tax assets, judgment would have to be applied to determine changes to the amount of the valuation allowance in any given period. Such changes could result in either a decrease or an increase in our provision for incometaxes, depending on whether the change in judgment resulted in an increase or a decrease to the valuation allowance. See “Results of Operations—Historical 2005 compared to 2004” and “Results of Operations—Historical 2004 compared to 2003.” We continually evaluate strategies that could allow for the future utilization of our deferred tax assets.
We have not provided for deferred taxes on the unremitted earnings of certain subsidiaries that are permanently reinvested. Should we make a distribution from the unremitted earnings of these subsidiaries, we may be required to recordadditional taxes. Because we cannot predict when, if at all, we will make a distribution of these unremitted earnings, we are unable to make a determination of the amount of unrecognized deferred tax liability.
We have not provided for deferred taxes in circumstances where we expect that, due to the structure of operationsand applicable law, the operations in that jurisdiction will not give rise to future tax consequences. Should our expectationschange regarding the expected future tax consequences, we may be required to record additional deferred taxes that couldhave a material effect on our consolidated financial position, results of operations or cash flows.
Goodwill impairment—We perform a test for impairment of our goodwill annually as of October 1 as prescribed bySFAS 142, Goodwill and Other Intangible Assets. Because our business is cyclical in nature, goodwill could be significantly impaired depending on when the assessment is performed in the business cycle. The fair value of our reporting units is based on a blend of estimated discounted cash flows, publicly traded company multiples and acquisition multiples.Estimated discounted cash flows are based on projected utilization and dayrates. Publicly traded company multiples andacquisition multiples are derived from information on traded shares and analysis of recent acquisitions in the marketplace, respectively, for companies with operations similar to ours. Changes in the assumptions used in the fair value calculationcould result in an estimated reporting unit fair value that is below the carrying value, which may give rise to an impairmentof goodwill. In addition to the annual review, we also test for impairment should an event occur or circumstances changethat may indicate a reduction in the fair value of a reporting unit below its carrying value. As a result of these tests for impairment, we had no impairment of goodwill for the years ended December 31, 2005, 2004 and 2003.
In addition, as long as we continue to operate in one reporting segment, we intend to use market capitalization asthe basis for the measurement of the fair value of our one reporting segment as we believe it is representative of, and the best evidence for, the fair value of the reporting unit as a whole.
Property and equipment—Our property and equipment represents approximately 64 percent of our total assets. Wedetermine the carrying value of these assets based on our property and equipment accounting policies, which incorporate our estimates, assumptions, and judgments relative to capitalized costs, useful lives and salvage values of our rigs.
Our property and equipment accounting policies are also designed to depreciate our assets over their estimateduseful lives. The assumptions and judgments we use in determining the estimated useful lives of our rigs reflect bothhistorical experience and expectations regarding future operations, utilization and performance of our assets. The use ofdifferent estimates, assumptions and judgments in the establishment of property and equipment accounting policies, especially those involving the useful lives of our rigs, would likely result in materially different net book values of ourassets and results of operations.
In addition, our policies are designed to appropriately and consistently capitalize costs incurred to enhance,improve and extend the useful lives of our assets and expense those costs incurred to repair and maintain the existing condition of our rigs. Capitalized costs increase the carrying values and depreciation expense of the related assets, whichwould also impact our results of operations.
Useful lives of rigs are difficult to estimate due to a variety of factors, including technological advances that impact the methods or cost of oil and gas exploration and development, changes in market or economic conditions, and changes inlaws or regulations affecting the drilling industry. We evaluate the remaining useful lives of our rigs when certain events occur that directly impact our assessment of the remaining useful lives of the rig and include changes in operating condition,functional capability and market and economic factors. We also consider major capital upgrades required to perform certaincontracts and the long-term impact of those upgrades on the future marketability when assessing the useful lives of
A-51
individual rigs. A one year increase in the useful lives of all of our rigs would cause a decrease in our annual depreciationexpense of approximately $38.2 million while a one year decrease would cause an increase in our annual depreciation expense of approximately $51.5 million.
We review our property and equipment for impairment when events or changes in circumstances indicate that thecarrying value of such assets or asset groups may be impaired or when reclassifications are made between property andequipment and assets held for sale as prescribed by SFAS 144, Accounting for Impairment or Disposal of Long-LivedAssets. Asset impairment evaluations are based on estimated undiscounted cash flows for the assets being evaluated. Supplyand demand are the key drivers of rig idle time and our ability to contract our rigs at economical rates. During periods of anoversupply, it is not uncommon for us to have rigs idled for extended periods of time, which could be an indication that anasset group may be impaired. Our rigs are equipped to operate in geographic regions throughout the world. Because our rigs are mobile, we may move rigs from an oversupplied market sector to one that is more lucrative and undersupplied when it is economical to do so. As such, our rigs are considered to be interchangeable within classes or asset groups and accordingly, our impairment evaluation is made by asset group. We consider our asset groups to be High-Specification Floaters, Other Floaters, Jackups and Other Rigs.
An impairment loss is recorded in the period in which it is determined that the aggregate carrying amount of assetswithin an asset group is not recoverable. This requires us to make judgments regarding long-term forecasts of futurerevenues and costs related to the assets subject to review. In turn, these forecasts are uncertain in that they requireassumptions about demand for our services, future market conditions and technological developments. Significant and unanticipated changes to these assumptions could require a provision for impairment in a future period. Given the nature ofthese evaluations and their application to specific asset groups and specific times, it is not possible to reasonably quantifythe impact of changes in these assumptions.
Pension and other postretirement benefits—Our defined benefit pension and other postretirement benefit (retiree life insurance and medical benefits) obligations and the related benefit costs are accounted for in accordance with SFAS 87, Employers’ Accounting for Pensions, and SFAS 106, Employers’ Accounting for Postretirement Benefits Other thanPensions. Pension and postretirement costs and obligations are actuarially determined and are affected by assumptionsincluding expected return on plan assets, discount rates, compensation increases, employee turnover rates and health care cost trend rates. We evaluate our assumptions periodically and make adjustments to these assumptions and the recordedliabilities as necessary.
Two of the most critical assumptions are the expected long-term rate of return on plan assets and the assumeddiscount rate. We evaluate our assumptions regarding the estimated long-term rate of return on plan assets based onhistorical experience and future expectations on investment returns, which are calculated by our third party investmentadvisor utilizing the asset allocation classes held by the plan’s portfolios. We utilize a yield curve approach based on Aa corporate bonds and the expected timing of future benefit payments as a basis for determining the discount rate for our U.S. plans. Changes in these and other assumptions used in the actuarial computations could impact our projected benefitobligations, pension liabilities, pension expense and other comprehensive income. We base our determination of pension expense on a market-related valuation of assets that reduces year-to-year volatility. This market-related valuation recognizes investment gains or losses over a five-year period from the year in which they occur. Investment gains or losses for thispurpose are the difference between the expected return calculated using the market-related value of assets and the actual return based on the market-related value of assets.
For each percentage point the expected long-term rate of return assumption is lowered, pension expense wouldincrease by approximately $2.0 million. For each one-half percentage point the discount rate is lowered, pension expensewould increase by approximately $3.6 million. See “―Retirement Plans and Other Postemployment Benefits.”
Contingent liabilities—We establish reserves for estimated loss contingencies when we believe a loss is probable and the amount of the loss can be reasonably estimated. Our contingent liability reserves relate primarily to litigation,personal injury claims and potential tax assessments (see “―Income Taxes”). Revisions to contingent liability reserves are reflected in income in the period in which different facts or information become known or circumstances change that affectour previous assumptions with respect to the likelihood or amount of loss. Reserves for contingent liabilities are based upon our assumptions and estimates regarding the probable outcome of the matter. Should the outcome differ from our assumptions and estimates or other events result in a material adjustment to the accrued estimated reserves, revisions to theestimated reserves for contingent liabilities would be required and would be recognized in the period the new informationbecomes known.
A-52
The estimation of the liability for personal injury claims includes the application of a loss development factor toreserves for known claims in order to estimate our ultimate liability for claims incurred during the period. The loss development method is based on the assumption that historical patterns of loss development will continue in the future.Actual losses may vary from the estimates computed with these reserve development factors as they are dependent uponfuture contingent events such as court decisions and settlements.
Retirement Plans and Other Postemployment Benefits
Defined Benefit Pension Plans—We maintain a qualified defined benefit pension plan (the “Retirement Plan”) covering substantially all U.S. employees, and an unfunded plan (the “Supplemental Benefit Plan”) to provide certaineligible employees with benefits in excess of those allowed under the Retirement Plan. In conjunction with the R&B Falconmerger, we acquired three defined benefit pension plans, two funded and one unfunded (the “Frozen Plans”), that were frozen prior to the merger for which benefits no longer accrue but the pension obligations have not been fully paid out. Werefer to the Retirement Plan, the Supplemental Benefit Plan and the Frozen Plans collectively as the “U.S. Plans.”
In addition, we provide several defined benefit plans, primarily group pension schemes with life insurancecompanies covering our Norway operations and two unfunded plans covering certain of our employees and former employees (the “Norway Plans”). Our contributions to the Norway Plans are determined primarily by the respective life insurance companies based on the terms of the plan. For the insurance-based plans, annual premium payments are considered to represent a reasonable approximation of the service costs of benefits earned during the period. We also haveunfunded defined benefit plans (the “Nigeria Plan” and the “Egypt Plan”) that provide retirement and severance benefits forcertain of our Nigerian and Egyptian employees. The benefits we provide under defined benefit pension plans are comprisedof the U.S. Plans, the Norway Plans, the Nigeria Plan and the Egypt Plan (collectively, the “Transocean Plans”).
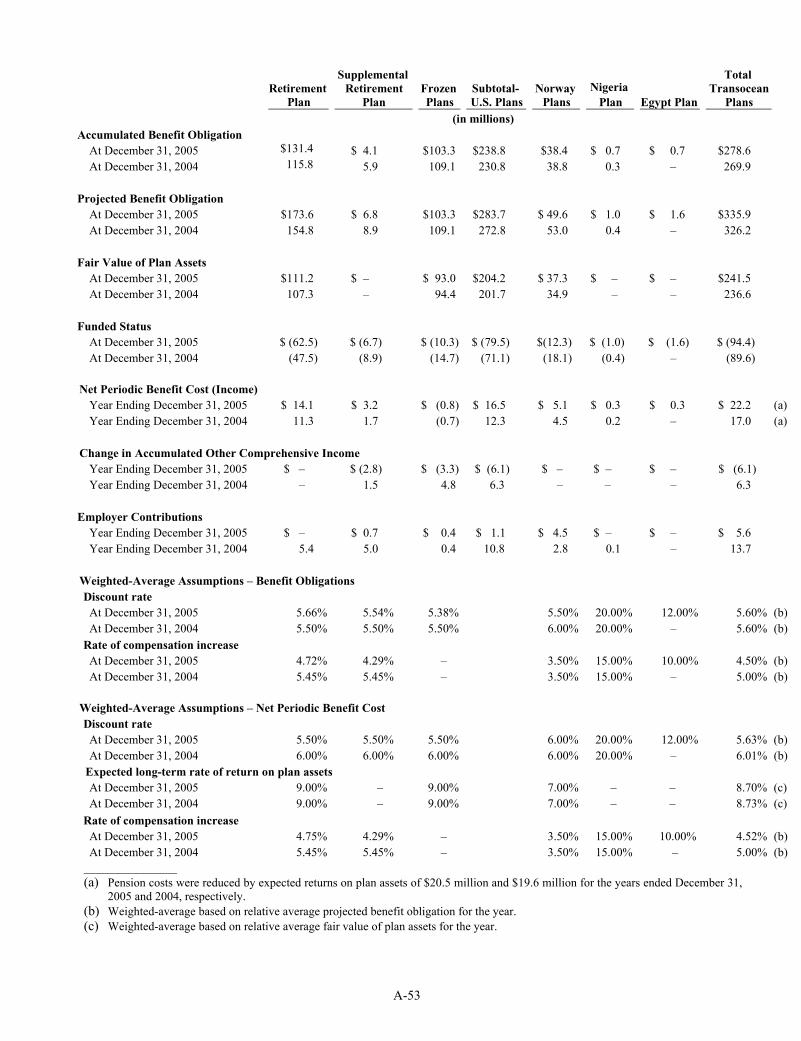
A-53
Retirement Plan
Supplemental Retirement
Plan Frozen Plans
Subtotal- U.S. Plans
NorwayPlans
Nigeria Plan Egypt Plan
Total Transocean
Plans(in millions)
Accumulated Benefit Obligation At December 31, 2005 $131.4 $ 4.1 $103.3 $238.8 $38.4 $ 0.7 $ 0.7 $278.6 At December 31, 2004 115.8 5.9 109.1 230.8 38.8 0.3 – 269.9
Projected Benefit Obligation At December 31, 2005 $173.6 $ 6.8 $103.3 $283.7 $ 49.6 $ 1.0 $ 1.6 $335.9 At December 31, 2004 154.8 8.9 109.1 272.8 53.0 0.4 – 326.2
Fair Value of Plan Assets At December 31, 2005 $111.2 $ – $ 93.0 $204.2 $ 37.3 $ – $ – $241.5 At December 31, 2004 107.3 – 94.4 201.7 34.9 – – 236.6
Funded Status At December 31, 2005 $ (62.5) $ (6.7) $ (10.3) $ (79.5) $(12.3) $ (1.0) $ (1.6) $ (94.4) At December 31, 2004 (47.5) (8.9) (14.7) (71.1) (18.1) (0.4) – (89.6)
Net Periodic Benefit Cost (Income) Year Ending December 31, 2005 $ 14.1 $ 3.2 $ (0.8) $ 16.5 $ 5.1 $ 0.3 $ 0.3 $ 22.2 (a)Year Ending December 31, 2004 11.3 1.7 (0.7) 12.3 4.5 0.2 – 17.0 (a)
Change in Accumulated Other Comprehensive Income Year Ending December 31, 2005 $ – $ (2.8) $ (3.3) $ (6.1) $ – $ – $ – $ (6.1) Year Ending December 31, 2004 – 1.5 4.8 6.3 – – – 6.3
Employer Contributions Year Ending December 31, 2005 $ – $ 0.7 $ 0.4 $ 1.1 $ 4.5 $ – $ – $ 5.6 Year Ending December 31, 2004 5.4 5.0 0.4 10.8 2.8 0.1 – 13.7
Weighted-Average Assumptions – Benefit Obligations Discount rate
At December 31, 2005 5.66% 5.54% 5.38% 5.50% 20.00% 12.00% 5.60% (b)At December 31, 2004 5.50% 5.50% 5.50% 6.00% 20.00% – 5.60% (b)
Rate of compensation increaseAt December 31, 2005 4.72% 4.29% – 3.50% 15.00% 10.00% 4.50% (b)At December 31, 2004 5.45% 5.45% – 3.50% 15.00% – 5.00% (b)
Weighted-Average Assumptions – Net Periodic Benefit Cost Discount rate
At December 31, 2005 5.50% 5.50% 5.50% 6.00% 20.00% 12.00% 5.63% (b)At December 31, 2004 6.00% 6.00% 6.00% 6.00% 20.00% – 6.01% (b)
Expected long-term rate of return on plan assetsAt December 31, 2005 9.00% – 9.00% 7.00% – – 8.70% (c)At December 31, 2004 9.00% – 9.00% 7.00% – – 8.73% (c)
Rate of compensation increaseAt December 31, 2005 4.75% 4.29% – 3.50% 15.00% 10.00% 4.52% (b)At December 31, 2004 5.45% 5.45% – 3.50% 15.00% – 5.00% (b)
______________(a) Pension costs were reduced by expected returns on plan assets of $20.5 million and $19.6 million for the years ended December 31,
2005 and 2004, respectively.(b) Weighted-average based on relative average projected benefit obligation for the year.(c) Weighted-average based on relative average fair value of plan assets for the year.
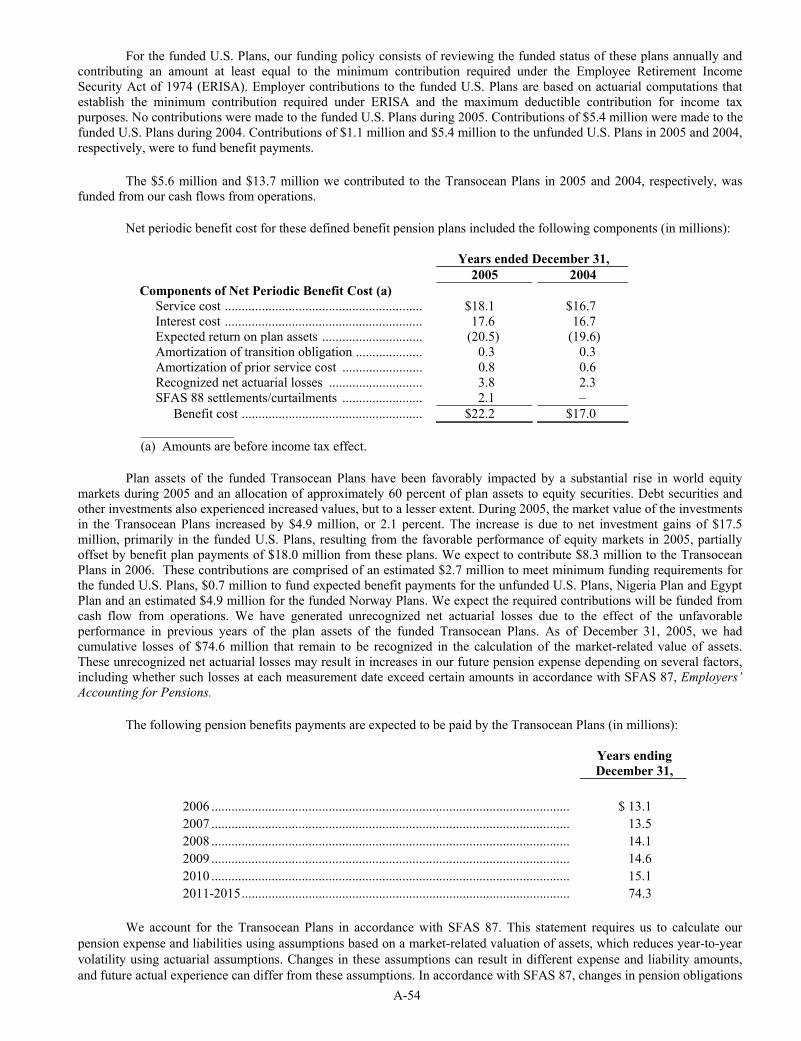
A-54
For the funded U.S. Plans, our funding policy consists of reviewing the funded status of these plans annually and contributing an amount at least equal to the minimum contribution required under the Employee Retirement IncomeSecurity Act of 1974 (ERISA). Employer contributions to the funded U.S. Plans are based on actuarial computations thatestablish the minimum contribution required under ERISA and the maximum deductible contribution for income taxpurposes. No contributions were made to the funded U.S. Plans during 2005. Contributions of $5.4 million were made to thefunded U.S. Plans during 2004. Contributions of $1.1 million and $5.4 million to the unfunded U.S. Plans in 2005 and 2004, respectively, were to fund benefit payments.
The $5.6 million and $13.7 million we contributed to the Transocean Plans in 2005 and 2004, respectively, wasfunded from our cash flows from operations.
Net periodic benefit cost for these defined benefit pension plans included the following components (in millions):
Years ended December 31, 2005 2004
Components of Net Periodic Benefit Cost (a) Service cost ........................................................... $18.1 $16.7 Interest cost ........................................................... 17.6 16.7 Expected return on plan assets .............................. (20.5) (19.6) Amortization of transition obligation .................... 0.3 0.3 Amortization of prior service cost ........................ 0.8 0.6 Recognized net actuarial losses ............................ 3.8 2.3 SFAS 88 settlements/curtailments ........................ 2.1 –
Benefit cost ...................................................... $22.2 $17.0 ______________(a) Amounts are before income tax effect.
Plan assets of the funded Transocean Plans have been favorably impacted by a substantial rise in world equitymarkets during 2005 and an allocation of approximately 60 percent of plan assets to equity securities. Debt securities and other investments also experienced increased values, but to a lesser extent. During 2005, the market value of the investments in the Transocean Plans increased by $4.9 million, or 2.1 percent. The increase is due to net investment gains of $17.5million, primarily in the funded U.S. Plans, resulting from the favorable performance of equity markets in 2005, partiallyoffset by benefit plan payments of $18.0 million from these plans. We expect to contribute $8.3 million to the Transocean Plans in 2006. These contributions are comprised of an estimated $2.7 million to meet minimum funding requirements for the funded U.S. Plans, $0.7 million to fund expected benefit payments for the unfunded U.S. Plans, Nigeria Plan and EgyptPlan and an estimated $4.9 million for the funded Norway Plans. We expect the required contributions will be funded fromcash flow from operations. We have generated unrecognized net actuarial losses due to the effect of the unfavorable performance in previous years of the plan assets of the funded Transocean Plans. As of December 31, 2005, we had cumulative losses of $74.6 million that remain to be recognized in the calculation of the market-related value of assets. These unrecognized net actuarial losses may result in increases in our future pension expense depending on several factors, including whether such losses at each measurement date exceed certain amounts in accordance with SFAS 87, Employers’Accounting for Pensions.
The following pension benefits payments are expected to be paid by the Transocean Plans (in millions):
Years ending December 31,
2006 ........................................................................................................... $ 13.1 2007 ........................................................................................................... 13.5 2008 ........................................................................................................... 14.1 2009 ........................................................................................................... 14.6 2010 ........................................................................................................... 15.1 2011-2015.................................................................................................. 74.3
We account for the Transocean Plans in accordance with SFAS 87. This statement requires us to calculate ourpension expense and liabilities using assumptions based on a market-related valuation of assets, which reduces year-to-year volatility using actuarial assumptions. Changes in these assumptions can result in different expense and liability amounts, and future actual experience can differ from these assumptions. In accordance with SFAS 87, changes in pension obligations

A-55
and assets may not be immediately recognized as pension costs in the statement of operations but generally are recognized in future years over the remaining average service period of plan participants. As such, significant portions of pension costs recorded in any period may not reflect the actual level of benefit payments provided to plan participants.
Two of the most critical assumptions used in calculating our pension expense and liabilities are the expected long-term rate of return on plan assets and the assumed discount rate. In 2004, the effect of the decrease in the discount rate offset the increases in the fair value of plan assets resulting in an increase in the minimum pension liability of $6.3 million. In2005, the increase in the fair value of plan assets offset the decrease in the discount rate resulting in a decrease in the minimum pension liability of $6.1 million. At December 31, 2005, the minimum pension liability included in other comprehensive income was $35.9 million. The minimum pension liability adjustments did not impact our results of operations during 2003, 2004 or 2005, nor did these adjustments affect our ability to meet any financial covenants related to our debt facilities.
Our expected long-term rates of return on plan assets for the funded U.S. Plans was 9.0 percent as of December 31,2005 and 2004. The expected long-term rate of return on plan assets was developed by reviewing each plan's targeted assetallocation and asset class long-term rate of return expectations. We regularly review our actual asset allocation and periodically rebalance plan assets as appropriate. For the U.S. Plans, we discounted our future pension obligations using arate of 5.5 percent at December 31, 2005, 6.0 percent at December 31, 2004 and 6.0 percent at December 31, 2003.
We expect pension expense related to the Transocean Plans for 2006 to increase by approximately $0.8 million primarily due to the change in discount rate assumptions.
Future changes in plan asset returns, assumed discount rates and various other factors related to the pension planswill impact our future pension expense and liabilities. We cannot predict with certainty what these factors will be in thefuture.
Postretirement Benefits Other Than Pensions―We have several unfunded contributory and noncontributorypostretirement benefit plans covering substantially all of our U.S. employees. Funding of benefit payments for planparticipants will be made as costs are incurred. Net periodic benefit cost for these other postretirement plans included the following components (in millions):
Years ended December 31, 2005 2004
Components of Net Periodic Benefit Cost (a) Service cost ........................................................... $ 1.3 $ 1.0 Interest cost ........................................................... 2.1 2.1 Amortization of prior service cost ........................ (2.3) (2.3) Recognized net actuarial losses ............................ 1.7 1.5
Benefit cost ...................................................... $ 2.8 $ 2.3 ______________(a) Amounts are before income tax effect.
The following postretirement benefits payments are expected to be paid by our postretirement benefits plans (in millions):
Years ending December 31,
2006............................................................................................................ $ 1.4 2007............................................................................................................ 1.5 2008............................................................................................................ 1.6 2009............................................................................................................ 1.7 2010............................................................................................................ 1.8 2011-2015 .................................................................................................. 10.5
Off–Balance Sheet Arrangement
We leased the semisubmersible rig M. G. Hulme, Jr. from Deep Sea Investors, L.L.C. (“Deep Sea Investors”), aspecial purpose entity formed by several leasing companies to acquire the rig from one of our subsidiaries in November
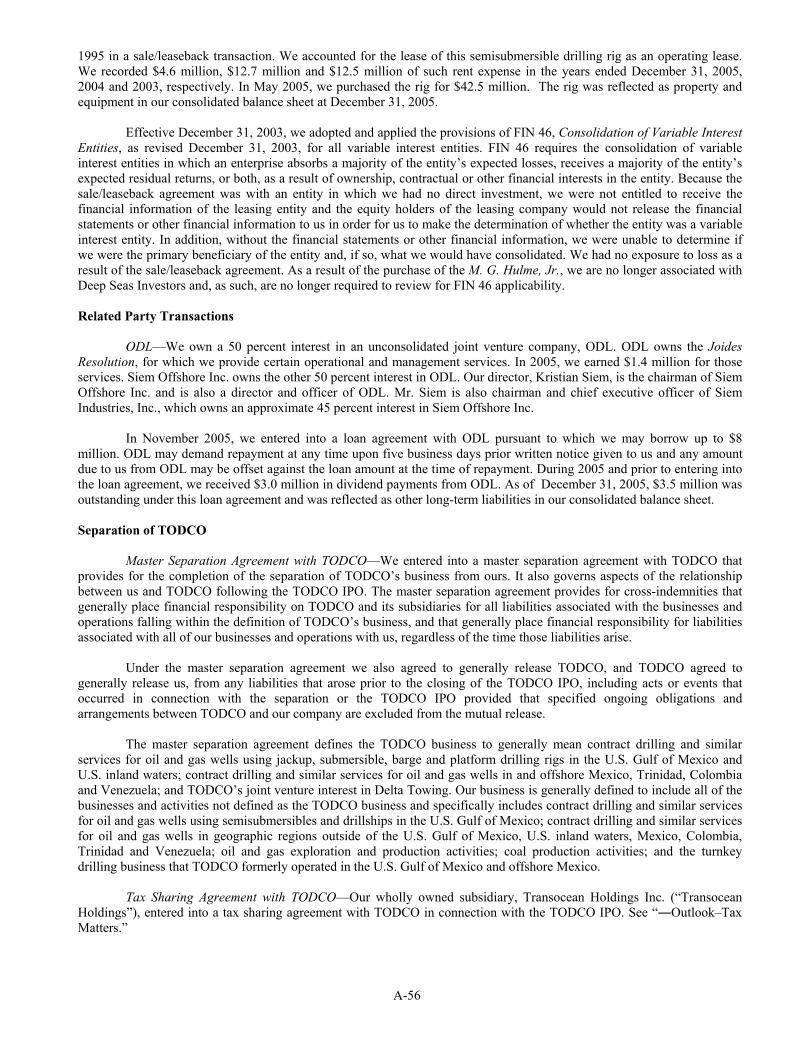
A-56
1995 in a sale/leaseback transaction. We accounted for the lease of this semisubmersible drilling rig as an operating lease. We recorded $4.6 million, $12.7 million and $12.5 million of such rent expense in the years ended December 31, 2005, 2004 and 2003, respectively. In May 2005, we purchased the rig for $42.5 million. The rig was reflected as property andequipment in our consolidated balance sheet at December 31, 2005.
Effective December 31, 2003, we adopted and applied the provisions of FIN 46, Consolidation of Variable Interest Entities, as revised December 31, 2003, for all variable interest entities. FIN 46 requires the consolidation of variableinterest entities in which an enterprise absorbs a majority of the entity’s expected losses, receives a majority of the entity’s expected residual returns, or both, as a result of ownership, contractual or other financial interests in the entity. Because the sale/leaseback agreement was with an entity in which we had no direct investment, we were not entitled to receive thefinancial information of the leasing entity and the equity holders of the leasing company would not release the financial statements or other financial information to us in order for us to make the determination of whether the entity was a variable interest entity. In addition, without the financial statements or other financial information, we were unable to determine ifwe were the primary beneficiary of the entity and, if so, what we would have consolidated. We had no exposure to loss as aresult of the sale/leaseback agreement. As a result of the purchase of the M. G. Hulme, Jr., we are no longer associated with Deep Seas Investors and, as such, are no longer required to review for FIN 46 applicability.
Related Party Transactions
ODL—We own a 50 percent interest in an unconsolidated joint venture company, ODL. ODL owns the JoidesResolution, for which we provide certain operational and management services. In 2005, we earned $1.4 million for those services. Siem Offshore Inc. owns the other 50 percent interest in ODL. Our director, Kristian Siem, is the chairman of SiemOffshore Inc. and is also a director and officer of ODL. Mr. Siem is also chairman and chief executive officer of SiemIndustries, Inc., which owns an approximate 45 percent interest in Siem Offshore Inc.
In November 2005, we entered into a loan agreement with ODL pursuant to which we may borrow up to $8million. ODL may demand repayment at any time upon five business days prior written notice given to us and any amountdue to us from ODL may be offset against the loan amount at the time of repayment. During 2005 and prior to entering intothe loan agreement, we received $3.0 million in dividend payments from ODL. As of December 31, 2005, $3.5 million was outstanding under this loan agreement and was reflected as other long-term liabilities in our consolidated balance sheet.
Separation of TODCO
Master Separation Agreement with TODCO—We entered into a master separation agreement with TODCO thatprovides for the completion of the separation of TODCO’s business from ours. It also governs aspects of the relationshipbetween us and TODCO following the TODCO IPO. The master separation agreement provides for cross-indemnities that generally place financial responsibility on TODCO and its subsidiaries for all liabilities associated with the businesses and operations falling within the definition of TODCO’s business, and that generally place financial responsibility for liabilitiesassociated with all of our businesses and operations with us, regardless of the time those liabilities arise.
Under the master separation agreement we also agreed to generally release TODCO, and TODCO agreed togenerally release us, from any liabilities that arose prior to the closing of the TODCO IPO, including acts or events thatoccurred in connection with the separation or the TODCO IPO provided that specified ongoing obligations and arrangements between TODCO and our company are excluded from the mutual release.
The master separation agreement defines the TODCO business to generally mean contract drilling and similarservices for oil and gas wells using jackup, submersible, barge and platform drilling rigs in the U.S. Gulf of Mexico and U.S. inland waters; contract drilling and similar services for oil and gas wells in and offshore Mexico, Trinidad, Colombiaand Venezuela; and TODCO’s joint venture interest in Delta Towing. Our business is generally defined to include all of thebusinesses and activities not defined as the TODCO business and specifically includes contract drilling and similar services for oil and gas wells using semisubmersibles and drillships in the U.S. Gulf of Mexico; contract drilling and similar services for oil and gas wells in geographic regions outside of the U.S. Gulf of Mexico, U.S. inland waters, Mexico, Colombia,Trinidad and Venezuela; oil and gas exploration and production activities; coal production activities; and the turnkeydrilling business that TODCO formerly operated in the U.S. Gulf of Mexico and offshore Mexico.
Tax Sharing Agreement with TODCO—Our wholly owned subsidiary, Transocean Holdings Inc. (“Transocean Holdings”), entered into a tax sharing agreement with TODCO in connection with the TODCO IPO. See “―Outlook–TaxMatters.”
A-57
New Accounting Pronouncements
In May 2005, the FASB issued SFAS 154, “Accounting Changes and Error Corrections,” which requires retrospective application to all prior period financial statements presented for voluntary changes in accounting principle unless it is impracticable. This statement replaces Accounting Principles Board Opinion (“APB”) 20, Accounting Changes, and SFAS 3, Reporting Accounting Changes in Interim Financial Statements, though it carries forward the guidance inthose pronouncements with respect to accounting for changes in estimates, changes in reporting entity and the correction of errors. SFAS 154 is effective for accounting changes and corrections of errors made in fiscal years beginning after December 15, 2005. We adopted SFAS 154 effective January 1, 2006, and we do not expect the adoption of this statement to have an impact on our consolidated financial position, results of operations or cash flows.
In December 2004, the FASB issued SFAS 123 (revised 2004) (“SFAS 123(R)”), Share-Based Payment, which is a revision of SFAS 123, Accounting for Stock-Based Compensation. SFAS 123(R) supersedes APB 25, Accounting for StockIssued to Employees, and amends SFAS 95, Statement of Cash Flows. While the approach in SFAS 123(R) is similar to the approach described in SFAS 123, SFAS 123(R) requires recognition in the income statement of all share-based payments toemployees, including grants of employee stock options, based on their fair values, and pro forma disclosure is no longer analternative. We adopted SFAS 123(R) effective January 1, 2006.
SFAS 123(R) permits adoption using one of two methods, a modified prospective method (“Prospective Method”)or a modified retrospective method (“Retrospective Method”). With the Prospective Method, costs are recognized beginningwith the effective date based on the requirements of SFAS 123(R) for (i) all share-based payments granted after the effective date of SFAS 123(R), and (ii) all awards granted to employees prior to the effective date of SFAS 123(R) that remainunvested on the effective date. The Retrospective Method applies the requirements of the Prospective Method but furtherpermits entities to restate all prior periods presented based on the amounts previously recognized under SFAS 123 for purposes of pro forma disclosures. We elected to adopt SFAS 123(R) using the Prospective Method.
We previously adopted the fair-value-based method of accounting for share-based payments effective January 1, 2003 using the Prospective Method as described in SFAS 148, Accounting for Stock-Based Compensation–Transition andDisclosure. We currently use the Black-Scholes-Merton formula to estimate the value of stock options granted toemployees, which is an acceptable share-based award valuation model, and we have chosen that model for determining fairvalue of stock awards granted under SFAS 123(R). Our APB 25 options vested in the third quarter of 2005. As a result,adoption of SFAS 123(R) had no effect on these options.
Since we adopted SFAS 123(R) using the Prospective Method, we do not expect the adoption to have an impact onour consolidated financial position, results of operations or cash flows. In addition to the compensation cost recognitionrequirements, SFAS 123(R) also requires the tax deduction benefits for an award in excess of recognized compensation costto be reported as a financing cash flow rather than as an operating cash flow, which is currently required under SFAS 95.While we cannot estimate what these amounts will be in the future (because they depend on, among other things, whenemployees exercise stock options), we reported operating cash flows related to tax deduction benefits of $22.1 million forthe year ended December 31, 2005.
Under SFAS 123, we recognize the compensation cost over the vesting period up to the date of actual retirement.We will continue this practice for awards granted prior to the adoption of SFAS 123(R). Upon the adoption of SFAS 123(R), we will recognize compensation cost for awards granted or modified after January 1, 2006 through the date the employee is no longer required to provide service to earn the award (“service period”). If we had amortized compensation cost over the service period, the amount would not have been material in 2005.
A-58
ITEM 7A. Quantitative and Qualitative Disclosures About Market Risk
Interest Rate Risk
Our exposure to market risk for changes in interest rates relates primarily to our long-term and short-term debt. Thetable below presents scheduled debt maturities in U.S. dollars and related weighted-average interest rates for each of theyears ended December 31 relating to debt obligations as of December 31, 2005.
At December 31, 2005 (in millions, except interest rate percentages):
Scheduled Maturity Date (a) (b) Fair Value2006 2007 2008 2009 2010 Thereafter Total 12/31/05
Total debt Fixed rate.............................. $400.0 $100.0 $19.0 $− $− $1,069.4 $1,588.4 $1,865.3
Average interest rate 1.5% 7.5% 2.8% −% −% 7.4% 5.8%__________________________(a) Maturity dates of the face value of our debt assume the put options on the 1.5% Convertible Debentures, 7.45% Notes
and Zero Coupon Convertible Debentures will be exercised in May 2006, April 2007 and May 2008, respectively. (b) Expected maturity amounts are based on the face value of debt.
At December 31, 2005, we had no variable rate debt and as such interest expense had no exposure to changes in interest rates. However, a large part of our cash investments would earn commensurately higher rates of return if interestrates increase. Using December 31, 2005 cash investment levels, a one percentage point change in interest rates would result in a corresponding change in interest income of approximately $3.3 million per year.
The fair market value of our debt at December 31, 2004 was $2,702.5 million compared to $1,865.3 million atDecember 31, 2005. The decrease in fair value of $837.2 million was primarily caused by our repurchases and redemptions of debt during the year, as well as changes in the corporate bond market.
Foreign Exchange Risk
Our international operations expose us to foreign exchange risk. We use a variety of techniques to minimize the exposure to foreign exchange risk, including customer contract payment terms and the possible use of foreign exchangederivative instruments. Our primary foreign exchange risk management strategy involves structuring customer contracts toprovide for payment in both U.S. dollars, which is our functional currency, and local currency. The payment portion denominated in local currency is based on anticipated local currency requirements over the contract term. Due to various factors, including customer acceptance, local banking laws, other statutory requirements, local currency convertibility and the impact of inflation on local costs, actual foreign exchange needs may vary from those anticipated in the customer contracts, resulting in partial exposure to foreign exchange risk. Fluctuations in foreign currencies typically have not had amaterial impact on overall results. In situations where payments of local currency do not equal local currency requirements, foreign exchange derivative instruments, specifically foreign exchange forward contracts, or spot purchases, may be used tomitigate foreign currency risk. A foreign exchange forward contract obligates us to exchange predetermined amounts ofspecified foreign currencies at specified exchange rates on specified dates or to make an equivalent U.S. dollar payment equal to the value of such exchange. We do not enter into derivative transactions for speculative purposes. At December 31, 2005, we had no open foreign exchange derivative contracts.
--- F-1
ITEM 8. Financial Statements and Supplementary Data
MANAGEMENT’S REPORT ON INTERNAL CONTROL OVER FINANCIAL REPORTING
Management of Transocean Inc. (the “Company” or “our”) is responsible for establishing and maintaining adequate internal control over financial reporting for the Company as defined in Rules 13a-15(f) and 15d-15(f) under the Securities Exchange Act of 1934. The Company’s internal control system was designed to provide reasonable assurance to the Company’s management and Board of Directors regarding the reliability of financial reporting and the preparation offinancial statements for external purposes in accordance with U.S. generally accepted accounting principles.
Internal control over financial reporting includes the controls themselves, monitoring (including internal auditingpractices), and actions taken to correct deficiencies as identified.
There are inherent limitations to the effectiveness of internal control over financial reporting, however welldesigned, including the possibility of human error and the possible circumvention or overriding of controls. The design of aninternal control system is also based in part upon assumptions and judgments made by management about the likelihood offuture events, and there can be no assurance that an internal control will be effective under all potential future conditions. As a result, even an effective system of internal controls can provide no more than reasonable assurance with respect to the fair presentation of financial statements and the processes under which they were prepared.
Management assessed the effectiveness of the Company’s internal control over financial reporting as ofDecember 31, 2005. In making this assessment, management used the criteria for internal control over financial reporting described in Internal Control–Integrated Framework by the Committee of Sponsoring Organizations of the TreadwayCommission (COSO). Management’s assessment included an evaluation of the design of the Company’s internal controlover financial reporting and testing of the operating effectiveness of its internal control over financial reporting.Management reviewed the results of its assessment with the Audit Committee of the Company’s Board of Directors. Based on this assessment, management has concluded that, as of December 31, 2005, the Company’s internal control over financial reporting was effective.
Ernst & Young LLP, an independent registered public accounting firm, audited management’s assessment of the effectiveness of the Company’s internal control over financial reporting as of December 31, 2005. Their report includedelsewhere herein expresses an unqualified opinion on management’s assessment and on the effectiveness of our internalcontrol over financial reporting as of December 31, 2005.
F-2
REPORT OF INDEPENDENT REGISTERED PUBLIC ACCOUNTING FIRM ON INTERNAL CONTROL OVER FINANCIAL REPORTING
The Board of Directors and Shareholders of Transocean Inc.
We have audited management’s assessment, included in the accompanying Management’s Report on Internal Control Over Financial Reporting, that Transocean Inc. maintained effective internal control over financial reporting as of December 31, 2005, based on criteria established in Internal Control—Integrated Framework issued by the Committee of Sponsoring Organizations of the Treadway Commission (the COSO criteria). Transocean Inc.’s management is responsiblefor maintaining effective internal control over financial reporting and for its assessment of the effectiveness of internal control over financial reporting. Our responsibility is to express an opinion on management’s assessment and an opinion onthe effectiveness of the company’s internal control over financial reporting based on our audit.
We conducted our audit in accordance with the standards of the Public Company Accounting Oversight Board(United States). Those standards require that we plan and perform the audit to obtain reasonable assurance about whether effective internal control over financial reporting was maintained in all material respects. Our audit included obtaining an understanding of internal control over financial reporting, evaluating management’s assessment, testing and evaluating the design and operating effectiveness of internal control, and performing such other procedures as we considered necessary inthe circumstances. We believe that our audit provides a reasonable basis for our opinion.
A company’s internal control over financial reporting is a process designed to provide reasonable assurance regarding the reliability of financial reporting and the preparation of financial statements for external purposes in accordance with generally accepted accounting principles. A company’s internal control over financial reporting includes those policies and procedures that (1) pertain to the maintenance of records that, in reasonable detail, accurately and fairly reflect the transactions and dispositions of the assets of the company; (2) provide reasonable assurance that transactions are recorded as necessary to permit preparation of financial statements in accordance with generally accepted accounting principles, and thatreceipts and expenditures of the company are being made only in accordance with authorizations of management and directors of the company; and (3) provide reasonable assurance regarding prevention or timely detection of unauthorizedacquisition, use, or disposition of the company’s assets that could have a material effect on the financial statements.
Because of its inherent limitations, internal control over financial reporting may not prevent or detect misstatements. Also, projections of any evaluation of effectiveness to future periods are subject to the risk that controls may become inadequate because of changes in conditions, or that the degree of compliance with the policies or procedures maydeteriorate.
In our opinion, management’s assessment that Transocean Inc. maintained effective internal control over financialreporting as of December 31, 2005, is fairly stated, in all material respects, based on the COSO criteria. Also, in our opinion, Transocean Inc. maintained, in all material respects, effective internal control over financial reporting as of December 31, 2005, based on the COSO criteria.
We also have audited, in accordance with the standards of the Public Company Accounting Oversight Board (United States), the consolidated balance sheets of Transocean Inc. and Subsidiaries as of December 31, 2005 and 2004, and the related consolidated statements of operations, comprehensive income, equity, and cash flows for each of the three yearsin the period ended December 31, 2005 and our report dated March 8, 2006 expressed an unqualified opinion thereon.
/s/ Ernst & Young LLP
Houston, Texas March 8, 2006
F-3
REPORT OF INDEPENDENT REGISTERED PUBLIC ACCOUNTING FIRM
The Board of Directors and Shareholders of Transocean Inc.
We have audited the accompanying consolidated balance sheets of Transocean Inc. and Subsidiaries as ofDecember 31, 2005 and 2004, and the related consolidated statements of operations, comprehensive income, equity,and cash flows for each of the three years in the period ended December 31, 2005. Our audits also included thefinancial statement schedule listed in the Index at Item 15(a). These financial statements and schedule are theresponsibility of the Company's management. Our responsibility is to express an opinion on these financialstatements and schedule based on our audits.
We conducted our audits in accordance with the standards of the Public Company Accounting OversightBoard (United States). Those standards require that we plan and perform the audit to obtain reasonable assuranceabout whether the financial statements are free of material misstatement. An audit includes examining, on a test basis, evidence supporting the amounts and disclosures in the financial statements. An audit also includes assessingthe accounting principles used and significant estimates made by management, as well as evaluating the overallfinancial statement presentation. We believe that our audits provide a reasonable basis for our opinion.
In our opinion, the financial statements referred to above present fairly, in all material respects, the consolidated financial position of Transocean Inc. and Subsidiaries at December 31, 2005 and 2004, and theconsolidated results of their operations and their cash flows for each of the three years in the period ended December 31, 2005, in conformity with U.S. generally accepted accounting principles. Also, in our opinion, the relatedfinancial statement schedule, when considered in relation to the basic financial statements taken as a whole, presents fairly in all material respects the information set forth therein.
We also have audited, in accordance with the standards of the Public Company Accounting Oversight Board (United States), the effectiveness of Transocean Inc.’s internal control over financial reporting as of December 31, 2005, based on criteria established in Internal Control-Integrated Framework issued by the Committeeof Sponsoring Organizations of the Treadway Commission and our report dated March 8, 2006 expressed anunqualified opinion thereon.
/s/ Ernst & Young LLP
Houston, Texas March 8, 2006
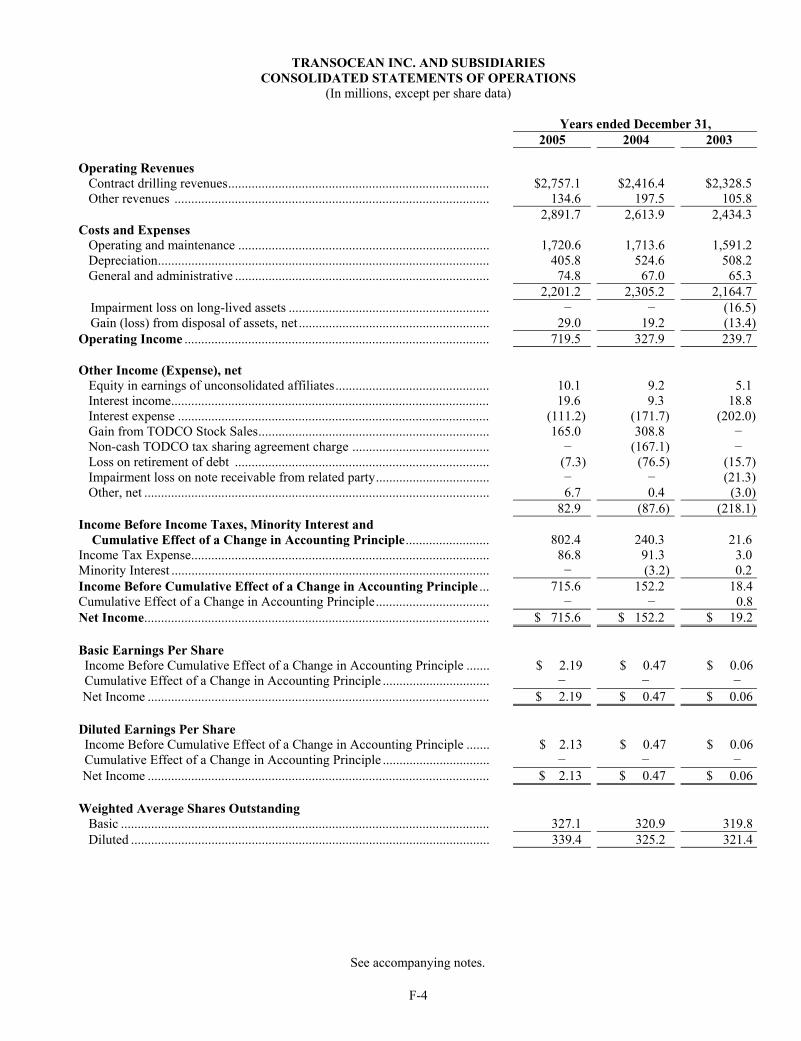
F-4
TRANSOCEAN INC. AND SUBSIDIARIES CONSOLIDATED STATEMENTS OF OPERATIONS
(In millions, except per share data)
Years ended December 31, 2005 2004 2003
Operating Revenues Contract drilling revenues.............................................................................. $2,757.1 $2,416.4 $2,328.5
Other revenues .............................................................................................. 134.6 197.5 105.82,891.7 2,613.9 2,434.3
Costs and Expenses Operating and maintenance ........................................................................... 1,720.6 1,713.6 1,591.2Depreciation................................................................................................... 405.8 524.6 508.2General and administrative ............................................................................ 74.8 67.0 65.3
2,201.2 2,305.2 2,164.7Impairment loss on long-lived assets ............................................................ − − (16.5)Gain (loss) from disposal of assets, net ......................................................... 29.0 19.2 (13.4)
Operating Income ........................................................................................... 719.5 327.9 239.7
Other Income (Expense), net Equity in earnings of unconsolidated affiliates.............................................. 10.1 9.2 5.1
Interest income............................................................................................... 19.6 9.3 18.8Interest expense ............................................................................................. (111.2) (171.7) (202.0)Gain from TODCO Stock Sales..................................................................... 165.0 308.8 −Non-cash TODCO tax sharing agreement charge ......................................... − (167.1) −
Loss on retirement of debt ............................................................................ (7.3) (76.5) (15.7) Impairment loss on note receivable from related party.................................. − − (21.3)Other, net ....................................................................................................... 6.7 0.4 (3.0)
82.9 (87.6) (218.1)Income Before Income Taxes, Minority Interest and
Cumulative Effect of a Change in Accounting Principle......................... 802.4 240.3 21.6Income Tax Expense......................................................................................... 86.8 91.3 3.0Minority Interest ............................................................................................... − (3.2) 0.2Income Before Cumulative Effect of a Change in Accounting Principle ... 715.6 152.2 18.4Cumulative Effect of a Change in Accounting Principle.................................. − − 0.8Net Income....................................................................................................... $ 715.6 $ 152.2 $ 19.2
Basic Earnings Per Share Income Before Cumulative Effect of a Change in Accounting Principle ....... $ 2.19 $ 0.47 $ 0.06Cumulative Effect of a Change in Accounting Principle ................................ − − −Net Income ...................................................................................................... $ 2.19 $ 0.47 $ 0.06
Diluted Earnings Per ShareIncome Before Cumulative Effect of a Change in Accounting Principle ....... $ 2.13 $ 0.47 $ 0.06Cumulative Effect of a Change in Accounting Principle ................................ − − −Net Income ...................................................................................................... $ 2.13 $ 0.47 $ 0.06
Weighted Average Shares Outstanding Basic .............................................................................................................. 327.1 320.9 319.8
Diluted ........................................................................................................... 339.4 325.2 321.4
See accompanying notes.
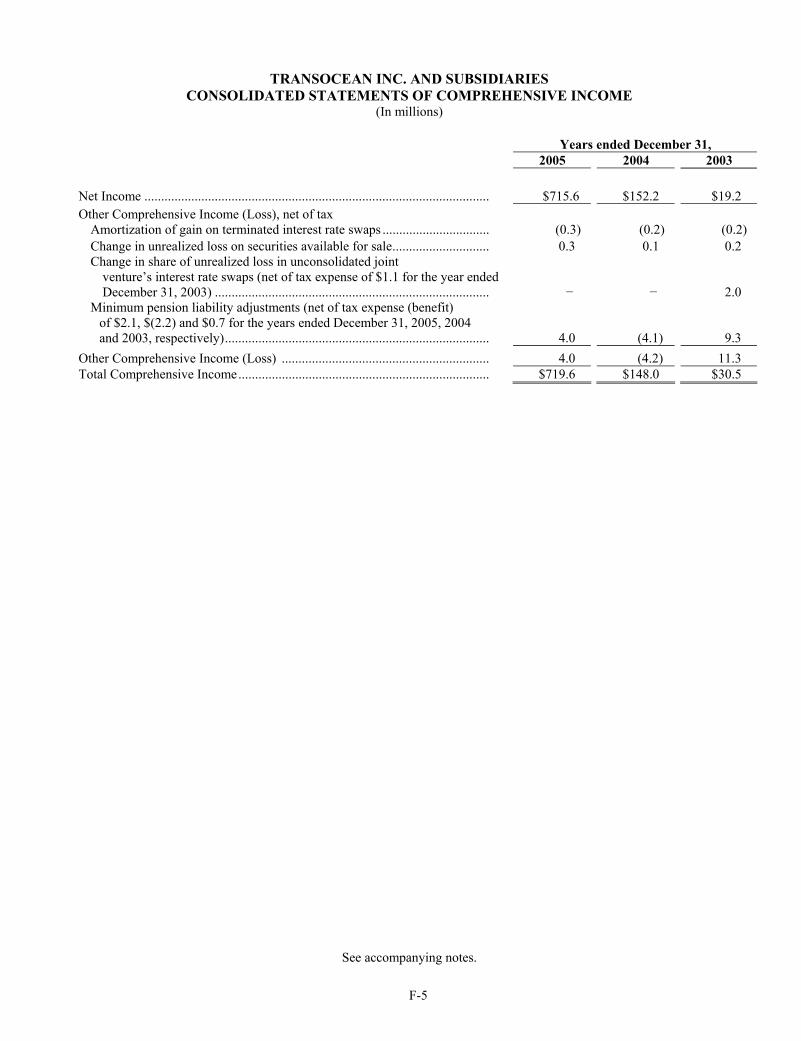
F-5
TRANSOCEAN INC. AND SUBSIDIARIES CONSOLIDATED STATEMENTS OF COMPREHENSIVE INCOME
(In millions)
Years ended December 31, 2005 2004 2003
Net Income ....................................................................................................... $715.6 $152.2 $19.2 Other Comprehensive Income (Loss), net of tax
Amortization of gain on terminated interest rate swaps ................................ (0.3) (0.2) (0.2) Change in unrealized loss on securities available for sale............................. 0.3 0.1 0.2 Change in share of unrealized loss in unconsolidated joint
venture’s interest rate swaps (net of tax expense of $1.1 for the year endedDecember 31, 2003) .................................................................................. − − 2.0
Minimum pension liability adjustments (net of tax expense (benefit) of $2.1, $(2.2) and $0.7 for the years ended December 31, 2005, 2004 and 2003, respectively)............................................................................... 4.0 (4.1) 9.3
Other Comprehensive Income (Loss) .............................................................. 4.0 (4.2) 11.3 Total Comprehensive Income........................................................................... $719.6 $148.0 $30.5
See accompanying notes.
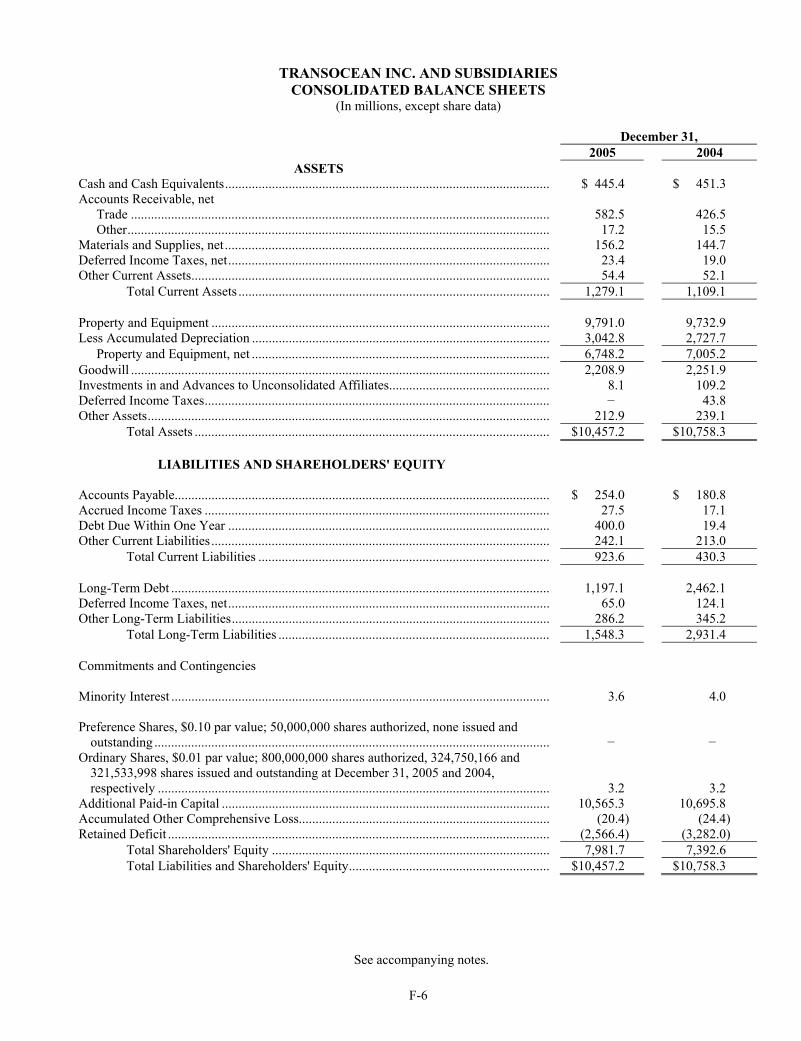
F-6
TRANSOCEAN INC. AND SUBSIDIARIES CONSOLIDATED BALANCE SHEETS
(In millions, except share data)
December 31, 2005 2004
ASSETS Cash and Cash Equivalents................................................................................................. $ 445.4 $ 451.3 Accounts Receivable, net
Trade ............................................................................................................................. 582.5 426.5 Other.............................................................................................................................. 17.2 15.5
Materials and Supplies, net................................................................................................. 156.2 144.7 Deferred Income Taxes, net................................................................................................ 23.4 19.0 Other Current Assets........................................................................................................... 54.4 52.1
Total Current Assets ............................................................................................. 1,279.1 1,109.1
Property and Equipment ..................................................................................................... 9,791.0 9,732.9 Less Accumulated Depreciation ......................................................................................... 3,042.8 2,727.7
Property and Equipment, net ......................................................................................... 6,748.2 7,005.2Goodwill ............................................................................................................................. 2,208.9 2,251.9 Investments in and Advances to Unconsolidated Affiliates................................................ 8.1 109.2 Deferred Income Taxes....................................................................................................... − 43.8 Other Assets........................................................................................................................ 212.9 239.1
Total Assets .......................................................................................................... $10,457.2 $10,758.3
LIABILITIES AND SHAREHOLDERS' EQUITY
Accounts Payable................................................................................................................ $ 254.0 $ 180.8Accrued Income Taxes ....................................................................................................... 27.5 17.1 Debt Due Within One Year ................................................................................................ 400.0 19.4 Other Current Liabilities..................................................................................................... 242.1 213.0
Total Current Liabilities ....................................................................................... 923.6 430.3
Long-Term Debt ................................................................................................................. 1,197.1 2,462.1 Deferred Income Taxes, net................................................................................................ 65.0 124.1 Other Long-Term Liabilities............................................................................................... 286.2 345.2
Total Long-Term Liabilities ................................................................................. 1,548.3 2,931.4
Commitments and Contingencies
Minority Interest ................................................................................................................. 3.6 4.0
Preference Shares, $0.10 par value; 50,000,000 shares authorized, none issued and outstanding ...................................................................................................................... − −
Ordinary Shares, $0.01 par value; 800,000,000 shares authorized, 324,750,166 and 321,533,998 shares issued and outstanding at December 31, 2005 and 2004, respectively ..................................................................................................................... 3.2 3.2
Additional Paid-in Capital .................................................................................................. 10,565.3 10,695.8Accumulated Other Comprehensive Loss........................................................................... (20.4) (24.4) Retained Deficit .................................................................................................................. (2,566.4) (3,282.0)
Total Shareholders' Equity ................................................................................... 7,981.7 7,392.6 Total Liabilities and Shareholders' Equity............................................................ $10,457.2 $10,758.3
See accompanying notes.
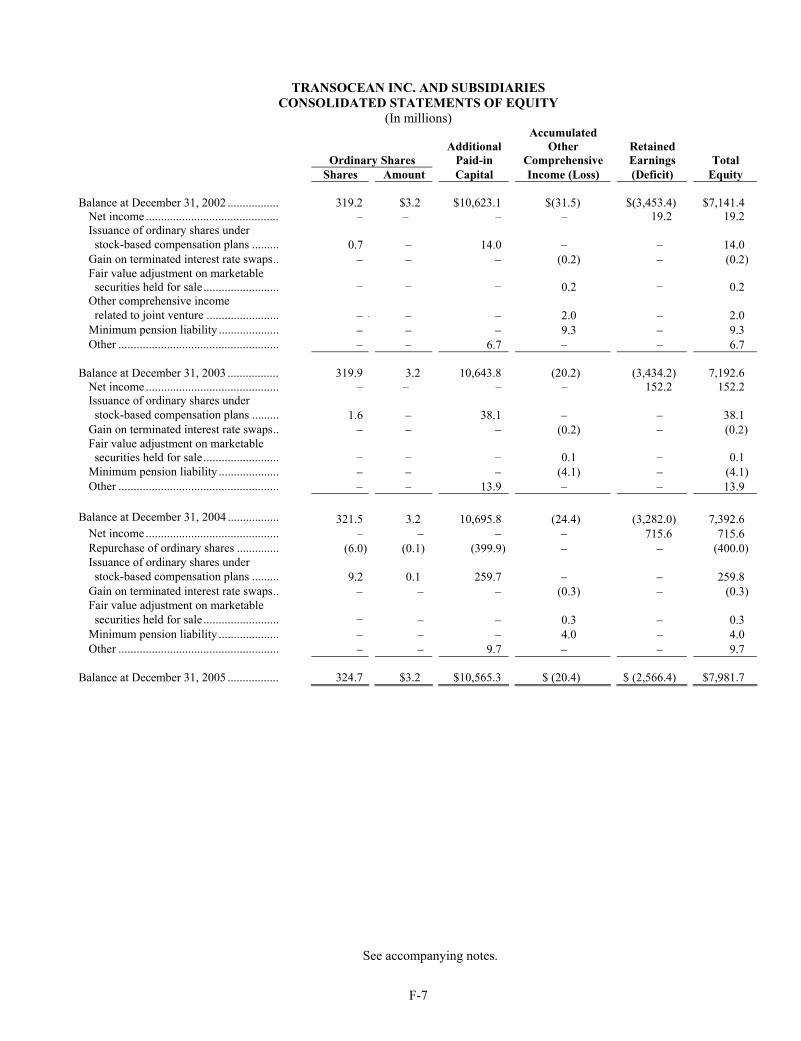
F-7
TRANSOCEAN INC. AND SUBSIDIARIES CONSOLIDATED STATEMENTS OF EQUITY
(In millions) Accumulated
Additional Other RetainedOrdinary Shares Paid-in Comprehensive Earnings Total
Shares Amount Capital Income (Loss) (Deficit) Equity
Balance at December 31, 2002 ................. 319.2 $3.2 $10,623.1 $(31.5) $(3,453.4) $7,141.4 Net income ............................................ – – – – 19.2 19.2 Issuance of ordinary shares under stock-based compensation plans ......... 0.7 − 14.0 − − 14.0
Gain on terminated interest rate swaps.. − − − (0.2) − (0.2) Fair value adjustment on marketable securities held for sale ......................... − − − 0.2 − 0.2
Other comprehensive incomerelated to joint venture ........................ −− − − 2.0 − 2.0
Minimum pension liability .................... − − − 9.3 − 9.3 Other ..................................................... − − 6.7 − − 6.7
Balance at December 31, 2003 ................. 319.9 3.2 10,643.8 (20.2) (3,434.2) 7,192.6 Net income ............................................ – – – – 152.2 152.2 Issuance of ordinary shares under stock-based compensation plans ......... 1.6 − 38.1 − − 38.1
Gain on terminated interest rate swaps.. − − − (0.2) − (0.2) Fair value adjustment on marketable securities held for sale ......................... − − − 0.1 − 0.1
Minimum pension liability .................... − − − (4.1) − (4.1) Other ..................................................... − − 13.9 − − 13.9
Balance at December 31, 2004 ................. 321.5 3.2 10,695.8 (24.4) (3,282.0) 7,392.6 Net income ............................................ – − − − 715.6 715.6 Repurchase of ordinary shares .............. (6.0) (0.1) (399.9) − − (400.0) Issuance of ordinary shares under stock-based compensation plans ......... 9.2 0.1 259.7 − − 259.8
Gain on terminated interest rate swaps.. − − − (0.3) − (0.3) Fair value adjustment on marketable securities held for sale ......................... − − − 0.3 − 0.3
Minimum pension liability .................... − − − 4.0 − 4.0 Other ..................................................... − − 9.7 − − 9.7
Balance at December 31, 2005 ................. 324.7 $3.2 $10,565.3 $ (20.4) $ (2,566.4) $7,981.7
See accompanying notes.
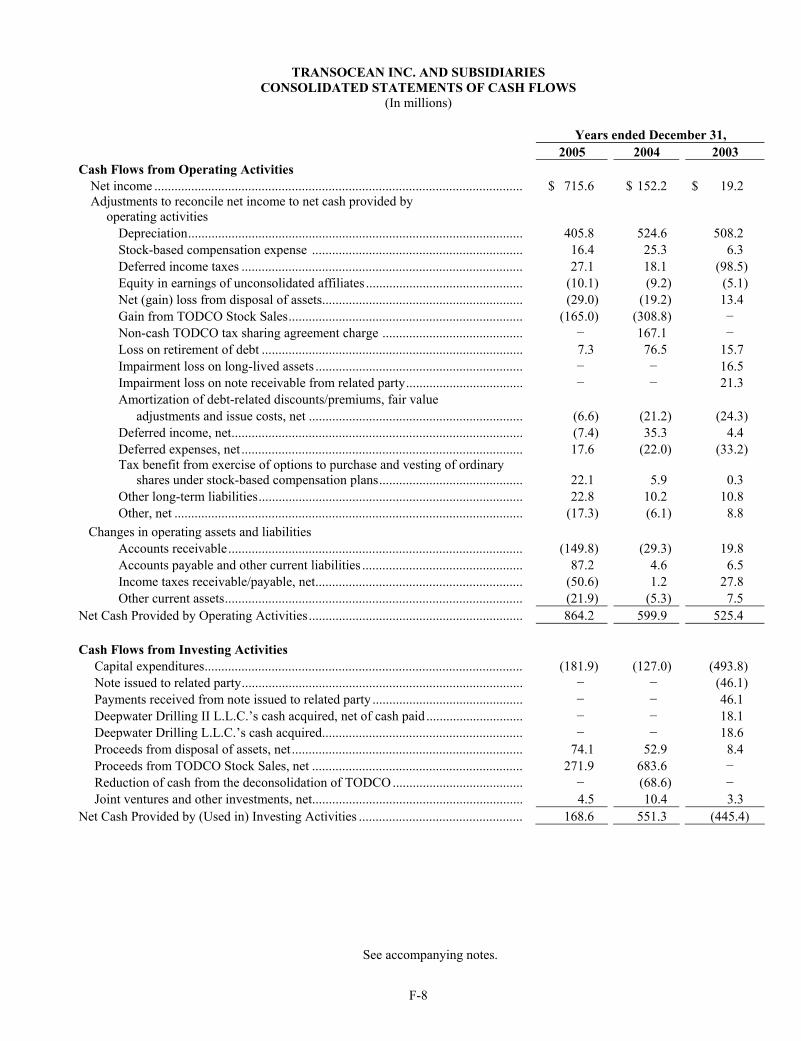
F-8
TRANSOCEAN INC. AND SUBSIDIARIES CONSOLIDATED STATEMENTS OF CASH FLOWS
(In millions)
Years ended December 31, 2005 2004 2003
Cash Flows from Operating Activities Net income .............................................................................................................. $ 715.6 $ 152.2 $ 19.2 Adjustments to reconcile net income to net cash provided by
operating activities Depreciation.................................................................................................... 405.8 524.6 508.2 Stock-based compensation expense ............................................................... 16.4 25.3 6.3 Deferred income taxes .................................................................................... 27.1 18.1 (98.5)Equity in earnings of unconsolidated affiliates ............................................... (10.1) (9.2) (5.1) Net (gain) loss from disposal of assets............................................................ (29.0) (19.2) 13.4 Gain from TODCO Stock Sales...................................................................... (165.0) (308.8) −Non-cash TODCO tax sharing agreement charge .......................................... − 167.1 −Loss on retirement of debt .............................................................................. 7.3 76.5 15.7 Impairment loss on long-lived assets .............................................................. − − 16.5 Impairment loss on note receivable from related party................................... − − 21.3 Amortization of debt-related discounts/premiums, fair value
adjustments and issue costs, net ................................................................ (6.6) (21.2) (24.3) Deferred income, net....................................................................................... (7.4) 35.3 4.4Deferred expenses, net .................................................................................... 17.6 (22.0) (33.2)Tax benefit from exercise of options to purchase and vesting of ordinary
shares under stock-based compensation plans........................................... 22.1 5.9 0.3 Other long-term liabilities............................................................................... 22.8 10.2 10.8 Other, net ........................................................................................................ (17.3) (6.1) 8.8
Changes in operating assets and liabilities Accounts receivable........................................................................................ (149.8) (29.3) 19.8 Accounts payable and other current liabilities ................................................ 87.2 4.6 6.5 Income taxes receivable/payable, net.............................................................. (50.6) 1.2 27.8 Other current assets......................................................................................... (21.9) (5.3) 7.5
Net Cash Provided by Operating Activities................................................................ 864.2 599.9 525.4
Cash Flows from Investing Activities Capital expenditures............................................................................................... (181.9) (127.0) (493.8)Note issued to related party.................................................................................... − − (46.1) Payments received from note issued to related party ............................................. − − 46.1 Deepwater Drilling II L.L.C.’s cash acquired, net of cash paid ............................. − − 18.1 Deepwater Drilling L.L.C.’s cash acquired............................................................ − − 18.6 Proceeds from disposal of assets, net ..................................................................... 74.1 52.9 8.4 Proceeds from TODCO Stock Sales, net ............................................................... 271.9 683.6 −Reduction of cash from the deconsolidation of TODCO ....................................... − (68.6) −Joint ventures and other investments, net............................................................... 4.5 10.4 3.3
Net Cash Provided by (Used in) Investing Activities ................................................. 168.6 551.3 (445.4)
See accompanying notes.
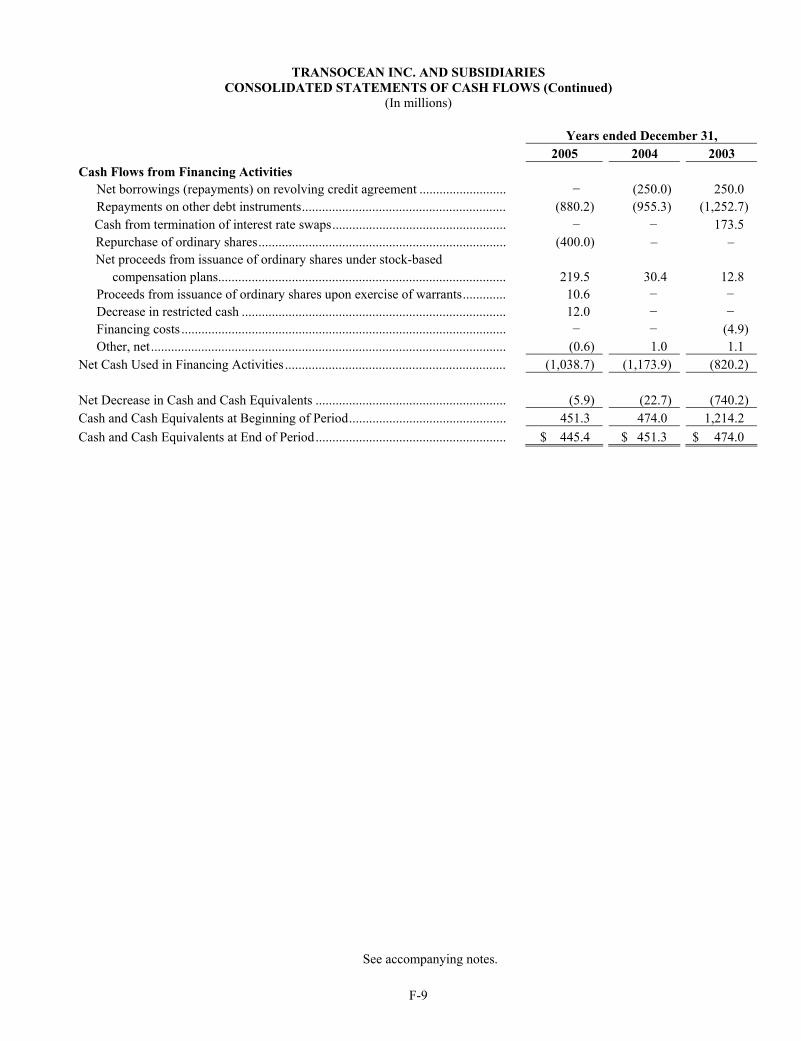
F-9
TRANSOCEAN INC. AND SUBSIDIARIES CONSOLIDATED STATEMENTS OF CASH FLOWS (Continued)
(In millions)
Years ended December 31, 2005 2004 2003
Cash Flows from Financing Activities Net borrowings (repayments) on revolving credit agreement .......................... − (250.0) 250.0 Repayments on other debt instruments............................................................. (880.2) (955.3) (1,252.7)Cash from termination of interest rate swaps.................................................... − − 173.5 Repurchase of ordinary shares.......................................................................... (400.0) – – Net proceeds from issuance of ordinary shares under stock-based
compensation plans...................................................................................... 219.5 30.4 12.8Proceeds from issuance of ordinary shares upon exercise of warrants............. 10.6 − −Decrease in restricted cash ............................................................................... 12.0 − −Financing costs ................................................................................................. − − (4.9) Other, net.......................................................................................................... (0.6) 1.0 1.1
Net Cash Used in Financing Activities .................................................................. (1,038.7) (1,173.9) (820.2)
Net Decrease in Cash and Cash Equivalents ......................................................... (5.9) (22.7) (740.2) Cash and Cash Equivalents at Beginning of Period............................................... 451.3 474.0 1,214.2 Cash and Cash Equivalents at End of Period......................................................... $ 445.4 $ 451.3 $ 474.0
See accompanying notes.
TRANSOCEAN INC. AND SUBSIDIARIES NOTES TO CONSOLIDATED FINANCIAL STATEMENTS
F-10
Note 1—Nature of Business and Principles of Consolidation
Transocean Inc. (together with its subsidiaries and predecessors, unless the context requires otherwise, “Transocean,”the “Company,” “we,” “us” or “our”) is a leading international provider of offshore contract drilling services for oil and gas wells. Our mobile offshore drilling fleet is considered one of the most modern and versatile fleets in the world. We specialize in technically demanding sectors of the offshore drilling business with a particular focus on deepwater and harsh environmentdrilling services. We contract our drilling rigs, related equipment and work crews primarily on a dayrate basis to drill oil and gaswells. We also provide additional services, including integrated services. At December 31, 2005, we owned, had partialownership interests in or operated 90 mobile offshore and barge drilling units. As of this date, our assets consisted of 32 High-Specification semisubmersibles and drillships (“floaters”), 23 Other Floaters, 25 Jackup Rigs and 10 Other Rigs (see Note 18).
On January 31, 2001, we completed a merger transaction (the “R&B Falcon merger”) with R&B Falcon Corporation(“R&B Falcon”). At the time of the merger, R&B Falcon operated a diverse global drilling rig fleet consisting of drillships, semisubmersibles, jackup rigs and other units including the Gulf of Mexico Shallow and Inland Water segment fleet. R&B Falcon and the Gulf of Mexico Shallow and Inland Water segment later became known as TODCO (together with its subsidiaries and predecessors, unless the context requires otherwise, “TODCO”) and the TODCO segment, respectively. In preparation for the initial public offering discussed below, we transferred all assets and subsidiaries out of R&B Falcon thatwere unrelated to the Gulf of Mexico Shallow and Inland Water business.
In February 2004, we completed an initial public offering (the “TODCO IPO”) of common stock of TODCO in whichwe sold 13.8 million shares of TODCO class A common stock, representing 23 percent of TODCO’s total outstanding shares.In September 2004 and December 2004, respectively, we completed additional public offerings of TODCO common stock(respectively referred to as the “September 2004 Offering” and “December 2004 Offering” and, together with the TODCO IPO, the “2004 Offerings”). We sold 17.9 million shares of TODCO’s class A common stock (30 percent of TODCO’s totaloutstanding shares) in the September 2004 Offering and 15.0 million shares of TODCO’s class A common stock (25 percent ofTODCO’s total outstanding shares) in the December 2004 Offering. Prior to the December 2004 Offering, we held TODCO class B common stock, which was entitled to five votes per share (compared to one vote per share of TODCO class A commonstock) and converted automatically into class A common stock upon any sale by us to a third party. In connection with theDecember 2004 Offering, we converted all of our remaining TODCO class B common stock not sold in the 2004 Offerings intoshares of class A common stock. After the 2004 Offerings, we held a 22 percent ownership and voting interest in TODCO,represented by 13.3 million shares of class A common stock.
We consolidated TODCO in our financial statements as a business segment through December 16, 2004 and thatportion of TODCO that we did not own was reported as minority interest in our consolidated statements of operations andbalance sheet. As a result of the conversion of the TODCO class B common stock into class A common stock, we no longer hada majority voting interest in TODCO and no longer consolidated TODCO in our financial statements but accounted for our remaining investment using the equity method of accounting.
In May 2005 and June 2005, respectively, we completed a public offering of TODCO common stock and a sale ofTODCO common stock pursuant to Rule 144 under the Securities Act of 1933, as amended (respectively referred to as the “May Offering” and the “June Sale,” collectively referred to as the “2005 Offering and Sale,” and, collectively with the 2004Offerings, the “TODCO Stock Sales”). We sold 12.0 million shares of TODCO’s class A common stock (20 percent ofTODCO’s total outstanding shares) in the May Offering and our remaining 1.3 million shares of TODCO’s class A common stock (two percent of TODCO’s total outstanding shares) in the June Sale. After the May Offering, we accounted for our remaining investment using the cost method of accounting. As a result of the June Sale, we no longer own any shares ofTODCO’s common stock. See Note 4.
For investments in joint ventures and other entities that do not meet the criteria of a variable interest entity or where we are not deemed to be the primary beneficiary for accounting purposes of those entities that meet the variable interest entitycriteria, we use the equity method of accounting where our ownership is between 20 percent and 50 percent or where ourownership is more than 50 percent and we do not have significant control over the unconsolidated affiliate. We use the costmethod of accounting for investments in unconsolidated affiliates where our ownership is less than 20 percent and where we do not have significant influence over the unconsolidated affiliate. We consolidate those investments that meet the criteria of a variable interest entity where we are deemed to be the primary beneficiary for accounting purposes and for entities in which wehave a majority voting interest. Intercompany transactions and accounts are eliminated.
TRANSOCEAN INC. AND SUBSIDIARIES NOTES TO CONSOLIDATED FINANCIAL STATEMENTS - Continued
F-11
Note 2—Summary of Significant Accounting Policies
Accounting Estimates—The preparation of financial statements in conformity with accounting principles generallyaccepted in the U.S. requires management to make estimates and assumptions that affect the reported amounts of assets,liabilities, revenues, expenses and disclosure of contingent assets and liabilities. On an ongoing basis, we evaluate our estimates, including those related to bad debts, materials and supplies obsolescence, investments, intangible assets and goodwill, property and equipment and other long-lived assets, income taxes, workers' insurance, pensions and other postretirement benefits, otheremployment benefits and contingent liabilities. We base our estimates on historical experience and on various other assumptionswe believe are reasonable under the circumstances, the results of which form the basis for making judgments about the carryingvalues of assets and liabilities that are not readily apparent from other sources. Actual results could differ from such estimates.
Cash and Cash Equivalents—Cash equivalents are stated at cost plus accrued interest, which approximates fair value. Cash equivalents are highly liquid debt instruments with an original maturity of three months or less and may consist of timedeposits with a number of commercial banks with high credit ratings, Eurodollar time deposits, certificates of deposit andcommercial paper. We may also invest excess funds in no-load, open-end, management investment trusts (“mutual funds”). The mutual funds invest exclusively in high quality money market instruments.
As a result of the Deepwater Nautilus project financing in 1999, we were required to maintain in cash an amount tocover certain principal and interest payments. Such restricted cash, classified as other current assets in the consolidated balancesheet, was $12.0 million at December 31, 2004. As a result of the repayment of the project financing (see Note 8), the restrictedcash balance was released in May 2005.
Accounts Receivable—Accounts receivable are stated at the historical carrying amount net of write-offs and allowancefor doubtful accounts receivable. Interest receivable on delinquent accounts receivable is included in the accounts receivabletrade balance and recognized as interest income when chargeable and collectibility is reasonably assured. Uncollectible accounts receivable are written off when a settlement is reached for an amount that is less than the outstanding historical balance.
Allowance for Doubtful Accounts—We establish reserves for doubtful accounts on a case-by-case basis when we believe the required payment of specific amounts owed is unlikely to occur. In establishing these reserves, we consider changesin the financial position of a major customer and restrictions placed on the conversion of local currency to U.S. dollars as well as disputes with our customers regarding the application of contract provisions to our drilling operations. This allowance was $15.3 million and $16.8 million at December 31, 2005 and 2004, respectively. We derive a majority of our revenue fromservices to international and government-owned or government-controlled oil companies, and, generally, do not requirecollateral or other security to support client receivables.
Materials and Supplies—Materials and supplies are carried at the lower of average cost or market less an allowance for obsolescence. Such allowance was $19.1 million and $20.3 million at December 31, 2005 and 2004, respectively.
Property and Equipment—Property and equipment, consisting primarily of offshore drilling rigs and relatedequipment, represented approximately 64 percent of our total assets at December 31, 2005. The carrying values of these assetsare based on estimates, assumptions and judgments relative to capitalized costs, useful lives and salvage values of our rigs.These estimates, assumptions and judgments reflect both historical experience and expectations regarding future industryconditions and operations. We compute depreciation using the straight-line method after allowing for salvage values. Expenditures for renewals, replacements and improvements are capitalized. Maintenance and repairs are charged to operatingexpense as incurred. Upon sale or other disposition, the applicable amounts of asset cost and accumulated depreciation are removed from the accounts and the net amount, less proceeds from disposal, is charged or credited to gain (loss) from disposalof assets, net.
Estimated original useful lives of our drilling units range from 18 to 35 years, reflecting maintenance history andmarket demand for these drilling units, buildings and improvements from 10 to 30 years and machinery and equipment fromfour to 12 years. From time to time, we may review the estimated remaining useful lives of our drilling units and may extend the useful life when events and circumstances indicate the drilling unit can operate beyond its original useful life. During the fourthquarter of 2004, we extended the useful lives to 35 years for four rigs, which had estimated useful lives ranging from 30 to 32years. We determined 35 years was appropriate for each of these rigs based on the then current contracts these rigs were
TRANSOCEAN INC. AND SUBSIDIARIES NOTES TO CONSOLIDATED FINANCIAL STATEMENTS - Continued
F-12
operating under as well as the additional life-extending work, upgrades and inspections we performed on these rigs. In 2005 and2004, the impact of the change in estimated useful life of these rigs was a reduction in depreciation expense of $16.1 million ($0.05 per diluted share) and $4.7 million ($0.01 per diluted share), respectively, which had no tax effect.
Assets Held for Sale—Assets are classified as held for sale when we have a plan for disposal and those assets meet theheld for sale criteria of the Financial Accounting Standards Board's (“FASB”) Statement of Financial Accounting Standards(“SFAS”) 144, Accounting for Impairment or Disposal of Long-Lived Assets. At December 31, 2005 and 2004, we had assets held for sale in the amounts of $15.9 million and $5.6 million, respectively, that were included in other current assets (see Notes 6 and 27).
Goodwill—In accordance with SFAS 142, Goodwill and Other Intangible Assets, goodwill is tested for impairment atleast annually at the reporting unit level, which is defined as an operating segment or a component of an operating segment that constitutes a business for which financial information is available and is regularly reviewed by management. Management has determined that our reporting units are the same as our operating segments for the purpose of allocating goodwill and thesubsequent testing of goodwill for impairment.
We perform our annual test of goodwill impairment as of October 1. As a result of these tests for impairment, we hadno impairment of goodwill for 2004 or 2003. Since the disposition of TODCO, we operate in one reportable segment (see Note1), which is also our reporting unit for the test of goodwill impairment. The goodwill impairment test performed at October 1,2004 was carried forward to October 1, 2005 since it met all necessary carry forward criteria within the scope of SFAS 142. As a result of these tests for impairment, we had no impairment of goodwill for the years ended December 31, 2005, 2004 and 2003.
Our goodwill balance and changes in the carrying amount of goodwill are as follows (in millions):
Balance at January 1,
2005 Other (a)
Balance at December 31,
2005
Transocean Drilling ........................................................... $2,251.9 $43.0 $2,208.9 ______________________(a) Primarily represents net adjustments during 2005 of income tax-related pre-acquisition contingencies. See Note
16.
Impairment of Long-Lived Assets—The carrying value of long-lived assets, principally property and equipment, isreviewed for potential impairment when events or changes in circumstances indicate that the carrying amount of such assetsmay not be recoverable. For property and equipment held for use, the determination of recoverability is made based upon the estimated undiscounted future net cash flows of the related asset or group of assets being evaluated. Property and equipment held for sale are recorded at the lower of net book value or fair value. See Note 7.
Operating Revenues and Expenses—Operating revenues are recognized as earned, based on contractual daily rates oron a fixed price basis. In connection with drilling contracts, we may receive revenues for preparation and mobilization of equipment and personnel or for capital improvements to rigs. In connection with new drilling contracts, revenues earned and incremental costs incurred directly related to preparation and mobilization are deferred and recognized over the primary contract term of the drilling project using the straight-line method. Our policy to amortize the fees related to preparation, mobilizationand capital upgrades on a straight-line basis over the estimated firm period of drilling is consistent with the general pace ofactivity, level of services being provided and dayrates being earned over the life of the contract. For contractual daily rate contracts, we account for loss contracts as the losses are incurred. Costs of relocating drilling units without contracts to more promising market areas are expensed as incurred. Upon completion of drilling contracts, any demobilization fees received are reported in income, as are any related expenses. Capital upgrade revenues received are deferred and recognized over the primarycontract term of the drilling project. The actual cost incurred for the capital upgrade is depreciated over the estimated useful lifeof the asset. We incur periodic survey and drydock costs in connection with obtaining regulatory certification to operate our rigson an ongoing basis. Costs associated with these certifications are deferred and amortized over the period until the next survey on a straight-line basis.
TRANSOCEAN INC. AND SUBSIDIARIES NOTES TO CONSOLIDATED FINANCIAL STATEMENTS - Continued
F-13
Capitalized Interest—Interest costs for the construction and upgrade of qualifying assets are capitalized. No interestcost was capitalized during the years ended December 31, 2005, 2004 and 2003.
Derivative Instruments and Hedging Activities—We account for our derivative instruments and hedging activities inaccordance with SFAS 133, Accounting for Derivative Instruments and Hedging Activities. See Notes 9 and 10.
Foreign Currency—The majority of our revenues and expenditures are denominated in U.S. dollars to limit ourexposure to foreign currency fluctuations, resulting in the use of the U.S. dollar as the functional currency for all of ouroperations. Foreign currency exchange gains and losses are primarily included in other income (expense) as incurred. Net foreign currency gains (losses) included in other income (expense) were $(4.5) million, $0.4 million and $(3.5) million for theyears ended December 31, 2005, 2004 and 2003, respectively.
Income Taxes—Income taxes have been provided based upon the tax laws and rates in effect in the countries in which operations are conducted and income is earned. There is no expected relationship between the provision for or benefit fromincome taxes and income or loss before income taxes because the countries in which we operate have taxation regimes that varynot only with respect to nominal rate, but also in terms of the availability of deductions, credits and other benefits. Variations also arise because income earned and taxed in any particular country or countries may fluctuate from year to year. Deferred taxassets and liabilities are recognized for the anticipated future tax effects of temporary differences between the financialstatement basis and the tax basis of our assets and liabilities using the applicable tax rates in effect at year end. A valuationallowance for deferred tax assets is recorded when it is more likely than not that some or all of the benefit from the deferred tax asset will not be realized. See Note 16.
Stock-Based Compensation—Effective January 1, 2003, we adopted the fair value recognition provisions of SFAS 123, Accounting for Stock-Based Compensation, using the prospective method proscribed in SFAS 148, Accounting for Stock-Based Compensation – Transition and Disclosure. Under the prospective method, employee stock-based compensation awards grantedon or subsequent to January 1, 2003 are expensed over the vesting period based on the fair value of the underlying awards onthe date of grant. The fair value of the stock options is determined using the Black-Scholes-Merton option pricing model, whilethe fair value of restricted stock grants is determined based on the market price of our stock on the date of grant. Additionally, stock appreciation rights are recorded at fair value with the changes in fair value recorded as compensation expense as incurred. Stock-based compensation awards granted prior to January 1, 2003, if not subsequently modified, were accounted for under the recognition and measurement provisions of Accounting Principles Board Opinion (“APB”) 25, Accounting for Stock Issued toEmployees and related interpretations (see “―New Accounting Pronouncements”). As a result of the adoption of SFAS 123,compensation expense increased $6.1 million ($4.3 million or $0.01 per diluted share, net of tax) related to our stock-based compensation awards and modifications, and our Employee Stock Purchase Plan (“ESPP”) during 2003.
TRANSOCEAN INC. AND SUBSIDIARIES NOTES TO CONSOLIDATED FINANCIAL STATEMENTS - Continued
F-14
If compensation expense for grants to employees under our long-term incentive plan prior to January 1, 2003 wasrecognized using the fair value method of accounting under SFAS 123 rather than the intrinsic value method under APB 25, net income and earnings per share would have been reduced to the pro forma amounts indicated below (in millions, except per share data):
Years ended December 31, 2005 2004 2003
Net Income as Reported ............................................................................... $715.6 $152.2 $ 19.2Add back: Stock-based compensation expense included in reported
net income, net of related tax effects................................................. 12.7 18.2 4.6 Deduct: Total stock-based compensation expense determined under the
fair value method for all awards, net of related tax effects Long-Term Incentive Plan ............................................................ (11.1) (22.4) (18.2) ESPP ............................................................................................. (3.6) (2.6) (2.5)
Pro Forma Net Income for basic earnings per share ................................ $713.6 $145.4 $ 3.1
Add back interest expense on the 1.5% convertible debentures ............... 6.3 – – Pro Forma Net Income for diluted earnings per share .............................. $719.9 $145.4 $ 3.1
Basic Earnings Per Share As Reported.............................................................................................. $2.19 $ 0.47 $ 0.06Pro Forma................................................................................................. 2.18 0.45 0.01
Diluted Earnings Per Share As Reported.............................................................................................. $2.13 $ 0.47 $ 0.06Pro Forma................................................................................................. 2.12 0.45 0.01
The above pro forma amounts are not indicative of future pro forma results. The fair value of each option grant ormodification under our long-term incentive plan was estimated on the date of grant or grant modification using the Black-Scholes-Merton option pricing model with the following weighted-average assumptions used:
Years ended December 31, 2005 2004 2003
Dividend yield ........................................................................................ – – – Expected price volatility range ............................................................... 26%-38% 38%-42% 39%-45% Risk-free interest rate range.................................................................... 2.86%-4.57% 2.59%-3.71% 1.94%-3.16% Expected life of options (in years).......................................................... 4.40 4.30 4.21 Weighted-average fair value of options granted or modified ................. $21.92 $10.65 $7.13
The fair value of each option grant under the ESPP was estimated using the following weighted-average assumptions:
Years ended December 31, 2005 2004 2003
Dividend yield ...................................................................................... – – – Expected price volatility ...................................................................... 28% 27% 41% Risk-free interest rate ........................................................................... 2.81% 1.19% 1.09% Expected life of options ....................................................................... Less than one
year Less than one
year Less than one
year Weighted-average fair value of options granted ................................... $7.10 $4.10 $4.69

TRANSOCEAN INC. AND SUBSIDIARIES NOTES TO CONSOLIDATED FINANCIAL STATEMENTS - Continued
F-15
New Accounting Pronouncements—In May 2005, the FASB issued SFAS 154, “Accounting Changes and Error Corrections,” which requires retrospective application to all prior period financial statements presented for voluntary changes inaccounting principle unless it is impracticable. This statement replaces APB 20, Accounting Changes, and SFAS 3, ReportingAccounting Changes in Interim Financial Statements, though it carries forward the guidance in those pronouncements withrespect to accounting for changes in estimates, changes in reporting entity and the correction of errors. SFAS 154 is effective for accounting changes and corrections of errors made in fiscal years beginning after December 15, 2005. We adopted SFAS 154 effective January 1, 2006. The adoption of this statement will have no impact on our consolidated financial position, results of operations or cash flows.
In December 2004, the FASB issued SFAS 123 (revised 2004) (“SFAS 123(R)”), Share-Based Payment, which is arevision of SFAS 123, Accounting for Stock-Based Compensation. SFAS 123(R) supersedes APB 25, Accounting for StockIssued to Employees, and amends SFAS 95, Statement of Cash Flows. While the approach in SFAS 123(R) is similar to the approach described in SFAS 123, SFAS 123(R) requires recognition in the income statement of all share-based payments toemployees, including grants of employee stock options, based on their fair values, and pro forma disclosure is no longer analternative. We adopted SFAS 123(R) effective January 1, 2006.
SFAS 123(R) permits adoption using one of two methods, a modified prospective method (“Prospective Method”) or a modified retrospective method (“Retrospective Method”). With the Prospective Method, costs are recognized beginning withthe effective date based on the requirements of SFAS 123(R) for (i) all share-based payments granted after the effective date of SFAS 123(R), and (ii) all awards granted to employees prior to the effective date of SFAS 123(R) that remain unvested on the effective date. The Retrospective Method applies the requirements of the Prospective Method but further permits entities torestate all prior periods presented based on the amounts previously recognized under SFAS 123 for purposes of pro forma disclosures. We elected to adopt SFAS 123(R) using the Prospective Method.
We previously adopted the fair-value-based method of accounting for share-based payments under SFAS 123 effectiveJanuary 1, 2003 using the modified prospective method as described in SFAS 148, Accounting for Stock-Based Compensation–Transition and Disclosure. We currently use the Black-Scholes-Merton formula to estimate the value of stock options granted to employees, which is an acceptable share-based award valuation model and we have chosen that model for determining fairvalue of stock awards granted under SFAS 123(R). Our APB 25 options vested in the third quarter of 2005. As a result, adoption of SFAS 123(R) had no effect on these options.
Since we adopted SFAS 123(R) using the Prospective Method, we do not expect the adoption to have an impact on ourconsolidated financial position, results of operations or cash flows. In addition to the compensation cost recognition requirements, SFAS 123(R) also requires the tax deduction benefits for an award in excess of recognized compensation cost to be reported as a financing cash flow rather than as an operating cash flow, which is currently required under SFAS 95. Whilewe cannot estimate what these amounts will be in the future (because they depend on, among other things, when employees exercise stock options), we reported operating cash flows related to tax deduction benefits of $22.1 million, $5.9 million and$0.3 million for the years ended December 31, 2005, 2004 and 2003, respectively.
Under SFAS 123, we recognize the compensation cost over the vesting period up to the date of actual retirement. Wewill continue this practice for awards granted prior to the adoption of SFAS 123(R). Upon the adoption of SFAS 123(R), wewill recognize compensation cost for awards granted or modified after January 1, 2006 through the date the employee is nolonger required to provide service to earn the award (“service period”). If we had amortized compensation cost over the service period, the amount would not have been material for all periods presented.
Reclassifications—Certain reclassifications have been made to prior period amounts to conform with the current year presentation.
TRANSOCEAN INC. AND SUBSIDIARIES NOTES TO CONSOLIDATED FINANCIAL STATEMENTS - Continued
F-16
Note 3—Accumulated Other Comprehensive Loss
The components of accumulated other comprehensive loss at December 31, 2005, 2004 and 2003, net of tax, are asfollows (in millions):
Gain onTerminated
Interest Rate
Swaps
Unrealized Loss
on Available-for-Sale
Securities
Other ComprehensiveLoss Related to Unconsolidated
Joint Venture
Minimum PensionLiability
Total Other
ComprehensiveIncome (Loss)
Balance at December 31, 2002 .............. $ 3.6 $(0.6) $(2.0) $(32.5) $(31.5) Other comprehensive income (loss)...... (0.2) 0.2 2.0 9.3 11.3 Balance at December 31, 2003 .............. 3.4 (0.4) − (23.2) (20.2) Other comprehensive income (loss)...... (0.2) 0.1 − (4.1) (4.2) Balance at December 31, 2004 .............. 3.2 (0.3) − (27.3) (24.4) Other comprehensive income (loss)...... (0.3) 0.3 − 4.0 4.0 Balance at December 31, 2005 .............. $ 2.9 $− $ − $(23.3) $(20.4)
Note 4—TODCO Stock Sales
In February 2004, we completed the TODCO IPO in which we sold 13.8 million shares of TODCO’s class A commonstock, representing 23 percent of TODCO’s total outstanding shares, at $12.00 per share. We received net proceeds of $155.7million from the TODCO IPO and recognized a gain of $39.4 million ($0.12 per diluted share), which had no tax effect, in thefirst quarter of 2004 and represented the excess of net proceeds received over the net book value of the shares sold in theTODCO IPO.
In conjunction with the closing of the TODCO IPO, TODCO granted restricted stock and stock options to some of its employees under its long-term incentive plan and some of these awards vested at the time of grant. In accordance with theprovisions of SFAS 123, TODCO recognized compensation expense of $5.6 million ($0.02 per Transocean’s diluted share), which had no tax effect, in the first quarter of 2004 as a result of the immediate vesting of these awards. In addition, certain ofTODCO’s employees held options that were granted prior to the TODCO IPO to acquire our ordinary shares. In accordancewith the employee matters agreement with TODCO, these options were modified at the TODCO IPO date, which resulted in the accelerated vesting of the options and the extension of the term of the options through the original contractual life. In connection with the modification of these options, TODCO recognized additional compensation expense of $1.5 million, which had no taxeffect, in the first quarter of 2004.
In September 2004, we completed the September 2004 Offering in which we sold 17.9 million shares of TODCO’sclass A common stock, representing 30 percent of TODCO’s total outstanding shares, at $15.75 per share. We received netproceeds of $269.9 million from the September 2004 Offering and recognized a gain of $129.4 million ($0.40 per diluted share),which had no tax effect, in the third quarter of 2004 and represented the excess of net proceeds received over the net book valueof the TODCO shares sold in the September 2004 Offering.
In December 2004, we completed the December 2004 Offering in which we sold 15.0 million shares of TODCO’sclass A common stock, representing 25 percent of TODCO’s total outstanding shares, at $18.00 per share. We received netproceeds of $258.0 million from the December 2004 Offering and recognized a gain of $140.0 million ($0.43 per diluted share), which had no tax effect, in the fourth quarter of 2004 and represented the excess of net proceeds received over the net book value of the TODCO shares sold in the December 2004 Offering.
We sold 12.0 million shares of TODCO’s class A common stock, representing 20 percent of TODCO’s total outstanding shares, at $20.50 per share in the May Offering. We sold our remaining 1.3 million shares of TODCO’s class Acommon stock, representing 2 percent of TODCO’s total outstanding shares, at $23.57 per share in the June Sale. We received net proceeds of $271.9 million from the 2005 Offering and Sale and recognized a gain in the second quarter of 2005 of $165.0 million ($0.49 per diluted share), which had no tax effect and represented the excess of net proceeds received over the net book value of the shares sold in the 2005 Offering and Sale.
TRANSOCEAN INC. AND SUBSIDIARIES NOTES TO CONSOLIDATED FINANCIAL STATEMENTS - Continued
F-17
Note 5—Capital Expenditures and Other Asset Acquisitions
Capital expenditures totaled $181.9 million during the year ended December 31, 2005 and related to corporate infrastructure and our existing fleet, including the replacement of equipment damaged during hurricanes Katrina and Rita on theDeepwater Nautilus and the Transocean Marianas and the purchase of the semisubmersible rig M.G. Hulme, Jr., which we had previously operated under a lease arrangement (see Note 17).
Capital expenditures totaled $127.0 million during the year ended December 31, 2004 and related to our existing fleet and corporate infrastructure. A substantial majority of the capital expenditures in 2004 related to the Transocean Drilling segment (see Note 22).
Capital expenditures totaled $493.8 million during the year ended December 31, 2003 and included our acquisition oftwo Fifth-Generation Deepwater Floaters, the Deepwater Pathfinder and Deepwater Frontier, through the payoff of synthetic lease financing arrangements totaling $382.8 million. The remaining $111.0 million related to capital expenditures for existingfleet and corporate infrastructure. A substantial majority of the capital expenditures in 2003 related to the Transocean Drillingsegment.
As a result of the R&B Falcon merger, we acquired ownership interests in two unconsolidated joint ventures, 50percent in Deepwater Drilling L.L.C. (“DD LLC”) and 60 percent in Deepwater Drilling II L.L.C. (“DDII LLC”). Subsidiariesof ConocoPhillips owned the remaining interests in these joint ventures. Each of the joint ventures was a lessee in a syntheticlease financing facility entered into in connection with the construction of the Deepwater Pathfinder, in the case of DD LLC,and the Deepwater Frontier, in the case of DDII LLC. Pursuant to the lease financings, the rigs were owned by special purpose entities and leased to the joint ventures.
In May 2003, WestLB AG, one of the lenders in the Deepwater Frontier synthetic lease financing facility, assigned its $46.1 million remaining promissory note receivable to us in exchange for cash of $46.1 million. Also in May 2003, butsubsequent to the WestLB AG assignment, we purchased ConocoPhillips’ 40 percent interest in DDII LLC for approximately$5.0 million. As a result of this purchase, we consolidated DDII LLC late in the second quarter of 2003. In addition, we acquired certain drilling and other contracts from ConocoPhillips for approximately $9.0 million in cash. In December 2003,DDII LLC prepaid the remaining $197.5 million debt and equity principal amounts owed, plus accrued and unpaid interest, tous and other lenders under the synthetic lease financing facility. As a result of this prepayment, DDII LLC became the legalowner of the Deepwater Frontier.
In November 2003, we purchased the remaining 25 percent minority interest in the Caspian Sea Ventures InternationalLimited (“CSVI”) joint venture. CSVI owns the jackup rig Trident 20 and is now a wholly owned subsidiary.
In December 2003, we purchased ConocoPhillips’ 50 percent interest in DD LLC in connection with the payoff of theDeepwater Pathfinder synthetic lease financing facility. As a result of this purchase, we consolidated DD LLC late in the fourthquarter of 2003. Concurrent with the purchase of this ownership interest, DD LLC prepaid the remaining $185.3 million debtand equity principal amounts owed, plus accrued and unpaid interest, to the lenders under the synthetic lease financing facility. As a result of this prepayment, DD LLC became the legal owner of the Deepwater Pathfinder.
Note 6—Asset Dispositions and Retirements
In January 2005, we completed the sale of the semisubmersible rig Sedco 600 for net proceeds of $24.9 million, ofwhich $2.5 million was received in 2004, and recognized a gain of $18.8 million ($0.06 per diluted share), which had no tax effect. At December 31, 2004, this asset was held for sale in the amount of $5.6 million and was included in other current assets in our consolidated balance sheet. See Note 2.
In June 2005, we sold the jackup rig Transocean Jupiter and a land rig for net proceeds of $23.5 million andrecognized a gain on these sales of $14.0 million ($9.1 million, or $0.03 per diluted share, net of tax).
In December 2005, we entered into an agreement to sell the drillship Peregrine III in connection with our efforts to dispose of non-strategic assets. We received a deposit totaling $7.8 million, which was reflected as unearned income and
TRANSOCEAN INC. AND SUBSIDIARIES NOTES TO CONSOLIDATED FINANCIAL STATEMENTS - Continued
F-18
included in other current liabilities in our consolidated balance sheet at December 31, 2005. At December 31, 2005, the rig wasclassified as an asset held for sale in the amount of $12.3 million, and was included in other current assets in our consolidatedbalance sheet. See Notes 2 and 27.
During the year ended December 31, 2005, we sold and disposed of certain other assets for net proceeds of approximately $18.4 million and we recorded net losses of $3.8 million ($4.1 million, or $0.01 per diluted share, net of tax).
In June 2004, we completed the sale of the Sedco 602 for net proceeds of $28.0 million and recognized a gain of $21.7 million ($0.07 per diluted share), which had no tax effect, in our Transocean Drilling segment.
During the year ended December 31, 2004, we settled insurance claims and sold and disposed of marine support vessels and certain other assets for net proceeds of $22.4 million. We recorded net losses of $8.3 million ($3.5 million, or $0.01per diluted share, net of tax) in our Transocean Drilling segment and net gains of $5.8 million ($0.02 per diluted share), which had no tax effect, in our TODCO segment.
In January 2003, we completed the sale of the jackup rig RBF 160 for net proceeds of $13.1 million and recognized a gain of $0.3 million ($0.2 million, net of tax) in our Transocean Drilling segment. The proceeds were received in December2002.
During the year ended December 31, 2003, we settled an insurance claim and sold and disposed of certain other assetsfor net proceeds of approximately $8.4 million and recorded net losses of $6.0 million ($4.5 million, or $0.01 per diluted share, net of tax) in our Transocean Drilling segment and $7.7 million ($8.0 million, or $0.02 per diluted share, net of tax) in our TODCO segment.
Note 7—Impairment Loss on Long-Lived Assets
During the year ended December 31, 2003, we recorded non-cash impairment charges of $5.2 million ($0.02 perdiluted share), which had no tax effect, in our Transocean Drilling segment associated with the removal of two rigs from drillingservice and the value assigned to leases on oil and gas properties that we intended to discontinue. The determination of fairmarket value was based on an offer from a potential buyer, in the case of the two rigs, and management’s assessment of fairvalue, in the case of the leases on oil and gas properties for which third party valuations were not available.
During the year ended December 31, 2003, we recorded non-cash impairment charges of $11.3 million ($7.4 million,or $0.02 per diluted share, net of tax) in our TODCO segment associated with the removal of five jackup rigs from drillingservice and the write down in the value of an investment in a joint venture to fair value. The determination of fair market value was based on third party valuations, in the case of the jackup rigs, and management’s assessment of fair value, in the case of theinvestment in a joint venture for which third party valuations were not available.
TRANSOCEAN INC. AND SUBSIDIARIES NOTES TO CONSOLIDATED FINANCIAL STATEMENTS - Continued
F-19
Note 8—Debt
Debt, net of unamortized discounts, premiums and fair value adjustments, is comprised of the following (in millions):
December 31, 2005 2004
7.31% Nautilus Class A1 Amortizing Notes – final maturity May 2005 .............................. $ – $ 19.4 6.95% Senior Notes, due April 2008..................................................................................... – 263.1 6.625% Notes, due April 2011 .............................................................................................. 183.0 785.7 7.375% Senior Notes, due April 2018................................................................................... 246.9 246.9 Zero Coupon Convertible Debentures, due May 2020 (put options exercisable
May 2008 and May 2013).................................................................................................. 17.5 17.0 1.5% Convertible Debentures, due May 2021 (put options exercisable May 2006,
May 2011 and May 2016) (a) ............................................................................................ 400.0 400.0 8% Debentures, due April 2027 ............................................................................................ 56.8 56.8 7.45% Notes, due April 2027 (put options exercisable April 2007)...................................... 95.3 95.0 7.5% Notes, due April 2031 .................................................................................................. 597.6 597.6 Total Debt.............................................................................................................................. 1,597.1 2,481.5 Less Debt Due Within One Year (a)...................................................................................... 400.0 19.4
Total Long-Term Debt ....................................................................................................... $1,197.1 $2,462.1______________________(a) The 1.5% Convertible Debentures are classified as debt due within one year since the holders can exercise their right to
require us to repurchase the debentures in May 2006.
The scheduled maturity of our debt assumes the bondholders exercise their rights to require us to repurchase the 1.5%Convertible Debentures, 7.45% Notes and Zero Coupon Convertible Debentures in May 2006, April 2007 and May 2008, respectively. The scheduled maturities are at face value except for the Zero Coupon Convertible Debentures, which are includedat the price we would be required to pay should the bondholders exercise their right to require us to repurchase the debentures in May 2008. The scheduled maturities are as follows (in millions):
Years ending December 31,
2006 .............................................................. $ 400.02007 .............................................................. 100.0 2008 .............................................................. 19.0 2009 .............................................................. –2010 .............................................................. –Thereafter...................................................... 1,069.4
Total .......................................................... $1,588.4
Revolving Credit Agreement— In July 2005, we entered into a $500.0 million, five-year revolving credit agreement (the “Revolving Credit Agreement”). The Revolving Credit Agreement bears interest, at our option, at a base rate or at theLondon Interbank Offered Rate (“LIBOR”) plus a margin that can vary from 0.19 percent to 0.58 percent depending on our non-credit enhanced senior unsecured public debt rating. A facility fee, varying from 0.06 percent to 0.17 percent depending on our non-credit enhanced senior unsecured public debt rating, is incurred on the daily amount of the underlying commitment, whether used or unused, throughout the term of the facility. A utilization fee, varying from 0.05 percent to 0.10 percentdepending on our non-credit enhanced senior unsecured public debt rating, is payable if amounts outstanding under theRevolving Credit Agreement are greater than or equal to 50 percent of the total underlying commitment. At December 31, 2005, the applicable margin, facility fee and utilization fee were 0.225 percent, 0.075 percent and 0.100 percent, respectively. The Revolving Credit Agreement requires compliance with various covenants and provisions customary for agreements of this
TRANSOCEAN INC. AND SUBSIDIARIES NOTES TO CONSOLIDATED FINANCIAL STATEMENTS - Continued
F-20
nature, including a debt to total tangible capitalization ratio, as defined by the Revolving Credit Agreement, of not greater than 60 percent. At December 31, 2005, no amount was outstanding under the Revolving Credit Agreement.
In conjunction with entering into the Revolving Credit Agreement, we terminated our existing $800.0 million, five-year revolving credit agreement and recognized a loss on the termination of this agreement of $0.8 million, which had no taxeffect, in the third quarter of 2005.
6.5%, 6.75%, 6.95%, 7.375%, 9.125% and 9.5% Senior Notes and Exchange Offer—In March 2002, we completedexchange offers and consent solicitations for TODCO’s 6.5%, 6.75%, 6.95%, 7.375%, 9.125% and 9.5% Senior Notes (“theExchange Offer”). As a result of the Exchange Offer, approximately $234.5 million, $342.3 million, $247.8 million, $246.5million, $76.9 million and $289.8 million principal amount of TODCO’s outstanding 6.5%, 6.75%, 6.95%, 7.375%, 9.125% and 9.5% Senior Notes, respectively, were exchanged for our newly issued 6.5%, 6.75%, 6.95%, 7.375%, 9.125% and 9.5% SeniorNotes having the same principal amount, interest rate, redemption terms and payment and maturity dates. Because the holders of a majority in principal amount of each of these series of notes consented to the proposed amendments to the applicableindenture pursuant to which the notes were issued, some covenants, restrictions and events of default were eliminated from the indentures with respect to these series of notes. After the Exchange Offer, approximately $5.0 million, $7.7 million, $2.2 million, $3.5 million, $10.2 million and $10.2 million principal amount of the outstanding 6.5%, 6.75%, 6.95%, 7.375%, 9.125% and 9.5% Senior Notes, respectively, not exchanged remain the obligation of TODCO. At December 31, 2005, $246.5million principal amount of 7.375% Senior Notes were outstanding. TODCO’s remaining Senior Notes were deconsolidatedfrom our consolidated balance sheets at December 31, 2004 (see Note 4). The 7.375% Senior Notes are redeemable at our option at a make-whole premium. See “―Retired, Redeemed and Repurchased Debt.”
6.625% Notes and 7.5% Notes—In April 2001, we issued $700.0 million aggregate principal amount of 6.625% Notesdue April 2011 and $600.0 million aggregate principal amount of 7.5% Notes due April 2031. At December 31, 2005, $165.6million principal amount of the 6.625% Notes was outstanding (see “—Retired, Redeemed and Repurchased Debt”). AtDecember 31, 2005, $600.0 million principal amount of the 7.5% Notes was outstanding with a discounted value of $597.6 million.
1.5% Convertible Debentures—In May 2001, we issued $400.0 million aggregate principal amount of 1.5%Convertible Debentures due May 2021. We have the right to redeem the debentures after five years for a price equal to 100 percent of the principal. Each holder has the right to require us to repurchase the debentures after five, 10 and 15 years at 100percent of the principal amount. We may pay this repurchase price with either cash or ordinary shares or a combination of cashand ordinary shares. The debentures are convertible into our ordinary shares at the option of the holder at any time at a ratio of 13.8627 shares per $1,000 principal amount debenture, which is equivalent to an initial conversion price of $72.136 per share.This ratio is subject to adjustments if certain events take place, and conversion may only occur if the closing sale price per ordinary share exceeds 110 percent of the conversion price for at least 20 trading days in a period of 30 consecutive trading daysending on the trading day immediately prior to the conversion date or if other specified conditions are met. At December 31, 2005, $400.0 million principal amount of these notes was outstanding.
Zero Coupon Convertible Debentures—In May 2000, we issued Zero Coupon Convertible Debentures due May 2020with a face value at maturity of $865.0 million. The debentures were issued to the public at a price of $579.12 per debenture andaccrue original issue discount at a rate of 2.75 percent per annum compounded semiannually to reach a face value at maturity of$1,000 per debenture. We will pay no interest on the debentures prior to maturity and, since May 2003, we have the right toredeem the debentures for a price equal to the issuance price plus accrued original issue discount to the date of redemption.Each holder has the right to require us to repurchase the debentures on the third, eighth and thirteenth anniversary of issuance at the issuance price plus accrued original issue discount to the date of repurchase (see “—Retired, Redeemed and Repurchased Debt”). We may pay this repurchase price with either cash or ordinary shares or a combination of cash and ordinary shares. The debentures are convertible into our ordinary shares at the option of the holder at any time at a ratio of 8.1566 shares perdebenture, which is equivalent to an initial conversion price of $71.00 per share, subject to adjustments if certain events take place. At December 31, 2005, $26.4 million face value of these notes was outstanding with a discounted value of $17.5 million. Should all of the debentures be put to us in May 2008, the debentures will have a discounted value of $19.0 million.
7.45% Notes and 8% Debentures—In April 1997, we issued $100.0 million aggregate principal amount of 7.45%Notes due April 2027 and $200.0 million aggregate principal amount of 8% Debentures due April 2027. Holders of the 7.45% Notes may elect to have all or any portion of the 7.45% Notes repaid in April 2007 at 100 percent of the principal amount. The
TRANSOCEAN INC. AND SUBSIDIARIES NOTES TO CONSOLIDATED FINANCIAL STATEMENTS - Continued
F-21
7.45% Notes, at any time after April 2007, and the 8% Debentures, at any time, are redeemable at our option at a make-wholepremium. At December 31, 2005, $100.0 million and $57.3 million principal amount of these notes was outstanding, respectively (see “—Retired, Redeemed and Repurchased Debt”).
Retired, Redeemed and Repurchased Debt—In July 2005, we acquired, pursuant to a tender offer, a total of $534.4million, or approximately 76.3 percent, of the aggregate principal amount of our 6.625% Notes due April 2011 at 110.578percent of face value, or $590.9 million, plus accrued and unpaid interest. In the third quarter of 2005, we recognized a gain onthe redemption of debt of $0.2 million, which had no tax effect and reflected adjustments for the unamortized fair valueadjustment on a previously terminated interest rate swap. We funded the repurchase with existing cash balances.
In May 2005, we repaid the remaining principal amount outstanding of the 7.31% Nautilus Class A1 amortizing note,plus accrued and unpaid interest, in accordance with its scheduled maturity. We funded the repayment from existing cash balances.
In March 2005, we redeemed our $247.8 million aggregate principal amount outstanding 6.95% Senior Notes dueApril 2008 at the make-whole premium price provided in the indenture. We redeemed these notes at 108.259 percent of facevalue, or $268.2 million, plus accrued and unpaid interest. In the first quarter of 2005, we recognized a loss on the redemption of debt of $6.7 million ($0.02 per diluted share), which had no tax effect and reflected adjustments for fair value of the debt atthe date of the R&B Falcon merger and the unamortized fair value adjustment on a previously terminated interest rate swap. We funded the redemption with existing cash balances.
In December 2004, we acquired, pursuant to a tender offer, a total of $142.7 million, or approximately 71.3 percent,aggregate principal amount of our 8% Debentures due April 2027 at 130.449 percent of face value, or $186.1 million, plus accrued and unpaid interest. We recognized a loss on the repurchase of $45.1 million ($0.14 per diluted share), which had no tax effect, in the fourth quarter of 2004. We funded the repurchases with existing cash balances.
In October 2004, we redeemed our $342.3 million aggregate principal amount outstanding 6.75% Senior Notes dueApril 2005 at the make-whole premium price provided in the indenture. We redeemed these notes at 102.127 percent of facevalue or $349.5 million, plus accrued and unpaid interest. In the fourth quarter of 2004, we recognized a loss on the redemption of $3.3 million ($0.01 per diluted share), which had no tax effect and reflected adjustments for fair value of the debt at the dateof the R&B Falcon merger and the unamortized fair value adjustment on a previously terminated interest rate swap. We funded the redemption with existing cash on hand, which included proceeds from the September 2004 Offering.
In March 2004, we redeemed our $289.8 million aggregate principal amount outstanding 9.5% Senior Notes due December 2008 at the make-whole premium price provided in the indenture. We redeemed these notes at 127.796 percent of face value or $370.3 million, plus accrued and unpaid interest. In the first quarter of 2004, we recognized a loss on the redemption of debt of $28.1 million ($0.09 per share), which had no tax effect and reflected adjustments for fair value of thedebt at the date of the R&B Falcon merger and the unamortized fair value adjustment on a previously terminated interest rate swap. We funded the redemption with existing cash balances, which included proceeds from the TODCO IPO.
In May 2003, we repurchased and retired the entire $50.0 million principal amount outstanding 9.41% Nautilus ClassA2 Notes due May 2005 and funded the repurchase from existing cash balances. We recognized a loss on retirement of debt of$5.5 million ($3.6 million, or $0.01 per diluted share, net of tax), in the second quarter of 2003.
In May 2003, holders of our Zero Coupon Convertible Debentures due May 24, 2020 had the option to require us to repurchase their debentures. Holders of $838.6 million aggregate principal amount, or approximately 97 percent, of these debentures exercised this option, and we repurchased their debentures at a repurchase price of $628.57 per $1,000 principalamount. Under the terms of the debentures, we had the option to pay for the debentures with cash, our ordinary shares or acombination of cash and shares, and we elected to pay the $527.2 million repurchase price from existing cash balances. Werecognized additional expense of $10.2 million ($0.03 per diluted share), which had no tax effect, as a loss on retirement of debt in the second quarter of 2003 to fully amortize the remaining debt issue costs related to the repurchased debentures.
TRANSOCEAN INC. AND SUBSIDIARIES NOTES TO CONSOLIDATED FINANCIAL STATEMENTS - Continued
F-22
Note 9—Financial Instruments and Risk Concentration
Foreign Exchange Risk—Our international operations expose us to foreign exchange risk. This risk is primarilyassociated with compensation costs denominated in currencies other than the U.S. dollar, which is our functional currency, and with purchases from foreign suppliers. We use a variety of techniques to minimize the exposure to foreign exchange risk, including customer contract payment terms and the possible use of foreign exchange derivative instruments.
Our primary foreign exchange risk management strategy involves structuring customer contracts to provide forpayment in both U.S. dollars and local currency. The payment portion denominated in local currency is based on anticipatedlocal currency requirements over the contract term. Due to various factors, including customer acceptance, local banking laws,other statutory requirements, local currency convertibility and the impact of inflation on local costs, actual foreign exchangeneeds may vary from those anticipated in the customer contracts, resulting in partial exposure to foreign exchange risk.Fluctuations in foreign currencies typically have not had a material impact on overall results. In situations where payments oflocal currency do not equal local currency requirements, foreign exchange derivative instruments, specifically foreign exchangeforward contracts, or spot purchases, may be used to mitigate foreign currency risk. A foreign exchange forward contract obligates us to exchange predetermined amounts of specified foreign currencies at specified exchange rates on specified dates or to make an equivalent U.S. dollar payment equal to the value of such exchange.
We do not enter into derivative transactions for speculative purposes. Gains and losses on foreign exchange derivativeinstruments, which qualify as accounting hedges, are deferred as other comprehensive income and recognized when theunderlying foreign exchange exposure is realized. Gains and losses on foreign exchange derivative instruments, which do notqualify as hedges for accounting purposes, are recognized currently based on the change in market value of the derivative instruments. At December 31, 2005 and 2004, we had no open foreign exchange derivative instruments.
Interest Rate Risk—Our use of debt directly exposes us to interest rate risk. Floating rate debt, where the interest rate can be changed every year or less over the life of the instrument, exposes us to short-term changes in market interest rates.Fixed rate debt, where the interest rate is fixed over the life of the instrument and the instrument's maturity is greater than one year, exposes us to changes in market interest rates should we refinance maturing debt with new debt.
In addition, we are exposed to interest rate risk in our cash investments, as the interest rates on these investmentschange with market interest rates.
From time to time, we may use interest rate swap agreements to manage the effect of interest rate changes on future income. These derivatives are used as hedges and are not used for speculative or trading purposes. Interest rate swaps are designated as a hedge of underlying future interest payments. These agreements involve the exchange of amounts based onvariable interest rates and amounts based on a fixed interest rate over the life of the agreement without an exchange of the notional amount upon which the payments are based. The interest rate differential to be received or paid on the swaps isrecognized over the lives of the swaps as an adjustment to interest expense. Gains and losses on terminations of interest rate swap agreements are deferred and recognized as an adjustment to interest expense over the remaining life of the underlyingdebt. In the event of the early retirement of a designated debt obligation, any realized or unrealized gain or loss from the swap would be recognized in income.
The major risks in using interest rate derivatives include changes in interest rates affecting the value of such instruments, potential increases in our interest expense due to market increases in floating interest rates in the case of derivatives that exchange fixed interest rates for floating interest rates and the credit worthiness of the counterparties in such transactions.
We had no interest rate swap transactions outstanding as of December 31, 2005 and 2004. See Note 10.
The market values of any open swap transactions would be carried on our consolidated balance sheet as an asset orliability depending on the movement of interest rates after the transaction is entered into and depending on the security beinghedged.
Should a counterparty default at a time in which the market value of the swap with that counterparty is classified as anasset in our consolidated balance sheet, we may be unable to collect on that asset. To mitigate such risk of failure, we enter into swap transactions with a diverse group of high-quality institutions.
TRANSOCEAN INC. AND SUBSIDIARIES NOTES TO CONSOLIDATED FINANCIAL STATEMENTS - Continued
F-23
Credit Risk—Financial instruments that potentially subject us to concentrations of credit risk are primarily cash andcash equivalents and trade receivables. It is our practice to place our cash and cash equivalents in time deposits at commercial banks with high credit ratings or mutual funds, which invest exclusively in high quality money market instruments. In foreignlocations, local financial institutions are generally utilized for local currency needs. We limit the amount of exposure to any one institution and do not believe we are exposed to any significant credit risk.
We derive the majority of our revenue from services to international oil companies and government-owned andgovernment-controlled oil companies. Receivables are dispersed in various countries. See Note 22. We maintain an allowancefor doubtful accounts receivable based upon expected collectibility and establish reserves for doubtful accounts on a case-by-case basis when we believe the required payment of specific amounts owed to us is unlikely to occur. We are not aware of any significant credit risks relating to our customer base and do not generally require collateral or other security to support customer receivables.
Labor Agreements—We require highly skilled personnel to operate our drilling units. As a result, we conduct extensivepersonnel recruiting, training and safety programs. At December 31, 2005, we had approximately 9,500 employees and we alsoutilized approximately 2,100 persons through contract labor providers. As of such date, approximately 14 percent of our employees and contract labor worldwide worked under collective bargaining agreements, most of whom worked in Norway, U.K. and Nigeria. Of these represented individuals, virtually all are working under agreements that are subject to salary negotiation in 2006.
Note 10—Interest Rate Swaps
In June 2001, we entered into interest rate swap agreements in the aggregate notional amount of $700.0 million with agroup of banks relating to our $700.0 million aggregate principal amount of 6.625% Notes due April 2011. In February 2002, we entered into interest rate swap agreements with a group of banks in the aggregate notional amount of $900.0 million relatingto our $350.0 million aggregate principal amount of 6.75% Senior Notes due April 2005, $250.0 million aggregate principal amount of 6.95% Senior Notes due April 2008 and $300.0 million aggregate principal amount of 9.5% Senior Notes due December 2008. The objective of each transaction was to protect the debt against changes in fair value due to changes in thebenchmark interest rate. Under each interest rate swap, we received the fixed rate equal to the coupon of the hedged item and paid LIBOR plus a specified margin, which was designated as the respective benchmark interest rates, on each of the interest payment dates until maturity of the respective notes. The hedges were considered perfectly effective against changes in the fair value of the debt due to changes in the benchmark interest rates over their term. As a result, the shortcut method applied and there was no requirement to periodically reassess the effectiveness of the hedges during the term of the swaps.
In January 2003, we terminated all our outstanding interest rate swaps, which were designated as fair value hedges, andrecorded $173.5 million as a fair value adjustment to the underlying long-term debt in our consolidated balance sheet. We amortize this amount as a reduction to interest expense over the remaining life of the underlying debt. During the years endedDecember 31, 2005, 2004 and 2003, such reduction amounted to $9.1 million ($0.03. per diluted share), $22.7 million ($0.07 per diluted share) and $23.1 million ($0.07 per diluted share), respectively. As a result of the redemption of our 6.95% SeniorNotes in March 2005, 6.75% Senior Notes in October 2004 and 9.5% Senior Notes in March 2004, we recognized $13.2 million($0.08 per diluted share) and $25.5 million ($0.08 per diluted share) during the years ended December 31, 2005 and 2004, respectively, of the unamortized fair value adjustment as a reduction to our loss on redemption of debt (see Note 8). As a result of the repurchase of our 6.625% Notes in July 2005, we recognized $62.0 million of the unamortized fair value adjustment as areduction to our loss on repurchase of debt, which resulted in a gain on this repurchase (see Note 8). There were no tax effects related to these reductions. The remaining balance to be amortized at December 31, 2005 of $17.9 million relates to the 6.625%Notes due April 2011.
At December 31, 2005 and 2004, we had no outstanding interest rate swaps.
TRANSOCEAN INC. AND SUBSIDIARIES NOTES TO CONSOLIDATED FINANCIAL STATEMENTS - Continued
F-24
Note 11—Fair Value of Financial Instruments
The following methods and assumptions were used to estimate the fair value of each class of financial instruments forwhich it is practicable to estimate that value:
Cash and cash equivalents and trade receivables—The carrying amounts approximate fair value because of the shortmaturity of those instruments.
Debt—The fair value of our fixed rate debt is calculated based on market prices. The carrying value of variable ratedebt approximates fair value.
December 31, 2005 December 31, 2004 CarryingAmount Fair Value
CarryingAmount Fair Value
(in millions) (in millions) Cash and cash equivalents .................................................. $ 445.4 $ 445.4 $ 451.3 $ 451.3 Trade receivables................................................................ 582.5 582.5 426.5 426.5 Debt .................................................................................... 1,597.1 1,865.3 2,481.5 2,702.5
Note 12—Other Current Liabilities
Other current liabilities are comprised of the following (in millions):
December 31, 2005 2004
Accrued payroll and employee benefits ................................. $120.5 $ 98.1Deferred revenue.................................................................... 42.9 50.7 Unearned income ................................................................... 30.5 2.5 Accrued interest ..................................................................... 19.0 30.2 Accrued taxes, other than income .......................................... 17.4 14.4 Reserves for contingent liabilities .......................................... 1.6 1.2 Other....................................................................................... 10.2 15.9
Total Other Current Liabilities........................................... $242.1 $213.0
Note 13—Other Long-Term Liabilities
Other long-term liabilities are comprised of the following (in millions):
December 31, 2005 2004
Reserves for contingent liabilities .......................................... $116.4 $194.9Accrued pension and early retirement.................................... 64.9 54.0 Accrued retiree life insurance and medical benefits............... 36.3 35.4 Deferred revenue.................................................................... 16.1 19.1 Other....................................................................................... 52.5 41.8
Total Other Long-Term Liabilities..................................... $286.2 $345.2
TRANSOCEAN INC. AND SUBSIDIARIES NOTES TO CONSOLIDATED FINANCIAL STATEMENTS - Continued
F-25
Note 14—Repurchase of Ordinary Shares
In October 2005, our board of directors authorized the repurchase of up to $2 billion of our ordinary shares. Therepurchase program does not have an established expiration date and may be suspended or discontinued at any time. Under the program, repurchased shares are constructively retired and returned to unissued status. In December 2005, we repurchased froman investment bank and retired $400 million of our ordinary shares, which amounted to approximately 6.0 million ordinaryshares at $66.50 per share. Total consideration paid to repurchase the shares of approximately $400 million was recorded inshareholders’ equity as a reduction in ordinary shares and additional paid-in capital. Such consideration was funded withexisting cash balances.
Note 15—Supplementary Cash Flow Information
Non-cash investing activities for the years ended December 31, 2005, 2004 and 2003 included $30.5 million, $9.7 million and $8.9 million, respectively, related to accruals of capital expenditures. The accruals have been reflected in the consolidated balance sheet as an increase in property and equipment, net and accounts payable.
Cash payments for interest were $128.5 million, $201.2 million and $219.0 million for the years ended December 31, 2005, 2004 and 2003, respectively. Cash payments for income taxes, net, were $107.2 million, $75.1 million and $73.4 million for the years ended December 31, 2005, 2004 and 2003, respectively.
Note 16—Income Taxes
We are a Cayman Islands company registered in Barbados, and we are not subject to income tax in the CaymanIslands. We operate through our various subsidiaries in a number of countries throughout the world. Income taxes have beenprovided based upon the tax laws and rates in the countries in which operations are conducted and income is earned. There is noexpected relationship between the provision for or benefit from income taxes and income or loss before income taxes becausethe countries in which we operate have taxation regimes that vary not only with respect to the nominal tax rate, but also in terms of the availability of deductions, credits and other benefits. Variations also arise when income earned and taxed in a particularcountry or countries fluctuates from year to year.
The components of the provision (benefit) for income taxes are as follows (in millions):
Years ended December 31, 2005 2004 2003
Current provision .............................................................................. $ 59.7 $ 73.2 $ 101.5 Deferred provision (benefit) .............................................................. 27.1 18.1 (98.5) Income tax provision before cumulative effect of a change in
accounting principle ....................................................................... $86.8 $91.3 $ 3.0
TRANSOCEAN INC. AND SUBSIDIARIES NOTES TO CONSOLIDATED FINANCIAL STATEMENTS - Continued
F-26
Significant components of deferred tax assets and liabilities are as follows (in millions):
Deferred tax assets and liabilities are recognized for the anticipated future tax effects of temporary differences between the financial statement basis and the tax basis of our assets and liabilities at the applicable tax rates in effect. We have not provided for deferred taxes in circumstances where we do not expect the operations in a jurisdiction to give rise to future taxconsequences, due to the structure of operations and applicable law. Should our expectations change regarding the expectedfuture tax consequences, we may be required to record additional deferred taxes that could have a material adverse effect on our consolidated financial position, results of operations or cash flows.
We have not provided for deferred taxes on the unremitted earnings of certain subsidiaries that we consider to bepermanently reinvested. Should we make a distribution of the unremitted earnings of these subsidiaries, we may be required torecord additional taxes. Because we cannot predict when, if at all, we will make a distribution of these unremitted earnings, we are unable to make a determination of the amount of unrecognized deferred tax liability.
A valuation allowance for deferred tax assets is recorded when it is more likely than not that some or all of the benefitfrom the deferred tax asset will not be realized. We provide a valuation allowance to offset deferred tax assets for net operating losses incurred during the year in certain jurisdictions and for other deferred tax assets where, in the opinion of management, it is more likely than not that the financial statement benefit of these losses will not be realized. We provide a valuation allowancefor foreign tax credit carryforwards to reflect the possible expiration of these benefits prior to their utilization. During the year ended December 31, 2005, the valuation allowance for non-current deferred tax assets decreased $66.8 million, which resulted primarily from the utilization of the underlying deferred tax assets to offset current year income and in the settlement of audits,in addition to adjustments related to the restructuring of certain of our non-U.S. operations. In the year ended December 31, 2004, the valuation allowance decreased $66.5 million.
Our U.S. net operating loss carryforwards expire between 2020 and 2025. The tax effect of the U.S. net operating losscarryforwards, net of valuation allowances of $0.6 million, was $24.2 million at December 31, 2005. Our U.K. net operating
December 31, 2005 2004
Deferred Tax Assets Tax credit carryforwards........................................................ $ 100.5 $ 166.7 Net operating loss carryforwards .......................................... 85.1 121.0 Retirement and benefit plan accruals..................................... 19.0 3.8 Unearned income .................................................................. 13.4 5.0 Other accruals ........................................................................ 12.3 15.0 Accrued workers' compensation insurance ........................... 5.0 0.5 Incentive compensation ......................................................... 4.0 7.1 Accrued personnel taxes ....................................................... 2.4 0.6 Deferred revenue and other.................................................... 1.8 2.2 Insurance accruals ................................................................. 1.0 9.1 Valuation allowance .............................................................. (48.5) (115.3)
Total Deferred Tax Assets 196.0 215.7
Deferred Tax Liabilities Depreciation and amortization............................................... (222.1) (255.8) Other liabilities ...................................................................... (5.4) (3.7) Deferred drydock costs .......................................................... (5.2) (3.3) Asset held for sale.................................................................. (4.6) – Investment in subsidiaries...................................................... (0.3) (14.2)
Total Deferred Tax Liabilities........................................ (237.6) (277.0)
Net Deferred Tax Liabilities ........................................................... $ (41.6) $ (61.3)
TRANSOCEAN INC. AND SUBSIDIARIES NOTES TO CONSOLIDATED FINANCIAL STATEMENTS - Continued
F-27
loss carryforwards do not expire. The tax effect of the U.K. net operating loss carryforwards was $60.3 million at December 31,2005. In 2005, we released the valuation allowance of $16.8 million on our U.K. net operating loss carryforwards to record the expected realization of those losses through future earnings based on improved market conditions and taking into account taxplanning strategies. Our U.S. foreign tax credit carryforwards of $50.2 million, net of valuation allowances of $46.9 million,will expire between 2009 and 2015. Our U.S. alternative minimum tax credits of $3.4 million do not expire.
In addition to our recognized tax attributes, we have an unrecognized U.S. capital loss carryforward and anunrecognized U.S. net operating loss carryforward. We have not recognized a deferred tax asset for the capital loss carryforward as it is not probable that we will realize the benefit of this tax attribute. Our operations do not normally generate capital gainincome, which is the only type of income that may be offset by capital losses. In the years ended December 31, 2005 and 2004,we recognized benefits of $70.7 million and $72.9 million, respectively, to record the utilization of the capital losscarryforwards to offset capital gain income resulting from certain restructuring transactions. Certain payments from TODCO under the tax sharing agreement also serve to reduce the capital loss carryforward. Should an opportunity to utilize the remaining capital loss arise, the total potential tax benefit at December 31, 2005 was $837.5 million. We have not recognized adeferred tax asset for certain of our U.S. net operating loss carryforwards as it is not probable that we will realize the benefit ofthe underlying tax deduction. Should an opportunity to utilize the unrecognized net operating loss arise, the total potential tax benefit at December 31, 2005 was $17.5 million.
We are subject to changes in tax laws, treaties and regulations in and between the countries in which we operate. A material change in these tax laws, treaties or regulations could result in a higher or lower effective tax rate on our worldwide earnings.
On October 22, 2004, the American Jobs Creation Act of 2004 (the “Act”) was signed into law. The applicableprovisions of the Act did not have a material effect on our tax provision in 2005.
Transocean Inc., a Cayman Islands company, is not subject to income taxes in the Cayman Islands. For the three yearsended December 31, 2005, there was no Cayman Islands income or profits tax, withholding tax, capital gains tax, capital transfer tax, estate duty or inheritance tax payable by a Cayman Islands company or its shareholders. We have obtained assurance from the Cayman Islands government under the Tax Concessions Law (1995 Revision) that in the event that anylegislation is enacted in the Cayman Islands imposing tax computed on profits, income, distributions or any capital assets, gain or appreciation, or any tax in the nature of estate duty or inheritance tax, such tax shall not, until June 1, 2019, be applicable tous or to any of our operations or to our shares, debentures or other obligations.
Our income tax returns are subject to review and examination in the various jurisdictions in which we operate. We are currently contesting various non-U.S. assessments. We accrue for income tax contingencies that we believe are probableexposures. While we cannot predict or provide assurance as to the final outcome, we do not expect the liability, if any, resulting from existing or future assessments to have a material adverse effect on our consolidated financial position, results of operationsor cash flows.
During the fourth quarter of 2005, we entered into a settlement agreement with the U.S. Internal Revenue Service (“IRS”) with respect to our 1999 and 2000 U.S. federal income tax returns, which resulted in a payment of $36.2 million including interest. The IRS agreed to settle all issues for this period and reduce its original tax assessment of approximately$195 million, exclusive of interest, to $25.5 million, exclusive of interest. This settlement did not result in a material effect onour consolidated financial position, results of operations or cash flows.
As a result of changes in our estimates of certain pre-acquisition tax contingencies and liabilities arising prior to our merger with Sedco Forex Holdings Limited (“Sedco Forex”) effective December 31, 1999, we recorded a decrease of $43.0 million in goodwill during the year ended December 31, 2005. We also recognized an income tax benefit of $48.7 million during the year ended December 31, 2005 related to post-acquisition tax contingencies. These adjustments resulted from the resolution of income tax audits in several jurisdictions.
Our 2002 and 2003 U.S. federal income tax returns are currently under examination by the IRS and our 2001 U.S. federal income tax returns remain open for examination. No examination report has been received at this time. While we cannot predict or provide assurance as to the final outcome, we do not expect the liability, if any, resulting from the proposed changes to have a material adverse effect on our consolidated financial position, results of operations or cash flows
TRANSOCEAN INC. AND SUBSIDIARIES NOTES TO CONSOLIDATED FINANCIAL STATEMENTS - Continued
F-28
In September 2004, the Norwegian tax authorities initiated inquiries related to a restructuring transaction undertaken in2001 and 2002 and a dividend payment made during 2001. In February 2005, we filed a response to these inquiries. In March2005, pursuant to court orders, the Norwegian tax authorities took action to obtain additional information regarding these transactions. During 2005, we have continued to respond to information requests from the Norwegian authorities. Based on these inquiries, we believe the Norwegian authorities are contemplating a tax assessment of approximately $96.4 million on the dividend, based on exchange rates in effect at December 31, 2005, plus penalty and interest. No assessment has been made, and we believe such an assessment would be without merit. While we cannot predict or provide assurance as to the final outcome, we do not expect the liability, if any, resulting from the inquiry to have a material adverse effect on our consolidated financialposition, results of operations or cash flows.
In December 2005, we restructured certain of our non-U.S. operations. As a result of the restructuring, we incurred adeferred tax charge in the amount of $32.9 million.
Our wholly owned subsidiary, Transocean Holdings Inc. (“Transocean Holdings”), entered into a tax sharingagreement with TODCO in connection with the TODCO IPO. The tax sharing agreement governs Transocean Holdings’ and TODCO’s respective rights, responsibilities and obligations with respect to taxes and tax benefits, the filing of tax returns, the control of audits and other tax matters. Under this agreement, most U.S. federal, state, local and foreign income taxes and income tax benefits (including income taxes and income tax benefits attributable to the TODCO business) that accrued on orbefore the closing of the TODCO IPO will be for the account of Transocean Holdings. Accordingly, Transocean Holdings generally is liable for any income taxes that accrued on or before the closing of the TODCO IPO, but TODCO generally must pay Transocean Holdings for the amount of any income tax benefits created on or before the closing of the TODCO IPO (“pre-closing tax benefits”) that it uses or absorbs on a return with respect to a period after the closing of the TODCO IPO. Under this agreement, we are entitled to receive from TODCO payment for most of the tax benefits TODCO generated prior to the TODCO IPO that they utilize subsequent to the TODCO IPO. While TODCO was included in our consolidated statements ofoperations and balance sheet as a consolidated subsidiary until the fourth quarter of 2004, we followed the provisions of SFAS109, which allowed us to evaluate the recoverability of the deferred tax assets associated with the tax sharing agreementconsidering TODCO’s deferred tax liabilities.
Because we no longer own shares of TODCO, we no longer include TODCO as a consolidated subsidiary in our financial statements. As a result, we recorded a non-cash charge of $167.1 million ($0.51 per diluted share), which had no taxeffect, in the fourth quarter of 2004 related to contingent amounts due from TODCO under the tax sharing agreement. The non-cash charge was necessary as the future payments under the tax sharing agreement are dependent on TODCO generating future taxable income, which cannot be assumed until such income is actually generated. Future payments we receive from TODCO’s utilization of the pre-TODCO IPO deferred tax assets will be recognized in other income as those amounts are realized, which isgenerally based on when TODCO files its annual tax returns. We are involved in an arbitration proceeding with TODCO in which we are seeking payment of these amounts, and TODCO is seeking, in this proceeding as well as in a lawsuit, to void theentire tax sharing agreement. We believe TODCO owes us the disputed payments and do not believe TODCO’s attempts to voidthe tax sharing agreement have merit. See Note 18.
During the year ended December 31, 2005, we received $32.0 million in payments from TODCO related to TODCO’s expected utilization of such tax benefits for the 2004 and 2005 tax years. Of the $32.0 million received, $11.4 million and $20.6 million was received for the 2004 tax year and a portion of the 2005 tax year, respectively. Included in the 2005 payments are$1.7 million relating to stock options deductions. In 2005, TODCO filed its 2004 U.S. federal and state income tax returns andwe recognized $11.4 million as other income in our consolidated income statement. The amounts received pertaining to TODCO’s 2005 federal and state income tax returns, as well as payments received related to stock options deductions, were deferred in other current liabilities in our consolidated balance sheet. We will recognize these estimated payments as other income when TODCO finalizes and files its 2005 federal and state income tax returns and the dispute with TODCO is resolved. Estimated tax benefits in excess of $300 million remain to be utilized by TODCO under the tax sharing agreement, although the ultimate amount and timing of the utilization is highly contingent on a variety of factors including potential revisions to the taxbenefits upon examination by the IRS, which is currently reviewing our 2002 and 2003 tax years, the amount of taxable incomethat TODCO realizes in future years and the resolution of the dispute with TODCO related to the tax sharing agreement.
As a result of the deconsolidation of TODCO from our other U.S. subsidiaries for U.S. federal income tax purposes inconjunction with the TODCO IPO (see Note 4), we established an initial valuation allowance in the first quarter of 2004 of
TRANSOCEAN INC. AND SUBSIDIARIES NOTES TO CONSOLIDATED FINANCIAL STATEMENTS - Continued
F-29
$31.0 million ($0.09 per diluted share) against the estimated deferred tax assets of TODCO in excess of its deferred taxliabilities and other deferred tax assets not expected to be realized, taking into account prudent and feasible tax planning strategies as required by SFAS 109. We adjusted the initial valuation allowance during 2004 to reflect changes in our estimateof the ultimate amount of TODCO’s deferred tax assets and other deferred tax assets not expected to be realized. An allocationof tax benefits between TODCO and our other U.S. subsidiaries occurred in the third quarter of 2005 upon the filing of our 2004U.S. consolidated federal income tax return. As a result of this allocation, we recorded additional income tax expense ofapproximately $8 million ($0.02 per diluted share) in 2005 to adjust the previously estimated allocation. This allocation issubject to potential revision upon subsequent IRS audit of our tax return and such revision, should it occur, could impact oureffective tax rate for future years as well as the ultimate amount of payments by TODCO related to the tax sharing agreement.
In connection with the distribution of Sedco Forex to the Schlumberger Limited (“Schlumberger”) shareholders inDecember 1999, Sedco Forex and Schlumberger entered into a tax separation agreement. In accordance with the terms of the tax separation agreement, Schlumberger agreed to indemnify Sedco Forex for any tax liabilities incurred directly in connection withthe preparation of Sedco Forex for this distribution. In addition, Schlumberger agreed to indemnify Sedco Forex for taxliabilities associated with Sedco Forex operations conducted through Schlumberger entities prior to the distribution and any tax liabilities associated with Sedco Forex assets retained by Schlumberger.
We were included in the consolidated federal income tax returns filed by a former parent, Sonat Inc. (“Sonat”) duringall periods in which Sonat's ownership was greater than or equal to 80 percent through 1993 (“Affiliation Years”). Transoceanand Sonat entered into a tax sharing agreement providing for the manner of determining payments with respect to federalincome tax liabilities and benefits arising in the Affiliation Years. Under the tax sharing agreement, we will pay to Sonat an amount equal to our share of the Sonat consolidated federal income tax liability, generally determined on a separate return basis. In addition, Sonat will pay us for Sonat's utilization of deductions, losses and credits that are attributable to us and in excess of that which would be utilized on a separate return basis.
Note 17—Off-Balance Sheet Arrangement
We leased the semisubmersible M. G. Hulme, Jr. from Deep Sea Investors, L.L.C. (“Deep Sea Investors”), a special purpose entity formed by several leasing companies to acquire the rig from one of our subsidiaries in November 1995 in a sale/leaseback transaction. We accounted for the lease of this semisubmersible drilling rig as an operating lease. We recorded$4.6 million, $12.7 million and $12.5 million of such rent expense for the years ended December 31, 2005, 2004 and 2003, respectively. In May 2005, we purchased the rig for $42.5 million. The rig was reflected as property and equipment in the consolidated balance sheet at December 31, 2005.
Effective December 31, 2003, we adopted and applied the provisions of FASB Interpretation (“FIN”) 46, Consolidation of Variable Interest Entities, as revised December 31, 2003, for all variable interest entities. FIN 46 requires the consolidation of variable interest entities in which an enterprise absorbs a majority of the entity’s expected losses, receives a majority of the entity’s expected residual returns, or both, as a result of ownership, contractual or other financial interests in the entity. Because the sale/leaseback agreement was with an entity in which we had no direct investment, we were not entitled to receive the financial information of the leasing entity and the equity holders of the leasing company would not release thefinancial statements or other financial information to us in order for us to make the determination of whether the entity was avariable interest entity. In addition, without the financial statements or other financial information, we were unable to determineif we were the primary beneficiary of the entity and, if so, what we would have consolidated. We had no exposure to loss as a result of the sale/leaseback agreement. As a result of the purchase of the M. G. Hulme, Jr., we are no longer associated with Deep Seas Investors and, as such, are no longer required to review for FIN 46 applicability.
TRANSOCEAN INC. AND SUBSIDIARIES NOTES TO CONSOLIDATED FINANCIAL STATEMENTS - Continued
F-30
Note 18—Commitments and Contingencies
Operating Leases⎯We have operating lease commitments expiring at various dates, principally for real estate, office space and office equipment. In addition to rental payments, some leases provide that we pay a pro rata share of operating costsapplicable to the leased property. As of December 31, 2005, future minimum rental payments related to noncancellable operating leases are as follows (in millions):
Rental expense for all operating leases, including leases with terms of less than one year, was approximately $30million, $40 million and $51 million for the years ended December 31, 2005, 2004 and 2003, respectively.
Purchase Obligations—At December 31, 2005, our purchase obligations as defined by SFAS 47, Disclosure of Long-Term Obligations (as amended), related to our two Sedco 700-series upgrade shipyard projects are as follows (in millions):
Years ending December 31,
2006 ............................................................................ $108.72007 ............................................................................ 65.1
Total ........................................................................ $173.8
Legal Proceedings⎯ Several of our subsidiaries have been named, along with other defendants, in several complaints that have been filed in the Circuit Courts of the State of Mississippi involving over 700 persons that allege personal injuryarising out of asbestos exposure in the course of their employment by some of these defendants between 1965 and 1986. Thecomplaints also name as defendants certain of TODCO's subsidiaries to whom we may owe indemnity and other unaffiliateddefendant companies, including companies that allegedly manufactured drilling related products containing asbestos that are thesubject of the complaints. The number of unaffiliated defendant companies involved in each complaint ranges fromapproximately 20 to 70. The complaints allege that the defendant drilling contractors used those asbestos-containing products in offshore drilling operations, land based drilling operations and in drilling structures, drilling rigs, vessels and other equipmentand assert claims based on, among other things, negligence and strict liability, and claims authorized under the Jones Act. Theplaintiffs seek, among other things, awards of unspecified compensatory and punitive damages. The trial court has ordered that the plaintiffs provide additional information regarding their employment histories. We have not yet had an opportunity toconduct extensive discovery nor have we been able to definitively determine the number of plaintiffs that were employed by oursubsidiaries or otherwise have any connection with our drilling operations. We intend to defend ourselves vigorously and, basedon the limited information available to us at this time, we do not expect the liability, if any, resulting from these matters to have a material adverse effect on our consolidated financial position, results of operations or cash flows.
In 1990 and 1991, two of our subsidiaries were served with various assessments collectively valued at approximately$10 million from the municipality of Rio de Janeiro, Brazil to collect a municipal tax on services. We believe that neither subsidiary is liable for the taxes and have contested the assessments in the Brazilian administrative and court systems. We have received several adverse rulings by various courts with respect to a June 1991 assessment, which is valued at approximately $9 million. We are continuing to challenge the assessment, however, and have an action to stay execution of a related tax
Years ending December 31,
2006 ............................................................................ $18.0 2007 ............................................................................ 12.1 2008 ............................................................................ 8.7 2009 ............................................................................ 5.9 2010............................................................................. 4.7 Thereafter ................................................................... 1.4
Total ........................................................................ $50.8
TRANSOCEAN INC. AND SUBSIDIARIES NOTES TO CONSOLIDATED FINANCIAL STATEMENTS - Continued
F-31
foreclosure proceeding. We expect that the government will attempt to enforce the judgment on this assessment and that the amount claimed may exceed the amounts we believe are at issue. We received a favorable ruling in connection with a disputedAugust 1990 assessment and the government has lost what we expect to be its final appeal with respect to that ruling. We alsoare awaiting a ruling from the Taxpayer's Council in connection with an October 1990 assessment. If our defenses are ultimatelyunsuccessful, we believe that the Brazilian government-controlled oil company, Petrobras, has a contractual obligation toreimburse us for these municipal tax payments. We do not expect the liability, if any, resulting from these assessments to have a material adverse effect on our consolidated financial position, results of operations or cash flows.
The Indian Customs Department, Mumbai, filed a "show cause notice" against one of our subsidiaries and various thirdparties in July 1999. The show cause notice alleged that the initial entry into India in 1988 and other subsequent movements ofthe Trident II jackup rig operated by the subsidiary constituted imports and exports for which proper customs procedures werenot followed and sought payment of customs duties of approximately $31 million based on an alleged 1998 rig value of $49million, plus interest and penalties, and confiscation of the rig. In January 2000, the Customs Department issued its order, whichfound that we had imported the rig improperly and intentionally concealed the import from the authorities, and directed us to pay a redemption fee of approximately $3 million for the rig in lieu of confiscation and to pay penalties of approximately $1million in addition to the amount of customs duties owed. In February 2000, we filed an appeal with the Customs, Excise andService Tax Appellate Tribunal (“CESTAT”) together with an application to have the confiscation of the rig stayed pending the outcome of the appeal. In March 2000, the CESTAT ruled on the stay application, directing that the confiscation be stayed pending the appeal. The CESTAT issued its order on our appeal on February 2, 2001, and while it found that the rig wasimported in 1988 without proper documentation or payment of duties, the redemption fee and penalties were reduced to less than $0.1 million in view of the ambiguity surrounding the import practice at the time and the lack of intentional concealment by us. The CESTAT further sustained our position regarding the value of the rig at the time of import as $13 million and ruledthat subsequent movements of the rig were not liable to import documentation or duties in view of the prevailing practice of the Customs Department, thus limiting our exposure as to custom duties to approximately $6 million. Although CESTAT did notgrant us the benefit of a customs duty exemption due to the absence of the required documentation, CESTAT left it open for our subsidiary to seek such documentation from the Ministry of Petroleum. Following the CESTAT order, we tendered payment ofredemption, penalty and duty in the amount specified by the order by offset against a $0.6 million deposit and $10.7 millionguarantee previously made by us. The Customs Department attempted to draw the entire guarantee, alleging the actual dutypayable is approximately $22 million based on an interpretation of the CESTAT order that we believe is incorrect. This action was stopped by an interim ruling of the High Court, Mumbai on writ petition filed by us. We and the Customs Department bothfiled appeals with the Supreme Court of India against the order of the CESTAT, and both appeals were admitted. The SupremeCourt has dismissed the Customs Department appeal and affirmed the CESTAT order but the Customs Department has notagreed with our interpretation of that order. We are contesting their interpretation. We and our customer agreed to pursue and obtained the issuance of the required documentation from the Ministry of Petroleum that, if accepted by the CustomsDepartment, would reduce the duty to nil. The Customs Department did not accept the documentation or agree to refund the duties already paid. We are pursuing our remedies against the Customs Department and our customer. We do not expect the liability, if any, resulting from this matter to have a material adverse effect on our consolidated financial position, results ofoperations or cash flows.
In October 2001, TODCO was notified by the U.S. Environmental Protection Agency ("EPA") that the EPA hadidentified a subsidiary as a potentially responsible party in connection with the Palmer Barge Line superfund site located in PortArthur, Texas. Based upon the information provided by the EPA and a review of TODCO's internal records to date, TODCOdisputes its designation as a potentially responsible party. Pursuant to the master separation agreement with TODCO, we are responsible and will indemnify TODCO for any losses TODCO incurs in connection with this action. We do not expect the liability, if any, resulting from this matter to have a material adverse effect on our consolidated financial position, results ofoperations or cash flows.
In August 2003, a judgment of approximately $9.5 million was entered by the Labor Division of the Provincial Courtof Luanda, Angola, against us and one of our labor contractors, Hull Blyth, in favor of certain former workers on several of our drilling rigs. The workers were employed by Hull Blyth to work on several drilling rigs while the rigs were located in Angola.When the drilling contracts concluded and the rigs left Angola, the workers' employment ended. The workers brought suitclaiming that they were not properly compensated when their employment ended. In addition to the monetary judgment, theLabor Division ordered the workers to be hired by us. We believe that this judgment is without sufficient legal foundation and have appealed the matter to the Angola Supreme Court. We further believe that Hull Blyth has an obligation to protect us from
TRANSOCEAN INC. AND SUBSIDIARIES NOTES TO CONSOLIDATED FINANCIAL STATEMENTS - Continued
F-32
any judgment. We do not expect the liability, if any, resulting from this matter to have a material adverse effect on ourconsolidated financial position, results of operations or cash flows.
One of our subsidiaries is involved in an action with respect to customs penalties relating to the Sedco 710semisubmersible drilling rig. Prior to our merger with Sedco Forex, this drilling rig, which was working for Petrobras in Brazil at the time, had been admitted into the country on a temporary basis under authority granted to a Schlumberger entity. Prior tothe Sedco Forex merger, the drilling contract was moved to an entity that would become one of our subsidiaries. In early 2000, the drilling contract was extended for another year. On January 10, 2000, the temporary import permit granted to the Schlumberger entity expired, and renewal filings were not made until later that January. In April 2000, the Brazilian customsauthorities cancelled the import permit. The Schlumberger entity filed an action in the Brazilian federal court of Campos for the purpose of extending the temporary admission. Other proceedings were also initiated in order to secure the transfer of the temporary admission to our subsidiary. Ultimately, the court permitted the transfer to our entity but has not ruled that the temporary admission could be extended without the payment of a financial penalty. During the first quarter of 2004, the customsoffice renewed its efforts to collect a penalty and issued a second assessment for this penalty but has now done so against oursubsidiary. The assessment is for approximately $71 million. We believe that the amount of the assessment, even if it wereappropriate, should only be approximately $7 million and should in any event be assessed against the Schlumberger entity. Weand Schlumberger are contesting our respective assessments. We have put Schlumberger on notice that we consider anyassessment to be the responsibility of Schlumberger. We do not expect the liability, if any, resulting from this matter to have a material adverse effect on our consolidated financial position, results of operations or cash flows.
We have a dispute with TODCO concerning payment to us under our tax sharing agreement with TODCO for the taxbenefit that TODCO derives from exercises of options to purchase our ordinary shares held by employees of TODCO. Anarbitration proceeding was initiated in January 2006, and the parties are in the process of appointing an arbitrator. We are seeking payment of the amount of tax benefits derived from exercises of options to purchase our ordinary shares by employeesof TODCO who were not on the payroll of TODCO at the time of exercise and a declaration that TODCO pay us for the benefitderived from such exercises in the future. TODCO is seeking to avoid such payment and is asking that the entire tax sharing agreement be voided. TODCO also filed suit in Houston in the district court of the State of Texas in January 2006 seeking toset aside the arbitration provision and to void the entire tax sharing agreement. We believe TODCO owes us approximately $10.7 million based on options exercised through December 31, 2005, and we do not believe TODCO’s attempts to void the tax sharing agreement have merit. We do not expect the outcome of this matter to have a material adverse effect on our consolidatedfinancial position, results of operations or cash flows.
We are involved in a number of other lawsuits, all of which have arisen in the ordinary course of our business. We donot expect the liability, if any, resulting from these matters to have a material adverse effect on our consolidated financial position, results of operations or cash flows.
Self Insurance—We are self-insured for the deductible portion of our insurance coverage. In the opinion ofmanagement, adequate accruals have been made based on known and estimated exposures up to the deductible portion of our insurance coverages. Management believes that claims and liabilities in excess of the amounts accrued are adequately insured.
Letters of Credit and Surety Bonds—We had letters of credit outstanding totaling $313.8 million and $182.2 million at December 31, 2005 and 2004, respectively. These letters of credit guarantee various contract bidding and performance activitiesunder various uncommitted lines provided by several banks.
As is customary in the contract drilling business, we also have various surety bonds in place that secure customs obligations relating to the importation of our rigs and certain performance and other obligations. Surety bonds outstandingtotaled $8.0 million and $7.6 million at December 31, 2005 and 2004, respectively.
TRANSOCEAN INC. AND SUBSIDIARIES NOTES TO CONSOLIDATED FINANCIAL STATEMENTS - Continued
F-33
Note 19—Stock-Based Compensation Plans
Long-Term Incentive Plan—We have a long-term incentive plan for key employees and outside directors (the “Incentive Plan”). Prior to 2003, we accounted for our Incentive Plan under APB 25 and related interpretations. Effective January 1, 2003, we have adopted the fair value recognition provisions of SFAS 123 using the prospective method. Under theprospective method and in accordance with the provisions of SFAS 148 (see Note 2), the recognition provisions are applied to all employee awards granted, modified, or settled after January 1, 2003.
Under the Incentive Plan, awards can be granted in the form of stock options, nonvested restricted shares, deferredunits, stock appreciation rights (“SARs”) and cash performance awards. Such awards include traditional time-vesting awards(“time-based vesting awards”) and awards that are earned based on the achievement of certain performance criteria(“performance-based awards”). Our executive compensation committee of our board of directors determines the terms andconditions of the awards under the Incentive Plan. Options issued to date under the Incentive Plan have a 10-year term. Time-based vesting awards vest in three equal annual installments from the date of grant. Performance-based awards issued to dateunder the Incentive Plan have a two-year performance cycle with the number of options, shares or deferred units earned beingdetermined following the completion of the performance cycle (the “determination date”) at which time one-third of the options,shares or deferred units are vested. Additional vesting occurs December 31 of the two subsequent years following thedetermination date.
As of December 31, 2005, we were authorized under the Incentive Plan to grant up to (i) 22.9 million ordinary sharesto employees; (ii) 0.6 million shares to outside directors; and (iii) 6.0 million restricted shares to employees. On December 31, 1999, all unvested stock options and SARs and all nonvested restricted shares granted after April 1996 became fully vested as aresult of the Sedco Forex merger. At December 31, 2005, there were approximately 9.2 million and 0.2 million total sharesavailable to employees and outside directors, respectively, for future grants under the Incentive Plan, assuming the 1.5 million performance-based stock options, unvested restricted share and deferred unit awards that could be issued at December 31, 2005are ultimately issued at the maximum amount.
Prior to the Sedco Forex merger, key employees of Sedco Forex were granted stock options at various dates under theSchlumberger stock option plans. For all of the stock options granted under such plans, the exercise price of each option equaled the market price of Schlumberger stock on the date of grant, each option's maximum term was 10 years and the options generally vested in 20 percent increments over five years. Fully vested Schlumberger options held by Sedco Forex employees atthe date of the spin-off will lapse in accordance with their provisions. Non-vested Schlumberger options were terminated andfully vested stock options to purchase our ordinary shares were granted under a new plan.
Prior to the R&B Falcon merger, certain employees and outside directors of R&B Falcon and its subsidiaries were granted stock options under various plans. As a result of the R&B Falcon merger, we assumed all outstanding R&B Falconstock options and converted them into options to purchase our ordinary shares.
As a result of the TODCO IPO (see Note 4), all unvested stock options to purchase our ordinary shares held byTODCO employees were fully vested.
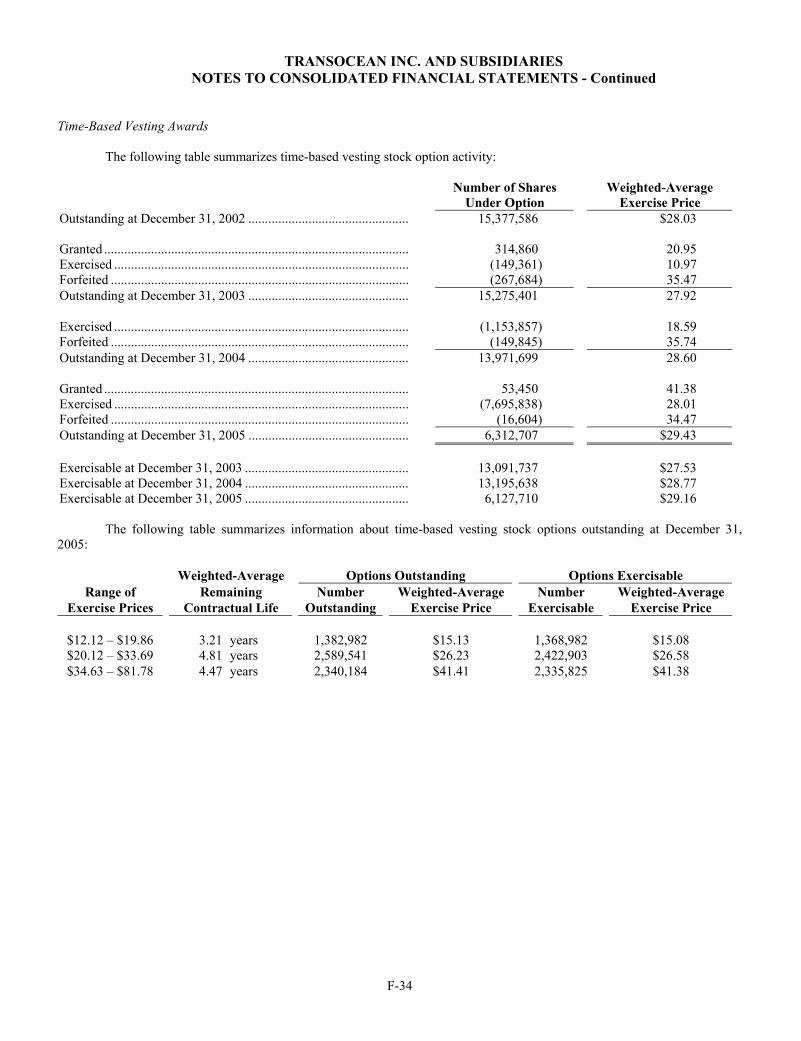
TRANSOCEAN INC. AND SUBSIDIARIES NOTES TO CONSOLIDATED FINANCIAL STATEMENTS - Continued
F-34
Time-Based Vesting Awards
The following table summarizes time-based vesting stock option activity:
Number of Shares Weighted-Average Under Option Exercise Price
Outstanding at December 31, 2002 ................................................ 15,377,586 $28.03
Granted ........................................................................................... 314,860 20.95 Exercised ........................................................................................ (149,361) 10.97 Forfeited ......................................................................................... (267,684) 35.47 Outstanding at December 31, 2003 ................................................ 15,275,401 27.92
Exercised ........................................................................................ (1,153,857) 18.59 Forfeited ......................................................................................... (149,845) 35.74 Outstanding at December 31, 2004 ................................................ 13,971,699 28.60
Granted ........................................................................................... 53,450 41.38 Exercised ........................................................................................ (7,695,838) 28.01 Forfeited ......................................................................................... (16,604) 34.47 Outstanding at December 31, 2005 ................................................ 6,312,707 $29.43
Exercisable at December 31, 2003 ................................................. 13,091,737 $27.53 Exercisable at December 31, 2004 ................................................. 13,195,638 $28.77 Exercisable at December 31, 2005 ................................................. 6,127,710 $29.16
The following table summarizes information about time-based vesting stock options outstanding at December 31, 2005:
Weighted-Average Options Outstanding Options ExercisableRange of Remaining Number Weighted-Average Number Weighted-Average
Exercise Prices Contractual Life Outstanding Exercise Price Exercisable Exercise Price
$12.12 – $19.86 3.21 years 1,382,982 $15.13 1,368,982 $15.08$20.12 – $33.69 4.81 years 2,589,541 $26.23 2,422,903 $26.58$34.63 – $81.78 4.47 years 2,340,184 $41.41 2,335,825 $41.38
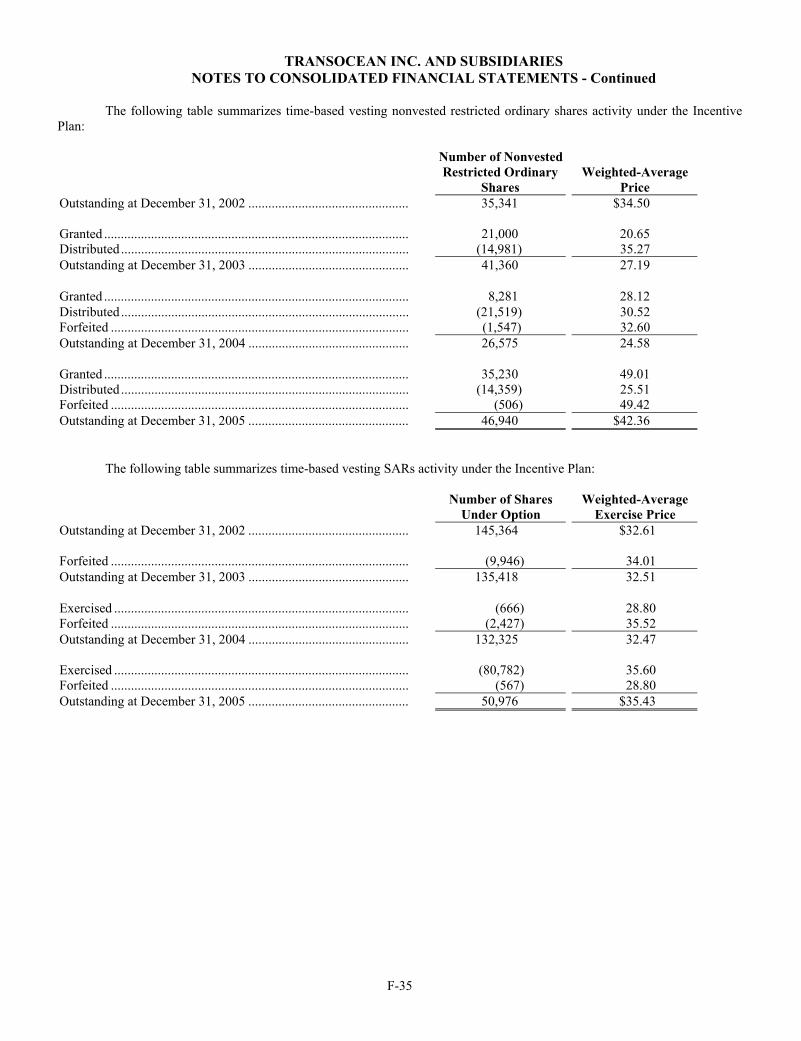
TRANSOCEAN INC. AND SUBSIDIARIES NOTES TO CONSOLIDATED FINANCIAL STATEMENTS - Continued
F-35
The following table summarizes time-based vesting nonvested restricted ordinary shares activity under the Incentive Plan:
Number of NonvestedRestricted Ordinary Weighted-Average
Shares Price Outstanding at December 31, 2002 ................................................ 35,341 $34.50
Granted ........................................................................................... 21,000 20.65 Distributed...................................................................................... (14,981) 35.27 Outstanding at December 31, 2003 ................................................ 41,360 27.19
Granted ........................................................................................... 8,281 28.12 Distributed...................................................................................... (21,519) 30.52 Forfeited ......................................................................................... (1,547) 32.60 Outstanding at December 31, 2004 ................................................ 26,575 24.58
Granted ........................................................................................... 35,230 49.01 Distributed...................................................................................... (14,359) 25.51 Forfeited ......................................................................................... (506) 49.42 Outstanding at December 31, 2005 ................................................ 46,940 $42.36
The following table summarizes time-based vesting SARs activity under the Incentive Plan:
Number of Shares Weighted-Average Under Option Exercise Price
Outstanding at December 31, 2002 ................................................ 145,364 $32.61
Forfeited ......................................................................................... (9,946) 34.01 Outstanding at December 31, 2003 ................................................ 135,418 32.51
Exercised ........................................................................................ (666) 28.80 Forfeited ......................................................................................... (2,427) 35.52 Outstanding at December 31, 2004 ................................................ 132,325 32.47
Exercised ........................................................................................ (80,782) 35.60 Forfeited ......................................................................................... (567) 28.80 Outstanding at December 31, 2005 ................................................ 50,976 $35.43
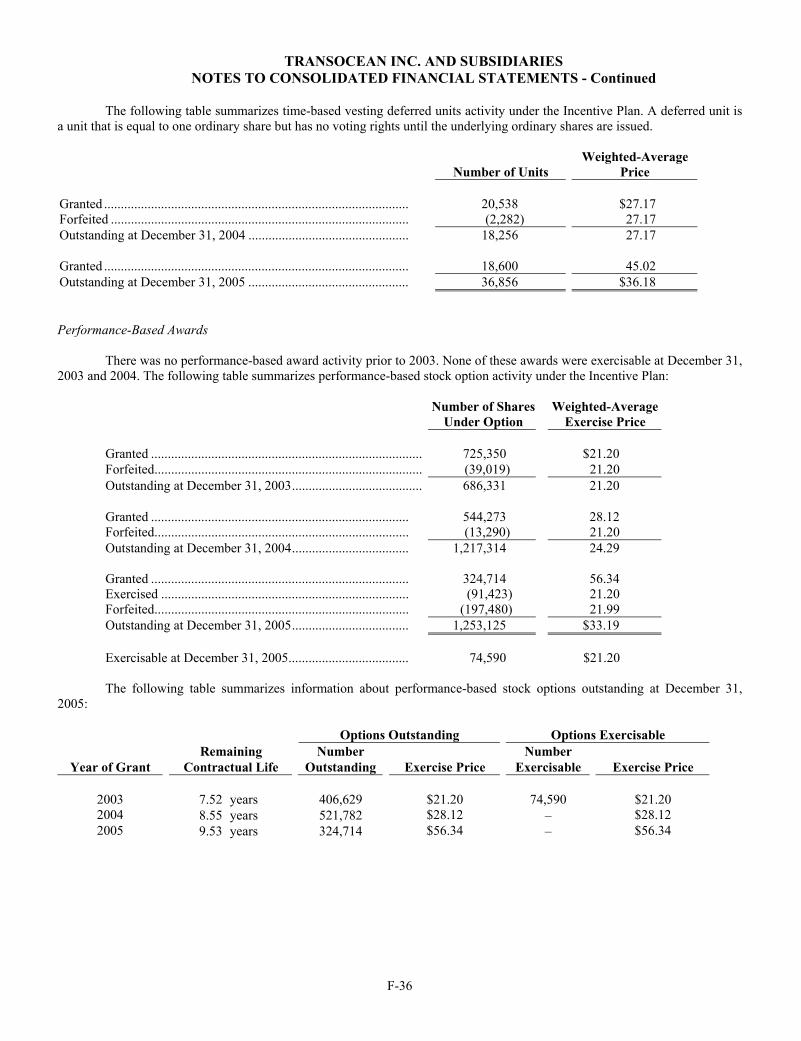
TRANSOCEAN INC. AND SUBSIDIARIES NOTES TO CONSOLIDATED FINANCIAL STATEMENTS - Continued
F-36
The following table summarizes time-based vesting deferred units activity under the Incentive Plan. A deferred unit is a unit that is equal to one ordinary share but has no voting rights until the underlying ordinary shares are issued.
Weighted-Average Number of Units Price
Granted ........................................................................................... 20,538 $27.17 Forfeited ......................................................................................... (2,282) 27.17 Outstanding at December 31, 2004 ................................................ 18,256 27.17
Granted ........................................................................................... 18,600 45.02 Outstanding at December 31, 2005 ................................................ 36,856 $36.18
Performance-Based Awards
There was no performance-based award activity prior to 2003. None of these awards were exercisable at December 31, 2003 and 2004. The following table summarizes performance-based stock option activity under the Incentive Plan:
The following table summarizes information about performance-based stock options outstanding at December 31, 2005:
Options Outstanding Options Exercisable Remaining Number Number
Year of Grant Contractual Life Outstanding Exercise Price Exercisable Exercise Price
2003 7.52 years 406,629 $21.20 74,590 $21.202004 8.55 years 521,782 $28.12 – $28.122005 9.53 years 324,714 $56.34 – $56.34
Number of Shares Weighted-AverageUnder Option Exercise Price
Granted ................................................................................. 725,350 $21.20 Forfeited................................................................................ (39,019) 21.20 Outstanding at December 31, 2003....................................... 686,331 21.20
Granted ............................................................................. 544,273 28.12 Forfeited............................................................................ (13,290) 21.20 Outstanding at December 31, 2004................................... 1,217,314 24.29
Granted ............................................................................. 324,714 56.34 Exercised .......................................................................... (91,423) 21.20 Forfeited............................................................................ (197,480) 21.99 Outstanding at December 31, 2005................................... 1,253,125 $33.19
Exercisable at December 31, 2005.................................... 74,590 $21.20
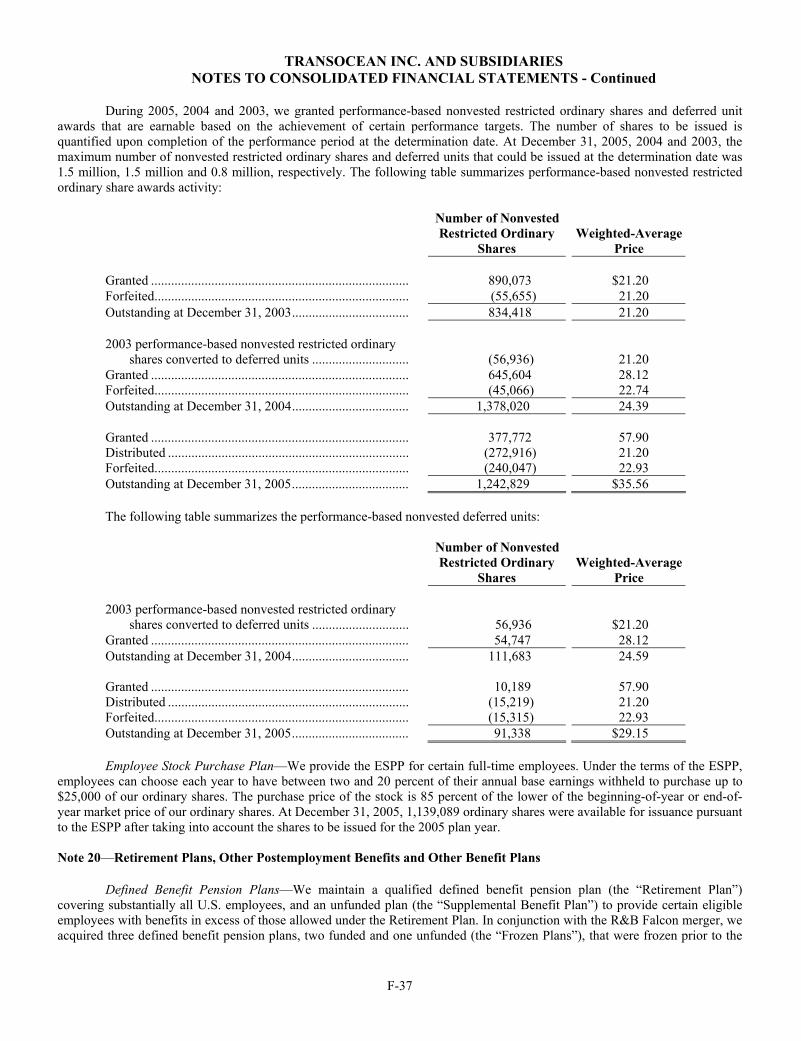
TRANSOCEAN INC. AND SUBSIDIARIES NOTES TO CONSOLIDATED FINANCIAL STATEMENTS - Continued
F-37
During 2005, 2004 and 2003, we granted performance-based nonvested restricted ordinary shares and deferred unitawards that are earnable based on the achievement of certain performance targets. The number of shares to be issued is quantified upon completion of the performance period at the determination date. At December 31, 2005, 2004 and 2003, themaximum number of nonvested restricted ordinary shares and deferred units that could be issued at the determination date was1.5 million, 1.5 million and 0.8 million, respectively. The following table summarizes performance-based nonvested restrictedordinary share awards activity:
The following table summarizes the performance-based nonvested deferred units:
Number of Nonvested Restricted Ordinary Weighted-Average Shares Price
2003 performance-based nonvested restricted ordinaryshares converted to deferred units ............................. 56,936 $21.20
Granted ............................................................................. 54,747 28.12 Outstanding at December 31, 2004................................... 111,683 24.59
Granted ............................................................................. 10,189 57.90 Distributed ........................................................................ (15,219) 21.20 Forfeited............................................................................ (15,315) 22.93 Outstanding at December 31, 2005................................... 91,338 $29.15
Employee Stock Purchase Plan—We provide the ESPP for certain full-time employees. Under the terms of the ESPP, employees can choose each year to have between two and 20 percent of their annual base earnings withheld to purchase up to$25,000 of our ordinary shares. The purchase price of the stock is 85 percent of the lower of the beginning-of-year or end-of-year market price of our ordinary shares. At December 31, 2005, 1,139,089 ordinary shares were available for issuance pursuant to the ESPP after taking into account the shares to be issued for the 2005 plan year.
Note 20—Retirement Plans, Other Postemployment Benefits and Other Benefit Plans
Defined Benefit Pension Plans—We maintain a qualified defined benefit pension plan (the “Retirement Plan”) covering substantially all U.S. employees, and an unfunded plan (the “Supplemental Benefit Plan”) to provide certain eligible employees with benefits in excess of those allowed under the Retirement Plan. In conjunction with the R&B Falcon merger, we acquired three defined benefit pension plans, two funded and one unfunded (the “Frozen Plans”), that were frozen prior to the
Number of Nonvested Restricted Ordinary Weighted-Average Shares Price
Granted ............................................................................. 890,073 $21.20 Forfeited............................................................................ (55,655) 21.20 Outstanding at December 31, 2003................................... 834,418 21.20
2003 performance-based nonvested restricted ordinaryshares converted to deferred units ............................. (56,936) 21.20
Granted ............................................................................. 645,604 28.12 Forfeited............................................................................ (45,066) 22.74 Outstanding at December 31, 2004................................... 1,378,020 24.39
Granted ............................................................................. 377,772 57.90 Distributed ........................................................................ (272,916) 21.20 Forfeited............................................................................ (240,047) 22.93 Outstanding at December 31, 2005................................... 1,242,829 $35.56
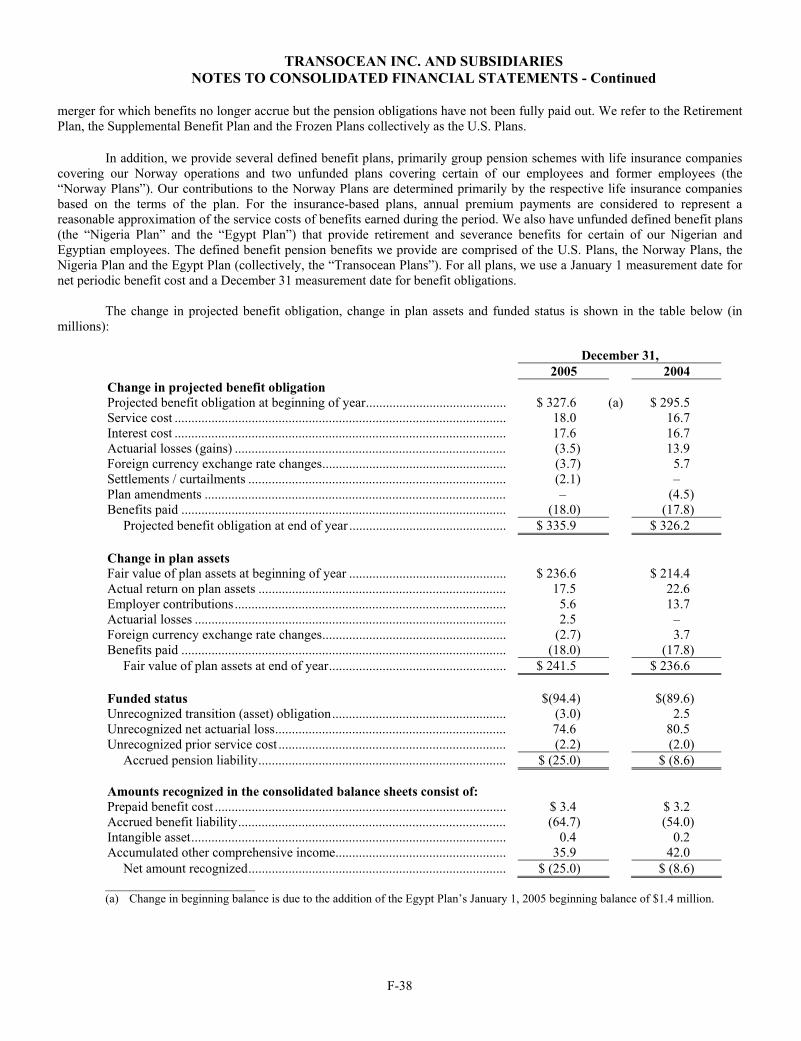
TRANSOCEAN INC. AND SUBSIDIARIES NOTES TO CONSOLIDATED FINANCIAL STATEMENTS - Continued
F-38
merger for which benefits no longer accrue but the pension obligations have not been fully paid out. We refer to the RetirementPlan, the Supplemental Benefit Plan and the Frozen Plans collectively as the U.S. Plans.
In addition, we provide several defined benefit plans, primarily group pension schemes with life insurance companies covering our Norway operations and two unfunded plans covering certain of our employees and former employees (the“Norway Plans”). Our contributions to the Norway Plans are determined primarily by the respective life insurance companies based on the terms of the plan. For the insurance-based plans, annual premium payments are considered to represent areasonable approximation of the service costs of benefits earned during the period. We also have unfunded defined benefit plans(the “Nigeria Plan” and the “Egypt Plan”) that provide retirement and severance benefits for certain of our Nigerian andEgyptian employees. The defined benefit pension benefits we provide are comprised of the U.S. Plans, the Norway Plans, the Nigeria Plan and the Egypt Plan (collectively, the “Transocean Plans”). For all plans, we use a January 1 measurement date for net periodic benefit cost and a December 31 measurement date for benefit obligations.
The change in projected benefit obligation, change in plan assets and funded status is shown in the table below (in millions):
December 31, 2005 2004
Change in projected benefit obligation Projected benefit obligation at beginning of year.......................................... $ 327.6 (a) $ 295.5 Service cost ................................................................................................... 18.0 16.7 Interest cost ................................................................................................... 17.6 16.7 Actuarial losses (gains) ................................................................................. (3.5) 13.9 Foreign currency exchange rate changes....................................................... (3.7) 5.7 Settlements / curtailments ............................................................................. (2.1) – Plan amendments .......................................................................................... – (4.5) Benefits paid ................................................................................................. (18.0) (17.8)
Projected benefit obligation at end of year ............................................... $ 335.9 $ 326.2
Change in plan assets Fair value of plan assets at beginning of year ............................................... $ 236.6 $ 214.4 Actual return on plan assets .......................................................................... 17.5 22.6 Employer contributions................................................................................. 5.6 13.7 Actuarial losses ............................................................................................. 2.5 – Foreign currency exchange rate changes....................................................... (2.7) 3.7 Benefits paid ................................................................................................. (18.0) (17.8)
Fair value of plan assets at end of year..................................................... $ 241.5 $ 236.6
Funded status $(94.4) $(89.6) Unrecognized transition (asset) obligation.................................................... (3.0) 2.5 Unrecognized net actuarial loss..................................................................... 74.6 80.5 Unrecognized prior service cost .................................................................... (2.2) (2.0)
Accrued pension liability.......................................................................... $ (25.0) $ (8.6)
Amounts recognized in the consolidated balance sheets consist of: Prepaid benefit cost ....................................................................................... $ 3.4 $ 3.2 Accrued benefit liability................................................................................ (64.7) (54.0) Intangible asset.............................................................................................. 0.4 0.2 Accumulated other comprehensive income................................................... 35.9 42.0
Net amount recognized............................................................................. $ (25.0) $ (8.6) _________________________ (a) Change in beginning balance is due to the addition of the Egypt Plan’s January 1, 2005 beginning balance of $1.4 million.
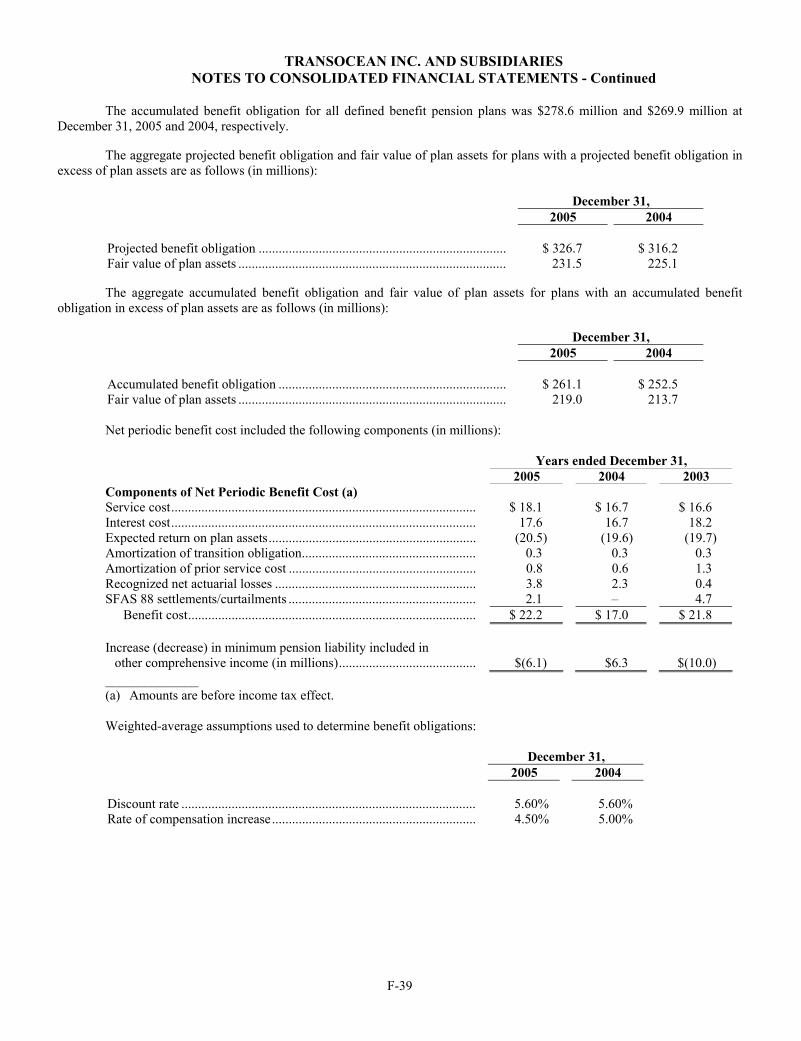
TRANSOCEAN INC. AND SUBSIDIARIES NOTES TO CONSOLIDATED FINANCIAL STATEMENTS - Continued
F-39
The accumulated benefit obligation for all defined benefit pension plans was $278.6 million and $269.9 million atDecember 31, 2005 and 2004, respectively.
The aggregate projected benefit obligation and fair value of plan assets for plans with a projected benefit obligation inexcess of plan assets are as follows (in millions):
December 31, 2005 2004
Projected benefit obligation .......................................................................... $ 326.7 $ 316.2 Fair value of plan assets ................................................................................ 231.5 225.1
The aggregate accumulated benefit obligation and fair value of plan assets for plans with an accumulated benefit obligation in excess of plan assets are as follows (in millions):
December 31, 2005 2004
Accumulated benefit obligation .................................................................... $ 261.1 $ 252.5 Fair value of plan assets ................................................................................ 219.0 213.7
Net periodic benefit cost included the following components (in millions):
Years ended December 31, 2005 2004 2003
Components of Net Periodic Benefit Cost (a) Service cost........................................................................................... $ 18.1 $ 16.7 $ 16.6 Interest cost........................................................................................... 17.6 16.7 18.2 Expected return on plan assets.............................................................. (20.5) (19.6) (19.7) Amortization of transition obligation.................................................... 0.3 0.3 0.3 Amortization of prior service cost ........................................................ 0.8 0.6 1.3 Recognized net actuarial losses ............................................................ 3.8 2.3 0.4 SFAS 88 settlements/curtailments ........................................................ 2.1 – 4.7
Benefit cost...................................................................................... $ 22.2 $ 17.0 $ 21.8
Increase (decrease) in minimum pension liability included in other comprehensive income (in millions)......................................... $(6.1) $6.3 $(10.0)
______________(a) Amounts are before income tax effect.
Weighted-average assumptions used to determine benefit obligations:
December 31, 2005 2004
Discount rate ........................................................................................ 5.60% 5.60% Rate of compensation increase............................................................. 4.50% 5.00%
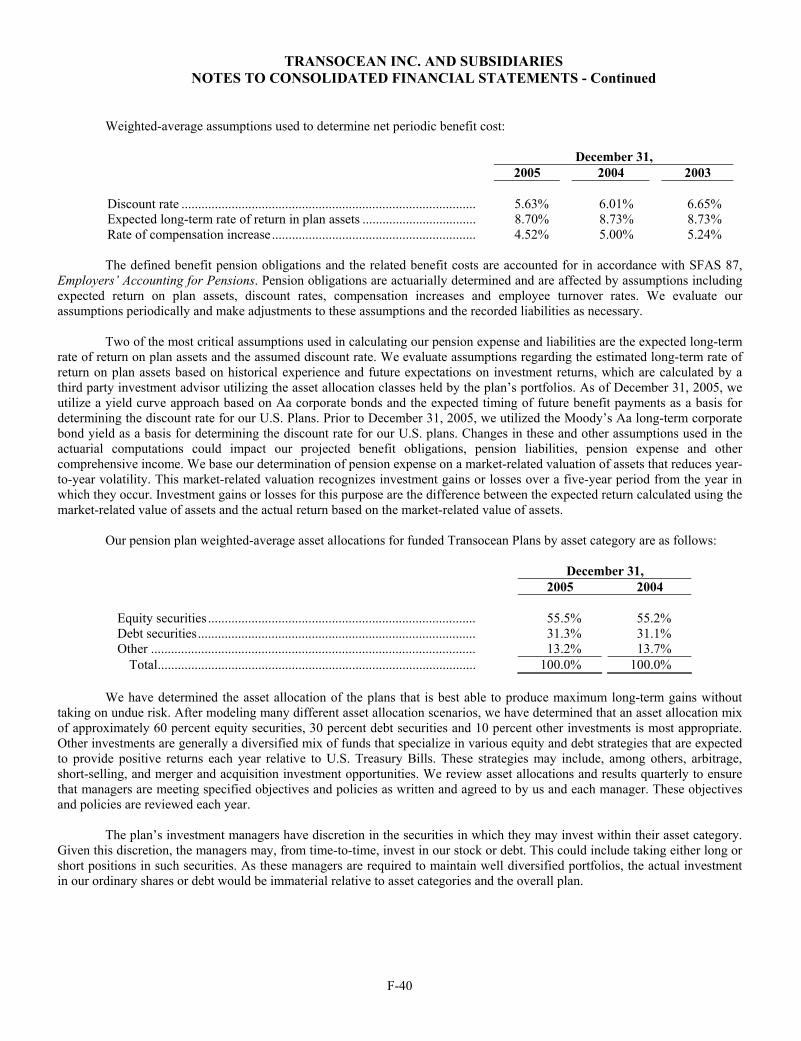
TRANSOCEAN INC. AND SUBSIDIARIES NOTES TO CONSOLIDATED FINANCIAL STATEMENTS - Continued
F-40
Weighted-average assumptions used to determine net periodic benefit cost:
December 31, 2005 2004 2003
Discount rate ........................................................................................ 5.63% 6.01% 6.65% Expected long-term rate of return in plan assets .................................. 8.70% 8.73% 8.73% Rate of compensation increase............................................................. 4.52% 5.00% 5.24%
The defined benefit pension obligations and the related benefit costs are accounted for in accordance with SFAS 87, Employers’ Accounting for Pensions. Pension obligations are actuarially determined and are affected by assumptions including expected return on plan assets, discount rates, compensation increases and employee turnover rates. We evaluate ourassumptions periodically and make adjustments to these assumptions and the recorded liabilities as necessary.
Two of the most critical assumptions used in calculating our pension expense and liabilities are the expected long-term rate of return on plan assets and the assumed discount rate. We evaluate assumptions regarding the estimated long-term rate of return on plan assets based on historical experience and future expectations on investment returns, which are calculated by athird party investment advisor utilizing the asset allocation classes held by the plan’s portfolios. As of December 31, 2005, we utilize a yield curve approach based on Aa corporate bonds and the expected timing of future benefit payments as a basis for determining the discount rate for our U.S. Plans. Prior to December 31, 2005, we utilized the Moody’s Aa long-term corporatebond yield as a basis for determining the discount rate for our U.S. plans. Changes in these and other assumptions used in the actuarial computations could impact our projected benefit obligations, pension liabilities, pension expense and other comprehensive income. We base our determination of pension expense on a market-related valuation of assets that reduces year-to-year volatility. This market-related valuation recognizes investment gains or losses over a five-year period from the year in which they occur. Investment gains or losses for this purpose are the difference between the expected return calculated using themarket-related value of assets and the actual return based on the market-related value of assets.
Our pension plan weighted-average asset allocations for funded Transocean Plans by asset category are as follows:
December 31, 2005 2004
Equity securities ................................................................................ 55.5% 55.2% Debt securities................................................................................... 31.3% 31.1% Other ................................................................................................. 13.2% 13.7%
Total............................................................................................... 100.0% 100.0%
We have determined the asset allocation of the plans that is best able to produce maximum long-term gains withouttaking on undue risk. After modeling many different asset allocation scenarios, we have determined that an asset allocation mixof approximately 60 percent equity securities, 30 percent debt securities and 10 percent other investments is most appropriate.Other investments are generally a diversified mix of funds that specialize in various equity and debt strategies that are expected to provide positive returns each year relative to U.S. Treasury Bills. These strategies may include, among others, arbitrage, short-selling, and merger and acquisition investment opportunities. We review asset allocations and results quarterly to ensurethat managers are meeting specified objectives and policies as written and agreed to by us and each manager. These objectives and policies are reviewed each year.
The plan’s investment managers have discretion in the securities in which they may invest within their asset category.Given this discretion, the managers may, from time-to-time, invest in our stock or debt. This could include taking either long or short positions in such securities. As these managers are required to maintain well diversified portfolios, the actual investment in our ordinary shares or debt would be immaterial relative to asset categories and the overall plan.
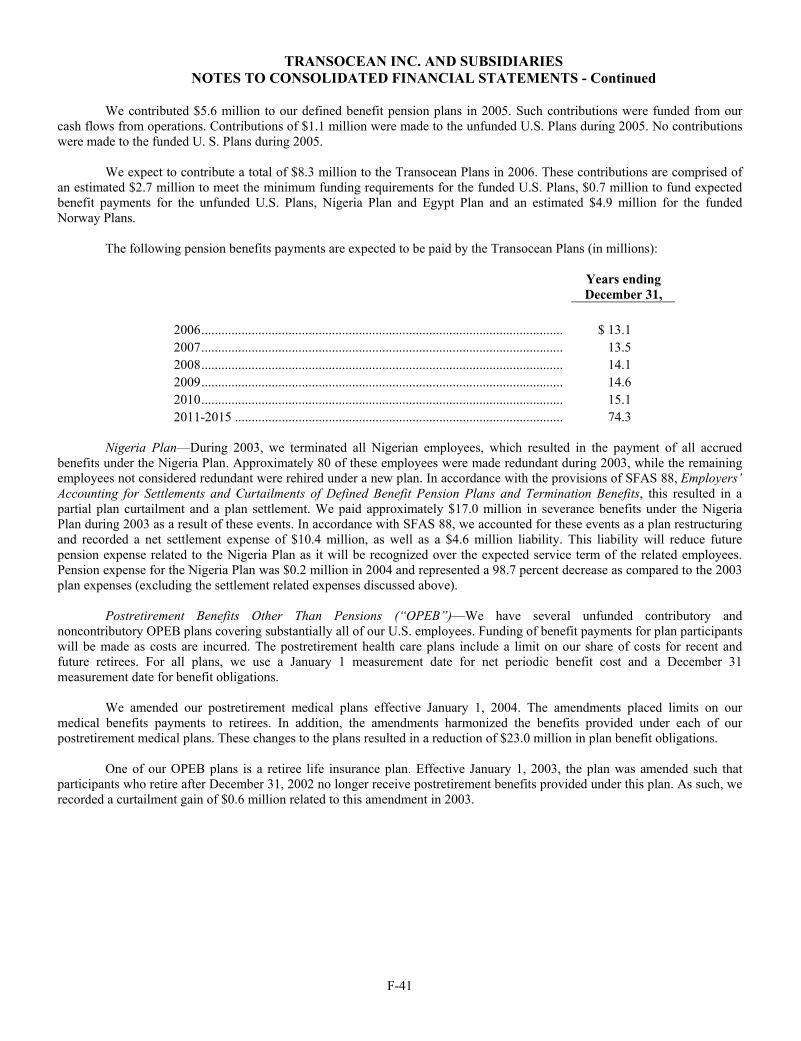
TRANSOCEAN INC. AND SUBSIDIARIES NOTES TO CONSOLIDATED FINANCIAL STATEMENTS - Continued
F-41
We contributed $5.6 million to our defined benefit pension plans in 2005. Such contributions were funded from ourcash flows from operations. Contributions of $1.1 million were made to the unfunded U.S. Plans during 2005. No contributionswere made to the funded U. S. Plans during 2005.
We expect to contribute a total of $8.3 million to the Transocean Plans in 2006. These contributions are comprised of an estimated $2.7 million to meet the minimum funding requirements for the funded U.S. Plans, $0.7 million to fund expectedbenefit payments for the unfunded U.S. Plans, Nigeria Plan and Egypt Plan and an estimated $4.9 million for the funded Norway Plans.
The following pension benefits payments are expected to be paid by the Transocean Plans (in millions):
Years ending December 31,
2006............................................................................................................ $ 13.1 2007............................................................................................................ 13.5 2008............................................................................................................ 14.1 2009............................................................................................................ 14.6 2010............................................................................................................ 15.1 2011-2015 .................................................................................................. 74.3
Nigeria Plan—During 2003, we terminated all Nigerian employees, which resulted in the payment of all accrued benefits under the Nigeria Plan. Approximately 80 of these employees were made redundant during 2003, while the remaining employees not considered redundant were rehired under a new plan. In accordance with the provisions of SFAS 88, Employers’Accounting for Settlements and Curtailments of Defined Benefit Pension Plans and Termination Benefits, this resulted in apartial plan curtailment and a plan settlement. We paid approximately $17.0 million in severance benefits under the Nigeria Plan during 2003 as a result of these events. In accordance with SFAS 88, we accounted for these events as a plan restructuringand recorded a net settlement expense of $10.4 million, as well as a $4.6 million liability. This liability will reduce future pension expense related to the Nigeria Plan as it will be recognized over the expected service term of the related employees.Pension expense for the Nigeria Plan was $0.2 million in 2004 and represented a 98.7 percent decrease as compared to the 2003plan expenses (excluding the settlement related expenses discussed above).
Postretirement Benefits Other Than Pensions (“OPEB”)—We have several unfunded contributory andnoncontributory OPEB plans covering substantially all of our U.S. employees. Funding of benefit payments for plan participantswill be made as costs are incurred. The postretirement health care plans include a limit on our share of costs for recent and future retirees. For all plans, we use a January 1 measurement date for net periodic benefit cost and a December 31measurement date for benefit obligations.
We amended our postretirement medical plans effective January 1, 2004. The amendments placed limits on our medical benefits payments to retirees. In addition, the amendments harmonized the benefits provided under each of our postretirement medical plans. These changes to the plans resulted in a reduction of $23.0 million in plan benefit obligations.
One of our OPEB plans is a retiree life insurance plan. Effective January 1, 2003, the plan was amended such thatparticipants who retire after December 31, 2002 no longer receive postretirement benefits provided under this plan. As such, werecorded a curtailment gain of $0.6 million related to this amendment in 2003.
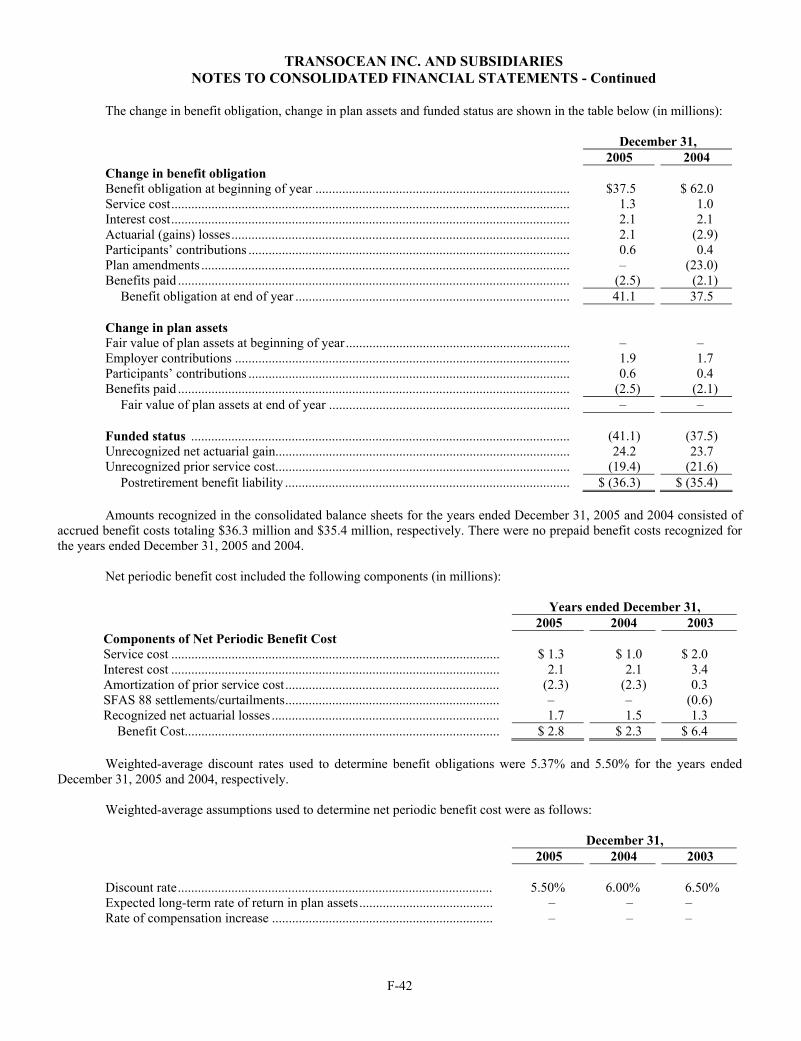
TRANSOCEAN INC. AND SUBSIDIARIES NOTES TO CONSOLIDATED FINANCIAL STATEMENTS - Continued
F-42
The change in benefit obligation, change in plan assets and funded status are shown in the table below (in millions):
December 31, 2005 2004
Change in benefit obligation Benefit obligation at beginning of year ............................................................................ $37.5 $ 62.0 Service cost....................................................................................................................... 1.3 1.0 Interest cost....................................................................................................................... 2.1 2.1 Actuarial (gains) losses..................................................................................................... 2.1 (2.9) Participants’ contributions ................................................................................................ 0.6 0.4 Plan amendments .............................................................................................................. – (23.0) Benefits paid ..................................................................................................................... (2.5) (2.1)
Benefit obligation at end of year .................................................................................. 41.1 37.5
Change in plan assets Fair value of plan assets at beginning of year................................................................... – – Employer contributions .................................................................................................... 1.9 1.7 Participants’ contributions ................................................................................................ 0.6 0.4 Benefits paid ..................................................................................................................... (2.5) (2.1)
Fair value of plan assets at end of year ........................................................................ – –
Funded status ................................................................................................................. (41.1) (37.5) Unrecognized net actuarial gain........................................................................................ 24.2 23.7 Unrecognized prior service cost........................................................................................ (19.4) (21.6)
Postretirement benefit liability ..................................................................................... $ (36.3) $ (35.4)
Amounts recognized in the consolidated balance sheets for the years ended December 31, 2005 and 2004 consisted of accrued benefit costs totaling $36.3 million and $35.4 million, respectively. There were no prepaid benefit costs recognized for the years ended December 31, 2005 and 2004.
Net periodic benefit cost included the following components (in millions):
Years ended December 31, 2005 2004 2003
Components of Net Periodic Benefit Cost Service cost .................................................................................................. $ 1.3 $ 1.0 $ 2.0 Interest cost .................................................................................................. 2.1 2.1 3.4 Amortization of prior service cost................................................................ (2.3) (2.3) 0.3 SFAS 88 settlements/curtailments................................................................ – – (0.6) Recognized net actuarial losses .................................................................... 1.7 1.5 1.3
Benefit Cost.............................................................................................. $ 2.8 $ 2.3 $ 6.4
Weighted-average discount rates used to determine benefit obligations were 5.37% and 5.50% for the years ended December 31, 2005 and 2004, respectively.
Weighted-average assumptions used to determine net periodic benefit cost were as follows:
December 31, 2005 2004 2003
Discount rate.............................................................................................. 5.50% 6.00% 6.50% Expected long-term rate of return in plan assets........................................ – – – Rate of compensation increase .................................................................. – – –
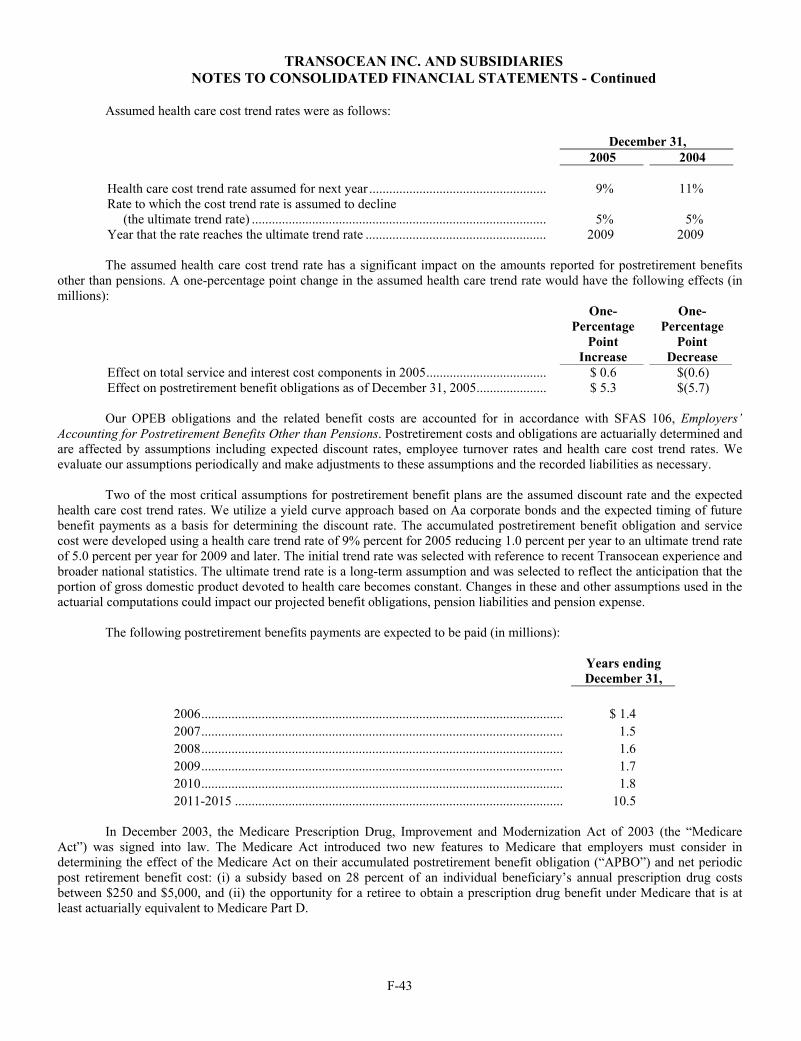
TRANSOCEAN INC. AND SUBSIDIARIES NOTES TO CONSOLIDATED FINANCIAL STATEMENTS - Continued
F-43
Assumed health care cost trend rates were as follows:
December 31, 2005 2004
Health care cost trend rate assumed for next year ..................................................... 9% 11% Rate to which the cost trend rate is assumed to decline
(the ultimate trend rate) ........................................................................................ 5% 5% Year that the rate reaches the ultimate trend rate ...................................................... 2009 2009
The assumed health care cost trend rate has a significant impact on the amounts reported for postretirement benefitsother than pensions. A one-percentage point change in the assumed health care trend rate would have the following effects (inmillions):
One- One- Percentage Percentage
Point Point Increase Decrease
Effect on total service and interest cost components in 2005.................................... $ 0.6 $(0.6) Effect on postretirement benefit obligations as of December 31, 2005..................... $ 5.3 $(5.7)
Our OPEB obligations and the related benefit costs are accounted for in accordance with SFAS 106, Employers’Accounting for Postretirement Benefits Other than Pensions. Postretirement costs and obligations are actuarially determined andare affected by assumptions including expected discount rates, employee turnover rates and health care cost trend rates. Weevaluate our assumptions periodically and make adjustments to these assumptions and the recorded liabilities as necessary.
Two of the most critical assumptions for postretirement benefit plans are the assumed discount rate and the expectedhealth care cost trend rates. We utilize a yield curve approach based on Aa corporate bonds and the expected timing of future benefit payments as a basis for determining the discount rate. The accumulated postretirement benefit obligation and service cost were developed using a health care trend rate of 9% percent for 2005 reducing 1.0 percent per year to an ultimate trend rate of 5.0 percent per year for 2009 and later. The initial trend rate was selected with reference to recent Transocean experience and broader national statistics. The ultimate trend rate is a long-term assumption and was selected to reflect the anticipation that the portion of gross domestic product devoted to health care becomes constant. Changes in these and other assumptions used in the actuarial computations could impact our projected benefit obligations, pension liabilities and pension expense.
The following postretirement benefits payments are expected to be paid (in millions):
Years ending December 31,
2006............................................................................................................ $ 1.4 2007............................................................................................................ 1.5 2008............................................................................................................ 1.6 2009............................................................................................................ 1.7 2010............................................................................................................ 1.8 2011-2015 .................................................................................................. 10.5
In December 2003, the Medicare Prescription Drug, Improvement and Modernization Act of 2003 (the “MedicareAct”) was signed into law. The Medicare Act introduced two new features to Medicare that employers must consider indetermining the effect of the Medicare Act on their accumulated postretirement benefit obligation (“APBO”) and net periodicpost retirement benefit cost: (i) a subsidy based on 28 percent of an individual beneficiary’s annual prescription drug costsbetween $250 and $5,000, and (ii) the opportunity for a retiree to obtain a prescription drug benefit under Medicare that is atleast actuarially equivalent to Medicare Part D.

TRANSOCEAN INC. AND SUBSIDIARIES NOTES TO CONSOLIDATED FINANCIAL STATEMENTS - Continued
F-44
In May 2004, the FASB issued FASB Staff Position (“FSP”) 106-2, Accounting and Disclosure Requirements Related to the Medicare Prescription Drug, Improvement and Modernization Act of 2003. We adopted FSP 106-2, effective July 1,2004, accounting for these new features in the Medicare Act prospectively as an actuarial gain to be amortized into income overthe average remaining service period of the plan participants. The adoption of these requirements did not have a material impact on our consolidated financial position, results of operations or cash flows for the years ended December 31, 2005 and 2004.
Defined Contribution Plans—We provide a defined contribution pension and savings plan covering senior non-U.S.field employees working outside the United States. Contributions and costs are determined as 4.5 percent to 6.5 percent of eachcovered employee's salary, based on years of service. In addition, we sponsor a U.S. defined contribution savings plan that covers certain employees and limits our contributions to no more than 4.5 percent of each covered employee's salary, based onthe employee's contribution. We also sponsor various other defined contribution plans worldwide. We recorded approximately $20.8 million, $20.3 million and $21.8 million of expense related to our defined contribution plans for the years ended December 31, 2005, 2004 and 2003, respectively.
Deferred Compensation Plan—We provided a Deferred Compensation Plan (the “Plan”). The Plan's primary purposewas to provide tax-advantageous asset accumulation for a select group of management, highly compensated employees and non-employee members of the board of directors.
Eligible employees who enrolled in the Plan could elect to defer up to a maximum of 90 percent of base salary, 100percent of any future performance awards, 100 percent of any special payments and 100 percent of directors' meeting fees and annual retainers; however, the administrative committee (seven individuals appointed by the finance and benefits committee ofthe board of directors) could, at its discretion, establish minimum amounts that must be deferred by anyone electing toparticipate in the Plan. In addition, the executive compensation committee of the board of directors could authorize employercontributions to participants and our chief executive officer, with executive compensation committee approval, was authorizedto cause us to enter into “deferred compensation award agreements” with such participants. There were no employer contributions to the Plan during the years ended December 31, 2005, 2004 or 2003.
In 2005, the Plan was amended to effectively freeze the Plan as of December 31, 2004.
Note 21—Investments in and Advances to Unconsolidated Affiliates
We have a 50 percent interest in Overseas Drilling Limited (“ODL”), which owns the drillship Joides Resolution. The drillship is contracted to perform drilling and coring operations in deep waters worldwide for the purpose of scientific research. We manage and operate the vessel on behalf of ODL. See Note 23.
As a result of the R&B Falcon merger, we had ownership interests in two unconsolidated joint ventures, 50 percent inDD LLC and 60 percent in DDII LLC. Subsidiaries of ConocoPhillips owned the remaining interests in these joint ventures. Wepurchased ConocoPhillips’ interests in DDII LLC and DD LLC in late May 2003 and late December 2003, respectively, at which time both DDII LLC and DD LLC became wholly owned subsidiaries. See Note 5.
As a result of the R&B Falcon merger, TODCO had a 25 percent ownership interest in Delta Towing Holdings, LLC(“Delta Towing”), a joint venture established for the purpose of owning and operating inland and shallow water marine supportvessel equipment. Delta Towing was considered a variable interest entity as its equity was not sufficient to absorb its expected losses. As a result of our adoption of FIN 46 effective December 31, 2003, TODCO evaluated the expected losses it would absorb from Delta Towing. Because TODCO had the largest percentage of investment at risk through the notes issued by DeltaTowing to TODCO, TODCO would absorb the majority of the joint venture’s expected losses; therefore, TODCO was deemed to be the primary beneficiary of Delta Towing for accounting purposes. As such, TODCO consolidated Delta Towing effectiveDecember 31, 2003 and the consolidation resulted in an increase in net assets and a corresponding gain as a cumulative effect of a change in accounting principle of approximately $0.8 million, which had no tax effect. As a result of the 2004 Offerings, Delta Towing was deconsolidated in connection with the deconsolidation of TODCO at December 17, 2004. See Notes 4 and 23.
As a result of our deconsolidation of TODCO at December 17, 2004, we accounted for our 22 percent interest inTODCO as an investment in an unconsolidated subsidiary and recognized our investment in TODCO under the equity methodof accounting. As a result of the May Offering, we accounted for our remaining two percent interest using the cost method of accounting and as a result of the June Sale, we no longer own any shares of TODCO. See Note 4.
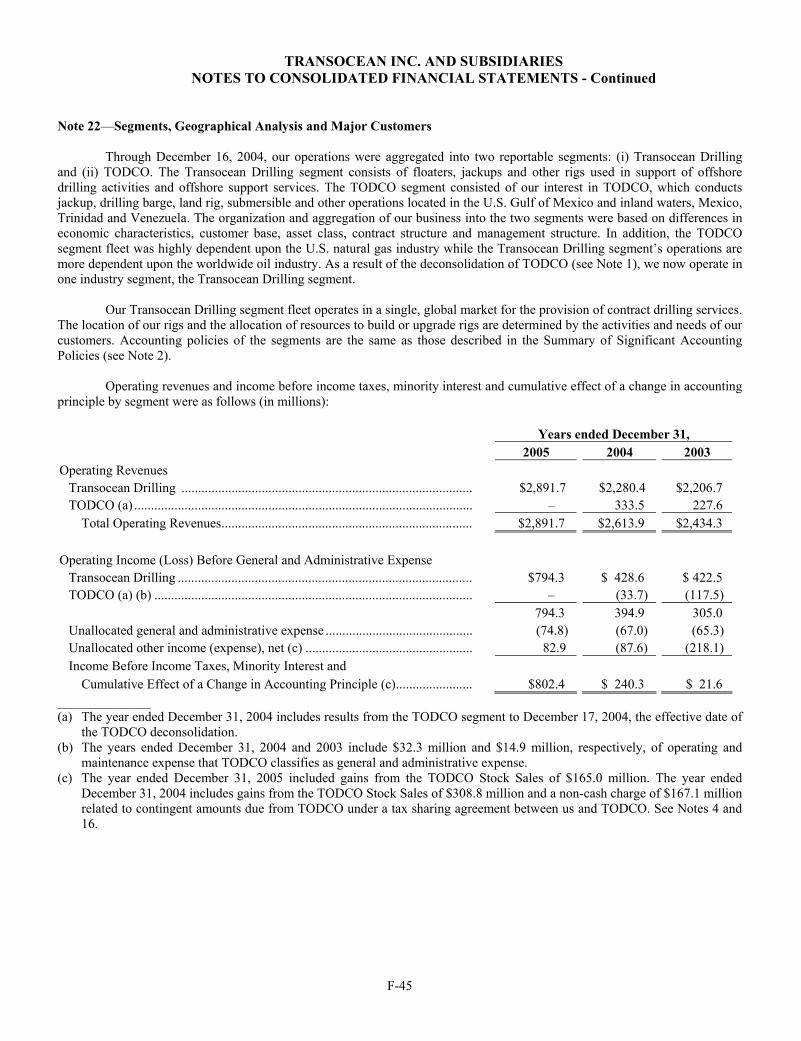
TRANSOCEAN INC. AND SUBSIDIARIES NOTES TO CONSOLIDATED FINANCIAL STATEMENTS - Continued
F-45
Note 22—Segments, Geographical Analysis and Major Customers
Through December 16, 2004, our operations were aggregated into two reportable segments: (i) Transocean Drilling and (ii) TODCO. The Transocean Drilling segment consists of floaters, jackups and other rigs used in support of offshore drilling activities and offshore support services. The TODCO segment consisted of our interest in TODCO, which conducts jackup, drilling barge, land rig, submersible and other operations located in the U.S. Gulf of Mexico and inland waters, Mexico, Trinidad and Venezuela. The organization and aggregation of our business into the two segments were based on differences ineconomic characteristics, customer base, asset class, contract structure and management structure. In addition, the TODCO segment fleet was highly dependent upon the U.S. natural gas industry while the Transocean Drilling segment’s operations are more dependent upon the worldwide oil industry. As a result of the deconsolidation of TODCO (see Note 1), we now operate inone industry segment, the Transocean Drilling segment.
Our Transocean Drilling segment fleet operates in a single, global market for the provision of contract drilling services. The location of our rigs and the allocation of resources to build or upgrade rigs are determined by the activities and needs of our customers. Accounting policies of the segments are the same as those described in the Summary of Significant AccountingPolicies (see Note 2).
Operating revenues and income before income taxes, minority interest and cumulative effect of a change in accounting principle by segment were as follows (in millions):
Years ended December 31, 2005 2004 2003
Operating Revenues Transocean Drilling ....................................................................................... $2,891.7 $2,280.4 $2,206.7TODCO (a) ..................................................................................................... – 333.5 227.6
Total Operating Revenues........................................................................... $2,891.7 $2,613.9 $2,434.3
Operating Income (Loss) Before General and Administrative Expense Transocean Drilling ........................................................................................ $794.3 $ 428.6 $ 422.5 TODCO (a) (b) ............................................................................................... – (33.7) (117.5)
794.3 394.9 305.0 Unallocated general and administrative expense ............................................ (74.8) (67.0) (65.3) Unallocated other income (expense), net (c) .................................................. 82.9 (87.6) (218.1) Income Before Income Taxes, Minority Interest and
Cumulative Effect of a Change in Accounting Principle (c)....................... $802.4 $ 240.3 $ 21.6______________(a) The year ended December 31, 2004 includes results from the TODCO segment to December 17, 2004, the effective date of
the TODCO deconsolidation.(b) The years ended December 31, 2004 and 2003 include $32.3 million and $14.9 million, respectively, of operating and
maintenance expense that TODCO classifies as general and administrative expense. (c) The year ended December 31, 2005 included gains from the TODCO Stock Sales of $165.0 million. The year ended
December 31, 2004 includes gains from the TODCO Stock Sales of $308.8 million and a non-cash charge of $167.1 million related to contingent amounts due from TODCO under a tax sharing agreement between us and TODCO. See Notes 4 and16.
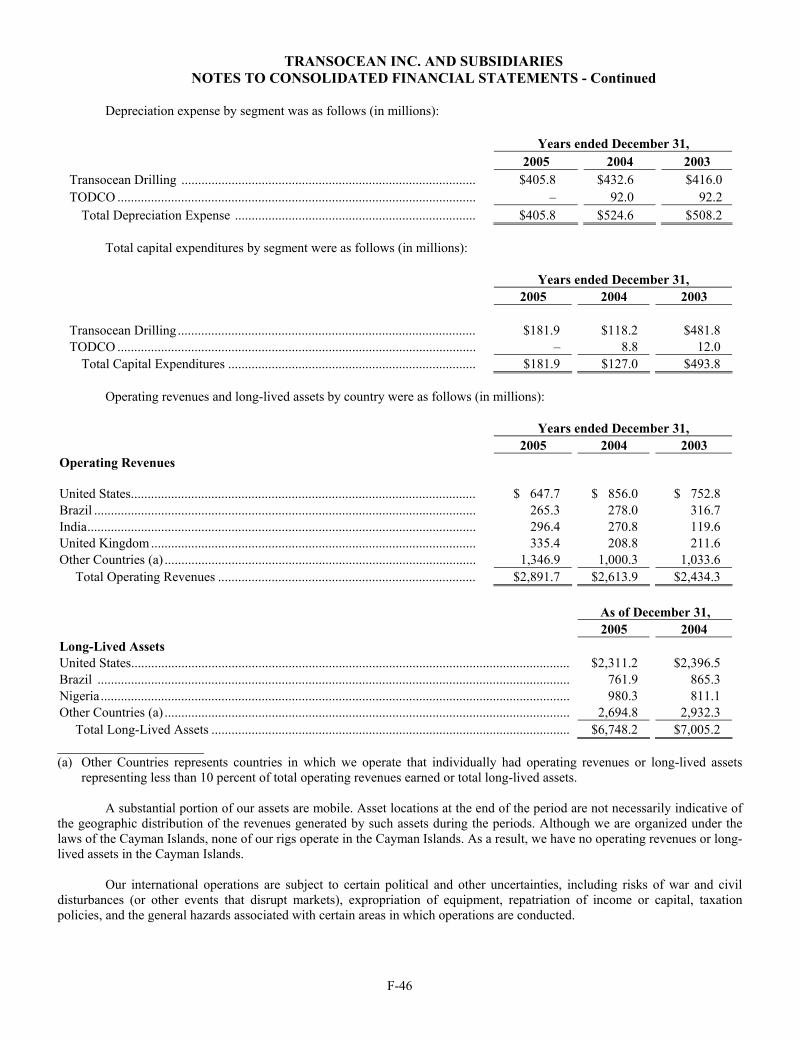
TRANSOCEAN INC. AND SUBSIDIARIES NOTES TO CONSOLIDATED FINANCIAL STATEMENTS - Continued
F-46
Depreciation expense by segment was as follows (in millions):
Years ended December 31, 2005 2004 2003
Transocean Drilling ........................................................................................ $405.8 $432.6 $416.0 TODCO ........................................................................................................... – 92.0 92.2
Total Depreciation Expense ........................................................................ $405.8 $524.6 $508.2
Total capital expenditures by segment were as follows (in millions):
Years ended December 31, 2005 2004 2003
Transocean Drilling ......................................................................................... $181.9 $118.2 $481.8TODCO ........................................................................................................... – 8.8 12.0
Total Capital Expenditures .......................................................................... $181.9 $127.0 $493.8
Operating revenues and long-lived assets by country were as follows (in millions):
Years ended December 31, 2005 2004 2003
Operating Revenues
United States....................................................................................................... $ 647.7 $ 856.0 $ 752.8Brazil .................................................................................................................. 265.3 278.0 316.7 India.................................................................................................................... 296.4 270.8 119.6 United Kingdom ................................................................................................. 335.4 208.8 211.6Other Countries (a) ............................................................................................. 1,346.9 1,000.3 1,033.6
Total Operating Revenues ............................................................................. $2,891.7 $2,613.9 $2,434.3
As of December 31, 2005 2004
Long-Lived Assets United States................................................................................................................................... $2,311.2 $2,396.5Brazil ............................................................................................................................................. 761.9 865.3 Nigeria............................................................................................................................................ 980.3 811.1 Other Countries (a) ......................................................................................................................... 2,694.8 2,932.3
Total Long-Lived Assets ........................................................................................................... $6,748.2 $7,005.2______________________(a) Other Countries represents countries in which we operate that individually had operating revenues or long-lived assets
representing less than 10 percent of total operating revenues earned or total long-lived assets.
A substantial portion of our assets are mobile. Asset locations at the end of the period are not necessarily indicative of the geographic distribution of the revenues generated by such assets during the periods. Although we are organized under thelaws of the Cayman Islands, none of our rigs operate in the Cayman Islands. As a result, we have no operating revenues or long-lived assets in the Cayman Islands.
Our international operations are subject to certain political and other uncertainties, including risks of war and civildisturbances (or other events that disrupt markets), expropriation of equipment, repatriation of income or capital, taxationpolicies, and the general hazards associated with certain areas in which operations are conducted.

TRANSOCEAN INC. AND SUBSIDIARIES NOTES TO CONSOLIDATED FINANCIAL STATEMENTS - Continued
F-47
For the year ended December 31, 2005, Chevron and BP accounted for approximately 12.1 percent and 11.7 percent, respectively, of our operating revenues. For the year ended December 31, 2004, BP, Petrobras and Chevron accounted for approximately 10.3 percent, 10.2 percent and 9.9 percent, respectively, of our operating revenues, of which the majority wasreported in the Transocean Drilling segment. For the year ended December 31, 2003, Petrobras, BP and Shell accounted for approximately 11.8 percent, 11.1 percent and 10.7 percent, respectively, of our operating revenues, of which the majority was reported in the Transocean Drilling segment. The loss of these or other significant customers could have a material adverse effect on our results of operations.
Note 23—Related Party Transactions
DD LLC and DDII LLC—Prior to our purchase of ConocoPhillips’ interest in DD LLC and DDII LLC (see Note 5), we were party to drilling services agreements with DD LLC and DDII LLC for the operations of the Deepwater Pathfinder andDeepwater Frontier, respectively. For the year ended December 31, 2003, we earned $1.6 million and $1.3 million for suchservices to DD LLC and DDII LLC, respectively, which was reflected in other revenues in our consolidated statement of operations.
Delta Towing—Immediately prior to the closing of the R&B Falcon merger, TODCO formed a joint venture to ownand operate its U.S. inland marine support vessel business (the “Marine Business”). In connection with the formation of the joint venture, the Marine Business was transferred by a subsidiary of TODCO to Delta Towing in exchange for a 25 percentequity interest, and certain secured notes payable from Delta Towing. The secured notes consisted of (i) an $80.0 millionprincipal amount note bearing interest at eight percent per annum due January 30, 2024 (the “Tier 1 Note”), (ii) a contingent$20.0 million principal amount note bearing interest at eight percent per annum with an expiration date of January 30, 2011 (the “Tier 2 Note”) and (iii) a contingent $44.0 million principal amount note bearing interest at eight percent per annum with an expiration date of January 30, 2011 (the “Tier 3 Note”). The 75 percent equity interest holder in the joint venture also loanedDelta Towing $3.0 million in the form of a Tier 1 Note. Until January 2011, Delta Towing must use 100 percent of its excess cash flow towards the payment of principal and interest on the Tier 1 Notes. After January 2011, 50 percent of its excess cashflows are to be applied towards the payment of principal and unpaid interest on the Tier 1 Notes. Interest is due and payable quarterly without regard to excess cash flow.
Delta Towing was obligated to repay at least (i) $8.3 million of the aggregate principal amount of the Tier 1 Note nolater than January 2004, (ii) $24.9 million of the aggregate principal amount no later than January 2006 and (iii) $62.3 million of the aggregate principal amount no later than January 2008. After the Tier 1 Note has been repaid, Delta Towing must apply75 percent of its excess cash flow towards payment of the Tier 2 Note. Upon the repayment of the Tier 2 Note, Delta Towingmust apply 50 percent of its excess cash to repay principal and interest on the Tier 3 Note. Any amounts not yet due under theTier 2 and Tier 3 Notes at the time of their expiration will be waived. The Tier 1, 2 and 3 Notes are secured by mortgages and liens on the vessels and other assets of Delta Towing.
TODCO valued its Tier 1, 2 and 3 Notes at $80 million immediately prior to the closing of the R&B Falcon merger, theeffect of which was to fully reserve the Tier 2 and 3 Notes. For the year ended December 31, 2003, we earned interest incomeon the outstanding balance of $3.1 million on the Tier 1 Note. In December 2001, the note agreement was amended to providefor a $4.0 million, three-year revolving credit facility (the “Delta Towing Revolver”) from the Company. Amounts drawn under the Delta Towing Revolver accrued interest at eight percent per annum, with interest payable quarterly. For the year ended December 31, 2003, TODCO recognized $0.3 million of interest income on the Delta Towing Revolver.
Delta Towing defaulted on the notes in January 2003 by failing to make its scheduled quarterly interest payment andremained in default as a result of its continued failure to make its quarterly interest payments. As a result of TODCO’s continued evaluation of the collectibility of the notes, TODCO recorded an impairment of the notes receivable of $21.3 million($13.8 million, or $0.04 per diluted share, net of tax) in June 2003 based on Delta Towing’s discounted cash flows over theterms of the notes, which deteriorated in the second quarter of 2003 as a result of the continued decline in Delta Towing’s business outlook. As permitted in the note agreement in the event of default, TODCO began offsetting a portion of the amount owed to Delta Towing against the interest due under the notes. Additionally, in 2003, TODCO established a reserve of $1.6million for interest income earned during the year ended December 31, 2003 on the notes receivable.
As part of the formation of the joint venture on January 31, 2001, TODCO entered into an agreement with Delta Towing under which TODCO committed to charter certain vessels for a period of one year ending January 31, 2002 and
TRANSOCEAN INC. AND SUBSIDIARIES NOTES TO CONSOLIDATED FINANCIAL STATEMENTS - Continued
F-48
committed to charter for a period of 2.5 years from the date of delivery 10 crewboats then under construction, all of which hadbeen placed into service as of December 31, 2002. During the year ended December 31, 2003, TODCO incurred charges of$11.7 million, which was reflected in operating and maintenance expense.
As a result of the adoption of FIN 46 and a determination that TODCO was the primary beneficiary for accounting purposes of Delta Towing, TODCO consolidated Delta Towing effective December 31, 2003 and intercompany transactions andaccounts were eliminated, including the above described notes. Consolidation of Delta Towing resulted in an increase in net assets and a corresponding gain as a cumulative effect of a change in accounting principle of approximately $0.8 million, whichhad no tax effect. In connection with the deconsolidation of TODCO, Delta Towing was deconsolidated effective December 17, 2004 (see Note 4).
ODL—In conjunction with the management and operation of the Joides Resolution on behalf of ODL, we earned $1.4million, $2.4 million and $1.2 million for the years ended December 31, 2005, 2004 and 2003, respectively. Such amounts areincluded in other revenues in our consolidated statements of operations. At December 31, 2005 and 2004, we had receivables due from ODL of $1.7 million and $1.1 million, respectively, which were recorded as accounts receivable – other in our consolidated balance sheets. Siem Offshore Inc. owns the other 50 percent interest in ODL. Our director, Kristian Siem, is thechairman of Siem Offshore Inc. and is also a director and officer of ODL. Mr. Siem is also chairman and chief executive officerof Siem Industries, Inc., which owns an approximate 45 percent interest in Siem Offshore Inc.
In November 2005, we entered into a loan agreement with ODL pursuant to which we may borrow up to $8 million.ODL may demand repayment at any time upon five business days prior written notice given to us and any amount due to usfrom ODL may be offset against the loan amount at the time of repayment. During 2005 and prior to entering into the loanagreement, we received $3.0 million in dividend payments from ODL. As of December 31, 2005, $3.5 million was outstanding under this loan agreement and was reflected as other long-term liabilities in our consolidated balance sheet.
TODCO—We entered into a transition services agreement under which we provide specified administrative support toTODCO during the transitional period following the closing of the TODCO IPO. TODCO provides specified administrative support on our behalf for rig operations in Trinidad and Venezuela. Prior to the deconsolidation of TODCO (see Notes 1 and 4),amounts we earned under the transition services agreement and amounts we incurred for administrative support from TODCOwere eliminated upon consolidation. As a result of our deconsolidation of TODCO, amounts earned under the transition services agreement are reflected in other revenues and amounts incurred for administrative support are reflected in operating andmaintenance expense in our consolidated statement of operations. While any amounts recorded between us and TODCOsubsequent to the deconsolidation of TODCO in mid-December 2004 were not material, we incurred $1.1 million of costs related to service fees that TODCO billed to us in 2005. At December 31, 2005 and 2004, we had payables related to the agreements for the separation of TODCO of $0.5 million and $0.3 million, respectively, which was included in accountspayable in our consolidated balance sheet. At December 31, 2005 and 2004, we had a long-term payable related to ourindemnification of certain TODCO non-U.S. income tax liabilities of $11.2 million, for each period, which was included in other long-term liabilities in our consolidated balance sheet. Although the ultimate amount of the indemnification could vary and we cannot predict or provide assurance as to the final outcome, we do not expect the liability, if any, resulting from theindemnification to have a material adverse effect on our consolidated financial position, results of operations or cash flows.
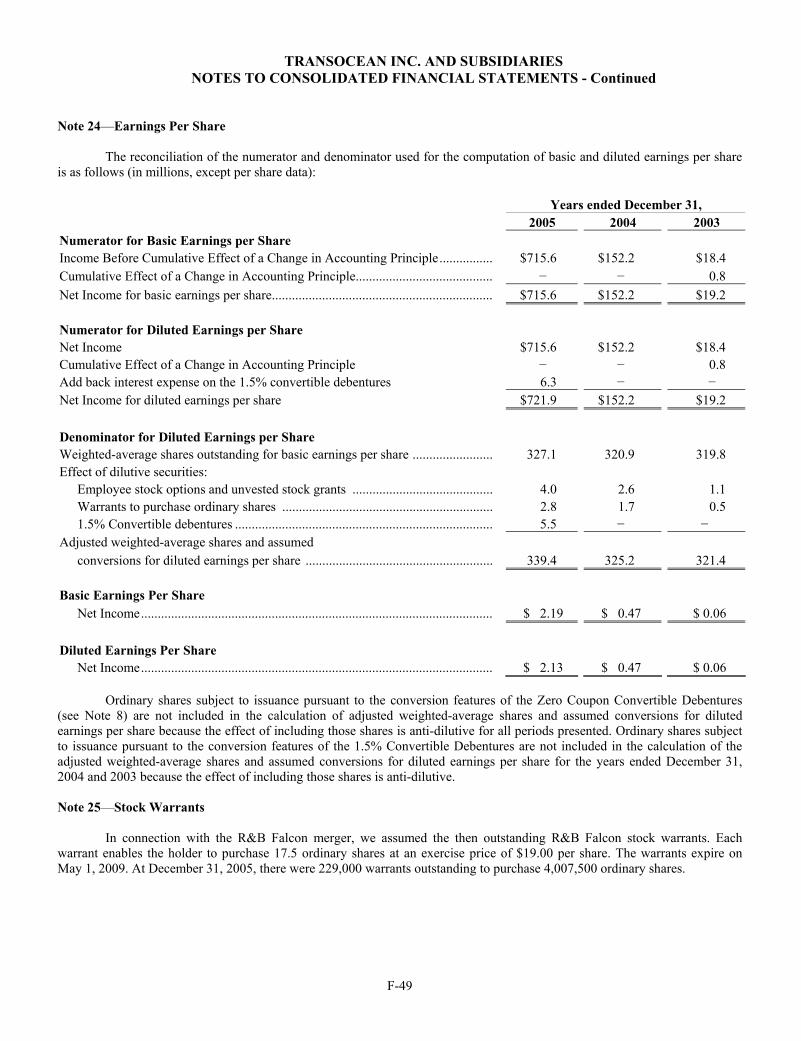
TRANSOCEAN INC. AND SUBSIDIARIES NOTES TO CONSOLIDATED FINANCIAL STATEMENTS - Continued
F-49
Note 24—Earnings Per Share
The reconciliation of the numerator and denominator used for the computation of basic and diluted earnings per shareis as follows (in millions, except per share data):
Years ended December 31, 2005 2004 2003
Numerator for Basic Earnings per ShareIncome Before Cumulative Effect of a Change in Accounting Principle................ $715.6 $152.2 $18.4 Cumulative Effect of a Change in Accounting Principle......................................... − − 0.8 Net Income for basic earnings per share.................................................................. $715.6 $152.2 $19.2
Numerator for Diluted Earnings per Share Net Income $715.6 $152.2 $18.4 Cumulative Effect of a Change in Accounting Principle − − 0.8 Add back interest expense on the 1.5% convertible debentures 6.3 − −Net Income for diluted earnings per share $721.9 $152.2 $19.2
Denominator for Diluted Earnings per ShareWeighted-average shares outstanding for basic earnings per share ........................ 327.1 320.9 319.8 Effect of dilutive securities:
Employee stock options and unvested stock grants .......................................... 4.0 2.6 1.1 Warrants to purchase ordinary shares ............................................................... 2.8 1.7 0.5 1.5% Convertible debentures ............................................................................. 5.5 − −
Adjusted weighted-average shares and assumed conversions for diluted earnings per share ........................................................ 339.4 325.2 321.4
Basic Earnings Per Share Net Income......................................................................................................... $ 2.19 $ 0.47 $ 0.06
Diluted Earnings Per ShareNet Income......................................................................................................... $ 2.13 $ 0.47 $ 0.06
Ordinary shares subject to issuance pursuant to the conversion features of the Zero Coupon Convertible Debentures (see Note 8) are not included in the calculation of adjusted weighted-average shares and assumed conversions for diluted earnings per share because the effect of including those shares is anti-dilutive for all periods presented. Ordinary shares subjectto issuance pursuant to the conversion features of the 1.5% Convertible Debentures are not included in the calculation of the adjusted weighted-average shares and assumed conversions for diluted earnings per share for the years ended December 31, 2004 and 2003 because the effect of including those shares is anti-dilutive.
Note 25—Stock Warrants
In connection with the R&B Falcon merger, we assumed the then outstanding R&B Falcon stock warrants. Eachwarrant enables the holder to purchase 17.5 ordinary shares at an exercise price of $19.00 per share. The warrants expire onMay 1, 2009. At December 31, 2005, there were 229,000 warrants outstanding to purchase 4,007,500 ordinary shares.
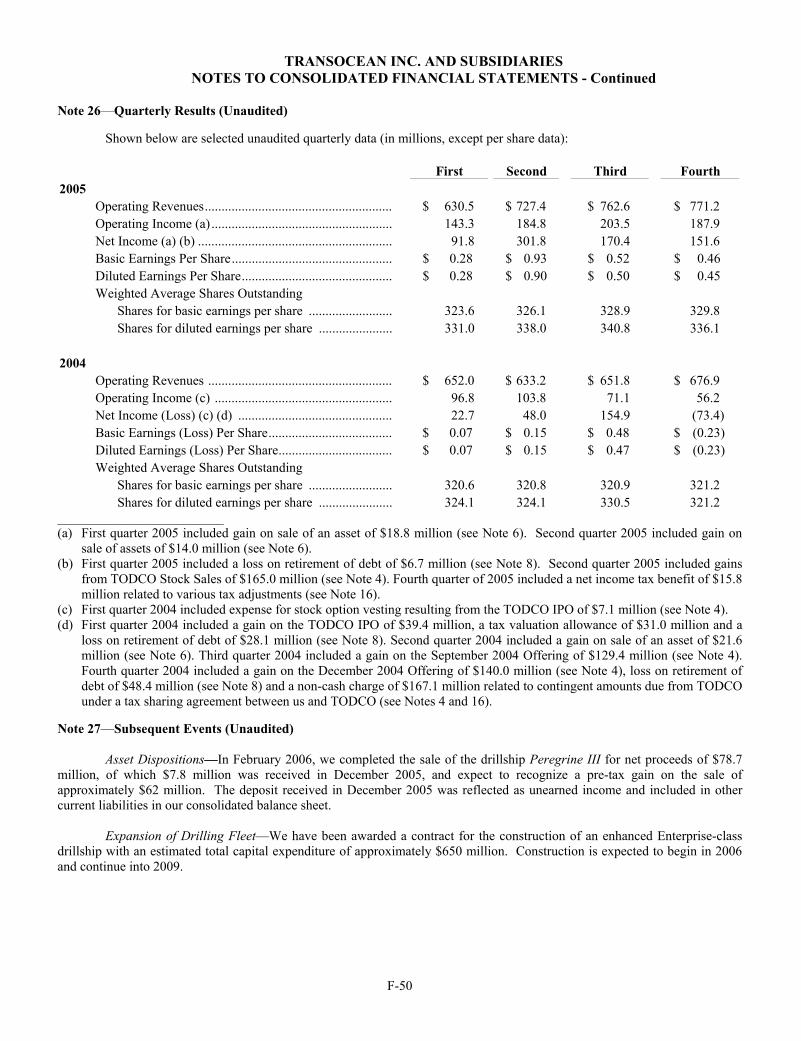
TRANSOCEAN INC. AND SUBSIDIARIES NOTES TO CONSOLIDATED FINANCIAL STATEMENTS - Continued
F-50
Note 26—Quarterly Results (Unaudited)
Shown below are selected unaudited quarterly data (in millions, except per share data):
First Second Third Fourth 2005
Operating Revenues........................................................ $ 630.5 $ 727.4 $ 762.6 $ 771.2 Operating Income (a) ...................................................... 143.3 184.8 203.5 187.9 Net Income (a) (b) .......................................................... 91.8 301.8 170.4 151.6 Basic Earnings Per Share................................................ $ 0.28 $ 0.93 $ 0.52 $ 0.46 Diluted Earnings Per Share............................................. $ 0.28 $ 0.90 $ 0.50 $ 0.45 Weighted Average Shares Outstanding
Shares for basic earnings per share ......................... 323.6 326.1 328.9 329.8 Shares for diluted earnings per share ...................... 331.0 338.0 340.8 336.1
2004Operating Revenues ....................................................... $ 652.0 $ 633.2 $ 651.8 $ 676.9 Operating Income (c) ..................................................... 96.8 103.8 71.1 56.2 Net Income (Loss) (c) (d) .............................................. 22.7 48.0 154.9 (73.4) Basic Earnings (Loss) Per Share..................................... $ 0.07 $ 0.15 $ 0.48 $ (0.23) Diluted Earnings (Loss) Per Share.................................. $ 0.07 $ 0.15 $ 0.47 $ (0.23) Weighted Average Shares Outstanding
Shares for basic earnings per share ......................... 320.6 320.8 320.9 321.2 Shares for diluted earnings per share ...................... 324.1 324.1 330.5 321.2
_________________________(a) First quarter 2005 included gain on sale of an asset of $18.8 million (see Note 6). Second quarter 2005 included gain on
sale of assets of $14.0 million (see Note 6). (b) First quarter 2005 included a loss on retirement of debt of $6.7 million (see Note 8). Second quarter 2005 included gains
from TODCO Stock Sales of $165.0 million (see Note 4). Fourth quarter of 2005 included a net income tax benefit of $15.8million related to various tax adjustments (see Note 16).
(c) First quarter 2004 included expense for stock option vesting resulting from the TODCO IPO of $7.1 million (see Note 4). (d) First quarter 2004 included a gain on the TODCO IPO of $39.4 million, a tax valuation allowance of $31.0 million and a
loss on retirement of debt of $28.1 million (see Note 8). Second quarter 2004 included a gain on sale of an asset of $21.6 million (see Note 6). Third quarter 2004 included a gain on the September 2004 Offering of $129.4 million (see Note 4).Fourth quarter 2004 included a gain on the December 2004 Offering of $140.0 million (see Note 4), loss on retirement of debt of $48.4 million (see Note 8) and a non-cash charge of $167.1 million related to contingent amounts due from TODCO under a tax sharing agreement between us and TODCO (see Notes 4 and 16).
Note 27—Subsequent Events (Unaudited)
Asset Dispositions—In February 2006, we completed the sale of the drillship Peregrine III for net proceeds of $78.7million, of which $7.8 million was received in December 2005, and expect to recognize a pre-tax gain on the sale of approximately $62 million. The deposit received in December 2005 was reflected as unearned income and included in other current liabilities in our consolidated balance sheet.
Expansion of Drilling Fleet—We have been awarded a contract for the construction of an enhanced Enterprise-class drillship with an estimated total capital expenditure of approximately $650 million. Construction is expected to begin in 2006and continue into 2009.
F-51
ITEM 9. Changes in and Disagreements with Accountants on Accounting and Financial Disclosure
We have not had a change in or disagreement with our accountants within 24 months prior to the date of our most recent financial statements or in any period subsequent to such date.
ITEM 9A. Controls and Procedures
In accordance with Exchange Act Rules 13a-15 and 15d-15, we carried out an evaluation, under the supervisionand with the participation of management, including our Chief Executive Officer and Chief Financial Officer, of the effectiveness of our disclosure controls and procedures as of the end of the period covered by this report. Based on thatevaluation, our Chief Executive Officer and Chief Financial Officer concluded that our disclosure controls and procedures were effective as of December 31, 2005 to provide reasonable assurance that information required to be disclosed in our reports filed or submitted under the Exchange Act (i) accumulated and communicated to our management, including ourChief Executive Officer and our Chief Financial Officer, to allow timely decisions regarding required disclosure and (ii) recorded, processed, summarized and reported within the time periods specified in the Securities and ExchangeCommission’s rules and forms.
Pursuant to our efforts relating to Section 404 of the Sarbanes-Oxley Act, we made certain changes to our internal controls over financial reporting during the quarter ended December 31, 2005 that we believe better align these controlswith the Section 404 requirements. However, there were no changes in these internal controls during that quarter that havematerially affected, or are reasonably likely to materially affect, our internal controls over financial reporting.
See “Management’s Report on Internal Control Over Financial Reporting” and “Report of Independent RegisteredPublic Accounting Firm on Internal Control over Financial Reporting” included in Item 8 of this Annual Report.
ITEM 9B. Other Information
None
PART III
ITEM 10. Directors and Executive Officers of the Registrant
ITEM 11. Executive Compensation
ITEM 12. Security Ownership of Certain Beneficial Owners and Management and Related Shareholder Matters
ITEM 13. Certain Relationships and Related Transactions
ITEM 14. Principal Accounting Fees and Services
The information required by Items 10, 11, 12, 13 and 14 is incorporated herein by reference to our definitive proxy statement for our 2006 annual general meeting of shareholders, which will be filed with the Securities and ExchangeCommission pursuant to Regulation 14A under the Securities Exchange Act of 1934 within 120 days of December 31, 2005. Certain information with respect to our executive officers is set forth in Item 4 of this annual report under the caption“Executive Officers of the Registrant.”
F-52
PART IV
ITEM 15. Exhibits and Financial Statement Schedules
(a) Index to Financial Statements, Financial Statement Schedules and Exhibits
(1) Financial Statements Page
Included in Part II of this report: Management’s Report on Internal Control Over Financial Reporting ...................... F-1 Report of Independent Registered Public Accounting Firm on
Internal Control over Financial Reporting ........................................................... F-2 Report of Independent Registered Public Accounting Firm...................................... F-3
Consolidated Statements of Operations..................................................................... F-4 Consolidated Statements of Comprehensive Income ................................................ F-5
Consolidated Balance Sheets..................................................................................... F-6 Consolidated Statements of Equity............................................................................ F-7 Consolidated Statements of Cash Flows.................................................................... F-8 Notes to Consolidated Financial Statements ............................................................. F-10
Financial statements of unconsolidated subsidiaries are not presented herein because such subsidiaries do not meet the significance test.
(2) Financial Statement Schedules
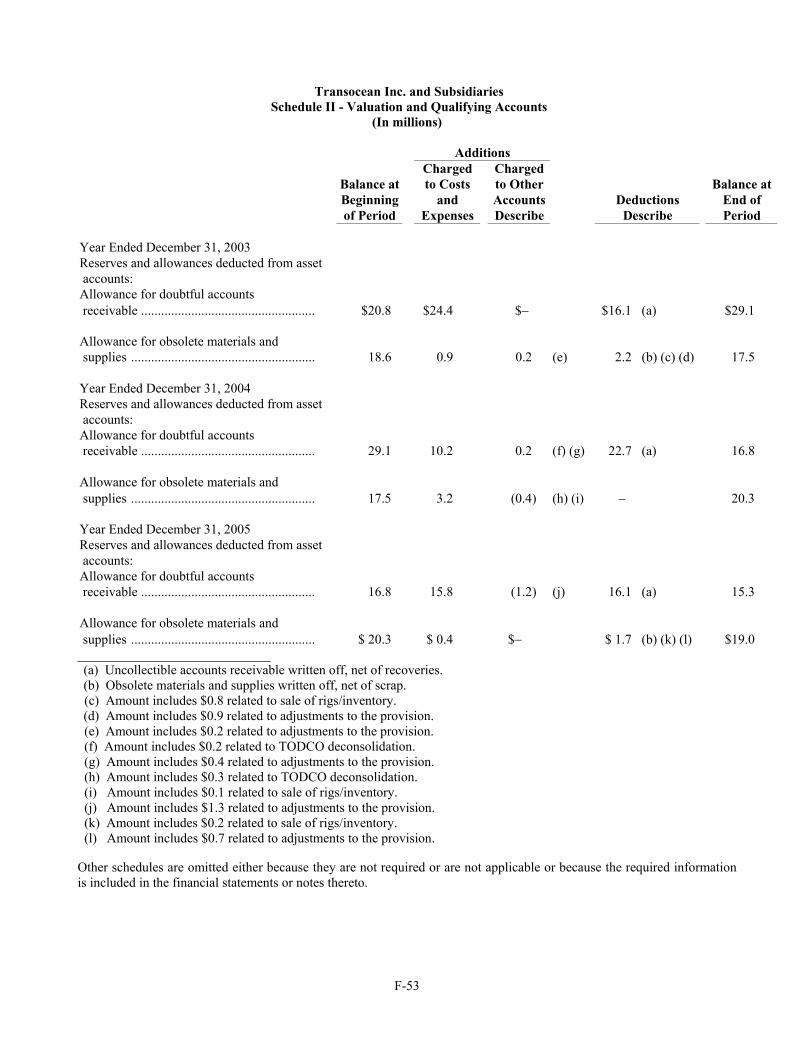
F-53
Transocean Inc. and Subsidiaries Schedule II - Valuation and Qualifying Accounts
(In millions)
Additions Charged Charged
Balance at to Costs to Other Balance at Beginning and Accounts Deductions End of of Period Expenses Describe Describe Period
Year Ended December 31, 2003 Reserves and allowances deducted from asset accounts: Allowance for doubtful accounts receivable .................................................... $20.8 $24.4 $− $16.1 (a) $29.1
Allowance for obsolete materials and supplies ....................................................... 18.6 0.9 0.2 (e) 2.2 (b) (c) (d) 17.5
Year Ended December 31, 2004 Reserves and allowances deducted from asset accounts: Allowance for doubtful accounts receivable .................................................... 29.1 10.2 0.2 (f) (g) 22.7 (a) 16.8
Allowance for obsolete materials and supplies ....................................................... 17.5 3.2 (0.4) (h) (i) − 20.3
Year Ended December 31, 2005 Reserves and allowances deducted from asset accounts: Allowance for doubtful accounts receivable .................................................... 16.8 15.8 (1.2) (j) 16.1 (a) 15.3
Allowance for obsolete materials and supplies ....................................................... $ 20.3 $ 0.4 $− $ 1.7 (b) (k) (l) $19.0
_____________________________(a) Uncollectible accounts receivable written off, net of recoveries. (b) Obsolete materials and supplies written off, net of scrap.
(c) Amount includes $0.8 related to sale of rigs/inventory.(d) Amount includes $0.9 related to adjustments to the provision.
(e) Amount includes $0.2 related to adjustments to the provision. (f) Amount includes $0.2 related to TODCO deconsolidation. (g) Amount includes $0.4 related to adjustments to the provision. (h) Amount includes $0.3 related to TODCO deconsolidation. (i) Amount includes $0.1 related to sale of rigs/inventory. (j) Amount includes $1.3 related to adjustments to the provision. (k) Amount includes $0.2 related to sale of rigs/inventory. (l) Amount includes $0.7 related to adjustments to the provision.
Other schedules are omitted either because they are not required or are not applicable or because the required informationis included in the financial statements or notes thereto.
F-54
(3) Exhibits
The following exhibits are filed in connection with this Report:
Number Description
2.1 Agreement and Plan of Merger dated as of August 19, 2000 by and among Transocean Inc., Transocean HoldingsInc., TSF Delaware Inc. and R&B Falcon Corporation (incorporated by reference to Annex A to the Joint ProxyStatement/Prospectus dated October 30, 2000 included in a 424(b)(3) prospectus filed by the Company onNovember 1, 2000)
2.2 Agreement and Plan of Merger dated as of July 12, 1999 among Schlumberger Limited, Sedco Forex HoldingsLimited, Transocean Offshore Inc. and Transocean SF Limited (incorporated by reference to Annex A to the Joint Proxy Statement/Prospectus dated October 27, included in a 424(b)(3) prospectus filed by the Company onNovember 1, 2000)
2.3 Distribution Agreement dated as of July 12, 1999 between Schlumberger Limited and Sedco Forex Holdings Limited (incorporated by reference to Annex B to the Joint Proxy Statement/Prospectus dated October 27,included in a 424(b)(3) prospectus filed by the Company on November 1, 2000)
2.4 Agreement and Plan of Merger and Conversion dated as of March 12, 1999 between Transocean Offshore Inc. andTransocean Offshore (Texas) Inc. (incorporated by reference to Exhibit 2.1 to the Registration Statement on FormS-4 of Transocean Offshore (Texas) Inc. filed on April 8, 1999 (Registration No. 333-75899))
3.1 Memorandum of Association of Transocean Sedco Forex Inc., as amended (incorporated by reference to Annex Eto the Joint Proxy Statement/Prospectus dated October 30, 2000 included in a 424(b)(3) prospectus filed by the Company on November 1, 2000)
3.2 Articles of Association of Transocean Sedco Forex Inc., as amended (incorporated by reference to Annex F to theJoint Proxy Statement/Prospectus dated October 30, 2000 included in a 424(b)(3) prospectus filed by the Company on November 1, 2000)
3.3 Certificate of Incorporation on Change of Name to Transocean Inc. (incorporated by reference to Exhibit 3.3 tothe Company’s Form 10-Q for the quarter ended June 30, 2002)
4.1 Indenture dated as of April 15, 1997 between the Company and Texas Commerce Bank National Association, as trustee (incorporated by reference to Exhibit 4.1 to the Company's Form 8-K dated April 29, 1997)
4.2 First Supplemental Indenture dated as of April 15, 1997 between the Company and Texas Commerce BankNational Association, as trustee, supplementing the Indenture dated as of April 15, 1997 (incorporated byreference to Exhibit 4.2 to the Company's Form 8-K dated April 29, 1997)
4.3 Second Supplemental Indenture dated as of May 14, 1999 between the Company and Chase Bank of Texas,National Association, as trustee (incorporated by reference to Exhibit 4.5 to the Company's Post-Effective Amendment No. 1 to Registration Statement on Form S-3 (Registration No. 333-59001-99))
4.4 Third Supplemental Indenture dated as of May 24, 2000 between the Company and Chase Bank of Texas,National Association, as trustee (incorporated by reference to Exhibit 4.1 to the Company's Current Report onForm 8-K filed on May 24, 2000)
4.5 Fourth Supplemental Indenture dated as of May 11, 2001 between the Company and The Chase Manhattan Bank (incorporated by reference to Exhibit 4.3 to the Company's Quarterly Report on Form 10-Q for the quarter ended March 31, 2001)
F-55
4.6 Form of 7.45% Notes due April 15, 2027 (incorporated by reference to Exhibit 4.3 to the Company's Form 8-K dated April 29, 1997)
4.7 Form of 8.00% Debentures due April 15, 2027 (incorporated by reference to Exhibit 4.4 to the Company's Form8-K dated April 19, 1997)
4.8 Form of Zero Coupon Convertible Debenture due May 24, 2020 between the Company and Chase Bank of Texas,National Association, as trustee (incorporated by reference to Exhibit 4.1 to the Company's Current Report onForm 8-K filed on May 24, 2000)
4.9 Form of 1.5% Convertible Debenture due May 15, 2021 (incorporated by reference to Exhibit 4.2 to the Company's Current Report on Form 8-K dated May 8, 2001)
4.10 Form of 6.625% Note due April 15, 2011 (incorporated by reference to Exhibit 4.3 to the Company's Current Report on Form 8-K dated March 30, 2001)
4.11 Form of 7.5% Note due April 15, 2031 (incorporated by reference to Exhibit 4.3 to the Company's Current Reporton Form 8-K dated March 30, 2001)
4.12 Officers' Certificate establishing the terms of the 6.50% Notes due 2003, 6.75% Notes due 2005, 6.95% Notes due 2008, 7.375% Notes due 2018, 9.125% Notes due 2003 and 9.50% Notes due 2008 (incorporated by reference toExhibit 4.13 to the Company's Annual Report on Form 10-K for the fiscal year ended December 31, 2001)
4.13 Officers' Certificate establishing the terms of the 7.375% Notes due 2018 (incorporated by reference to Exhibit4.14 to the Company's Annual Report on Form 10-K for the fiscal year ended December 31, 2001)
4.14 Warrant Agreement, including form of Warrant, dated April 22, 1999 between R&B Falcon and American Stock Transfer & Trust Company (incorporated by reference to Exhibit 4.1 to R&B Falcon's Registration Statement No.333-81181 on Form S-3 dated June 21, 1999)
4.15 Supplement to Warrant Agreement dated January 31, 2001 among Transocean Sedco Forex Inc., R&B Falcon Corporation and American Stock Transfer & Trust Company (incorporated by reference to Exhibit 4.28 to the Company's Annual Report on Form 10-K for the year ended December 31, 2000)
4.16 Supplement to Warrant Agreement dated September 14, 2005 between Transocean Inc. and The Bank of NewYork (incorporated by reference to Exhibit 4.3 to our Post-Effective Amendment No. 3 on Form S-3 to Form S-4 filed on November 18, 2005)
4.17 Registration Rights Agreement dated April 22, 1999 between R&B Falcon and American Stock Transfer & TrustCompany (incorporated by reference to Exhibit 4.2 to R&B Falcon's Registration Statement No. 333-81181 onForm S-3 dated June 21, 1999)
4.18 Supplement to Registration Rights Agreement dated January 31, 2001 between Transocean Sedco Forex Inc. and R&B Falcon Corporation (incorporated by reference to Exhibit 4.30 to the Company's Annual Report on Form 10-K for the year ended December 31, 2000)
4.19 Revolving Credit Agreement dated December 16, 2003 among Transocean Inc., the lenders party thereto, Suntrust Bank, as administrative agent, Citibank, N.A. and Bank of America, N.A., as co-syndication agents, The Royal Bank of Scotland plc and Bank One, NA, as co-documentation agents, Wells Fargo Bank, N.A. and UBS LoanFinance LLC, as managing agents, The Bank of New York, Den Norske Bank ASA and HSBC Bank USA, as co-agents, and Citigroup Global Markets Inc. and Suntrust Capital Markets, Inc., as co-lead arrangers (incorporatedby reference to Exhibit 4.25 to our Annual Report on Form 10-K for the year ended December 31, 2003)
4.20 Revolving Credit Agreement, dated as of July 8, 2005, among Transocean Inc., the lenders from time to time party thereto, Citibank, N.A., Bank of America, N.A., JPMorgan Chase Bank, N.A., The Royal Bank of Scotland plc
F-56
and SunTrust Bank (incorporated by reference to Exhibit 4.1 to our Current Report on Form 8-K filed on July 13, 2005)
10.1 Tax Sharing Agreement between Sonat Inc. and Sonat Offshore Drilling Inc. dated June 3, 1993 (incorporated byreference to Exhibit 10-(3) to the Company's Form 10-Q for the quarter ended June 30, 1993)
*10.2 Performance Award and Cash Bonus Plan of Sonat Offshore Drilling Inc. (incorporated by reference to Exhibit10-(5) to the Company's Form 10-Q for the quarter ended June 30, 1993)
*10.3 Form of Sonat Offshore Drilling Inc. Executive Life Insurance Program Split Dollar Agreement and CollateralAssignment Agreement (incorporated by reference to Exhibit 10-(9) to the Company's Form 10-K for the year ended December 31, 1993)
*10.4 Amended and Restated Employee Stock Purchase Plan of Transocean Inc. (incorporated by reference to Exhibit 10.1 to the Company's Current Report on Form 8-K dated May 16, 2005)
*10.5 Amended and Restated Long-Term Incentive Plan of Transocean Inc. (incorporated by reference to Appendix B to the Company’s Proxy Statement dated March 19, 2004)
*10.6 Form of Employment Agreement dated May 14, 1999 between J. Michael Talbert, Robert L. Long, Eric B. Brown and Barbara S. Wood, individually, and the Company (incorporated by reference to Exhibit 10.1 to the Company's Form 10-Q for the quarter ended June 30, 1999)
*10.7 Deferred Compensation Plan of Transocean Offshore Inc., as amended and restated effective January 1, 2000(incorporated by reference to Exhibit 10.10 to the Company's Annual Report on Form 10-K for the year endedDecember 31, 1999)
*10.8 Amendment to Transocean Inc. Deferred Compensation Plan (incorporate by reference to Exhibit 10.1 to our Current Report on Form 8-K filed on December 29, 2005)
*10.9 Sedco Forex Employees Option Plan of Transocean Sedco Forex Inc. effective December 31, 1999 (incorporated by reference to Exhibit 4.5 to the Company's Registration Statement on Form S-8 (Registration No. 333-94569)filed January 12, 2000)
*10.10 Employment Agreement dated September 22, 2000 between J. Michael Talbert and Transocean OffshoreDeepwater Drilling Inc. (incorporated by reference to Exhibit 10.1 to the Company's Form 10-Q for the quarter ended September 30, 2000)
*10.11 Agreement dated October 10, 2002 by and among Transocean Inc., Transocean Offshore Deepwater Drilling Inc. and J. Michael Talbert (incorporated by reference to Exhibit 99.2 to the Company’s Current Report on Form 8-K dated October 10, 2002)
*10.12 Employment Agreement dated September 17, 2000 between Robert L. Long and Transocean Offshore Deepwater Drilling Inc. (incorporated by reference to Exhibit 10.3 to the Company's Form 10-Q for the quarter endedSeptember 30, 2000)
*10.13 Agreement dated May 9, 2002 by and among Transocean Offshore Deepwater Drilling Inc. and Robert L. Long(incorporated by reference to Exhibit 99.4 to the Company’s Current Report on Form 8-K dated October 10, 2002)
*10.14 Employment Agreement dated September 20, 2000 between Eric B. Brown and Transocean Offshore Deepwater Drilling Inc. (incorporated by reference to Exhibit 10.6 to the Company's Form 10-Q for the quarter endedSeptember 30, 2000)
*10.15 Employment Agreement dated October 4, 2000 between Barbara S. Wood and Transocean Offshore Deepwater Drilling Inc. (incorporated by reference to Exhibit 10.7 to the Company's Form 10-Q for the quarter endedSeptember 30, 2000)
F-57
*10.16 Employment Agreement dated July 15, 2002 by and among R&B Falcon Corporation, R&B Falcon Management Services, Inc. and Jan Rask (incorporated by reference to Exhibit 10.1 to the Company’s Form 10-Q for thequarter ended June 30, 2002)
*10.17 Amendment No. 1 dated December 12, 2003 to the Employment Agreement dated July 15, 2002 by and amongJan Rask, R&B Falcon Management Services, Inc. and R&B Falcon Corporation (incorporated by reference toExhibit 10.8 to TODCO’s Registration Statement No. 333-101921 on Form S-1 dated February 3, 2004)
*10.18 1992 Long-Term Incentive Plan of Reading & Bates Corporation (incorporated by reference to Exhibit B toReading & Bates' Proxy Statement dated April 27, 1992)
*10.19 1995 Long-Term Incentive Plan of Reading & Bates Corporation (incorporated by reference to Exhibit 99.A toReading & Bates' Proxy Statement dated March 29, 1995)
*10.20 1995 Director Stock Option Plan of Reading & Bates Corporation (incorporated by reference to Exhibit 99.B toReading & Bates' Proxy Statement dated March 29, 1995)
*10.21 1997 Long-Term Incentive Plan of Reading & Bates Corporation (incorporated by reference to Exhibit 99.A toReading & Bates' Proxy Statement dated March 18, 1997)
*10.22 1998 Employee Long-Term Incentive Plan of R&B Falcon Corporation (incorporated by reference to Exhibit99.A to R&B Falcon's Proxy Statement dated April 23,1998)
*10.23 1998 Director Long-Term Incentive Plan of R&B Falcon Corporation (incorporated by reference to Exhibit 99.Bto R&B Falcon's Proxy Statement dated April 23,1998)
*10.24 1999 Employee Long-Term Incentive Plan of R&B Falcon Corporation (incorporated by reference to Exhibit99.A to R&B Falcon's Proxy Statement dated April 13, 1999)
*10.25 1999 Director Long-Term Incentive Plan of R&B Falcon Corporation (incorporated by reference to Exhibit 99.Bto R&B Falcon's Proxy Statement dated April 13, 1999)
10.26 Memorandum of Agreement dated November 28, 1995 between Reading and Bates, Inc., a subsidiary of Reading & Bates Corporation, and Deep Sea Investors, L.L.C. (incorporated by reference to Exhibit 10.110 to Reading & Bates' Annual Report on Form 10-K for 1995)
10.27 Amended and Restated Bareboat Charter dated July 1, 1998 to Bareboat Charter M. G. Hulme, Jr. datedNovember 28, 1995 between Deep Sea Investors, L.L.C. and Reading & Bates Drilling Co., a subsidiary ofReading & Bates Corporation (incorporated by reference to Exhibit 10.177 to R&B Falcon's Annual Report onForm 10-K for the year ended December 31, 1998)
10.28 Master Separation Agreement dated February 4, 2004 by and among Transocean Inc., Transocean Holdings Inc.and TODCO (incorporated by reference to Exhibit 99.2 to the Company’s Current Report on Form 8-K datedMarch 2, 2004)
10.29 Tax Sharing Agreement dated February 4, 2004 between Transocean Holdings Inc. and TODCO (incorporated by reference to Exhibit 99.3 to the Company’s Current Report on Form 8-K dated March 2, 2004)
*10.30 Executive Severance Benefit of Transocean Inc. effective February 9, 2005 (incorporated by reference to Exhibit10.1 to our Current Report on Form 8-K filed on February 15, 2005)
*10.31 Form of 2004 Performance-Based Nonqualified Share Option Award Letter (incorporated by reference to Exhibit 10.2 to our Current Report on Form 8-K filed on February 15, 2005)
F-58
*10.32 Form of 2004 Employee Contingent Restricted Ordinary Share Award (incorporated by reference to Exhibit 10.3to our Current Report on Form 8-K filed on February 15, 2005)
*10.33 Form of 2004 Director Deferred Unit Award (incorporated by reference to Exhibit 10.4 to our Current Report onForm 8-K filed on February 15, 2005)
*10.34 Performance Award and Cash Bonus Plan of Transocean Inc. (incorporated by reference to Exhibit 10.5 to ourCurrent Report on Form 8-K filed on February 15, 2005)
*10.35 Description of Annual Cash Bonuses for Certain Executive Officers (incorporated by reference to Item 1.01 of theCompany’s Current Report on Form 8-K filed on February 14, 2006)
*10.36 Description of Director Compensation (incorporated by reference to Item 1.01 of the Company’s Current Reporton Form 8-K filed on February 15, 2005)
*10.37 Description of Director Compensation (incorporated by reference to Item 1.01 of the Company’s Current Reporton Form 8-K filed on February 14, 2006)
†*10.38 Description of Base Salaries of Certain Executive Officers
*10.39 Executive Change of Control Severance Benefit (incorporated by reference to Exhibit 10.1 to our Current Reporton Form 8-K filed on July 19, 2005)
†21 Subsidiaries of the Company
†23.1 Consent of Ernst & Young LLP
†24 Powers of Attorney
†31.1 CEO Certification Pursuant to Section 302 of the Sarbanes-Oxley Act of 2002
†31.2 CFO Certification Pursuant to Section 302 of the Sarbanes-Oxley Act of 2002
†32.1 CEO Certification Pursuant to Section 906 of the Sarbanes-Oxley Act of 2002
†32.2 CFO Certification Pursuant to Section 906 of the Sarbanes-Oxley Act of 2002
*Compensatory plan or arrangement.†Filed herewith.
Exhibits listed above as previously having been filed with the SEC are incorporated herein by reference pursuantto Rule 12b-32 under the Securities Exchange Act of 1934 and made a part hereof with the same effect as if filed herewith.
Certain instruments relating to our long-term debt and our subsidiaries have not been filed as exhibits since thetotal amount of securities authorized under any such instrument does not exceed 10 percent of our total assets and our subsidiaries on a consolidated basis. We agree to furnish a copy of each such instrument to the SEC upon request.
F-59
SIGNATURES
Pursuant to the requirements of Section 13 or 15(d) of the Securities Exchange Act of 1934, the registrant has duly caused this report to be signed on its behalf by the undersigned; thereunto duly authorized, on March 9,2006.
TRANSOCEAN INC. By /s/ Gregory L. Cauthen Gregory L. Cauthen Senior Vice President and Chief Financial Officer
Pursuant to the requirements of the Securities Exchange Act of 1934, this report has been signed below bythe following persons on behalf of the registrant in the capacities indicated on March 9, 2006.
Signature Title
* Chairman of the Board of Directors J. Michael Talbert
/s/ Robert L. Long President and Chief Executive Officer Robert L. Long (Principal Executive Officer)
/s/ Gregory L. Cauthen Senior Vice President and Chief Financial Officer Gregory L. Cauthen (Principal Financial Officer)
/s/ David A. Tonnel Vice President and Controller David A. Tonnel (Principal Accounting Officer)
* Director Victor E. Grijalva
* Director Judy J. Kelly
* Director Arthur Lindenauer
* Director Martin B. McNamara
* Director Roberto Monti
F-60
Signature Title
* Director Richard A. Pattarozzi
* Director Kristian Siem
* Director Robert M. Sprague
* Director Ian C. Strachan
By /s/ William E. Turcotte William E. Turcotte
(Attorney-in-Fact)
F-61
Exhibit 31.1
CEO CERTIFICATION PURSUANT TO SECTION 302 OF THE SARBANES-OXLEY ACT OF 2002
I, Robert L. Long, certify that:
1. I have reviewed this annual report on Form 10-K of Transocean Inc.,
2. Based on my knowledge, this annual report does not contain any untrue statement of a material fact or omit tostate a material fact necessary to make the statements made, in light of the circumstances under which suchstatements were made, not misleading with respect to the period covered by this annual report;
3. Based on my knowledge, the financial statements, and other financial information included in this annual report, fairly present in all material respects the financial condition, results of operations and cash flows of the registrantas of, and for, the periods presented in this annual report;
4. The registrant’s other certifying officer and I are responsible for establishing and maintaining disclosure controls andprocedures (as defined in Exchange Act Rules 13a-15(e) and 15d-15(e)) and internal control over financial reporting (as defined in Exchange Act Rules 13a-15(f) and 15d-15(f)) for the registrant and we have:
a) designed such disclosure controls and procedures, or caused such disclosure controls and procedures tobe designed under our supervision, to ensure that material information relating to the registrant, includingits consolidated subsidiaries, is made known to us by others within those entities, particularly during theperiod in which this annual report is being prepared;
b) designed such internal control over financial reporting, or caused such internal control over financialreporting to be designed under our supervision, to provide reasonable assurance regarding the reliability offinancial reporting and the preparation of financial statements for external purposes in accordance with generally accepted accounting principles; and
c) evaluated the effectiveness of the registrant’s disclosure controls and procedures and presented in thisannual report our conclusions about the effectiveness of the disclosure controls and procedures, as of the end of the period covered by this annual report based on such evaluation; and
d) disclosed in this annual report any change in the registrant’s internal control over financial reporting that occurred during the registrant’s most recent fiscal quarter (the registrant’s fourth fiscal quarter in the case of an annual report) that has materially affected, or is reasonably likely to materially affect, theregistrant’s internal control over financial reporting; and
5. The registrant’s other certifying officer and I have disclosed, based on our most recent evaluation of internal controlover financial reporting, to the registrant’s auditors and the audit committee of registrant’s board of directors (or persons performing the equivalent function):
a) all significant deficiencies and material weaknesses in the design or operation of internal control over financial reporting which are reasonably likely to adversely affect the registrant’s ability to record, process, summarize and report financial information; and
b) any fraud, whether or not material, that involves management or other employees who have a significant role in the registrant’s internal control over financial reporting.
Date: March 9, 2006 /s/ Robert L. Long Robert L. LongPresident and Chief Executive Officer
F-62
Exhibit 31.2
CFO CERTIFICATION PURSUANT TO SECTION 302 OF THE SARBANES-OXLEY ACT OF 2002
I, Gregory L. Cauthen, certify that:
1. I have reviewed this annual report on Form 10-K of Transocean Inc.,
2. Based on my knowledge, this annual report does not contain any untrue statement of a material fact or omit tostate a material fact necessary to make the statements made, in light of the circumstances under which suchstatements were made, not misleading with respect to the period covered by this annual report;
3. Based on my knowledge, the financial statements, and other financial information included in this annual report, fairly present in all material respects the financial condition, results of operations and cash flows of the registrantas of, and for, the periods presented in this annual report;
4. The registrant’s other certifying officer and I are responsible for establishing and maintaining disclosure controlsand procedures (as defined in Exchange Act Rules 13a-15(e) and 15d-15(e)) and internal control over financialreporting (as defined in Exchange Act Rules 13a-15(f) and 15d-15(f)) for the registrant and we have:
a) designed such disclosure controls and procedures, or caused such disclosure controls and procedures tobe designed under our supervision, to ensure that material information relating to the registrant, includingits consolidated subsidiaries, is made known to us by others within those entities, particularly during theperiod in which this annual report is being prepared;
b) designed such internal control over financial reporting, or caused such internal control over financialreporting to be designed under our supervision, to provide reasonable assurance regarding the reliability offinancial reporting and the preparation of financial statements for external purposes in accordance with generally accepted accounting principles; and
c) evaluated the effectiveness of the registrant’s disclosure controls and procedures and presented in thisannual report our conclusions about the effectiveness of the disclosure controls and procedures, as of the end of the period covered by this annual report based on such evaluation; and
d) disclosed in this annual report any change in the registrant’s internal control over financial reporting thatoccurred during the registrant’s most recent fiscal quarter (the registrant’s fourth fiscal quarter in the caseof an annual report) that has materially affected, or is reasonably likely to materially affect, the registrant’sinternal control over financial reporting; and
5. The registrant’s other certifying officer and I have disclosed, based on our most recent evaluation of internalcontrol over financial reporting, to the registrant’s auditors and the audit committee of registrant’s board ofdirectors (or persons performing the equivalent function):
a) all significant deficiencies and material weaknesses in the design or operation of internal control over financial reporting which are reasonably likely to adversely affect the registrant’s ability to record, process, summarize and report financial information; and
b) any fraud, whether or not material, that involves management or other employees who have a significant role in the registrant’s internal control over financial reporting.
Date: March 9, 2006 /s/ Gregory L. Cauthen Gregory L. Cauthen Senior Vice President and Chief Financial Officer
F-63
Exhibit 32.1
CERTIFICATION PURSUANT TO SECTION 906 OF THE SARBANES-OXLEY ACT OF 2002 (SUBSECTIONS (a) AND (b)
OF SECTION 1350, CHAPTER 63 OF TITLE 18, UNITED STATES CODE)
Pursuant to Section 906 of the Sarbanes-Oxley Act of 2002 (Subsections (a) and (b) of Section 1350, Chapter 63of Title 18, United States Code), I, Robert L. Long, President and Chief Executive Officer of Transocean Inc., a CaymanIslands company (the “Company”), hereby certify, to my knowledge, that:
(1) the Company’s Annual Report on Form 10-K for the year ended December 31, 2005 (the “Report”) fully complies with the requirements of Section 13(a) or 15(d) of the Securities Exchange Act of 1934; and
(2) information contained in the Report fairly presents, in all material respects, the financial condition andresults of operations of the Company.
Dated: March 9, 2006/s/ Robert L. Long
Name: Robert L. LongPresident and Chief Executive Officer
The foregoing certification is being furnished solely pursuant to Section 906 of the Sarbanes-Oxley Act of 2002(Subsections (a) and (b) of Section 1350, Chapter 63 of Title 18, United States Code) and is not being filed as part of the Report or as a separate disclosure document.
A signed original of this written statement required by Section 906 has been provided to Transocean Inc. and will be retained by Transocean Inc. and furnished to the Securities and Exchange Commission or its staff upon request.
F-64
Exhibit 32.2
CERTIFICATION PURSUANT TO SECTION 906 OF THE SARBANES-OXLEY ACT OF 2002 (SUBSECTIONS (a) AND (b)
OF SECTION 1350, CHAPTER 63 OF TITLE 18, UNITED STATES CODE)
Pursuant to Section 906 of the Sarbanes-Oxley Act of 2002 (Subsections (a) and (b) of Section 1350, Chapter 63of Title 18, United States Code), I, Gregory L. Cauthen, Senior Vice President and Chief Financial Officer of Transocean Inc., a Cayman Islands company (the “Company”), hereby certify, to my knowledge, that:
(1) the Company’s Annual Report on Form 10-K for the year ended December 31, 2005 (the “Report”) fully complies with the requirements of Section 13(a) or 15(d) of the Securities Exchange Act of 1934; and
(2) information contained in the Report fairly presents, in all material respects, the financial condition andresults of operations of the Company.
Dated: March 9, 2006 /s/ Gregory L. Cauthen Name: Gregory L. Cauthen
Senior Vice President and Chief Financial Officer
The foregoing certification is being furnished solely pursuant to Section 906 of the Sarbanes-Oxley Act of 2002(Subsections (a) and (b) of Section 1350, Chapter 63 of Title 18, United States Code) and is not being filed as part of the Report or as a separate disclosure document.
A signed original of this written statement required by Section 906 has been provided to Transocean Inc. and willbe retained by Transocean Inc. and furnished to the Securities and Exchange Commission or its staff upon request.
B O A R D O F D I R E C T O R S
J. MICHAEL TALBERTChairmanTransocean Inc.Houston,Texas
VICTOR E. GRIJALVARetired Vice Chairman of the BoardSchlumberger LimitedNew York, New York
ARTHUR LINDENAUERRetired Executive Vice President-Finance & Chief Financial OfficerSchlumberger LimitedNew York, New York
JUDY J. KELLYRetired ExxonMobil Corporation Executive Houston,Texas
ROBERT L. LONGPresident and Chief Executive OfficerTransocean Inc.Houston,Texas
MARTIN B. MCNAMARAPartner, Gibson, Dunn & Crutcher, LLPDallas,Texas
ROBERTO L. MONTIRetired Executive Vice PresidentExploration & ProductionRepsol YPFBuenos Aires,Argentina
RICHARD A. PATTAROZZIRetired Shell Oil Company ExecutiveAbita Springs, Louisiana
KRISTIAN SIEMChairman and Chief Executive OfficerSiem Industries, Inc.George Town, Cayman Islands
ROBERT M. SPRAGUERetired Royal Dutch/Shell ExecutiveLondon, England
IAN C. STRACHANFormer ChairmanInstinet Group IncorporatedLondon, England
E X E C U T I V E O F F I C E R S
ROBERT L. LONGPresident and Chief Executive Officer
JEAN P. CAHUZACExecutive Vice President and Chief Operating Officer
ERIC B. BROWNSenior Vice President, General Counsel and Corporate Secretary
GREGORY L. CAUTHENSenior Vice President and Chief Financial Officer
STEVEN L. NEWMANSenior Vice President, Human Resources, Information ProcessSolutions and Treasury
DAVID A. TONNELVice President and Controller
C O R P O R A T E I N F O R M A T I O N
Registered Address Transocean Inc.Walker House Mary Street George Town, Grand Cayman Cayman Islands
Houston Office Transocean Inc.4 Greenway Plaza Houston,Texas 77046 713.232.7500
Transfer Agent and Registrar The Bank of New York P.O. Box 11258 Church Street Station New York, New York 10286 1.877.397.72291.212.815.3700 (for callers outside the United States)
Internet Address: http://www.stockbny.comE-mail Address: [email protected]
Direct Purchase Plan The Bank of New York, the Transfer Agent for Transocean Inc., offers a Direct Purchase and Sale Planfor the ordinary shares of Transocean Inc. called BuyDirect. For more information on BuyDirect,including a complete enrollment package, please contact the Bank of New York at 1.877.397.7229or 1.212.815.3700 for callers outside the United States.
Independent Registered Public Accounting Firm Ernst & Young LLP Houston,Texas
Stock Exchange Listing Transocean Inc. shares are listed on the New York Stock Exchange (NYSE) under the symbol RIG.The following table sets forth the high and low sales prices of the company's ordinary shares for theperiods indicated, as reported on the NYSE Composite Tape.
Price (in U.S. dollars) HIGH LOW
2004 First Quarter 31.94 23.10 Second Quarter 29.27 24.49 Third Quarter 36.24 25.94 Fourth Quarter 43.25 33.70
2005 First Quarter 51.97 39.79Second Quarter 58.19 43.16Third Quarter 63.11 53.52Fourth Quarter 70.93 52.34
Financial Information Financial analysts and shareholders desiring information about Transocean Inc. should write to theInvestor Relations and Corporate Communications Department or call 713.232.7694. Informationmay also be obtained by visiting the company’s website at http://www.deepwater.com.
NYSE Annual CEO Certification and Sarbanes-Oxley Section 302 Certifications We submitted the annual chief executive officer certification to the NYSE as required under the cor-porate governance rules of the NYSE. We also filed as an exhibit to our 2005 Annual Report onForm 10-K the chief executive officer and chief financial officer certifications required underSection 302 of the Sarbanes-Oxley Act of 2002.

www.deepwater.com
4 Greenway Plaza
Houston,TX 77046
713.232.7500
Related Documents