Working paper 2.5 6 August 2020 Group of Experts on National Accounts September 2020 Webinar on Well-being and sustainability 3 September 2020, 13:30 - 16:30 Organizers: Statistics Canada and OECD INDICATORS OF HEALTH CARE IN THE SYSTEM OF NATIONAL ACCOUNTS

Welcome message from author
This document is posted to help you gain knowledge. Please leave a comment to let me know what you think about it! Share it to your friends and learn new things together.
Transcript
Working paper 2.5
6 August 2020
Group of Experts on National Accounts
September 2020
Webinar on Well-being and sustainability 3 September 2020, 13:30 - 16:30
Organizers: Statistics Canada and OECD
INDICATORS OF HEALTH CARE IN THE SYSTEM OF
NATIONAL ACCOUNTS

Indicators of Health Care in the SystemofNationalAccounts
TaskForceontheSNAResearchAgendaSubgrouponWell‐BeingandSustainabilityAreaGrouponHealthandSocialConditions*
July 2020
* Contributions to this guidance note were made by all members of the area group on health and social conditions. Members include Ann Lisbet Brathaug (Statistics Norway), Elisabeth Hopkins (Statistics Sweden), Ciara O’Shea (Central Statistics Office Ireland), Paolo Passerini (Eurostat), Maria Pettersson (Statistics Sweden), Dylan Rassier (U.S. Bureau of Economic Analysis), Lisbeth Rivas (International Monetary Fund), and Rachel Soloveichik (U.S. Bureau of Economic Analysis).
Health and Social Conditions – July 2020 i
Contents Summary ...................................................................................................................................................... iii
1. Introduction to the Issue........................................................................................................................... 1
2. Existing Materials ...................................................................................................................................... 1
2.1. Background and Objective ................................................................................................................. 1
2.2. Scope and Framework ....................................................................................................................... 2
2.2.1. Classification of Health Care Functions ....................................................................................... 3
2.2.2. Classification of Health Care Providers ....................................................................................... 3
2.2.3. Classification of Health Care Financing Schemes ........................................................................ 4
2.3. Relationship between SHA and SNA .................................................................................................. 4
3. Options Considered for Health Care Indicators ........................................................................................ 5
3.1. Implementation within the SNA Central System ............................................................................... 5
3.1.1. Classifications of Final Consumption Expenditures .................................................................... 5
3.1.2. Health Care Products and Supply‐Use Tables ............................................................................. 6
3.1.3. Volume Measures of Health Care ............................................................................................... 9
3.1.4. Paid Long‐Term Social Care Services......................................................................................... 12
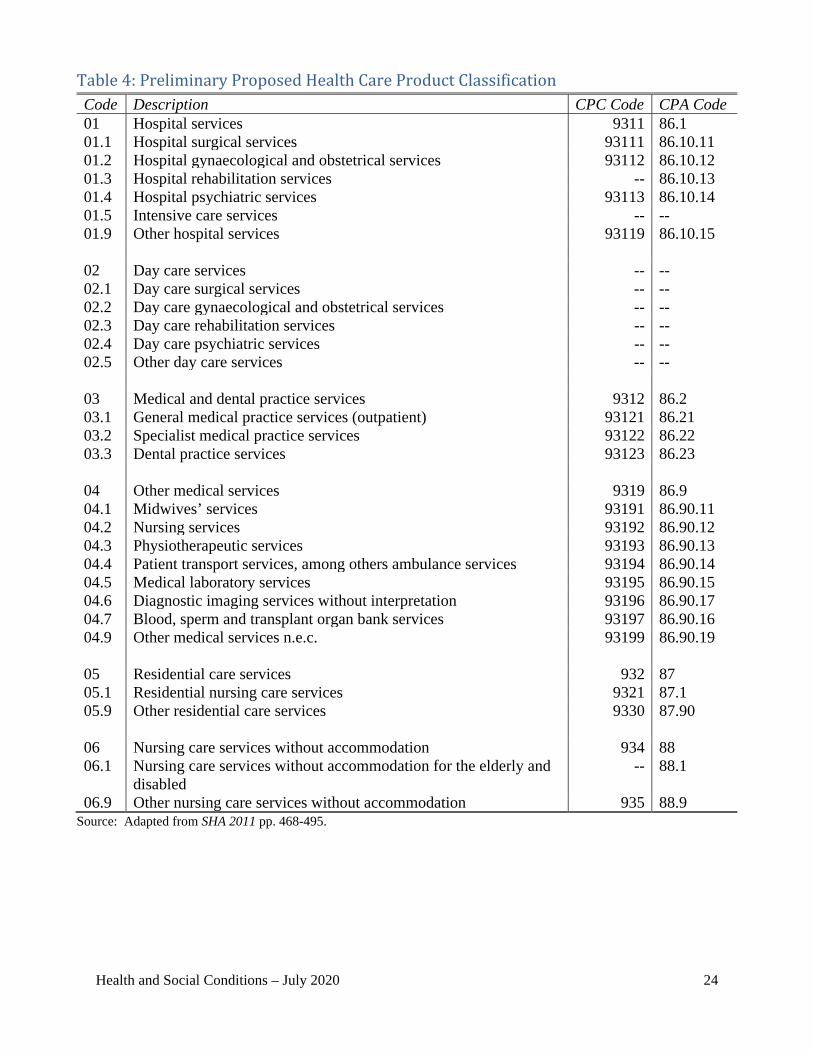
3.1.5. Occupational Health Services ................................................................................................... 13
3.2. Developments Outside the SNA Central System ............................................................................. 13
3.2.1. Supplemental Classifications for Private Health Insurance ...................................................... 13
3.2.2. Unpaid Household Production of Care ..................................................................................... 14
3.3. Health Care Indicators ..................................................................................................................... 18
3.3.1. Indicators Embedded in the SNA Core Framework .................................................................. 18
3.3.2. Indicators that are Extensions of the SNA Core Framework .................................................... 19
4. Changes Required to SNA 2008 and SHA 2011 ....................................................................................... 20
References .................................................................................................................................................. 21
Annex A: Tables .......................................................................................................................................... 22
Table 1: Classification of Health Care Functions at the First‐Digit Level ................................................ 23
Table 2: Classification of Health Care Providers at the First‐Digit Level ................................................. 23
Table 3: Classification of Health Care Financing Schemes at the First‐Digit Level.................................. 23
Table 4: Preliminary Proposed Health Care Product Classification ........................................................ 24
Table 5: Correspondence between ICHA‐HC and CPC Ver. 2.................................................................. 26
Health and Social Conditions – July 2020 ii
Table 6: Correspondence between ICHA‐HP and ISIC Rev. 4 .................................................................. 27
Table 7: Relation of Consumption to SNA and SHA Aggregates ............................................................. 28
Table 8: Own‐Use Production Work of Service Activities and Market Counterparts ............................. 28
Table 9: Questions to Identify Households Providing Health Care or Social Care ................................. 29
Table 10: Indicators Based on Final Consumption Expenditures and Capital Formation ....................... 30
Annex B: Summary of Recommendations ................................................................................................. 31
Health and Social Conditions – July 2020 iii
Summary The objective of this guidance note is to consider options for indicators of health care that can either be embedded in the core framework of the System of National Accounts 2008 (SNA 2008) or provide extensions of the core framework as a way to expand official measures of well-being. A System of Health Accounts 2011 (SHA 2011) is a well-developed framework for classifying health expenditures by function, provider, and financing schemes, and it serves as the foundation for achieving this objective. The note distinguishes options to be implemented within the SNA central system from those to be developed outside the central system.i Options to be implemented within the SNA central system include: 1) updating and harmonizing classifications between the SNA and SHA, 2) identifying products relevant for meaningful measures of health care and developing health care supply-use tables with enough detail for policy relevance, 3) quality-adjusted measures of health care volumes, and 4) inclusion of paid long-term social care services in addition to health care services. Options to be developed outside the SNA central system include: 1) classification breakdowns for private health insurance claims and premiums and 2) expansion of the SNA production boundary to include unpaid household production of health care and long-term social care. Indicators for health care can be built from SHA expenditure flow data. Indicators that can be embedded in the SNA core framework include those based on final consumption expenditures with breakdowns by function, provider, and financing schemes that can be cross tabulated. Indicators that can provide extensions of the SNA core framework include those based on physical measures such as employment as well as those based on supplemental classifications of private health insurance and unpaid household production of health care and long-term social care. Recommendations are summarized in Annex B of the note, and they support changes or supplements to SNA 2008. The two primary changes required to SNA 2008 are: 1) current classifications (or more updated classifications) for functions and providers from the SHA need to be introduced to the SNA and 2) own-account production of occupational health services that is currently included in compensation of employees should be imputed as secondary output and allocated to intermediate consumption. The two primary supplements to SNA 2008 are: 1) the production boundary should be expanded to include imputed values for unpaid household production of health care and long-term social care and 2) supplementary supply-use tables for health care and long-term social care should be created from the SNA core supply-use tables. If supplemental indicators based on private health insurance are a goal, then relevant distinctions for health insurance should also be defined as a supplement to SNA 2008. If complete harmonization of SHA 2011 and SNA 2008 is also a goal, the following three changes are required for SHA 2011: 1) the SHA capital account needs to recognize expenditures on R&D in health as capital formation, 2) manufacturers of health goods need to be included in the SHA provider classification and retailers’ output measures need to be limited to their trade margins rather than treating their purchases of goods as intermediate consumption, and 3) the treatment of occupational health services and the valuation of unpaid household work need to be aligned with the SNA.
i The “SNA central system” includes all features of national accounts such as classification, boundaries, current cost concepts, and the accounting structure. The “SNA core framework” includes only features of the accounting structure.
Health and Social Conditions – July 2020 1
1. Introduction to the Issue 1. A well-rounded picture of a country’s economy should include data that enables policymakers and other users of official statistics to assess resources committed to health care and real output of health care. The objective of this guidance note is to consider options for indicators of health care that can either be embedded in the core framework of the System of National Accounts 2008 (SNA 2008) or provide extensions of the core framework as a way to expand official measures of well-being. A System of Health Accounts 2011 (SHA 2011) is a well-developed framework for classifying health expenditures by function, provider, and financing schemes, and it serves as the foundation for achieving this objective. 2. A number of questions come to mind for this purpose:
What classifications yield the most relevant details for health care in a national accounting context?
What products are relevant to construct meaningful indicators of health care? What detail could be introduced to supply-use tables to generate more policy-relevant
indicators and do source data provide the requested detail? How should volumes of health services be measured in light of quality differences? Should national accounts boundaries be extended to include unpaid household production
of health care, or should unpaid household production at least be measured given its implications for government policy to promote well-being?
To what extent should national accounts include social care services separate from health care services to cover a broader part of well-being?
3. The SNA is the primary statistical framework that supports policymaking and other purposes. As measures of well-being become more important to decision making, the relevance of macroeconomic statistics depends on the ability to adapt the SNA and develop a more comprehensive framework to meet the evolving needs of policymakers and other users.
2. Existing Materials
2.1. Background and Objective 4. A System of Health Accounts 2011 (SHA 2011) is a result of a joint cooperation among the Organization for Economic Cooperation and Development (OECD), World Health Organization (WHO), and Eurostat, and it builds on the first edition of A System of Health Accounts (OECD 2000), the Guide to Producing National Health Accounts (WHO, World Bank, and USAID 2003), and the SHA Guidelines (Eurostat and UK Office for National Statistics 2003). The first edition of the SHA is described in paragraphs 29.128-29.142 of SNA 2008. The SHA methodology was revised in 2011. 5. The background for setting up the health accounts is described in SHA 2011 as follows:
Health and Social Conditions – July 2020 2
“Health accounts provide a systematic description of the financial flows related to the consumption of health care goods and services. Their intent is to describe a health system from an expenditure perspective. But as more countries implement and institutionalize health accounts, there are increased expectations from analysts, policy makers, and the general public alike for the more sophisticated information that can be gained through the greater volume of health expenditure data now available. Health accounts are increasingly expected to provide inputs (along with other statistical information) into improved analytical tools to monitor and assess health system performance.” (SHA 2011, p. 20)
6. The SHA is organized around a tri-axial system, defining consumption of health care goods and services by function, provision of health care services by industry, and financing of health care (i.e., sources of funding). The three dimensions have their own classifications. Consumption of goods and services classified according to health care functions is the starting point and defines the boundaries of the health accounts. What is consumed must be provided, meaning that setting up the system within a supply-use framework would be a useful tool for ensuring consistency and completeness. Finally, what is produced and consumed must be financed. Therefore, there is a clear link and consistency among the three axes. 7. The SHA is closely linked to compilations in the national accounts as well as business accounting and public accounting standards.
8. SHA 2011 provides a standard for classifying health expenditures and the underlying objectives include 1) providing a framework relevant for international comparisons of health expenditure and health system analysis, 2) providing a tool that can produce useful data to monitor and analyze the health system, and 3) defining internationally harmonized boundaries for tracking expenditures on health care consumption (SHA 2011, p. 25).
2.2. Scope and Framework 9. The three key classifications in the SHA are 1) classification of health care functions (HC), 2) classification of health care providers (HP), and 3) classification of health care financing schemes (HF). These three classifications answer the questions what types of health care services are provided, who provides the services, and how are they financed? Other classifications are also provided in the system, but the three outlined above are essential and closely related to reporting of data. They provide the tools to account comprehensively for health care financing, and they define the key concepts and the relationships among consumption (function), production (provider), and financing. 10. An example of other classifications provided in the SHA framework is the classification of health care goods and services, described in Annex E of SHA 2011. The primary use of the product classification is to facilitate the boundary-setting and recommend what products should be selected when estimating health care expenditures. The product classification in the SHA is linked to the Central Product Classification (CPC) and the Classification of Products by Activity (CPA), and thus, the supply-use framework being part of the national accounts.

Health and Social Conditions – July 2020 3
2.2.1. Classification of Health Care Functions 11. Health care functions relate to “what is the purpose” or “the type of need a transaction or group of transactions aims to satisfy” (SHA 2011, p. 72). This is the most fundamental classification within the SHA and defines what is in and out of scope for “health care”. 12. The first-digit level of this classification aims to identify the type of need of the consumer—curative care, rehabilitative care, etc. Table 1 of this note presents the first-digit level from table 5.1 of SHA 2011. The classification is broken down into further detail, as the two-digit level of curative care can be distributed among inpatient curative care (HC.1.1), day curative care (HC.1.2), outpatient curative care (HC.1.3), and home-based curative care (HC.1.4). The three-digit level is further split in table 5.1 as well.
13. There will always be borderline cases between health care and social care. Long-term care (health) consists of a range of medical and personal care services that are consumed, and the goal is to alleviate pain and suffering and reduce deterioration in the health status of patients depending on long-term care. The SHA describes what to include under this function, however, the handbook also recommends to measure, as a memorandum item (not part of health expenditures), the expenditures related to long-term care (social). What is defined as long-term care (social) is listed in the handbook (SHA 2011, p. 114). The definition is important in order to maintain a consistent definition of “health care” across countries and over time.
14. SHA 2011 Annex A gives a detailed correspondence between the functional classification (HC) and the CPC product classification and between the functional classification (HC) and classifications in the SNA: classification of individual consumption according to purpose (COICOP), classification of the functions of government (COFOG), and classification of the purposes of non-profit institutions serving households (COPNI). 2.2.2. Classification of Health Care Providers 15. Health care providers include organizations and actors that deliver health care goods and services as their primary activity, as well as those for which provision of health care products is a secondary activity (SHA 2011, p. 122).1 Table 2 of this note adapts the first-digit level from table 6.2 of SHA 2011. The provider’s classification is broken down into two- and three-digit levels. For example, hospitals (HP.1) can be split into general hospitals (HP.1.1), mental health hospitals (HP.1.2), and specialized hospitals other than mental health hospitals (HP.1.3). 16. SHA 2011 Annex A gives a detailed correspondence between the provider classification (HP) and the International Standard Industrial Classification (ISIC) and between the provider classification (HP) and institutional sectors in the SNA.
1 All other industries as secondary providers of health care are classified under HP.8.2.
Health and Social Conditions – July 2020 4
2.2.3. Classification of Health Care Financing Schemes 17. This classification reveals who is financing the expenditures. The financing schemes will include both direct payments by households and third-party financing arrangements. Table 3 of this note reports the first-digit level from table 7.3 of SHA 2011. The financing classification is broken down into two- and three-digit levels. For example, government schemes and compulsory health care financing schemes (HF.1) can be broken down into government schemes (HF.1.1), compulsory contributory health insurance schemes (HF.1.2), and compulsory medical savings accounts (HF.1.3). 18. SHA 2011 Annex A gives a detailed correspondence between financing schemes and institutional sectors in the SNA.
2.3. Relationship between SHA and SNA 19. As already indicated, there is a link between the SHA and the SNA, and SHA 2011 describes how health expenditures and financing data reported in the SHA cross-classified tables relate to the main macroeconomic variables in the SNA. Hence, data for the SHA can be retrieved from national accounts if the basic detail information is included. The SHA also gives guidelines for compilation of additional SNA-type accounts. The links between the SHA and the SNA are provided in Annex B of SHA 2011. 20. Current health expenditures reported in the SHA will be equal to the sum of health care goods and services for final consumption of resident units. When broken down by providers (i.e., HCxHP), it represents the value of the part of output from health care providers that is consumed by households, NPISH, and government. This is similar to the supply-use tables in the SNA. In the supply-use tables, the value of health goods and services used as intermediate consumption by health providers or other companies will also be included.
21. Annex B of SHA 2011 enumerates four important differences between the SHA and the SNA. We use the four differences as a foundation for recommendations in this guidance note, and we suggest in section 4 changes to SNA 2008 or SHA 2011 that would resolve the differences.
22. One difference is the SHA extends the SNA production boundary by including imputed production for the value of health services produced within the household that are covered partially or completely by dependency allowances. For example, if households receive cash transfers to cover a sizeable share of the value of household labor services provided to persons with severe functional mobility or cognitive handicaps, the transfers are treated in the SHA as quasi-salaries with a corresponding production value that is included in current health expenditure.
23. Another difference is that occupational health care paid by employers is treated as intermediate consumption in the SNA and final consumption in the SHA.
24. A third difference is the SHA considers goods purchased and resold by retailers as their intermediate consumption, whereas the SNA excludes them from intermediate consumption, which
Health and Social Conditions – July 2020 5
yields two consequences: 1) manufacturers of health care goods are excluded from the SHA provider classification and 2) retailers’ output is measured in the SHA by the sum of the total value of the goods they purchase for resale plus the trade margins realized, while in the SNA only the latter component is included. This different treatment should have no impact on either measured final output or measured consumption.
25. The final difference enumerated in SHA 2011 is that research and development (R&D) is treated as a non-financial asset in the SNA, and hence, R&D produced on own-account is part of hospital output (and recorded as gross fixed capital formation in the same industry), while the SHA core measures exclude this creation of R&D. R&D is discussed in SHA 2011 on page 267. The reason for treating R&D as an input in the production process (i.e., intermediate consumption) instead of capitalizing it is guided by practical considerations. At the time of the preparation of SHA 2011, information on R&D in the health system was available only for a few countries, so its inclusion would likely impair international comparability of the data.
3. Options Considered for Health Care Indicators 26. This section outlines options to be considered before linking indicators of health care from the SHA to the SNA. We first distinguish options to be implemented within the SNA central system from those to be developed outside the central system. We then discuss indicators that we deem eligible for either embedding in the SNA core framework or extending the core framework.2
3.1. Implementation within the SNA Central System
3.1.1. Classifications of Final Consumption Expenditures
27. As described in section 2.2, Annex A of SHA 2011 contains correspondence tables among the various SNA classifications and its own International Classification of Health Accounts (ICHA): health care function (HC), health care provider (HP), and health care financing schemes (HF). The functional classification (HC) is the most relevant in relation to classifications used for final consumption in national accounts. 28. The classification of individual consumption according to purpose (COICOP) for household expenditures in the SNA was updated in a 2018 revision. Division 06 (health) of COICOP was restructured to allow for better alignment of COICOP 2018 with the ICHA.3
2 We distinguish the “SNA central system” from the “SNA core framework” because the latter is only one feature of the former. The “SNA central system” includes all features of national accounts such as classification, boundaries, current cost concepts, and the accounting structure. The “SNA core framework” includes only features of the accounting structure such as the sequence of accounts for institutional sectors and supply-use tables for the production account and goods and services account. 3 See paragraph 88, paragraph 114, and comments to division 06 of COICOP 2018 available at the following link: https://unstats.un.org/unsd/classifications/Econ/Download/In%20Text/COICOP_2018_pre_edited_white_cover_version_2018_12_26.pdf.
Health and Social Conditions – July 2020 6
29. For classification of the functions of government (COFOG), updates similar to those for COICOP have not been implemented. The reference international classification remains the 1999 edition.4 COFOG covers health care expenditures (including individual and collective final consumption expenditures) by government in division 07 (health).5 Recommendation 1: Assess whether the SHA functional classification (HC) defines the most relevant supplementary details for health in a national accounting context. Some elements of the SHA classification should be reexamined for this purpose (e.g., the feasibility of distinguishing expenditures between curative and rehabilitative care). Recommendation 2: The classifications in the SHA and the SNA should be harmonized to reflect the 2018 developments in national accounts COICOP and to facilitate embedding or linking indicators from the SHA to the SNA.
Recommendation 3: Update the COFOG classification for health (division 07) to at least reflect changes introduced in the 2018 COICOP classification and to account for the detail necessary to be useful for policy analysis of health.
3.1.2. Health Care Products and Supply-Use Tables 3.1.2.1.ProductsRelevantforMeaningfulMeasuresofHealthCare 30. What products are relevant to construct meaningful measures of health care? Annex E of SHA 2011 offers a preliminary classification of health care products based on their composition and characteristics. Annex E starts by defining a health care product, which is consistent with the SNA, and then proceeds to enumerate relevant health care products based on a six-digit coding scheme that is generally linked to the CPC and CPA. The following summarizes the SHA 2011 definition of a health care product:
“A health care product is the result of the interaction of capital, labour, and entrepreneurship in the production process, which has the primary purpose of improving, maintaining, or preventing the deterioration of the health status of persons or mitigating the consequences of ill-health. Products can consist of both goods and services.” (SHA 2011, pp. 464-465)
31. The three main classification schemes of the SHA – i.e., function (HC), provider (HP), financing scheme (HF) – are ultimately designed to group and organize health care products in a meaningful way for statistical and policy purposes. The functional classification of the SHA is the fundamental classification for setting boundaries of “health care”, and the other classifications leverage off the functional classification. The functional classification focuses on final consumption expenditures of products by households, NPISH, and government for health
4 See the following link: https://unstats.un.org/unsd/iiss/Classification-of-the-Functions-of-Government-COFOG.ashx. 5 See Annex A of SHA 2011 (p. 389) for a more detailed description of correspondences between the functional classification (HC) and COFOG.
Health and Social Conditions – July 2020 7
purposes. In order to ensure compilation of the most accurate and reliable expenditure measures for each classification scheme requires identifying a complete set of products that fit within each scheme. 32. Table 4 in this note presents the preliminary list of two- and three-digit health care products proposed in Annex E of SHA 2011. Explanations as well as lower tiered health care products can be found on pages 468-495 of SHA 2011. 3.1.2.2.AdditionalDetailinSupply‐UseTables 33. The supply-use tables of the SNA provide internally consistent and complete statistical compilations of goods and services produced and used in an economy. Detail in supply-use tables can be a tool for cross-classifying products to relevant functions and other classifications in the SHA. In addition, detail ensures that secondary production of health products is accounted properly, allowing to analyze the total resources spent on health care products. Thus, supply-use tables can be used to compile health accounts, and SHA 2011 underscores this objective in Annex E (SHA 2011, p. 465). 34. In addition to the list of products in Annex E, the SHA includes explicit links between SNA supply-use tables and SHA tables. Table A.1.7 in Annex A of SHA 2011 provides a correspondence between the SHA functional classification (HC) and CPC codes, which is summarized in table 5 of this note. Table A.1.10 in Annex A provides a similar correspondence between the SHA provider classification (HP) and ISIC codes, which is summarized in table 6. 35. To be useful for compilation, a product classification must be detailed enough to separately identify products that belong to a given classification group. However, users are not interested in compilation but rather in a system that provides answers to relevant questions. What detail could be introduced to supply-use tables to generate more policy-relevant information? The product classification laid out in table 4 and the related detail in Annex E of SHA 2011 reveal some products that should be included in meaningful measures of health care but do not currently have equivalents in CPC or CPA and may, thus, result in missing detail in supply-use tables.
36. A lack of equivalents in CPC or CPA does not necessarily mean that measures cannot be compiled for SHA functions or other classifications using alternative available information. In Norway, for example, services by hospitals are split into SHA functions using information on day care, outpatients, and other information.
37. Health care products missing CPC or CPA equivalents include both the high level two-digit tier as well as lower level tiers. At the two-digit level, entire product categories with no CPC or CPA equivalent include day care services (02), preventive services (08), and health and social care goods and services produced by households for own use (11).
38. According to SHA 2011, day care services (02) include short-term services for patients admitted to hospitals, ambulatory premises, or self-standing centers for less than 24 hours. Services may include medical, rehabilitative, emergency, operating, laboratory, imaging, and other ancillary services.

Health and Social Conditions – July 2020 8
39. Preventive services (08) in SHA 2011 are any services at the primary, secondary, or tertiary levels that reduce the burden of mortality or morbidity from disease. Primary prevention anticipates the emergence and lessens the severity of diseases (e.g., vaccination). Secondary prevention is aimed at early detection of diseases to reduce costs associated with a disease (e.g., screening). Tertiary prevention reduces the negative impact of an already-established disease by restoring function and reducing disease-related complications. Prevention in the SHA is limited to primary and secondary prevention, which may be delivered as part of curative and rehabilitative services for inpatients and day cases but may also be delivered outside health care premises by special teams or individual health professionals not connected with a hospital, clinic, or practitioner.
40. Health and social care goods and services produced by households for own use (11) includes services generated by households for own final use, which are reimbursed or the subject of transfers. These services are currently outside the production boundary of the SNA, but the goods are inside the production boundary. This is discussed further in section 3.2.2.
41. At the three-digit level in table 4, product subcategories with no CPC or CPA equivalent include hospital rehabilitation services (01.3), intensive care services (01.5), nursing care services without accommodation for the elderly and disabled (06.1), mail order or internet retail trade services in medical goods (07.4), and all other retail trade services in medical products and their repair (07.9). There are also a number of lower tier products identified in Annex E that have no CPC or CPA equivalent.
Recommendation 4: Review detail in the product classification of Annex E of SHA 2011 to identify additional products that are relevant for policy decisions to be based on details in supply-use tables. The SNA and the SHA should be harmonized—even though there may be differences regarding details in the two systems, they should be consistent at an aggregate level. Recommendation 5: A supplementary supply-use table from health accounts should be set up to ensure consistency and completeness in analyses of health care. Table 29.4 of SNA 2008 provides an example of supply-use tables that could be compiled from the SHA. 3.1.2.3.HealthCareServicesasSecondaryOutput 42. Non-health government agencies, non-health non-profits and a few non-health businesses may produce individual health care services as secondary output. For example, firefighters may provide emergency medical care in non-fire situations. The health care activities of fire departments are within scope of the SHA functional classification, and they are covered by HP.4.1 or HP.8.2 in the provider classification. However, this secondary activity of fire departments is often not included by compilers in the health care classifications of supply-use tables (i.e., CPC, CPA, ISIC) for practical reasons. 43. Currently, national accountants often track secondary health output together with primary output due to a lack of information. In many cases, the chosen treatment depends on details of the
Health and Social Conditions – July 2020 9
organizational framework and the payment structure, which are not directly relevant to the health care itself. Across countries, the exact same service might be part of the health sector in one country and part of the non-health sector in another country. This comparability problem could be minimized by counting all primary and secondary health output together in supply-use tables. 44. Tracking secondary health output should not have any impact on aggregate GDP if it is tracked as something else. In the government and non-profit sectors, the increase in measured health output is exactly offset by a decrease in general government output. In the for-profit business sector, if secondary health care is bundled together with sold primary products, then the increase in measured health output is exactly offset by a decrease in primary output. Likewise, if secondary health output is provided without payment because it is used for own account or charitable purposes, a value should ideally be imputed for it. This is done in satellite accounts for education and training where training expenditures by corporations are imputed.
45. Portions of this suggestion are easy to implement. The SHA already recommends that countries track secondary health providers in the health care sector, and many countries publish health accounts at least partially consistent with the SHA. Hence, secondary health output that is already tracked in health accounts can be tracked in supply-use tables as well. If secondary health output is not tracked in health accounts because of practical difficulties, there may also be a chance for supply-use tables to complement production of health accounts.
Recommendation 6: More research is needed to develop a comprehensive and consistent list of secondary health outputs across countries and how those outputs can fit into the various national accounting classification systems. 3.1.3. Volume Measures of Health Care 46. Health services constitute a substantial part of a country’s economy. The services provided are similar among countries in many ways, but there are also differences in how the health service sector is organized across countries. In some countries, a large part of health services is produced and financed by the government, which means there are no arms-length transaction prices because there is no market activity. Consequently, volume measures are impossible to obtain from normal deflation methods. In other countries, private health care providers play an important role, financed either by government, insurance companies, or individuals. In countries where market production of health care exists, prices are potentially available and constant price measures can be estimated by ordinary deflation methods. This is always the preferred method for constant price estimation. 47. According to national accounting principles, price and volume measures should be constructed for each aggregate transaction in products within the accounts so that the value index is equal to the price index multiplied by the volume index. This means that each change in the value of a given flow must be attributed either to a change in price or to a change in volume or to a combination of the two (Eurostat 2016, chapter 1.3). The price component should include only changes in price. Price changes for a given transaction flow can occur only as a result of a change in price for individual products. All other changes should be reflected in volume changes.
Health and Social Conditions – July 2020 10
48. Regarding health care, recommendations in the Eurostat Handbook on Prices and Volume Measures in National Accounts are based on the following definition of health output: “Health output is the quantity of health care received by patients, for each type of health care. The quantities should be weighted together using data on the costs or prices of the health care provided.” For volume measurement, the focus is on outputs, and using direct volume indicators in all cases where market prices are unavailable. There is also a discussion of which direct volume indicators can be used in SHA 2011 chapter 13. 49. The treatment in national accounts is different for market and non-market services. The price of a market product corresponds to the expenditure made by the purchaser of the product. The challenge is what to do in the absence of a market price. In this case, the guidelines recommend compiling a real measure of output using a “direct” volume index. Since the dollar value for non-market production is given as the sum of the costs incurred – i.e., labor compensation, intermediate consumption, consumption of fixed capital, other taxes less subsidies on production, and a net return to fixed capital – the price index can be estimated as a residual.
50. The implementation of diagnosis related systems (DRGs) for management and funding purposes in many countries is improving the availability of output data for hospitals. Using DRGs as a volume index for hospital output is recommended as a good method. If DRGs are not available, methods that use the International Classification of Diseases (ICDs) to classify discharges is also acceptable provided the diagnoses are recorded at a very detailed level and appropriate cost weights are used (Eurostat 2016, paragraph 4.17). 51. While direct output measurement for individual non-market services is preferable, it is in most cases difficult to define units of quantity for collective non-market services. For collective services, therefore, deflating with implicit cost price indices (input method) will be acceptable. Some countries may also choose to adjust input costs for productivity growth.
3.1.3.1.ReconcilingtheImportanceofQualityAdjustmentforHealthwithStatisticalGuidancethatOmitsQualityAdjustment 52. As a result of exhaustive research and development in the area of health, the sector has been through major improvements in recent decades. Treatment methods, drugs, preventive care, and contact methods have improved. This has improved both the length and the quality of life for treated patients. In some cases, the improvements have led to lower expenditures on treatment and in other cases to higher expenditures. The way health care services are provided to patients has also changed among countries. Some countries have focused on providing digital or telehealth services – such as medical advice via phone and video – while other countries focus on physical appointments. Naturally, the quality of treatment experiences differs across patients, which leads to how output measures should be adjusted for quality changes. 53. The European System of Accounts 2010 (ESA 2010) and the Eurostat Handbook on Price and Volume Measures in National Accounts both advocate the output method in countries where data availability is good enough to determine homogeneous products. Otherwise, the input method can be used. Explicit quality adjusted volumes were excluded from the ESA central system because of conceptual difficulties and the absence of consensus on output methods adjusted for quality

Health and Social Conditions – July 2020 11
affect comparability of results across EU countries. The Eurostat Handbook on Price and Volume Measures in National Accounts is generally consistent with ESA 2010 on explicit quality adjusted volumes; however, countries are encouraged to use detailed stratification of homogeneous products to include implicit changes in quality. To exclude the use of explicit quality adjustment from the central system in order to preserve comparability might seem reasonable. With a lack of data to make quality adjustments and lack of a universal definition, volume growth could vary substantially across countries just because non-comparable methods for quality adjustment are used. 54. SNA 2008 also advocates the output method and includes a provision for explicit quality adjustment as long as measures reflect the service provided (SNA 2008, paragraph 15.122). Thus, volume measures in non-EU countries might reflect changes in quality differently than in EU countries under SNA guidance. Likewise, in countries that estimate currency values for market health care and then deflate – i.e., do not use direct volume indicators – quality adjustment may be applied to prices. In either case, quality changes are ultimately reflected in volume measures of health care.
3.1.3.2.CountryExperienceswithQualityAdjustment 3.1.3.2.1. Eurostat Task Force on Prices and Volumes for Service Activities 55. For the last 20 years, Eurostat has been working on how to measure output from non-market services in volume terms, both related to the conceptual methodology and to more practical aspects. The most recent work is from the Eurostat Task Force on Price and Volume Measures for Service Activities in 2018, where for example a Dutch study concludes that for the Netherlands, explicit quality adjustment in price and volume measurement in health care appears beneficial and feasible. However, developing a comprehensive methodology would require further effort and research. In the same report, a Danish study concludes that for Denmark, an explicit general quality adjustment of hospital treatments has a significant effect on national accounts measures and the construction of an advanced treatment of a specific quality adjusted volume indicator for a complicated patient treatment group has been achieved in collaboration with health care quality experts.
56. The report of the Task Force concluded that:6
Improvements in methods to take into account quality change for health are possible, and the impact of the improved measures on growth rates of health services can be significant.
For health services, a useful distinction between general quality adjustments, i.e., those that apply to all services provided, and treatment-specific adjustments, which are based on treatment-specific indicators, can be made.
The experience also showed the benefit of working closely together with health organizations and experts.
6 See the following link: https://ec.europa.eu/eurostat/web/products‐manuals‐and‐guidelines/‐/KS‐GQ‐14‐005.
Health and Social Conditions – July 2020 12
57. The Task Force considered that the work on methods to better reflect quality changes in education and health should continue, in order to prepare future discussions on their possible use in the next ESA. 3.1.3.2.2. Atkinson Review in the UK 58. The Atkinson review is an independent review of the measurement of government output in the national accounts in the United Kingdom published by Tony Atkinson in 2005. The review was produced with help from experts all over the world and was the foundation for the Office for National Statistics work with volume measures in health services among other areas. 59. The report finds that the main dimensions for understanding quality of health care include 1) saving lives and extending life spans, 2) preventing illness and mitigating its impact on the quality of life, 3) speed of access to treatment, and 4) quality of patient experience. The report concludes that all the dimensions are relevant for national accounts and work is needed to find ways to measure them.
3.1.3.2.3. Quality Adjusted Prices in the U.S. 60. The Bureau of Economic Analysis (BEA) has also studied quality adjustment for health care in the United States. BEA currently publishes supplemental statistics that track spending by disease, and these estimates are not adjusted for quality.7 More recently, BEA has explored explicit adjustment for improvements in the quality of treatment (Hall 2016, Dauda et al. 2019). The conclusions of this work are broadly similar to those of the Eurostat Task Force: adjusting health care prices for quality change can significantly raise the real growth rate of health services. More work is needed before this research is ready for incorporation into the U.S. national accounts. Recommendation 7: Consistent with SNA recommendations and conclusions of country experiences, research should continue to better understand the quality of health care and to best reflect quality changes in volume measures of health care services in national accounts. 3.1.4. Paid Long-Term Social Care Services 61. The SHA is related to increased information on health care services, access to it, and changes in health policy priorities. Recall the intent of health accounts is to describe a health system from an expenditure perspective. Only expenditures on health care are defined within the system. Often distinguishing health care expenditures from social care expenditures is difficult, especially for long-term care (LTC) (see section 3.2.2). The SHA clearly establishes a borderline between LTC (health) and LTC (social) (SHA 2011, pp. 88-95). However, the handbook highlights that health care related classifications also identify policy relevant areas that go beyond the health care boundary as programs that come under the social part of long-term care (SHA 2011, p. 74). 62. Since social care services are also important for household well-being and for policymaking, social care services should be taken into consideration. The SHA does this by
7 See the following link for more information: https://www.bea.gov/data/special-topics/health-care.
Health and Social Conditions – July 2020 13
including LTC (social) as a memorandum item in the classification of health care functions. The memorandum item for LTC (social) comprises expenditures on lower level social care services to assist with instrumental activities of daily living (IADL) such as shopping, laundry, and cooking (SHA 2011, p. 114). Also, other social care services such as child welfare could be included. However, as a first step, inclusion of what is already discussed in the SHA 2011, i.e., LTC (social), could be a starting point. Recommendation 8: A framework on well-being and sustainability should cover all expenditures on health care and long-term social care. 3.1.5. Occupational Health Services 63. Occupational health services provided by corporations, government, and non-profit institutions to their employees include routine surveillance and therapeutic care provided either on own account via an organization’s hired health personnel or on contract via purchased services. In the SHA, both own-account and purchased occupational health services are treated as final consumption and are included in total health expenditures (SHA 2011, p. 46). In the SNA, occupational health services purchased under contract are recorded as intermediate consumption, and the costs of hired health personnel on own account are recorded as compensation of employees. Thus, the SNA has an inconsistent treatment of purchased occupational health and own-account occupational health. Moreover, the SHA treatment of occupational health as final consumption would not work well for corporations in the SNA without complicated rerouting of transactions. Recommendation 9: Purchased occupational health services in the SNA should be identified as health expenditures (i.e., health output financed by corporations, government, and non-profit institutions), which will remain allocated to intermediate consumption. Recommendation 10: Own-account production of occupational health services in the SNA should be imputed as secondary output and allocated to intermediate consumption.
3.2. Developments Outside the SNA Central System 3.2.1. Supplemental Classifications for Private Health Insurance 64. For some countries, private health insurance is important, and breakdowns for insurance service charges and insurance transfers can be useful for analysis. 65. In the SNA, non-life insurance service charges are roughly equal to premiums plus investment income minus adjusted claims. The SNA consumption classifications have a breakdown for insurance service charges by business area in COICOP division 12 third digit, which includes life and accident, health, dwelling, transport and travel, and other. Current transfers are recorded for non-life insurance premiums and claims—premiums (claims) are payable by households (insurance corporations) and receivable by insurance corporations (households). A breakdown of insurance transfers by business area is not currently included in the SNA but could be useful for analysis of health insurance.
Health and Social Conditions – July 2020 14
66. In the SHA, insurance service charges include specific management and administrative costs such as sales, enrollment and policy services, claim adjudication, actuarial functions, legal support, investment functions, and corporate overhead and are included in health care final consumption expenditures for the various functional (HC) categories. Health insurance claims payable by insurance corporations are recorded under compulsory private health insurance (HF.1.2.2) or voluntary health insurance (HF.2.1). Health insurance premiums payable by households are recorded in the revenues of health care financing schemes classification (FS) under compulsory prepayment from individuals/households (FS.4.1) or voluntary prepayment from individuals/households (FS.5.1).8 The SHA recommends a breakdown of health insurance claims and premiums for any function in the functional classification (HC). However, the detail of the cross-classifications may be subject to practical limitations. Recommendation 11: A breakdown of insurance claims and premiums by business area, including total health, could be introduced as a supplement to the SNA central system. Recommendation 12: An assessment could be made for the feasibility of a supplement to the SNA central system for additional breakdowns of health insurance claims and premiums by health function (HC) similar to the SHA. 67. The SHA financing scheme classification (HF) distinguishes between social health insurance schemes (HF.1.2.1), compulsory private insurance schemes (HF.1.2.2) and voluntary health insurance schemes (HF.2.1) (SHA 2011, pp. 169-174). From the experience of SHA data collection, the classification may present grey areas. In some countries, social health insurance schemes may be defined as compulsory for all residents or for a specific population group. People belonging to the specific population group covered compulsorily have the right to opt out, in which case they are normally obliged to take another health protection, including private insurance. Therefore, there is an element of voluntary choice for those who do (or do not) opt out of social health insurance schemes. In other countries, members of the population not covered compulsorily may be given the possibility to voluntarily opt into social health insurance schemes. This clashes somehow with the definition of social health insurance schemes as compulsory schemes. Recommendation 13: Experience developed in the course of SHA data collection could be used to define distinctions for health insurance along dimensions including voluntary/compulsory, private/public, and individual/social as a supplement to the SNA central system. 3.2.2. Unpaid Household Production of Care 68. The central system of the SNA does not include within the production boundary services produced by households for own consumption. Among the activities excluded, paragraph 1.4 of SNA 2008 identifies the care of sick, infirm, or old people. The exclusion is justified on the grounds that non-market flows of household production are very different from market-based
8 See chapter 8 of SHA 2011.
Health and Social Conditions – July 2020 15
flows and that inclusion of such large non-market flows together with market flows would obscure what is happening in the market and reduce the analytical usefulness of the data. 69. Justifications for measuring unpaid household production of health care are evident in a number of sources. Stiglitz et al. (2009) argue that focusing solely on market activity provides a biased picture of living standards, especially when economic activity appears to increase but is simply the result of a shift from household production to the market provision of similar services. Hanly and Sheerin (2017) focus on heightened demand for unpaid long-term care putting pressure on the provision of informal care in the home, which at the same time is experiencing limited supply because of female labor force participation and loosening of community and family ties. Gender differences also play a role in the importance of official statistics on unpaid household production of health care. Ferrant et al. (2014) conclude that the majority of informal care is undertaken by women, which negatively impacts their participation in the labor force and in education. Likewise, Hanly and Sheerin (2017) argue that neglecting unpaid care work leads to incorrect inferences about levels and changes in individuals’ well-being, which in turn limits policy effectiveness for gender inequalities in employment and empowerment areas. Overall, the literature supports the view that unpaid household care has a significant role in understanding health and social conditions and individuals’ well-being. 3.2.2.1.DefiningUnpaidHouseholdCare 70. The Guidance Note on Unpaid Household Activities defines “adult care” as:
“Unpaid adult care captures activities where individuals are providing informal healthcare services to an adult, for example changing bandages or dressings or other medical assistance. It can also include activity where an individual helps another adult by carrying out their cleaning, mowing their lawn or other voluntary tasks on their behalf. Unpaid adult care may be provided on a temporary basis, where an adult needs caring assistance for a fixed duration of time. Alternatively, it may also be provided to those who are potentially terminally ill and need long-term care. Unpaid adult care shares the same active vs passive care division as unpaid child care and, in principle, adult care can also be split into physical and developmental categories. However, a larger proportion of adult care would normally be considered as physical care where most of those in receipt of adult care are elderly and require some kind of physical assistance.” (Guidance Note on Unpaid Household Activities)
71. The Guidance Note on Unpaid Household Activities defines “child care” as:
“Unpaid child care captures all the time provided by care givers in the direct care of children. This can range from helping with homework to feeding, washing or dressing children. Meal production is excluded and would fall under the nutrition category. Unpaid child care can be considered in different sub-divisions – active versus passive or physical versus developmental. Active care is defined as activity where the primary focus of attention is care. Alternatively, passive care is described as time where a person is in the duty of care of a caregiver but the
Health and Social Conditions – July 2020 16
caregiver may not consider their main focus to be on a care task. For example, if a parent needs to be at home because their children would otherwise be unsupervised, then they may not consider their current activity as child care, particularly if they are busy with other tasks at the time or even sleeping overnight. However, it is still important to recognise that if the parent was not present then they would need to find a volunteer to supervise the children or pay someone to do so.” (Guidance Note on Unpaid Household Activities)
72. Many activities of adult care may also be provided to sick or disabled children within households. In addition, unpaid care work can be provided to adults or children within the same household or in other households. For example, adult children providing care to their frail and elderly parents in another household. In defining unpaid care work, the long-established distinction between “health care” and “social care” should be maintained. The activities within the adult care definition could be classified specifically as “health care” and “social care” necessary for the long-term care (LTC) of older people or vulnerable adults and children. The SHA distinguishes between “health care” and “social care” in order to delimit the boundary of health care (versus social care) to ensure the consistent recording of health care expenditures across countries and over time. 73. Total LTC (HC.3 + HCR.1) in the SHA consists of a range of medical and nursing care services, personal care services, and assistance services that are consumed with the primary goal of alleviating pain and suffering or reducing or managing the deterioration in health status in patients with a degree of long-term dependency. In general, LTC (health) (HC.3) is composed of medical or nursing care and personal care services. Medical or nursing care (e.g., administering medication, palliative care, etc.) can include preventive activities to avoid deterioration in long-term health conditions or rehabilitative activities to improve functionality. Personal care services provide help with activities of daily living (ADL) such as eating, bathing, and dressing. LTC (social) (HCR.1) consists of assistance services that enable a person to live independently. They help with instrumental activities of daily living (IADL) such as shopping, laundry, and cooking.
74. The scope of health care-related services provided at home by family members is often a mixture of health and social care services. This leads to the problem of how to split the health care component from the social care component when classifying these activities under the SHA. 3.2.2.2.MeasuringUnpaidHouseholdCare 75. Although generally consistent with the SNA, the SHA extends the production boundary to include cash transfers to private households for care givers of home care for the sick and disabled, which is treated as paid household production of health care for personal health services provided within households by family members in cases where they correspond to social transfer payments granted for this purpose. The valuation of the service is based on the assumption that the value of the unpaid care work performed in the household is worth what social programs are willing to grant (SHA 2011, pp. 46-47). Table 7 summarizes the relationship between the SNA and the SHA treatments of cash transfers to private households for caregivers of home care for the sick and disabled.
Health and Social Conditions – July 2020 17
76. If LTC activities of households are included in the production boundary as an extension of the SNA (e.g., household account or health account), a valuation of the production is necessary. Measurement could be captured with time-use data. One can also look at measuring and estimating unpaid household production of health care and social care activities by looking at equivalent providers within the market economy. Table 8 presents an extract of care activities related to health care and social care from the UNECE Guide to Valuing Unpaid Household Service Work that highlights the own-use production work of services provided by households and market counterparts. The range of services provided by households is extensive. If a market value were put on these activities, they would presumably add significantly to GDP.
77. Some methodologies for estimating unpaid household work blend time use survey data with administrative data to better allocate the time use survey data across households. This approach could be made more sophisticated with the use of broader and more detailed profiling of households from census data. For example, table 9 summarizes three questions from the Irish census of population that could help identify households providing health care or social care for family members.
78. Administrative sources that might complement estimates of health care and social care provided by households are data in relation to certain social welfare payments for care responsibilities. This information also provides additional information to profile households more accurately to better estimate caring duties of households. As already indicated above, these payments do not reflect the value of that work but rather are a form of income support for such households to ensure they have enough income to carry out their care duties. 3.2.2.3.EstimatesoftheValueofUnpaidHouseholdCare 79. There have been studies that attempt to estimate the value of informal health care at home. One study in Ireland, which used the Irish census data on caring responsibilities outlined in table 9, estimated that the value of informal care in 2011 could range from 2.1 to 5.5 billion Euros (i.e., between 1.2 percent and 3.2 percent of GDP). This would add approximately another 10 to 25 percent to estimates of current health care expenditures in Ireland in 2011. Studies from other countries also demonstrate similar estimates of the value of informal health care. A study in the U.S. (Chari et al. 2015) estimated the value of informal care to be between 1.4 percent and 4.0 percent of GDP. A study in Spain (Oliva-Moreno et al. 2015) estimated it to be valued between 1.7 percent and 4.9 percent of GDP. For Switzerland, informal care has been estimated to be valued at 0.3 percent of GDP, or nearly 3.0 percent of total health expenditures (OECD 2011, p. 152).
80. The above studies make clear that informal health care at home is not insignificant, and given societal changes, reliance on informal care as a means of caring for sick, vulnerable, or elderly members of society is a key policy question. Recommendation 14: A framework on well-being and sustainability should expand the production boundary to include imputed values for unpaid household production of health care and long-term social care in an extension outside the SNA central system. The valuation should be in line with proposals from the Guidance Note on Unpaid Household Activities.
Health and Social Conditions – July 2020 18
From this follows that the imputation of production must be allocated to users and relevant functions. In addition, data would have to be accurately coded to 2018 COICOP to facilitate classification to either health care or social care for the correct recording of activities within the health care boundary or social care boundary necessary for consistent recording of the expenditures.
3.3. Health Care Indicators 81. Indicators for health care can be built from expenditure flow data. This covers final consumption as well as gross fixed capital formation. In addition, indicators based on capital stock result from measures of gross fixed capital formation. Indicators in physical terms such as employment should also be considered. Chapter 10 of SHA 2011 also discusses indicators on health spending by beneficiary characteristics – such as age and gender, type of disease, socioeconomic status, or geographic region – that can be constructed from SHA data and combined in various ways with other indicators. 3.3.1. Indicators Embedded in the SNA Core Framework 82. Indicators based on final consumption expenditures are covered in detail in chapter 15 of the SHA. The various breakdowns defined mainly by health care function, provider, and financing scheme can be cross tabulated according to various combinations. In addition, the SHA suggests the following standardizations and additional breakdowns of final consumption expenditures for domestic uses over time: expenditures as a share of GDP, per capita expenditures, expenditures by disease, expenditures by age and gender of beneficiaries, and expenditures by income group of beneficiaries. In addition, the financing scheme is important, allowing for example to analyze the shares between health care expenditures paid out of own pocket or by private insurance, government, or non-profits and health care received as transfers in kind. The SHA also suggests expenditures in purchasing power parities for comparisons across countries in international uses, which requires coordination across countries and is best left for international organizations.
83. Data on gross fixed capital formation of health providers are discussed in chapter 11 of the SHA. A classification by type of asset is proposed, covering standard categories of assets with specific reference to the health care sector: infrastructure, machinery and equipment, and intellectual property products. Infrastructure includes residential and non-residential buildings such as nursing care facilities and hospitals. Machinery and equipment include medical, transport, and ICT equipment such as diagnostic equipment and ambulances. Intellectual property products include the results of health-related R&D and computer software.
84. Table 10 in this note summarizes breakdowns for indicators suggested in SHA 2011 based on final consumption expenditures and capital formation.
85. Indicators based on capital stock can be used to measure aspects of the health care sector productive capacity. A suitable categorization could replicate the asset categories used for gross fixed capital formation. Valuations of non-financial produced fixed assets in national accounts generally use the perpetual inventory method, which starts from time series of gross fixed capital

Health and Social Conditions – July 2020 19
formation and uses estimates of asset service lives and consumption of fixed capital patterns together with revaluations based on price indices for new assets.
86. In practice, aggregate indicators of gross fixed capital formation and capital stock by SHA asset category may not offer more information on health care than is currently available in some countries’ national accounts because their aggregate measures already cover the standard categories of assets for health care. However, where feasible, indicators of gross fixed capital formation and capital stock by SHA asset category and SHA functional or other classification would generally enrich data on health care available to users. Recommendation 15: Review the SHA for relevant indicators based on final consumption expenditures with breakdowns by function, provider, and financing schemes for possible inclusion in the SNA core framework. 3.3.2. Indicators that are Extensions of the SNA Core Framework 87. In the context of extending the SNA core framework, indicators based on physical measures can be considered along with alternative indicators based on developments outside the SNA central system in section 3.2. 3.3.2.1.IndicatorsBasedonPhysicalMeasures 88. Indicators based on employment may be most usefully presented with a breakdown by the International Standard Classification of Occupations (ISCO-08) characteristics of employed persons. The most relevant ISCO groups for health are sub-major group 22 (health professionals) and 32 (health associate professionals).9 Indicators based on assets’ physical measures could also be presented with a suitable breakdown (e.g., number of hospital beds available). Recommendation 16: Compile a list of relevant indicators based on physical measures and determine how the indicators could be linked to the SNA core framework. 3.3.2.2.AlternativeIndicatorsBasedonDevelopmentsOutsidetheSNACentralSystem 89. Section 3.2 outlines two options considered for developments outside the SNA central system: 1) supplemental classifications for private health insurance and 2) unpaid household production of health care and long-term social care. Each of the two could yield alternative indicators that are extensions of the SNA core framework. 90. The supplemental classifications for private health insurance could be used to construct indicators for analyses of health insurance as a financing mechanism. Possibilities include more granular indicators on transfers between households and insurance corporations for health insurance claims and premiums in addition to breakdowns of claims and premiums by health function.
9 See the ILO website for details: https://www.ilo.org/public/english/bureau/stat/isco/isco08/.
Health and Social Conditions – July 2020 20
91. Expanding the SNA production boundary to include unpaid household production of health care and long-term social care in an extended framework would yield measures of final consumption expenditures that could be linked to their counterparts in the core framework for a more comprehensive picture of household health care and social care production. Recommendation 17: Compile a list of relevant indicators based on the two developments outside the SNA central system (i.e., supplemental classifications for private health insurance and unpaid household production of health care and long-term social care) and determine how the indicators could be linked to the SNA core framework.
4. Changes Required to SNA2008 and SHA2011 92. Achieving the most accurate and relevant indicators of health care embedded in the SNA core framework will require two primary changes to SNA 2008. First, current classifications (or more updated classifications) for functions (HC) and providers (HP) from SHA 2011 should be introduced to SNA 2008. Second, own-account production of occupational health services that is currently recorded as compensation of employees should be imputed as secondary output and allocated to intermediate consumption. This change will yield a consistent recording with purchased occupational health services, which should be identified as health expenditures (i.e., health output financed by corporations, government, and non-profit institutions). With these changes, GDP is not affected by either purchased occupational health services or own-account occupational health services. 93. Achieving the most accurate and relevant indicators of health care that are extensions of the SNA core framework will require two primary supplements to SNA 2008. First, the production boundary should be expanded to include imputed values for unpaid household production of health care and long-term social care. This should be carried out in line with the general recommendations of valuation of unpaid household work. This will not be in complete harmony with SHA 2011, which limits the imputations to the costs of non-market health and social care services that are covered by dependency allowances. Second, supplementary supply-use tables for health care and long-term social care should be created from the core supply-use tables in SNA 2008. 94. If supplemental indicators based on private health insurance are a goal, then relevant distinctions for health insurance should also be defined as a supplement to the SNA central system. 95. Annex B of this guidance note presents a summary of recommendations to help facilitate and manage the changes and supplements to SNA 2008. 96. If complete harmonization of SHA 2011 and SNA 2008 is also a goal, there are three changes required to SHA 2011. First, the SHA capital account needs to recognize expenditures on R&D in health as capital formation. Second, manufacturers of health goods need to be included in the SHA provider classification and retailers’ output measures need to be limited to their trade margins rather than treating their purchases of goods as intermediate consumption. Finally, the treatment of occupational health services and the valuation of unpaid household work need to be aligned with the SNA.
Health and Social Conditions – July 2020 21
References Chari, Amalavoyal V., John Engberg, Kristin N. Ray, Ateev Mehrotra. 2015. The Opportunity Costs of Informal Elder-Care in the United States: New Estimates from the American Time Use Survey, Health Services Research, 50(3), pp. 871-882. Dauda, Seidu, Abe Dunn, Anne Hall. 2019. Are Medical Care Prices Still Declining? A Systematic Examination of Quality-Adjusted Price Index Alternatives. BEA Working Paper 2019-3. Eisner, Robert. 1995. Expansion of Boundaries and Satellite Accounts in The New System of National Accounts, ed., John W. Kendrick, Springer, pp. 91-119. European Commission, International Monetary Fund, Organisation for Economic Co-operation and Development, United Nations, World Bank. 2009. System of National Accounts 2008, New York, NY: United Nations. Eurostat. 2016. Handbook on Prices and Volume Measures in National Accounts. Ferrant, Gaëlle, Luca Maria Pesando, Keiko Nowacka. 2014. Unpaid Care Work: The Missing Link in the Analysis of Gender Gaps in Labour Market Outcomes. OECD Development Centre Issues Paper. Hall, Anne. 2016. Adjusting the Measurement of the Output of the Medical Sector: A Review of the Literature, Medical Care Research and Review, 74(6), pp. 639-667. Hanly, Paul, Corina Sheerin. 2017. Valuing Informal Care in Ireland: Beyond the Traditional Production Boundary, The Economic and Social Review, 48(3), pp. 337-364. OECD. 2018. Accounting and Mapping of Long-Term Care Expenditure under SHA 2011. OECD Directorate for Employment, Labour, and Social Affairs. OECD, Eurostat, World Health Organization. 2017. A System of Health Accounts 2011: Revised edition, OECD Publishing, Paris. Oliva-Moreno, Juan, Maria Luz Pena-Longobardo, Cristina Vilaplana-Prieto. 2015. An Estimation of the Value of Informal Care Provided to Dependent People in Spain, Applied Health Economics and Health Policy, 13(2), pp. 223-231. Stiglitz, Joseph E., Amartya Kumar Sen, Jean-Paul Fitoussi. 2009. Report by the Commission on the Measurement of Economic Performance and Social Progress. Commission on the Measurement of Economic Performance and Social Progress, Paris. United Nations. Central Product Classification, version 2.1. New York: United Nations. United Nations Economic Commission for Europe. 2017. Guide to Valuing Unpaid Household Service Work. Geneva: United Nations.

Health and Social Conditions – July 2020 22
Annex A: Tables

Health and Social Conditions – July 2020 23
Table 1: Classification of Health Care Functions at the First-Digit Level HC.1 Curative care HC.2 Rehabilitative care HC.3 Long-term care (health) HC.4 Ancillary services (non-specified by function) HC.5 Medical goods (non-specified by function) HC.6 Preventive care HC.7 Governance and health system and financing administration HC.9 Other health care services not elsewhere classified (n.e.c.) Memorandum items: Reporting items HC.RI.1 Total pharmaceutical expenditure HC.RI.2 Traditional complementary alternative medicines HC.RI.3 Prevention and public health services (according to SHA 1.0) Memorandum items: Health care related HCR.1 Long-term care (social) HCR.2 Health promotion with a multi-sectoral approach
Source: Adapted from SHA 2011 table 5.1.
Table 2: Classification of Health Care Providers at the First-Digit Level HP.1 Hospitals HP.2 Residential long-term care facilities HP.3 Providers of ambulatory health care HP.4 Providers of ancillary services HP.5 Retailers and providers of medical goods HP.6 Providers of preventive care HP.7 Providers of health care system administration and financing HP.8 Rest of economy HP.9 Rest of the world
Source: Adapted from SHA 2011 table 6.2.
Table 3: Classification of Health Care Financing Schemes at the First-Digit Level HF.1 Government schemes and compulsory contributory health care financing schemes HF.2 Voluntary health care payment schemes HF.3 Household out-of-pocket payment HF.4 Rest of world financing schemes (non-resident)
Source: Adapted from SHA 2011 table 7.3.
Health and Social Conditions – July 2020 24
Table 4: Preliminary Proposed Health Care Product Classification Code Description CPC Code CPA Code 01 Hospital services 9311 86.1 01.1 Hospital surgical services 93111 86.10.11 01.2 Hospital gynaecological and obstetrical services 93112 86.10.12 01.3 Hospital rehabilitation services -- 86.10.13 01.4 Hospital psychiatric services 93113 86.10.14 01.5 Intensive care services -- -- 01.9 Other hospital services 93119 86.10.15 02 Day care services -- -- 02.1 Day care surgical services -- -- 02.2 Day care gynaecological and obstetrical services -- -- 02.3 Day care rehabilitation services -- -- 02.4 Day care psychiatric services -- -- 02.5 Other day care services -- -- 03 Medical and dental practice services 9312 86.2 03.1 General medical practice services (outpatient) 93121 86.21 03.2 Specialist medical practice services 93122 86.22 03.3 Dental practice services 93123 86.23 04 Other medical services 9319 86.9 04.1 Midwives’ services 93191 86.90.11 04.2 Nursing services 93192 86.90.12 04.3 Physiotherapeutic services 93193 86.90.13 04.4 Patient transport services, among others ambulance services 93194 86.90.14 04.5 Medical laboratory services 93195 86.90.15 04.6 Diagnostic imaging services without interpretation 93196 86.90.17 04.7 Blood, sperm and transplant organ bank services 93197 86.90.16 04.9 Other medical services n.e.c. 93199 86.90.19 05 Residential care services 932 87 05.1 Residential nursing care services 9321 87.1 05.9 Other residential care services 9330 87.90 06 Nursing care services without accommodation 934 88 06.1 Nursing care services without accommodation for the elderly and
disabled -- 88.1
06.9 Other nursing care services without accommodation 935 88.9 Source: Adapted from SHA 2011 pp. 468-495.
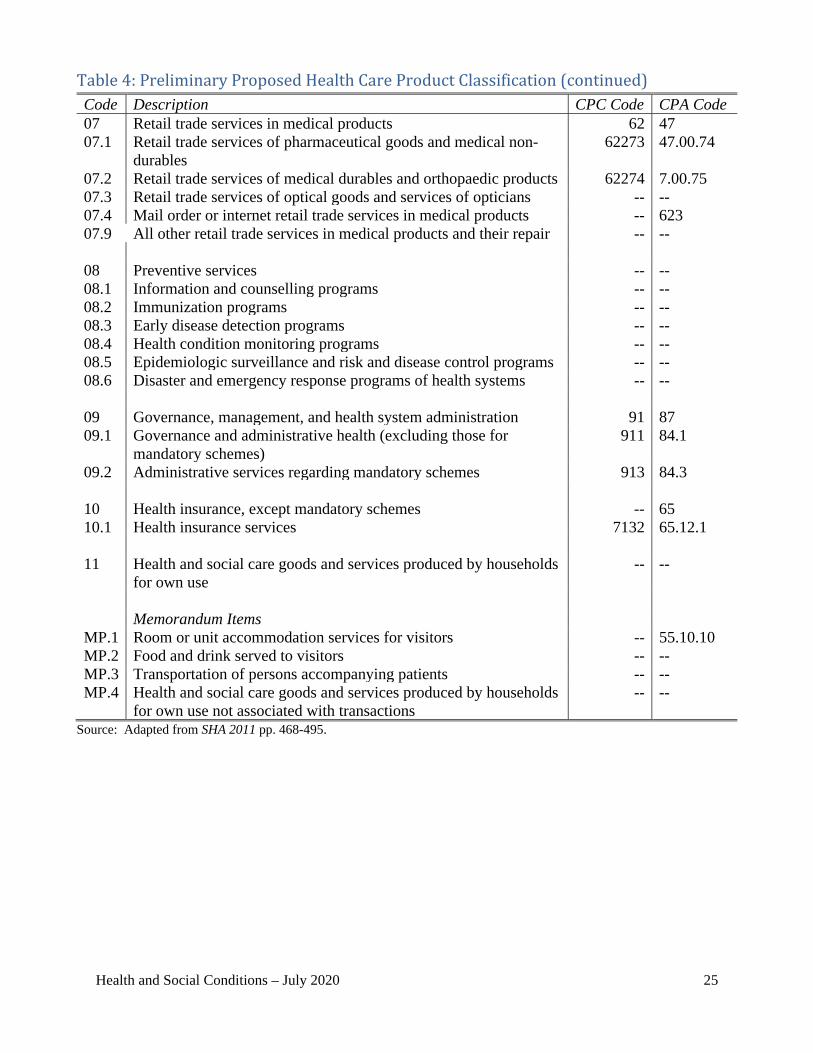
Health and Social Conditions – July 2020 25
Table 4: Preliminary Proposed Health Care Product Classification (continued) Code Description CPC Code CPA Code 07 Retail trade services in medical products 62 47 07.1 Retail trade services of pharmaceutical goods and medical non-
durables 62273 47.00.74
07.2 Retail trade services of medical durables and orthopaedic products 62274 7.00.75 07.3 Retail trade services of optical goods and services of opticians -- -- 07.4 Mail order or internet retail trade services in medical products -- 623 07.9 All other retail trade services in medical products and their repair -- -- 08 Preventive services -- -- 08.1 Information and counselling programs -- -- 08.2 Immunization programs -- -- 08.3 Early disease detection programs -- -- 08.4 Health condition monitoring programs -- -- 08.5 Epidemiologic surveillance and risk and disease control programs -- -- 08.6 Disaster and emergency response programs of health systems -- -- 09 Governance, management, and health system administration 91 87 09.1 Governance and administrative health (excluding those for
mandatory schemes) 911 84.1
09.2 Administrative services regarding mandatory schemes 913 84.3 10 Health insurance, except mandatory schemes -- 65 10.1 Health insurance services 7132 65.12.1 11 Health and social care goods and services produced by households
for own use -- --
Memorandum Items MP.1 Room or unit accommodation services for visitors -- 55.10.10 MP.2 Food and drink served to visitors -- -- MP.3 Transportation of persons accompanying patients -- -- MP.4 Health and social care goods and services produced by households
for own use not associated with transactions -- --
Source: Adapted from SHA 2011 pp. 468-495.
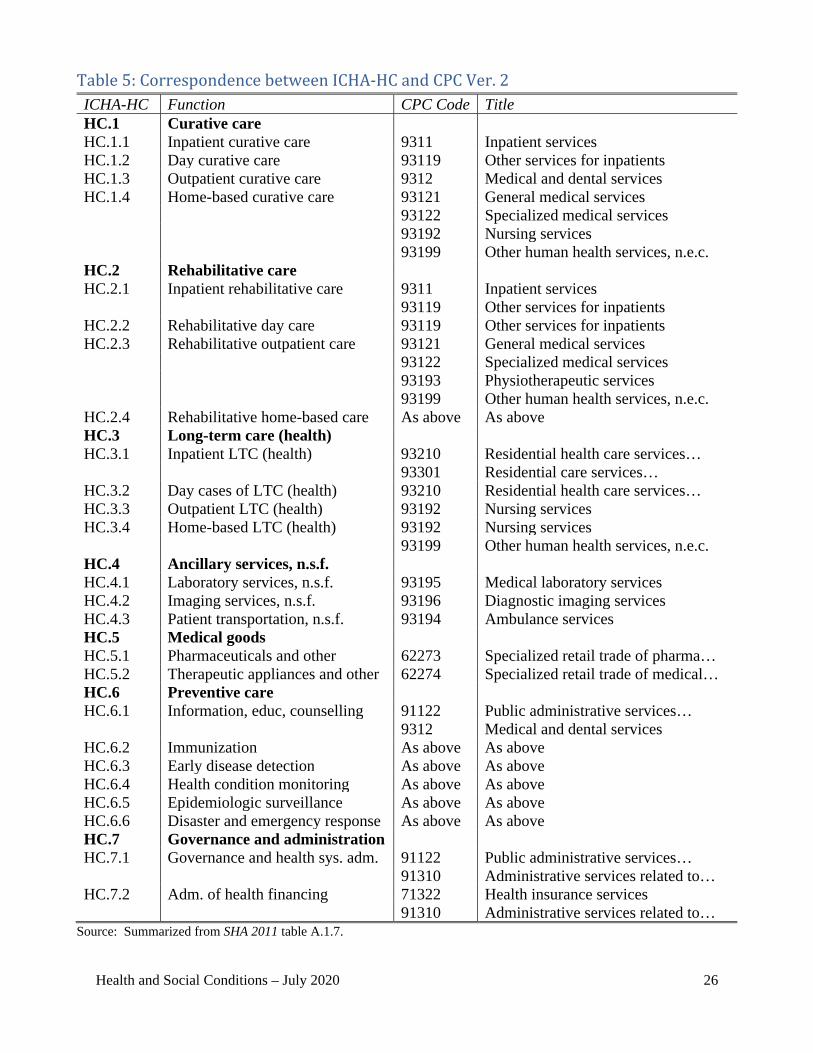
Health and Social Conditions – July 2020 26
Table 5: Correspondence between ICHA-HC and CPC Ver. 2 ICHA-HC Function CPC Code Title HC.1 Curative care HC.1.1 Inpatient curative care 9311 Inpatient services HC.1.2 Day curative care 93119 Other services for inpatients HC.1.3 Outpatient curative care 9312 Medical and dental services HC.1.4 Home-based curative care 93121 General medical services 93122 Specialized medical services 93192 Nursing services 93199 Other human health services, n.e.c. HC.2 Rehabilitative care HC.2.1 Inpatient rehabilitative care 9311 Inpatient services 93119 Other services for inpatients HC.2.2 Rehabilitative day care 93119 Other services for inpatients HC.2.3 Rehabilitative outpatient care 93121 General medical services 93122 Specialized medical services 93193 Physiotherapeutic services 93199 Other human health services, n.e.c. HC.2.4 Rehabilitative home-based care As above As above HC.3 Long-term care (health) HC.3.1 Inpatient LTC (health) 93210 Residential health care services… 93301 Residential care services… HC.3.2 Day cases of LTC (health) 93210 Residential health care services… HC.3.3 Outpatient LTC (health) 93192 Nursing services HC.3.4 Home-based LTC (health) 93192 Nursing services 93199 Other human health services, n.e.c. HC.4 Ancillary services, n.s.f. HC.4.1 Laboratory services, n.s.f. 93195 Medical laboratory services HC.4.2 Imaging services, n.s.f. 93196 Diagnostic imaging services HC.4.3 Patient transportation, n.s.f. 93194 Ambulance services HC.5 Medical goods HC.5.1 Pharmaceuticals and other 62273 Specialized retail trade of pharma… HC.5.2 Therapeutic appliances and other 62274 Specialized retail trade of medical… HC.6 Preventive care HC.6.1 Information, educ, counselling 91122 Public administrative services… 9312 Medical and dental services HC.6.2 Immunization As above As above HC.6.3 Early disease detection As above As above HC.6.4 Health condition monitoring As above As above HC.6.5 Epidemiologic surveillance As above As above HC.6.6 Disaster and emergency response As above As above HC.7 Governance and administration HC.7.1 Governance and health sys. adm. 91122 Public administrative services… 91310 Administrative services related to… HC.7.2 Adm. of health financing 71322 Health insurance services 91310 Administrative services related to…
Source: Summarized from SHA 2011 table A.1.7.
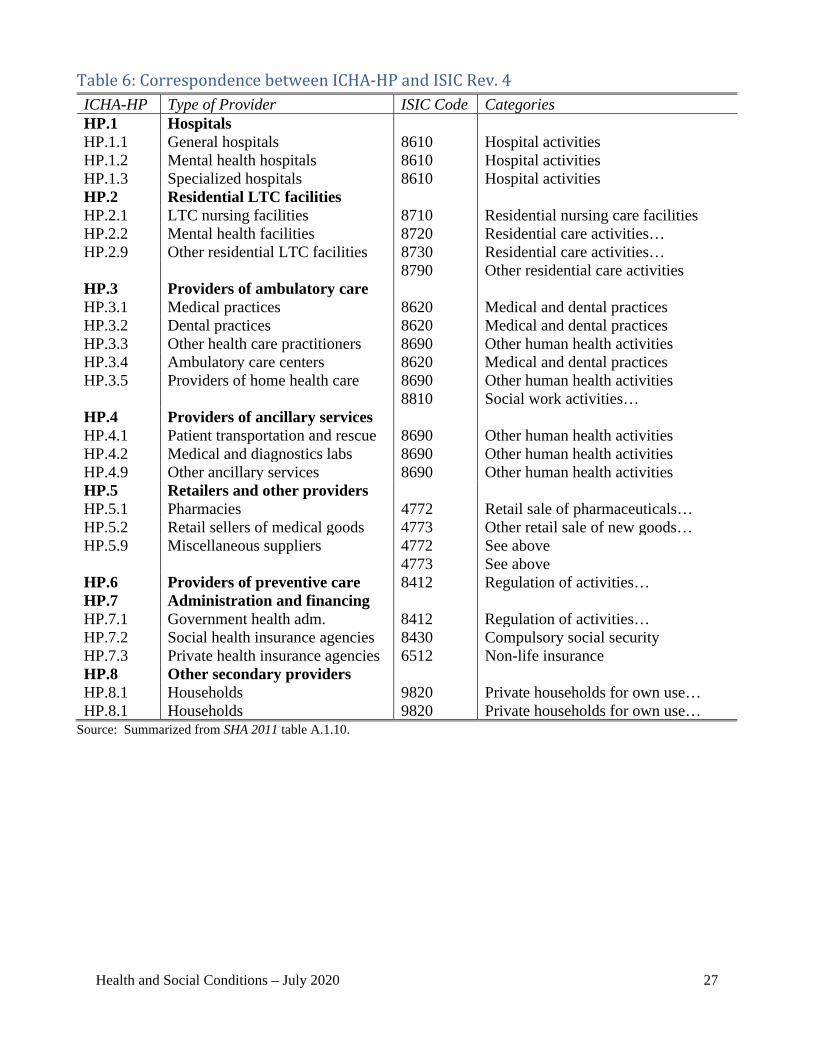
Health and Social Conditions – July 2020 27
Table 6: Correspondence between ICHA-HP and ISIC Rev. 4 ICHA-HP Type of Provider ISIC Code Categories HP.1 Hospitals HP.1.1 General hospitals 8610 Hospital activities HP.1.2 Mental health hospitals 8610 Hospital activities HP.1.3 Specialized hospitals 8610 Hospital activities HP.2 Residential LTC facilities HP.2.1 LTC nursing facilities 8710 Residential nursing care facilities HP.2.2 Mental health facilities 8720 Residential care activities… HP.2.9 Other residential LTC facilities 8730 Residential care activities… 8790 Other residential care activities HP.3 Providers of ambulatory care HP.3.1 Medical practices 8620 Medical and dental practices HP.3.2 Dental practices 8620 Medical and dental practices HP.3.3 Other health care practitioners 8690 Other human health activities HP.3.4 Ambulatory care centers 8620 Medical and dental practices HP.3.5 Providers of home health care 8690 Other human health activities 8810 Social work activities… HP.4 Providers of ancillary services HP.4.1 Patient transportation and rescue 8690 Other human health activities HP.4.2 Medical and diagnostics labs 8690 Other human health activities HP.4.9 Other ancillary services 8690 Other human health activities HP.5 Retailers and other providers HP.5.1 Pharmacies 4772 Retail sale of pharmaceuticals… HP.5.2 Retail sellers of medical goods 4773 Other retail sale of new goods… HP.5.9 Miscellaneous suppliers 4772 See above 4773 See above HP.6 Providers of preventive care 8412 Regulation of activities… HP.7 Administration and financing HP.7.1 Government health adm. 8412 Regulation of activities… HP.7.2 Social health insurance agencies 8430 Compulsory social security HP.7.3 Private health insurance agencies 6512 Non-life insurance HP.8 Other secondary providers HP.8.1 Households 9820 Private households for own use… HP.8.1 Households 9820 Private households for own use…
Source: Summarized from SHA 2011 table A.1.10.
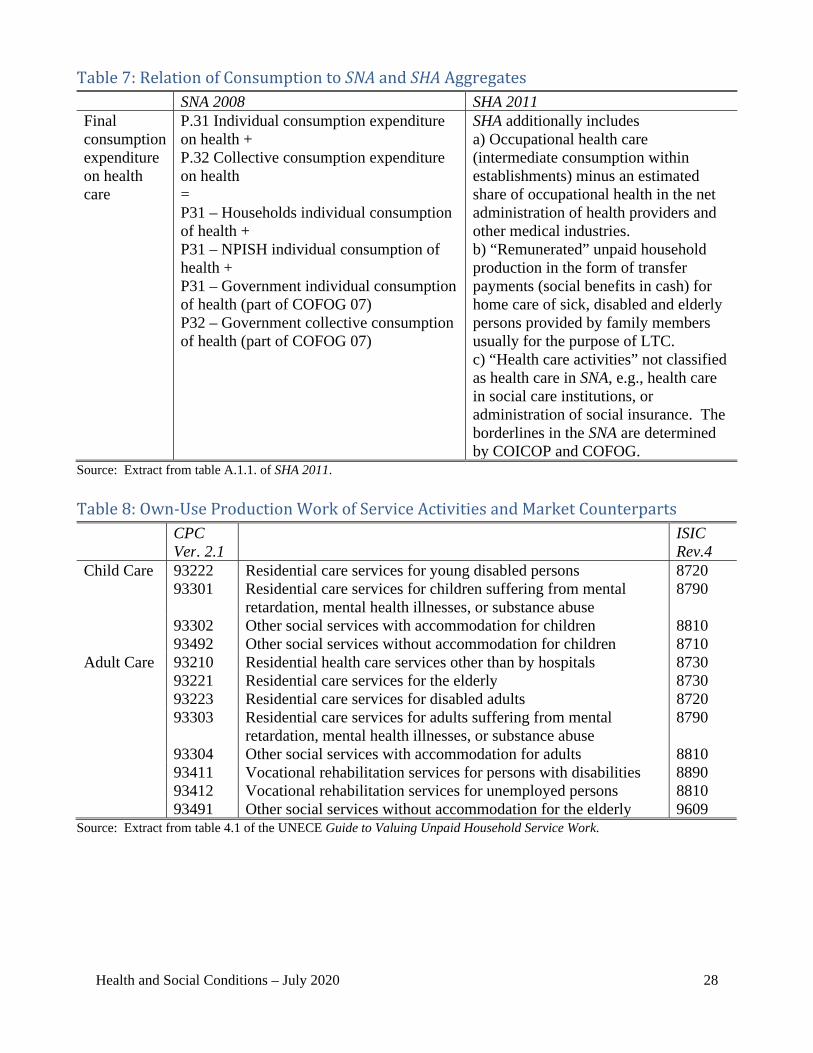
Health and Social Conditions – July 2020 28
Table 7: Relation of Consumption to SNA and SHA Aggregates SNA 2008 SHA 2011 Final consumption expenditure on health care
P.31 Individual consumption expenditure on health + P.32 Collective consumption expenditure on health = P31 – Households individual consumption of health + P31 – NPISH individual consumption of health + P31 – Government individual consumption of health (part of COFOG 07) P32 – Government collective consumption of health (part of COFOG 07)
SHA additionally includes a) Occupational health care (intermediate consumption within establishments) minus an estimated share of occupational health in the net administration of health providers and other medical industries. b) “Remunerated” unpaid household production in the form of transfer payments (social benefits in cash) for home care of sick, disabled and elderly persons provided by family members usually for the purpose of LTC. c) “Health care activities” not classified as health care in SNA, e.g., health care in social care institutions, or administration of social insurance. The borderlines in the SNA are determined by COICOP and COFOG.
Source: Extract from table A.1.1. of SHA 2011.
Table 8: Own-Use Production Work of Service Activities and Market Counterparts CPC
Ver. 2.1 ISIC
Rev.4 Child Care 93222 Residential care services for young disabled persons 8720 93301 Residential care services for children suffering from mental
retardation, mental health illnesses, or substance abuse 8790
93302 Other social services with accommodation for children 8810 93492 Other social services without accommodation for children 8710 Adult Care 93210 Residential health care services other than by hospitals 8730 93221 Residential care services for the elderly 8730 93223 Residential care services for disabled adults 8720 93303 Residential care services for adults suffering from mental
retardation, mental health illnesses, or substance abuse 8790
93304 Other social services with accommodation for adults 8810 93411 Vocational rehabilitation services for persons with disabilities 8890 93412 Vocational rehabilitation services for unemployed persons 8810 93491 Other social services without accommodation for the elderly 9609
Source: Extract from table 4.1 of the UNECE Guide to Valuing Unpaid Household Service Work.
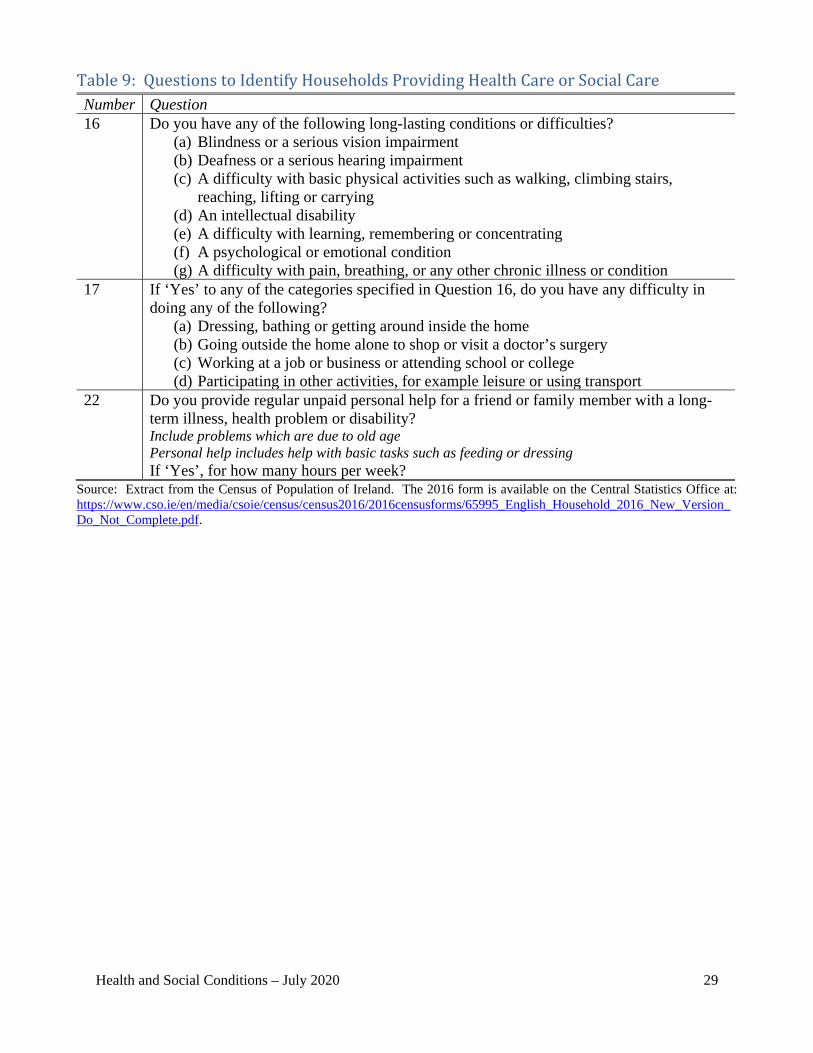
Health and Social Conditions – July 2020 29
Table 9: Questions to Identify Households Providing Health Care or Social Care Number Question 16 Do you have any of the following long-lasting conditions or difficulties?
(a) Blindness or a serious vision impairment (b) Deafness or a serious hearing impairment (c) A difficulty with basic physical activities such as walking, climbing stairs,
reaching, lifting or carrying (d) An intellectual disability (e) A difficulty with learning, remembering or concentrating (f) A psychological or emotional condition (g) A difficulty with pain, breathing, or any other chronic illness or condition
17 If ‘Yes’ to any of the categories specified in Question 16, do you have any difficulty in doing any of the following?
(a) Dressing, bathing or getting around inside the home (b) Going outside the home alone to shop or visit a doctor’s surgery (c) Working at a job or business or attending school or college (d) Participating in other activities, for example leisure or using transport
22 Do you provide regular unpaid personal help for a friend or family member with a long-term illness, health problem or disability? Include problems which are due to old age Personal help includes help with basic tasks such as feeding or dressing If ‘Yes’, for how many hours per week?
Source: Extract from the Census of Population of Ireland. The 2016 form is available on the Central Statistics Office at: https://www.cso.ie/en/media/csoie/census/census2016/2016censusforms/65995_English_Household_2016_New_Version_Do_Not_Complete.pdf.
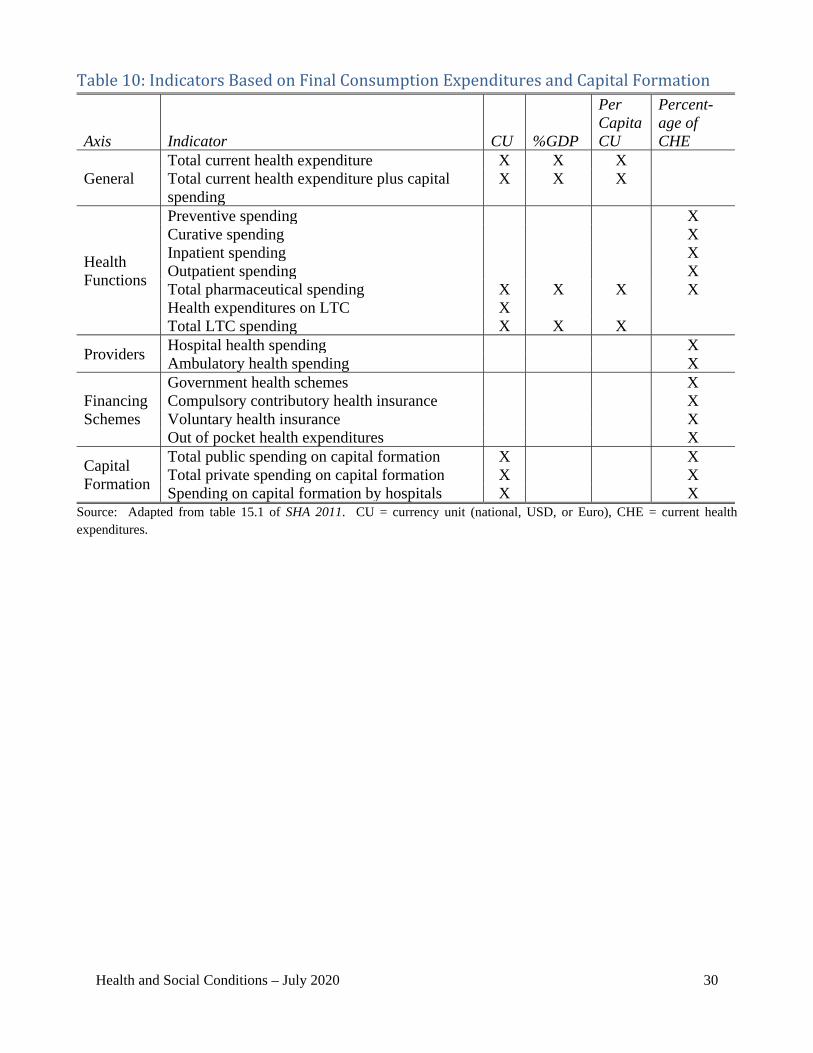
Health and Social Conditions – July 2020 30
Table 10: Indicators Based on Final Consumption Expenditures and Capital Formation
Axis Indicator CU %GDP
Per Capita CU
Percent-age of CHE
General Total current health expenditure X X X Total current health expenditure plus capital spending
X X X
Health Functions
Preventive spending X Curative spending X Inpatient spending X Outpatient spending X Total pharmaceutical spending X X X X Health expenditures on LTC X Total LTC spending X X X
Providers Hospital health spending X Ambulatory health spending X
Financing Schemes
Government health schemes X Compulsory contributory health insurance X Voluntary health insurance X Out of pocket health expenditures X
Capital Formation
Total public spending on capital formation X X Total private spending on capital formation X X Spending on capital formation by hospitals X X
Source: Adapted from table 15.1 of SHA 2011. CU = currency unit (national, USD, or Euro), CHE = current health expenditures.

Health and Social Conditions – July 2020 31
Annex B: Summary of Recommendations

Health and Social Conditions – July 2020 32
Recommendation 1: Assess whether the SHA functional classification (HC) defines the most relevant supplementary details for health in a national accounting context. Some elements of the SHA classification should be reexamined for this purpose (e.g., the feasibility of distinguishing expenditures between curative and rehabilitative care). Recommendation 2: The classifications in the SHA and the SNA should be harmonized to reflect the 2018 developments in national accounts COICOP and to facilitate embedding or linking indicators from the SHA to the SNA. Recommendation 3: Update the COFOG classification for health (division 07) to at least reflect changes introduced in the 2018 COICOP classification and to account for the detail necessary to be useful for policy analysis of health. Recommendation 4: Review detail in the product classification of Annex E of SHA 2011 to identify additional products that are relevant for policy decisions to be based on details in supply-use tables. The SNA and the SHA should be harmonized—even though there may be differences regarding details in the two systems, they should be consistent at an aggregate level. Recommendation 5: A supplementary supply-use table from health accounts should be set up to ensure consistency and completeness in analyses of health care. Table 29.4 of SNA 2008 provides an example of supply-use tables that could be compiled from the SHA. Recommendation 6: More research is needed to develop a comprehensive and consistent list of secondary health outputs across countries and how those outputs can fit into the various national accounting classification systems. Recommendation 7: Consistent with SNA recommendations and conclusions of country experiences, research should continue to better understand the quality of health care and to best reflect quality changes in volume measures of health care services in national accounts. Recommendation 8: A framework on well-being and sustainability should cover all expenditures on health care and long-term social care. Recommendation 9: Purchased occupational health services in the SNA should be identified as health expenditures (i.e., health output financed by corporations, government, and non-profit institutions), which will remain allocated to intermediate consumption. Recommendation 10: Own-account production of occupational health services in the SNA should be imputed as secondary output and allocated to intermediate consumption. Recommendation 11: A breakdown of insurance claims and premiums by business area, including total health, could be introduced as a supplement to the SNA central system. Recommendation 12: An assessment could be made for the feasibility of a supplement to the SNA central system for additional breakdowns of health insurance claims and premiums by health function (HC) similar to the SHA.
Health and Social Conditions – July 2020 33
Recommendation 13: Experience developed in the course of SHA data collection could be used to define distinctions for health insurance along dimensions including voluntary/compulsory, private/public, and individual/social as a supplement to the SNA central system. Recommendation 14: A framework on well-being and sustainability should expand the production boundary to include imputed values for unpaid household production of health care and long-term social care in an extension outside the SNA central system. The valuation should be in line with proposals from the Guidance Note on Unpaid Household Activities. From this follows that the imputation of production must be allocated to users and relevant functions. In addition, data would have to be accurately coded to 2018 COICOP to facilitate classification to either health care or social care for the correct recording of activities within the health care boundary or social care boundary necessary for consistent recording of the expenditures. Recommendation 15: Review the SHA for relevant indicators based on final consumption expenditures with breakdowns by function, provider, and financing schemes for possible inclusion in the SNA core framework. Recommendation 16: Compile a list of relevant indicators based on physical measures and determine how the indicators could be linked to the SNA core framework. Recommendation 17: Compile a list of relevant indicators based on the two developments outside the SNA central system (i.e., supplemental classifications for private health insurance and unpaid household production of health care and long-term social care) and determine how the indicators could be linked to the SNA core framework.
Related Documents
![WEBINAR: Your Meeting's Footprint [ New Sustainability Perspective]](https://static.cupdf.com/doc/110x72/55a696d71a28ab7c2d8b465f/webinar-your-meetings-footprint-new-sustainability-perspective.jpg)