Webinar Electric Utility Industry 101 David Schlissel Cathy Kunkel March 4, 2015

Welcome message from author
This document is posted to help you gain knowledge. Please leave a comment to let me know what you think about it! Share it to your friends and learn new things together.
Transcript

Webinar
Electric Utility Industry 101
David Schlissel
Cathy Kunkel
March 4, 2015

Webinar Outline
2
• History: regulation and deregulation
• Regional electricity markets
• Types of companies
• How investment decisions are made
• Industry trends
• Components of power plant costs
• Metrics for evaluating power plant performance
• Where to find data
©2015 The Institute for Energy Economics & Financial Analysis

History
3
• 1935: Public Utility Holding Company Act• Restricted utility corporate structures and mergers
• 1990s: Restructuring of electric utility industry in some states• Break-up of vertically integrated utilities into power
generation companies, transmission companies, and distribution companies
• Only distribution companies remain under state public service commission regulation
• Not all states deregulated
©2015 The Institute for Energy Economics & Financial Analysis

Independent System Operators (ISOs)
4
• Federal Energy Regulatory Commission encouraged formation of Independent System Operators and Regional Transmission Organizations (RTOs)
• Ensure open access to the transmission grid, to facilitate competition
• Created and manage wholesale markets for electricity
©2015 The Institute for Energy Economics & Financial Analysis

Map of ISOs
5©2015 The Institute for Energy Economics & Financial Analysis

Electricity Markets - Energy
6©2015 The Institute for Energy Economics & Financial Analysis

Historical PJM Energy Market Prices
7©2015 The Institute for Energy Economics & Financial Analysis
Aug-0
5
Dec-0
5
Apr-0
6
Aug-0
6
Dec-0
6
Apr-0
7
Aug-0
7
Dec-0
7
Apr-0
8
Aug-0
8
Dec-0
8
Apr-0
9
Aug-0
9
Dec-0
9
Apr-1
0
Aug-1
0
Dec-1
0
Apr-1
1
Aug-1
1
Dec-1
1
Apr-1
2
Aug-1
2
Dec-1
2
Apr-1
3
Aug-1
3
Dec-1
3
Apr-1
4.00
20.00
40.00
60.00
80.00
100.00
120.00
140.00
160.00
180.00
Historic power prices (PJM Western Hub)
On-peak Off-peak
$/M
Wh

Electricity Markets - Capacity
8
• Supposed to ensure that there are enough power plants to meet reliability goals
• Forward auction to purchase capacity several years in advance
• Have not provided stable price signal
• Only in PJM, NYISO, ISO-NE and MISO
©2015 The Institute for Energy Economics & Financial Analysis
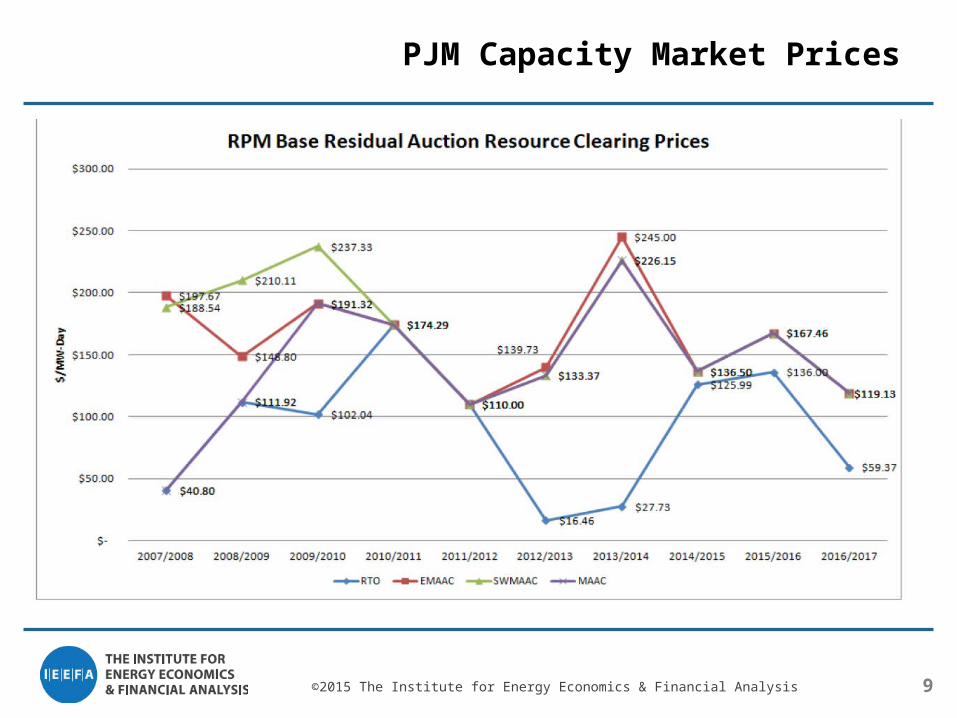
PJM Capacity Market Prices
9©2015 The Institute for Energy Economics & Financial Analysis
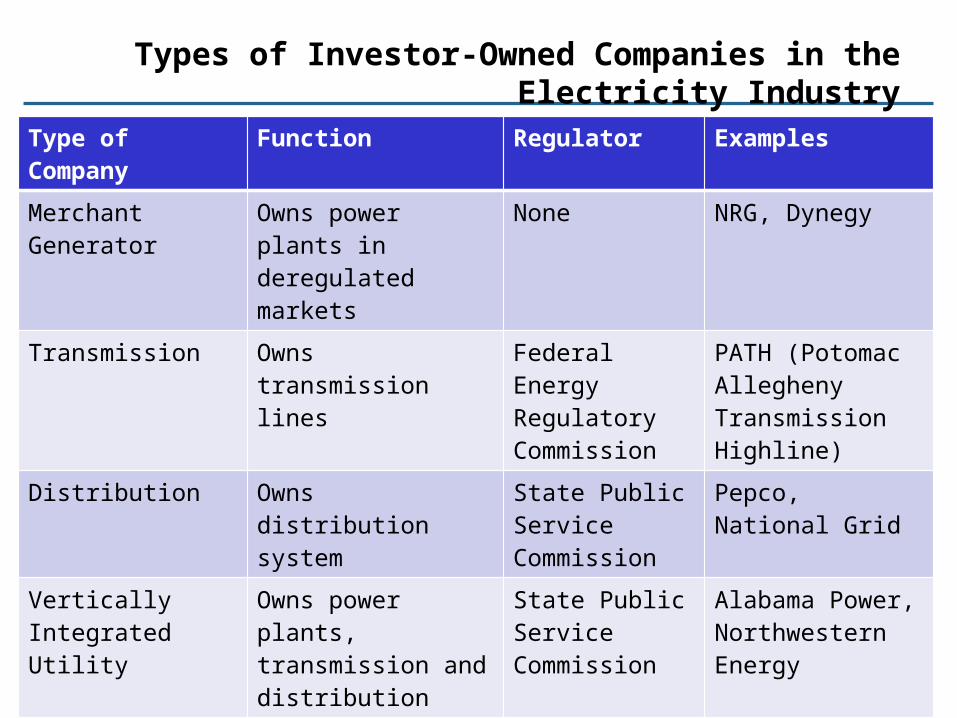
Types of Investor-Owned Companies in the Electricity Industry
10©2015 The Institute for Energy Economics & Financial Analysis
Type of Company Function Regulator Examples
Merchant Generator
Owns power plants in deregulated markets
None NRG, Dynegy
Transmission Owns transmission lines
Federal Energy Regulatory Commission
PATH (Potomac Allegheny Transmission Highline)
Distribution Owns distribution system
State Public Service Commission
Pepco, National Grid
Vertically Integrated Utility
Owns power plants, transmission and distribution
State Public Service Commission
Alabama Power, Northwestern Energy

Utility Holding Companies
11
• One investor-owned holding company can own a number of different subsidiaries and affiliates:
• Southern Company owns:• Regulated vertically integrated utilities
• Merchant generation
• Exelon Corporation owns:• Merchant generation
• Transmission
• Distribution
• AEP and FirstEnergy each own:• Merchant generation
• Transmission
• Distribution
• Regulated vertically integrated utilities
©2015 The Institute for Energy Economics & Financial Analysis
Types of Power Plant Owners
12
• Merchant Generation Companies
• Vertically Integrated Investor Owned Utilities
• Public Power utilities
• Electric Membership Co-operatives (EMC)
• Power agencies
©2015 The Institute for Energy Economics & Financial Analysis

Investment decisions
13©2015 The Institute for Energy Economics & Financial Analysis
Company Type Factors driving investment
Merchant generators • Wholesale electricity price outlook
• Not interested in investing in capital- intensive generation (e.g. nuclear, coal) if prices are expected to remain low
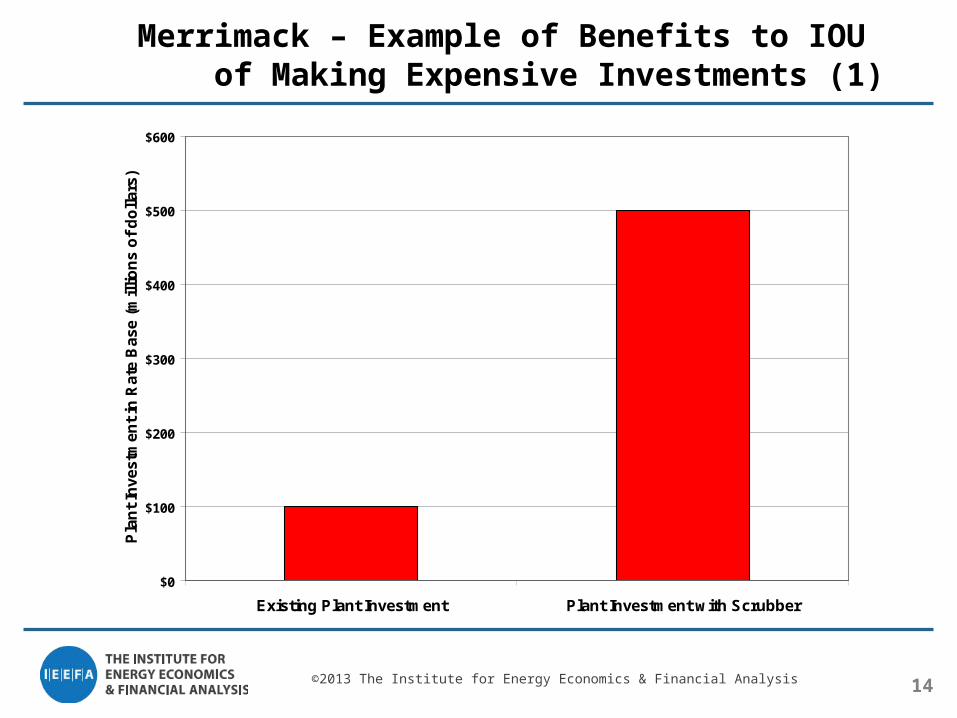
Vertically integrated utilities
• Regulatory environment and expected rate of return
• Want to make capital-intensive investments (new generation, pollution control equipment) to earn a rate of return through electric rates
Publicly owned utilities • Cost of debt
14©2013 The Institute for Energy Economics & Financial Analysis
Merrimack – Example of Benefits to IOU of Making Expensive Investments (1)
$0
$100
$200
$300
$400
$500
$600
Existing Plant Investment Plant Investment with Scrubber
Pla
nt
Inve
stm
ent
in R
ate
Bas
e (m
illi
on
s o
f d
oll
ars)

15©2013 The Institute for Energy Economics & Financial Analysis
Merrimack – Example of Benefits to IOU of Making Expensive Investments (2)
$0
$10
$20
$30
$40
$50
$60
Existing Plant With Scrubber
Pre
-ta
x R
etu
rn o
n R
ate
Ba
se
Fro
m
Me
rrim
ac
k S
tati
on
(m
illio
ns
of
do
llars
)
Financial incentives driving corporate policy
16
• Merchant generation companies: • Interested in driving up wholesale electricity market
prices
• Advocate for rule changes at ISOs
• Want to block competition from other sources, e.g. from energy efficiency and renewables
• Vertically integrated companies:• Interested in increasing sales to earn more money
(rates set on a per kWh basis)
• Incentive to oppose energy efficiency and customer-owned power generation (e.g. rooftop solar)
©2015 The Institute for Energy Economics & Financial Analysis

Recent Industry Trends
17
• Opposition to energy efficiency and rooftop solar
• Move back towards regulation• Acquire regulated utilities
• Sell merchant generation business
• Transfer assets from merchant generation to regulated subsidiaries
©2015 The Institute for Energy Economics & Financial Analysis

Webinar Outline
18
• History: regulation and deregulation
• Regional electricity markets
• Types of companies
• How investment decisions are made
• Industry trends
• Components of power plant costs
• Metrics for evaluating power plant performance
• Where to find data
©2015 The Institute for Energy Economics & Financial Analysis

Components of Power Plant Costs
19
• Capital cost is the cost of building the power plant and making periodic equipment replacements, major repairs and/or plant upgrades.
• Cost of financing these capital expenditures are included in ongoing cost of generating power: • For investor-owned companies these financing costs are a
blend of shareholder provided funds (equity) and borrowed money (debt).
• For publicly-owned utilities and electric membership co-ops, financing costs are debt.
• General Rule -- The more it costs to build the plant, the higher the annual financing costs will be – depending on the equity and debt borrowing rates.
©2015 The Institute for Energy Economics & Financial Analysis
Components of Power Plant Costs (Cont’d)
20
• Annual depreciation expenses. • the cost of building a power plant is amortized (spread) over
the expected life of the plant. The plant owner collects this amount each year as a depreciation expense.
• For example, if it costs $1 billion to build a new fossil-fired plant with an expected depreciation life of 25 years, each year the plant owner will recover $40 million (that is, $1 billion divided by 25) through the cost of the power generated by the plant. .
• Plant operating & maintenance (O&M) costs.• Labor, materials, etc.
• Fuel costs.
• Cost of transmitting power from plant where it is generated to places where it is used.
©2015 The Institute for Energy Economics & Financial Analysis

Fixed vs. Variable Power Plant Operating Costs
21
• Fixed vs. variable costs.• Financing & almost all O&M costs are ‘fixed” – have to be
paid whether or not plant generates any power or how much it generates.
• Other costs, like fuel and some O&M, are ‘variable.’ These fluctuate depending on how many MWh are generated.
• Examples of variable O&M costs include costs of operating plant environmental control equipment
©2015 The Institute for Energy Economics & Financial Analysis

22
Example of Rising Plant Construction Costs – Kemper IGCC Coal Plant - Mississippi
©2015 The Institute for Energy Economics & Financial Analysis

23
Relative Costs Among Supply-Side and Demand-Side Resources
©2015 The Institute for Energy Economics & Financial Analysis

24
Power Plant Cost Components – Example Prairie State Energy Campus
©2015 The Institute for Energy Economics & Financial Analysis
Power Plant Metrics - Capacity & Energy
25
• Capacity is a measure of the power that a plant can produce at any one moment or instance – measured in megawatts (MW) which are millions of watts.• Large fossil and nuclear power plants have full power
ratings in the range of 250 MW to 1500 MW.
• A large power plant will generally have several units at the same site.
• Energy is a measure of how much power the plant generates over time, whether hours, days, months or years – measured in Megawatt-Hours (MWh)• Example – a 100 MW power plant that generates at full
power for 10 hours will produce 1,000 MWh
©2015 The Institute for Energy Economics & Financial Analysis
Power Plant Metric - Capacity Factor
26
• A power plant’s ‘capacity factor’ is a measure of how much energy (in MWh) it generates during the period of time being examined.
• Capacity factor is given as a % - the plant’s actual generation (in MWh) in the period divided by the power it would have generated if it had operated at full power for all hours.• Example – a power plant with a full power rating of
100 MW operates at only 50 MW for all of the hours of the period – its capacity factor is 50%.
• The amount of power generated by a plant will change (perhaps frequently) in response to plant outages, equipment problems or economic factors.
• The higher the capacity factor, the better.
©2015 The Institute for Energy Economics & Financial Analysis
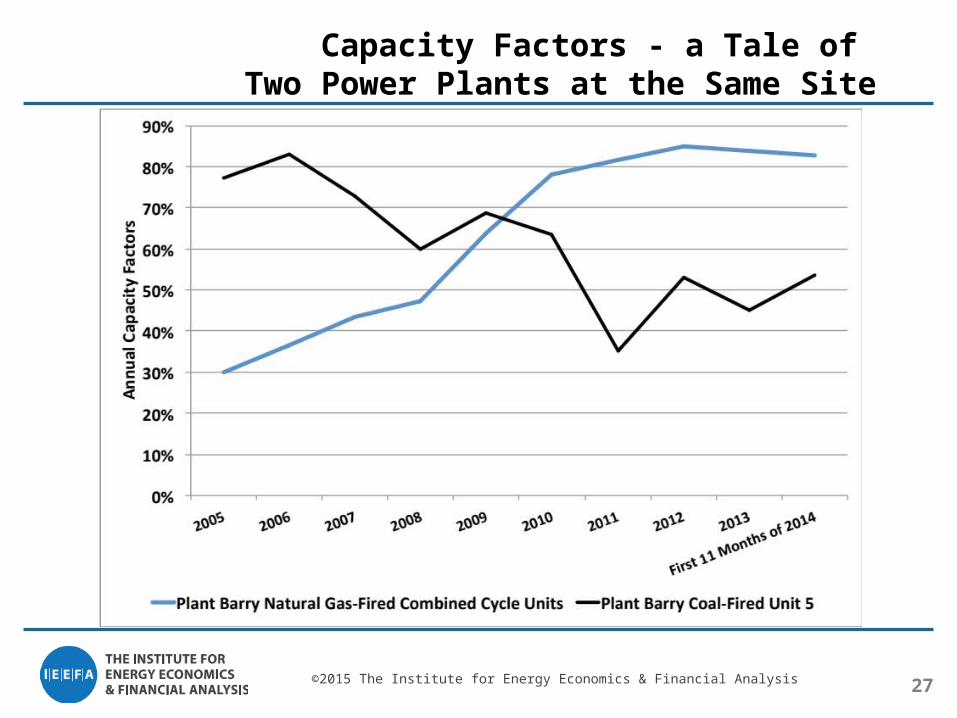
27
Capacity Factors - a Tale of Two Power Plants at the Same Site
©2015 The Institute for Energy Economics & Financial Analysis

Power Plant Metric - Heat Rate
28
• A power plant’s ‘heat rate’ measures how efficiently the plant burns fuel – the more efficiently the plant burns fuel, the less fuel it needs, and, consequently, the lower its fuel costs.
• Heat rate is measured in British Thermal Units (btu) – energy input from fuel - per kilowatt-hour of electricity generated – btu/kwh
• The lower the heat rate, the better – this means it requires less energy input from the fuel to produce an average kwh of electricity.
©2015 The Institute for Energy Economics & Financial Analysis

29
Illustrative Power Plant Heat Rates
©2015 The Institute for Energy Economics & Financial Analysis

30
Fuel or Generation Mix – New England in 2013
©2015 The Institute for Energy Economics & Financial Analysis

Where Can You Find Information about Power Plant Operations and Costs
31
• Investor-owned companies (both regulated utilities and merchant) - Form 10-K annual filings to U.S. Securities and Exchange Commission.
• Regulated investor-owned utilities – Form 1 annual filings to state utility commission and/or Federal Energy Regulatory Commission.
• Data filed by plant owners with the U.S. Energy Information Administration of the Department of Energy – especially Forms 860, 861, 923.
• Public power utilities and electric membership cooperatives – Ask nicely, find a friendly board member to ask for info, file Freedom of Information Act requests (FOIA) requests.
• Ask IEEFA or Synapse Energy Economics.
©2015 The Institute for Energy Economics & Financial Analysis
32
Thank you!!
Contact:David Schlissel: [email protected]
Cathy Kunkel: [email protected]
©2015 The Institute for Energy Economics & Financial Analysis
Related Documents