Welcome message from author
This document is posted to help you gain knowledge. Please leave a comment to let me know what you think about it! Share it to your friends and learn new things together.
Transcript

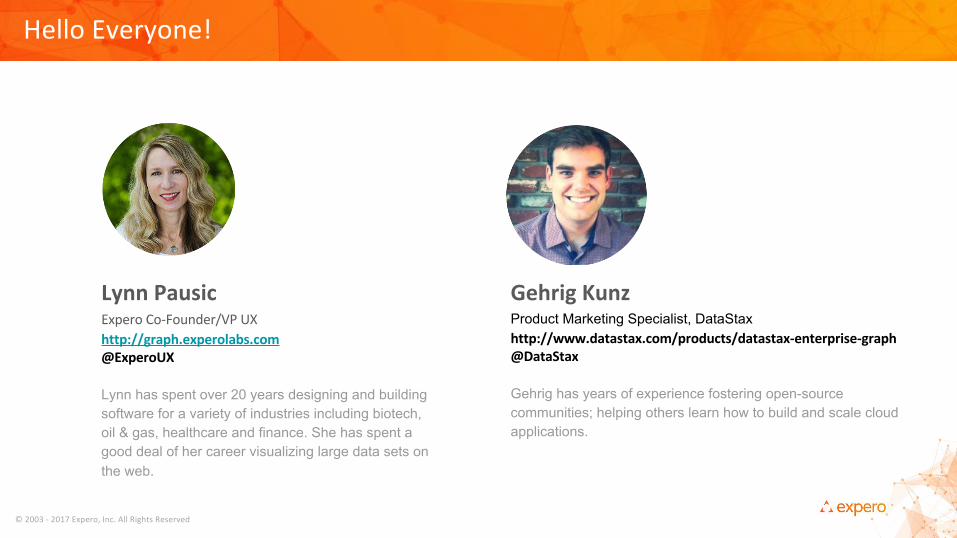
Lynn has spent over 20 years designing and building software for a variety of industries including biotech, oil & gas, healthcare and finance. She has spent a good deal of her career visualizing large data sets on the web
Product Marketing Specialist, DataStax
Gehrig has years of experience fostering open-source communities; helping others learn how to build and scale cloud applications.
●●●●●●
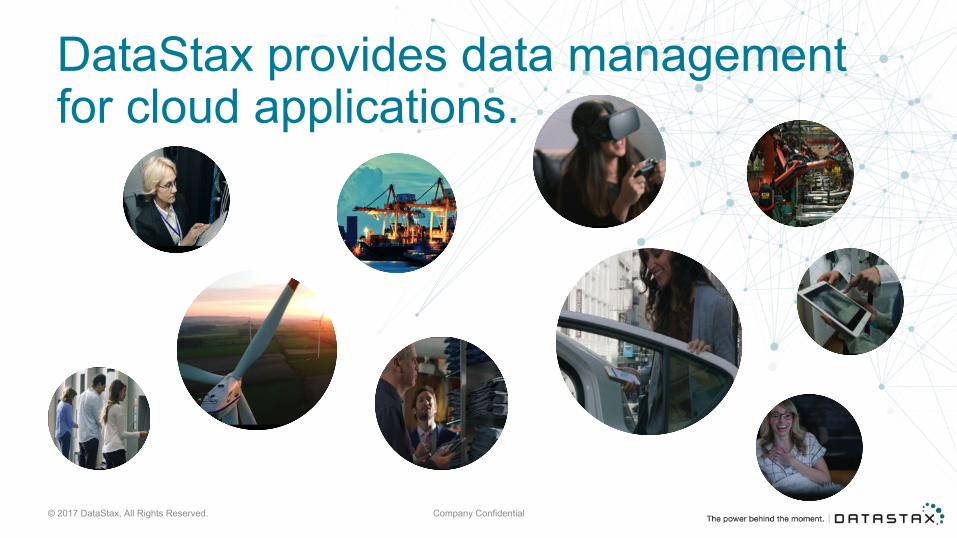
DataStax provides data management for cloud applications.
© 2017 DataStax, All Rights Reserved. Company Confidential
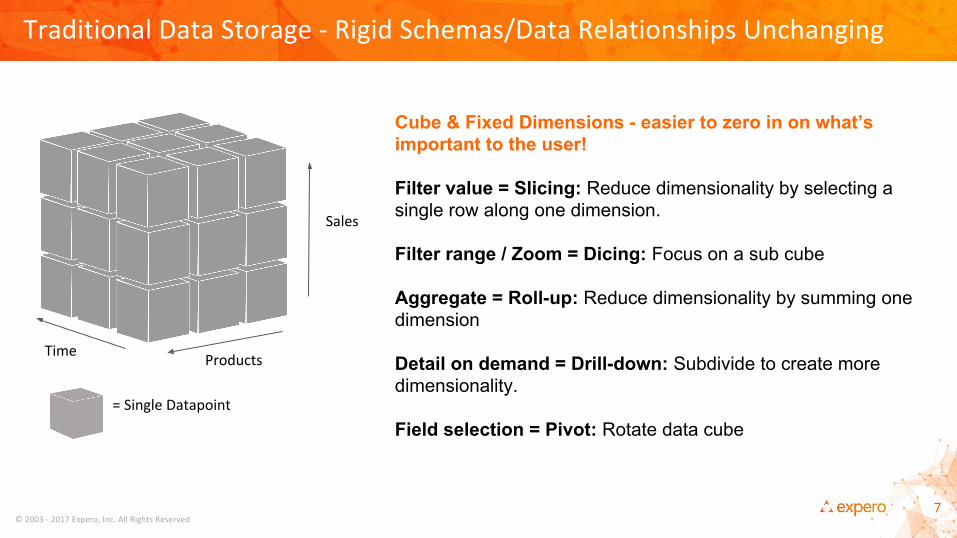
Cube & Fixed Dimensions - easier to zero in on what’s important to the user!
Filter value = Slicing: Reduce dimensionality by selecting a single row along one dimension.
Filter range / Zoom = Dicing: Focus on a sub cube
Aggregate = Roll-up: Reduce dimensionality by summing one dimension
Detail on demand = Drill-down: Subdivide to create more dimensionality.
Field selection = Pivot: Rotate data cube
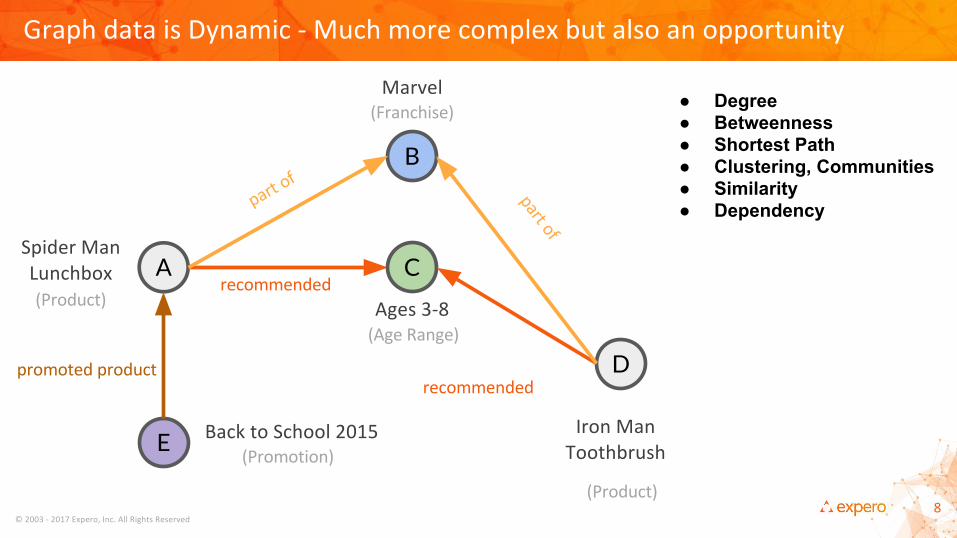
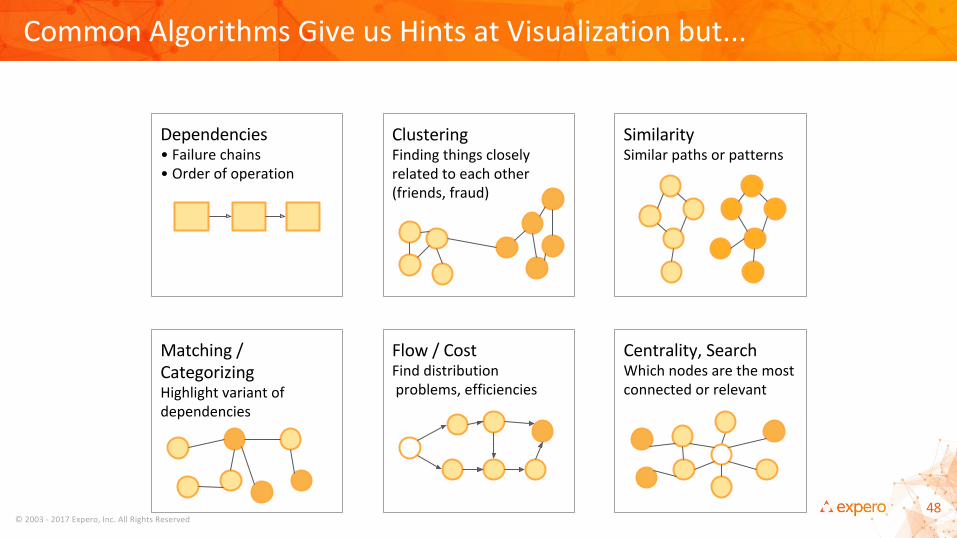
● Degree● Betweenness● Shortest Path ● Clustering, Communities● Similarity● Dependency
A C
B
D
E
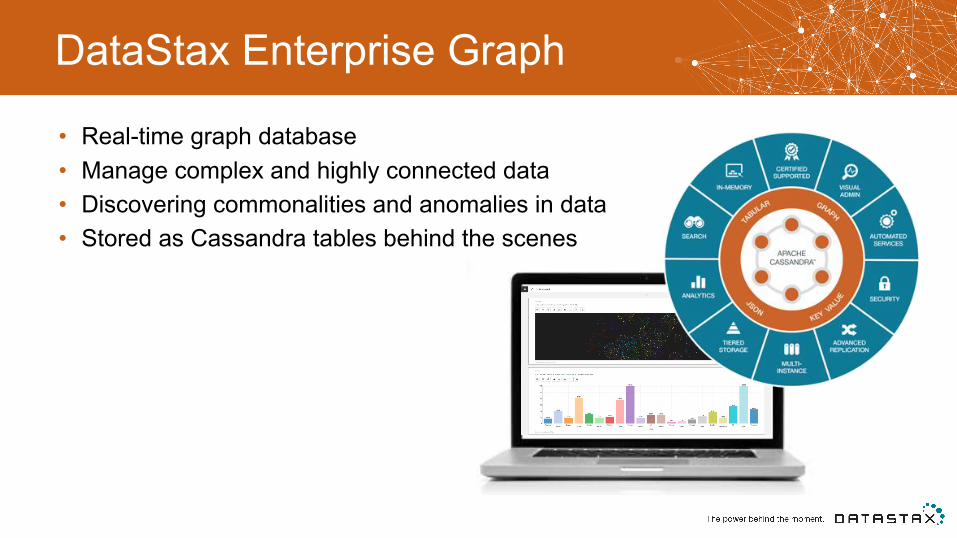
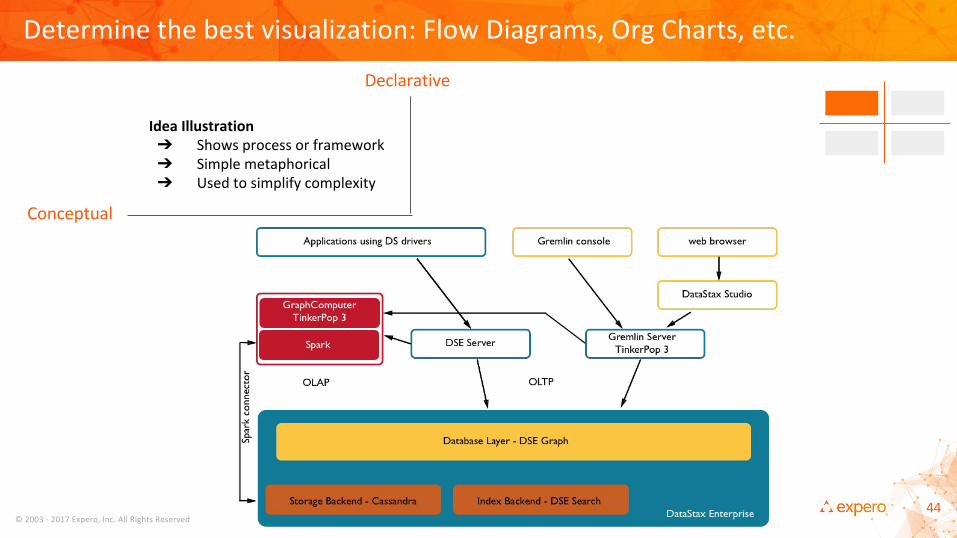
DataStax Enterprise Graph
• Real-time graph database• Manage complex and highly connected data• Discovering commonalities and anomalies in data• Stored as Cassandra tables behind the scenes
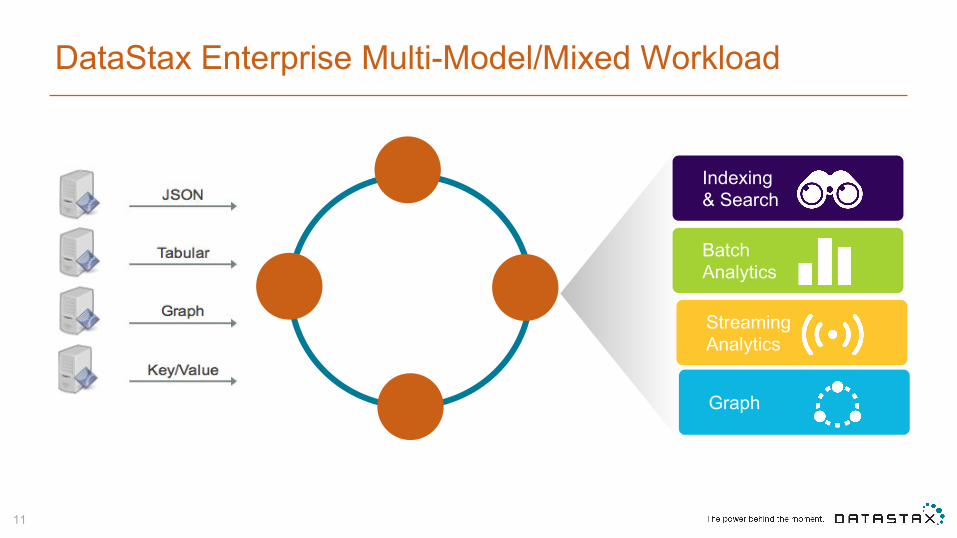
Indexing& Search
StreamingAnalytics
Graph
BatchAnalytics
DataStax Enterprise Multi-Model/Mixed Workload
11
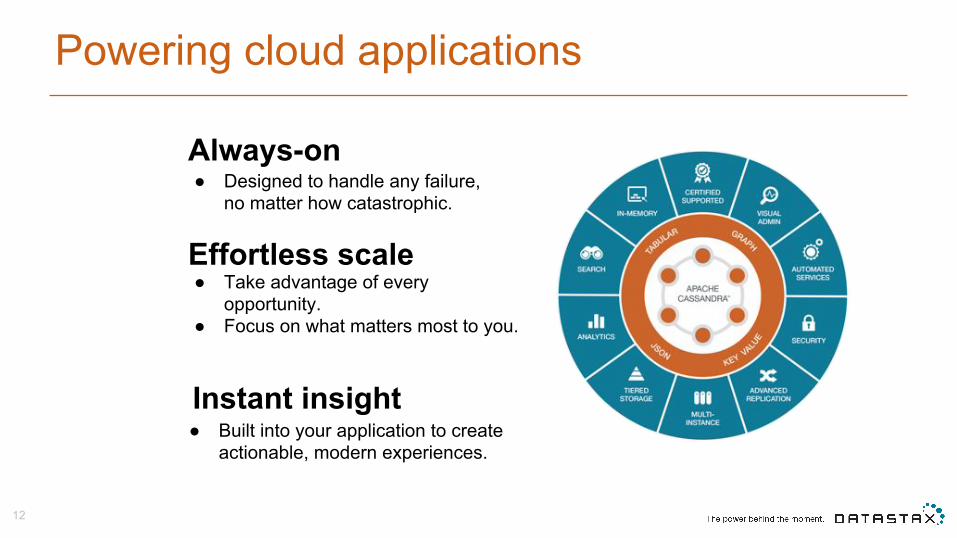
Powering cloud applications
12
Effortless scale
Always-on● Designed to handle any failure,
no matter how catastrophic.
● Take advantage of every opportunity.
● Focus on what matters most to you.
Instant insight● Built into your application to create
actionable, modern experiences.
Copyright of Shell International RESTRICTED 15
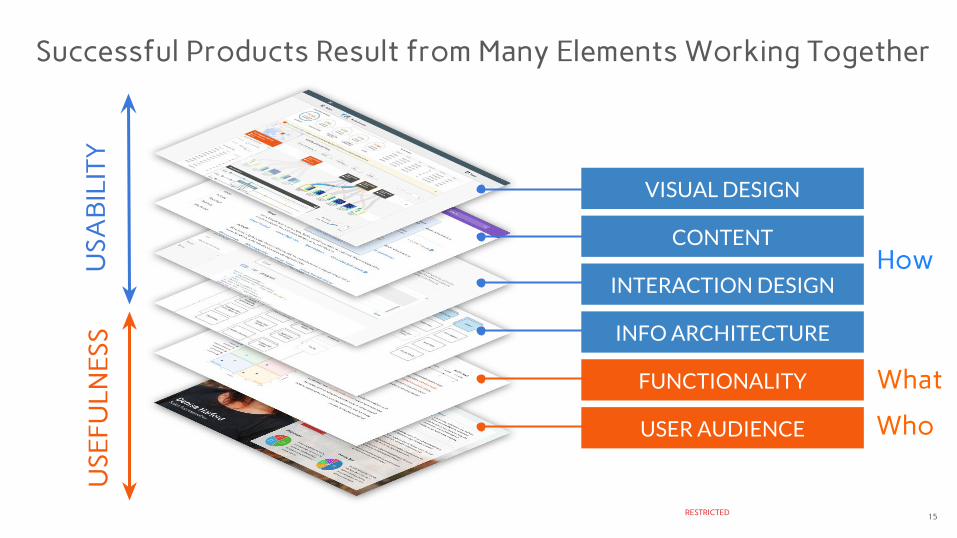
Successful Products Result from Many Elements Working Together
VISUAL DESIGN
CONTENT
INTERACTION DESIGN
INFO ARCHITECTURE
FUNCTIONALITY
USER AUDIENCE
USA
BIL
ITY
USE
FULN
ESS
Who
What
How
…
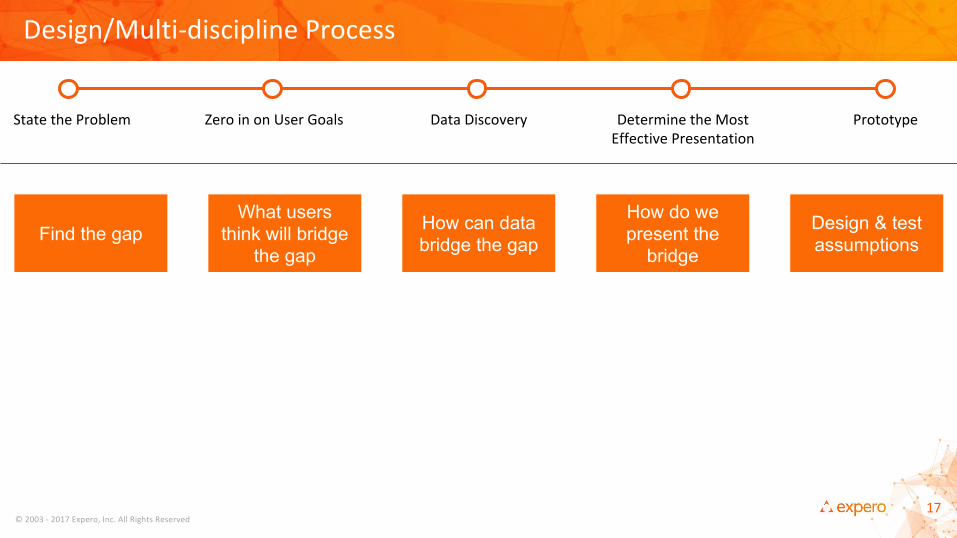
Find the gapWhat users
think will bridge the gap
How can data bridge the gap
How do we present the
bridge
Design & test assumptions

●●
●
●●●
Copyright of Shell International RESTRICTED 20
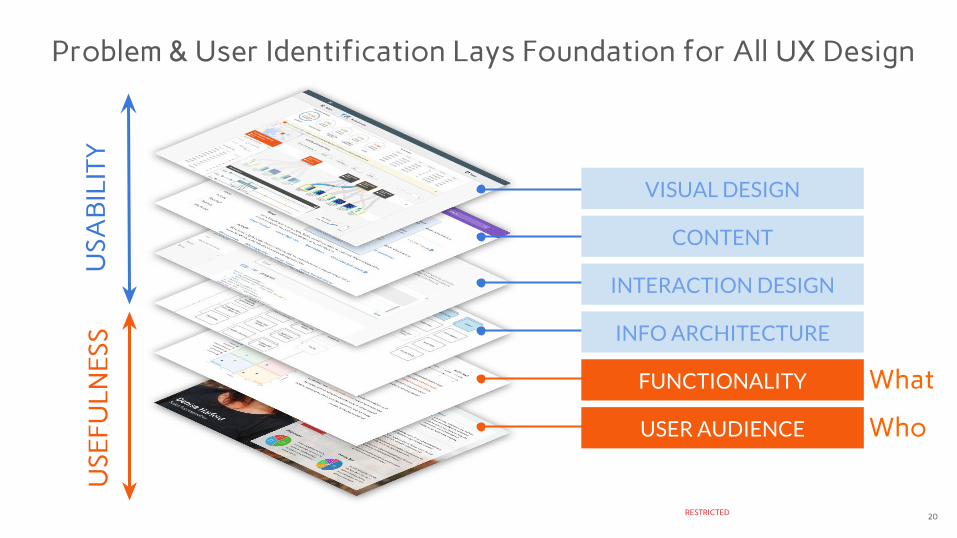
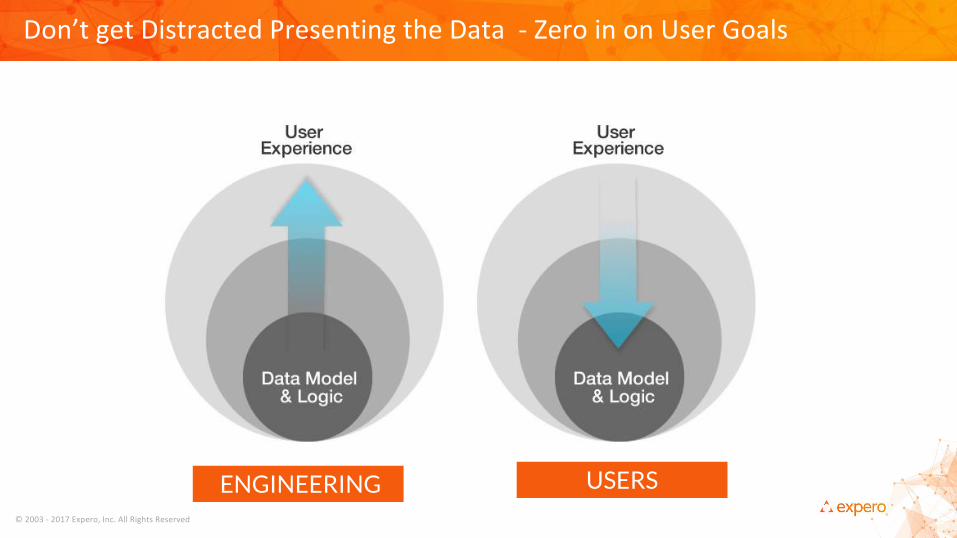
Problem & User Identification Lays Foundation for All UX Design
VISUAL DESIGN
CONTENT
INTERACTION DESIGN
INFO ARCHITECTURE
FUNCTIONALITY
USER AUDIENCE
USA
BIL
ITY
USE
FULN
ESS
What
Who
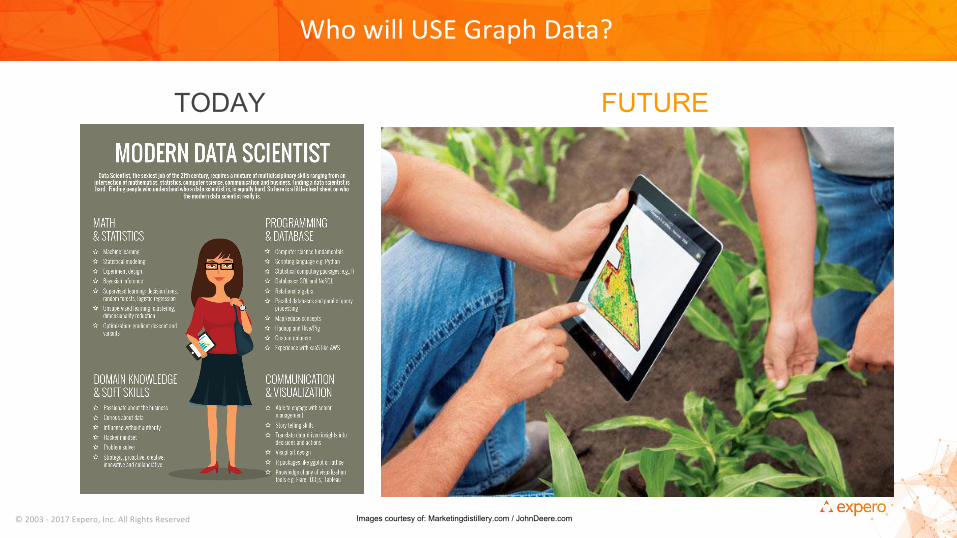
TODAY FUTURE
Images courtesy of: Marketingdistillery.com / JohnDeere.com
●●●
●●
●
●●
●●
…
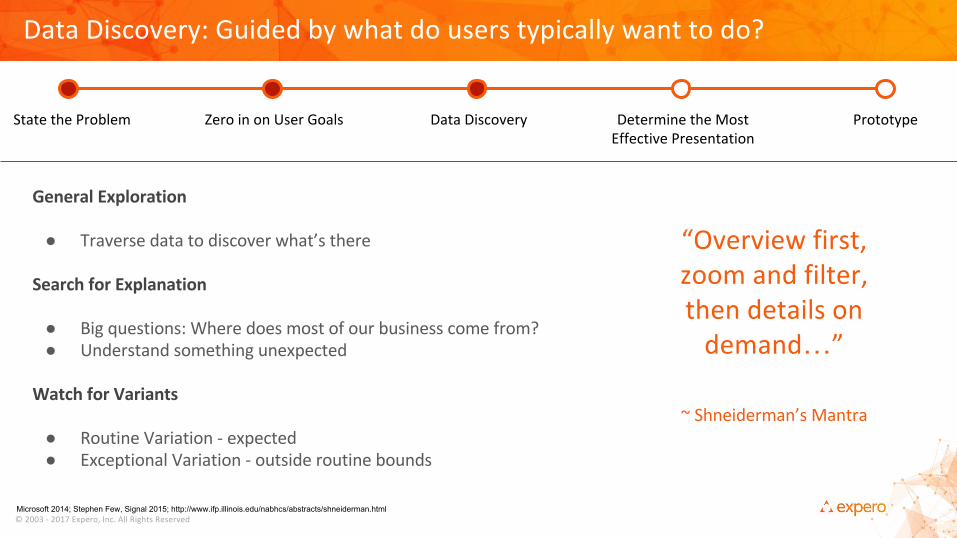
Microsoft 2014; Stephen Few, Signal 2015; http://www.ifp.illinois.edu/nabhcs/abstracts/shneiderman.html
●●●●●
●●●●
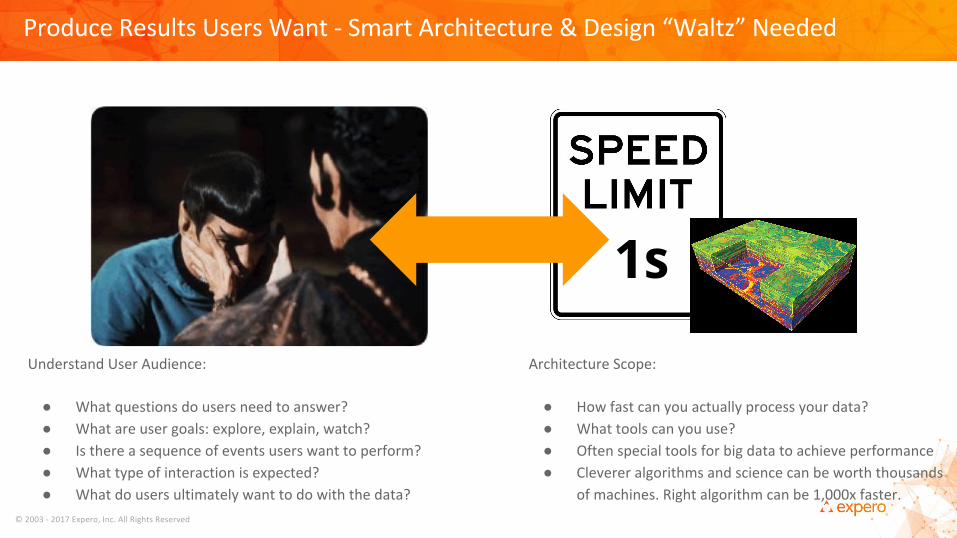
1s
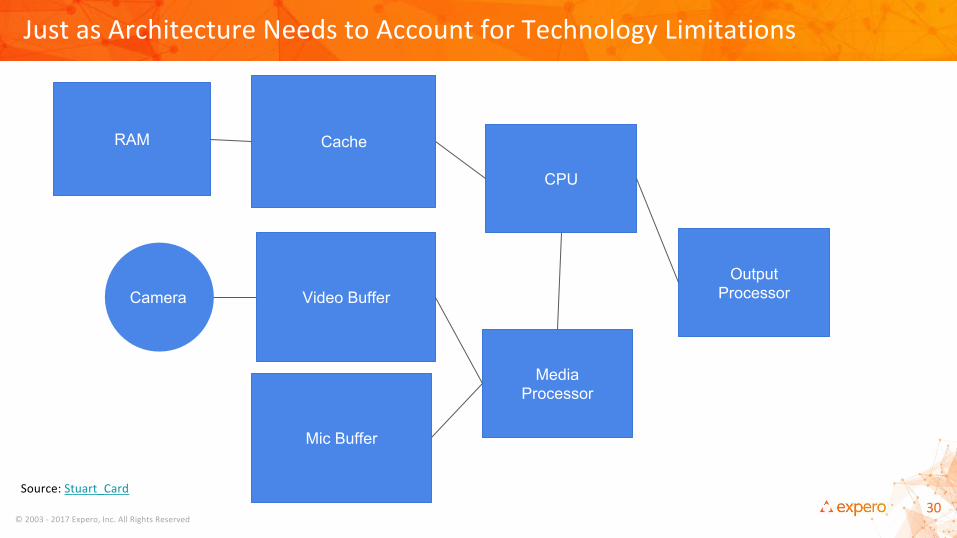
RAM Cache
CPU
OutputProcessor
MediaProcessor
Video Buffer
Mic Buffer
Camera
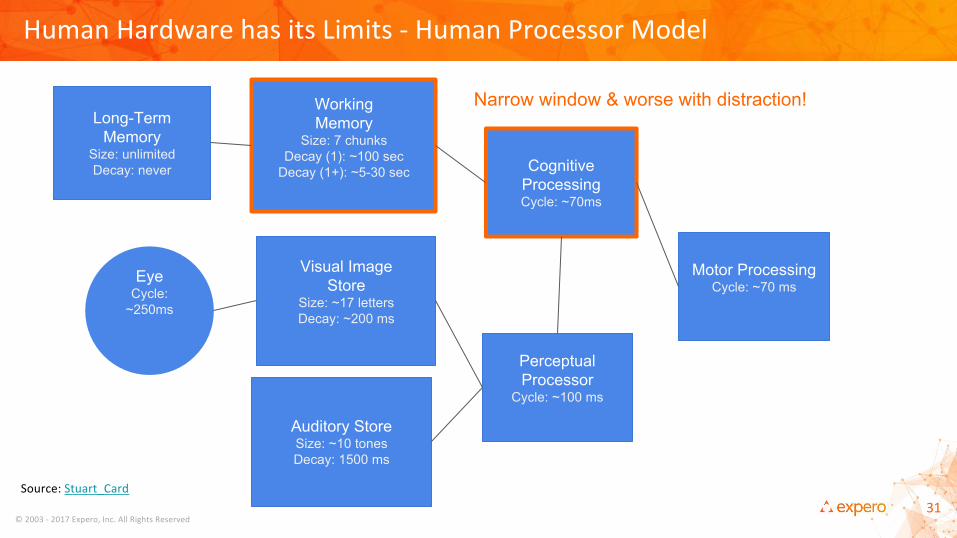
Long-Term Memory
Size: unlimitedDecay: never
Working Memory
Size: 7 chunksDecay (1): ~100 sec
Decay (1+): ~5-30 sec
Cognitive ProcessingCycle: ~70ms
Motor ProcessingCycle: ~70 ms
Perceptual Processor
Cycle: ~100 ms
Visual Image Store
Size: ~17 lettersDecay: ~200 ms
Auditory StoreSize: ~10 tonesDecay: 1500 ms
EyeCycle:
~250ms
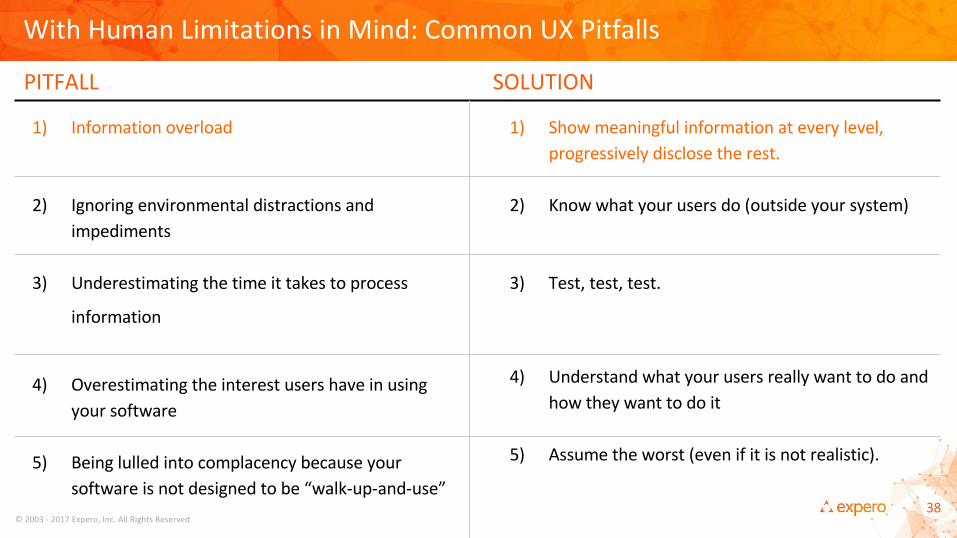
Narrow window & worse with distraction!
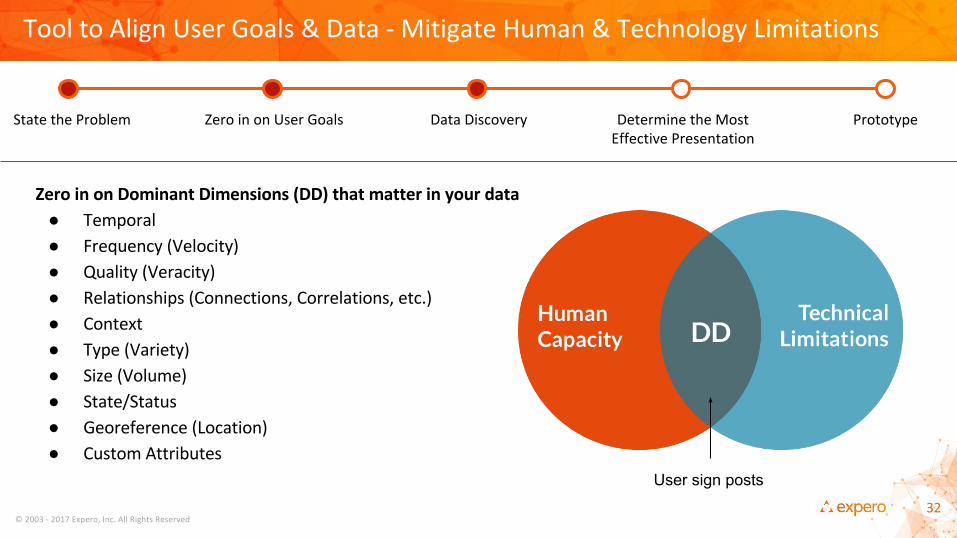
●●●●●●●●●●
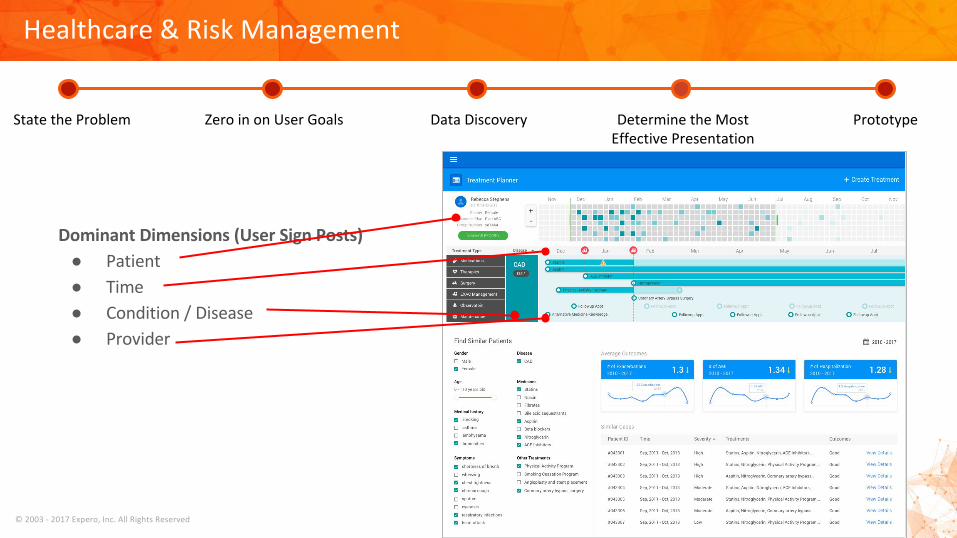
User sign posts
Copyright 2015 Expero, Inc. All Rights Reserved 8/11/2015
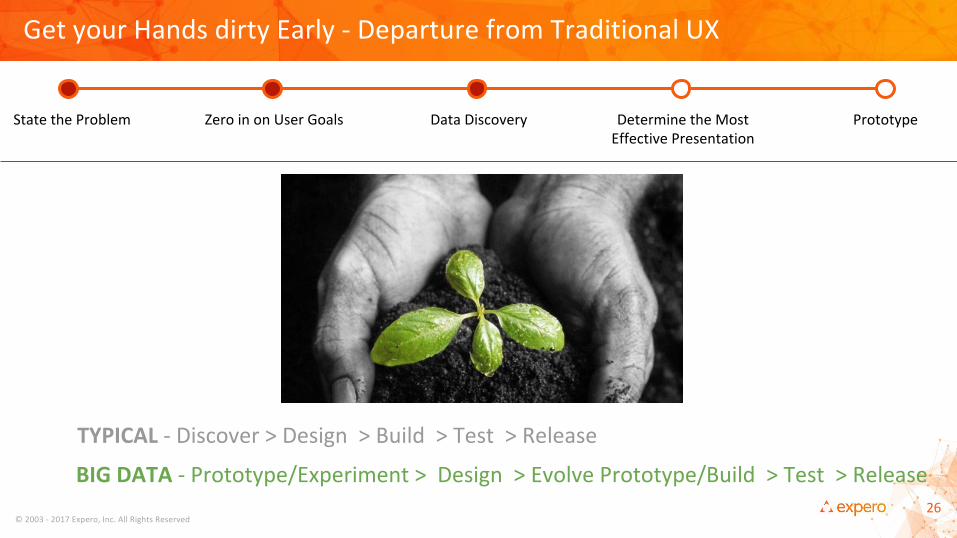
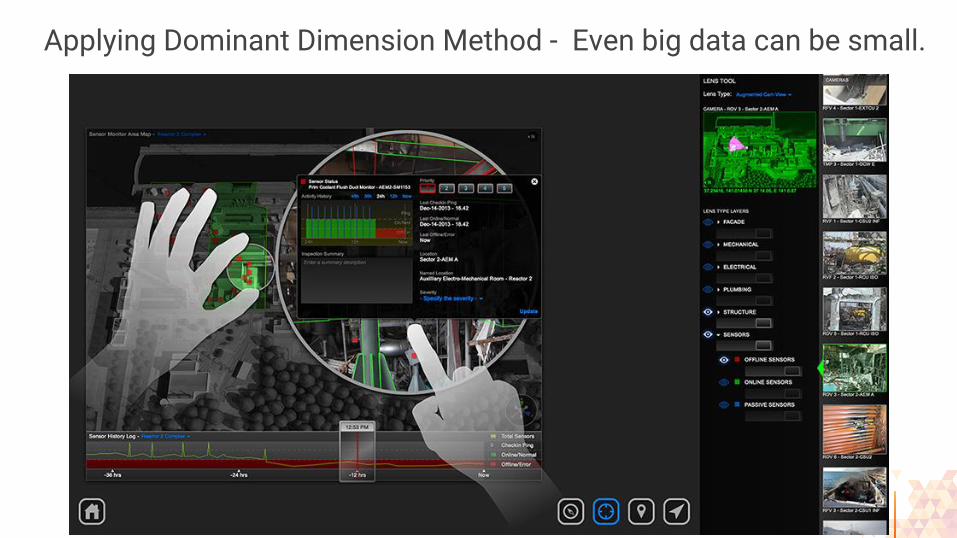
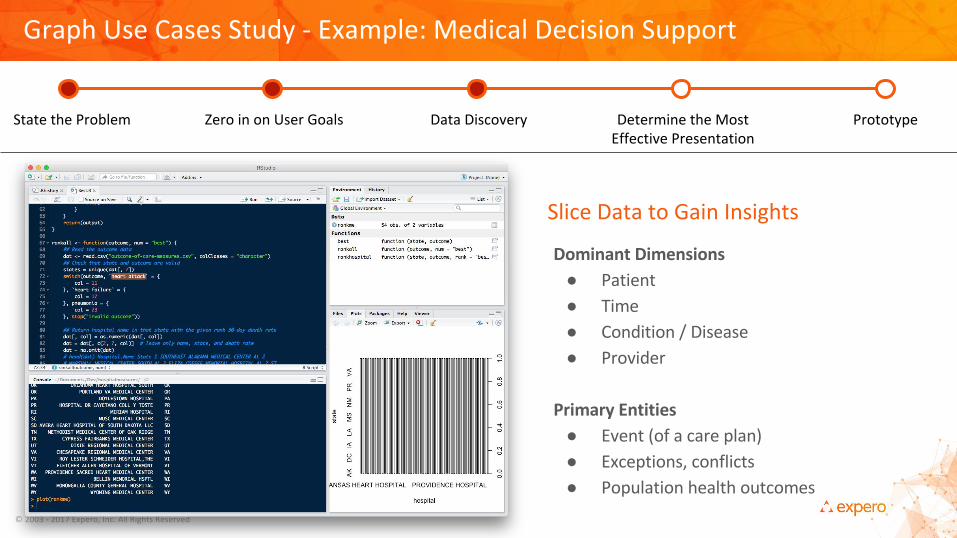
Applying Dominant Dimension Method - Even big data can be small.
Copyright 2015 Expero, Inc. All Rights Reserved 8/11/2015
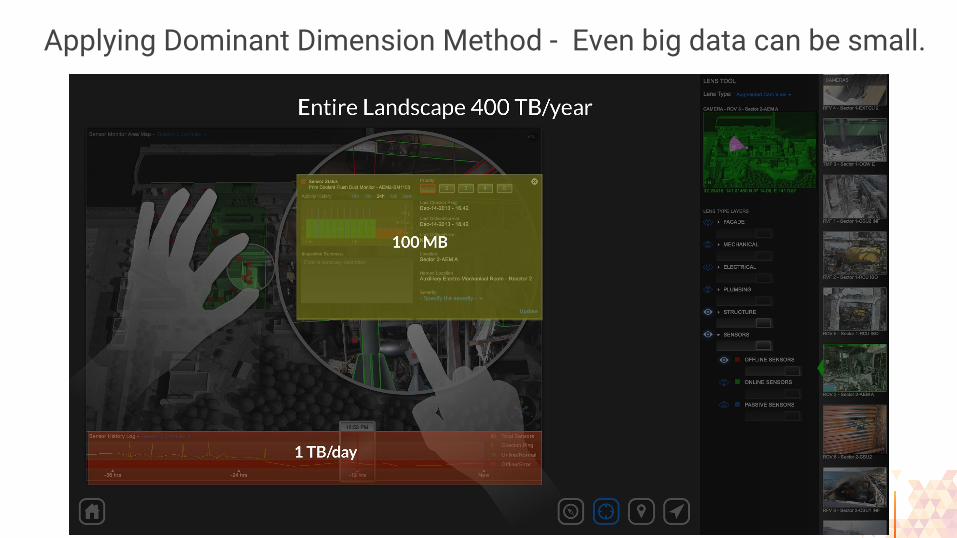
Applying Dominant Dimension Method - Even big data can be small.
Copyright 2015 Expero, Inc. All Rights Reserved 8/11/2015
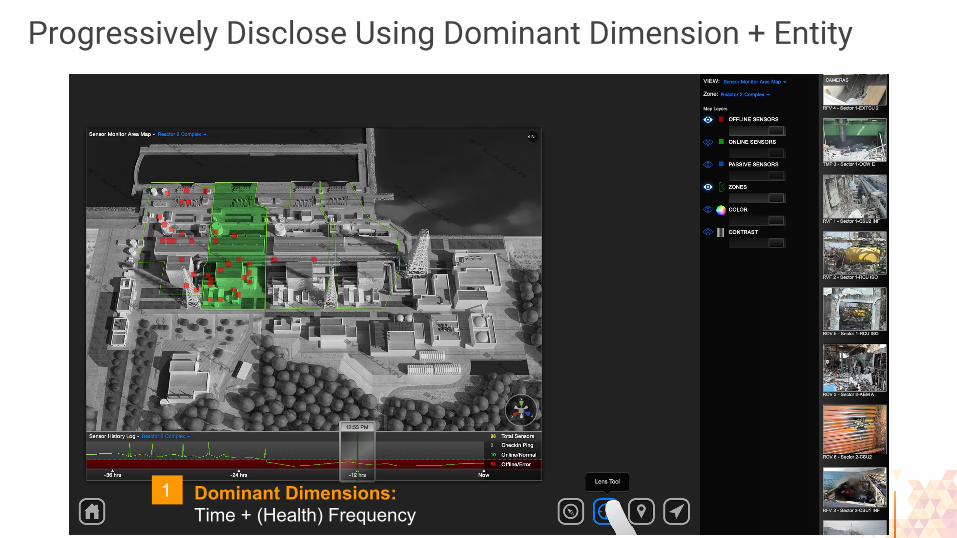
Progressively Disclose Using Dominant Dimension + Entity
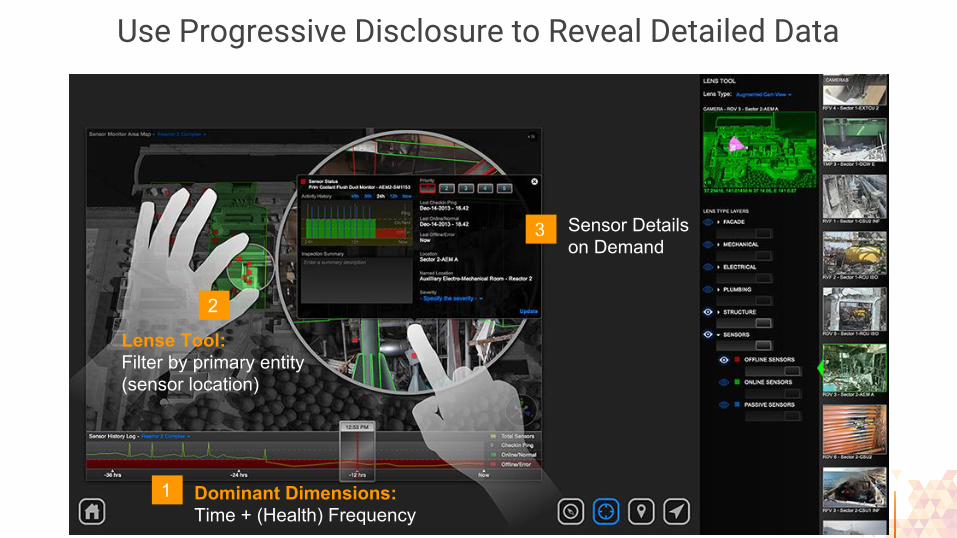
Dominant Dimensions: Time + (Health) Frequency
1
Copyright 2015 Expero, Inc. All Rights Reserved 8/11/2015
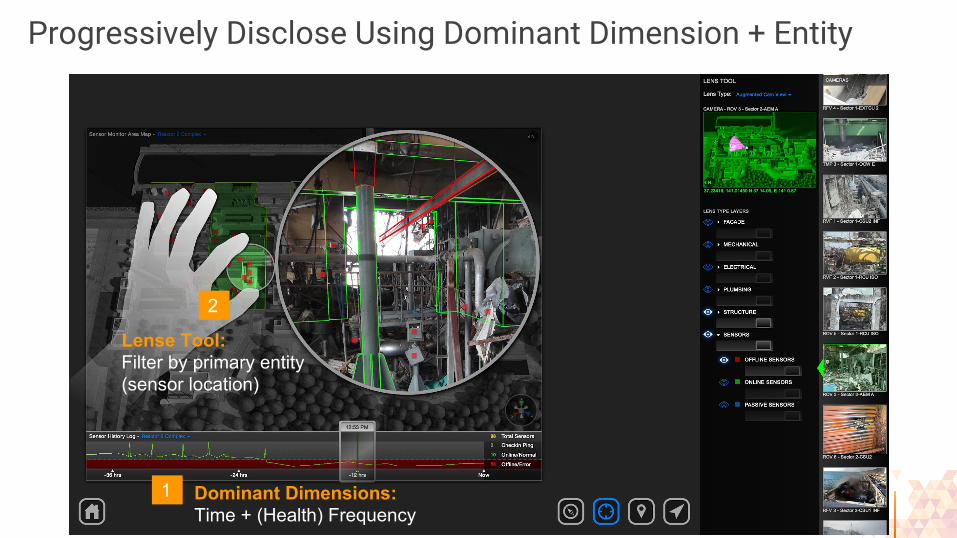
Progressively Disclose Using Dominant Dimension + Entity
Lense Tool:Filter by primary entity (sensor location)
2
Dominant Dimensions: Time + (Health) Frequency
1
Copyright 2015 Expero, Inc. All Rights Reserved 8/11/2015
Use Progressive Disclosure to Reveal Detailed Data
Sensor Detailson Demand
3
Dominant Dimensions: Time + (Health) Frequency
1
Lense Tool:Filter by primary entity (sensor location)
2

ENGINEERING USERS
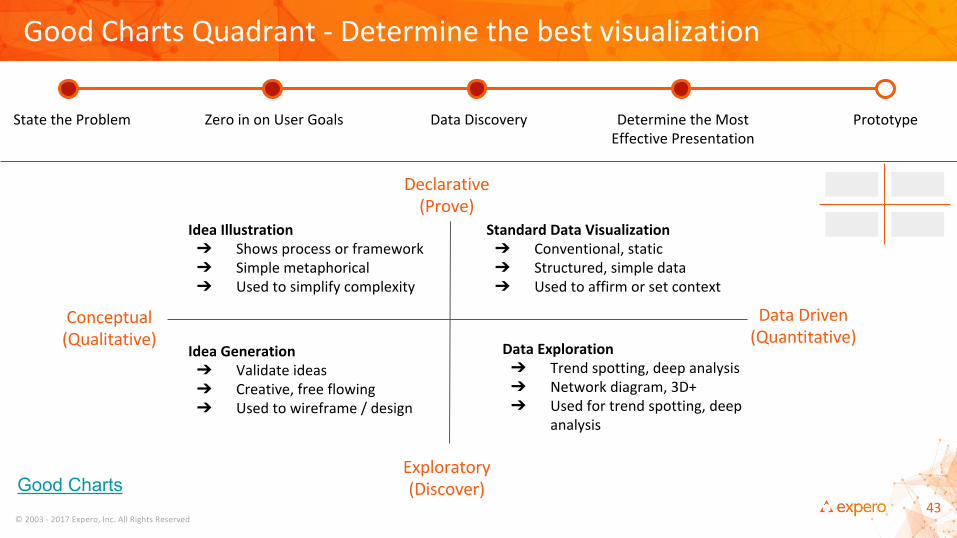
Good Charts
➔➔➔
➔➔➔
➔➔➔
➔➔➔
➔➔➔
➔➔➔
➔➔➔
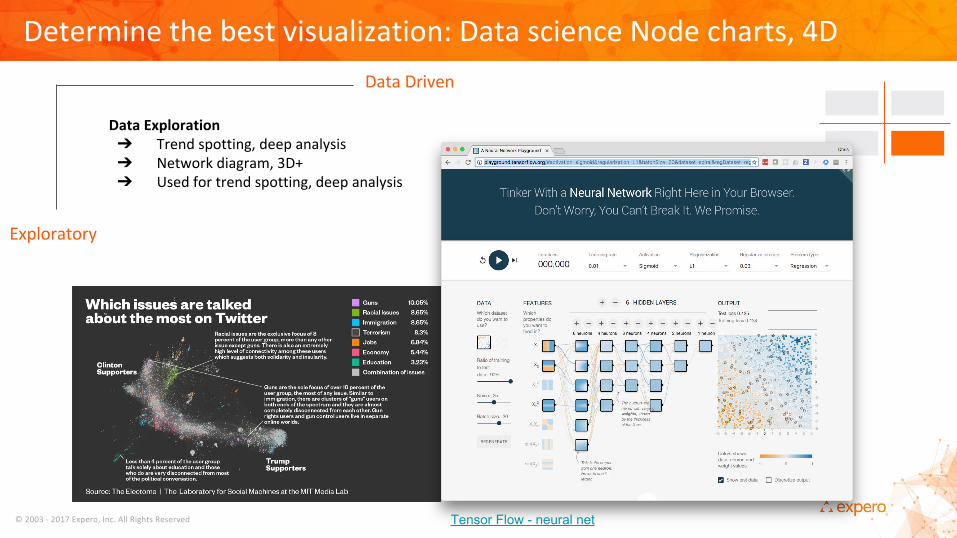
Tensor Flow - neural net
➔
➔
➔
➔
➔
➔
●●●●●
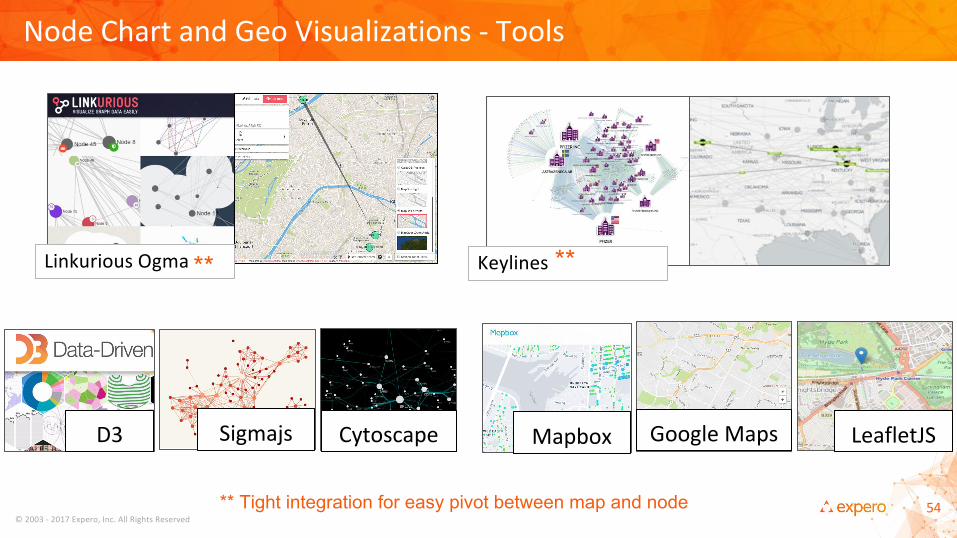
** Tight integration for easy pivot between map and node
** **

●●
●●●●
●
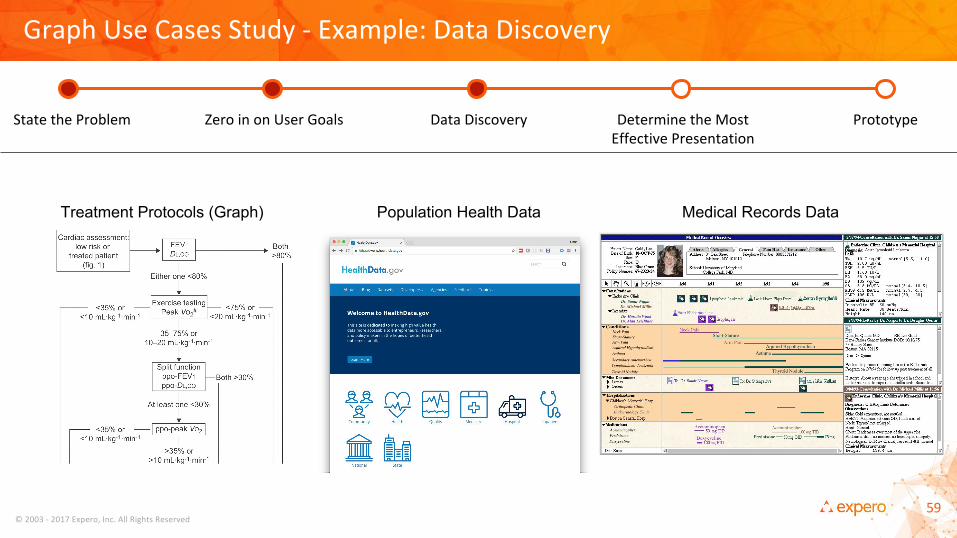
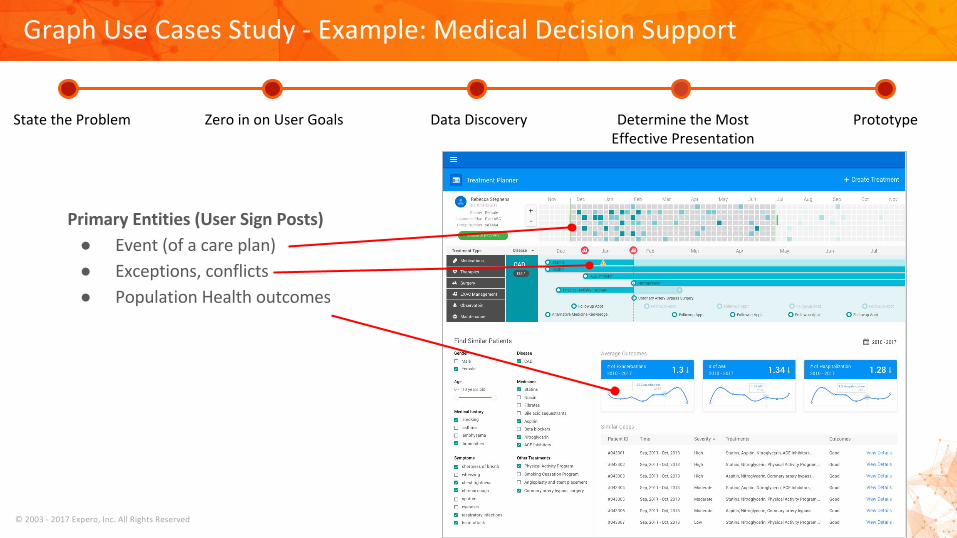
Treatment Protocols (Graph) Population Health Data Medical Records Data
●●●●
●●●
➔➔➔
➔➔➔
➔➔➔
➔➔➔
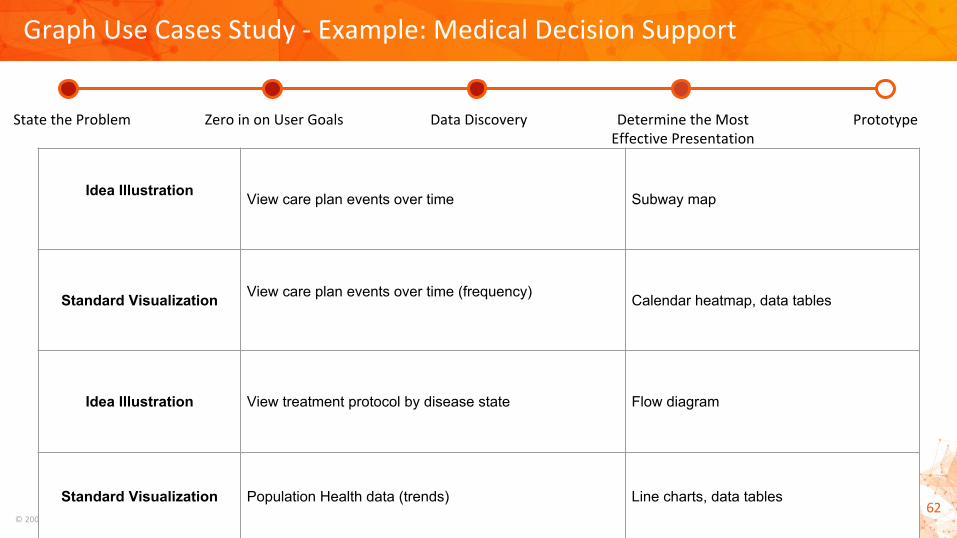
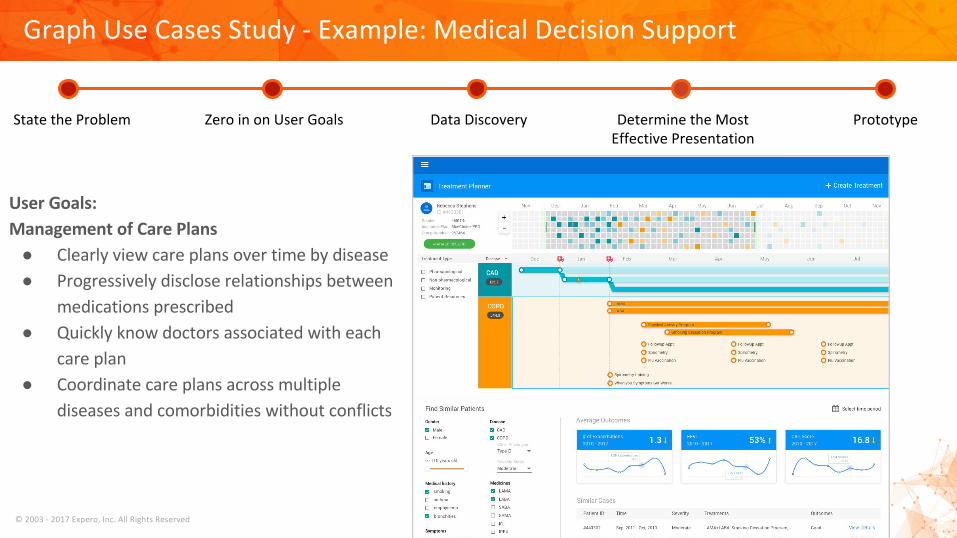
Idea Illustration View care plan events over time Subway map
Standard Visualization View care plan events over time (frequency) Calendar heatmap, data tables
Idea Illustration View treatment protocol by disease state Flow diagram
Standard Visualization Population Health data (trends) Line charts, data tables
●●●●
●●●
●●
●
●
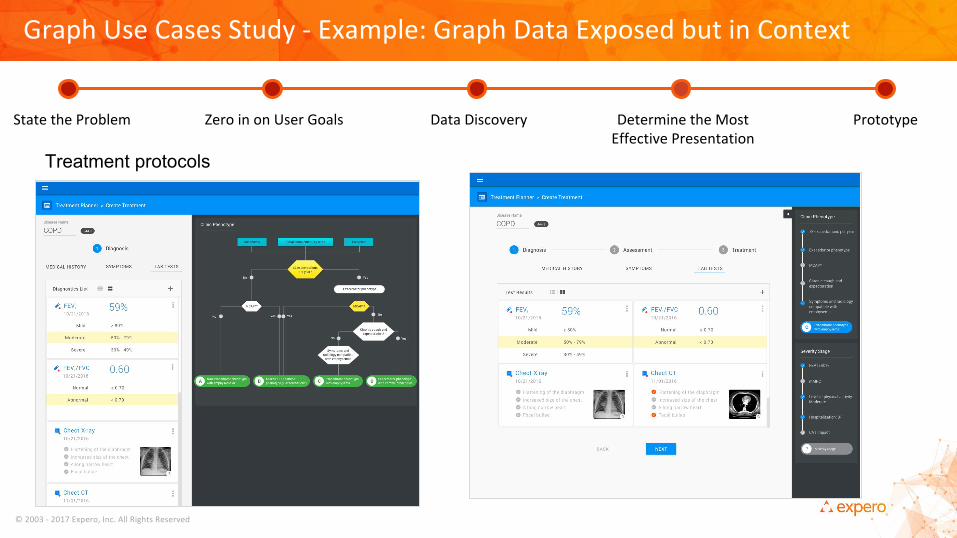
Treatment protocols

●●●
●●●●●
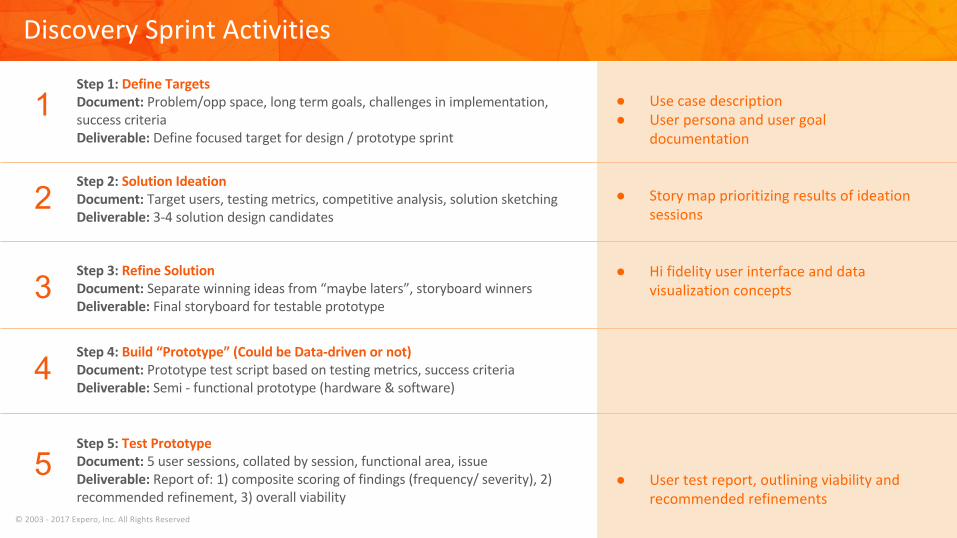
1
2
3
4
5
●●
●
●
●
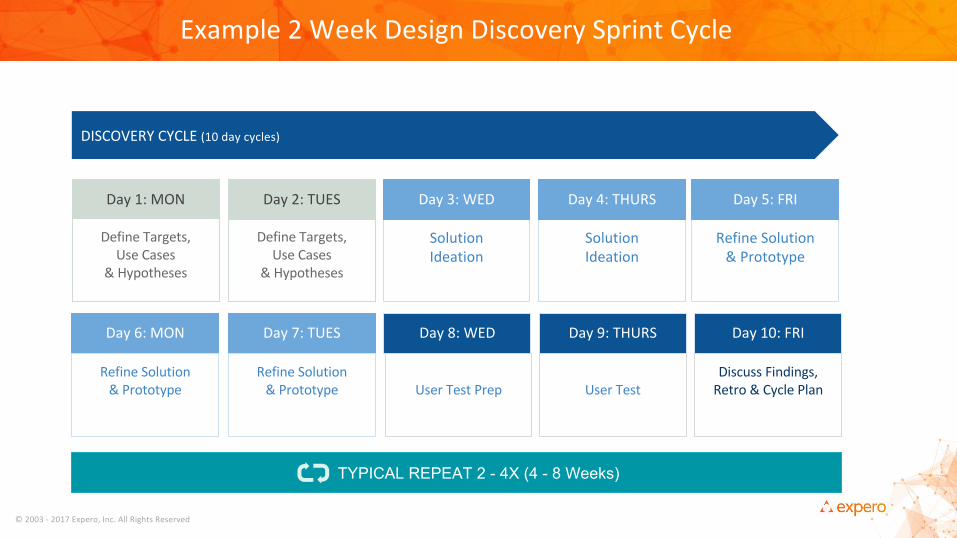
TYPICAL REPEAT 2 - 4X (4 - 8 Weeks)
Related Documents