WebAccess+ IoT Solution Software Advantech AE Technical Share Document Date 2016 / 3 / 8 SR# 1-2392864601 Category ■ FAQ □ SOP Related OS Microsoft Windows7 Abstract WebAccess SCADA Quick Start Material Keyword WebAccess, Project Node, SCADA Node, DrawDAQ, ViewDAQ Description: This document contains basic skills that user will need to complete SCADA project. The functions include how to create and define Project Node, SCADA Node, communicate port, device, tag and user interfaces.

Welcome message from author
This document is posted to help you gain knowledge. Please leave a comment to let me know what you think about it! Share it to your friends and learn new things together.
Transcript

WebAccess+ IoT Solution Software
Advantech AE Technical Share Document
Date 2016 / 3 / 8 SR# 1-2392864601
Category ■ FAQ □ SOP Related OS Microsoft Windows7
Abstract WebAccess SCADA Quick Start Material
Keyword WebAccess, Project Node, SCADA Node, DrawDAQ, ViewDAQ
Description:
This document contains basic skills that user will need to complete SCADA project. The functions include how to
create and define Project Node, SCADA Node, communicate port, device, tag and user interfaces.

WebAccess+ IoT Solution Software Quick Start Material
Advantech Co., Ltd. Ver. 8.0 1
Contents Section 1 - Introduction 1-1
Objectives .............................................................................................................................................. 1-1 Training Notes ....................................................................................................................................... 1-1 Using this Training Manual ................................................................................................................... 1-2 What is WebAccess? ............................................................................................................................. 1-2 WebAccess Benefits .............................................................................................................................. 1-3 WebAccess Components ....................................................................................................................... 1-3 Exercises ................................................................................................................................................ 1-6
Task 1: Install WebAccess Software. ........................................................................................ 1-6 Task 2: Project Node System Requirement. ............................................................................ 1-11 Task 3: Hard Key & License. .................................................................................................. 1-12
Section 2 - Project and SCADA Node Configuration 2-1
Objectives .............................................................................................................................................. 2-1 Training Notes ....................................................................................................................................... 2-1 Exercises ................................................................................................................................................ 2-2
Task 1: Connect to project node ................................................................................................ 2-2
Task 2: Start WebAccess Configuration .................................................................................... 2-3
Task 3: Create New Project ....................................................................................................... 2-4
Task 4: Add SCADA Node ....................................................................................................... 2-5
Task 5: Download and Start the SCADA Node ........................................................................ 2-7
Section 3 – Communications, IO Tags 3-1
Objective ............................................................................................................................................... 3-1 Training Notes ....................................................................................................................................... 3-1 IO Tags and Blocks ............................................................................................................................... 3-1 Tag Fields .............................................................................................................................................. 3-2 Parameters ............................................................................................................................................. 3-2 Exercises ................................................................................................................................................ 3-4
Task 1: Add New Comport ........................................................................................................ 3-4
Task 2: Add New Device ........................................................................................................... 3-5
Task 3: Add New Analog I/O Tag ............................................................................................. 3-7
Task 4: ModSim for Simulation ................................................................................................ 3-8
Task 5: Download to Node ........................................................................................................ 3-9
Task 6: Start the Node Kernel ................................................................................................. 3-10
Task 7: Start VIEW to Point Info ............................................................................................ 3-11
Task 8: Add New Digital I/O Tag .......................................................................................... 3-13
Section 4 - Internal Tags 4-1
Objective ............................................................................................................................................... 4-1 Training Notes ....................................................................................................................................... 4-1 Constant Point ....................................................................................................................................... 4-1 Accumulation Point ............................................................................................................................... 4-2 Calculation Point ................................................................................................................................... 4-2 Math Functions ...................................................................................................................................... 4-2 Logic Functions ..................................................................................................................................... 4-3 System Point Tags ................................................................................................................................. 4-3

WebAccess+ IoT Solution Software Quick Start Material
Advantech Co., Ltd. Ver. 8.0 2
Exercise ................................................................................................................................................. 4-3 Task 1: Create constant point tags. ............................................................................................ 4-3
Task 2: Create accumulation point tag. ..................................................................................... 4-8
Task 3: Create calculation point tags. ........................................................................................ 4-9
Task 4: Configure a System Point Tag .................................................................................... 4-12
Task 5: Verify new Tag configurations in VIEW. ................................................................... 4-13
Task 6: Export Tags to EXCEL (EXCEL OUT). .................................................................... 4-15
Task 7: Edit and Create Tags in EXCEL ................................................................................. 4-16
Task 8: Import Tags from EXCEL (EXCEL IN).................................................................... 4-18
Section 5 - DRAW 5-1
Objectives .............................................................................................................................................. 5-1 Exercise ................................................................................................................................................. 5-1
Task 1: Start local graphics builder - DrawDAQ....................................................................... 5-2
Task 2: Explore DRAW Toolbars ............................................................................................. 5-2
Task 3: Draw a Widget- Meter .................................................................................................. 5-3
Task 4: Draw Text ..................................................................................................................... 5-6
Task 5: Dynamic Text Animation ........................................................................................... 5-10
Task 6: Draw a Pushbutton ...................................................................................................... 5-11
Task 7: SAVE Graphic ............................................................................................................ 5-13
Task 8: Download Graphic ...................................................................................................... 5-14
Task 9: Download Graphics from task tray ............................................................................. 5-15
Task 10: Start WebAccess VIEW............................................................................................ 5-16
Task 11: Create a tank level graphic display. .......................................................................... 5-20
Section 6 – Pushbuttons, Key Macros & Scripts 6-1
Objectives .............................................................................................................................................. 6-1 Training Notes ....................................................................................................................................... 6-1 Key Macros ........................................................................................................................................... 6-1 Scripts ................................................................................................................................................... 6-1 Exercise ................................................................................................................................................. 6-3
Task 1: DRAW Push buttons ..................................................................................................... 6-4
Task 2: Edit Pushbuttons ........................................................................................................... 6-6
Task 3: Create a KeyMacro File ................................................................................................ 6-8
Task 4: Rotate a Widget with a Script ....................................................................................... 6-9
Task 5: Multiple rotating fans.................................................................................................. 6-14
Task 6: Write data into an Text file ......................................................................................... 6-15
Task 7: Global Script Configuration ........................................................................................ 6-17
Section 7 - Trending 7-1
Objectives .............................................................................................................................................. 7-1 Training Notes ....................................................................................................................................... 7-1
Exercise ................................................................................................................................................. 7-3 Task 1: Enable Data Logging for Tags. ..................................................................................... 7-1
Task 2: Add Data Log Trend Group .......................................................................................... 7-5
Task 3: Add RealTime Trend Group ......................................................................................... 7-7
Task 4: View Data Log Trend Group ........................................................................................ 7-9
Task 5: Export Data - Trend Display ....................................................................................... 7-10
Task 6: Add Tag to Real-time Trend ....................................................................................... 7-11
Section 8 - Alarms 8-1
WebAccess+ IoT Solution Software Quick Start Material
Advantech Co., Ltd. Ver. 8.0 3
Objectives .............................................................................................................................................. 8-1 Training Notes ....................................................................................................................................... 8-1 Alarm Handling Package Summary ...................................................................................................... 8-1 Exercise ................................................................................................................................................. 8-4
Task 1: Alarm Configuration ..................................................................................................... 8-4
Task 2: View the Alarm Summary ............................................................................................ 8-6
Task 3: Alarm Summary controls .............................................................................................. 8-8
Task 4: View the Alarm Log Display ...................................................................................... 8-10
Section 9 – Users & Passwords 9-1
Objectives .............................................................................................................................................. 9-1 Training Notes ....................................................................................................................................... 9-1 Overview - Users & Passwords ............................................................................................................. 9-1 Area and Level security ......................................................................................................................... 9-2 Exercise ................................................................................................................................................. 9-3
Task 1: Add or Update a User ................................................................................................... 9-3
Task 2: Add or Update Project User or admin ........................................................................... 9-6
Section 10 – Display Groups 10-1
Objectives ............................................................................................................................................ 10-1 Training Notes ..................................................................................................................................... 10-1 Exercise ............................................................................................................................................... 10-1
Task 1: Start ViewDAQ .......................................................................................................... 10-1
Task 2: Create a new Display Group ....................................................................................... 10-2
Task 3: Open Display Group from Menu Bar ......................................................................... 10-6
Task 4: Create Windows Display Group ................................................................................. 10-7
Task 5: Verify Display Group behavior .................................................................................. 10-9
Section 11 – Video 11-1
Objectives ............................................................................................................................................ 11-1 Training Notes ..................................................................................................................................... 11-1 Exercise ............................................................................................................................................... 11-2
Task 1 Video configuration from Project Manager ................................................................. 11-2
Task 2: VIEW full screen Video Cameras .............................................................................. 11-4
Task 3: Draw Video in User Graphic Display ......................................................................... 11-6
Section 12 - Excel Reports 12-1
Objectives ............................................................................................................................................ 12-1 Training Notes ..................................................................................................................................... 12-1 Excel Report Configuration ................................................................................................................. 12-1 Exercise ............................................................................................................................................... 12-8
Task 1: Build the Template. .................................................................................................... 12-8
Task 2: View Report ................................................................................................................ 12-9
Task 3: Download the Report ................................................................................................ 12-10
Task 4: View Report in View DAQ ...................................................................................... 12-10
Task 5: Embed the Excel Report ........................................................................................... 12-11
Section 13 - Scheduler 13-1
Objectives ............................................................................................................................................ 13-1 Training Notes ..................................................................................................................................... 13-1 Scheduler Functions ............................................................................................................................ 13-1

WebAccess+ IoT Solution Software Quick Start Material
Advantech Co., Ltd. Ver. 8.0 4
Exercise ............................................................................................................................................... 13-2 Task 1: Create a Schedule ....................................................................................................... 13-1
Task 2: Start Scheduler in View or ViewDAQ ........................................................................ 13-7
Section 14 - Recipes 14-1
Objectives ............................................................................................................................................ 14-1 Training Notes ..................................................................................................................................... 14-1 Exercise ............................................................................................................................................... 14-4
Task 1: Configure a recipe file. .............................................................................................. 14-4
Task 2: Manage recipes in VIEW. .......................................................................................... 14-5
Task 3: Create Recipe Download Button. ............................................................................... 14-8
Task 4: View and download recipe. ....................................................................................... 14-8
Section 15 - Dashboard 15-1
Objective ............................................................................................................................................. 15-1 Training Notes ..................................................................................................................................... 15-1 Dashboard Overview ........................................................................................................................... 15-1 Dashboard Operating Environment ..................................................................................................... 15-2 Dashboard Editor ................................................................................................................................. 15-1 Exercise ............................................................................................................................................... 15-6
Task 1: Dashboard Project Configuration ............................................................................... 15-6
Task 2: Dashboard Widget Builder Configuration ................................................................ 15-10
Section 16 - Advanced Features 16-1
Objective ............................................................................................................................................. 16-1 Training Notes ..................................................................................................................................... 16-1
Data Transfer ........................................................................................................................... 16-1
DDE ...................................................................................................................................... 16-1
OPC ...................................................................................................................................... 16-2
Exercise ............................................................................................................................................... 16-3 Task 1: Configure Data Transfer ............................................................................................. 16-3
Task 2: EXCEL formula to read tags from WebAccess DDE ................................................. 16-4
Task 3: Configure an OPC Communication Port .................................................................... 16-5
Task 4: Add OPC Device ........................................................................................................ 16-6
Task 5: Start the OPC Tool ...................................................................................................... 16-6
Task 6: Connect to OPC Server with OPC Tool...................................................................... 16-8
Task 7: Blocks, Parameters & Detail Displays ...................................................................... 16-12
Step 1: Create Parameters for PID Block ................................................................. 16-12
Step 2: Create a PID Block Type ............................................................................. 16-21
Step 3: Create PID Blocks ........................................................................................ 16-23
Step 4: View the PID Blocks .................................................................................... 16-25
Step 5: Create PID Block Detail Display ................................................................. 16-26
Appendix 17-1

WebAccess+ IoT Solution Software Quick Start Material
Advantech Co., Ltd. Ver. 8.0 1 - 1
Section 1 - Introduction
Objectives This section introduces WebAccess software. At the end of the section, you will be familiar with:
1. Software Components
2. Capabilities of WebAccess Software
Training Notes
Using this Training Manual
The following is recommended for the Student PC
Windows 7 with IIS installed on the students PC.
A network card and TCP IP service.
Project & SCADA Node software. This will be done in Section 2 Task 1: Install Project
and SCADA Node software.
Modbus TCP PLC or Modbus TCP Simulator installed on student PC. This is used in
Section 4 Communications & IO Tags.
Microsoft EXCEL 2003 (or above Version) installed on Student PC.
Optionally, an OPC server installed on student PC if OPC section is to be covered.
For alternative configurations and workarounds, see the appendix.
Note - Previously, they were to localhost. You can edit the host file on a PC to redirect to 127.0.0.1 (i.e.
localhost) if an Internet connection is not available or if the student has Project Node software installed
on their PC.

WebAccess+ IoT Solution Software Quick Start Material
Advantech Co., Ltd. Ver. 8.0 1 - 2
What is WebAccess?
WebAccess is web browser based software for Human Machine Interface (HMI) and Supervisory
Control and Data Acquisition. WebAccess communicates with automation equipment used in
manufacturing facilities, industrial plants and building automation systems. The software
acquires, displays and stores real-time data and allows operators to change setpoints,
equipment status and other parameters in Programmable Logic Controllers (PLCs), Controllers,
IO, RTUs, DCS and DDC systems.
Through a graphical user interface on a Personal Computer (PC), WebAccess
Displays dynamic real-time data on graphic displays that are pictorial
representations\of equipment and processes
Indicates alarm conditions, through beeping sound, flashing colors, email messages to
users and pagers, text-to-speech annunciation and media files (e.g. wave, midi, mp3)
Displays trends that mimic strip-chart recorders and archives historical data to hard
drives and databases
Enables the operator to perform control actions (change setpoints, start/stop pumps,
etc.)
Provides tools to assist operators such as downloading recipes, jump to an Alarm
display, browse tags, and find displays used by a tag.
Tracks operator initiated changes.
Executes scripts for animation, custom reports, emails, logic for real-time control and
scheduling equipment.
Exports historical data to html files and external databases.
Generates scheduled reports and logs.
Uses live Video mixed with animation and live data
Does all this in an ordinary web browser (Internet Explorer 6.0 recommended)
Provides a non-web browser version of all these functions also for dedicated control
rooms and stand-alone computers.
WebAccess Benefits
Add Internet technology to control and automation equipment
Remotely engineer and support automation equipment
Reduce trips to the field
Provide timely access to real-time data to users through out the enterprise using
ordinary web browsers (for example, accountants and managers).
Provides a modularized system that allows you to expand with project needs.
A database structure, which resembles that of a DCS, that enables database parameter,
Block, and display templates to reduce the time in engineering and commission a
system.

WebAccess+ IoT Solution Software Quick Start Material
Advantech Co., Ltd. Ver. 8.0 1 - 3
Vector-based Graphic Builder that enables fast creation of displays with sophisticated
animation capabilities and smaller file sizes for faster downloads. Also allows import of
bitmap (JPEG, GIF, Bmp, DIB) and Vector-based DXF files from AutoCAD.
Graphics that provide details from a plant-wide overview to individual control loops can
be generated minimal effort (a built-in, drill-down, and display architecture.)
Integration with enterprise databases via real-time ODBC data conversion including
Microsoft Access (standard) and relational databases including Microsoft SQL Server,
Oracle and MySQL.
Built-in scheduled report module - no add-on option is required.
Built-in networking capabilities allow data from remote sites to be readily available to
the central control.
WebAccess Components
A complete WebAccess system consists of three basic areas, illustrated below
Client (Web Browser VIEW of real-time Data) and an Active-X control called the
Plug-in
SCADA Node – a PC that communicates with automation devices and the Clients.

WebAccess+ IoT Solution Software Quick Start Material
Advantech Co., Ltd. Ver. 8.0 1 - 4
Project Node - the Configuration Tool, Central Data base and Web Server. .
Thin Clients - which display snapshots of graphics and use a text based interface to
change data, acknowledge alarms and control. No software installation required.
Supports PDA and Pocket PCs
Stand-alone systems are implemented in one of two general ways:
The SCADA Node software and Project Node software are on the same PC.
The SCADA Node software is on the PC and the Project Node Software is on a mobile
laptop or remote PC.
Standalone PC with remote dial up access
Configuration
The configuration tools are:

WebAccess+ IoT Solution Software Quick Start Material
Advantech Co., Ltd. Ver. 8.0 1 - 5
Project Manager - This module allows you to configure tags mapped to device
addresses. Other functions, such as recipes, trending, networking and scripts, are
also configured in this module. This is on the Web Sever / Project Node.
Graphic Builder - This module is used to create graphics for run-time display. Tags
configured in the database can be associated with graphical elements to enable
animated display of process data. DRAW is the web browser version that runs on a
Client web-browser when connected to Project Node. DrawDAQ runs locally on the
Project Node (without a web browser).
Client
The Client consists of a Web-browser and the Client Plug-in. SCADA Nodes also have a
non-web browser version of the Client called ViewDAQ.
SCADA Node
The SCADA node runs independently of any node in the system.
Kernel (datacore.exe)- This consists of a real-time kernel that handles all the
communications with the external automation devices and Clients. It is also
responsible for logging historical data, alarm functions, executing event programs,
printing reports, etc.
Device Driver(s) - This handles the communication protocol between WebAccess and
the external device.
Web Service (webvrpcs.exe) – this provides the remote communication over the
Internet or intranet. This is the icon that appears in the taskbar next to the clock
ViewDAQ – this is a non-web browser version of VIEW. It runs on the SCADA node
locally. It is used for stand-alone systems and control room applications. It also
provides a type of redundancy allowing operators to view and control even if the
network connection is down.
Project Node
The Project Node is a central database and the Web Server. The Project Node holds a
copy of the database and graphics of all SCADA Nodes in the system. A user downloads
these files from the Project Node to the SCADA node via a web browser.
Project Manager - The Project Manager is the configuration tool. It consists of a
collection ASP pages and databases to allow an ordinary web browser to configure
tags, alarms, reports, scheduled and perform all the engineering using fill-in-the-
blanks configuration. The Project Node provides a number of utilities for project
deployment and maintenance including EXCEL Import, EXCEL Export, the OPC Import
tool and Import SCADA Node to import tags and graphics from another project or PC:
DrawDAQ – this is a non-web browser version of DRAW. It runs on the Project node
locally (or a combined Project Node / SCADA Node). It is used for stand-alone
systems and control room applications. It allows engineers and technicians to build
and animate graphic displays.

WebAccess+ IoT Solution Software Quick Start Material
Advantech Co., Ltd. Ver. 8.0 1 - 6
OPCTool - These enable you to and import tags from an OPC Client into a WebAccess
tag database from a third party application OPC Servers, such as Cimetrics Bacnet
OPC Server, Kepware OPC Servers. Many automation hardware suppliers supply OPC
Servers as the communications interface to their proprietary networks.
Exercises
This goal of this exercise is to install WebAccess software. This shows what an ordinary
user will encounter when first connecting to an established WebAccess system.
What you need to complete this exercise:
a. Windows 7.
b. Internet Explorer 9.0 (or above)
c. Connection to http://localhost that Project Node installed on your PC.
Task 1: Install WebAccess Software.
1. Start Install WebAccess Node .
Select the WebAccess Node.
2. WebAccess Node Installshield Wizard appears.

WebAccess+ IoT Solution Software Quick Start Material
Advantech Co., Ltd. Ver. 8.0 1 - 7
3. A Welcome to Install Shield for WebAccess Node screen is displayed.
To continue, click Next.
4. The WebAccess License Agreement displays. Please accept the License Agreement
and to continue with Setup, click Yes.
5. Enter your Customer Information (user name and company).
To continue, click Next.

WebAccess+ IoT Solution Software Quick Start Material
Advantech Co., Ltd. Ver. 8.0 1 - 8
6. Select Options to install. Select Project and SCADA node.
This exercise assumes you want a single PC to have both Project Node and
SCADA node software.
7. Choose Destination - Folder where setup will install WebAccess SCADA Node
program and Project Configuration files. To continue, click NEXT.
Note - It is recommended to accept the default directory (c:\WebAccess\Node)
unless you are very experienced user and have a good reason.
8. Skip the Remote Access Code. To continue, click NEXT.

WebAccess+ IoT Solution Software Quick Start Material
Advantech Co., Ltd. Ver. 8.0 1 - 9
9. Accept the default (0), click NEXT. The default Primary TCP Port Number is
(4592)
10. Accept the default (0), click NEXT. The default Secondary TCP Port Number is
(14592)
11. Confirm the WWWRoot directory to Install ASP files - This is the directory used by
IIS (Internet Information Server) Web Server.
Select Next. We recommend that you don’t change the default folder to run Install
at first time.
12. Running install will appear, see below.

WebAccess+ IoT Solution Software Quick Start Material
Advantech Co., Ltd. Ver. 8.0 1 - 10
13. InstallSheild Wizard Complete, Select, Yes I want to restart my computer
now. To continue, select Finish.
After reboot, you should see the WebAccess Icon in the taskbar next to the system
clock.
Install Project and SCADA Node software also installs DrawDAQ and
ViewDAQ. Right clicking the WebAccess icon accesses these options plus Start Kernel,
Stop Kernel and Download Graph.

WebAccess+ IoT Solution Software Quick Start Material
Advantech Co., Ltd. Ver. 8.0 1 - 11
Project Node Taskbar Icon
If you install Project Node only, DrawDAQ and Download Graph appear in the Taskbar
menu (but no Start Kernel).
SCADA Node Taskbar Icon
If you install SCADA Node only, Start Kernel appears in the Taskbar menu (but no
DrawDAQ and Download Graph).
Project Node - System Requirements
Operating System: Windows 7 (Professional and Ultimate), Windows Server 2008 with
IIS (Internet Information Server) installed.
IIS (Internet Information Server) installed. The WWW Service (web Server) must
be installed and running. In previous Windows system, you can IIS from your Windows
2000 Professional, Windows 2000 Server or Windows XP Professional Installation CD.
ASP (Active Server Pages) enabled.
Client number limitation - Microsoft Licensing will limit the number of clients
connecting to IIS. The Limit is 10 simultaneous connections in Windows 2000 and XP
Professional. In Windows 2000 and XP Server versions, the limit is depended on your
license. Windows Server2008 (or above) is unlimited, but system performance is
depended on your hardware.
NTFS File System - NTFS provides Security and it is faster. FAT provides no security
and is not appropriate for the Web Server (Project Node).

WebAccess+ IoT Solution Software Quick Start Material
Advantech Co., Ltd. Ver. 8.0 1 - 12
Hardware: Pentium IV processors are recommended for the Project Node and SCADA
nodes. SCSI Hard Drive, SAN or other large cache storage recommended if Data
Logging.
Network Addressing: Fixed IP Address or network address.
Web Browser: Optional. Need for configuration tool. Microsoft Internet Explorer 9.0 or
above.
Display Resolution: (Optional although a Display is recommended). 1024 x 768 or
higher (recommended). Lower resolutions also supported.
Communications Service: Microsoft TCP/IP Protocol.
Communications Speed: T1 or DSL is recommended.
(33 Kb/sec, 56 Kb/sec, 128 Kb/sec and ADSL supported, 3G/4G network supported also)
Web Security: WebAccess supports Anonymous Access, Authenticated Access
(Integrated Windows authentication) and Secure Communications including Certificates,
Secure Sockets and Virtual Private Networks (VPN).
Firewall Security: If using a connection through a Firewall, two additional TCP Ports
assigned by your IT are required (in default port is 4592 and 14592). These are in
addition to Port 80, the HTTP port, which must also be opened
Hard Key & License
WebAccess software products use the Sentinel Hard Key for copy protection. A hard key
must be installed to the USB.
USB Hard Key
The USB versions of the Hardkey key are inserted in a USB port after installing
WebAccess SCADA Node software.
Note -All USB Sentinel SuperPro keys need to be removed before installing software.
Otherwise, the USB portion of the installation might fail. If you insert the USB key
prior to installing SCADA Node software, you will be prompted to insert a CD with
sentinel drivers. You should select CANCEL and install WebAccess SCADA Node
Software before inserting a USB key.
All USB Sentinel SuperPro hard keys must be removed before installing software.
Install USB Key after software

WebAccess+ IoT Solution Software Quick Start Material
Advantech Co., Ltd. Ver. 8.0 1 - 13
If Plug and Play is enabled (and after WebAccess is installed), when you install the USB
key, a dialog box will appear saying, "new hardware found". It will find the driver if you
have installed WebAccess. If you move the USB key to another port, it will re-install the
driver (and you will get the pop-up dialog box again) if you have Plug-n-Play enabled
Control File
In conjunction with a hard key, every installed WebAccess package, except the working,
requires a control file for proper operation. During WebAccess installation, this control
file is installed to the WebAccess root directory. The serial number of the control file
must match that of the hard key.
The control file contains information about the options enabled in the WebAccess
package.
Customers can download file from WebAccess Product web site,
http://webaccess.advantech.com/, click “Control File”
If you have already registered an account, please sign in with your account. Otherwise,
please register first and sign in.
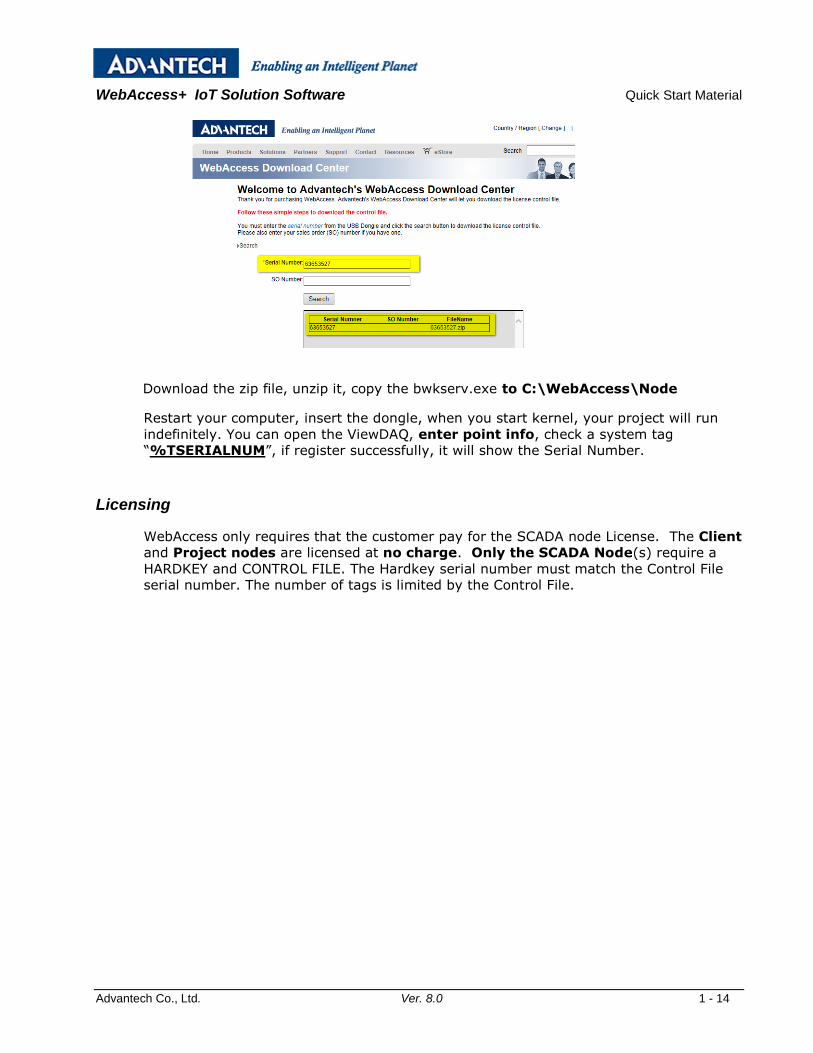
After you sign in, you can enter your Serial Nubmer, and click “Search”, then the
system will provide the download link of your control file, as shown above
WebAccess+ IoT Solution Software Quick Start Material
Advantech Co., Ltd. Ver. 8.0 1 - 14
Download the zip file, unzip it, copy the bwkserv.exe to C:\WebAccess\Node
Restart your computer, insert the dongle, when you start kernel, your project will run
indefinitely. You can open the ViewDAQ, enter point info, check a system tag
“%TSERIALNUM”, if register successfully, it will show the Serial Number.
Licensing
WebAccess only requires that the customer pay for the SCADA node License. The Client
and Project nodes are licensed at no charge. Only the SCADA Node(s) require a
HARDKEY and CONTROL FILE. The Hardkey serial number must match the Control File
serial number. The number of tags is limited by the Control File.

WebAccess+ IoT Solution Software Training Course 2. Project & Node Configuration
Advantech Co., Ltd. Ver. 8.0 2 - 1
Section 2 - Project and SCADA Node Configuration
Objectives This section provides details on the minimum settings to enable communication between
WebAccess Project Node, SCADA Node and Clients via a web browser. This is a useful first step
in “checking-out” your network. At the completion of this section, you will be able to create an
Project, configure a SCADA Node and check communications. The following topics are covered:
Project Node configuration
SCADA Node configuration
Download SCADA Node configuration.
Start and Stop a SCADA node.
Communicate with SCADA Node from a client Web browser.
View default Graphic displays.
Training Notes The minimum configurations required to establish communication with a controller device are:
Project Configuration
SCADA Node - specifies the configuration of your system, such
as printer port selection, logging functions to be
enabled/disabled, any additional programs.
Port configuration - specifies the communication port to
communicate with the controller device.
Device configuration - specifies the device type, node name and
addresses.
To check that you can read and write data to a controller device, you need to create an I/O
point, such as a Single Point tag. A single point tag is a tag that addresses a memory location in

WebAccess+ IoT Solution Software Training Course 2. Project & Node Configuration
Advantech Co., Ltd. Ver. 8.0 2 - 2
the controller device. It constitutes a single I/O point. WebAccess also supports tags that
consist of multiple I/O points, called Blocks. These are discussed in section 4.
Let's begin by quickly configuring a Project with the minimum information needed to Download
and Start your SCADA node. This will allow you to test out your newly installed software. This
assumes you have installed Project Node and SCADA node Software.
To build a minimum configuration to download and Start:
Connect to Project Node
Start WebAccess Configuration
Create a Project
Open Project Manager
Create a Node
Download and Start SCADA node
VIEW the SCADA node
WebAccess has pre-built system displays that allow you to quickly build and VIEW a run-time
database without any graphics building. This should take an experienced user less than 5
minutes to build a basic project, download and start your SCADA node and confirm your
software installation was successful.
Exercises
Task 1: Connect to project node
1. Start Internet Explorer.
Double Click the Icon on your Desktop
OR, From the Start button select:
Start->Programs->Internet Explorer
2. Enter the 127.0.0.1 or
To connect to your local PC enter http://localhost/
3. Press the Enter key or Select Go. Appeared see below

WebAccess+ IoT Solution Software Training Course 2. Project & Node Configuration
Advantech Co., Ltd. Ver. 8.0 2 - 3
Congratulations! You have successfully connected to your WebAccess Project
Node. It took no special software to connect.
Let’s next go to WebAccess Configuration, to build a project.
Task 2: Start WebAccess Configuration
1. Select Project Management
2. Login with Default username and password
If this is a new system or you are connecting to the Live Demo, use the "Default
Login". Otherwise, use your Login Name and Password.
a. In the Login Name field type: admin
b. Leave Password field blank (i.e. no password)

WebAccess+ IoT Solution Software Training Course 2. Project & Node Configuration
Advantech Co., Ltd. Ver. 8.0 2 - 4
c. Click the Login Button
Task 3: Create New Project
If you have not already done so, connect to the Project Node and Start
WebAccess Configuration.
1. Please enter Project1 as Project name for this Training Course
Enter a Project Name for this project, in the Create New Project section in the
WebAccess Project(s). This name can be any alphanumeric (but NO
UNDERSCORES,No “_”). This name will identify the project in the Project
Manger. Projects are typically named after the customer or facility.
Note - If you are using a standalone system, the Project Name with the SCADA node name appended
to it will appear in ViewDAQ and DrawDAQ menu lists (ProjectName_NodeName)
2. Optionally, enter a Project Description to help identify your project. This will
appear only in the Project Manager.
3. Please enter 127.0.0.1 in Project Node IP Address for this Training Course
The Project Node IP Address should already appear by default. You can also
use a IP Address or Computer Name.
4. Project Node HTTP Port & Project Node TCP Port accept the default: 0.
That 0 means the default primary port number (4592)
5. Project TimeOut accept the default: 0.
It is recommended to accept the default Project Time Out. 0 means the default
value is used (15 seconds). Project Time out can range from 1 to 60 seconds.
This is the time for normal communications between the Project Node and a
SCADA node or the Project Node.

WebAccess+ IoT Solution Software Training Course 2. Project & Node Configuration
Advantech Co., Ltd. Ver. 8.0 2 - 5
6. The Access Code should appear by default.
This is the Remote Access Code specified during the installation of the
WebAccess Project Node Software. This Remote Access Code is to prevent
unauthorized use of your project node.
7. Press Submit for New Project.
8. Press Yes to create a new Project.
Task 4: Add SCADA Node
If you have already done so, connect to the Project Node to WebAccess Configuration.
1. From Current Projects select your Project Name and press Configure.
2. The WebAccess Project Manager opens.
3. Select Add SCADA Node from the Project Manager.
4. The Create SCADA Node .

WebAccess+ IoT Solution Software Training Course 2. Project & Node Configuration
Advantech Co., Ltd. Ver. 8.0 2 - 6
5. Enter a SCADA1 in Node Name for this node.
This is the name that users will see in the caption bar of VIEW and use to select
this node from a list of nodes if your have multiple SCADA nodes.
Note - the Project Name with the SCADA node name appended to it will appear in ViewDAQ and
DrawDAQ menu lists (ProjectName_NodeName).
6. Optionally, enter a Description.
7. Enter the 127.0.0.1 in IP address of the SCADA node.
The Project Node IP Address appears by default. Be sure to enter the IP Address
of the SCADA node. You can also use a IP Address or Computer Name.
8. Accept the default: 0 in the Primary Port Number of a TCP port.
That 0 means the default primary port number (4592)
9. Accept the default: 0 in the Secondary Port Number of a TCP port.
That 0 means the default primary port number (14592)
WebAccess uses the HTTP port plus requires 2 additional TCP ports; do not use
the same port number for both primary and secondary ports if you are
connecting through a firewall.
Firewalls - Three (3) TCP ports are required. Typically port 80 is already open, this is the port for
HTTP (web and ASP pages). WebAccess needs two additional ports:
Primary port (default 4592) for file transfer and
Secondary Port (default 14592) for real-time data.
10. Accept the default: 0 in Node Time Out
It is recommended to accept the default Node Time Out. 0 means the default
value is used (15 seconds). SCADA Node Time out can range from 1 to 60
seconds. This is the time for normal communications between the SCADA Node

WebAccess+ IoT Solution Software Training Course 2. Project & Node Configuration
Advantech Co., Ltd. Ver. 8.0 2 - 7
and a VIEW Client, the Project Node. If you have a very slow network connection
between the Project and SCADA nodes, you may have to increase this value.
11. Leave the Remote Access Code fields blank for now.
12. Leave the information about Alarm Log, Printers, Action Log, Alarm Beep, email
and other fields blank for now.
13. Press Submit. This is just the minimum to create a SCADA Node.
You have configured enough information to Download and Start a SCADA node. You
can start VIEW and see the default main graphic display. To test out your software
installation, let's Download and Start SCADA node.
Task 5: Download and Start the SCADA Node
If you have already done,
1. Select the SCADA Node under your Project Name in the Project/Node list.
2. Select Download.
3. The Download Dialog Box pops open
4. When download is finished, select Close Window.
5. From Project Manager select Start node.
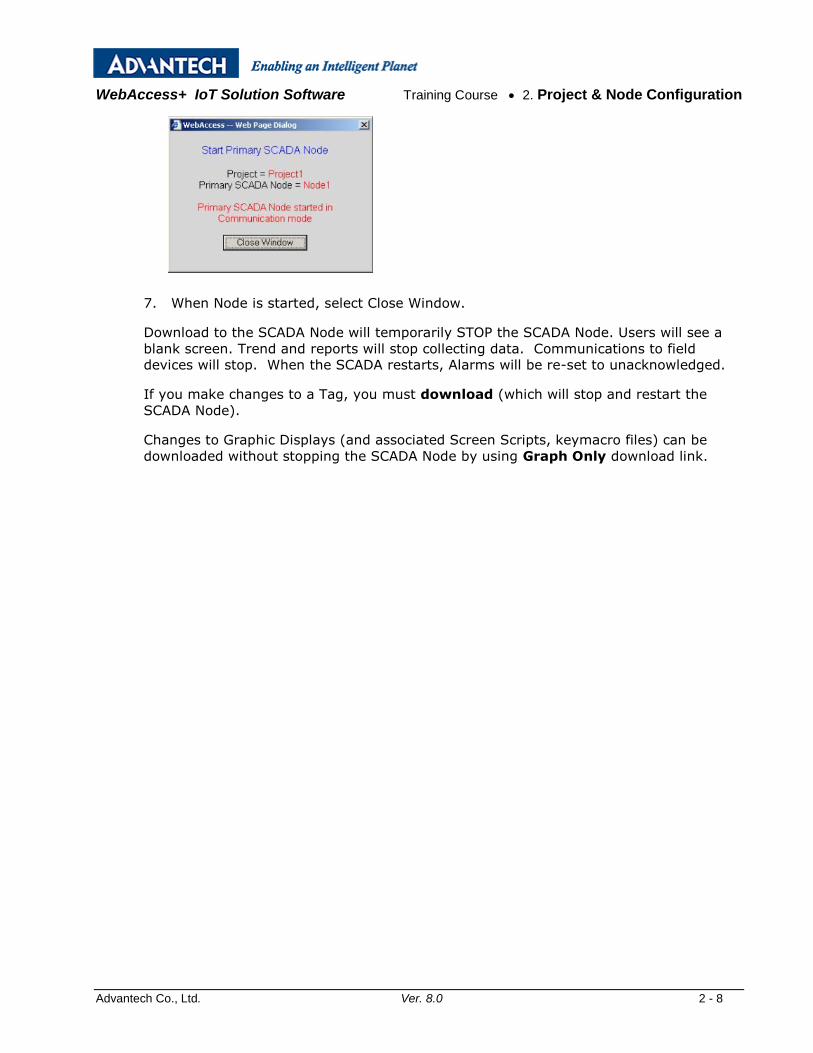
6. The Start Node Dialog Box pops open.
WebAccess+ IoT Solution Software Training Course 2. Project & Node Configuration
Advantech Co., Ltd. Ver. 8.0 2 - 8
7. When Node is started, select Close Window.
Download to the SCADA Node will temporarily STOP the SCADA Node. Users will see a
blank screen. Trend and reports will stop collecting data. Communications to field
devices will stop. When the SCADA restarts, Alarms will be re-set to unacknowledged.
If you make changes to a Tag, you must download (which will stop and restart the
SCADA Node).
Changes to Graphic Displays (and associated Screen Scripts, keymacro files) can be
downloaded without stopping the SCADA Node by using Graph Only download link.

WebAccess+ IoT Solution Software Training Course 3. Communications, IO Tags
Advantech Co., Ltd. Ver. 8.0 3 - 1
Section 3 – Communications, IO Tags
Objective This section discusses the various point types (Analog Tags, Discrete Tags, Text-type Tags and
Blocks, parameters, tag fields, internal tags, IO Tags etc.) that you can configure in WebAccess.
After completion of this section, you will be able to distinguish, configure and apply the various
point types in a project.
Training Notes There are two different categories of point tags: I/O communication points and database points.
I/O Tags - These include single points and multi-points.
Communication points have device addresses that are mapped
to some memory location in the controller device. I/O
communication points are created from parameters and block
types.
Internal Tags - These include constant points, calculation points
and accumulation points. They are not configured for
communication; they do not have I/O addresses and are used
solely in WebAccess.
IO Tags and Blocks
WebAccess uses two concepts of tags used in communication with plant floor devices:
Tags and Blocks. Both IO Tags and Blocks describe real-time measurements and
outputs (reads and writes) between the SCADA node and automation devices (PLCs,
controllers, DDC systems, etc).
Tags are easiest to understand and are frequently used in small projects.
Blocks are productivity tools, that require significant planning, but can dramatically
reduce the time to implement a large automation project or repetitions of the same
automation project.

WebAccess+ IoT Solution Software Training Course 3. Communications, IO Tags
Advantech Co., Ltd. Ver. 8.0 3 - 2
Tags can represent analog, discrete or text type data. Discrete type data is also
called digital. Analog data is a usually a floating point number. Discrete data is an
often only 0 or 1. Text type data is an ASCII string up to 72 characters.
Parameters are the individual elements of a Block. Users reference the data in a block
by appending the parameter to the block name: Blockname:Parameter.
For example, to read the setpoint of flow controller, type FIC101:SP in the Point Info
Dialog box.
IO Tags and Blocks are built from template type objects: Parameter Types and Block
Types.
Tag Fields
Tag Fields describe the multiple dimensions of a Tag including description, Alarm State,
Alarm Limits, Output Limits, Engineering Units, Span Hi, and Span Lo. Tag fields are
read by appending the Field name to the Tagname. The format is:
Tagname.FIELD or Blockname:paramter.FIELD
For example, to read the high output limit of the setpoint in the above example, type
FIC101:SP.OUTPH in the Point Info Dialog box
To see or change the High Alarm Limit of the tag named SINE, type SINE.ALMHI in the
point info dialog box
Many Tag Fields are Read/Write and can be used to adjust Alarm Limits, Descriptions,
etc. during Run time.
Parameters
Parameters are the starting point in the configuration of I/O points and block types. A
parameter defines the template for a single device point. An example of a parameter
is the process value of a process controller or the analog/digital input/output of a
PLC. It is used as a basis in defining single points. It can also be included as a
parameter in a block type.
It is usually not necessary to create new parameters. Each device driver includes a set
of pre-built parameters. You can review and customize the parameters according to
your project needs.
Scan Types
By default, WebAccess reads data from the controller device continuously as long as
the KERNEL Task is running. This is called constant scan. In addition to constant
scan, you can specify some other scan type so that for the specific point WebAccess
scans data only when a graphic associated with that point is open. For a large project,
these other scan types can significantly reduce the communication burden and
improve driver performance. The following scan types are available:
Constant - the point is scanned continuously regardless of the
current VIEW task.

WebAccess+ IoT Solution Software Training Course 3. Communications, IO Tags
Advantech Co., Ltd. Ver. 8.0 3 - 3
Display - the point is scanned only when it is displayed in a
graphic.
Input Scaling
You can apply a scaling to the raw data from the controller devices. The following
scaling methods (Input Scaling) are available for display of values:
No Scale - for a value not requiring scaling or one that will be
scaled prior to reaching the computer.
Scale to Span (for 0-100%) input - for a percent value that
needs to be converted to an engineering range specified by the
SpanHi and SpanLo fields. The input value from the controller
device must be in the range 0-100.
Square Root - for a value that requires a square root function.
Linear function MX+B X=input - for a value that needs to be
scaled to an engineering range with a slope and bias. The
values for the multiplier (M) and the bias (B) are calculated
using the following linear slope equation:
M * (High Input Count) + B = Span High
M * (Low Input Count) + B = Span Low
Scale to Span (for 12-bit input) - for a percent value that
needs to be converted to an engineering range specified by the
SpanHi and SpanLo fields. The input value from the controller
device must be in the range 0-4095.

WebAccess+ IoT Solution Software Training Course 3. Communications, IO Tags
Advantech Co., Ltd. Ver. 8.0 3 - 4
Exercises For these training exercises, it is recommended to use a Modbus PLC with TCP/IP
communications. If a PLC is not available, it is recommended to install the Modbus TCP
Simulator software on the student’s PC. See the Appendix for more information on the Modbus
PLC simulator software.
Task 1: Add New Comport
From the Project Manager
1. Select your SCADA node under the Project/Node list.
2. Select Add Comport
This can take a long time while tables are created in the database on the Project
Node / Web Server.
3. The Create New Comport page appears.
4. Select the TCP/IP as the Interface Name for this Comport. (Also called the
Comport Type).
The fields change depending on the Comport Type.

WebAccess+ IoT Solution Software Training Course 3. Communications, IO Tags
Advantech Co., Ltd. Ver. 8.0 3 - 5
5. The TCP/IP Comport Properties page appears.
6. Enter 3 for Comport Number.
It is recommended to use a number above 2 for TCP/IP ports, so you don't
interfere with adding a serial comport. Most PCs have 2 serial comports, if you
configured a TCP/IP comport as 1 or 2, you would not be able to use that serial
comport in the future. It is not easy to change comport numbers.
7. Optionally, enter a Description. This is just for your own reference.
8. Enter a Scan Time and select the radio button for the units (Millisecond, Second,
Minute or Hour).
9. Accept the default values for the other fields, or modify them.
10. Click Submit.
11. The SCADA Node page appears. The Port should appear as a folder under the
SCADA node. (In this example Port3 under SCADA1) in the menu tree at left.
Task 2: Add New Device
12. Click on the Port hyperlink (Port3 in this example). The Com Port Properties
page opens.

WebAccess+ IoT Solution Software Training Course 3. Communications, IO Tags
Advantech Co., Ltd. Ver. 8.0 3 - 6
13. Select Add Device.
14. The Create Device Page opens. This also can take some time while data tables
are created in the database on the Project Node.
15. Select Modicon form the Device Type pull down list for now.
16. Enter a PLC1 for Device Name. This will appear as a folder under the comport in
the Project Manager.
17. Optionally, enter a description.
18. Enter the Unit Number. This number will appear in VIEW during runtime on the
Station Status display and will be the reference to Enable and Disable
communications to the Device.
19. Enter 127.0.0.1 for IP Address for now.
You will installed the ModSim.exe simulator software on your PC, then enter the
IP Address of your PC or 127.0.0.1
20. Enter 502 for TCP or UDP Port Number for the Device.
21. Enter a Device Address if different from the Unit Number.

WebAccess+ IoT Solution Software Training Course 3. Communications, IO Tags
Advantech Co., Ltd. Ver. 8.0 3 - 7
Important! – Use the Device Address given by your Instructor for the PLC in your
classroom. The Modbus TCP Simulator software uses Device Address 1.
22. Press Submit. This can be a wait while data tables are created on the Project
Node.
The PLC appears as a folder under the comport in Project Manager.
Task 3: Add New Analog I/O Tag
25. The Update Device Page Appears.
26. Select Add Tag.
27. The Create New Tag page appears.
28. Use the AI Parameter from the Parameter pull down List
29. Enter a Tagname (AI1 in the example).
30. Modify the address (40001 in the example).

WebAccess+ IoT Solution Software Training Course 3. Communications, IO Tags
Advantech Co., Ltd. Ver. 8.0 3 - 8
32. Accept the default values for the other fields . Press Submit.
Important! – Press SUBMIT before continuing to next step or you will loose your
data.
33. Please create another new Tag named AI2 (Address : 40002) for now.
34. Download the changes to Node. (As same as previous download steps)
Task 4: ModSim for Simulation
1.Start ModSim32.exe (or ModSim.exe)
Double Click the Icon on your ModSim
OR, From the Start button select: Start->Programs->ModSim (You should prepare this Program in advanced)
2. Select Modbus /TCP Sev form the Connection pull down list for now.
3.Enter 502 for Modbus/TCP Service Port, then Press OK.
3. Select New form the File pull down list for now.
Enter 0001 in the Address and 10 in the Length field,

WebAccess+ IoT Solution Software Training Course 3. Communications, IO Tags
Advantech Co., Ltd. Ver. 8.0 3 - 9
Select 03 (HLODING REGISTER) for Modbus Point Type, It appears
Task 5: Download to Node
1. Select the right Node under your Project Name in the Project/Node list.
2. Select Download.
3. The Download Dialog Box pops open.
4. When download is finished, select Close Window.
5. From Project Manager Select Start node.

WebAccess+ IoT Solution Software Training Course 3. Communications, IO Tags
Advantech Co., Ltd. Ver. 8.0 3 - 10
6. The Start Node Dialog Box pops open. Click Submit
7. When Node is started, select Close Window.
Download to the Node will temporarily STOP the SCADA Node. Users will see a blank
screen. Trend and reports will stop collecting data. Communications to field devices will
stop. When the SCADA restarts, Alarms will be re-set to unacknowledged.
If you make changes to a Tag, you must download (which will stop and restart the
SCADA Node).
Changes to Graphic Displays (and associated Screen Scripts, keymacro files) can be
downloaded without stopping the SCADA Node by using Graph Only download link.
Task 6: Start the Node Kernel
1. Select the SCADA Node under your Project Name in the Project/Node list.
2. From Project Manager select Start node .
3. The Start Node Dialog Box pops open.
4. When Node is started, select Close Window.

WebAccess+ IoT Solution Software Training Course 3. Communications, IO Tags
Advantech Co., Ltd. Ver. 8.0 3 - 11
Task 7: Start VIEW to Point Info
1. Select Start View.
9. If you have not already installed the Client, you will see a message:
"Please Click here to install WebAccess Client first".
If you get this message, just follow the steps to download and install the client.
10. Welcome to WebAccess Login appears.
11. Select Please Login
12. The User Login Dialog Box Appears.

WebAccess+ IoT Solution Software Training Course 3. Communications, IO Tags
Advantech Co., Ltd. Ver. 8.0 3 - 12
13. Enter Username: admin
and no Password:
14. Right Click with the mouse or press the Enter key.
15. The default Main Graphic Display appears (you can edit or create a new Main.bgr
later)
16. Use the Point Info Dialog Box is opened using:
Pressing the icon on the Toolbar.

WebAccess+ IoT Solution Software Training Course 3. Communications, IO Tags
Advantech Co., Ltd. Ver. 8.0 3 - 13
Troubleshooting
17. If you see an asterisk (*) with a number (typically 8000), communications has
failed. You have the IP Address wrong, the port wrong, the address wrong or some
other communication problem.
Task 8: Add New Digital I/O Tag
1. Please finish the two tags followed the previous procedures, then show in Point Info.
DI Point : DI1 Address : 10001 (Modbus Address)
DI Point : DI2 Address : 10002
Tag name Tag fields
DI1 Address: 10001
Description: DI1
State 0 descriptor: 0
State 1 descriptor: 1
All other parameters: use default
Tag name Tag fields
DI2 Address: 10002
Description: DI2
State 0 descriptor: 0
State 1 descriptor: 1
All other parameters: use default

WebAccess+ IoT Solution Software Training Course 4. Internal Tags
Advantech Co., Ltd. Ver. 8.0 4 - 1
Section 4 - Internal Tags
Objective This section discusses the various point types you can configure in WebAccess. After completion
of this section, you will be able to distinguish, configure and apply the various point types in a
project.
Training Notes
WebAccess provides Internal Tags that do not read IO directly: Calculation Tags,
Accumulation Tags, and Constant Tags . The internal tags are used for calculations
and for constants used by scripts or calculations. Internal Tags have all the alarm and
security features of IO Tags. These Internal Tags are available to every other tag, script,
display, and client in the system.
Local Screen Tags are temporary internal tags used by scripts and graphic
displays. Typically, Local Screen Tags hold intermediate values or enhance display
animation. Local Screen Tags disappear when the display they are assigned is closed.
%DAQ System Tags and System Point Tags are used to access system data
Constant Point
Constant Tags are a Global Internal Tags. All clients, scripts and other tags will see the
same value when reading this tag. Changes to the tag will be seen globally by all other
clients, scripts and other tags.
Constant Tags are most frequently used for operator entry of values to calculation tags,
scripts and user programs.

WebAccess+ IoT Solution Software Training Course 4. Internal Tags
Advantech Co., Ltd. Ver. 8.0 4 - 2
Accumulation Point
An Accumulation Tag consists of an Integration function from another tag or block,
usually an IO Tag.
The most common use is to totalize the Flow from a flow device (e.g. calculate volume
from flow rate). The value of the input tag is "Accumulated" into a total. The
totalization function is executed within the software. Accumulation tags are ANALOG
tags.
Calculation Point
A Calculation Tags perform mathematical and logical operations on the values of other
tags. The result is a single analog output that can be alarmed and data logged. Up to
20 inputs can be used in the calculation. Input tags can be Analog or Discrete.
A typical formula is: (A*.99+B)/C.
Math Functions
Calculation Tag Math Functions
Operators Description
+ Addition
- Subtraction
* Multiplication
/ Division
sin( ) Sine function; format is sin(A) where A is in radians
cos( ) Cosine function; format is cos(A) where A is in radians
sqrt( ) Square root; format is sqrt(A) where A is in radians
pow( , ) Power; format is pow(A,B) for A to the power of B
log( ) Natural logarithm; format is log(A)
log10( ) Logarithm base 10; format is log10(A)
( ) Precedence operator. Perform calculation inside parentheses
before any operators outside parentheses
Math Functions can be nested. For example, SIN(A*0.0175) will multiply A by 0.0175
then calculate the Sine.
Logic Functions
Logic Functions
Operators Description
> Greater than
>= Greater than or equal to
< Less than
<= Less than or equal to

WebAccess+ IoT Solution Software Training Course 4. Internal Tags
Advantech Co., Ltd. Ver. 8.0 4 - 3
== Equal to
!= Not equal to
! NOT
&& AND
|| OR
max(A,B) Selects the higher value of A and B
min(A,B) Selects the lower value of A and B
Exp1?Exp2:Exp3 Conditional expression where Exp 1, 2 and 3 are math and/or
logic expressions. Exp 1 is evaluated first. If it is non-zero (true),
the tag uses the value of Exp 2 as its output. Otherwise, Exp 3 is
used for the tag output.
An example is C>0?A*B/C:1 If C is greater than 0, the tags value will be A*B/C. If C
is Not greater that 0, then output of the calculation is 1.
System Point Tags
System Point tags provide diagnostics and provide useful information for Alarms,
Reports, Logs and global scripts. For example, there are system tags for Communication
Port Status, Device Status, Simulation Mode, License Serial Number, and Tag Limit.
The System Point tags must be configured by the user and are based on a subset of the
%DAQ tags although there are System Point Tags that do no have a corresponding
%DAQ tag. System Points Tags alarm, show in the Alarm Summary, can be used in
trends, global scripts, calculation tags, logs and reports.
Note - The %DAQ tags are created automatically and are similar to System Point Tags,
however %DAQ tags can not be used in Calculation Tags and %DAQ tags do not appear
in the Alarm Summary, trends, or reports. Only Local Screen Scripts, Graphic Displays
and Pushbutton Keymacros can use %DAQ tags. Use System Point Tags for reports,
alarms and calculation tags.
Exercise
Task 1: Create constant point tags.
1. Select your SCADA Node from the list on the left of the Project Manager.
2. Click the ConstPoint hyperlink in Project Manager to open the Constant Point
List page.

WebAccess+ IoT Solution Software Training Course 4. Internal Tags
Advantech Co., Ltd. Ver. 8.0 4 - 4
3. Click Add Const Point to open the Add New Tag page.
Create Analog Constant Point Tags
4. ConstAna should be selected for the Parameter.
5. Configure a constant point tag named Amplitude by entering the following data
from the table. It should look like the picture below the table.
Tag name Tag fields
Amplitude
Parameter: ConAna
Description: Size of SINE wave
Keep previous value: Yes
Initial value: 70
Span Hi: 100
Span Lo: -100
Output High Limit: 100
Display Digits (Integer): 3
All other parameters: use default

WebAccess+ IoT Solution Software Training Course 4. Internal Tags
Advantech Co., Ltd. Ver. 8.0 4 - 5
6. Press Submit when finished entering data.
Important! – Press Submit to save your data and create the AMPLITUDE tag
before starting the next step.
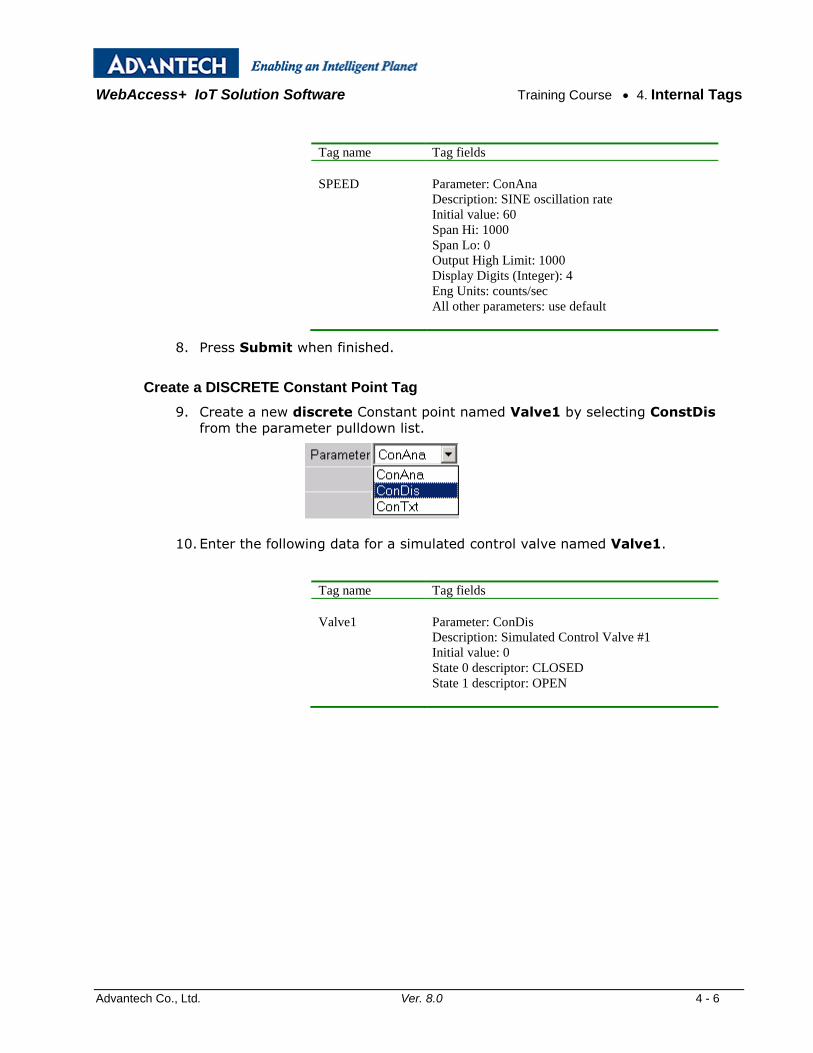
7. Create a new Constant Point Tag named SPEED by entering the following data.
WebAccess+ IoT Solution Software Training Course 4. Internal Tags
Advantech Co., Ltd. Ver. 8.0 4 - 6
Tag name Tag fields
SPEED Parameter: ConAna
Description: SINE oscillation rate
Initial value: 60
Span Hi: 1000
Span Lo: 0
Output High Limit: 1000
Display Digits (Integer): 4
Eng Units: counts/sec
All other parameters: use default
8. Press Submit when finished.
Create a DISCRETE Constant Point Tag
9. Create a new discrete Constant point named Valve1 by selecting ConstDis
from the parameter pulldown list.
10. Enter the following data for a simulated control valve named Valve1.
Tag name Tag fields
Valve1 Parameter: ConDis
Description: Simulated Control Valve #1
Initial value: 0
State 0 descriptor: CLOSED
State 1 descriptor: OPEN

WebAccess+ IoT Solution Software Training Course 4. Internal Tags
Advantech Co., Ltd. Ver. 8.0 4 - 7
11. Press Submit when finished entering data for Valve1.
12. To make changes to your Constant Point Tags, select Const Point List.
13. Select the Folder next to Const Point to expand the List.
Create Discrete Tag for a FAN to rotate later
14. Create a second Discrete Constant Point Tag named FAN101.

WebAccess+ IoT Solution Software Training Course 4. Internal Tags
Advantech Co., Ltd. Ver. 8.0 4 - 8
Task 2: Create accumulation point tag.
1. Select your SCADA Node from the list on the left of the Project Manager.
2. Click the AccPoint hyperlink in Project Manager.
3. Configure the following accumulation point.

WebAccess+ IoT Solution Software Training Course 4. Internal Tags
Advantech Co., Ltd. Ver. 8.0 4 - 9
Tag name Tag fields
TIMER Accumulation point
Description: Input to SINE
Source tag name: SPEED
Accumulate frequency: 1 once per second
Divide factor: 1
Span Hi: 3600
Span Lo: 0
Value Limit: 3599
All other parameters: use default
4. Press Submit when finished.
5.
Task 3: Create calculation point tags.
Configure the following calculation points.
1. Select your Node from the list on the left of the Project Manager.
2. Click the CalcPoint hyperlink in Project Manager

WebAccess+ IoT Solution Software Training Course 4. Internal Tags
Advantech Co., Ltd. Ver. 8.0 4 - 10
3. Click the Add Calculation Point hyperlink.
4. Create New Tag page opens.
5. Enter the values as shown above or in the table below for the SINE calculation
Tag.
Tag name Tag fields
SINE Parameter: CalcAna
Description: Sine Wave
Evaluate Frequency: 1 second
Write Action Log: No
Log Data: Yes
Data Log Db: 0.2%
Span high: 1
Span low: -1
Output High Limit: 1
Output Low Limit: -1
Display Digits (integer): 1
Display Digits (fraction): 2
Calculation: SIN(A*0.00175)*(B/100)
A: Timer
B: AMPLITUDE

WebAccess+ IoT Solution Software Training Course 4. Internal Tags
Advantech Co., Ltd. Ver. 8.0 4 - 11
6. Press Submit when finished entering information for the SINE
7. Select CalcDis from the Parameter Pulldown List.
8. The Create New Tag page refreshes displaying fields for a Discrete Type tag.
4. Enter for the FlipFlop calculation point Tag.
Tag name Tag fields
FlipFlop Parameter: CalcDis
Description: Test if nonzero - flip from 0 to 1 to 0
Evaluate Frequency: 3 seconds
Initial Value: 0
State 0 OFF
State 1 ON
State 2 NotUsed
Formula: A>0?0:1
A: FlipFlop
5. Press Submit when finished entering information for the tag.
6. The SINE and FlipFlop tags should appear under Calc Point.

WebAccess+ IoT Solution Software Training Course 4. Internal Tags
Advantech Co., Ltd. Ver. 8.0 4 - 12
Task 4: Configure a System Point Tag
1. Select SysPoint hyperlink from SCADA Node Properties Page.
2. Select ADD System Point.
3. From the Pull Down list Parameter, select a Parameter associated with the function
you want to monitor. Select DEVSTS.
Parameter names for System Points are an abbreviation of the function. Pick a
parameter, then read the Description that describes it's function better than the
abbreviated parameter name.
4. Enter a Tag Name: ModbusPLC
5. Enter Comport Number and Unit Number: 3,0
This assumes you created a Comport 3 and used Device Address 0 for previous
Modbus PLC setting.
6. Press Submit.

WebAccess+ IoT Solution Software Training Course 4. Internal Tags
Advantech Co., Ltd. Ver. 8.0 4 - 13
7. Download the node to make changes and update.
Task 5: Verify new Tag configurations in VIEW.
1. Download the Node.
2. Start Node
3. Start VIEW.
4. Open the Point Info List and use the filter buttons to check the values of the points
configured. The Point Info Dialog Box is opened using:
Pressing the icon on the Toolbar.
Right Click -> Goto -> Point Info (ViewDAQ users skip the right click)
5. View Constant Points
Constant Point Tags and System Tags appear as IO Tags in Point Info. Constant
Button shows only Constant Tags and System Point Tags for the Node.

WebAccess+ IoT Solution Software Training Course 4. Internal Tags
Advantech Co., Ltd. Ver. 8.0 4 - 14
6. View Accumulation Tag
Accumulation Tags appear as I/O Tags from all Nodes. Use the Accumulation button
to view Acc Tags on this node.
7. View Calculation Tags.
Calculation Point Tags appear as I/O Tags or using the Calculation Button to view
Calc Tags on this node
View I/O Tag, in the Point List, select a point AI1.
8. Select the Goto button, the Point Goto Dialog Box opens.
9. Select Point Detail button.
10. Select OK. Check the tag fields in the point detail displays.

WebAccess+ IoT Solution Software Training Course 4. Internal Tags
Advantech Co., Ltd. Ver. 8.0 4 - 15
Task 6: Export Tags to EXCEL (EXCEL OUT)
EXCEL OUT - exports the Tag Database of a SCADA node to an EXCEL Spreadsheet on
the SCADA node, to allow editing of the tags and adding new tags by copying existing
tags. EXCEL IN allows those changes to be imported into the Project or another project.
It is recommended to create tags only by copying tags already exported using EXCEL
OUT.
EXCEL OUT creates a EXCEL Worksheet on the Project Node. You must be on the
Project Node or have access to a Shared Drive or an FTP directory on the Project Node
to edit this EXCEL Worksheet.
To export Tags to EXCEL
1. Login to Project Manager
2. Select SCADA Node from the Project Tree at left
3. Select EXCEL OUT hyperlink.
4. Optionally, modify the path and file name of the EXCEL Worksheet. (note - this
will be located on the Project Node)

WebAccess+ IoT Solution Software Training Course 4. Internal Tags
Advantech Co., Ltd. Ver. 8.0 4 - 16
5. Press Submit.
6. A Progress Box opens. Press CLOSE to close the box.
7. An ASP Page appears listing Tags exported to Excel.
8. Optionally, Print the list.
9. Press OK when finished.
Open EXCEL on the Project Node to edit the file named in step 4 above.
Task 7: Edit and Create Tags in EXCEL
It is recommended to create tags only by copying tags already exported using EXCEL
OUT.
EXCEL OUT creates a EXCEL Worksheet on the Project Node. You must be on the
Project Node or have access to a Shared Drive or an FTP directory on the Project Node
to edit this EXCEL Worksheet.
1. Start EXCEL on the Project Node.

WebAccess+ IoT Solution Software Training Course 4. Internal Tags
Advantech Co., Ltd. Ver. 8.0 4 - 17
Important - EXCEL OUT creates a EXCEL Worksheet on the Project Node. You
must be on the Project Node or have access to a Shared Drive on the Project
Node to edit this EXCEL Worksheet
3. Open the Worksheet you exported.
Typically, this is located at C:\WebAccess\Node\config\bwTagExport.XLS,
On the Project Node!
4. The first three sheets are blank (Sheet1, Sheet2, and Sheet3 are blank and can
be erased or used for notes)
5. Select BwAnalog sheet to edit Analog Tags.
6. Insert rows only above the last row.
7. Copy a row (for example copy the tag SPEED).
8. Past SPEED row to the blank row inserted in step 6.
9. Modify the tag name of the new row to New Tag.
10. Select BwDiscrete to modify Discrete Tags.
11. Select BwAlarmAnalog to modify Analog Alarms.
12. Select BwAlarmDiscrete to modify Discrete Alarms.
13. Select BwText to modify Text Tags.
14. Select BwCalcAnalog to modify Analog Calculation Tags
15. Select BwCalcDiscrete to modify Discrete Calculation Tags
16. Select BwAcc to modify Accumulation Tags.
17. Save the EXCEL Worksheet using a different name.
Important - BwTagExport will be overwritten the next time EXCEL Out is used and
will erase your work.

WebAccess+ IoT Solution Software Training Course 4. Internal Tags
Advantech Co., Ltd. Ver. 8.0 4 - 18
Task 8: Import Tags from EXCEL (EXCEL IN)
EXCEL IN - imports Tags from EXCEL Spreadsheet. EXCEL IN allows tags to be
imported into the Project or another project.
It is recommended to create tags only by copying tags already exported using EXCEL
OUT.
EXCEL IN imports an EXCEL Worksheet on the Project Node. You must be on the Project
Node or the Project Node must have access to a Shared Drive to import this EXCEL
Worksheet.
The Project Name and SCADA Node name for the Tags you want to import from the
Worksheet must match the Project and SCADA node you are importing.
Note - ProjName and NodeName must match the Project Name and SCADA node name for each tag you are
importing to this SCADA node and project.
To import Tags from EXCEL
1. Login to Project Manager
2. Select SCADA Node from the Project Tree at left
3. Select EXCEL IN hyperlink.
4. Optionally, modify the path and file name of the EXCEL Worksheet. (note - this
must be located on the Project Node).
5. Select No if you want only to insert new tags without overwriting existing tags.

WebAccess+ IoT Solution Software Training Course 4. Internal Tags
Advantech Co., Ltd. Ver. 8.0 4 - 19
6. Press Submit.
7. A Progress Box opens.
8. An ASP Page appears listing Tags exported to Excel.
9. Optionally, Print the list.
10. Press OK when finished.
The new tags should appear in the Project Under your SCADA node.
Common Errors
A. An entire Column was pasted. This will create 65,535 rows of mostly empty data
and will result in a very long time to import via EXCEL IN. The web server may
timeout resulting in no imported tags.
B. File name is not correct.
C. The original EXCEL OUT saves as bwTagExport. It will be overwritten the next
time EXCEL Out is used. This will erase any changes you made. Resave your
changes to a new file name!
D. The worksheet is on the Project Node. If you are on a remote client or remote
SCADA node, you will not be able to see the exported worksheet. Contact your

WebAccess+ IoT Solution Software Training Course 4. Internal Tags
Advantech Co., Ltd. Ver. 8.0 4 - 20
system administrator to Map a network drive or have an FTP service set up on
the Project node that you can access.
E. The Project or SCADA node name in the EXCEL spreadsheet does not match the
Project or SCADA Node you are importing to

WebAccess+ IoT Solution Software Training Course 5. DRAW
Advantech Co., Ltd. Ver. 8.0 5 - 1
Section 5 - DRAW
Objectives In this section, you will learn to use DRAW, the Graphic Builder, to create custom graphics and
controls. At the end of the section, you will be able to create animated objects that change
state according to a point’s values.
Exercise
Task 1: Start local graphics builder - DrawDAQ
You have to be on the Project Node (or a combine Project/SCADA node) to use
DrawDAQ. This is the Computer with the WebAccess Project Node software installed.
If you do not see the WebAccess icon on your taskbar (usually at lower right of screen
next to the clock) or can not find DrawDAQ, then start your web browser and go to the
previous section Start Web Access – DRAW.
1. Click the WebAccess Service icon on the taskbar (usually located at lower right of
screen, next to the clock).
2. Drag the mouse curser over the popup menu to DrawDAQ.

WebAccess+ IoT Solution Software Training Course 5. DRAW
Advantech Co., Ltd. Ver. 8.0 5 - 2
3. Drag the mouse to the Project1_SCADA1 (ProjectName_Node) of the desired
Project and Node. If you have only one project and only one node, you will see only one
entry.
4. DrawDAQ opens.
Notice there is a menu bar in the local DrawDAQ. This replaces the Right-Click Menu in
the web browser version.
Task 2: Explore DRAW Toolbars
These are the toolbars used to Build Graphics. The buttons are shortcuts for items
found in the Right Click Menu (in DRAW) and Menu Bar (in DrawDAQ). Toolbars are the
same in both DRAW and DrawDAQ.

WebAccess+ IoT Solution Software Training Course 5. DRAW
Advantech Co., Ltd. Ver. 8.0 5 - 3
Toolbar (DRAW) - Top
Toolbar (DRAW) - Bottom
Moving the cursor over the Toolbar and pausing on an icon/button will show a ToolTip
(black text in a yellow box).
If ToolTip does not show, please change the Toolbar ToolTip to Yes in Node Property.
Task 3: Draw a Widget- Meter
1. Click the Widget icon from the upper toolbar.
Hint - If you pause the pointer over the icon a tool tip opens describing the button .
2. Use the scroll bar to $meter01
3. Select $meter01 from the Draw Widget Dialog Box.
4. Select OK.
5. The Tag List appears.

WebAccess+ IoT Solution Software Training Course 5. DRAW
Advantech Co., Ltd. Ver. 8.0 5 - 4
I/O Tag list may be empty in a new system. Usually, you would use the I/O Tag list
for animation, but in case you are on a new system without I/O Tags, we will use a
pre-built System Tag for this example.
6. Click the DaqTag button to see some system tags.
7. Scroll down to %ATIMERCOUNT.
8. Click on %ATIMERCOUNT and select OK .
9. The Widget appears in Outline form with a cursor. Position the Widget where you
want it drawn.

WebAccess+ IoT Solution Software Training Course 5. DRAW
Advantech Co., Ltd. Ver. 8.0 5 - 5
10. Click the left mouse button to draw the widget.

WebAccess+ IoT Solution Software Training Course 5. DRAW
Advantech Co., Ltd. Ver. 8.0 5 - 6
Congratulations! You have just drawn and animated a meter that will indicate the
value of your tag. The needle will move as the value changes. The High Scale and
Low Scale of the Tag will be displayed.
You can continue to draw some text, animate Text and draw some pushbuttons.
Or you can save the graphic and download your graphic to the SCADA node in order to
VIEW it.
Task 4: Draw Text
To draw text on a graphic display:
1. Click the Text icon from the Bottom Toolbar.
2. Position the Text Starting Point with the Crosshair.
3. Click once to fix the Text Start Position.
4. Type in your text using your keyboard. (For example, type "SETPOINT").

WebAccess+ IoT Solution Software Training Course 5. DRAW
Advantech Co., Ltd. Ver. 8.0 5 - 7
5. Press the ENTER key when done.
6. To Reposition the Text: Hold the left mouse button down over the text, while
moving the mouse.
Repeat this for a second test field. Draw Text to act as placeholder for dynamic data
(animated text).
1. (Repeat Steps 1 to 6). Type six characters. For example, type "XXXXXX".

WebAccess+ IoT Solution Software Training Course 5. DRAW
Advantech Co., Ltd. Ver. 8.0 5 - 8
8. To select both Text fields (i.e. SETPOINT and XXXXXX). Hold the left mouse
button down and drag a rectangle that covers both text fields.
9. Right Click ->Edit -> Align.

WebAccess+ IoT Solution Software Training Course 5. DRAW
Advantech Co., Ltd. Ver. 8.0 5 - 9
10. Select Align Center from Dialog Box
Congratulations!
You can continue to animate Text and draw some pushbuttons.
Or you can save the graphic and download your graphic to the SCADA node in order to
VIEW it now.

WebAccess+ IoT Solution Software Training Course 5. DRAW
Advantech Co., Ltd. Ver. 8.0 5 - 10
Task 5: Dynamic Text Animation
To animate text with real-time data:
1. Right Click -> Dynamic ->Animation
OR
Select the Dynamic icon from the upper toolbar.
2. The Animation Configuration Dialog Box appears.
3. Select R-Text radio button (R-Text = Right Justified Text).
4. Select a TAG from the List (for example select SPEED).
Hint - if the Tag List is blank Click the DaqTag button to see some system tags. %ATIMERCOUNT
is a useful tag to use for learning.
5. Click on the TAG Name from the list and select OK .
6. Click once on the text to be animated( for example, click on the XXXXX).
7. A red box should appear around the text signifying that the text is Dynamic.

WebAccess+ IoT Solution Software Training Course 5. DRAW
Advantech Co., Ltd. Ver. 8.0 5 - 11
You can continue to draw some pushbuttons. Or you can save the graphic and download
your graphic to the SCADA node in order to VIEW it.
Task 6: Draw a Pushbutton
Optionally, first draw Text that will be the label for the pushbutton. For example,
type "ALARM SUMMARY". See DRAW Text example above to refresh your memory. If
you draw the text label first, you can use the "Group Objects" feature to draw a
perfectly positioned button. In addition, if grouped, you can edit the text and the
button will automatically resize to fit the new text. You can also draw the text later
and place it on top of the button.
1. Click the Text icon from the Bottom Toolbar.
2. Position the Text Starting Point with the Crosshair.
3. Type: ALARM SUMMARY.

WebAccess+ IoT Solution Software Training Course 5. DRAW
Advantech Co., Ltd. Ver. 8.0 5 - 12
4. Menu bar -> Dynamic ->Pushbutton.
5. Pushbutton Dialog Box appears.
6. Click the Button Down field once (the empty field to the left of the words)
7. Drag slider bar to scroll down the list of key Macros to find
<GOTO ALMSUMMARY>
8. Double Click on <GOTO ALMSUMMARY>
9. Check GROUP Objects.

WebAccess+ IoT Solution Software Training Course 5. DRAW
Advantech Co., Ltd. Ver. 8.0 5 - 13
10. Select OK.
11. If you followed all the steps exactly, the button is drawn around the object(s).
Task 7: SAVE Graphic
There are two Save Graphic commands, which correspond to the two file types.
SAVE DRW saves your work in a form that can be edited later. SAVE BGR creates a
runtime version of the file that can be viewed on clients. SAVE BGR also has an
option to save the DRW with the same file name. Most people use SAVE BGR.
REMEMBER TO CHECK THE SAVE DRW OPTION!
To save a Graphic:
1. Menu bar -> File -> Save BGR.
OR - Select the Save BGR Icon from the top toolbar.
2. The SAVE BGR File Dialog Box appears.

WebAccess+ IoT Solution Software Training Course 5. DRAW
Advantech Co., Ltd. Ver. 8.0 5 - 14
3. Type a File name for the graphic with the .bgr extension. Don't use untitled.bgr!
For example, type METER.BGR
4. IMPORTANT! Check the Save DRW option .
5. Select Entire Drawing radio button .
6. Select OK.
7. The Save DRW dialog Box appears. Accept the default name, which is the same
as the BGR.
8. Select OK.
The BGR file is a compiled Graphic suitable for Display by the WebAccess Client. You
cannot edit a BGR file. The DRW file is the source file. You can Edit the DRW file and
generate a new BGR file. If you loose the DRW, you can never edit the file
again. Save the DRW.
Task 8: Download Graphic
DRAW creates files on the Project Node. The SCADA Node displays the files with live
data. You need to download these files from the Project node to the SCADA node to
see any changes you made in DRAW.

WebAccess+ IoT Solution Software Training Course 5. DRAW
Advantech Co., Ltd. Ver. 8.0 5 - 15
There are two ways to download graphics from the Project Node to the SCADA node:
1) Using a web browser
or
2) Task tray icon on the Project Node
To Download Graphics from any node or client:
1. Connect to Project Manager with a web browser. There should be another
Browser window opened to it already, if you followed this step by step
2. Select the SCADA node to be downloaded.
3. Select Graph Only. The Graph Only link results in a download of only Graphic
Files from the WebAccess Project Node to the SCADA node. Using Graph Only
does not stop the SCADA node. Graph Only is recommended. Graph only will
download bgr scripts, macros and all other draw related files.
Alternatively, you could also use Download.
4. The Download Progress Dialog Box opens.
6. When complete, the Download is confirmed.
7. Select Close Window to close the Dialog Box.
Task 9: Download Graphics from task tray
On the Project Node, there is a Download Graph menu item in task tray icon. This
downloads only Graphic files (bgr, scr, mcr, et al). It does not download IO tags,
recipes, schedules, etc. It does not stop the SCADA node

WebAccess+ IoT Solution Software Training Course 5. DRAW
Advantech Co., Ltd. Ver. 8.0 5 - 16
1. Click the WebAccess Service icon on the taskbar (usually located at lower right
of screen, next to the clock).
2. Drag the mouse cursor over the popup menu to Download Graph
3. Drag the mouse cursor over the Project1_SCADA1 (Projectname_Nodename) of
the SCADA node to download.
4. Click once with the mouse on the ProjectNode_SCADANode to be downloaded.
Task 10: Start WebAccess VIEW
1. Select the WebAccess View button
2. The WebAccess View Login Page appears

WebAccess+ IoT Solution Software Training Course 5. DRAW
Advantech Co., Ltd. Ver. 8.0 5 - 17
2. The Login Dialog Box appears
3. Enter your "User Name" assigned by the engineer or technician who configured the
system. Note that you can use either your keyboard or the mouse in the Login
dialog box.
Tip - if this is a newly installed system, use the default login username: admin.
4. Enter your User Name & Password
Default login is,
User Name: admin
Password: (a blank password)
5. Press the Enter key.
6. The MAIN graphic display for your system appears. The default MAIN graphic
supplied with WebAccess is shown below. Yours will probably look different

WebAccess+ IoT Solution Software Training Course 5. DRAW
Advantech Co., Ltd. Ver. 8.0 5 - 18
Call up the Point Info tag browser by one of these methods:
a. Select on the standard Toolbar
OR
b. Use the Popup Menu in a web browser VIEW:
Right Click -> Goto -> Graph
OR
c. From the ViewDAQ menu bar select: Goto -> Graph
OR
d. Press F9 on your keyboard
2. The Graph List Dialog Box pops open

WebAccess+ IoT Solution Software Training Course 5. DRAW
Advantech Co., Ltd. Ver. 8.0 5 - 19
3. Double click on the Graphic name in the Graph List Dialog. For example, double
click on Meter2.bgr.
OR
Single click on the Graphic name and press OK.
4. The graphic display you selected appears.

WebAccess+ IoT Solution Software Training Course 5. DRAW
Advantech Co., Ltd. Ver. 8.0 5 - 20
Task 11: Create a tank level graphic display.
Draw the Tank Graphic shown below
For a web browser DRAW, use the Right Click menu, then select the following commands.
For the local DrawDAQ on the Project Node, use the menu bar.
Create a new tank level graphic display in DRAW using File -> New.
1. Insert the Tank symbol with Draw -> Symbol.
a. Select $tank10.dsm ( path : C:\WebAccess\Node\config\system\dsm)
b. Select OK.
c. Position the Symbol.
d. Right-Click to draw it.
2. Click the left mouse button to draw the tank.

WebAccess+ IoT Solution Software Training Course 5. DRAW
Advantech Co., Ltd. Ver. 8.0 5 - 21
5. On the Tank's center:
In DRAW select Right Click -> Edit -> Explode
In DrawDAQ, Right Click -> Explode.)
6. Drag the Mouse around the “cut-away” of the Level
or
Click on the “cut-away” with the mouse to select it. There should be a red box drawn
around the “cut-away window”

WebAccess+ IoT Solution Software Training Course 5. DRAW
Advantech Co., Ltd. Ver. 8.0 5 - 22
7. Use Dynamic Animation to fill the tank with a Fill animation.
In DrawDAQ, from the menu bar, select Dynamic -> Animation
8. The Dynamic Animation Dialog Box opens.

WebAccess+ IoT Solution Software Training Course 5. DRAW
Advantech Co., Ltd. Ver. 8.0 5 - 23
9. Select Fill radio button.
10. Select a TAG to fill the tank, for example select SINE.
11. Label the Tank with static text using Draw -> Text . Type “LEVEL:”.
12. Create a placeholder for a Dynamic Animation active point for the Level tag “XXX.X”
using Draw -> Text.
13. Use Dynamic -> Animation to animate the text “XXX.X next to Level.
14. Select R-Text
15. Use TAG named SINE as the Level measurement tag.
16. Use the Or button to force orthogonal 90 degree lines.
17. Use Draw -> Polyline to draw a 90 degree pipeline.

WebAccess+ IoT Solution Software Training Course 5. DRAW
Advantech Co., Ltd. Ver. 8.0 5 - 24
18. Use Modify Attributes -> Pen Width to change the thickness if required.
19. Insert a Valve using Draw -> Symbol
20. Select $valve01.dsm.
21. Select OK.
22. Position the Valve, then Right Click to Draw it.
23. Label the valve with static text using Draw -> Text to create a placeholder for a
Dynamic Animation active point for the tag “VALVE STATUS”.
24. Use Dynamic -> Animation to animate the text under the valve.

WebAccess+ IoT Solution Software Training Course 5. DRAW
Advantech Co., Ltd. Ver. 8.0 5 - 25
25. Use R-Text and connect to tag Valve1.
26. Select Digital States, then pick the ON (1) and OFF (0) colors for the Valve Text
(Green and Red in the example).
27. Select OK twice.
28. Create a trend window for the tags using Dynamic -> Trend.
a. Enter the tag names: Valve1, Amplitude, Timer, SINE and SPEED.
b. Select the Time radio buttons and COLORS.

WebAccess+ IoT Solution Software Training Course 5. DRAW
Advantech Co., Ltd. Ver. 8.0 5 - 26
c. Select OK.
d. Click the Upper Left corner of the trend window.
e. Drag to the lower right window of the trend window and Click once.
29. Save the graphic as Tank.bgr and Tank.drw.
30. Download load to the SCADA Node.
31. (Start SCADA Node if it is not already running).
View the graphic in VIEW
1. Start VIEW.
2. Open the graphic called Tank.bgr from Graph List.
3. Observe the change in the tank level.
4. Change the value of “valve” to OPEN. The color of the valve text should change to
red. Hint, double click on the CLOSE or OPEN text to open the Change Dialog Box.

WebAccess+ IoT Solution Software Training Course 5. DRAW
Advantech Co., Ltd. Ver. 8.0 5 - 27

WebAccess+ IoT Solution Software Training Course 6. Pushbuttons, Key Macros & Scripts
Advantech Co., Ltd. Ver. 8.0 6 - 1
Section 6 – Pushbuttons, Key Macros & Scripts
Objectives This section introduces key macros and scripts to automate user actions and control functions.
At the end of the section, you will have knowledge about the various types of key macros and
scripts and their syntax, and be able to configure simple examples.
Training Notes
Key Macros
Keymacro commands are normally assigned to "Pushbuttons" on user built graphic
displays. Keymacro commands are used to change displays, call up dialog boxes, change
setpoint, acknowledge alarms, etc.
These same keymacro commands are used on all standard displays in WebAccess (Alarm
Summary, Alarm Log, Trends, Point Detail, et al) allowing uses to modify the default
displays also.
Pushbuttons are a Dynamic Animation in WebAccess. No Gifs or Bitmaps are required.
The Animation shows reverse highlights for Button-Down and Button-up.
Scripts Scripts are simple programs used to customize your displays screens and SCADA system with
user built calculations and logic. The most common use of scripts is advanced animation and
reformat data. Scripts in WebAccess are powerful enough to communicate with other programs
and do control.
Scripts are programmed in one of three computer languages similar to BASIC:
1. Tcl (pronounced as 'tickle').

WebAccess+ IoT Solution Software Training Course 6. Pushbuttons, Key Macros & Scripts
Advantech Co., Ltd. Ver. 8.0 6 - 2
2. VB Script (Visual Basic Script)
3. Java Script
They are called scripts, because they are not compiled. Scripts are "interpreted": as soon as
you save and download your source file, it is ready to run. The source file is in simple text
format.
If you have any programming experience, you can be writing scripts in 30 minutes. Tcl, VB and
Java Scripts are industry standards taught in many schools.
You can download Tcl programs and tutorials from the Internet. There are many examples in
the WebAccess Engineering Manual describing Tcl. Tcl is also supported with better error
message and debugging capabilities in WebAccess.
Similarly, you can download VB Script and Java Script tutorials and examples from the Internet
or from most local bookstores.
There are two types of commands in a script:
Keywords – these are the Tcl, VB or JAVA commands built-in to the official language.
Action Commands – these are WebAccess Commands, similar to keymacro commands
that allow Tcl, or Java or VB to interact with WebAccess.
There are two types of scripts:
Local Scripts - also called Screen Scripts - run on a client and are associated with a
graphic display.
Global Scripts - run on the SCADA node.
Local Scripts (Screen Scripts)
Local Scripts – which run only run when the associated Screen is displayed or called by a
Pushbutton on a Screen. Local Scripts are also referred to as Screen Scripts. Local
Scripts run on the Client. Local scripts are downloaded to a web client when the display
is called up. The script runs on the remote client. Local Scripts run at the frequency
specified by the Graphic Parameters (Set Graph Param) as fast as every 25
milliseconds.
Run Once when display first opened
Run continuously while display is open by user
Run Once when display closed
Global Scripts (SCADA node Scripts)
Global System Scripts run on the SCADA Node, independent of any Display. Global
Scripts can be configured to run in one of three modes:

WebAccess+ IoT Solution Software Training Course 6. Pushbuttons, Key Macros & Scripts
Advantech Co., Ltd. Ver. 8.0 6 - 3
Run Continuously at user specified frequency (as fast as 25 milliseconds).
Once at Start-up or Restart
Once at Shutdown (or restart).
Global scripts run a subset of ACTION commands. Most commands that interact with a
display screen are ignored by SCADA scripts (for example, GOTO GRAPH, GOTO URL,
POPUP a dialog box).
Global Scripts are usually written using the Script Editor in DRAW. The Global Script
Configurator in SCADA Node properties, has a pull down list of files with the *.scr
extension in the node's \bgr subdirectory.
Run a Script
There is no command line for executing a script command. To run a Script in WebAccess
script, it must be created in the script editor and called
Assigned to a Pushbutton Keymacro on a Display (a Local Script), or
Assigned to a Graphic Display in Set Graph Parameters (a Local Script), or
Configured in GlobalScript on the SCADA Node Properties, or
Specified in the SCADA script initialization file (BWSCRRDT.INI), or
Called by another Script.
For more information see:
Keymacro commands <SCREXEC> and <SCRLOOP>
the Set Graph Parameters in DRAW
12.11.1 Global Script Configuration .
Local Scripts (Screen Scripts) can be downloaded from the project node to the SCADA
node using the download Graph Only command that can be performed without stopping
the SCADA node.
Local scripts are downloaded to the Client when the display using the script is called.
The Client will have to refresh the screen that uses a new version of Local Screen Script.
Global Scripts must be downloaded using the Download command and will require
stopping and restarting the SCADA node.
Exercise In this exercise, you will configure a screen key macro and a screen script.

WebAccess+ IoT Solution Software Training Course 6. Pushbuttons, Key Macros & Scripts
Advantech Co., Ltd. Ver. 8.0 6 - 4
Task 1: DRAW Push buttons
Toc Create a Pushbutton on a Graphic Display
1. Start DrawDAQ.
2. Open previous METER.drw for your graphic Display.
3. Draw Text or a graphic Symbol.
For example, Draw Text and type : MAIN (for MAIN GRAPHIC)
4. With the graphic in DrawDAQ,
Dynamic -> Pushbutton
5. The Push button Dialog Box opens.

WebAccess+ IoT Solution Software Training Course 6. Pushbuttons, Key Macros & Scripts
Advantech Co., Ltd. Ver. 8.0 6 - 5
6. Select the keymacro from the list.
For this example Finish the Keymacro with <GOTO>Graph=main.bgr
8. Select Group Object. This will draw the Pushbutton symmetrically around the
object.
9. Change Colors by clicking once on the Button Color Field, then once on a color in the
Palette.
10. Change Margin or Bevel Size as desired
11. Press OK.
12. The button is drawn symmetrically around the selected object, if you selected group
objects and started with an object already selected.

WebAccess+ IoT Solution Software Training Course 6. Pushbuttons, Key Macros & Scripts
Advantech Co., Ltd. Ver. 8.0 6 - 6
View the graphic in VIEW
1. Download Graphic and Start VIEW
2. Open the graphic from Graph List.
2. Try the Button work properly in ViewDAQ.
Task 2: Edit Pushbutton
Use Replace String to edit grouped Pushbutton
1. Select the Pushbutton
2. Open the Edit Dialog Box with the Modify Command
-> Edit -> Replace String.

WebAccess+ IoT Solution Software Training Course 6. Pushbuttons, Key Macros & Scripts
Advantech Co., Ltd. Ver. 8.0 6 - 7
3. The Replace String Dialog Box Opens.
4. Type the Find What (the Text to be Replaced)
5. Type Replace With (the new Text)
6. Press OK.
7. The Text in the Button is changed and the Button resizes automatically if Grouped.
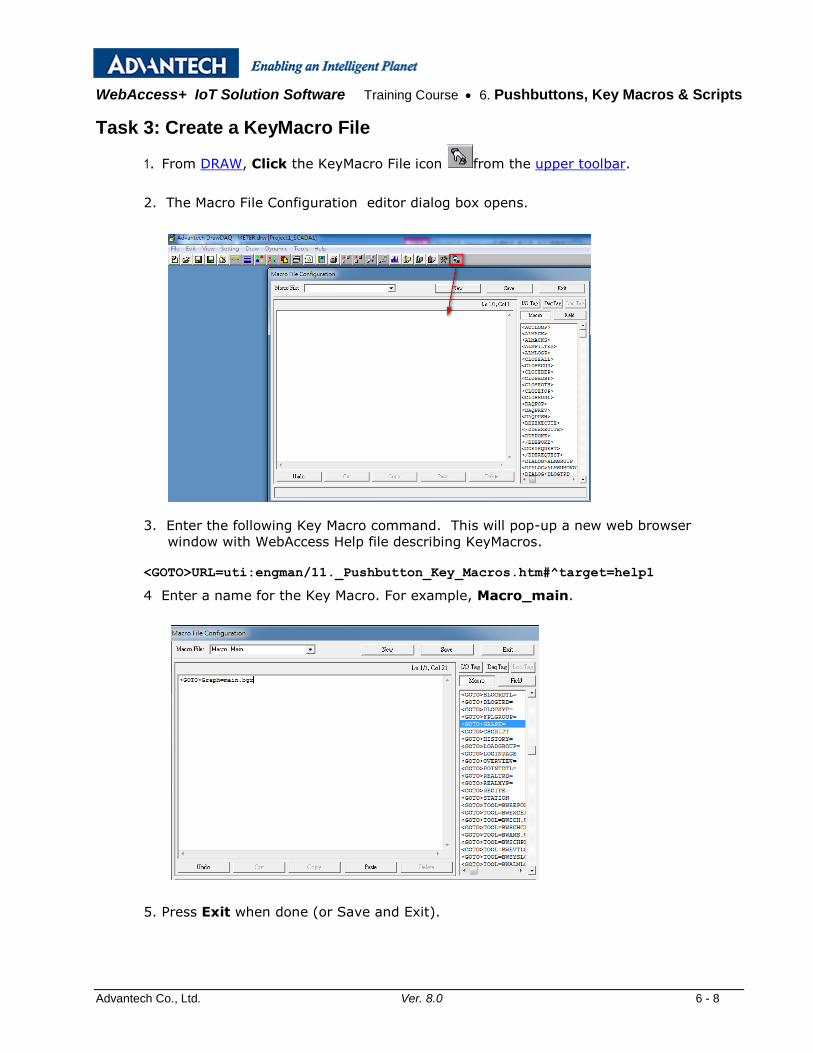
WebAccess+ IoT Solution Software Training Course 6. Pushbuttons, Key Macros & Scripts
Advantech Co., Ltd. Ver. 8.0 6 - 8
Task 3: Create a KeyMacro File
1. From DRAW, Click the KeyMacro File icon from the upper toolbar.
2. The Macro File Configuration editor dialog box opens.
3. Enter the following Key Macro command. This will pop-up a new web browser
window with WebAccess Help file describing KeyMacros.
<GOTO>URL=uti:engman/11._Pushbutton_Key_Macros.htm#^target=help1
4 Enter a name for the Key Macro. For example, Macro_main.
5. Press Exit when done (or Save and Exit).

WebAccess+ IoT Solution Software Training Course 6. Pushbuttons, Key Macros & Scripts
Advantech Co., Ltd. Ver. 8.0 6 - 9
6. Draw Text to act as a descriptor. For example, draw GO Main.
7. Draw a Pushbutton with the keymacro:
<MCREXEC>@Macro_main.mcr
Important!- add the .mcr extension to the file name.
8. Save the Graphic (the bgr and drw).
9. Download the Graphic to the SCADA node.
9. Try the Macro work properly in ViewDAQ.
Task 4: Rotate a Widget with a Script
The most common use of screen scripts is to provide enhanced animation. This example
describes how to rotate a FAN based on the ON/OFF state of the fan. Please refer to the
Engineering Manual, Chapter 12 Scripts for detailed description of Scripts in WebAccess.
Tcl is used in these examples.
This example uses is a "trick" widget that connects to two tags. Normally, a widget is
built with only one tag. In this example, the first tag is the IO tag that describes the on
off state of the Fan or Pump (the Discrete Tag). The second "trick" tag is an analog-
type Local Screen Tag that will loop from 0 to 359 when the IO Tag is ON.
The "trick" to using this two-tag widget ($FANBLADES.dwt) is to name the local screen
tag after your IO tag by appending the word "rotate" to it. (if you are using long tag
names, try using just the letter "r" instead of "rotate"). If your digital IO Tag is named
FAN101 then you should create a screen tag named FAN101rotate.

WebAccess+ IoT Solution Software Training Course 6. Pushbuttons, Key Macros & Scripts
Advantech Co., Ltd. Ver. 8.0 6 - 10
Note - Local Screen tags are limited to 15 characters. If your IO tag is more than 9
characters in length, you can use any name for the Local Screen tag and then
edit the Widget to use the actual Local Screen Tag name.
A summary of the steps are:
Start DRAW.
Edit your Graphic Display (Open DRW).
Create a Local Tag File with an analog-type Screen Tag named after your
digital IO Tag (with rotate appended to end)
Create a Script that Loops TAGrotate if TAG is true
Attach the Script and Tag file to your Graphic
Draw the Widget.
Edit the Widget to make sure the rotate animation is attached to the analog
Local Screen Tag (TAGrotate).
Step by Step Guide to Rotate a Widget.
1. Start DRAW
2. Open the DRW file of the Graphic Display you want to add this Widget.
3. Create a Local Tag File with an Analog Tag.
a. Select File -> Set Graph Parameter

WebAccess+ IoT Solution Software Training Course 6. Pushbuttons, Key Macros & Scripts
Advantech Co., Ltd. Ver. 8.0 6 - 11
b. Select the field next to Local Tag File
c. Select Edit
d. Enter a name for your Tag File (I name these after my graphic display).
e. Enter the "trick" Tag Name

WebAccess+ IoT Solution Software Training Course 6. Pushbuttons, Key Macros & Scripts
Advantech Co., Ltd. Ver. 8.0 6 - 12
It should be named after your IO Tag by appending the word "rotate" to it. If
your digital IO Tag is named FAN101 then you should create a screen tag named
FAN101rotate.
f. Check Point Type = Analog
g. Enter Span High = 359 (it can be any number but my example script was
designed for this so it does not skip.)
h. Select Add/Modify
i. Select OK
j. Select Save
k. Select OK
l. Select Exit
m. Select your Tag File name to attach it to your Graphic as the Local Tag File.
4. Create a script
a. Open Set Graph Parameters Dialog box (it should still be open).
b. Select the field under Local Script File next to, While Showing:
c. Select Edit
d. Copy and Paste the following Script into the Script Editor.

WebAccess+ IoT Solution Software Training Course 6. Pushbuttons, Key Macros & Scripts
Advantech Co., Ltd. Ver. 8.0 6 - 13
catch { if {[GETVAL FAN101] == 1} then { SETVAL {FAN101rotate=%ROTATEPLUS 32} } }
e. Edit the script to use your tag names. Replace FAN101 with your digital IO Tag.
f. Replace FAN101rotate with your analog local screen tag (Step 3.e above).
g. Enter a name for your Script File (I name mine after the graphic).
h. Select Save
i. Select Exit
j. Click on your Script File Name to enter it in the While Showing field
5. Adjust the Screen Update and Script Update rate to get faster spin.
a. (Use Set Graph Parameters Again. I use 5 = 5*0.025 sec = 0.125 secs)
b. Select OK to close the Set Graph Parameter dialog box
6. Draw -> Widget
7. Select $FANBLADES.dwt

WebAccess+ IoT Solution Software Training Course 6. Pushbuttons, Key Macros & Scripts
Advantech Co., Ltd. Ver. 8.0 6 - 14
When you draw the widget, it asks for a tagname. Enter you digital IO Tag (FAN101 in the
example.
8. Save and download your Graphic.
Task 5: Multiple rotating fans
Multiple Rotating Widgets on Same Graphic
If you have multiple Fans on a graphic, you must add additional screen tags and edit the
script by repeating the test.
catch { if {[GETVAL FAN101] == 1} then { SETVAL {FAN101rotate=%ROTATEPLUS 16} } } catch { if {[GETVAL FAN102] == 1} then { SETVAL {FAN102rotate=%ROTATEPLUS 16} } }

WebAccess+ IoT Solution Software Training Course 6. Pushbuttons, Key Macros & Scripts
Advantech Co., Ltd. Ver. 8.0 6 - 15
Task 6: Write data into an Text file
Report1 is a Text File used for report data.
The script first runs a Test if Report1 files exists, . if not, create it with header lines
then enters a row of time stamped data
if {[file exists "../Report1.txt"]} then { set fileid [open "../Report1.txt" a+] puts $fileid "[GETVAL %TTMDATE] [GETVAL %TTMTIME] [GETVAL AMPLITUDE] [GETVAL TIMER] " close $fileid } else { set fileid [open "../Report1.txt" a+] seek $fileid 0 start puts $fileid "----- Water Use Report-------\nPage 1" #Insert data into table puts $fileid "[GETVAL %TTMDATE] [GETVAL %TTMTIME] [GETVAL AMPLITUDE] [GETVAL TIMER] " close $fileid }

WebAccess+ IoT Solution Software Training Course 6. Pushbuttons, Key Macros & Scripts
Advantech Co., Ltd. Ver. 8.0 6 - 16

WebAccess+ IoT Solution Software Training Course 6. Pushbuttons, Key Macros & Scripts
Advantech Co., Ltd. Ver. 8.0 6 - 17
(Default Path : C:\WebAccess\Node\Project1_SCADA1\ Report1.txt)
Task 7: Global Script Configuration
A Global Script is like a Screen Script except it runs, no matter what display is
showing. The Global Script runs on the SCADA node (not the client).
Global Scripts are built using the Script Editor in DRAW. The Global script is then
scheduled using the Global Script in Project Manager. There is a maximum of 8 global
script groups, with a start script, stop script and while running script. Scripts can call
other scripts (using SCREXEC), so you use these scheduled scripts to call other scripts.

WebAccess+ IoT Solution Software Training Course 6. Pushbuttons, Key Macros & Scripts
Advantech Co., Ltd. Ver. 8.0 6 - 18
Global Script Configuration:
1. Connect to WebAccess Project Node.
2. Start Configuration.
3. Select SCADA node.
4. Select Global Script hyperlink in Project Manager Node Properties.
5. The Global Script configuration page appears.
6. Description is any user-defined description for this group of scripts.
7. Click Start Script if you want a script to run when the SCADA node starts. This
script will run once when the SCADA node starts or restarts.
Use the pull down menu to the right of Script File List to select the name of the script.
This file must be located in the project root directory, typically c:\WebAccess\node\config\projectname\bgr.
Scripts are built using the Script Editor in DRAW.
8. Click Stop Script to specify a script to run when the SCADA node is stopped or
stopped as part of a restart. This acts as a Shutdown Script. The Stop script runs
when the SCADA Node is stopped using bwkCTRL, the task bar menu or the Project
Manager.
9. Click While Running Script if you want a script to run repeatedly at specified
Interval while the SCADA node is running. The While Running Script runs
continuously on the SCADA Node (as long as the kernel is running).
Use the pull down menu to the right of Script File List to select the name of the script.
10. Type an Interval for the While Running Script. These are in 25 millisecond
intervals. 10 = 0.25 sec = ¼ second
11. Select ENABLE for the STATUS.

WebAccess+ IoT Solution Software Training Course 7. Trending
Advantech Co., Ltd. Ver. 8.0 7 - 1
Section 7 - Trending
Objectives This section provides information about WebAccess trending capabilities. At the end of this
section, you will be able to configure trends and become familiar with the run-time trend
displays.
Training Notes
Two types of trending are available in WebAccess:
Real-time trends - display data acquired during in real-time.
Once data scrolls off the screen, it is lost.
Data Log Trends - display both real-time and historical data.
Data is stored on the Hard Drive of the SCADA node for later
retrieval.
Real-time trends do not take Disk space and are often used for Tuning Parameters and
other short term trending. Real-time trends are also useful for HMI and Touch Panels
with limited disk space. Any Tag can be viewed using Real-time trend with no planning
before hand.
Data Log Trends save the data indefinitely or until you schedule Data Log Maintenance
to delete or archive the files after user-defined interval (Days, months, or years). An
Engineer must enable Data Logging for each Tag in the Project Manger before tags can
be viewed in Data Log Trends.
Historical data can be recorded to ODBC databases or spreadsheet in real-time (Real-
time ODBC option required) using Log to ODBC. This will be covered later in the Reports
& Logs section.
Data Log and Real-Time trends can be converted to an HTML file, then "Copied and
Pasted" to EXCEL or WORD. Use Edit -> Export Data to create the HTML report of the
Trend. This creates an “on-the-fly” report. .
Each trend display can show data of up to 12 data points. Analog and Discrete tag types
can be trended. Tags can be added without losing data from other tags. At least one

WebAccess+ IoT Solution Software Training Course 7. Trending
Advantech Co., Ltd. Ver. 8.0 7 - 2
Real-time Trend Group and at least one Historical Trend Group must be configured to
see Trend Data. DataLog must be enabled for each Tag for Historical Trending.
Seconds Data can be disabled to reduce Disk Space.
Data Logging
WebAccess collects each tags DATA in a separate file that allows remixing tags on a
DATALOG trend without losing past data.
You must enable DATA LOGGING for each TAG in the Tag configuration using Tag
Properties (see Analog Tag Properties or Discrete Tag Properties).
Log Data in Tag Properties is Data Logging enabled. A file will be created for this Tag
and a record entered once a second, if the Dead Band is exceeded.
Data Log DB is the Dead Band used to reduce file size of the Data Log. The Tag's value
must change more than the Dead Band in order for a record to be added to the Data Log
File.
You can Data Log Analog and Discrete (e.g. Digital) Tags. You cannot Data Log text-
type Tags.
To view Data Log Trends, you should create at least one Data Log Trend Group. A
maximum of 12 tags can be viewed in one Trend Group simultaneously; but, you can
add or replace Tags "on the fly" in any Trend Group without losing historical data. The
Data Log Trend Group uses a pre-built template display. You need only enter the Tag
names in a list to build a Trend Group.
You should also check that the Deadband for Data Logging is set appropriately. Too
large of a Deadband will prevent any data from being logged. Too small a Deadband will
result in unnecessary recording of values that have not changed and will waste disk
space.
Use Data Log Maintenance to schedule File Management for Data Log Trend Files. Files
can be Archived to another drive and/or deleted.
The log files are located on the SCADA node. Typically, the default path is
C:\WebAccess\Node\projectnameNodename\log
It is recommended to specify another path to reduce the time for re-installing software.
This is done is SCADA Node Properties, Data Log Folder. WebAccess modifies the
security settings of all files in drive:\WebAccess during Node software installation. A
large number of Data Log files will greatly increase software installation.

WebAccess+ IoT Solution Software Training Course 7. Trending
Advantech Co., Ltd. Ver. 8.0 7 - 3
The Log Data Maintenance feature in WebAccess will archive Data Log Trend files to
a network folder or mass storage device AND will ERASE files that are older than a user-
defined period on the local hard drive of the SCADA Node. Log Data Maintenance will
also archive and delete expired (old) records from the ODBC Log databases on the
Project Node. (See Log Data Maintenance for more information).
Exercise In this exercise, you will practice creating real-time and historical trend groups, and using the
various functions in the VIEW trend displays.
Task 1: Enable Data Logging for Tags.
1. Log in to Project Manager.
2. Select your Project.
3. Select your SCADA Node from the list on the left of the Project Manager.
4. Select the Tag (AI1 in the example)
5. Select the Tag Property hyperlink.

WebAccess+ IoT Solution Software Training Course 7. Trending
Advantech Co., Ltd. Ver. 8.0 7 - 4
6. The Update Tag page opens.
7. Check Yes for Log Data.
8. Make Data Log DB (DeadBand) 1%.
9. Press Submit.
10. Repeat for AI2 and optionally other IO Tags on this PLC.
11. Expand the List of Accumulation Tags by clicking the Acc Point Folder ICON.
12. Select TIMER tag.
13. Select Tag Property.

WebAccess+ IoT Solution Software Training Course 7. Trending
Advantech Co., Ltd. Ver. 8.0 7 - 5
14. Check Yes for Log Data.
15. Press Submit.
16. Expand List of Calculation Tags by clicking the Folder icon next to Calc Point.
17. Select SINE tag.
18. Select Tag Property.
19. Check Yes for Log Data.
20. Make Log DB (deadband) = 0.2%
21. Press Submit.
Task 2: Add Data Log Trend Group
1. The SCADA Node. The SCADA Node Main Page opens.
2. Select DataLog Trend.
The Data Log Trend Display Group List Page appears.
3. Select Add DataLog Trend.
4. The Create New DataLog Group appears.

WebAccess+ IoT Solution Software Training Course 7. Trending
Advantech Co., Ltd. Ver. 8.0 7 - 6
5. Enter a Unique Group Number (between 1 and 1000). This is how the Group will be
ordered in the Data Log Trend Group Dialog Box in VIEW and identified by Operators
and Users.
6. Enter a Description for the group. This will appear in the Data Log Trend Group
List Dialog Box seen by users and operators in VIEW.
7. Select a Time Span from the Pulldown menus. This is the default time span that
appears when first opening the Trend Display. This feature allows the viewing of
data at a sample frequency different than the recording frequency. The intent is to
allow users to adjust the time span across the screen. This does not affect the
actual data recording rate.
8. Select the empty field next to Tag Name 1.
9. Open the Pull down list by clicking on Tag List. This shows the names of all Analog
Tags with Log Data and Discrete Tags with Log Data set to yes.
10. Scroll down the Tag List. Click the Tagname desired. The Tagname should appear on
the Tag Name 1 field. For example, select AI1.
11. Select the empty field next to Tag Name 2.
12. Repeat steps 9 to 12.
13. Select the opening Plot Type that will appear for each tag.
Users can change this from VIEW in combination with the Time Period Chosen
(Seconds, Minutes Hours, and Days)
i. LAST shows the last recorded value of the Tag during the time period.
ii. Average shows the average value.
iii. Minimum will show the smallest value.
iv. Maximum will show the largest value.
If seconds are the time period chosen by the user, the Last value is always
shown. Seconds is the default period chosen. Your entry here will affect the
Minutes, Hours and Day time periods.

WebAccess+ IoT Solution Software Training Course 7. Trending
Advantech Co., Ltd. Ver. 8.0 7 - 7
14. Click Submit when you are finished.
15. Click Download.
Task 3: Add RealTime Trend Group
1. Select the SCADA Node.
2. The SCADA Node Main page opens.
3. Select RealTime Trend.
The RealTime Trend List Page appears.
4. Select Add RealTime Trend.
5. The Create New RealTime Trend Group appears.

WebAccess+ IoT Solution Software Training Course 7. Trending
Advantech Co., Ltd. Ver. 8.0 7 - 8
6. Enter a Unique Group Number (between 1 and 1000). This is how the Group will be
ordered in the RealTime Trend Dialog Box in VIEW and identified to Operators and
Users.
7. Enter a Description for the group. This will appear in the RealTime Trend Group List
Dialog Box seen by users and operators in VIEW.
8. Enter a Sample Rate. This is the frequency of updating the Trend Display with new
Data. RealTime Trends are fixed at 240 samples. Sample Rate for Realtime Trends
range from 1 to 180 seconds.
If 1 second interval and 240 samples = 1 x 240 = 240 seconds (4 minutes)
9. Select the field next to Tag Name 1.
10. Open the Pull down list by clicking on Tag List. This shows the names of all Analog
Tags and Discrete Tags.
11. Scroll down the Tag List. Click the Tagname desired. The Tagname should appear on
the Tag Name 1 field.
12. Repeat for Tag Name 2 to 12.
13. You can Type Tag names and Blocks (BLOCK:PARAMETERs). You can also copy and
paste Tag Names and Block Names from the Left Frame of your browser.
14. Click Submit when you are finished.

WebAccess+ IoT Solution Software Training Course 7. Trending
Advantech Co., Ltd. Ver. 8.0 7 - 9
15. Click Download.
Task 4: View Data Log Trend Group
1. Open the Data Log Trend Pop-up Dialog Box with a list of all these Data Log Trend
Groups.
Select the Standard Toolbar button
Or Right Click -> Goto -> Data Log Trend (in a web browser VIEW)
Or on the ViewDAQ menu bar, select Goto -> Data Log Trend
2. Select Trend 1 from the List Box

WebAccess+ IoT Solution Software Training Course 7. Trending
Advantech Co., Ltd. Ver. 8.0 7 - 10
3. Select Datalog Trend. Trends are plotted versus Time (the X-axis is Time),
similar to a strip-chart recorder.
4. Select OK.
5. Data Log Trend Display opens.
Task 5: Export Data - Trend Display
DATA Log Trend data can be exported to EXCEL, email and other programs. Up to 12
Tags can be exported in a on a single Data Log Trend Display.
To export data in a Web Browser
1. Scroll to the time period you want.
2. Select SEC. MIN, HOUR or DAY as the interval.
3. Select LAST, AVG, MAX or MIN as the data type
4. Right Click -> Edit -> Export Data

WebAccess+ IoT Solution Software Training Course 7. Trending
Advantech Co., Ltd. Ver. 8.0 7 - 11
5. A second Web Browser window pops up with the HTML formatted data. Copy and
Paste the data or use File -> Save to save the HTML page.
Task 6: Add Tag to Real-time Trend
1. Open the RealTime Trend Pop-up Dialog Box will list all the RealTime Trend
Groups, which can be viewed by:
The Standard Toolbar button

WebAccess+ IoT Solution Software Training Course 7. Trending
Advantech Co., Ltd. Ver. 8.0 7 - 12
Or a pushbutton with the <GOTO>REALTRD=keymacro.
Or the Right-Click Menu in a web browser VIEW
Right Click -> Goto -> Realtime Trend
Or from the menu bar in ViewDAQ Goto -> Realtime Trend
2. The Real-Time Trend List Box Opens.
Any Tag can be added to a Trend Group in VIEW (i.e. by operators and ordinary users in
run-time).
3. Select Trend 1.
4. Select OK.
5. The Realtime Trend opens.

WebAccess+ IoT Solution Software Training Course 7. Trending
Advantech Co., Ltd. Ver. 8.0 7 - 13
6. Select a field under Tagname by clicking next to a colored square. (AC12_OAT in the
example). A the pointer should appear there.
7. Click New Tag.
8. A Dialog Box of Tags all tags in the system opens.
9. Select Tag Name.
10. The Tag is added to the Trend.
If you leave this RealTime Trend Group, the Tag will disappear from the Trend.

WebAccess+ IoT Solution Software Training Course 7. Trending
Advantech Co., Ltd. Ver. 8.0 7 - 14
If you select a field that already has a Tagname, the New Tag will temporarily replace
that Tag until you leave this Trend Group.
To permanently add a Tag to a Realtime Trend Group, use the Project Manager to Modify
the Trend Group.
Realtime Trends use a single Template Display that is pre-built and supplied with
WebAccess. There is no graphics building required. Up to 12 Tags can be viewed on a
single RealTime Trend Display.

WebAccess+ IoT Solution Software Training Course 8.Alarms
Advantech Co., Ltd. Ver. 8.0 8 - 1
Section 8 - Alarms
Objectives In this section, you will learn to use the Alarm Management features in WebAccess.
Training Notes Alarm Management is built into WebAccess. Alarms provide a notification system to inform
operators of process and equipment status.
WebAccess provides a full-feature Alarm handling package developed for use in traditional
Distributed Control Systems (DCS). There are no special displays to build. There are no special
points to build.
Alarm Handling Package Summary
WebAccess supplies pre-built alarm summary display, alarm groups, alarm log display,
and audible alarm notification to the operator of new alarms.
1. Analog-type Tag Alarms providing High-High, High, Low, Low-Low, Rate-of-
Change and Deviation Alarms for each Analog point tag in the system including IO
Tags, each parameter of a Block, Calculation Points, Accumulation Points, and
Constant Point Tags.
2. Discrete Tag Alarms and Digital-type Tag Alarms on the true or false state of
the tag. This is for IO Tags, each parameter of a Block, Calculation Points,
Accumulation Points, and Constant Point Tags.
3. Alarm Summary Display shows a dynamically updated display of all active alarms.
This display is automatically generated. It displays all active unacknowledged alarms
in flashing red and active acknowledged alarms in blue. (The colors can be changed
by the user by editing the almsum.dxx file in DRAW). Once an alarm “clears” it is
removed from the alarm summary display.

WebAccess+ IoT Solution Software Training Course 8.Alarms
Advantech Co., Ltd. Ver. 8.0 8 - 2
4. Prioritizing Alarms with 99 alarm priorities. Alarms can be sorted by rank of
priority on the alarm summary page to enable operators to see the most important
alarms first.
5. Sorting Alarms by Time, Priority, Group, Acknowledge State on alarm summary
displays.
Alarms can also be sorted in the Project Alarm Log, which uses an ODBC Database
(i.e. Access, SQL Server, Oracle or MySQL).
6. Filtering Alarms from other nodes or by Priority or Acknowledge state. The Alarm
Summary provides filtering of alarms. By disabling Alarm priorities, these disabled
alarms will not show in the alarm summary display.
7. Alarm Log generates a running display of all alarms in chronological order. The
user can select to have this alarm log printed to a printer, to a file on the hard drive
and written to a database. This is Local to the SCADA node.
8. Alarm Groups can be configured in any logical arrangement. These are user
configurable. The user can display alarm groups using automatically generated alarm
group displays. An alarm group is typically a process unit in a multi-process facility.
9. Individual Alarm Suppression of any tag. The user can disable alarms from
being reported individually. This allows nuisance alarms to be removed when a unit
or process is shutdown or out of service.
10. Alarm Graphic is configurable for each tag in the system. From the alarm summary
display, the operator can call up this Alarm Graphic with a single mouse click. The
Alarm Graphic can be any graphic display in the system. Typically, it is a process
graphic giving the operator the most information on the cause or solution to the
alarm condition.
11. Flashing and Color of Values on Displays. Operator graphics display alarms by
changing the color of numeric, text and state values. The colors can change and
flash based on alarm, acknowledge state, and priority of the alarm.
12. Pre-configured alarm indication in Widgets and Faceplate supplied in the
symbols library allows users to build graphic display elements with alarm display
features already incorporated into them.
13. Alarm indication on pre-built System Displays and Dialog Boxes including Point
List (i.e. Point Browser), Trends, Overview Display, Group Displays, Point Detail
Displays and Block Detail Displays.
14. Status Bar Alarms -There are four (4) Alarm windows in Status Bar at the base of
all displays.
15. Alarm Limits Changeable On-line, in Runtime VIEW, from Point Detail Display
and Point Browser, protected by Security Level. Alarm limits can also be changed by
scripts and programs. These property changes can take place from both the client
and the SCADA nodes.

WebAccess+ IoT Solution Software Training Course 8.Alarms
Advantech Co., Ltd. Ver. 8.0 8 - 3
16. Alarm Acknowledgment is provided through the standard toolbar on every display,
the Alarm Summary and Alarm Group displays, Point Info Dialog Box, and user-
built displays, pushbuttons, key macros and scripts.
17. Email notification of Alarms is a standard feature in WebAccess. No third party
software is required. Tags can be individually selected to generate an email, assigned
recipient email address or use global email recipients.
18. Local Alarm Beep is provided using the system speaker on the Personal Computer
of all Clients (including Web Browser Clients). A sound card is not required. The tone
and duration is configurable. This audible annunciator is coordinated with
unacknowledged alarms.
19. Alarm Suppression Tag - The Associate Tag suppresses the alarms for a tag when
the Associate Tag is in alarm. The Associate Tag is usually the “more important”
alarm. The Associate Tag is used to suppress nuisance alarms and help operators
identify the cause of upset conditions.
20. Media Files (.wav, .mid, .mp3, etc.) played for Alarm Annunciation. Pre-
recorded Media files can annunciate alarms locally on the SCADA node and on Clients.
Users must install media player software on the clients and SCADA node (it is not
part of the client plug-in or SCADA node software). Recording is required by the user.
A sound card and speaker is required.
21. Centralized ODBC Database for all alarms on all nodes. Optionally, Alarms
can also be recorded in the Project Alarm Log, which uses an ODBC Database (i.e.
Access, SQL Server, Oracle or MySQL). All alarms from all SCADA nodes are
recorded in this centralized database on the Project Node.
22. Alarm Tag Fields Tag Fields describe the attributes of each tag, for Alarm Limits,
Alarm state and many more.
.ALMST - Alarm State of the Tag
0 = NO ALARM
1 = UNACKNOWLEDGED ALARM
2= ACKNOWLEDGED ALARM
.ALMED - Alarm ENABLE / DISABLE used to temporarily enable or disable alarming
for the tag.
.ALMGP - Alarm Group.
.ALMHH - High-High Alarm Limit
.ALMHI - High Alarm Limit.
.ALMLL - Low-Low Alarm Limit.
.ALMLO - Low Alarm Limit.
23. Alarm %DAQ The Alarm of a %DAQ tag does not appear in the alarm summary or
alarm log. The alarm is for Display purposes only, are self clearing and cannot be
acknowledged.

WebAccess+ IoT Solution Software Training Course 8.Alarms
Advantech Co., Ltd. Ver. 8.0 8 - 4
%AALMGLOBAL : Global Alarm Status
0 : NO ALARM
1 : UNACKNOWLEDGED ALARM
2 : ALL ALARMS ACKNOWLEDGED
%AALMGLOBAL(n) : for each Alarm Priority
Example: %AALMGLOBAL(1)
%AALMGLOBALN : Number of Global Alarms Status
Exercise
Task 1: Alarm Configuration
Unlike other HMI and SCADA, you do not need to create additional alarm tags. Alarming
can be enabled for every analog or discrete tag through the Project Manager.
Alarm configuration can be added to a Tag by simply changing the tag’s configuration.
An alarm is “configured” by selecting a non-zero Alarm Priority for the alarm type.
In a perfect world, the engineer “plans” what the alarm values of the tags in the system
will be, then engineer or technician enters these values as the tag is configured.
Alarm Limits can be changed on-line without stopping or downloading the SCADA node,
if the alarm is already configured with a non-zero Alarm Priority for the Tag. The change
can be made by a Power User with Tag Field Level of 127, by changing the Alarm Field for the Tag. If “Online Change Tag Field To DataBase” is enabled for the SCADA Node
properties, then these changes are permanent; if not enabled, the next download will
over-write these alarm changes.
Configure an Alarm for a Tag:
1. Select your SCADA node.
2. Expand the Comport and Device to see the list of Tags.
3. Select the Tag (AI1 in the example)
4. Select Tag Property.
5. The Tag page opens.

WebAccess+ IoT Solution Software Training Course 8.Alarms
Advantech Co., Ltd. Ver. 8.0 8 - 5
6. From the Alarm Pull Down List, select Alarm.
7. Wait for the page to Update. A Pink border should appear around Alarm.
8. Drag the slider bar down to the bottom to the Page into the Pick Section.
9. Select a non-zero Alarm Priority for the desired for High Priority (1 in the
example).
10. Enter a High Alarm Limit. (800 in the example)
11. Analog Tags can have multiple Alarms. Enable other alarms for the tag by
entering a non-zero Alarm Priority and Alarm Limit.
12. Press Submit.
13. Select tag AI2 from the left.
14. Select Tag Property.

WebAccess+ IoT Solution Software Training Course 8.Alarms
Advantech Co., Ltd. Ver. 8.0 8 - 6
15. Update Tag page opens.
16. Select Alarm. Wait for Page to refresh.
17. Select a non-zero Alarm Priority for the desired for High Priority (1 in the
example).
18. Enter a High Alarm Limit. (80 in the example)
19. Analog Tags can have multiple Alarms. Enable other alarms for the tag by
entering a non-zero Alarm Priority and Alarm Limit.
20. Press Submit.
21. Download your SCADA node.
Task 2: View the Alarm Summary
1. Click Start View
2. View the Alarm Summary:
Select the Alarm Summary button from the Standard Toolbar
OR
Menu bar in ViewDAQ: Goto -> Alarm Summary
10. The Alarm Summary Opens.

WebAccess+ IoT Solution Software Training Course 8.Alarms
Advantech Co., Ltd. Ver. 8.0 8 - 7
11. If there are no Alarms, force AI1 into alarm.
12. Open the Point Info List and use the filter buttons to check the values of the points
configured. The Point Info Dialog Box is opened using:
Pressing the icon on the toolbar.
Pressing Ctrl + F5 on the Keyboard.
Right Click -> Goto -> Point Info (ViewDAQ users
skip the right click).

WebAccess+ IoT Solution Software Training Course 8.Alarms
Advantech Co., Ltd. Ver. 8.0 8 - 8
13. Select AI1.
14. Select Change.
15. Type 900 or use slider bar.
16. Click Enter.
17. AI1 should appear Red in both the Alarm Summary and the Point Info Dialog Box.
It should also appear in the Status Bar at the bottom of the page. Your computer
should beep. If Alarm Voice is enabled, the Alarm should be read to you.
18. Press the Acknowledge button in the Point Info. The Flashing red should stop. AI1
should change color in the Alarm Summary also.
Task 3: Alarm Summary controls
The Alarm Summary shows a list of Current Alarms and Unacknowledged
Alarms. Each time an Alarm occurs, a line is entered in the Alarm Summary describing
the alarm. Acknowledgement by the operator changes the color (or flashing color) to
indicate Acknowledgement. As alarms return to Normal, they disappear from the Alarm
Summary (if they have been acknowledged by an operator or user).
y

WebAccess+ IoT Solution Software Training Course 8.Alarms
Advantech Co., Ltd. Ver. 8.0 8 - 9
The Alarm Summary can be edited for colors and columns. Above is a modified Alarm
Summary display.
Acknowledge All
Pressing the Acknowledge All button will acknowledge all active alarms on the SCADA
node.
If a tag's current value has triggered multiple alarms (for example, low-low and low
alarms) then the next lower priority alarm will appear.
Acknowledge Screen
Pressing the Acknowledge Screen button will acknowledge all active alarms Displayed
on the screen.
If there are more than 17 alarms (i.e. the number that will fit in the Alarm Summary)
only the first 17 alarms will be acknowledged. The user must use the Scroll Down (or
Scroll UP) buttons to view additional Alarms, which will be unacknowledged.
Similarly, if the Alarm Filter is enabled, only the displayed alarms will be acknowledged.
Acknowledge Tag
Pressing the Acknowledge Tag button will acknowledge only the selected tag. To
acknowledge only one tag on the Alarm Summary:
1. Click on the Tagname (or anywhere on that line)
2. Click Acknowledge Tag
Alarm Sorting
From the Alarm Summary Display, the SORT alarm field indicates how alarms are sorted:
by Time (default), Name, Priority, Acknowledge Status and Alarm Group.
Clicking the square button next to each sort method will change the sort criteria.
This allows users and operators to quickly identify the Highest Priority Alarm, find an
alarm by Tagname or other criteria. If the Alarm Filter is enabled, those tags will be
hidden from this sorted list.
Leaving the Alarm Summary, then returning will result in the sort by Time (the default
value).

WebAccess+ IoT Solution Software Training Course 8.Alarms
Advantech Co., Ltd. Ver. 8.0 8 - 10
Advanced Options (Alarm Filter)
From the Alarm Summary Display, the Advanced Options pushbutton allows users to
hide alarms from view (i.e. filter-out unwanted alarms).
Task 4: View the Alarm Log Display 1. The Alarm Log Display can be viewed from:
the Toolbar icon
OR. The Right-Click Menu can also call up the Action Log (Right Click -> Goto ->
Alarm Log).
2. The Alarm Log opens.

WebAccess+ IoT Solution Software Training Course 8.Alarms
Advantech Co., Ltd. Ver. 8.0 8 - 11
The Alarm Log is a historical record of all alarms. In contrast, the Alarm Summary shows only
Current Alarms and Unacknowledged Alarms. Each time an Alarm occurs, a line is entered in
the Alarm Log describing the alarm. Three lines are printed for a Text Type tag in
Alarm. Acknowledgement by the operator is also recorded. This is similar to Alarm Printers in
control rooms, except alarms are written to a text file.
Only Power Users and the admin account can view the Alarm Log through a Web Browser.
(General Users and Restricted users cannot view the Alarm Log through a Web Browser). All
users can view the Alarm Log locally on the SCADA node using ViewDAQ.

WebAccess+ IoT Solution Software Training Course 9. Users & Passwords
Advantech Co., Ltd. Ver. 8.0 9 - 1
Section 9 – Users & Passwords
Objectives This section introduces the concept Users, User Types, and Passwords.
Training Notes
Overview - Users & Passwords
Users must "Login" using a Username and password to VIEW. All Web Browser
Clients must Login to see any graphic displays or data. User names are not case
sensitive. Passwords are case-sensitive.
ViewDAQ - The local, non-web browser version, ViewDAQ will start without a user
login. Any one with access to the Windows Operating System can use
ViewDAQ. Admin, Power, General and Restricted Users can View all
Displays and Tags in ViewDAQ. Security Area and Level restrict who can
change data in VIEW. Use Windows security to “lock computer” for un-
attended operation in ViewDAQ.
All users are assigned a User Type. The user type determines which displays and types
of displays a user can View. User type is used to restrict the ability to view data and
displays.
The User Types are
admin (administrator),
user manager,
project user,
power user,
general user
and
restricted user.
Admin and Project Users can access the Project Manager (the configuration and
engineering tool). Admin can access all SCADA Nodes using VIEW (and

WebAccess+ IoT Solution Software Training Course 9. Users & Passwords
Advantech Co., Ltd. Ver. 8.0 9 - 2
ViewDAQ). Project Users can not access runtime VIEW unless a second account, with
the same name, is created as a Power, General or Restricted User.
Admin, power users, and general users can use VIEW to access all SCADA Nodes in
the project and view all displays through a web browser.
Admin and power users can access the Scheduler, Reports, System Log and ODBC
Logs through VIEW (the web browser).
Project Users can access the Scheduler, Reports, System Log and ODBC Logs
through the Project Manager.
A restricted user can view only displays assigned to that user (this may be a single
display) if the login is through a Web Browser. If the assigned default graphic display
does not exist on that SCADA Node, or no graphic is assigned, then the restricted user
can not login to that SCADA Node. The ability to Acknowledge alarms and Change Tags
can be disabled or enabled on a per graphic basis (Area and Level Security still applies).
All users, except user managers, (Admin, power, general and restricted users) can use
ViewDAQ (the non-web version, local to the SCADA node) to view all displays, all
system displays, view all tags, acknowledge alarms and access the Scheduler, Reports,
System Log and ODBC Logs through ViewDAQ.
User Managers can only add and modify new users via the User Management button.
Only Admin and User Managers can login to the WebAccess User Management.
Area and Level security
Security Area and security Level are used to restrict the ability to change data. In order
to change the value of a tag, both the user and the tag must be assigned to the same
Area and the user must have a security Level greater or equal to the security level
assigned to the tag.
WebAccess uses the "Area of Responsibility" concept for control actions. This allows a
user to have varying Levels of access in different Areas of the facility. For example, a
user may be allowed to change Temperature Setpoints in one area of the facility, but not
is another.
Each tag in the WebAccess database is assigned to one Area and given one security
Level. If a Tag is assigned to Area 0 and Level 0, all users can change the Tag’s value.
Each User is assigned a security Level for each Area. The default Level is 0 (the
lowest).
In order to change the value of a tag, the User's Area and Level must match the Area
and Level of the Tag. WebAccess compares the Tag's Area and Level to the user's Level
for that Area. If the user is assigned a security Level greater than or equal to the Tag's
Level in the same Area, then the change is permitted.

WebAccess+ IoT Solution Software Training Course 9. Users & Passwords
Advantech Co., Ltd. Ver. 8.0 9 - 3
If the user's Level and Area do not match the tag's Area and Level, a Popup Dialog Box
will appear prompting the user to Login as a new user. In a Web Browser, this new log
in is temporary and applies only to changing the selected tag this one time.
WebAccess has 64 user defined Areas and 4 special Areas: Local Tag, View Tag, Tag
Field and Exit ViewDAQ. Level 127 is administrator level and is required to change Field
Tags (for example, change alarm limits from the point detail. All Field Tags require
Level 127 in order to change them. Examples of Tag Fields include Alarm Limits,
Description, SPANHI, SPAN LO, and ENG UNITS.
A tag assigned as READ ONLY can't be changed by an operator or administrator.
Exercise
Task 1: Add or Update a User
A User can VIEW a SCADA Node using the Web Browser VIEW or ViewDAQ. The user
types are Power User, General User and Restricted User.
To create or modify a User account to use VIEW a SCADA Node:
1. Log in to Project Manager
2. Select the Project the user will access.
3. Usually the SCADA Node Properties appears.
4. Select the Project Hyperlink to open Project Property Page.
5. Select User hyperlink in Project Properties.
6. The User List appears.

WebAccess+ IoT Solution Software Training Course 9. Users & Passwords
Advantech Co., Ltd. Ver. 8.0 9 - 4
7. Select Add User to create a new user or select Update to modify an existing
user.
8. The Create User or Update User page appears (they look the same).
9. Select a User Type from the pull down list.
The choices are: Power User, General User and Restricted User.
10. Enter a User Name if you are adding a new user. Changing the name of an
existing user will change the name (not create a new user account).
11. The Password can be up to 8 characters and is case sensitive. There is no way
to view an existing password. IF you have forgotten it, you have to enter a new
password.
12. Area corresponds to the Security Area the tags are assigned a user may
change. To change the value of a Tag, user must be assigned a Security
Level greater or equal to the Level assign to the Tag in the same Area the Tag is
assigned. A user may have a different Level for each Area of the project that
the user is to access. Security Level can be from 0 to 127. (127 = admin) How
many Areas you divide your plant by your design. Many projects start with only
one Area (Area 0). Area 0 is the default for tags. You can leave unused Areas
unchanged and fill in Level only for Areas that apply. For an in-depth description,
see Area and Level in the Engineering Manual.
13. Local Tag, View Tag, Tag Field and ViewDAQ enable a user to change non-IO
tags, system tags and exit ViewDAQ. Enter a value of 127 (the admin level) for
each applicable field if a user is to modify local tags (user built screen tags for

WebAccess+ IoT Solution Software Training Course 9. Users & Passwords
Advantech Co., Ltd. Ver. 8.0 9 - 5
displays and reports), View Tags (%ViewDAQ system tags including Simulation
Mode %DKRLMODE) or Tag Fields (e.g. alarm limits, Span Hi, Span Lo and other
online configuration changes).
14. Enter a value of 127 in ViewDAQ if the user is to be able to modify and Save
Display Groups in ViewDAQ. A number less than 127 defines the Exit Password
Level this user has when trying to close ViewDAQ windows on the SCADA Node in
order to exit ViewDAQ and stop the SCADA Node kernel locally.
15. Node Access. A user must be assigned to either ALL NODES or one or more
nodes in the system. If the user is not assigned to a node, he/she will not be
able to login to that node using VIEW or ViewDAQ.
16. Graphic Page Access. Power and General Users can be assigned a default
Graphic that will appear when they log-in. Otherwise, the Main.bgr graphic will
appear. Power Users can View all displays including the system displays (Action
Log, Alarm Log, Station Status and Global Script Displays). General users can
view all user built displays, trends, alarm summary and alarm group displays.
The Default Graphic is the display the user will see after Log in using VIEW (the web
browser). A Restricted User must be assigned a Default Graphic to Login to a node
using View.
The default graphic is optional for Power Users and General Users. If no Default
Graphic is assigned to a Power or General User, then the Main.bgr will appear when
using View.
ViewDAQ – ignores the Default Graphic and Restricted User display restrictions. Main.bgr or the graphic
saved with the Display Group appears for all users when ViewDAQ or a Display Group is first
opened.
17. To assign a Default Graphic, select the Default Graphic field with the mouse.
18. Click the Graphic List to view a list of all graphic displays (*.bgr)
19. Select a graphic from the list by clicking on it. Alternatively, you can type the
name of a Graphic Display that you plan to build in the future.
20. Select the menu pull down icon to assign graphics for this user on another
SCADA Node
21. If you are Adding or Updating a General User or Power User, you are
done. Press Submit and Download.

WebAccess+ IoT Solution Software Training Course 9. Users & Passwords
Advantech Co., Ltd. Ver. 8.0 9 - 6
Task 2: Add or Update Project User or admin
1. Log in to Project Manager or if already connected, hit HOME link at the top right of
most pages.
2. Select Admin / Project User on the Project Manager Home Page.
3. Project User list appears.
4. Enter User name and password to create a new users account.
5. Enter the password twice to verify correct entry.
6. Press the Submit button
7. Select Update to modify an existing account.
8. The update Project Users page appears.

WebAccess+ IoT Solution Software Training Course 9. Users & Passwords
Advantech Co., Ltd. Ver. 8.0 9 - 7
9. Make you changes and press submit.
Note – change the user name renames the existing account (it does not create a copy).
10. Download the SCADA Node.
11. Login as the new Users.

WebAccess+ IoT Solution Software Training Course 10. Display Groups
Advantech Co., Ltd. Ver. 8.0 10 - 1
Section 10 – Display Groups
Objectives This section describes the concept and provides practical training on using WebAccess Display
Groups which allow multiple window displays, user defined pop-up windows and customization
of WebAccess VIEW (e.g. hide toolbars and status bars). At the end of this section, you will be
able to create dependent tasks and mosaics.
Training Notes ViewDAQ is a local, non-web browser version on VIEW that runs on the SCADA Node. This
provides a non-web version of WebAccess similar to traditional HMI & SCADA. ViewDAQ is
intended for 'stand-alone' and control room applications.
Displays Groups allow multiple windows to 'pop-up' with a single button click. Both VIEW and
ViewDAQ users can open Display Groups. Only ViewDAQ can create, modify and save Display
Groups. Web browser users can only view Display Groups.
Display Groups also allow engineers to customize the ‘look’ of ViewDAQ by hiding toolbars and
requiring passwords. Custom pop-ups and dialog boxes can also be created with Display
Groups.
Exercise
Task 1: Start ViewDAQ
1. Start the SCADA Node kernel, if it is not already started.
2. Click the Green WebAccess Icon in the Taskbar (System Tray) next to the
clock to open the Taskbar Icon.

WebAccess+ IoT Solution Software Training Course 10. Display Groups
Advantech Co., Ltd. Ver. 8.0 10 - 2
3. Move the Mouse to the ViewDAQ menu item.
4. Click once on ViewDAQ.
5. Welcome to ViewDAQ opens without Toolbar.
6. Right Click or Press Enter to view the Toolbar and Main.bgr
Note – if the Start-up Option in SCADA Node properties is Start Kernel and View,
then ViewDAQ will start when the SCADA Node reboots.
Task 2: Create a new Display Group
1. Start ViewDAQ.
2. Login as a Power User or admin.
From the Menu bar select
File -> Login

WebAccess+ IoT Solution Software Training Course 10. Display Groups
Advantech Co., Ltd. Ver. 8.0 10 - 3
3. Enter User name and password (For example, admin ).
4. From Menu bar select
View -> ViewDAQ Options -> ViewDAQ Definition
5. In the dialog Box, give it a new name. Main is the default, if you use main for
your new name you will make all windows appear like this.

WebAccess+ IoT Solution Software Training Course 10. Display Groups
Advantech Co., Ltd. Ver. 8.0 10 - 4
The most common use of ViewDAQ Definition is to define a new Display Group Name in
order to Save a new Display Group.
6. Enter a Display Group Name: SCROLL
7. Optionally Enter ViewDAQ Name: new
8. Enter a Title: Scroll Bar on Right. These will appear on the Title Bar.
9. Press OK.
10. Select another Graphic Display to use as the Opening Graphic.. For example,
open the Alarm Summary or a Data Log Trend. (From Menu Bar select Goto ->
Alarm Summary).
9. Define an Exit Password Level (View -> ViewDAQ Options -> Exit Password
Level).

WebAccess+ IoT Solution Software Training Course 10. Display Groups
Advantech Co., Ltd. Ver. 8.0 10 - 5
10. Select a Password level.
11. Press OK.
12. Save this new Display Group with the Alarm Summary Open.
From Menu bar
File -> Save ViewDAQ -> Save ViewDAQ in Display Group

WebAccess+ IoT Solution Software Training Course 10. Display Groups
Advantech Co., Ltd. Ver. 8.0 10 - 6
12. Pick the name of the new display group you just defined. If there is more than one
Display Group, the list will be larger.
13. Press OK.
14. Confirm the name of the DSP (SCROLL.DSP)
15. Press OK
Task 3: Open Display Group from Menu Bar
1. From Menu bar, select
File -> Open Display Group -> New Display Group

WebAccess+ IoT Solution Software Training Course 10. Display Groups
Advantech Co., Ltd. Ver. 8.0 10 - 7
2. Pick the display group from the List. This will Close your existing Window and
open a new Window with the features saved. For the example above,
SCROLL.DSP will have a scroll bar don the side.
Note that the other ways to open a Display group is with a user built pushbutton or
script or Right Click Menu.
Task 4: Create Windows Display Group.
1. Start ViewDAQ
2. Login as a Power User or Admin (God, King or admin).
3. Position the graphic and scale to the smaller size. This will be the parent task
4. Open a Dependant Window. From menu bar select:
File -> Open Display Group -> Popup Dependant Display Group

WebAccess+ IoT Solution Software Training Course 10. Display Groups
Advantech Co., Ltd. Ver. 8.0 10 - 8
5. Display Group List Dialog Box opens.
6. Select SCROLL.DSP
7. Select OK.
8. Position the SCROLL Windows to the side of the first parent Window.

WebAccess+ IoT Solution Software Training Course 10. Display Groups
Advantech Co., Ltd. Ver. 8.0 10 - 9
9. From Parent Window (on the Left), another Popup Dependent window
File -> Open Display Group -> Popup Dependant Display Group
10. Select SCROLL.DSP again.
11. Position and resize this under the other two
12. Select a DataLog Trend.
13. From menu bar of Trend Window, select:
View -> Window Options -> Hide Toolbar
14. From Parent Window, save this as a new Display Group. File -> Save ViewDAQs -> Save Current and Dependent ViewDAQs.
15. In the Save Box, enter a new name: 3WINDOWS.DSP
16. Press OK.
Task 5: Verify Display Group behavior.
1. Login in as admin or a Power User (God or King).
2. Open a new ViewDAQ Group.
File -> Open Display Group -> New Display Group.
3. Display Group List Dialog Box opens.

WebAccess+ IoT Solution Software Training Course 10. Display Groups
Advantech Co., Ltd. Ver. 8.0 10 - 10
4. Pick SCROLL.DSP and press OK
5. You should see just one Window with the Alarm Summary.
6. Open a new ViewDAQ Group.
File -> Open Display Group -> New Display Group.
7. Display Group List Dialog Box opens.

WebAccess+ IoT Solution Software Training Course 10. Display Groups
Advantech Co., Ltd. Ver. 8.0 10 - 11
8. Pick 3WINDOW.DSP and press OK
9. You should see 3 Windows.
10. Close the Alarm Summary window..
Note - You will have enter a admin or Power User name and password to close the
SCROLL.DSP window.
11. The other two windows should remain open.

WebAccess+ IoT Solution Software Training Course 10. Display Groups
Advantech Co., Ltd. Ver. 8.0 10 - 12
12. Close the Parent Window. (the top left window).
13. Both the Parent and the Trend Window should close.
14. Start ViewDAQ from the task bar
15. Click the Green WebAccess Icon in the Taskbar (System Tray) next to the clock to open the
Taskbar Icon.
16. Move the Mouse to the ViewDAQ menu item.
17. Click once on ViewDAQ.
18. Welcome to ViewDAQ opens without Toolbar.
19. Right Click or Press Enter to view the Toolbar and Main.bgr.

WebAccess+ IoT Solution Software Training Course 11. Video
Advantech Co., Ltd. Ver. 8.0 11 - 1
Section 11 – Video
Objectives This section introduces the features of Web Cameras, JPEG Cameras and other IP enabled Video.
This allows users to view in real-time images on the WebAccess HMI & SCADA clients.
Training Notes WebAccess supports the use of live Video camera that are IP enabled (i.e. use the Internet or
intranet to send live video images) via an ActiveX control (an OCX). WebAccess will launch the
Active-X control in an Internet Explorer 6.0 web browser. If using ViewDAQ, IE 5.5 or later
must be installed on the PC in order to view live video.
WebAccess has a list of Video camera drivers with Active-X controls compatible with VIEW and
ViewDAQ.
Two methods of implementing Video are provided.
1. Full Screen (using only a Fill-in-the Blanks form in Project Manager).
2. Drawn as part of a Graphic Display (using DRAW).
The Video Dialog Box shows a list of configured Cameras for the SCADA node.
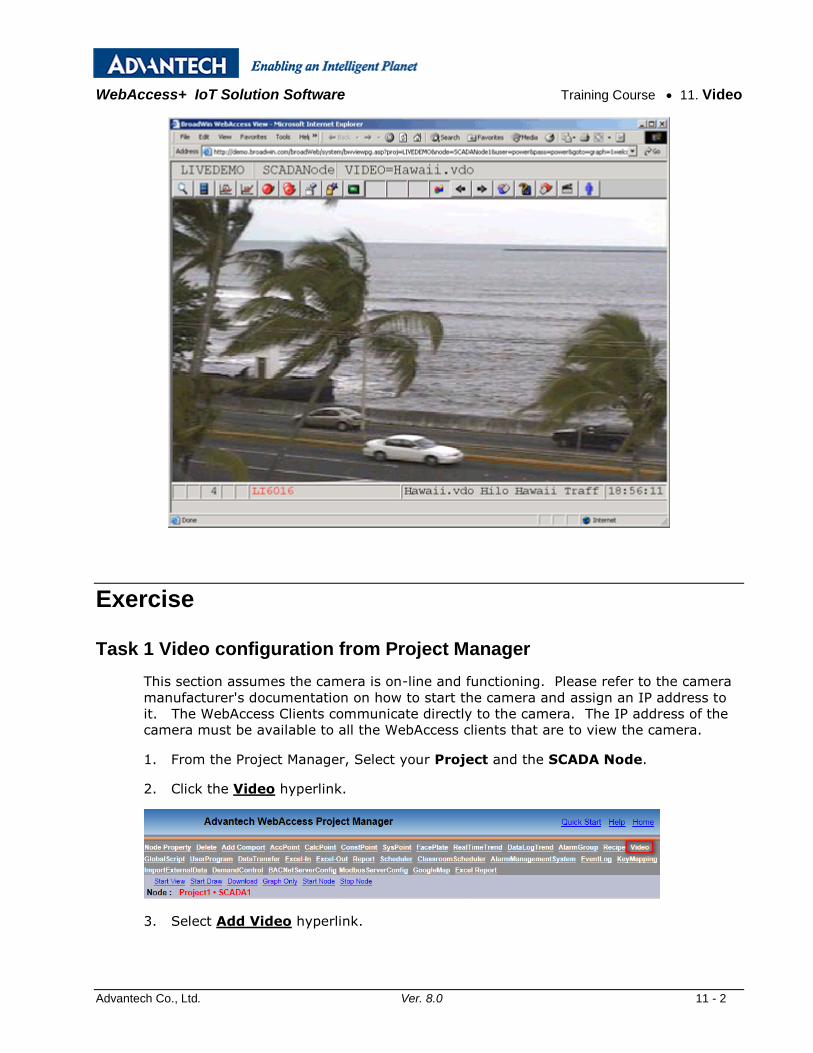
WebAccess+ IoT Solution Software Training Course 11. Video
Advantech Co., Ltd. Ver. 8.0 11 - 2
Exercise
Task 1 Video configuration from Project Manager
This section assumes the camera is on-line and functioning. Please refer to the camera
manufacturer's documentation on how to start the camera and assign an IP address to
it. The WebAccess Clients communicate directly to the camera. The IP address of the
camera must be available to all the WebAccess clients that are to view the camera.
1. From the Project Manager, Select your Project and the SCADA Node.
2. Click the Video hyperlink.
3. Select Add Video hyperlink.

WebAccess+ IoT Solution Software Training Course 11. Video
Advantech Co., Ltd. Ver. 8.0 11 - 3
4. The Add/Update Video page appears.
5. Select the Video Type from the Pull down list. The Video type matches the camera
you are connecting to. These correspond to Active X controls supplied by the camera
manufacturer. If your camera's manufacturer is not listed on the pull-down list, it is
not supported by WebAccess.
Some are multi-purpose Video Types:
snapshot (JPEG pull), server push (JPEG Image push)
Most are pre-configured to a demo camera on the Internet.
Note - For this example, select Sonync or the camera your instructor has setup
6. Accept the default Video name (use Sony).
7. Optionally, Enter a Description that will appear in the project manager.

WebAccess+ IoT Solution Software Training Course 11. Video
Advantech Co., Ltd. Ver. 8.0 11 - 4
8. Enter the IP address of the camera if your instructor tells you. Otherwise, accept the
default IP address
9. Enter the TCP port assigned to the camera if your instructor tells you. Otherwise,
accept the default IP address.
10. Press submit.
11. Download to the SCADA node.
Task 2: VIEW full screen Video Cameras
1. Start VIEW
2. There are at least three ways to open the Video List:
3. The Video icon on a toolbar.
4. Right Click Menu -> Goto -> Video

WebAccess+ IoT Solution Software Training Course 11. Video
Advantech Co., Ltd. Ver. 8.0 11 - 5
5. The Video List Dialog Box will display the Camera in VIEW or VIEWDAQ window (i.e.
full size).
6. Select a Camera (for example Sony.vdo).
7. Press OK.
8. Full Screen video opens.

WebAccess+ IoT Solution Software Training Course 11. Video
Advantech Co., Ltd. Ver. 8.0 11 - 6
Task 3: Draw Video in User Graphic Display
Multi-camera Displays, including live tag data and trends can be built in DRAW using the
Dynamic -> Video Display from the toolbar
1. Start DRAW.
2. Select New DRW .
3. Right Click the Mouse.
4. Select. Dynamic -> Video Display
5. The Video Display Dialog Box opens.

WebAccess+ IoT Solution Software Training Course 11. Video
Advantech Co., Ltd. Ver. 8.0 11 - 7
4. Enter a Name for this Video Window. This will allow scripts and animation to
change which camera is displayed in this window. (If you previously edited or drew a
Video Display, these fields will have the data from the last Video Display edited).
6. Enter the Video type, the pound sign (#) and the IP address of the Video Camera
or PC with Media Player & plus any options.
For example, enter
sonync#ip=159.121.28.8&port=80&cam=speed=0&lc=0&rc=0&tc=0&bc=0
Hint – if you configured a Video Camera in Project Manager, copy the video information
from the last line of the Dialog Box.
7. Select OK .
8. Click once to define the start of a rectangle

WebAccess+ IoT Solution Software Training Course 11. Video
Advantech Co., Ltd. Ver. 8.0 11 - 8
7. Drag with the mouse to define the size of the Video Window in the Graphic.
9. Click a second time to define the end of the rectangle.
10. Optionally add text, trends, pushbuttons and animation to the display.
11. Download GRAPH ONLY to the SCADA Node.

WebAccess+ IoT Solution Software Training Course 12. Excel Reports
Advantech Co., Ltd. Ver. 8.0 12 - 1
Section 12 - Excel Reports
Objectives This section provides information about WebAccess Excel Report capabilities. At the end of
this section, you will be able to configure default Excel reports and customize reports.
Training Notes
WebAccess Excel reports are generated from the historical tag data based on the
templates built by the data table and analysis charts as the report format in the
WebAccess SCADA Node. Users & Operators can build customized report templates
based on EXCEL functions and key words and uploaded in the WebAccess Excel report
function to automatically generated daily/weekly/monthly or specific date reports. The
function provides extensive analysis and viewing functions for statistical and event
data. Reports are built using easy to follow “Report Template Forms” based on Excel
format. View immediately in View DAQ via IE or local PC or store as “Predefined
Reports” for later use
Note:
Microsoft Excel version up to 2007
Windows XP only supports Daily/Weekly/Monthly report types.
Excel Report Configuration
Excel Report can be found in SCADA Node properties. There are seven different types:
Last Day Report, Last Month Report, Multi-Time Report, Daily Report, Weekly Report,
Monthly Report and Yearly Report. The following we will talk about how to configure

WebAccess+ IoT Solution Software Training Course 12. Excel Reports
Advantech Co., Ltd. Ver. 8.0 12 - 2
the reports. One report can gather a maximum of 32 tags and 3600 records The report will be
generated and saved in C:\inetpub\wwwroot\broadweb\WaExlViewer\report
1. Excel Report Configuration
1. Start Advantech WebAccess Project Manager
2. Login with the User Name and Password and select your Project Name
3. Open the SCADA node
4. Choose the EXCEL Report in SCADA Node:Go to the EXCEL report list page
5. Click New Report to create NEW EXCEL report
6. Configure the Report information
7. Submit the New Report

WebAccess+ IoT Solution Software Training Course 12. Excel Reports
Advantech Co., Ltd. Ver. 8.0 12 - 3
8. Generate the Report: Click Generate to get the Report. If the report has been generated, the report link is shown in the View column
General Report:
View Report:

WebAccess+ IoT Solution Software Training Course 12. Excel Reports
Advantech Co., Ltd. Ver. 8.0 12 - 4
9. Update / Delete Report: Click Update and go to the update page
2. Last Day Report Type
Users can get the report based on the data with the day before the day of the
WebAccess system from 0:00 to 24:00. The default start time and end time are
already set when user chooses this report type
3. Last Month Report Type
Users can get the report based on the data with the last month of the
WebAccess system. The default start time and end time are already set when
the user chooses this report type.

WebAccess+ IoT Solution Software Training Course 12. Excel Reports
Advantech Co., Ltd. Ver. 8.0 12 - 5
4. Multi-Time Report
Multi-time reports provide users with the option to choose different time periods
to generate the report. The Maximum number of time periods is five. Users can
define each time period.
Report Type:Multi-time.
Time Set:Choose Time periods. Maximum is five.
Start Time/End time:The start time and end time of the time period.
Position offset:The interval of the multi-time data in the report. If the position offset is 3, the first time period
data is three lines from second time period data.
Time Interval:Time interval of all time periods.

WebAccess+ IoT Solution Software Training Course 12. Excel Reports
Advantech Co., Ltd. Ver. 8.0 12 - 6
5. Daily Report
Daily reports are automatically generated based on the defined time period every
day. The report list will show each daily report and view the report
6. Weekly Report
Weekly reports are automatically generated based on the defined time period every
week. The report list will show each weekly report and view the report

WebAccess+ IoT Solution Software Training Course 12. Excel Reports
Advantech Co., Ltd. Ver. 8.0 12 - 7
7. Monthly Report
Monthly reports are automatically generated based on the defined time period
every month. The report list will show each weekly report and view the report.
8. Yearly Report
Yearly reports are automatically generated based on the defined time period every
year. The report list will show each yearly report and view the report

WebAccess+ IoT Solution Software Training Course 12. Excel Reports
Advantech Co., Ltd. Ver. 8.0 12 - 8
Exercise In this exercise, you will practice creating Excel Report, and using the various functions in the
Excel Report editor.
Task1 : Build the Template
Users & Operators can build customized report template based on EXCEL functions and key words and upload in
WebAccess Excel report function to automatically generated daily/weekly/monthly or the specific date report
1. Open the Microsoft office EXCEL
2. Rename Sheet 1 to “template”. WebAccess Excel Report function identifies the name ”template” as the sheet to be the report template
3. Key in the key words about Time / Tag / Project/Node information. Save the file and the file name will be the name of Template in the WebAccess
4. Upload the template in the system:New Template
5. Template list:List all templates. The template list includes four default templates and the new
uploaded templates. The template list based on the upload date
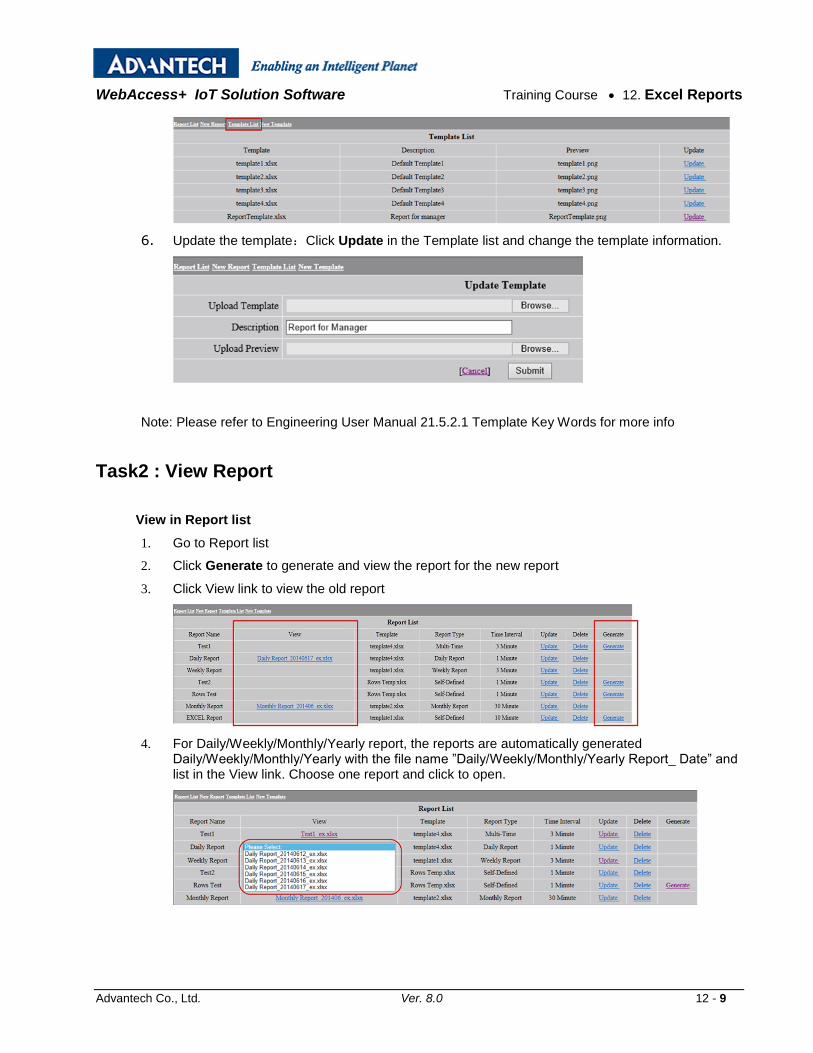
WebAccess+ IoT Solution Software Training Course 12. Excel Reports
Advantech Co., Ltd. Ver. 8.0 12 - 9
6. Update the template:Click Update in the Template list and change the template information.
Note: Please refer to Engineering User Manual 21.5.2.1 Template Key Words for more info
Task2 : View Report
View in Report list
1. Go to Report list
2. Click Generate to generate and view the report for the new report
3. Click View link to view the old report
4. For Daily/Weekly/Monthly/Yearly report, the reports are automatically generated Daily/Weekly/Monthly/Yearly with the file name ”Daily/Weekly/Monthly/Yearly Report_ Date” and list in the View link. Choose one report and click to open.

WebAccess+ IoT Solution Software Training Course 12. Excel Reports
Advantech Co., Ltd. Ver. 8.0 12 - 10
Task3 : Download the Report
1. Open the Report and Click Download. The Excel file report will download to your computer.
Task4 : View Report in View DAQ
1. Start Kernel and Open ViewDAQ
2. Tools→Excel Report
3. Report List: choose the excel Report you would like to view.

WebAccess+ IoT Solution Software Training Course 12. Excel Reports
Advantech Co., Ltd. Ver. 8.0 12 - 11
Task5 : Embed the Excel report
1. Embed the button on the interface: the button can connect to the Report on View DAQ
The method: Draw DAQ → Dynamic →Push Button
Button Down Macro:
To Repot list:<GOTO>TOOL=BWEXCELVIEW.UTI
To specific Report:<GOTO>TOOL=BWEXCELVIEW.UTI^REPORT=filename
2. Embed the Report on Draw DAQ:Dynamic → Video Display
Name : XXX
Video :

WebAccess+ IoT Solution Software Training Course 12. Excel Reports
Advantech Co., Ltd. Ver. 8.0 12 - 12
To Repot list:uti:../WaExlViewer/WaExlViewer.asp?uti=1&
To Specific Report:uti:../WaExlViewer/WaExlViewer.asp?uti=1&report=filename&
1. Insert the uti command to Video Display
2. Save and download, you will see Report List in View/ViewDAQ
3. Click any report and selected report will be retrieved.

WebAccess+ IoT Solution Software Training Course 12. Excel Reports
Advantech Co., Ltd. Ver. 8.0 12 - 13

WebAccess+ IoT Solution Software Training Course 13. Scheduler
Advantech Co., Ltd. Ver. 8.0 13 - 1
Section 13 - Scheduler
Objectives In this section, you will learn about the Scheduler function. This works with Analog, Discrete
and Text type tags in your system. This function allows you to schedule setpoint changes,
equipment start / stop and email addresses to change automatically based on a time-of-day,
day of week and calendar.
Training Notes
Scheduler Functions
The scheduler can provide both "On/Off" and Setpoint changes. For example, an "OFF"
hours Temperature Setpoint may be "setback" during evening hours to save energy
while the "ON" hours Temperature Setpoint may be set for occupant comfort. The On
Value and Off value are specified for each Tag (or Circuit). These can be any two
values (i.e. not just 0 and 1) to allow setpoint changes and other value changes
(included text strings).
The On Values and Off Values are specified for each tag in the Circuit Group. A tag can
be viewed as representing a single electrical circuit (for example on/off control of
lights). Hence, groups of tags are called "Circuit Groups". A "Circuit Group" can be any
group of tags (or even a single tag) that will always share the same schedule.
The Time specifies the Start Time and Stop Time for each day of the Week. Each day
of a schedule consists of Normal Hours, two sets of Extra Hours and a Default time
period. Separate Start and Stop Time can be defined for Normal Hours, Extra Hours
I and Extra Hours II. The Default applies to any time outside of Normal or Extra
Hours. The Normal Hours, and Extra Hours, combined with the "Default", allows 4 time
periods per day (minimum) to be specified. Additional schedules can be defined if more
"periods" per day are required.
A Cycle Time, in 1-minute intervals, can also be specified to allow On/OFF cycling of
equipment during the schedule (for example, turn the Fans on for 10 minutes, then off
for 20 minutes from 8:00 am to 5:00 pm). The ON CYCLE TIME and OFF CYCLE TIME
can be defined for each Normal, Extra Hours and default period of the day. If both ON

WebAccess+ IoT Solution Software Training Course 13. Scheduler
Advantech Co., Ltd. Ver. 8.0 13 - 2
Cycle = 0 and OFF Cycle=0, then nothing happens, the tags remain unchanged during
the time period. If ON Cycle=1 and OFF Cycle=0, then no cycling happens and the tags
are set to the ON values for the duration of the Start to Stop time.
Holiday defines calendar-based events. It allows "Holiday Schedules" to be set to
account for non-occupancy or special events. The Holiday schedule can be used for any
calendar event (based on Month, Day of Month and Year) up to 1 year in the
future. Multiple holiday schedules can be configured and assigned to different groups of
tags.
There is no limit to the number of Schedules that can be configured. Each schedule has
a START TIME, STOP TIME, optional CYCLE time, ON and OFF values for each day of
week plus the "Holiday schedule".
An Equipment Group associates a Time Schedule with one or more Circuit Groups .
Multiple "Circuit Groups" can be linked to a single "Time Schedule" in an "Equipment
Group". For example, the lights for each floor a building might be grouped into a Circuit
group each (1stFloorCircuit, 2ndFloorCircuit, 3rdFloorCircuit, … 40thFloorCircuit). Each
'Occupied" floor might be assigned to the "Occupied Equipment Group" with the
"Occupied Schedule". If a tenant moves, that floor would be reassigned to the
"Unoccupied" Equipment group, which uses the "Unoccupied Schedule".
A MANUAL ON and MANUAL OFF feature allow a schedule to be "overridden" and
forced to the ON or OFF values for a Circuit Group. MANUAL ON/OFF is typically used to
enable occupancy (i.e. turn on the lights) for non-scheduled events. AUTOMATIC
follows the defined schedule when specified in a Circuit Group.
New schedules and changes to schedules will Download to the SCADA node without
stopping the SCADA Node.
Power Users can download and Modify Schedules from VIEW (and ViewDAQ) from the
Tools menu. Web browser VIEW clients must log in as Power Users to Download or
Modify a Schedule. Any ViewDAQ user can download a schedule.
To access Scheduler from VIEW:
Right Click -> Tools -> Scheduler
To access Scheduler from ViewDAQ:
From the Menu Bar, select Tools -> Scheduler
Exercise
Task 1: Create a Schedule
1. Login in to Project Manager
2. Select Project and SCADA Node
3. From SCADA Node main page, select Scheduler.

WebAccess+ IoT Solution Software Training Course 13. Scheduler
Advantech Co., Ltd. Ver. 8.0 13 - 3
Create a Schedule
4. From the Holiday page, create at least one holiday schedule. It can be
blank. The Holiday Schedule defines “exceptions” to the 7 day per week
schedule. The "Holiday" is any unusual event or series of events. The Holiday
Schedule can be defined, redefined and assigned at any time, but usually is
defined first to allow easy assignment to the Time Schedules as the "exception" to
the schedule.
a. Enter a name for the Holiday Schedule.
b. Enter a Group Number.
c. Press submit.
The typical use is to create "Holiday" schedules to account for non-occupancy of
buildings in order to have an "exception" to the normal weekday schedule. A
Holiday Schedule can be created for any calendar event, not just holidays, that
are based on the Day, Month and Year.

WebAccess+ IoT Solution Software Training Course 13. Scheduler
Advantech Co., Ltd. Ver. 8.0 13 - 4
5. Select Time.
6. On the Time Group page, define the Time Schedules. These are the START TIME
and STOP TIME for Normal and Extra Hours for a weekly schedule. A single
"Holiday Schedule Group" is assigned to each Time Schedule.
a. Enter a Time Group Number.
b. Enter a name the Time Group.
c. From pull down list, select Holiday Schedule.

WebAccess+ IoT Solution Software Training Course 13. Scheduler
Advantech Co., Ltd. Ver. 8.0 13 - 5
d. Under Normal Hours, use the pull down list to select Start and
Stop times (Monday through Sunday and Holiday).
e. Enter 1 under Cycle ON and leave 0 as Cycle Off if value is
continuously ON.
f. Repeat for Extra Hours, Extra Hours II and default cycle if there
are multiple scheduled per day. (See Time for more detailed
information)
g. Press submit.
7. Select Equipment Group.
Equipment Groups associate one or multiple Circuit Groups with a Time
Schedule. Equipment Groups allow a single Time Schedule to be assigned to
multiple Circuit Groups quickly and reduces the need to re-create the same
schedule.

WebAccess+ IoT Solution Software Training Course 13. Scheduler
Advantech Co., Ltd. Ver. 8.0 13 - 6
8. Define Equipment Group by:
a. Enter Group Number
b. Enter a Name
c. Select a Time Group (a Schedule) from the pull down menu.
d. Press submit.
9. Select Circuit Group
10. Define Circuit Groups. These are "Tags" that will always share the same
Schedule.
a. Enter a Name for the Circuit Group.
b. Accept 0 or enter a Circuit Group Number.
c. Select an Equipment Group from the pull down menu. The Equipment Group
associates a Time Group (a Schedule) with this Circuit and, optionally, the
same time group/schedule with other circuits.
d. Select a field under Tag Name.
e. Select the Tag List.
f. Scroll down list to find desired Tag.
g. Click once on the Tag in Tag List.

WebAccess+ IoT Solution Software Training Course 13. Scheduler
Advantech Co., Ltd. Ver. 8.0 13 - 7
h. Repeat for other Tag Names.
i. To increase the number of tags, modify the Max Tags field.
j. Press submit.
11. Download the Schedules to the SCADA node. You can download the SCHEDULER
without stopping the SCADA node. The new schedule will take effect
immediately. If a tag is supposed to be ON, it will be set to the ON value.
Task 2: Start Scheduler in View or ViewDAQ
Start Scheduler from VIEW:
1. Login as a Power User or Admin.
2. Right Click -> Tools -> Scheduler
Start Scheduler from ViewDAQ:
1. From the Menu Bar, select Tools -> Scheduler

WebAccess+ IoT Solution Software Training Course 14. Recipes
Advantech Co., Ltd. Ver. 8.0 14 - 1
Section 14 - Recipes
Objectives This section provides training on using WebAccess recipe management tools. At the end of the
section, you would be able to:
configure a recipe file
View recipe displays and recipe dialog boxes
download and upload recipe values in run-time
Training Notes The WebAccess Recipe Handler function is a software module that supports recipe downloading,
uploading, verifying, editing, and saving during run-time. Recipe configuration consists of two
main steps:
1. Creating recipe files that define ingredients, units and their
preset values.
2. Generating pre-formatted or custom recipe displays.
A Recipe allows an Operator or User to change the value of many tags with a single
pushbutton.
The Recipe function is similar in concept to a "recipe" used in cooking food. A Recipe is a
collection of pre-set values or setpoints for multiple ingredients. Engineers configure a recipe
(like writing a cook book) in the Project Manager. During Run-time, Operators and Users can
download the recipe using a single pushbutton. Dozens or hundreds of values can be changed
with a single pushbutton.
Common uses for recipes include setting up machines and manufacturing tools for a "new run"
or a different product. Recipes are also used to enable shutdown settings or startup settings.
A recipe is a collection of Setpoint or preset values for multiple items (ingredients). A given
recipe can be used with several different “units”, although each “unit” must have similar
equipment lineups (e.g. tag types). A unit consists of a group of tagnames associated with an
item (ingredient). For example, all Air Handling Units, (AHU's) have an Exhaust Fan, Supply
Fan, Pre-Heat Controls, Cooling Controls and secondary fans. Air Handler 1 (AHU1) is shown

WebAccess+ IoT Solution Software Training Course 14. Recipes
Advantech Co., Ltd. Ver. 8.0 14 - 2
below. The Exhaust Fan for Air Handler 1 is EF-12, the Supply Fan is FAN101. The Preset
values for the Startup recipe are RUN, Auto and non-zero setpoints (see figure below).
A recipe file can consist of multiple processing Units (for example, continuing the Air Handler
example above): Air Handler Unit 1, Air Handler Unit 2 and Air Handler Unit 3). Any recipe
can be downloaded to any unit: startup, shutdown, and maintenance mode.
Operators select the Recipe File, Recipe and Unit from the Recipe List Dialog Box called from
the toolbar icon or from user-built pushbuttons.
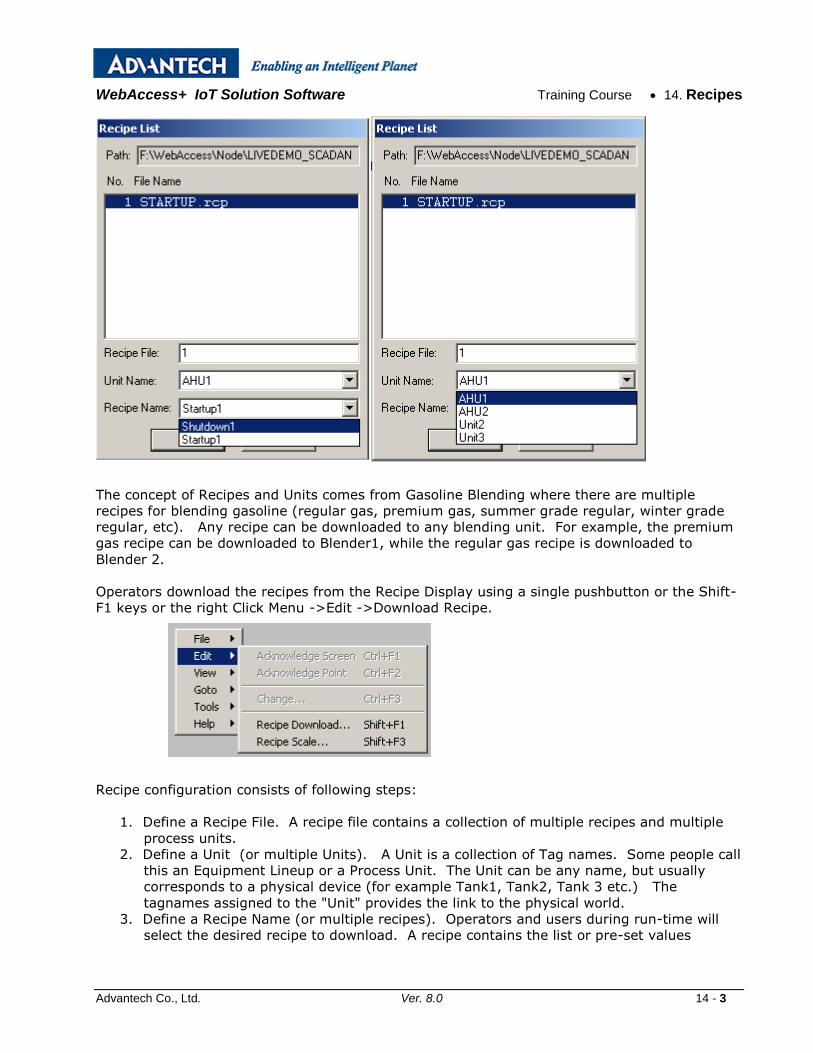
WebAccess+ IoT Solution Software Training Course 14. Recipes
Advantech Co., Ltd. Ver. 8.0 14 - 3
The concept of Recipes and Units comes from Gasoline Blending where there are multiple
recipes for blending gasoline (regular gas, premium gas, summer grade regular, winter grade
regular, etc). Any recipe can be downloaded to any blending unit. For example, the premium
gas recipe can be downloaded to Blender1, while the regular gas recipe is downloaded to
Blender 2.
Operators download the recipes from the Recipe Display using a single pushbutton or the Shift-
F1 keys or the right Click Menu ->Edit ->Download Recipe.
Recipe configuration consists of following steps:
1. Define a Recipe File. A recipe file contains a collection of multiple recipes and multiple
process units.
2. Define a Unit (or multiple Units). A Unit is a collection of Tag names. Some people call
this an Equipment Lineup or a Process Unit. The Unit can be any name, but usually
corresponds to a physical device (for example Tank1, Tank2, Tank 3 etc.) The
tagnames assigned to the "Unit" provides the link to the physical world.
3. Define a Recipe Name (or multiple recipes). Operators and users during run-time will
select the desired recipe to download. A recipe contains the list or pre-set values

WebAccess+ IoT Solution Software Training Course 14. Recipes
Advantech Co., Ltd. Ver. 8.0 14 - 4
defined by an engineer that will be downloaded using a single button push. This allows
dozens or hundreds of tags to be changed with a single button push.
4. Define Item Names. These are the ingredient names. They are a description and can be
any user-defined text. They are to make it easier for Engineers and Operators
understand the values.
5. Define Tag names. These physical IO tags are associated with the process Unit. For
example, if the Unit were Tank1, then all the tags would be associated with Tank1.
6. Define Preset Values. These are the numbers and text to be downloaded. The preset
values are associated with a given recipe within the recipe file.
WebAccess provides a pre-built recipe template display for run-time. All recipes can be viewed
in runtime without any display building. WebAccess also provides a pop-up dialog box in
runtime to allow Operators and Users to select the recipe file, Unit and recipe.
Only Admin, Power Users and General Users can access Recipe Displays and Recipe Dialog
Boxes in VIEW. Restricted Users, using VIEW, cannot access standard recipe displays
or recipe dialog boxes.
Exercise
Task 1: Configure a recipe file.
From the Project Manager
1. Select your Project and the SCADA Node.
2. Click the Recipe hyperlink from the SCADA Node main page (bwMain.asp).
3. The Recipe List page opens.
4. Select Add Recipe File .
5. The Add/Update Recipe page opens.

WebAccess+ IoT Solution Software Training Course 14. Recipes
Advantech Co., Ltd. Ver. 8.0 14 - 5
6. Create the following recipe.
Ingredient Unit Recipe
Names Tank1 Canary yellow Teal Green
%Yellow Yellow 88 45
%Blue Blue 12 36
%Red red 10 15
Use a 5% deadband for all the pre-set values.
Indicate a Area 1 and Level 3 password for on-line editing and a level 2 password for downloading of
recipe.
Save the recipe file using the file name color.rcp.
7. Press Submit.
8. Download the SCADA node.
Task 2: Manage recipes in VIEW.
1. Start VIEW
2. From the Toolbar select the recipe icon
3. From the Recipe Dialog Box select the recipe file

WebAccess+ IoT Solution Software Training Course 14. Recipes
Advantech Co., Ltd. Ver. 8.0 14 - 6
(In the example, select Color.rcp).
4. Choose the unit and recipe
(In the example select CanaryYellow and Mixer1)
5. Select OK to open the recipe display.
6. Click the Download button on the Toolbar. Note the change in the current
values.
7. Note that the Current values should change.
8. Click the Change Preset button. Change values by more than 15 .
V - is a Verification Error associated with Recipes. This will appear only if you are
viewing a Recipe Display and there is a mismatch between a recipe Preset Value and
the corresponding Tag's value. If you are not viewing a Recipe Display, this window is
Blank (no V).
WHITE Text - White Number or Text for Current Value does not equal the recipe
preset value after a download. It is outside the "Tolerance" specified for the recipe by
the engineer.
Red Text is an Alarm - Alarms are shown, just like in an Alarm Group display or Alarm
Summary.

WebAccess+ IoT Solution Software Training Course 14. Recipes
Advantech Co., Ltd. Ver. 8.0 14 - 7
9. Right Click -> Edit -> Recipe Download
10. Note that the Current values should change.
11. Right Click -> Edit -> Recipe Upload.
12. Click the Upload button so that the current values become the recipe preset values.
13. Right Click -> Edit -> Recipe Upload
14. Save a new recipe named BLACK (with the new pre-set values) by clicking the Save
button. These will be create a new recipe values next time you open the recipe file
again.

WebAccess+ IoT Solution Software Training Course 14. Recipes
Advantech Co., Ltd. Ver. 8.0 14 - 8
Task 3: Create Recipe Download Button.
1. In the Mixpaint graphic, draw a label with the text “Download Recipe” and create
a pushbutton around it. Use the key macro <RCPDOWNLOAD>@color.rcp.
2. Save and download the graphic.
Task 4: View and download recipe.
1. Open the Mixpaint or the new graphic created in Task 1 in VIEW.
2. Click the Download Recipe button and see the effect on the values of the filling
line. If the values are not the pre-set values for unit one and recipe one, check
the push button key macro for errors.

WebAccess+ IoT Solution Software Training Course 15. Dashboard
Advantech Co., Ltd. Ver. 8.0 15 - 1
Section 15 - Dashboard
Objective This section introduces the advanced WebAccess features. These include:
Dashboard Overview
Dashboard Operating Environment
Dashboard Editor
Dashboard Viewer
Dashboard Project Configuration
Widget Builder(need V8.1 20150807 bate or later version)
Training Notes
Dashboard Overview
WebAccess 8.0 is the next generation of HMI software and is based on HTML5,
JavaScript and CSS technology. Users can create a customized information page by
using analysis charts and diagrams called widgets. They can view the data on different
platforms, like Explorer, Safari, Chrome, and Firefox for a seamless viewing experience
across PCs, Macs, tablets and smartphones.
WebAccess 8.0 still contains the original HMI functions – DrawDAQ and ViewDAQ, and
has added a new HMI function, “Dashboard” to Extend HMI access for mobile engineers
or managers and empowered mobile workers to access monitoring information remotely
to increase productivity, control, and efficiency whilst at the same time, saving money
and resources.

WebAccess+ IoT Solution Software Training Course 15. Dashboard
Advantech Co., Ltd. Ver. 8.0 15 - 2
Dashboard Operating Environment
Server side
Up to Windows 7 (not include Win 7 Home Basic ) and Windows Server 2008 R2
IIS 7.5 and .Net Framework 4.5
WebAccess 8.0
WebAccess 8.0 License
Client End
HTML 5 compatible browser including, but not limited to
Windows : IE9 or higher, Chrome, Firefox
iOS : Safari / Chrome
Android : Chrome / Firefox
Windows Phone 8 : IE10
Dashboard Editor
Dashboard Editor is the main Dashboard editor page and is based on HTML5 and is similar in
concept to the Dashboard software. Users can build the real-time and analysis pages used to
display the dynamic data and data analysis charts. A Widget library is included to build the

WebAccess+ IoT Solution Software Training Course 15. Dashboard
Advantech Co., Ltd. Ver. 8.0 15 - 3
Dashboard page to produce graphical representations of the application data analysis for end-
users or managers.
1. Banner
The top picture of Dashboard Editor is called the Banner. Users can modify the Banner to change the
pictures or title
Banner Configuration
Go to Dashboard Config. in the Menu Bar. Choose the Banner Image setting to change the Banner
image and title
Banner Image setting:The image at the top of the Dashboard Editor/Viewer is the Banner. Users
can change the Banner image and title in this setting page. The Banner consists of three pictures (left,
center and right)click the image to change the pictures
Banner title is the text in the middle of the Banner. Type the Banner title, and set the font to customize
the Banner

WebAccess+ IoT Solution Software Training Course 15. Dashboard
Advantech Co., Ltd. Ver. 8.0 15 - 4
2. Menu Bar
Menu bar contains the most commonly used tools ie: create new Dashboard, save Dashboard, or go to
Dashboard viewer
a. New Dashboard:Open a new dashboard page
b. Save Dashboard:Save the dashboard page
c. Dashboard Config:Set the preferences for the Dashboard system
d. Preview:Users can preview the Dashboard page in different modes on platforms, including
PC/Tablet Mode, Phone Portrait Mode, Phone Landscape Mode. Select a mode to preview the result
in Dashboard Viewer. There are preset user-defined sizes for special resolutions
e. Dashboard Viewer:Go to Dashboard Viewer Page
f. Logout:Logout of the Dashboard page
3. Left Panel – Menu List & Dashboard List Tree
The Left pane integrates two functions - Dashboard list and Menu list - to build the dashboard list tree of
different projects. The left pane is an Accordion Menu and can be hidden with this close icon

WebAccess+ IoT Solution Software Training Course 15. Dashboard
Advantech Co., Ltd. Ver. 8.0 15 - 5
4. Dashboard Area
The central area of the Dashboard is the Dashboard Area. It is the main editor area of the Dashboard
system. Users can build the Dashboard with widgets in this area and View the saved Dashboard in
Dashboard viewer
5. Right Pane – Property Pane
The Property pane is where the properties of the dashboard page or widget are set. The pane is an
Accordion Menu and can be hidden with this close icon
When users click a widget in Dashboard Widget, the property pane will show the properties related to the
widget.
When users click Dashboard tab, the Property Pane will show the properties related to the dashboard page
6. Widget List Pane
Widget List Pane shows the Widget Explorer and the 10 most recently used Widgets

WebAccess+ IoT Solution Software Training Course 15. Dashboard
Advantech Co., Ltd. Ver. 8.0 15 - 6
Widget Explorer:Users can drag the icon in Dashboard area and pop-up the widget library
windows to choose the required widget
Exercise
Task 1: Dashboard Project Configuration
1. Open WebAccess Project Home Page
2. Go to Project Management and Login the Account
3. Choose the Project and go to Dashboard Edit

WebAccess+ IoT Solution Software Training Course 15. Dashboard
Advantech Co., Ltd. Ver. 8.0 15 - 7
4. Create New Dashboard
5. Drag the Widget Library and Choose widget to edit the Dashboard page in Dashboard Area.

WebAccess+ IoT Solution Software Training Course 15. Dashboard
Advantech Co., Ltd. Ver. 8.0 15 - 8
6. Change/Cancel the widget:Click to replace widget, Click button to edit widget
property , Click button to close this widget.
7. Assign the right Tag and Time interval in widget property
8. Save the Dashboard page.
9. Go to dashboard Viewer to view the result

WebAccess+ IoT Solution Software Training Course 15. Dashboard
Advantech Co., Ltd. Ver. 8.0 15 - 9
10. Dashboard View.

WebAccess+ IoT Solution Software Training Course 15. Dashboard
Advantech Co., Ltd. Ver. 8.0 15 - 10
Task 2: Dashboard Widget Builder Configuration (need WebAccess 2015.8 version or above)
1. Start Widget Builder.
2. Upload a new image from your PNG files: (The file should be a PNG format)

WebAccess+ IoT Solution Software Training Course 15. Dashboard
Advantech Co., Ltd. Ver. 8.0 15 - 11
3. Click Close , put it on the right position and resize for image.
4. Drag one Text component n area, one Text for Label, enter “AI1”, enter “Label” in Description Name, another Text enter “xxxx”, enter “Tag1” in Description Name and “L-Text” in Animation property, click apply and resize Texts.
AI1 : Label (Description Name) (None Animation property)
xxxx : Tag1 (Description Name) & L-Text (Animation property)

WebAccess+ IoT Solution Software Training Course 15. Dashboard
Advantech Co., Ltd. Ver. 8.0 15 - 12
5. Save Widget named W2.
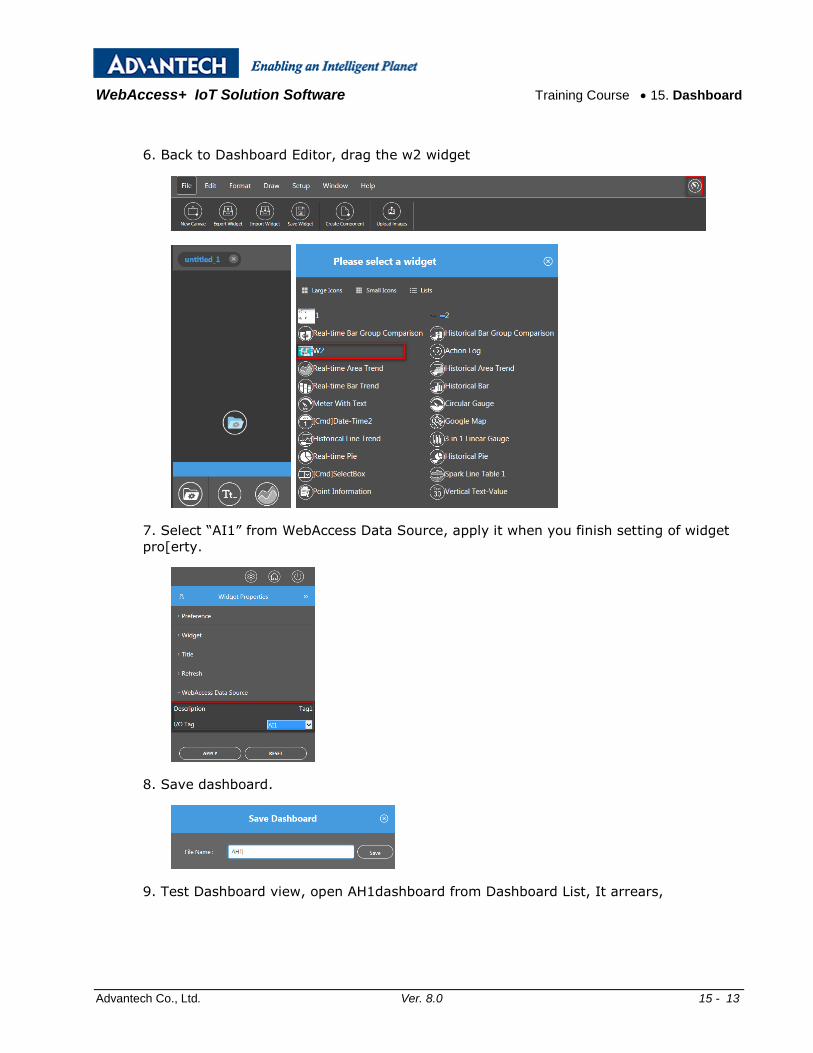
WebAccess+ IoT Solution Software Training Course 15. Dashboard
Advantech Co., Ltd. Ver. 8.0 15 - 13
6. Back to Dashboard Editor, drag the w2 widget
7. Select “AI1” from WebAccess Data Source, apply it when you finish setting of widget
pro[erty.
8. Save dashboard.
9. Test Dashboard view, open AH1dashboard from Dashboard List, It arrears,

WebAccess+ IoT Solution Software Training Course 15. Dashboard
Advantech Co., Ltd. Ver. 8.0 15 - 14
Note. You should start node if you cannot connect with project node.

WebAccess+ IoT Solution Software Training Course 16. Advanced Features
Advantech Co., Ltd. Ver. 8.0 16 - 1
Section 16 - Advanced Features
Objective This section introduces the advanced WebAccess features. These include:
Data Transfer
DDE
OPC
Training Notes
Data Transfer
The DATA Transfer function used to transfer data from one PLC or automation device to
another. This is especially useful in single-master protocols or to exchange data between
devices that have different communication protocols and are unable to communicate
with each other directly.
DDE
The EXCEL application must have access to the WebAccess SCADA node. EXCEL must
be running on the SCADA Node PC or have a Network DDE connection (NetDDE) to the
SCADA node.
In EXCEL, the formula has three parts: the name of the application (bwdde); the file
name or topic always topic for WebAccess); and the cell range, value, field, or data
that's referred to (the tagname). The following illustration shows the parts of a remote
reference formula and the required separator characters.
A pipe character (|) separates the program name from the document or topic name. An
exclamation point (!) separates the document or topic name from the cell range, value,
field, or data referred to.
The general format of EXCEL formula to read data from WebAccess is:

WebAccess+ IoT Solution Software Training Course 16. Advanced Features
Advantech Co., Ltd. Ver. 8.0 16 - 2
=bwddexe|topic!tagname
=bwddexe|topic!tagname.field
=bwddexe|topic!BLOCK:PARAMETER
=bwddexe|topic!BLOCK:PARAMETER.field
OPC
OPC is an acronym for OLE for Process Control. It is an industry standard introduced by
Microsoft based on DCOM. If there is not a “Genuine WebAccess Driver” for your
automation device, then you should see if the manufacturer (or a 3rd Party like Kepware)
supplies an OPC Server for the device.
The WebAccess OPC Device driver is an OPC Client. Hardware manufactures typically
supply an OPC Server to provide access to real-time data. Most OPC Servers allow tags
to be "browsed" and "imported". WebAccess provides an OPCTool.exe that allows tags
to be "imported" after you have configured an OPC Comport and at least one OPC
Device.
The OPC Server software is usually is installed on the SCADA node (a Local OPC
Server).
The OPC Server software can also be installed on another PC (a Remote OPC Server)
that is not the SCADA Node. A TCP/IP network connection (usually a LAN or Intranet) is
used to communicate to the "remote" OPC Server from the SCADA Node. The remote
OPC Server must have either WebAccess Project Node software or OPC Service installed.
WebAccess provides a set of pre-built communication “drivers” that enable engineers
and technicians to easily establish communications to automation devices including PLCs,
controllers, DCS, DDC systems, other software packages, recorders, RTUs, IO, smart
transmitters and other automation hardware.
There are drawbacks to using an OPC Server:
You must maintain two (2) communications databases, the OPC tag
configuration and the Web Access Tag configuration. If you change the
Tag name in OPC Server, you must change the OPC Tag address in
WebAccess to match the new name.
Technicians must translate the OPC Tag name to the device address when
troubleshooting or identifying IO.
Most OPC Servers do not support remote configuration. Most OPC Servers
require configuration to be performed locally on the OPC Server Node
(usually the SCADA Node).
WebAccess OPC Tool (the Import Tool) must be run locally on the Project
Node.
Note – If you know the OPC Tag addressing, you can type it into the WebAccess Address
field. This works well for small changes or additions.

WebAccess+ IoT Solution Software Training Course 16. Advanced Features
Advantech Co., Ltd. Ver. 8.0 16 - 3
The OPC Software is a second set of software programs that must be maintained
and monitored.
Generally, it is best to use a WebAccess Driver specific for your device when
considering remote configuration.
Exercise
Task 1: Configure Data Transfer
From the Project Manager
1. Select your Project and the SCADA Node.
2. Click the Data Transfer hyperlink.
This opens the Data Transfer page, shown in below
3. Select either Add Data Transfer or Update.
This opens the Create Data Transfer or Update Data Transfer page shown
below.
4. Source Tag. Enter the tagname that contains the value to be transferred.
5. Target Tag. Enter the tagname of the Destination Tag. This tag will receive the
value from the source tag.

WebAccess+ IoT Solution Software Training Course 16. Advanced Features
Advantech Co., Ltd. Ver. 8.0 16 - 4
6. Check Time. This is the frequency of checking the two tags in milliseconds (500
to 60,000 milliseconds).
7. Dead Band (%). This is the difference in value (in percent of full scale)
between the two tags that will result in a data transfer from the source to the
target. A large deadband will minimize communications traffic. A smaller
deadband will increase communications and accuracy.
8. Press Submit when you are finished entering data.
Task 2: EXCEL formula to read tags from WebAccess DDE
1. Start EXCEL on the SCADA node.
2. Create a formula in a Cell to read the value of the tag named speed:
=bwddexe|topic!SPEED.NAME
3. Create a formula in a Cell to read the Hi Span of a tag name speed:
=bwddexe|topic!SPEED.SPANHI
4. Create a formula in a Cell to read the engineering units of speed
: =bwddexe|topic!SPEED.ENUNIT
5. Repeat for the tag named TIMER.

WebAccess+ IoT Solution Software Training Course 16. Advanced Features
Advantech Co., Ltd. Ver. 8.0 16 - 5
Task 3: Configure an OPC Communication Port
From the Project Manager (See section 2.3.2 Connect to Project Node in the Engineering
Manual if you need help connecting).
1. Select your SCADA node under the Project/Node list.
2. Select Add Comport
This can take a long time while tables are created in the database on the Project
Node / Web Server.
3. The Create New Comport page appears.
4. Select the OPC as the Interface Name for this Comport.
5. Enter a Comport Number. It is recommended to use a number above 2 so you
don't interfere with adding a serial comport. Most PCs have 2 serial comports, if
you configured a TCP/IP comport as 1 or 2, you would not be able to use that
serial comport in the future. It is not easy to change comport numbers In the
OPC port properties, this is a Virtual number used for reference. It can be any
number. The only consideration might be to avoid conflicts with another
device driver (i.e. a Serial Comport) which requires the comport number to
match that of the physical interface.
If the OPC Server uses a Serial Comport, it is okay to use that same number as
the OPC Comport number. This has the added advantage of reducing confusion
6. Optionally, enter a Description. This is just for your own reference.
7. Enter a Scan Time for the units (Millisecond, Second, Minute or Hour).
8. Select the OPC Server Type:
The OPC Server software is usually is installed on the SCADA node. In this case,
select a Local OPC Server type.

WebAccess+ IoT Solution Software Training Course 16. Advanced Features
Advantech Co., Ltd. Ver. 8.0 16 - 6
The OPC Server software can also be installed on another PC. The select Remote
OPC Server Type.
A TCP/IP network connection (usually a LAN or Intranet) is used to communicate
to the "remote" OPC Server from the SCADA Node. The remote OPC Server must
have either WebAccess Project Node software or OPC Service installed.
Accept the default values for the other fields, or modify them.
10. Click Submit.
11. The SCADA Node page appears. The Port should appear as a folder under the
SCADA node. in the menu tree at left.
Task 4: Add OPC Device
1. Click on the Port hyperlink (Port3 in this example). The Comport Properties Page
for an OPC Type Device appears.
2. Select ADD DEVICE. This will take a while, so wait and be patient.
3. 13. Enter a Device Name. This is any user defined name.
4. Optionally, Enter a Description is a user defined.
5. Enter a Unit Number, for most OPC interfaces, this is a "virtual number" and does
not correspond to the actual Unit Number used in the protocol addressing.
6. Press Submit.
7. This can be a wait while data tables are created on the Project Node.
Task 5: Start the OPC Tool
The easiest way to run the OPC Tool is:
1. Go to the Project Node
2. Select the START button from the Task Bar
3. Select Run

WebAccess+ IoT Solution Software Training Course 16. Advanced Features
Advantech Co., Ltd. Ver. 8.0 16 - 7
4. Enter OPCTool
5. Select OK.
6. The OPC Tool Client opens.
It will be blank until you connect to a Server.
The OPC Tool is program located in the WebAccess Node directory (typically
C:\WebAccess\Node\OPCTool.exe) on the Project Node. As an alternate to using
the Start button and RUN, you can double click on the OPCTool.exe icon in Windows
Explorer.
Before using the OPC Tool to import, you must configure an OPC Comport, at least one
OPC Device. In case you forgot to configure an OPC Comport and Device in your
WebAccess Database, you can do so without closing the OPC Tool.

WebAccess+ IoT Solution Software Training Course 16. Advanced Features
Advantech Co., Ltd. Ver. 8.0 16 - 8
Task 6: Connect to OPC Server with OPC Tool
1. To connect the OPC Tool to an OPC Server, select either the connect icon or from
the menu bar select OPC - > Connect OPC Server from the OPC Tool Client.
2. The WebAccess Connect OPC Server Dialog box opens.
3. Under Server Type, select either Local (i.e. this computer, the Project Node) or
Remote (another computer).
3a. If you select Local, a list of all installed OPC Servers on this local computer
appears. (I.e. the OPC Servers installed on the Project Node or Combined Project
/ SCADA node).

WebAccess+ IoT Solution Software Training Course 16. Advanced Features
Advantech Co., Ltd. Ver. 8.0 16 - 9
4. Select the server from the OPC Server List
5. Select the Connect OPC Server button.
The OPC Tool will start the OPC Server if it is not running. However, it is
recommended that you manually start the OPC Server and run through any procedure
needed to connect to the automation devices (for example in the Kepware Modbus
and Cimetrics Bacnet OPC Servers both start with no devices connected and require
that you select a device or network to communicate).
6. The OPC Item Browse/Import Dialog Panel appears.
6.1 Click ”Add Selected item” or “Add All Items”: to add Items
6.2 Click “Finish”to configure

WebAccess+ IoT Solution Software Training Course 16. Advanced Features
Advantech Co., Ltd. Ver. 8.0 16 - 10
7. The OPC Tool Client appears
7. Select the Export to WebAccess icon

WebAccess+ IoT Solution Software Training Course 16. Advanced Features
Advantech Co., Ltd. Ver. 8.0 16 - 11
8. The Dialog Panel appears. You should select the right Project / Node / Comport /
Device for OPC tags export

WebAccess+ IoT Solution Software Training Course 16. Advanced Features
Advantech Co., Ltd. Ver. 8.0 16 - 12
Exercise 7: Blocks, Parameters & Detail Displays
The following examples create a PID Block type and a PID Block Detail Display. The
classic use of a Block Detail Display is for a PID Controller: Measurement, Setpoint,
Output, and tuning parameters for all PID blocks are viewed using the one Block Detail
Display shown below. A Modicon device is used in these examples.
Blocks are a common "productivity tool" that can reduce display-building requirements
and allow users to commission new devices and IO without any display building. . A
common application is in Building Automation where hundreds of similar VAV's are
monitored. Only one Block Detail Display needs to be built for a VAV Type. The Block
Detail Display can have multiple pages.
The Block Tag name can be anything (e.g. TIC101, PIC227, FlowControl). All three of
these Blocks will use the same PID Block Detail display. New PID blocks can be added,
without display building, and all can use the PID Block Detail Display.
Step1: Create Parameters for PID Block
This example uses a Modicon Modbus Device to create a PID Block. This will create 4
parameters:
MEAS
SP
OUT
AM
1. Start WebAccess Configuration.

WebAccess+ IoT Solution Software Training Course 16. Advanced Features
Advantech Co., Ltd. Ver. 8.0 16 - 13
2. Login with User Name and Password.
3. Select your Project Name.
4. The Project Manger opens.
5. Drag the slider bar on the left Frame down to reveal Device Type list.
6. Pick the Modicon Device Type (this is for a Modbus Driver).
7. The Parameters Set for the Device Type (driver) opens.

WebAccess+ IoT Solution Software Training Course 16. Advanced Features
Advantech Co., Ltd. Ver. 8.0 16 - 14
8. Select Add Parameter.
9. The Create Parameter Properties Page opens.

WebAccess+ IoT Solution Software Training Course 16. Advanced Features
Advantech Co., Ltd. Ver. 8.0 16 - 15
Create MEAS Parameter
9. Select Analog Parameter Type from the Pull Down List.
10. Enter Parameter name: MEAS.
11. Enter a Description: Measurement
12. Enter Address: 30001

WebAccess+ IoT Solution Software Training Course 16. Advanced Features
Advantech Co., Ltd. Ver. 8.0 16 - 16
13. Enter Eng Unit: DegF
14. For OverView, select Yes
15. Refer to the Analog Parameter Properties to change the other parameters as
needed.

WebAccess+ IoT Solution Software Training Course 16. Advanced Features
Advantech Co., Ltd. Ver. 8.0 16 - 17
16. Press Submit when you are finished entering Data.
Create SP Parameter
17. Select Analog Parameter Type from the Pull Down List.
18. Enter Parameter name: SP.
19. Enter a Description: Setpoint
20. Enter Address: 40001
21. Enter Eng Unit: DegF
22. For OverView, select No

WebAccess+ IoT Solution Software Training Course 16. Advanced Features
Advantech Co., Ltd. Ver. 8.0 16 - 18
23. Refer to the Analog Parameter Properties to change the other parameters as
needed.
24. Press Submit when you are finished entering Data.
Create OUT Parameter
25. Select Analog Parameter Type from the Pull Down List.
26. Enter Parameter name: SP
27. Enter a Description: Valve Output
28. Enter Address: 40002

WebAccess+ IoT Solution Software Training Course 16. Advanced Features
Advantech Co., Ltd. Ver. 8.0 16 - 19
29. Enter Eng Unit: %OPEN
30. For OverView, select No

WebAccess+ IoT Solution Software Training Course 16. Advanced Features
Advantech Co., Ltd. Ver. 8.0 16 - 20
31. Refer to the Analog Parameter Properties to change the other parameters as
needed.
32. Press Submit when you are finished entering Data.
Create AM Parameter
33. Select Discrete Parameter Type from the Pull Down List.
34. Enter Parameter name: AM
35. Enter a Description: Auto/Manual
36. Enter Address: 00001
37. Enter State0: MANUAL
38. Enter State1: AUTO

WebAccess+ IoT Solution Software Training Course 16. Advanced Features
Advantech Co., Ltd. Ver. 8.0 16 - 21
39. For OverView, select No
40. Refer to the Discrete Parameter Properties to change the other parameters as
needed.
41. Press Submit when you are finished entering Data.
42. Select the Parameter and Block Type List hyperlink when you are finished
creating Parameters.
Step 2: Create a PID Block Type
This section assumes you have already created the PARAMETERS (Meas, SP, OUT and
AM). you plan to group into a Block type.
This section assumes you have completed 5.7.1 Step 1: Create Parameters for PID Block
1. From the Parameter Set for the Modicon Device Type, select Add Block Type.

WebAccess+ IoT Solution Software Training Course 16. Advanced Features
Advantech Co., Ltd. Ver. 8.0 16 - 22
7. The Block Type Configuration Page appears.
9. Enter a Name for Your Block Type: PID

WebAccess+ IoT Solution Software Training Course 16. Advanced Features
Advantech Co., Ltd. Ver. 8.0 16 - 23
10. Check the Parameters you want group into this Block Type: MEAS, OUT, SP and
AM.
11. Select Submit when finished.
Step 3: Create PID Blocks
This section also assumes you have configured a Modicon Modbus Comport, a Modicon
Device and a PID Block type. Refer to a Step by Step Guide to creating a Comport and
Device for Modicon Modbus.
1. Expand the Port List by Clicking on the SCADA Node (Node 1 in the example).
2. Expand the list of Devices under your Comport by clicking on the Comport.
3. Drag the slider bar on the left Frame down to reveal Communication Port (e.g.
Port 3 in the example)
8. Drag the slider bar on the left Frame down to reveal Device (e.g. DemoPLC 3 in
the example).
9. Click on the Modicon Device (in the example, pick DemoPLC).
10. The Device Properties page opens. It can take some time to open all the data
tables on the Project Node / Web Server.

WebAccess+ IoT Solution Software Training Course 16. Advanced Features
Advantech Co., Ltd. Ver. 8.0 16 - 24
11. Select Add Block.
12. The Create New Block Page appears.
13. Select the PID from the pull down list for Block Type.
14. Enter a Block Name: TIC101
This will become the Tag name for your Block Tag. Block Name is up 12
alphanumeric characters. This is the name that users and operators will use
to access the data read by this tag. Typical Block Names are TIC1001,
Zone11, and ZAC61.
15. Enter a Description. PID Temperature Controller.
This helps operators to identify the tag. It will appear on the Point Info, Block
Detail and Point Detail Displays. It will also appear in the Alarm Summary and
will be read by the Text-to-Speech Alarm Annunciator.
13. Enter an Offset. For this example, enter 50.

WebAccess+ IoT Solution Software Training Course 16. Advanced Features
Advantech Co., Ltd. Ver. 8.0 16 - 25
If you planned your addresses well, you will be able to use the Block Offset
feature to create the proper addresses for all the parameters in the block with a
single keystroke.
The offset for Modbus protocol devices are a simple integer.
The Block Offset feature will increment all the addresses of all the parameters in
a block by a given amount. If your parameter addresses have a predictable
pattern, the Block Offset feature can greatly reduce the time and effort to create
blocks and establish communications with the field.
You can modify the addresses of each parameter later, if needed
14. Select Submit when finished.
15. Select the DemoPLC icon.
16. Create another Block named TIC185 (repeat steps 9 to 14).
17. Download the database to the SCADA Node.
Step 4: View the PID Blocks
18. Start the Node (if it was not already running)
19. Start View
20. Open the Point Info dialog Box
21. Scroll down (if necessary) to see the Tag Name for the Block.
22. Click on the TagName:Parameter for the Block. In this example TIC101:SP.

WebAccess+ IoT Solution Software Training Course 16. Advanced Features
Advantech Co., Ltd. Ver. 8.0 16 - 26
Step 5: Create PID Block Detail Display
This section also assumes you have configured a Modicon Modbus Comport, a Modicon
Device and a PID Block type.
Start DRAW: Create PID Block Detail Display
This section also assumes you have configured a Modicon Modbus Comport, a Modicon
Device and a PID Block type.
.
1. From the Project Manager
2. Select a Project.
3. Select the SCADA Node.

WebAccess+ IoT Solution Software Training Course 16. Advanced Features
Advantech Co., Ltd. Ver. 8.0 16 - 27
4. Right Click the Start Draw link in the Project Configuration Manager.
5. Select Open in New Window from the menu.
6. DRAW opens in a new web browser window.
7. Optionally, modify the Page color by clicking the icon .

WebAccess+ IoT Solution Software Training Course 16. Advanced Features
Advantech Co., Ltd. Ver. 8.0 16 - 28
8. Select a color from the Pallete (207 in this example).
9. Press OK.
Draw Text: Create PID Block Detail Display
Draw Text for descriptions and placeholders for dynamic data for the parameters in the
PID Block:
MEAS
SP
OUT
and AM
To draw text on a graphic display:
1. Modify the Text Settings by clicking the icon on the top toolbar.
In the example, select Arial Bold, Transparent, Yellow foreground and Black
background.
2. Select OK.
3. Click the Text icon from the Bottom Toolbar.

WebAccess+ IoT Solution Software Training Course 16. Advanced Features
Advantech Co., Ltd. Ver. 8.0 16 - 29
4. Position the Text Starting Point with the Crosshair.
5. Click once to fix the Text Start Position.
6. Type in your text using your keyboard. (For example, type "MEAS").

WebAccess+ IoT Solution Software Training Course 16. Advanced Features
Advantech Co., Ltd. Ver. 8.0 16 - 30
7. Press the ENTER key when done.
8. Repeat Steps 1 to 7 to create placeholder for the Measurement value. Type seven
characters.
For example type "9999.99".

WebAccess+ IoT Solution Software Training Course 16. Advanced Features
Advantech Co., Ltd. Ver. 8.0 16 - 31
9. To select both Text fields (i.e. SETPOINT and XXXXXX). Hold the left mouse
button down and drag a rectangle that covers both text fields.
10. Right Click ->Edit -> Align.

WebAccess+ IoT Solution Software Training Course 16. Advanced Features
Advantech Co., Ltd. Ver. 8.0 16 - 32
11. Select Align Center from Dialog Box
12. Repeat Steps 1 to 11 to create SP, OUT, and AM with placeholders fields for real-
time data, Eng. Units and Tagname.
For example type:
BLOCKNAME
MEAS 9999.99 DEGF
SP 9999.99
OUT 999.9 %OPEN
AM MANUAL

WebAccess+ IoT Solution Software Training Course 16. Advanced Features
Advantech Co., Ltd. Ver. 8.0 16 - 33
HIGH ALARM: 9999.99
LOW ALARM: 9999.99
Next Step is to animate Text.
Animate with Parameters: Create Block Detail Display
The important step in making a Block Detail Display is to use Parameter names. Do
not use Tagnames to animate text or trends. Instead, use the Parameter names of your
Block Type.
This example uses the parameters names of the PID block: MEAS, SP, OUT and AM.
This section also assumes you have configured a Modicon Modbus Comport, a Modicon
Device and a PID Block type.
To animate text in the Block Detail with real-time data:
1. Right Click -> Dynamic ->Animation
OR
Select the Dynamic icon from the upper toolbar.

WebAccess+ IoT Solution Software Training Course 16. Advanced Features
Advantech Co., Ltd. Ver. 8.0 16 - 34
2. The Animation Configuration Dialog Box appears.
3. Type the parameter name instead of TAG: MEAS.

WebAccess+ IoT Solution Software Training Course 16. Advanced Features
Advantech Co., Ltd. Ver. 8.0 16 - 35
Important - a Block Detail Display uses PARAMETER instead TAG.
4. Select R-Text radio button (R-Text = Right Justified Text).
5. Select Alarm Status.
6. Select Block Alarm.
7. Normal: Yellow
8. Alarm: Red, Flashing.
9. Ack Alarm: Red.
10. Click OK .
11. Click once on the 9999.99 text to be animated. (i.e. next to MEAS).

WebAccess+ IoT Solution Software Training Course 16. Advanced Features
Advantech Co., Ltd. Ver. 8.0 16 - 36
12. A red box should appear around the 9999.99 text signifying that the text is Dynamic.
13. Right Click -> Dynamic ->Animation OR
Select the Dynamic icon from the upper toolbar.
14. The Animation Configuration Dialog Box appears.

WebAccess+ IoT Solution Software Training Course 16. Advanced Features
Advantech Co., Ltd. Ver. 8.0 16 - 37
15. Select the Field button.
16. A list of Tag Fields opens. Drag down to the ENUNIT
17. This time, we will add the Tag Field for Engineering Units of the MEAS Parameter
to the display.
18. Click once after MEAS.
19. Click once on ENUNIT
OR, Type the parameter name with Tag Field instead of TAG: MEAS.ENUNIT
20. Select L-Text radio button (L-Text = Left Justified Text).
21. Select Alarm Status.
22. Unselect Block Alarm.
23. Normal: Yellow
24. Alarm: Yellow.

WebAccess+ IoT Solution Software Training Course 16. Advanced Features
Advantech Co., Ltd. Ver. 8.0 16 - 38
25. Ack Alarm: Yellow.
26. Click OK .
27. Click once on the DEGFXX text to be animated. (i.e. next to MEAS).
28. A red box should appear around the DEGFXX text signifying that the text is Dynamic.
29. Repeat steps 1 to 12 for SP (connect 9999.99 to SP).
30. Repeat steps 1 to 28 for OUTPUT (connect 9999.99 to OUT and %CLOSED to
OUT.ENUNIT)
31. Repeat steps 1 to 12 for AM (connect MANUAL to AM)
32. Repeat steps 13 to 28 for HIGH ALARM (connect 9999.99 to MEAS.ALMHI)
33. Repeat steps 13 to 28 for LOW ALARM (connect 9999.99 to MEAS.ALMLO)
Below is a composite showing the connections to Parameters for the Dynamic Text
Animation for the example PID Block.

WebAccess+ IoT Solution Software Training Course 16. Advanced Features
Advantech Co., Ltd. Ver. 8.0 16 - 39
34. Right Click -> Dynamic ->Trend
35. Enter the Parameter names for your PID Block in the Trend Configuration. (In the
example: MEAS, SP, OUT, AM).
36. Select OK.

WebAccess+ IoT Solution Software Training Course 16. Advanced Features
Advantech Co., Ltd. Ver. 8.0 16 - 40
37. Draw a rectangle for the Trend area.
38. Optionally, draw other animation and fields.
Review Block Parameters: Create PID Block Detail Display
Did you forget the parameters names used to create your PID Block?
1. Go to Project Manager
2. Use the slider bar in the left to see the Device Types. In this example, pick the
Modicon device.

WebAccess+ IoT Solution Software Training Course 16. Advanced Features
Advantech Co., Ltd. Ver. 8.0 16 - 41
3. The Parameter Set with Blocks listed at bottom of the page appears.

WebAccess+ IoT Solution Software Training Course 16. Advanced Features
Advantech Co., Ltd. Ver. 8.0 16 - 42
4. Select the Update hyperlink next to PID.
5. The UPDATE Block page opens listing the Parameters for the PID block: MEAS, SP,
OUT and AM
Save with *.BD1 extension: Create Block Detail Display
The Block Detail Display is saves with the BD1 extension (the first page is saved as
*.BD1, if there is a second page, its is saved as a *.BD2, third page as *.BD3, etc).
This example uses PID.BD1. You should also save the DRW file, so you can edit your
Block Detail display later.

WebAccess+ IoT Solution Software Training Course 16. Advanced Features
Advantech Co., Ltd. Ver. 8.0 16 - 43
To save a Graphic:
1. Right Click -> File -> Save BGR.
OR - Select the Save BGR Icon from the top toolbar.
2. The SAVE BGR File Dialog Box appears.
3. Type a File name that matches the Block Type with the .BD1 extension. Don't use
untitled.bgr!
For example, type PID.BD1
4. IMPORTANT! The Block Detail file name must be exactly the same as the Block
Type.
In this example, the Block Type is PID.

WebAccess+ IoT Solution Software Training Course 16. Advanced Features
Advantech Co., Ltd. Ver. 8.0 16 - 44
4. Check the Save DRW option .
5. Select Entire Drawing radio button .
6. Select OK.
7. The Save DRW dialog Box appears. Accept the default name, which is the same
as the BD1.
Be careful if you have multiple pages for the same Block Detail; you should rename
the DRW files slightly so you do not overwrite another page (for example PID.BD1
source is PID.DRW and PID.BD2 source is PIDp2.DRW). The BD1 file is a compiled
Graphic suitable for Display by the WebAccess Client. You cannot edit a BGR file.
The DRW file is the source file. You can Edit the DRW file and generate a new BGR
file. If you loose the DRW, you can never edit the file again. Save the DRW!
8. Select OK.
9. Download Block Detail graphic.

WebAccess+ IoT Solution Software Training Course Appendix
Advantech Co., Ltd. Ver. 8.0 17 - 1
Appendix
o
Related Documents


