Exploring precognition using a repetition priming paradigm. David J. Vernon 1 Acknowledgements This research was supported in part by a small grant awarded to the author by The Society for Psychical Research. A special note of thanks for help with the data coding goes to Anna Nichols-Pike and Mitra Soheili. Thanks also to the very helpful comments of the two anonymous reviewers. Affiliation 1 School of Psychology, Politics & Sociology, 1

Welcome message from author
This document is posted to help you gain knowledge. Please leave a comment to let me know what you think about it! Share it to your friends and learn new things together.
Transcript
Exploring precognition using a repetition priming
paradigm.
David J. Vernon1
Acknowledgements
This research was supported in part by a small grant awarded to the author by The Society for Psychical Research. A special note of thanks for help with the data coding goes to Anna Nichols-Pike and Mitra Soheili. Thanks also to the very helpful comments of the two anonymous reviewers.
Affiliation 1School of Psychology, Politics & Sociology,
Canterbury Christ Church University,
Canterbury, Kent.
CT1 1QU, UK.
Email: [email protected]
1
Abstract
Controversy has emerged recently over claims that future practice could retroactively
facilitate explicit recall in the here and now, with attempts to replicate such findings leading
to inconsistent results. Here it is proposed that one possibility for such ambiguous and
conflicting findings is that an explicit recall paradigm may be less sensitive to the subtle
effects of such phenomena in comparison to an implicit repetition priming paradigm, as this
does not rely on conscious processes. In addition, manipulation of a traditional repetition
priming paradigm provides an opportunity to address the additional question of whether a
single future repetition or multiple future repetitions of a stimulus would be needed to elicit a
retroactive facilitation in implicit priming, or more simply a precognitive priming effect. Pilot
work led to the development of a functional classification task and this was subsequently
used to measure possible precognitive priming effects of 102 native English speakers. The
data showed no evidence of precognitive priming when stimuli were repeated only once in
the future. However, multiple future repetitions, whilst having no effect on response
latencies, did elicit an effect on accuracy such that participants were more accurate when
responding to stimuli that would be repeated four times in the future compared to stimuli that
were not repeated. The results are discussed and some speculative possibilities are offered.
Nevertheless, the lack of robust precognitive priming effects for both response times and
accuracy means that such a result needs to be interpreted with caution.
2
Background
Some researchers have suggested that it may be possible for a future event to influence some
aspect of behaviour in the here and now (see e.g., Bem, 2011; Lobach, 2009; Mossbridge,
Tressoldi & Utts, 2012; Radin, 2004). Such unusual effects have been referred to as
presentiment (Lobach, 2009; Radin, 2004), unexplained anticipatory effects (Mossbridge,
Tressoldi & Utts, 2012) and precognition or retroactive influence (Bem, 2011).
For example, Radin (1997; 2004) used the term presentiment to describe automatic
(i.e., no need to imply any conscious awareness) changes in the human nervous system (as
measured by electrodermal activity) prior to exposure of an emotional picture. This
presentiment effect has been replicated by others (e.g., Spottiswoode & May, 2003) and been
found in other physiological measures, for instance, when monitoring functional magnetic
resonance imaging (fMRI; Bierman & Scholte, 2002) and heart rate variability (McCraty,
Atkinson & Bradley, 2004). More recently Bem (2011) reported on nine experiments
designed to test for precognition and retroactive influence. Eight of these showed the
predicted pattern of effects – that is, that some future event significantly influenced present
behaviour. This included: detection of erotic/negative images; retroactive affective priming
and retroactive facilitation of recall.
However, recent attempts to try and replicate some of these effects have been
unsuccessful. For instance, Ritchie, Wiseman and French (2012) attempted to replicate the
precognitive effects found by Bem (2011) using explicit recall. In three experiments they had
participants complete a standard memory recall test which was followed by a ‘practice’
session for half the stimuli. The aim being to see if the post-test practice would retroactively
influence explicit recall. All three experiments failed to exhibit any evidence of precognition.
A similar pattern was reported by Galak, LeBoeuf, Nelson and Simmons (2012) when they
attempted to replicate the retroactive effects Bem (2011) reported when using a free recall
task. Nevertheless, a more recent meta-analysis reports ‘decisive evidence’ (p.2) in favour of
the anomalous anticipation of random future events (Bem, Tressoldi, Rabeyron, & Duggan,
2014).
It is not clear why some seem able to elicit precognitive effects that others cannot
find. Statisticians have suggested that this may be due, in part, to the particular analysis used
by the researchers. For instance, Wagenmakers, Wetzels, Borsboom and van der Mass (2011)
re-analysed Bem’s (2011) original data using a Bayesian analysis and found no evidence in
3
favour of precognition. However, Bem, Utts and Johnson (2011) criticised this approach as
utilising an unrealistic prior which in turn led to an underestimation of the experimental
effects. A full explanation of the issues regarding the effects of distinct statistical approaches
is beyond the scope of this article but further discussion and insights can be found within the
literature (e.g., Rouder, Morey & Province, 2013; Storm, Tressoldi & Utts, 2013).
Alternatively, it may be that the original effects reported by Bem are genuine but
simply difficult to replicate. This could be due to variation in psi ability and/or the nature of
psi itself (see, Kennedy, 2003; Schiltz, Wiseman, Watt & Radin, 2006). A further possibility
is that the nature of the task influenced, and/or, interacted with the effect. For example, an
explicit recall task is reliant on conscious cognitive processes and these may overshadow or
reduce the possible influence of any psi effects. It may be that a task that relies on indirect or
implicit processes may be more amenable to exhibiting precognitive influences. Such an idea
is consistent with the suggestion that anomalous effects may be better understood and
explored using indirect or implicit measures (Bargh & Ferguson, 2000).
Hence, the aim of this research was to extend such findings by utilising an implicit
repetition priming task, which may be more susceptible/sensitive to anomalous effects given
its reliance on non-conscious processing. Also, modifying the traditional repetition priming
paradigm to include a post-test phase would make it possible to ascertain whether a single
repetition is sufficient to obtain a precognitive priming effect or whether multiple repetitions
are required. This could be important, as Bem (2011) had participants scan their ‘practice
words’ four times and it is not clear yet what, if any, effect multiple repetition of the stimuli
would have on such precognitive effects.
A standard implicit repetition priming paradigm involves two phases, a study phase
which is followed at various delay intervals by a test phase. There is a wealth of literature
within cognitive psychology showing that priming an individual with a stimulus (e.g. a word)
during the study phase will result in that individual processing the stimulus faster and more
accurately when they see it again in the later test phase, despite the fact that they need make
no conscious effort to recall the initial exposure (see e.g., Schacter, Wagner & Buckner,
2000). Hence, this project utilised this well established paradigm and reversed the direction
of focus to explore potential retroactive influences. That is, whether it is possible that
repeating a stimulus in the test phase will retroactively influence performance in the previous
study phase. In addition, by incorporating a post test phase that presented a subset of items
4
from the test phase multiple times, it would be possible to test whether additional repetitions
of a stimulus in the post-test phase would retroactively influence performance in the previous
test phase. In both cases the prediction was that participants would respond in less time and
more accurately to material in the study and test phases that they ‘will’ see again in the test
and post-test phases respectively, compared to material that is not repeated.
Pilot Study 1: Identifying a suitable priming task
An initial pilot study was developed to identify a possible priming paradigm. The aim was to
create a priming paradigm that would ensure that participant’s performance had not reached
ceiling during the test phase and as such allow for the possibility of a precognitive priming
effect when comparing response times and errors in the test phase for those items that would
be repeated in the post-test phase to those that would not. A semantic classification task was
used (i.e., classifying words as referring to either living vs. non-living objects) as this type of
implicit task typically involves using conceptual processing and requires more time than a
simple word naming task and hence was thought less likely to exhibit ceiling effects (see,
Roediger & McDermott, 1993).
Method
Participants
Fourteen participants (3 males and 11 females) aged 18-27 (mean 19.2y; SD 2.35y)
completed this initial pilot. All participants were undergraduate students from CCCU with
normal/corrected to normal vision and native English speakers.
Materials
Six main word lists, each consisting of 24 words with 12 relating to living animals and 12
words relating to non-living items, were created. All words were taken from the
SUBTLEXUS database (http://expsy.ugent.be/subtlexus) and the lists were matched for mean
word frequency using the SUBTL frequency norms (see, Brysbaert & New, 2009). Following
Bem (2011), a two-item scale was also used to assess stimulus seeking composed of the two
statements: “I am easily bored” and “I often enjoy seeing films I’ve seen before” (reverse
5
scored). Responses were recorded on 5-point scales that ranged from Very Untrue to Very
True and averaged into a single score ranging from 1 to 5. An image from the Hubble space
telescope (image reference M17: Omega Nebula) was also used alongside some relaxing new
age music (The mists of Avalon.wav). All experiments used a Super RiteMaster computer
tower installed with Windows 7 enterprise and an Intel(R) Core(TM)2 Duo CPU processor
with SuperLab 4.5 (Cedrus Corporation) presentation software and an RB-530 response pad.
Design
The eight stages in the experiment are illustrated in Figure 1. The participant first answered
the two stimulus seeking questions from Bem (2011), followed immediately followed by a 3-
minute relaxation period where the participant listened to soft music and was shown an image
from the Hubble space telescope. Ten practice trials were then completed, followed by the
study phase, which in turn was followed by a blink break, the test phase, a second blink break
and finally the post-test phase.
_______________
Figure 1 about here
_______________
Presentation of the six word lists in the conditions of the study, test and post-test phases was
completely counterbalanced, ensuring that each word list occurred equally often in the
repeated and non-repeated/new conditions, creating 12 possible variations, see Figure 2
below. This meant that within each phase (Study, Test and Post-test) participants were
exposed to a total of 96 words.
_______________
Figure 2 about here
_______________
6
Procedure
Consistent with the work of Bem all participants were made aware that the experiment tested
for ESP, although precisely how it tested for this was not explained until they had completed
the experiment. Each participant was tested individually in a quiet room. They began by
completing a consent form followed by answering the stimulus seeking questions. The
experimenter then explained the task to them (semantic classification) and allowed them the
opportunity to ask any questions. Following this, and in line with Bem’s work, and others,
computers were used to standardise the delivery of the stimuli. So, once the participants were
clear what it is they had to do the experimenter initiated the computer program and left them
alone in the room.
The computer began by showing an image taken from the Hubble space telescope and
simultaneously playing some new-age type music for 3 minutes. The aim of this was to
provide participants with a brief relaxation period prior to the experiment allowing them to
become familiar with the environment (see, Bem, 2011). At the end of this period the
computer displayed an instruction screen informing the participant that they would
subsequently be presented with a series of words and that their task was to classify the words
as relating to living or non-living objects. The computer then presented ten practice trials (5
living words and 5 non-living) not included in the other lists to ensure that participants were
clear about what was expected of them and to help them become familiar with the
expectations of the task. Participants responded by pressing one of two buttons on an RB-530
response pad (Cedrus Corporation) with the index fingers of both hands. The left-right
orientation was counterbalanced across participants to control for possible handedness
effects. At the end of this stage the computer showed a query screen which asked if the
participant had any queries/questions and if so to call in the experimenter, and if not to
simply press any key to continue. Once a key was pressed the computer moved on to the
study phase and randomly presented items from four word lists of 24 words (i.e., 96 words)
and participants responded to each item, identifying it as either ‘living’ or ‘non-living’. There
was a short blink-break before the test phase began. During this phase, the computer again
randomly presented stimuli from four word lists each containing 24 words, with two of the
word lists repeated from the study phase and two new word lists. This was again followed by
a short blink-break and then the post-test phase, in which the computer randomly presented
one of the word lists of 24 words that had been used in both the study and test phase four
times. Hence, in each phase; study, test and post-test, participants classified 96 words.
7
Ethics
Full University Faculty ethics approval was obtained for all the studies. This involved an
initial risk assessment for each study, and included obtaining written consent from all
participants and providing information assuring them that participation in the study was
entirely voluntary and that they were free to withdraw at any time, and have their data
destroyed, and that any data collected would be anonymised to protect their identity.
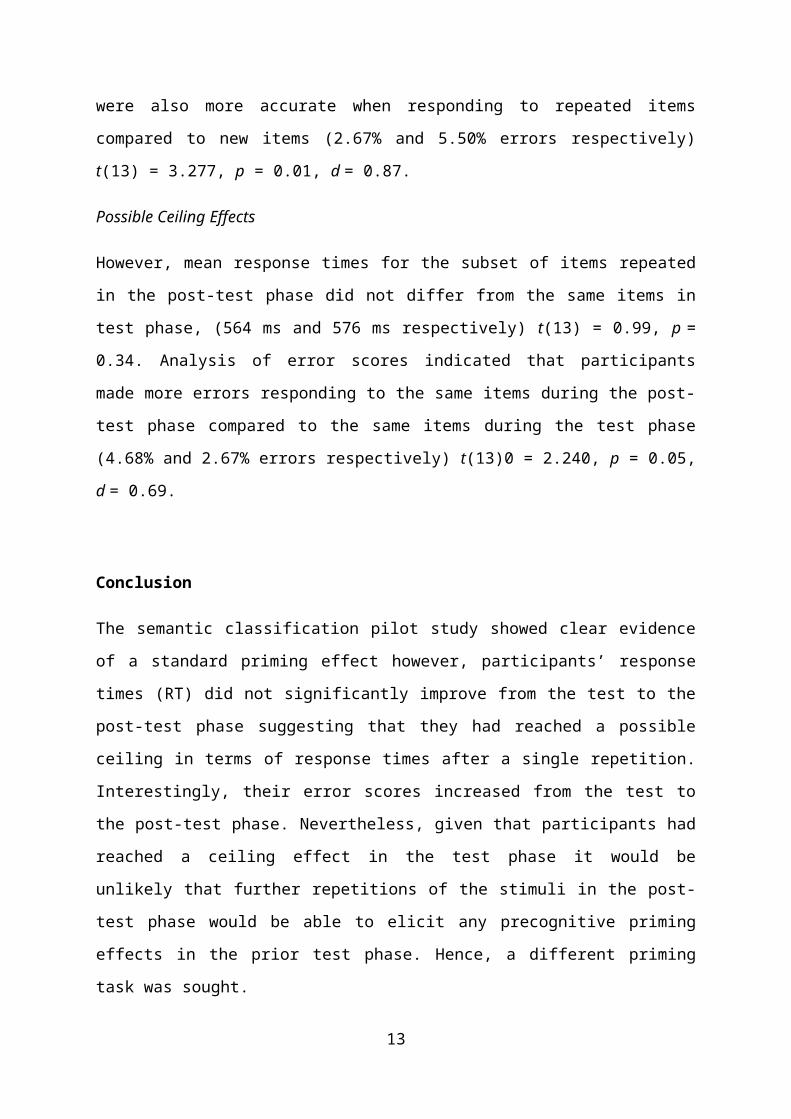
Results
The aims of this pilot were twofold. First, to test whether the paradigm was sensitive to
standard priming effects and second to ensure that a response ceiling had not been reached in
the test phase. Standard priming was measured as the difference in response times and error
scores between the two repeated word lists and the two new word lists introduced in the test
phase. Possible ceiling effects were examined by comparing response times for the list
repeated in the post-test phase with the same list presented in the previous test phase. It
should be noted that throughout this study, and the subsequent ones, two-tailed t tests were
used as these would allow for the possibility of results in the opposite direction (see Ritchie et
al., 2012).
Standard Priming Effect
A standard priming effect was found with participants responding in less time to primed
items seen in the study phase compared to new unprimed items (576.57 ms and 605.81 ms
respectively) t(13) = 5.175, p = 0.001, d = 0.35. Participants were also more accurate when
responding to repeated items compared to new items (2.67% and 5.50% errors respectively)
t(13) = 3.277, p = 0.01, d = 0.87.
Possible Ceiling Effects
However, mean response times for the subset of items repeated in the post-test phase did not
differ from the same items in test phase, (564 ms and 576 ms respectively) t(13) = 0.99, p =
0.34. Analysis of error scores indicated that participants made more errors responding to the
same items during the post-test phase compared to the same items during the test phase
(4.68% and 2.67% errors respectively) t(13)0 = 2.240, p = 0.05, d = 0.69.
8
Conclusion
The semantic classification pilot study showed clear evidence of a standard priming effect
however, participants’ response times (RT) did not significantly improve from the test to the
post-test phase suggesting that they had reached a possible ceiling in terms of response times
after a single repetition. Interestingly, their error scores increased from the test to the post-test
phase. Nevertheless, given that participants had reached a ceiling effect in the test phase it
would be unlikely that further repetitions of the stimuli in the post-test phase would be able to
elicit any precognitive priming effects in the prior test phase. Hence, a different priming task
was sought.
Pilot Study 2: A different priming task
To try and address the ceiling effects evident in the test phase response times of the semantic
classification task a functional classification task was developed, based on work showing that
this required more conceptual processing, which in turn would require more time and be less
susceptible to ceiling effects (see, Thompson-Schill & Gabrieli, 1999). This task involved the
presentation of word pairs and required participants to identify whether the two words
presented referred to objects that had the same/or similar function (e.g., apron – overall) or
not (e.g., strawberry – colander).
Method
Participants
Twelve participants (11 female and 1 male) aged 18y to 30y with a mean age of 19.3y
completed the experiment for course credits.
Materials
As before six lists were created but this time each list contained 16 word pairs, 8 functionally
similar and 8 functionally dissimilar. The mean co-occurrence ratings of each of the six lists
were matched (see, Rhode, Gonnerman & Plaut, 2008) and as before each list was rotated
through the various phases of the experiment to ensure that each word pair appeared in each
condition an equal number of times.
9
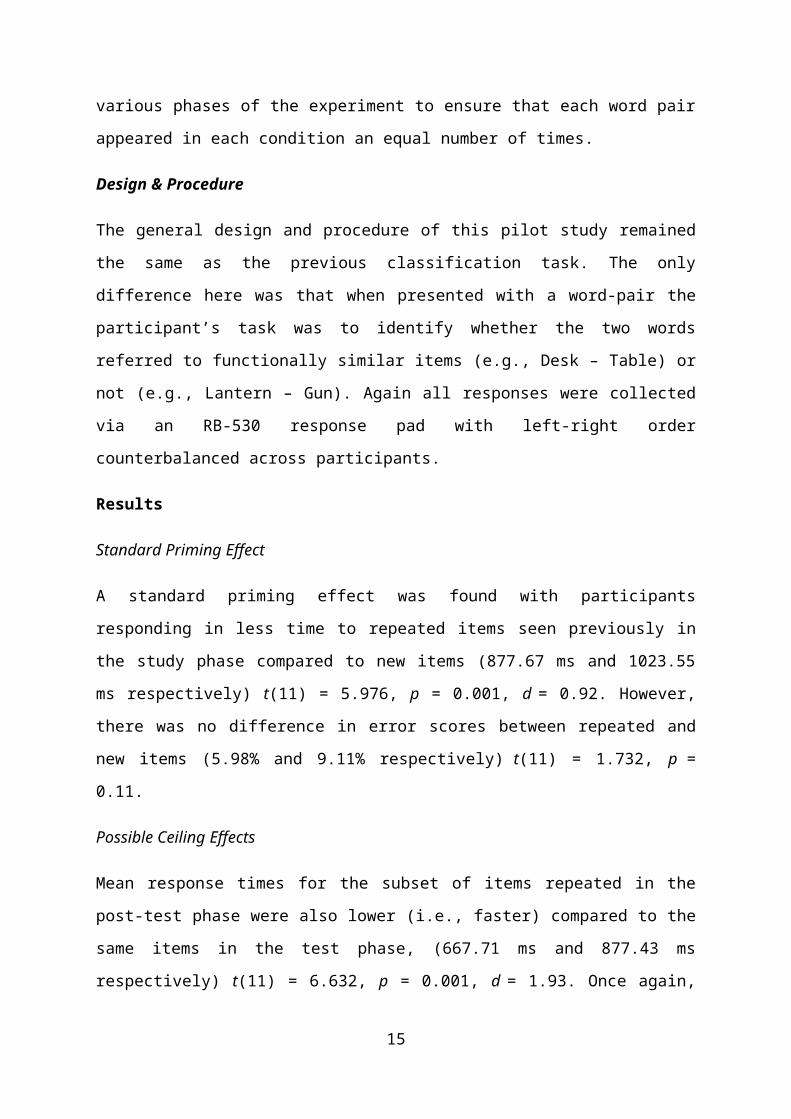
Design & Procedure
The general design and procedure of this pilot study remained the same as the previous
classification task. The only difference here was that when presented with a word-pair the
participant’s task was to identify whether the two words referred to functionally similar items
(e.g., Desk – Table) or not (e.g., Lantern – Gun). Again all responses were collected via an
RB-530 response pad with left-right order counterbalanced across participants.
Results
Standard Priming Effect
A standard priming effect was found with participants responding in less time to repeated
items seen previously in the study phase compared to new items (877.67 ms and 1023.55 ms
respectively) t(11) = 5.976, p = 0.001, d = 0.92. However, there was no difference in error
scores between repeated and new items (5.98% and 9.11% respectively) t(11) = 1.732, p =
0.11.
Possible Ceiling Effects
Mean response times for the subset of items repeated in the post-test phase were also lower
(i.e., faster) compared to the same items in the test phase, (667.71 ms and 877.43 ms
respectively) t(11) = 6.632, p = 0.001, d = 1.93. Once again, however there was no difference
in error scores between items in the test phase that were repeated in the post-test phase
(4.16% and 3.91% respectively) t(11) = 0.181, p = 0.86.
Conclusion
This pilot study clearly showed that such a paradigm would be sensitive to standard priming
effects and that a single repetition was not sufficient to elicit ceiling effects in response times.
Hence, this paradigm was adopted for the main study.
10
MAIN STUDY
Participants
Given the effect sizes reported by Bem (2011) an opportunity sampling approach was utilised
and the main functional classification task was conducted on a separate population of 1021
participants (26 Male, 76 Female), aged 18y to 39y (Mean age of 19.9y). All participants
were native English speakers had normal or corrected to normal vision and were either paid a
fee of £5 or received course credits for taking part.
Method
The design remained the same as in previous pilot task.
Results
Data from the study phase and the test phase was analysed separately. Response time data
and error data were also analysed separately. Consistent with Bem’s (2011) approach
repeated measures t tests were used to compare means in order to keep the analysis simple
and transparent. However, unlike Bem two-tailed tests were used as these would allow for the
possibility of results in the opposite direction (see Ritchie et al., 2012).
In the study phase precognitive priming was measured as the difference in response time and
accuracy between the word lists that were subsequently repeated in the test phase and the lists
that were not repeated (see Figure 3a).
_______________
Figures 3a-3c about here
_______________
1 Based on the small effect size of the retroactive influence reported by Bem (2011) d = 0.29 and adopting the
standard alpha criterion of 0.05 (two-tailed), coupled with a test that has the statistical power of 0.8, the required
sample size can be calculated using Howell’s (1996) sample calculation, where power of 0.8 as a function of
significance at 0.05 (two-tailed) translates into a δ score of 2.80 (Appendix Power Tables from Howell, 1996).
Hence, N = (2.80/0.29) 2 gives: 9.652 which equals 93. Thus, a minimum of 93 participants was required.
11
The test phase involved conducting multiple comparisons which raises the risk of a Type 1
error and a useful way of dealing with this possibility is to include an alpha correction such as
the Bonferroni procedure (Howell, 1996). However, a simple blanket approach to using the
Bonferroni correction for multiple comparisons can produce very conservative criterion
levels and increase the risk of a Type 2 error (see, Field, 2009). A traditional approach to
dealing with this issue is to utilise the Bonferroni correction in a staged or stepwise manner
where the alpha correction is incorporated at each additional stage of the procedure (de Cani,
1984; Rosenthal & Rubin, 1984). With such an approach it has been suggested that the order
of the comparisons could influence the results and as such the order should reflect the
importance to the theory of the confirming presence or absence of a possible effect (see, de
Cani, 1984). Hence, the two comparisons made in the test phase are made in the order of
testing for multiple precognitive priming followed by standard priming. Where multiple
precognitive priming was measured as the difference in response time and accuracy between
the list that was repeated four times in the post-test phase and the list that was not repeated
(Figure 3b). Standard priming effects were examined in the test phase by comparing the
difference in response time and accuracy between the repeated word lists (i.e., Primes in the
test phase) and non-repeated lists (Figure 3c). Correlations were also conducted between
participants’ stimulus seeking scores and any indication of precognitive priming.
Precognitive Priming
Response Times
In the study phase, there was no difference in RTs between items that were later repeated and
those that were not (1053 ms and 1056 ms respectively) t(101) = 0.385, p = 0.701 (see Table
1).
Error Scores
There was no difference in participants’ errors when classifying items that were subsequently
repeated compared to those that were not (9.28% and 8.91% respectively) t(101) = 0.491, p =
0.624.
12
_______________
Table 1 about here
_______________
Multiple Precognitive Priming
Response Times
In the test phase, there was no difference in RTs between items that were later repeated and
those that were not (901.2 ms and 906.3 ms respectively) t(101) = 0.641, p = 0.523.
Error Scores
Participants made fewer errors when classifying items that were subsequently repeated
compared to those that were not (4.47% and 6.25% respectively) t(101) = 2.450, p = 0.016, d
= 0.26 (see Table 2). Error scores for both the repeated and non-repeated, as well as the
difference between the two, were compared with stimulus seeking scores to assess whether
there was any correlation. No significant correlations emerged between stimulus seeking
scores and error scores for the repeated items (r(102) = 0.062, p = 0.536), non-repeated items
(r(102) = -0.058, p = 0.564), or the differences between the two (r(102) = -0.109, p = 0.276).
_______________
Table 2 about here
_______________
Standard Priming
Response Times
In the test phase, participants were faster to respond to repeated items compared to new items
(903.7 ms and 1047.5 ms respectively) t(101) = 18.676, p < 0.001, d = 0.82 (see Table 3).
13
Error Scores
Participants made fewer errors when classifying items that were repeated compared to those
that were not (5.36% and 9.37% respectively) t(101) = 6.460, p < 0.001, d = 0.68.
_______________
Table 3 about here
_______________
DISCUSSION
The aims of this study were to ascertain whether single or multiple repetitions of a
stimulus at some future stage would influence implicit memory, as measured by repetition
priming, in the here and now. Two pilot studies were developed to ensure that the final
paradigm would be sufficiently sensitive to exhibit traditional priming in the test phase and
that such performance did not exhibit a ceiling effect in the test phase. Thereby providing for
the possibility of future stimulus repetitions to have a reverse time effect. However, when
looking at the response times of the main study there was no evidence of any precognitive
priming effect in either the study or the test phase, although a standard priming effect in the
test phase is robustly evident. Nevertheless, when looking at accuracy performance in the test
phase an anomalous pattern does emerge. In the test phase participants were more accurate
when classifying items that would be repeated in the subsequent post-test phase compared to
those that were not.
As such, data from the study phase would suggest that a single repetition of material
in the future is insufficient to elicit evidence of a precognitive priming effect. Such a finding
is consistent with previous attempts that have failed to find evidence of retroactive facilitation
of recall following multiple practice attempts (Galak et al., 2012; Ritchie et al., 2012) and
extends their work to show that a single future repetition is also insufficient. The failure of
the main study to show any evidence of precognitive priming for response times when
material is repeated multiple times in the future is also consistent with this view and may fit
with the interpretation that such effects are merely the result of statistical and/or
14
methodological artifacts (e.g., Wagenmakers et al., 2011). However, an anomalous pattern
emerged for the error data in the test phase and whilst the author would wish to abide by the
principle of Occam’s razor he would not wish to be accused of using Occam’s broom.
Occam’s Razor vs. Occam’s Broom
Most people should be familiar with the concept of Occam’s razor or the principle of
parsimony. However, Occam's broom is a somewhat more recent conceit, attributable to
Sydney Brenner, and embodies the principle whereby inconvenient facts are swept under the
carpet in the interests of a clear interpretation of a messy reality (see Robertson, 2009).
Hence, some account should be offered for the anomalous pattern of error data seen in the
test phase.
The anomalous effect in error scores in the test phase is suggestive of a precognitive
priming effect. That such an effect was not evident in the initial study phase would suggest
that multiple repetitions are required to elicit such an effect, a pattern that would be consistent
with previous work (see, Bem, 2003). Of course it remains an open question as to the nature
of the relationship between the number of repetitions and the strength of the effect.
Nevertheless, it is not clear why no precognitive priming effects were evident in the response
time data and this could be taken to suggest that response times and accuracy may rely on
distinct aspects of processing and as such may be differentially influenced by possible
precognitive effects. For instance, early views of response times as a dependent variable of
memory performance have argued that response time data is a more sensitive measure of
behavioural change than errors (see e.g., Wearing & Montague, 1970). Furthermore, analysis
of the standard priming effects from the main study here shows robust priming of both
response times and error scores, and interestingly the effect size for response times is greater
than that for errors. This would be consistent with the notion that response times are a more
sensitive indicator of behavioural change compared to errors.
However, others have suggested that accuracy may at times be more sensitive than
latency and that accuracy and speed of responses may in fact tap distinct aspects of memory
(MacLeod & Nelson, 1984). This in part is influenced by the nature of memory itself, that is,
whether memory is unidimensional or multidimensional. If an intervention elicits an
empirical outcome on error probability that is distinct and/or different from that measured by
15
latency it is tempting to suggest that this may be due to the multidimensional nature of
memory. Indeed, MacLeod and Nelson (1984) have argued that different ‘processes can
affect these two dependent variables in qualitatively different ways’ (p.230). Thus, accuracy
and latency may not represent indices of a single underlying dimension of memory. If this is
the case then the aspect of memory represented by accuracy may be more susceptible to
precognitive influences as compared to that aspect responsible for the speed of a response.
However, it should be noted that this is a speculative possibility and that more work and
further replications of this effect are needed before such a tentative possibility can be
accepted.
A further speculative possibility is that the processes involved in precognition may be
distinct from those that support implicit memory. Whilst there is no single accepted view of
the basis of implicit memory researchers have suggested that it may be supported by the
automatic activation of pre-existing representations (Graf & Mandler, 1984) and/or the
overlap in processing operations carried out at study and at test (Morris, Bransford & Franks,
1977; Roediger, 1990). Hence, precognitive priming could be based on the similarity in
processing operations between the phases of experiment reported here, simply operating in a
reversed temporal direction. However, given that the basis of precognition is as yet unknown
such proposals are speculative and need to be interpreted with caution. As such, a possible
reason why no clear precognitive priming effects were evident in this study is that the nature
of precognition is distinct from and reliant upon different processes to that of implicit
memory.
Whilst robust precognitive priming effects were not obtained in this study such a
result should not be taken to indicate that such an effect is either not possible or simply
unobtainable using this paradigm. The lack of a robust precognitive priming effect may have
been influenced by a range of other mediating factors such as the specific stimuli used, the
gender of the participants as well as their personal beliefs. For instance, the stimuli used here
were simple everyday words relating to specific objects (e.g., apron – overall) and research
has suggested that precognitive effects may be proportional to the physiological impact of the
stimuli used (Lobach, 2009). The argument here is that stimuli that elicit stronger feelings of
pleasure and/or discomfort may be better suited to producing precognitive effects. In
addition, others have shown that females may be more sensitive to precognitive effects
compared to males (see, Radin & Lobach, 2007). Furthermore, it has been shown that
individuals who believe in psi phenomenon may exhibit greater psi performance compared to
16
their more sceptical counterparts (see e.g., Walsh & Moddel, 2007). Hence, future research
could utilise this implicit priming paradigm and incorporate these points to further explore
the possibility of precognitive priming.
Of course, a potentially more parsimonious explanation is that the anomaly in the
error scores for the test phase may simply represent a Type I error. Whilst a Bonferroni
correction was utilised when additional comparisons were made in a stepwise fashion it is
important, given the potential interpretation placed on the anomalous error scores, to realise
that such a correction merely reduces the probability of Type I errors, it does not preclude
them. Furthermore, the fact that there were no differences in error scores in the second pilot
study lends weight to the notion that this could simply be a spurious effect.
17
References
Bargh, J.A., & Ferguson, M.J. (2000). Beyond behaviourism: on the automaticity of higher mental processes. Psychological Bulletin, 126, 925–945.
Bem, D.J. (2003). Precognitive habituation: Replicable evidence for a process of anomalous cognition. Paper presented at the meeting of the Parapsychological Association, Vancouver, British Columbia, Canada.
Bem, D.J. (2011). Feeling the future: experimental evidence for anomalous retroactive influences on cognition and affect. Journal of Personality and Social Psychology, 100, 407–425.
Bem, D.J., Tressoldi, P., Rabeyron, T., & Duggan, M. (2014). Feeling the future: a meta-analysis of 90 experiments on the anomalous anticipation of random future events. (SSRNScholarlyPaper No.ID2423692). Rochester, NY: Social Science Research Network. Available online at: http:// papers.ssrn.com/abstract=2423692
Bem, D.J., Utts, J., & Johnson, W.O. (2011). Must psychologists change the way they
analyse their data? A response to Wagenmakers, Wetzels, Borsboom & van der Maas (2011).
Journal of Personality and Social Psychology, 101,716–719.
Bierman, D.J., & Scholte, H.S. (2002). Anomalous anticipatory brain activation preceding
exposure of emotional and neutral pictures. Proceedings of the 45th Annual Convention of the
Parasychological Association, 25.
Brysbaert, M., & New, B. (2009). Moving beyond Kučera and Francis: A critical evaluation
of current word frequency norms and the introduction of a new and improved word frequency
measure for American English. Behavior Research Methods, 41, 977–990.
de Cani, J.S. (1984). Balancing Type 1 risk and loss of power in ordered Bonferroni
procedures. Journal of Educational Psychology, 76, 1035–1037.
Field, A. (2009). Discovering Statistics Using SPSS 3rd Ed. London: Sage.
Galak, J., LeBoeuf, R. A., Nelson, L. D., & Simmons, J. P. (2012). Correcting the past:
Failures to replicate psi. Journal of Personality and Social Psychology, 103, 933–948.
Graf, P., & Mandler, G. (1984). Activation makes words more accessible, but not necessarily
more retrievable. Journal of Verbal Learning and Verbal Behaviour, 23, 533–568.
Howell, D.C. (1996). Statistical methods for psychology 3rd Ed. California: Wadsworth.
18
Kennedy, J. E. (2003). The capricious, actively evasive, unsustainable nature of psi: A
summary and hypotheses. Journal of Parapsychology, 67, 53–74.
Lobach, E. (2009). Presentiment research: Past, present and future. In C.A. Roe, L. Coly, &
W. Kramer (Eds) Utrecht II: Charting the future of Parapsychology (pp. 22-45). New York,
NY: Parapsychology Foundation.
MacLeod, C.M., & Nelson, T.O. (1984). Response latency and response accuracy as
measures of memory. Acta Psychologica, 57(3), 215–235.
McCraty, R., Atkinson, M., & Bradley, R.T. (2004). Electrophysiological Evidence of
Intuition: Part 2. A System-Wide Process? The Journal of Alternative and Complementary
Medicine. 10(2), 325–336.
Morris, C.D., Bransford, J.D., & Franks, J.J. (1977). Levels of processing versus transfer
appropriate processing. Journal of Verbal Learning and Verbal Behaviour, 16, 519–533.
Mossbridge, J., Tressoldi, P., & Utts, J. (2012). Predictive physiological anticipation
preceding seemingly unpredictable stimuli: a meta-analysis. Frontiers in Psychology,
Volume 3, Article 390, doi: 10.3389/fpsyg.2012.00390
Radin, D.I. (1997). Unconscious perception of future emotions: an experiment in presentiment. Journal of Scientific Exploration, 11, 163–180.
Radin, D.L. (2004). Electrodermal presentiments of future emotions. Journal of Scientific
Exploration, 18, 253–273.
Radin, D., & Lobach, E. (2007). Toward understanding the placebo effect: investigating a
possible retrocausal factor. The Journal of Alternative and Complementary Medicine, 13(7),
733–739.
Rhode, D.L.T., Gonnerman, L.M., & Plaut, D.C. (2004). An improved method for deriving
word meaning from lexical co-occurrence. Cognitive Psychology, 7,573–605.
Ritchie, S.J., Wiseman, R., & French, C.C. (2012). Failing the future: Three unsuccessful
attempts to replicate Bem’s ‘retroactive facilitation of recall’ effect. PLoS one, 7(3), e33423.
Robertson, M. (2009). Ockham’s broom: A new series. Journal of Biology, 8, 79.
19
Roediger, H.L. (1990). Implicit memory: retention without remembering. American
Psychologist, 45, 1043–1056.
Roediger, H.L., & McDermott, K.B. (1993). Implicit memory in normal human subjects. Handbook of Neuropsychology, 8, 63–63.
Rosenthal, R., & Rubin, D.B. (1984). Multiple contrasts and ordered Bonferroni procedures.
Journal of Educational Psychology, 76, 1028–1034.
Rouder, J.N., Morey, R.D., & Province, J.M. (2013). A Bayes factor meta-analysis of recent extrasensory perception experiments: Comment on Storm, Tressoldi, and Di Risio (2010). Psychological Bulletin, 139(1), 241–247.
Schacter, D.L., Wagner, A.D., & Buckner, R.L. (2000). Memory systems of 1999. In
Tulving, E., & Craik, F.I.M. (Eds), The Oxford handbook of memory, (pp. 627-643). New
York, NY: Oxford University Press.
Schlitz, M., Wiseman, R., Watt, C., & Radin, D. (2006). Of two minds: Sceptic‐proponent
collaboration within parapsychology. British Journal of Psychology, 97(3), 313–322.
Spottiswoode, S.J.P., & May, E.C. (2003). Skin conductance prestimulus response: Analyses,
artifacts and a pilot study. Journal of Scientific Exploration, 17, 617–641.
Storm, L., Tressoldi, P.E., & Utts, J. (2013). Testing the Storm et al. (2010) meta-analysis
using Bayesian and frequentist approaches: Reply to Rouder et al. (2013). Psychological
Bulletin, 139(1), 248–254.
Thompson-Schill, S.L., & Gabrieli, J.D. (1999). Priming of visual and functional knowledge
on a semantic classification task. Journal of Experimental Psychology: Learning, Memory,
and Cognition, 25(1), 41.
Walsh, K., & Moddel, G. (2007). Effect of belief on psi performance in a card guessing task.
Journal of Scientific Exploration, 21(3), 501–510.
Wagenmakers, E.J., Wetzels, R., Borsboom, D., & Van Der Maas, H.L. (2011). Why
psychologists must change the way they analyze their data: the case of psi: comment on Bem
(2011). Journal of Personality and Social Psychology, 100, 426–432.
20
Wearing, A.J., & Montague, W.E.A. (1970). A test for the Battig procedure for controlling
the level of individual item learning in paired-associate lists. Behaviour Research Methods &
Instrumentation, 2, 9–10.
21
Figure 1. The eight stages of the experiment.
22
3-mins of relaxing music with image
Completion of stimulus seeking items
10 practice trials
STUDY PHASE
Blink break
TEST PHASE
Blink break
POST TEST PHASE
Figure 2. Rotation of the six word lists (each containing 24 words) through conditions, with
total number of words presented in each condition.
23
Study Phase Test Phase Post Test Phase
Repeated Not Repeated Repeated New Repeated x4Word lists 1 2 3 4 1 2 5 6 1Word lists 1 2 3 4 1 2 5 6 2Word lists 1 2 5 6 1 2 3 4 1Word lists 1 2 5 6 1 2 3 4 2Word lists 3 4 1 2 3 4 5 6 3Word lists 3 4 1 2 3 4 5 6 4Word lists 3 4 5 6 3 4 1 2 3Word lists 3 4 5 6 3 4 1 2 4Word lists 5 6 1 2 5 6 3 4 5Word lists 5 6 1 2 5 6 3 4 6Word lists 5 6 3 4 5 6 1 2 5Word lists 5 6 3 4 5 6 1 2 6
Total wordsper condition
48 48 48 48 96
Study Phase Test Phase Post Test Phase
Word list 1 Same word list 1
Same word list 1
x 4
Word list 2 Same word list 2
Word list 3 New word list 5
Word list 4 New word list 6
Figure 3a. Precognitive priming;
Study Phase Test Phase Post Test Phase
Word list 1 Same word list 1
Same word list 1
x 4
Word list 2 Same word list 2
Word list 3 New word list 5
Word list 4 New word list 6
Figure 3b. Multiple precognitive priming.
Study Phase Test Phase Post Test Phase
Word list 1 Same word list 1
Same word list 1
x 4
Word list 2 Same word list 2
Word list 3 New word list 5
Word list 4 New word list 6
Figure 3c. Standard priming.
24
Study Phase
Repeated Not Repeated
Mean RT (SD) 1053.44 (202.4)ms 1056.16 (201.8)ms
Mean % Error (SD) 9.28% (6.9%) 8.91% (6.6%)
Table 1. Mean response times (in milliseconds) and percentage errors with standard
deviations in parenthesis for repeated and not-repeated conditions in the Study phase.
25
Test Phase
Repeated Not Repeated
Mean RT (SD) 901.22 (157.5) 906.33 (165.7)
Mean % Error (SD) 4.47% (5.4%) 6.25% (7.9%)
Table 2. Mean response times (in milliseconds) and percentage errors with standard
deviations in parenthesis for test phase items that were repeated again in the later post-test
phase and not repeated in the post-test phase.
26
Test Phase
Repeated New
Mean RT (SD) 903.77 (156.6)ms 1047.53 (193.9)ms
Mean % Error (SD) 5.36% (5.7%) 9.37% (5.9%)
Table 3. Mean response times (in milliseconds) and percentage errors with standard
deviations in parenthesis for items repeated from the previous study phase (i.e., primed) and
new items not seen in the previous study phase.
27
Related Documents