Kevin Chuba Adam Dastup Human Geog-1400 17Sep2014 • How would you describe the pattern of world population density? Patterns in population densities appear next to coastal regions and large bodies of water. This image show high population densities in Asia. • Who created this data, and what sources did they use? Map Images by jcalkins_eoe Last Modified: November 23, 2011. Population data sources included national population censuses, the United Nations demographic yearbooks, and others. • What is one reason you can think of for the difference between the population densities in northern India compared to that of Nepal?

Welcome message from author
This document is posted to help you gain knowledge. Please leave a comment to let me know what you think about it! Share it to your friends and learn new things together.
Transcript

Kevin ChubaAdam DastupHuman Geog-140017Sep2014
• How would you describe the pattern of world population density?Patterns in population densities appear next to coastal regions and large bodies of water. This
image show high population densities in Asia.
• Who created this data, and what sources did they use?Map Images by jcalkins_eoe Last Modified: November 23, 2011. Population data sources
included national population censuses, the United Nations demographic yearbooks, and others.
• What is one reason you can think of for the difference between the population densities in northern India compared to that of Nepal?
Nepal, is at much higher elevation making it a harder places to live. Farming is more difficult in Nepal which does not allow for huge population growths.
• Use the Measure tool and determine the distance between the area of highest population density in India to the area of lowest population density in Nepal. Be sure to note the distance units you are using (miles or kilometers).

The distance was only about 400 miles from the highest population density in India to the lowest in Nepal.
How do you think the dense settlement here may have an effect on the ecoregions of this area?
I think that human degradation of these areas will lead to desertification and the soil will no longer be able to yield crops.
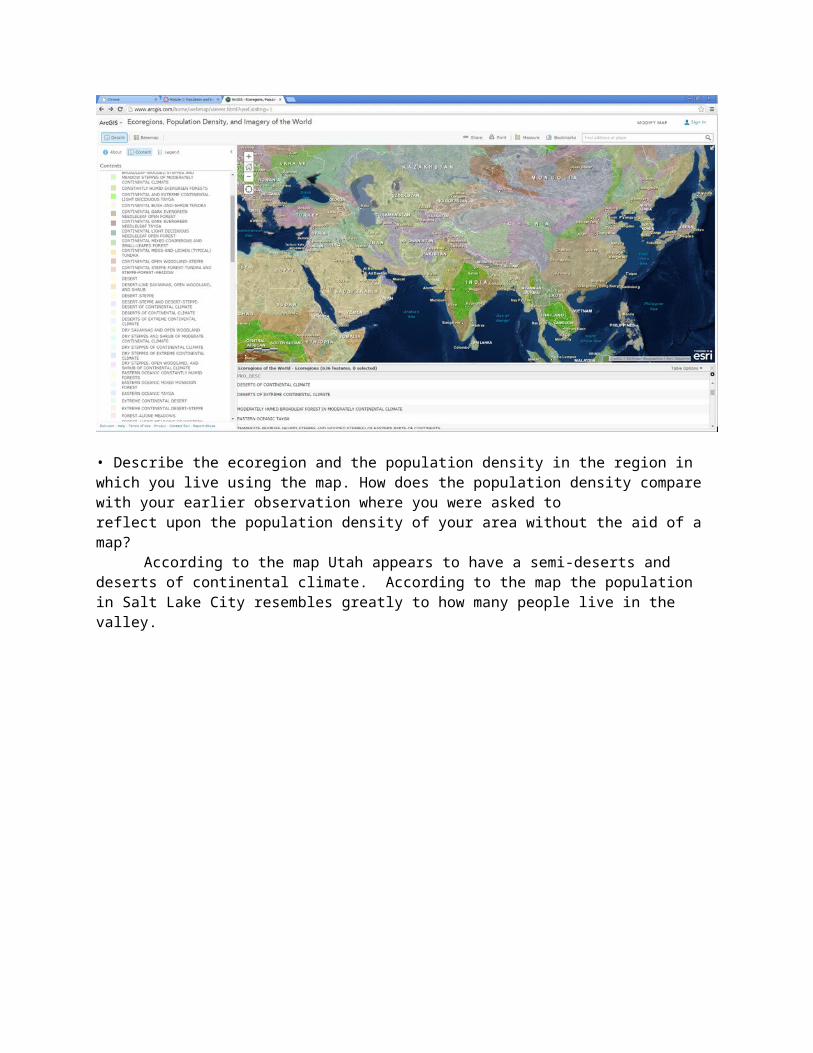
• Describe the ecoregion and the population density in the region in which you live using the map. How does the population density compare with your earlier observation where you were asked to reflect upon the population density of your area without the aid of a map?
According to the map Utah appears to have a semi-deserts and deserts of continental climate. According to the map the population in Salt Lake City resembles greatly to how many people live in the valley.

• Countries with a higher growth rate typically have a lower percentage of working age population.
• Why do you suppose the growth rate and percentage of working age population are related in the way that you've indicated here?
Places with a higher growth rate typically don’t need to work at an older age. The rise in population allows for the elders to retire earlier than places where there is not people to take over the jobs that need to be done.
• What impact do you think a high population growth rate has on a country?I think there is too many people in the world. So a country that has a higher growth rate will
consume more natural resources and increase human degradation to that country.
• Recall your recent reading about map projections. This map uses the Web Mercator projection. How are the areas near the North and South Pole shown on this map?
In this Mercator projection the north and South Pole are shown to cover the entire layout of the map
• How does the projection that this map is using affect your interpretation of what you are studying?This projection alters where countries really are compared to a globe.
What is the predominant tapestry segment for your state?Rural Resort Dwellers is the predominant Tapestry segement.
What is the tapestry segment of your neighborhood or a neighborhood you are interested in?
Industrious urban fringe.• Would you say that the tapestry segment describes you accurately? Does it describe some of your neighbors? Does the segment description make you laugh, or laugh nervously?
Yes there are numerous industries in Glendale. Yes my Neighbors are low income and probably work in factories.
The segment only makes me laugh because I had no idea that this data was available.
• What influence does the map scale have on the data you are analyzing?I found that the map needs to be zoomed in a lot in order to get a better visual for the different
segments.
Related Documents