~ 18 ~ International Journal of Mosquito Research 2014; 1 (3): 18-25 ISSN: 2348-5906 CODEN: IJMRK2 IJMR 2014; 1 (3): 18-25 © 2014 IJMR Received: 10-06-2014 Accepted: 21-07-2014 M.Palaniyandi Remote Sensing & GIS Laboratory, Vector Control Research Centre, (ICMR), Indira Nagar, Medical complex, Pondicherr-605006, India. For Correspondence: M.Palaniyandi Remote Sensing & GIS Laboratory, Vector Control Research Centre, (ICMR), Indira Nagar, Medical complex, Pondicherr-605006, India. Email: [email protected] Web mapping GIS: GPS under the GIS umbrella for Aedes species dengue and chikungunya vector mosquito surveillance and control M. Palaniyandi Abstract The mosquito nuisance and the mosquito borne diseases have become major important challenging public health problems in India especially in the fast developing city like Pondicherry urban agglomeration. The Pondicherry government has been implemented full-fledged mosquito control measures, however, dengue and chikungunya epidemics was accelerating trend in Pondicherry for the recent years, and therefore, the directorate of public health, Pondicherry was requested vector control research centre (VCRC), to conduct a mosquito control evaluation survey. A team of field staff of VCRC headed by the author, Pondicherry, have conducted a detailed reconnaissance survey for collecting the site specifications of houses and the streetwise mosquito data for analyzing the density of vector mosquitoes in the wards / blocks and delineating the areas vulnerable to disease epidemics in the urban areas. The GPS GARMIN 12 XL was used to collect the field data. The ARC GIS 10.0 software was used to map the site locations (houses) with mosquito’s data. The digital map of block boundary of Pondicherry was used for mapping purpose. A systematic grid sampling was applied to conduct a rapid survey for mapping Aedes species mosquito genic condition in the urban areas and the coordinates of sites of house information with breeding habitats positive in the grid sectors was collected using GPS, and the mean value of positive habitats was analyzed by quintiles method for mapping. The four blocks were selected for Aedes mosquito survey where the mosquito problem was identified as comparatively high, four numbers of wards were selected from each block, and the 40 number of houses was selected with 100 meter interval distance for mosquito breeding survey in the domestic and peripheral domestic areas in each wards. The problematic areas were identified, highlighted and recommended for web mapping GIS for Aedes mosquito surveillance continuously for monitoring the mosquito control measures in the Pondicherry urban areas and the other parts of the urban areas in the country. Keywords: Aedes mosquito, dengue, chikungunya, systematic grid sampling, web mapping GIS. 1. Introduction The environmental determinants have been creating conducing environment and manmade factors were responsible for the occurrences of disease epidemics across the country, especially, dengue and chikungunya with thousands of cases and hundreds of deaths annually. [1-3, 6-13, 20-25] The chikungunya epidemic was showing spatially declining trend, however, it was replaced with dengue epidemic and it was steadily increased to become very serious threat to the public. [6-13, 19- 25] The both dengue and chikungunya have been transmitted by the Aedes genus (Aedes aegypti or Ae. Albopictus) vector mosquito. [6, 19] The environmental aspects were responsible for the occurrences of disease epidemics across the country and it has become public health important problems and has increasingly very serious threat to the public year by years, [6-13, 15, 19, 25] and therefore, the present study is designed for developing a GIS based systematic surveillance tool for epidemic control. Therefore, the urgent need of chikungunya & dengue surveillance and health information management for disease epidemic control in India, using GIS based rapid techniques [6-13] . The web mapping GIS API technology has been mushrooming globally and most importantly, the web mapping GIS for dengue surveillance [6, 9, 13, 16] is needed to the public health monitoring in India, and hence, the health programmers has used the health information from health GIS websites to enable them to make use of the health information management to the disease control [6, 9, 13, 16] . The web mapping GIS for dengue surveillance is needed to monitoring the dengue and chikungunya epidemics in India. The web mapping GIS technology is not only assisting to updating and mapping the disease prevalence of dengue cases but, also becoming important disease surveillance and public health information management, perhaps, decision making for controlling the dengue epidemics in India as it has become the national important [6, 9, 13, 16] .

Welcome message from author
This document is posted to help you gain knowledge. Please leave a comment to let me know what you think about it! Share it to your friends and learn new things together.
Transcript
~ 18 ~
International Journal of Mosquito Research 2014; 1 (3): 18-25 ISSN: 2348-5906 CODEN: IJMRK2 IJMR 2014; 1 (3): 18-25 © 2014 IJMR Received: 10-06-2014 Accepted: 21-07-2014 M.Palaniyandi Remote Sensing & GIS Laboratory, Vector Control Research Centre, (ICMR), Indira Nagar, Medical complex, Pondicherr-605006, India. For Correspondence: M.Palaniyandi Remote Sensing & GIS Laboratory, Vector Control Research Centre, (ICMR), Indira Nagar, Medical complex, Pondicherr-605006, India. Email: [email protected]
Web mapping GIS: GPS under the GIS umbrella for Aedes species dengue and chikungunya vector
mosquito surveillance and control
M. Palaniyandi Abstract The mosquito nuisance and the mosquito borne diseases have become major important challenging public health problems in India especially in the fast developing city like Pondicherry urban agglomeration. The Pondicherry government has been implemented full-fledged mosquito control measures, however, dengue and chikungunya epidemics was accelerating trend in Pondicherry for the recent years, and therefore, the directorate of public health, Pondicherry was requested vector control research centre (VCRC), to conduct a mosquito control evaluation survey. A team of field staff of VCRC headed by the author, Pondicherry, have conducted a detailed reconnaissance survey for collecting the site specifications of houses and the streetwise mosquito data for analyzing the density of vector mosquitoes in the wards / blocks and delineating the areas vulnerable to disease epidemics in the urban areas. The GPS GARMIN 12 XL was used to collect the field data. The ARC GIS 10.0 software was used to map the site locations (houses) with mosquito’s data. The digital map of block boundary of Pondicherry was used for mapping purpose. A systematic grid sampling was applied to conduct a rapid survey for mapping Aedes species mosquito genic condition in the urban areas and the coordinates of sites of house information with breeding habitats positive in the grid sectors was collected using GPS, and the mean value of positive habitats was analyzed by quintiles method for mapping. The four blocks were selected for Aedes mosquito survey where the mosquito problem was identified as comparatively high, four numbers of wards were selected from each block, and the 40 number of houses was selected with 100 meter interval distance for mosquito breeding survey in the domestic and peripheral domestic areas in each wards. The problematic areas were identified, highlighted and recommended for web mapping GIS for Aedes mosquito surveillance continuously for monitoring the mosquito control measures in the Pondicherry urban areas and the other parts of the urban areas in the country. Keywords: Aedes mosquito, dengue, chikungunya, systematic grid sampling, web mapping GIS.
1. Introduction The environmental determinants have been creating conducing environment and manmade factors were responsible for the occurrences of disease epidemics across the country, especially, dengue and chikungunya with thousands of cases and hundreds of deaths annually. [1-3, 6-13, 20-25] The chikungunya epidemic was showing spatially declining trend, however, it was replaced with dengue epidemic and it was steadily increased to become very serious threat to the public. [6-13, 19-
25] The both dengue and chikungunya have been transmitted by the Aedes genus (Aedes aegypti or Ae. Albopictus) vector mosquito. [6, 19] The environmental aspects were responsible for the occurrences of disease epidemics across the country and it has become public health important problems and has increasingly very serious threat to the public year by years, [6-13, 15, 19, 25] and therefore, the present study is designed for developing a GIS based systematic surveillance tool for epidemic control. Therefore, the urgent need of chikungunya & dengue surveillance and health information management for disease epidemic control in India, using GIS based rapid techniques [6-13]. The web mapping GIS API technology has been mushrooming globally and most importantly, the web mapping GIS for dengue surveillance [6, 9, 13, 16] is needed to the public health monitoring in India, and hence, the health programmers has used the health information from health GIS websites to enable them to make use of the health information management to the disease control [6, 9, 13, 16]. The web mapping GIS for dengue surveillance is needed to monitoring the dengue and chikungunya epidemics in India. The web mapping GIS technology is not only assisting to updating and mapping the disease prevalence of dengue cases but, also becoming important disease surveillance and public health information management, perhaps, decision making for controlling the dengue epidemics in India as it has become the national important [6, 9,
13, 16].
~ 19 ~
International Journal of Mosquito Research Volume 1 Issue 3 (2014)
2. Dengue and Chikungunya epidemics in India The dengue epidemic cases and the mortality caused by dengue and dengue hemorrhagic fever (DHF) has become daily news nowadays in India [6, 9, 13, 19]. The report of dengue and DHF has been reported from 24 states with thousands of cases and hundreds of deaths annually [6, 13, 19]. A large scale chikungunya epidemic cases were reported in 213 districts with 14,277 clinically confirmed cases across the country during 2012, especially in South India. The epidemic was showing spatially declining trend, however, it was replaced with the epidemics of dengue in 24 states / union territories of India with 37,070 cases and 227 deaths during 2012, and it was steadily increased to become very serious threat to the public [6, 13, 19]. Since, a huge chickunqunea epidemic was reported during 2006, [4, 6, 13] a team of experts of vector control research centre, ICMR has visited the affected areas for chickunqunea epidemic investigation. It was observed that there was an intermittent of southwest monsoon precipitation during the hot summer, perhaps, there was an irregular supply of drinking water and supplied once in a week or 10 days, and hence, the village people have practice of drinking water storage using big plastic container / cement container [1-3, 5, 6,
13]. A huge number of domestic animals were found as which are known hidden host (monkey, buffalo, donkey, dog, cat, rat, cow, goat, etc.,) of dengue and chickunqunea virus load [1-19,
25]. A survey on mosquitoes control evaluation was conducted
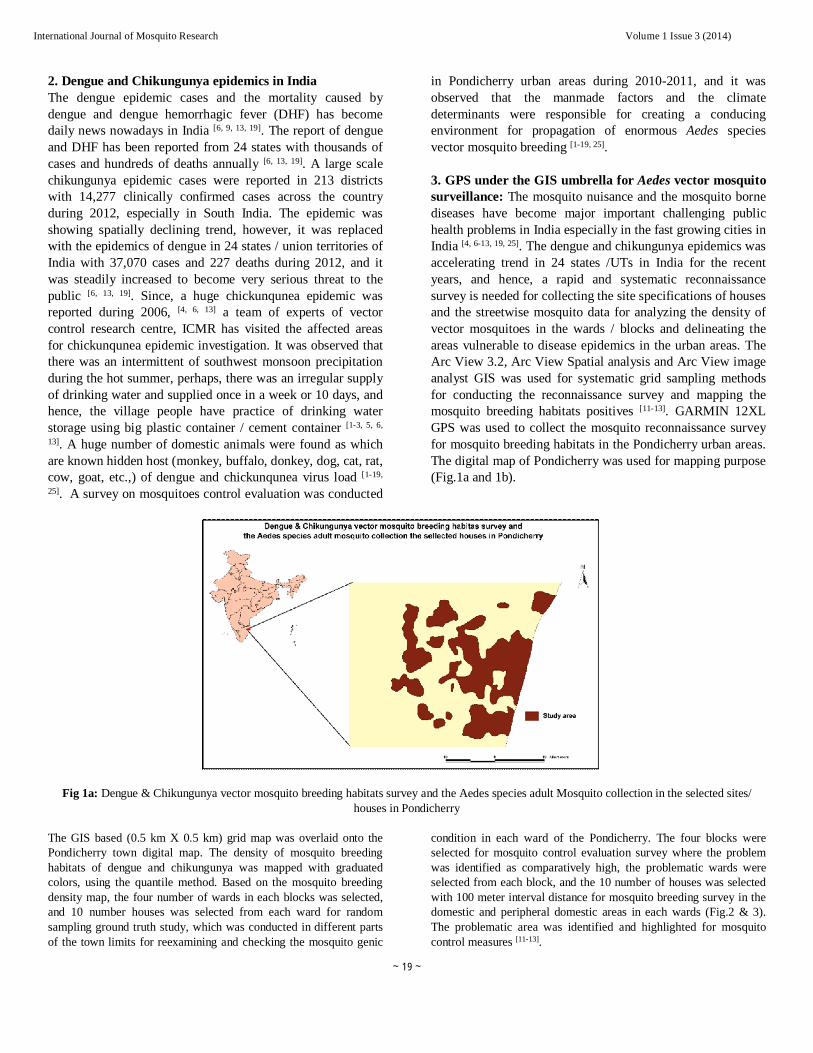
in Pondicherry urban areas during 2010-2011, and it was observed that the manmade factors and the climate determinants were responsible for creating a conducing environment for propagation of enormous Aedes species vector mosquito breeding [1-19, 25]. 3. GPS under the GIS umbrella for Aedes vector mosquito surveillance: The mosquito nuisance and the mosquito borne diseases have become major important challenging public health problems in India especially in the fast growing cities in India [4, 6-13, 19, 25]. The dengue and chikungunya epidemics was accelerating trend in 24 states /UTs in India for the recent years, and hence, a rapid and systematic reconnaissance survey is needed for collecting the site specifications of houses and the streetwise mosquito data for analyzing the density of vector mosquitoes in the wards / blocks and delineating the areas vulnerable to disease epidemics in the urban areas. The Arc View 3.2, Arc View Spatial analysis and Arc View image analyst GIS was used for systematic grid sampling methods for conducting the reconnaissance survey and mapping the mosquito breeding habitats positives [11-13]. GARMIN 12XL GPS was used to collect the mosquito reconnaissance survey for mosquito breeding habitats in the Pondicherry urban areas. The digital map of Pondicherry was used for mapping purpose (Fig.1a and 1b).
Fig 1a: Dengue & Chikungunya vector mosquito breeding habitats survey and the Aedes species adult Mosquito collection in the selected sites/
houses in Pondicherry
The GIS based (0.5 km X 0.5 km) grid map was overlaid onto the Pondicherry town digital map. The density of mosquito breeding habitats of dengue and chikungunya was mapped with graduated colors, using the quantile method. Based on the mosquito breeding density map, the four number of wards in each blocks was selected, and 10 number houses was selected from each ward for random sampling ground truth study, which was conducted in different parts of the town limits for reexamining and checking the mosquito genic
condition in each ward of the Pondicherry. The four blocks were selected for mosquito control evaluation survey where the problem was identified as comparatively high, the problematic wards were selected from each block, and the 10 number of houses was selected with 100 meter interval distance for mosquito breeding survey in the domestic and peripheral domestic areas in each wards (Fig.2 & 3). The problematic area was identified and highlighted for mosquito control measures [11-13].
~ 20 ~
International Journal of Mosquito Research Volume 1 Issue 3 (2014)
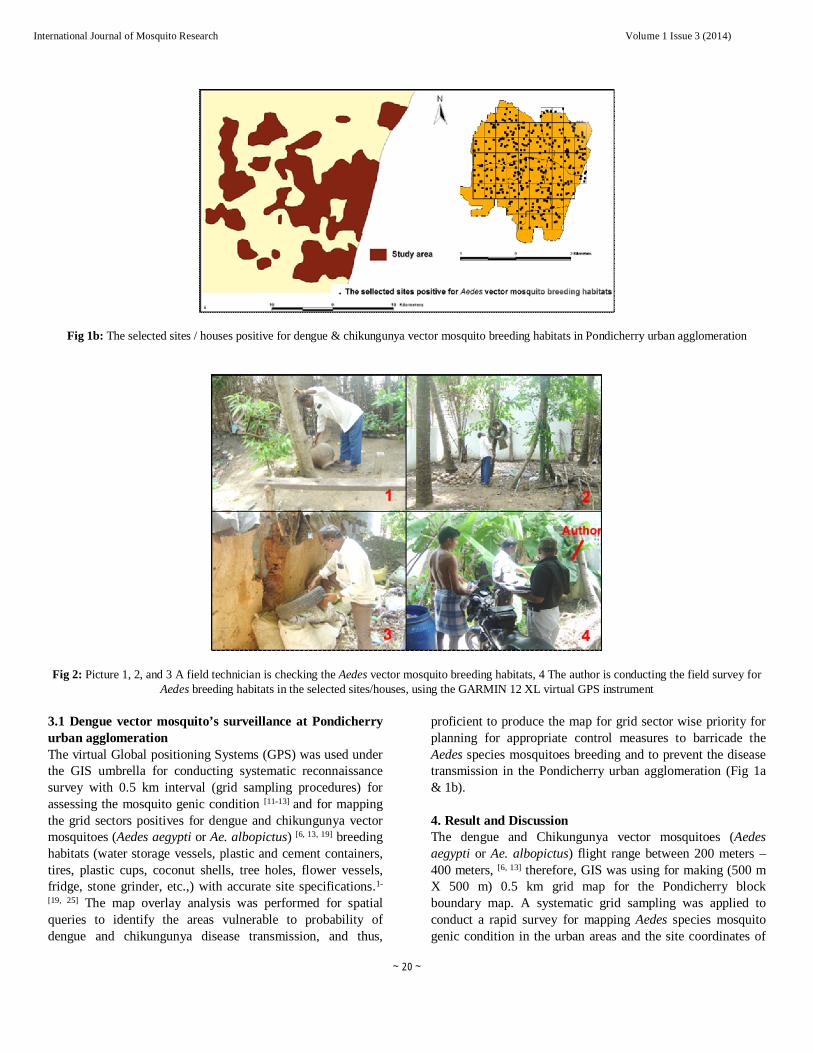
Fig 1b: The selected sites / houses positive for dengue & chikungunya vector mosquito breeding habitats in Pondicherry urban agglomeration
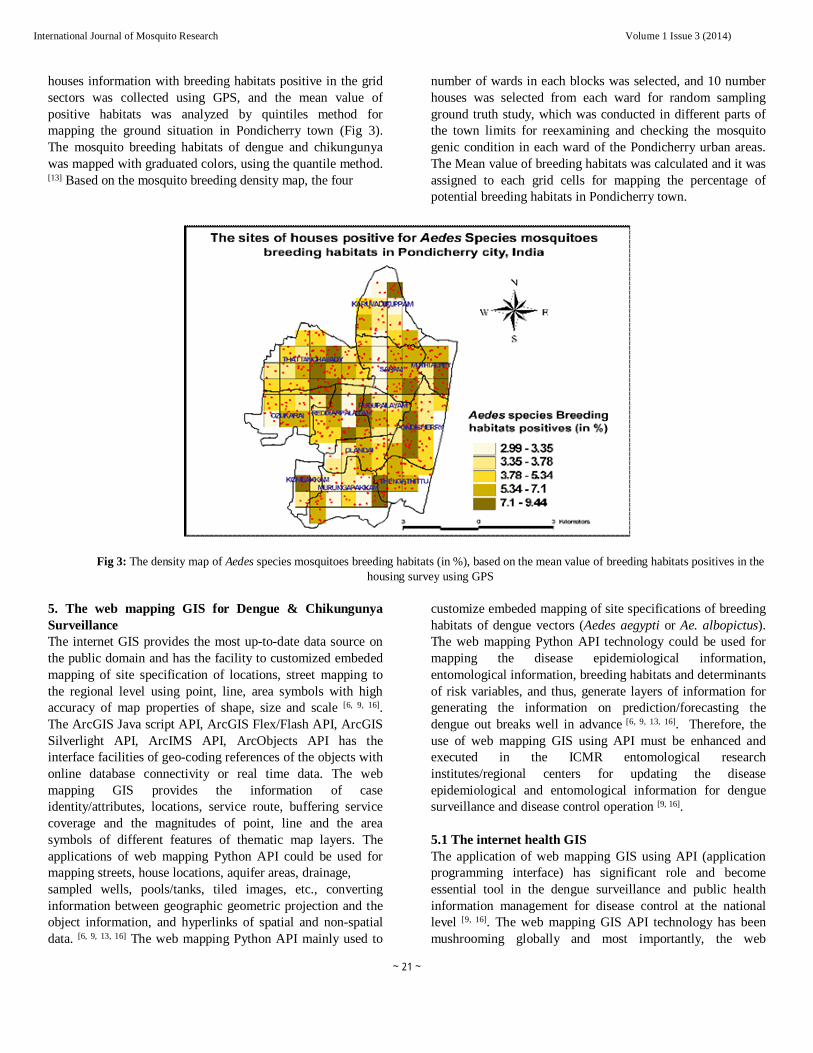
Fig 2: Picture 1, 2, and 3 A field technician is checking the Aedes vector mosquito breeding habitats, 4 The author is conducting the field survey for Aedes breeding habitats in the selected sites/houses, using the GARMIN 12 XL virtual GPS instrument
3.1 Dengue vector mosquito’s surveillance at Pondicherry urban agglomeration The virtual Global positioning Systems (GPS) was used under the GIS umbrella for conducting systematic reconnaissance survey with 0.5 km interval (grid sampling procedures) for assessing the mosquito genic condition [11-13] and for mapping the grid sectors positives for dengue and chikungunya vector mosquitoes (Aedes aegypti or Ae. albopictus) [6, 13, 19] breeding habitats (water storage vessels, plastic and cement containers, tires, plastic cups, coconut shells, tree holes, flower vessels, fridge, stone grinder, etc.,) with accurate site specifications.1-
[19, 25] The map overlay analysis was performed for spatial queries to identify the areas vulnerable to probability of dengue and chikungunya disease transmission, and thus,
proficient to produce the map for grid sector wise priority for planning for appropriate control measures to barricade the Aedes species mosquitoes breeding and to prevent the disease transmission in the Pondicherry urban agglomeration (Fig 1a & 1b). 4. Result and Discussion The dengue and Chikungunya vector mosquitoes (Aedes aegypti or Ae. albopictus) flight range between 200 meters – 400 meters, [6, 13] therefore, GIS was using for making (500 m X 500 m) 0.5 km grid map for the Pondicherry block boundary map. A systematic grid sampling was applied to conduct a rapid survey for mapping Aedes species mosquito genic condition in the urban areas and the site coordinates of
~ 21 ~
International Journal of Mosquito Research Volume 1 Issue 3 (2014)
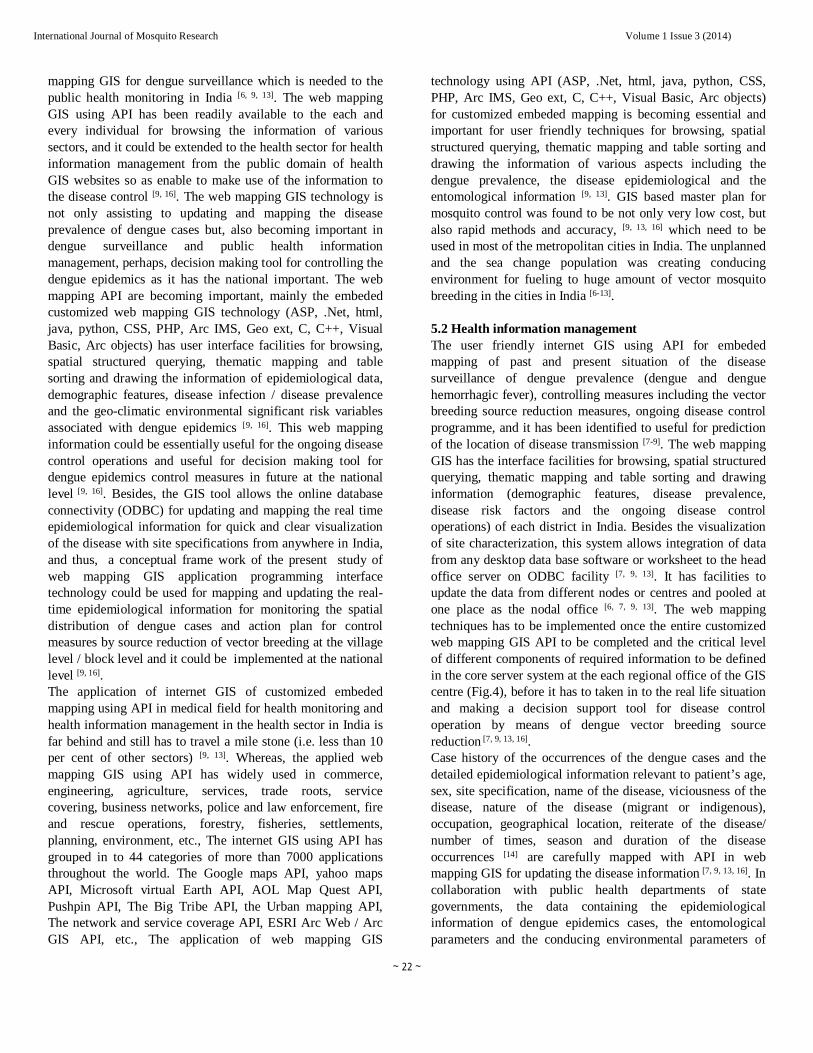
houses information with breeding habitats positive in the grid sectors was collected using GPS, and the mean value of positive habitats was analyzed by quintiles method for mapping the ground situation in Pondicherry town (Fig 3). The mosquito breeding habitats of dengue and chikungunya was mapped with graduated colors, using the quantile method. [13] Based on the mosquito breeding density map, the four
number of wards in each blocks was selected, and 10 number houses was selected from each ward for random sampling ground truth study, which was conducted in different parts of the town limits for reexamining and checking the mosquito genic condition in each ward of the Pondicherry urban areas. The Mean value of breeding habitats was calculated and it was assigned to each grid cells for mapping the percentage of potential breeding habitats in Pondicherry town.
Fig 3: The density map of Aedes species mosquitoes breeding habitats (in %), based on the mean value of breeding habitats positives in the
housing survey using GPS
5. The web mapping GIS for Dengue & Chikungunya Surveillance The internet GIS provides the most up-to-date data source on the public domain and has the facility to customized embeded mapping of site specification of locations, street mapping to the regional level using point, line, area symbols with high accuracy of map properties of shape, size and scale [6, 9, 16]. The ArcGIS Java script API, ArcGIS Flex/Flash API, ArcGIS Silverlight API, ArcIMS API, ArcObjects API has the interface facilities of geo-coding references of the objects with online database connectivity or real time data. The web mapping GIS provides the information of case identity/attributes, locations, service route, buffering service coverage and the magnitudes of point, line and the area symbols of different features of thematic map layers. The applications of web mapping Python API could be used for mapping streets, house locations, aquifer areas, drainage, sampled wells, pools/tanks, tiled images, etc., converting information between geographic geometric projection and the object information, and hyperlinks of spatial and non-spatial data. [6, 9, 13, 16] The web mapping Python API mainly used to
customize embeded mapping of site specifications of breeding habitats of dengue vectors (Aedes aegypti or Ae. albopictus). The web mapping Python API technology could be used for mapping the disease epidemiological information, entomological information, breeding habitats and determinants of risk variables, and thus, generate layers of information for generating the information on prediction/forecasting the dengue out breaks well in advance [6, 9, 13, 16]. Therefore, the use of web mapping GIS using API must be enhanced and executed in the ICMR entomological research institutes/regional centers for updating the disease epidemiological and entomological information for dengue surveillance and disease control operation [9, 16].
5.1 The internet health GIS The application of web mapping GIS using API (application programming interface) has significant role and become essential tool in the dengue surveillance and public health information management for disease control at the national level [9, 16]. The web mapping GIS API technology has been mushrooming globally and most importantly, the web
~ 22 ~
International Journal of Mosquito Research Volume 1 Issue 3 (2014)
mapping GIS for dengue surveillance which is needed to the public health monitoring in India [6, 9, 13]. The web mapping GIS using API has been readily available to the each and every individual for browsing the information of various sectors, and it could be extended to the health sector for health information management from the public domain of health GIS websites so as enable to make use of the information to the disease control [9, 16]. The web mapping GIS technology is not only assisting to updating and mapping the disease prevalence of dengue cases but, also becoming important in dengue surveillance and public health information management, perhaps, decision making tool for controlling the dengue epidemics as it has the national important. The web mapping API are becoming important, mainly the embeded customized web mapping GIS technology (ASP, .Net, html, java, python, CSS, PHP, Arc IMS, Geo ext, C, C++, Visual Basic, Arc objects) has user interface facilities for browsing, spatial structured querying, thematic mapping and table sorting and drawing the information of epidemiological data, demographic features, disease infection / disease prevalence and the geo-climatic environmental significant risk variables associated with dengue epidemics [9, 16]. This web mapping information could be essentially useful for the ongoing disease control operations and useful for decision making tool for dengue epidemics control measures in future at the national level [9, 16]. Besides, the GIS tool allows the online database connectivity (ODBC) for updating and mapping the real time epidemiological information for quick and clear visualization of the disease with site specifications from anywhere in India, and thus, a conceptual frame work of the present study of web mapping GIS application programming interface technology could be used for mapping and updating the real-time epidemiological information for monitoring the spatial distribution of dengue cases and action plan for control measures by source reduction of vector breeding at the village level / block level and it could be implemented at the national level [9, 16]. The application of internet GIS of customized embeded mapping using API in medical field for health monitoring and health information management in the health sector in India is far behind and still has to travel a mile stone (i.e. less than 10 per cent of other sectors) [9, 13]. Whereas, the applied web mapping GIS using API has widely used in commerce, engineering, agriculture, services, trade roots, service covering, business networks, police and law enforcement, fire and rescue operations, forestry, fisheries, settlements, planning, environment, etc., The internet GIS using API has grouped in to 44 categories of more than 7000 applications throughout the world. The Google maps API, yahoo maps API, Microsoft virtual Earth API, AOL Map Quest API, Pushpin API, The Big Tribe API, the Urban mapping API, The network and service coverage API, ESRI Arc Web / Arc GIS API, etc., The application of web mapping GIS
technology using API (ASP, .Net, html, java, python, CSS, PHP, Arc IMS, Geo ext, C, C++, Visual Basic, Arc objects) for customized embeded mapping is becoming essential and important for user friendly techniques for browsing, spatial structured querying, thematic mapping and table sorting and drawing the information of various aspects including the dengue prevalence, the disease epidemiological and the entomological information [9, 13]. GIS based master plan for mosquito control was found to be not only very low cost, but also rapid methods and accuracy, [9, 13, 16] which need to be used in most of the metropolitan cities in India. The unplanned and the sea change population was creating conducing environment for fueling to huge amount of vector mosquito breeding in the cities in India [6-13].
5.2 Health information management The user friendly internet GIS using API for embeded mapping of past and present situation of the disease surveillance of dengue prevalence (dengue and dengue hemorrhagic fever), controlling measures including the vector breeding source reduction measures, ongoing disease control programme, and it has been identified to useful for prediction of the location of disease transmission [7-9]. The web mapping GIS has the interface facilities for browsing, spatial structured querying, thematic mapping and table sorting and drawing information (demographic features, disease prevalence, disease risk factors and the ongoing disease control operations) of each district in India. Besides the visualization of site characterization, this system allows integration of data from any desktop data base software or worksheet to the head office server on ODBC facility [7, 9, 13]. It has facilities to update the data from different nodes or centres and pooled at one place as the nodal office [6, 7, 9, 13]. The web mapping techniques has to be implemented once the entire customized web mapping GIS API to be completed and the critical level of different components of required information to be defined in the core server system at the each regional office of the GIS centre (Fig.4), before it has to taken in to the real life situation and making a decision support tool for disease control operation by means of dengue vector breeding source reduction [7, 9, 13, 16]. Case history of the occurrences of the dengue cases and the detailed epidemiological information relevant to patient’s age, sex, site specification, name of the disease, viciousness of the disease, nature of the disease (migrant or indigenous), occupation, geographical location, reiterate of the disease/ number of times, season and duration of the disease occurrences [14] are carefully mapped with API in web mapping GIS for updating the disease information [7, 9, 13, 16]. In collaboration with public health departments of state governments, the data containing the epidemiological information of dengue epidemics cases, the entomological parameters and the conducing environmental parameters of
~ 23 ~
International Journal of Mosquito Research Volume 1 Issue 3 (2014)
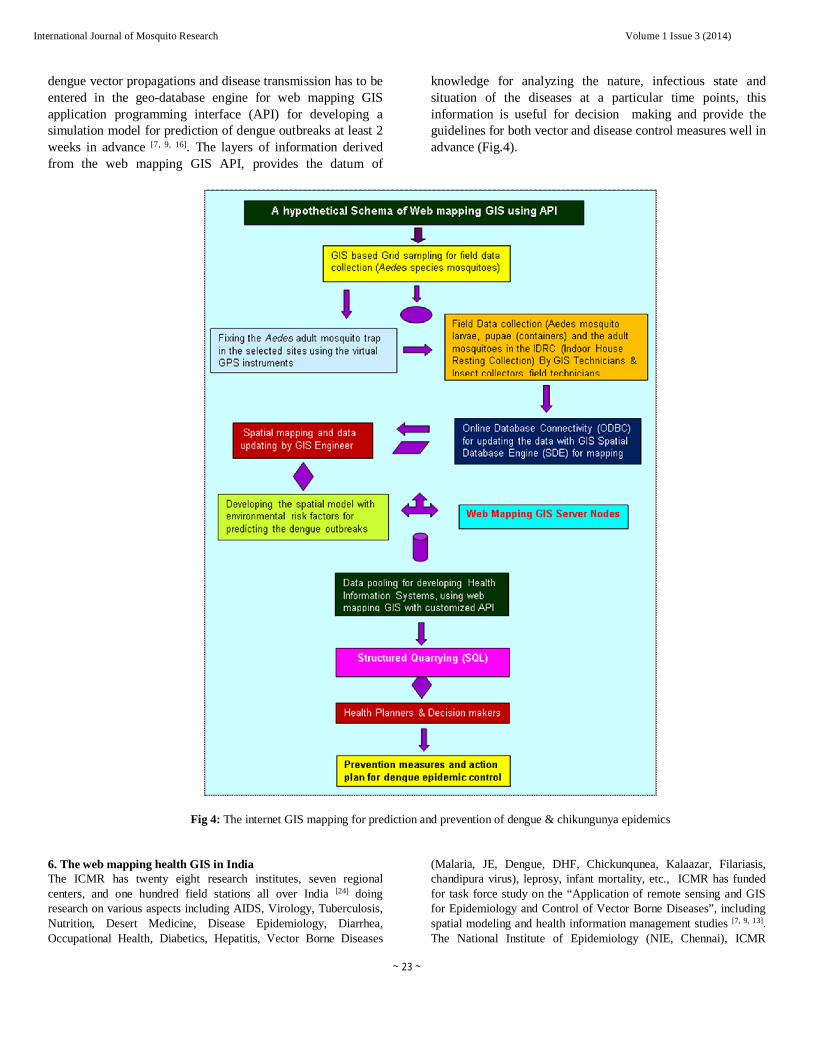
dengue vector propagations and disease transmission has to be entered in the geo-database engine for web mapping GIS application programming interface (API) for developing a simulation model for prediction of dengue outbreaks at least 2 weeks in advance [7, 9, 16]. The layers of information derived from the web mapping GIS API, provides the datum of
knowledge for analyzing the nature, infectious state and situation of the diseases at a particular time points, this information is useful for decision making and provide the guidelines for both vector and disease control measures well in advance (Fig.4).
Fig 4: The internet GIS mapping for prediction and prevention of dengue & chikungunya epidemics 6. The web mapping health GIS in India The ICMR has twenty eight research institutes, seven regional centers, and one hundred field stations all over India [24] doing research on various aspects including AIDS, Virology, Tuberculosis, Nutrition, Desert Medicine, Disease Epidemiology, Diarrhea, Occupational Health, Diabetics, Hepatitis, Vector Borne Diseases
(Malaria, JE, Dengue, DHF, Chickunqunea, Kalaazar, Filariasis, chandipura virus), leprosy, infant mortality, etc., ICMR has funded for task force study on the “Application of remote sensing and GIS for Epidemiology and Control of Vector Borne Diseases”, including spatial modeling and health information management studies [7, 9, 13]. The National Institute of Epidemiology (NIE, Chennai), ICMR
~ 24 ~
International Journal of Mosquito Research Volume 1 Issue 3 (2014)
institute has conducted a series of four national workshops on GIS application to epidemiological mapping funded by ICMR during September 2010 – February 2011 and it is appreciatively recorded that there are 146 members (GIS users, GIS specialist / GIS experts, biostatisticians, entomologist, epidemiologist) participated from all over the country [3]. However, the systems is lacking with controlling the disease epidemics especially dengue, JE and malaria. The present situation need a plan for control operation in place in advance where the problem of vectors and the occurrence of dengue epidemics in India. Therefore, the ICMR perhaps, strengthen the GIS laboratory in each institutes of ICMR with experienced GIS specialist/GIS experts for web mapping GIS using API customized embeded mapping of disease prevalence, entomological parameters, sources of vector breeding habitats, epidemiological information, environmental and climatic risk factors associated with disease epidemics [7, 9, 13, 16]. The virtual global positioning systems (GPS) instruments were using for collecting the information on the site specifications of breeding sources of dengue vectors and dengue hemorrhagic fever (DHF) victims nearer to the host availability with real time, reliable and high accuracy. This information must be updated every 2 weeks/ fortnight of the every month and updating the field data in the web mapping GIS [7, 9, 13, 16]. The web mapping Python API mainly used to customize embeded mapping of GPS based information of dengue vector breeding habitats, tiled images of remote sensing data, converting information between geographic site specifications of the information relevant to dengue vector breeding sources / habitats with the geographic links of coordinate of geometric projection [7, 9,
13]. Thus, the current situations the disease problems could be analyzed and given solutions for precaution measures and action plan for controlling the dengue outbreaks, and hence, forecasting the site specification of the horizontal and vertical magnitudes of dengue transmission in India. The highlight of web mapping customized API was recommended for dengue and chikungunya epidemic surveillance and control in the country [7, 9, 13, 16].
7. Conclusion The virtual GPS under the GIS umbrella was used to conduct a rapid survey with 0.5 km distance interval (grid sampling procedures) for assessing the mosquito genic condition and for mapping the sectors positives for dengue and chikungunya vector mosquitoes (Aedes aegypti or Ae. albopictus) breeding habitats (water storage vessels, plastic and cement containers, tires, plastic cups, coconut cells, tree holes, flower vessels, fridge, stone grinder, etc.,) with accurate site specifications. To beyond the all these problems, the available GIS technique was found useful and has provided the datum of useful guidelines for giving priority with site specification of the areas to fixing the adult Aedes mosquitoes trap with less than one km distance interval for Aedes species adult mosquito collection, and making awareness among the people for source reduction of mosquito breeding to control the present situation and management of the dengue epidemics in the Pondicherry urban areas. In the urban situation, the GPS and GIS based site selection was made to fixing the adult Aedes mosquitoes trap with one km distance interval for Aedes species adult mosquito collection, and the data was updated for web mapping and dengue health information management for taking prevention measures to dengue epidemic control. It was concluded that the GIS based surveillance is the best solution for epidemic control and disease management of the present situation of dengue epidemic in the country.
8. References
1. Acharya A, Goswami K, Srinath S, Goswami A. Awareness about dengue syndrome and related preventive practices amongst residents of an urban resettlement colony of south Delhi. Journal of Vector Borne Diseases 2005; 42:122-127.
2. Almeida AS, Rde AM, Valencia LI. Spatial analysis of dengue and the socioeconomic context of the city of Rio de Janeiro (Southeastern Brazil). Rev Saude Publica 2009; 43(4):666-73.
3. Hassan MK, Kumar L. Assessing the risk for dengue fever based on socioeconomic and environmental variables in a geographical information system environment. Geospatial Health 2012; 6(2):171-176.
4. Krishnamoorthy K, Harichandirakumar KT, Krishnakumari A, das LK. Burden of chikungunya in India: estimates of disability adjusted life years (DALY) lost in 2006 epidemics. Journal of Vector Borne Disases 2009; 46:26-35.
5. Anh PL, Nguyena BC, Archie CA, Clements BC, Jason AL, Jeffery C et al. Abundance and prevalence of Aedes aegypti immatures and relationships with household water storage in rural areas in southern Viet Nam, International Health 2011; 3:115-25.
6. Palaniyandi M. The environmental aspects of dengue and chikungunya outbreaks in India: GIS for epidemic control, International Journal of Mosquito Research 2014; 1(2):38-44.
7. Palaniyandi M. Revolutionalising Epidemiology with GIS. India Geospatial Digest 2014, 1-6.
8. Palaniyandi M. GIS for disease surveillance and health information management in India. Geospatial Today 2014; 13(5):44-46.
9. Palaniyandi M. GIS for epidemic control in India. Geospatial World Weekly, (GIS e-newsletter) 2013; 28:1-4.
10. Palaniyandi M. Remote sensing and GIS for mapping the geographical distributions and the ecological aspects of vector borne diseases in India: review article. Journal of GIS India, 2013, 22, 1, 4-7.
11. Palaniyandi M. A systematic grid sampling for dengue surveillance and control, using GIS: a case study, Pondicherry City, India. International Journal of Remote Sensing and Geomatics 2014.
12. Palaniyandi M. GIS based site selection for fixing UV light adult mosquito trap and gravity adult mosquito trap for epidemic control in the urban settlements. International Journal of Scientific and Technology Research 2014 (in press).
13. Palaniyandi M. Invited paper presentation on GIS for dengue surveillance and health care management in India at the National Symposium on Climate Change and Disease Dynamics. held at Government Arts College (Autonomous), 612 001, Tamil Nadu, India, 2014.
14. Winch PJ, Leontsini E, Jose G, Rigau-Pe RM, Clark GG, Duane J et al. Community-Based Dengue Prevention Programs In Puerto Rico: Impact On Knowledge, Behavior, and Residential Mosquito Infestation. Am J Trop Med Hyg 2002; 67(4):363-370
~ 25 ~
International Journal of Mosquito Research Volume 1 Issue 3 (2014)
15. Prasad R. Dengue Nation: the rise and spread of viral challenges. The Hindu, (National Daily News Paper) 2012.
16. Gluskin RT, Johansson MA, Santillana M, Brownstein JS. Evaluation of Internet-Based Dengue Query Data: Google Dengue Trends. PLOS Neglected Tropical Diseases 2014; 8(2):e2713.
17. Cordeiro R, Donalisio MR, Andrade VR, Mafra ACN, Nucci LB, Brown JC et al. Spatial distribution of the risk of dengue fever in southeast Brazil, 2006-2007, BMC Public Health 2011; 11:355.
18. Koyadun S, Butraporn P, Kittayapong P. Ecologic and Socio-demographic Risk Determinants for Dengue Transmission in Urban Areas in Thailand. Interdisciplinary Perspectives on Infectious Diseases 2012; 12.
19. Sivagnaname NS, Yuvarajan, De Britto RLJ. Urgent need for a permanent dengue surveillance system in India, Current Science 2012; 102(5):672-675.
20. The Times of India, Dengue epidemic News (The national Newspaper) 2012.
21. The Times of India, Dengue epidemic News (The national Newspaper), 2013.
22. The Hindu, Dengue epidemic News, Daily Newspaper dated 9th May, 14th May, 24th May, 25th May, 14th September, 31st September, 8th November, 9th November, 10th November, 12th November, 19th November of the year 2012, 2nd and.3rd December. The Hindu National Newspaper, 2012.
23. The report of National Vector borne Disease Control, Ministry of Health & family Welfare, The Union Government of India, 2012.
24. The report of ICMR Publication. Task Force studies on the application of remote sensing and GIS for Epidemiology and Control of Vector borne diseases (2000-2006), ICMR Publication, New Delhi, 2006.
25. Joshua V, Gupte, Selvaraj, Ramesh, Mandar, Mohan et al. Institute, Medical, Paranjape. Public health & GIS: Views & opinions of Indian users. Indian J Med Res India 2012; 136:299-300.
Related Documents