Web-based Stereoscopic Collaboration for Medical Visualization Dissertation zur Erlangung des mathematisch-naturwissenschaftlichen Doktorgrades "Doctor rerum naturalium" der Georg-August-Universität Göttingen im Promotionsprogramm in Computer Science (PCS) der Georg-August University School of Science (GAUSS) vorgelegt von Mathias Kaspar aus Gotha Göttingen, 2013

Welcome message from author
This document is posted to help you gain knowledge. Please leave a comment to let me know what you think about it! Share it to your friends and learn new things together.
Transcript

Web-based Stereoscopic Collaborationfor Medical Visualization
Dissertation
zur Erlangung des mathematisch-naturwissenschaftlichen Doktorgrades
"Doctor rerum naturalium"der Georg-August-Universität Göttingen
im Promotionsprogramm in Computer Science (PCS)der Georg-August University School of Science (GAUSS)
vorgelegt von
Mathias Kasparaus Gotha
Göttingen, 2013

Betreuungsausschuss
Prof. Dr. Otto Rienhoff, Abt. Medizinische Informatik, Universitätsmedizin Göttingen
Prof. Dr. Jonathan C. Silverstein, Center for Clinical and Research Informatics, NorthShore
University HealthSystem, Evanston, IL, USA
Mitglieder der Prüfungskommission
Referent:
Prof. Dr. Otto Rienhoff, Abt. Medizinische Informatik, Universitätsmedizin Göttingen
Korreferent:
Prof. Dr. Xiaoming Fu, Institut für Informatik, Universität Göttingen
Weitere Mitglieder der Prüfungskommission:
Prof. Dr. Jens Grabowski, Institut für Informatik, Universität Göttingen
Prof. Dr. Dieter Hogrefe, Institut für Informatik, Universität Göttingen
Prof. Dr. Ulrich Sax, Geschäftsbereich Informationstechnologie, Universitätsmedizin Göttingen
Prof. Dr. Ramin Yahyapour, Institut für Informatik, Universität Göttingen
Tag der mündlichen Prüfung: 23. August 2013
Summary
Medical volume visualization is a valuable tool in medical practice and education to virtuallyexplore volume data of the human body. Real-time interaction, stereoscopic presentation, andcollaboration are required for its full comprehension in all its three dimensional complexity. Suchvisualization of high-resolution data, however, is due to its high hardware demand almost onlyavailable on special imaging workstations. Whereas remote visualization systems are used toprovide such visualization at peripheral locations, they still require complex software deploy-ments. Since these are barriers for an universal and ad-hoc availability, the following hypothesisarose: A high performing remote visualization system, specialized for stereoscopy and ease ofuse, can provide access to real-time interactive, stereoscopic, and collaborative medical volumevisualization.
The most recent work about remote visualization utilizes pure web browsers, but without empha-sizing high performing usability by any participant nor essential functionalities to support variousstereoscopic display systems. The web browsers familiarity, their ease of use, and wide availabilityled to following main research question: Can we evoke a solution that fulfills all aspects by onlyusing a pure standard web browser at the client side?
A proof of concept was conducted to verify the hypothesis, including a prototype development,its practical application, its performance measurement, and comparison.
The resulting prototype system (CoWebViz) is one of the first web browser based systems withoutadded software that provides fluid interactive remote visualization in real-time. Performancetests and comparisons show the superiority of the approach to the tested existing applications,including a native application. Its support of various stereoscopic display systems, which aresimultaneously usable in a single collaborative visualization session is currently unique via such alightweight client. Its usage for an usually resource intensive stereoscopic and collaborative setupfor anatomy teaching shared with inter-continental participants shows the approach’s feasibilityand simplifying character. The feasibility of the approach has also been shown by its furthersuccessful usage in high-performance computing, and in surgery.
III

Zusammenfassung
Medizinische Volumenvisualisierung ist ein wertvolles Werkzeug zur Betrachtung von Volumen-daten in der medizinischen Praxis und Lehre. Eine interaktive, stereoskopische und kollaborativeDarstellung in Echtzeit ist notwendig, um die Daten vollständig und im Detail verstehen zukönnen. Solche Visualisierung von hochauflösenden Daten ist jedoch wegen hoher Hardware-Anforderungen fast nur an speziellen Visualisierungssystemen möglich. Remote-Visualisierungwird verwendet, um solche Visualisierung peripher nutzen zu können. Dies benötigt jedoch fastimmer komplexe Software-Deployments, wodurch eine universelle ad-hoc Nutzbarkeit erschwertwird. Aus diesem Sachverhalt ergibt sich folgende Hypothese: Ein hoch performantes Remote-Visualisierungssystem, welches für Stereoskopie und einfache Benutzbarkeit spezialisiert ist, kannfür interaktive, stereoskopische und kollaborative medizinische Volumenvisualisierung genutztwerden.
Die neueste Literatur über Remote-Visualisierung beschreibt Anwendungen, welche nur reineWebbrowser benötigen. Allerdings wird bei diesen kein besonderer Schwerpunkt auf die perfor-mante Nutzbarkeit von jedem Teilnehmer gesetzt, noch die notwendige Funktion bereitgestellt,um mehrere stereoskopische Präsentationssysteme zu bedienen. Durch die Bekanntheit von Web-browsern, deren einfach Nutzbarkeit und weite Verbreitung hat sich folgende spezifische Frageergeben: Können wir ein System entwickeln, welches alle Aspekte unterstützt, aber nur einenreinen Webbrowser ohne zusätzliche Software als Client benötigt?
Ein Proof of Concept wurde durchgeführt um die Hypothese zu verifizieren. Dazu gehörte einePrototyp-Entwicklung, deren praktische Anwendung, deren Performanzmessung und -vergleich.
Der resultierende Prototyp (CoWebViz) ist eines der ersten Webbrowser basierten Systeme,welches flüssige und interaktive Remote-Visualisierung in Realzeit und ohne zusätzliche Soft-ware ermöglicht. Tests und Vergleiche zeigen, dass der Ansatz eine bessere Performanz hat alsandere ähnliche getestete Systeme. Die simultane Nutzung verschiedener stereoskopischer Präsen-tationssysteme mit so einem einfachen Remote-Visualisierungssystem ist zur Zeit einzigartig.Die Nutzung für die normalerweise sehr ressourcen-intensive stereoskopische und kollaborativeAnatomieausbildung, gemeinsam mit interkontinentalen Teilnehmern, zeigt die Machbarkeit undden vereinfachenden Charakter des Ansatzes. Die Machbarkeit des Ansatzes wurde auch durchdie erfolgreiche Nutzung für andere Anwendungsfälle gezeigt, wie z.B. im Grid-computing und inder Chirurgie.
IV
Acknowledgments
I would like to express my deepest thanks to Prof. Otto Rienhoff for his unremitting supportduring the past years, who helped me getting deeper into working at an university in generaland, specifically, in helping me to conceptualize and finish my dissertation, and in successfullyarranging the visit at The University of Chicago very shortly after I started my work.
I would like to express my deepest thanks to Prof. Jonathan C. Silverstein, who welcomed me inhis working group at The University of Chicago for a short research stay that ended up in a longcollaboration, who provided an environment that allowed us to advance our initial ideas with avery practical meaning, and for his enduring optimism and confidence.
I would like to thank all committee members, Prof. Otto Rienhoff, Prof. Xiaoming Fu, Prof. JensGrabowski, Prof. Dieter Hogrefe, Prof. Ulrich Sax, and Prof. Ramin Yahyapour for any discussion,comments, and hard questioning, which undoubtedly helped me to refine my thesis. I would alsolike to thank Prof. Nigel John for his external review of my work.
I would like to thank Nigel M. Parsad and Fred Dech for all the countless hours they helped meamongst others with my prototype developments, tests, manuscript improvements, and for givingme an idea about the US american life.
I would also like to thank Nestor J. Zaluzec, Eric Olson, Joseph Insley, and Thomas Uram from theArgonne National Laboratories, Mike W. Daley from the Cardiff School of Computer Science andInformatics of Cardiff University, and Benjamin Löhnhardt from the Georg-August-Unviversityof Göttingen for their discussions about and testing of CoWebViz.
I would like to thank the German Academic Exchange Service (DAAD) for their support via ashort-term fellowship for Ph.D. research studies.
Thanks to my parents Martina and Detlef Kaspar for always believing in me.
Lastly, my wife Lea K. Seidlmayer deserves my eternal gratitude for all of our discussions and,especially, her endurance during the last years.
V
Contents
1 Introduction 1
1.1 Aspects of medical visualization usage . . . . . . . . . . . . . . . . . . . . . . . . 1
1.2 Usage scenarios for medical volume visualization . . . . . . . . . . . . . . . . . . 2
1.3 Necessity for easier accessibility of volume visualization . . . . . . . . . . . . . . . 4
1.4 Rationale and Objectives . . . . . . . . . . . . . . . . . . . . . . . . . . . . . . . 6
2 Methodology 8
2.1 Literature analysis . . . . . . . . . . . . . . . . . . . . . . . . . . . . . . . . . . . 8
2.2 Techniques evaluation via rapid prototypes . . . . . . . . . . . . . . . . . . . . . 11
2.2.1 Method . . . . . . . . . . . . . . . . . . . . . . . . . . . . . . . . . . . . . 11
2.2.2 Verification . . . . . . . . . . . . . . . . . . . . . . . . . . . . . . . . . . . 13
2.3 Proof of concept conduction . . . . . . . . . . . . . . . . . . . . . . . . . . . . . . 14
2.3.1 Method . . . . . . . . . . . . . . . . . . . . . . . . . . . . . . . . . . . . . 14
2.3.2 Verification . . . . . . . . . . . . . . . . . . . . . . . . . . . . . . . . . . . 15
3 Background and related work 22
3.1 Medical Visualization . . . . . . . . . . . . . . . . . . . . . . . . . . . . . . . . . . 22
3.1.1 Imaging data types . . . . . . . . . . . . . . . . . . . . . . . . . . . . . . . 23
3.1.2 Basic visualization techniques . . . . . . . . . . . . . . . . . . . . . . . . . 25
3.2 Display techniques with depth perception . . . . . . . . . . . . . . . . . . . . . . 26
3.2.1 Stereoscopic display principles . . . . . . . . . . . . . . . . . . . . . . . . . 28
3.2.2 Common visualization setups . . . . . . . . . . . . . . . . . . . . . . . . . 31
3.3 Remote sharing of interactive visualization in real-time . . . . . . . . . . . . . . . 33
3.3.1 Network aspects of interactive systems . . . . . . . . . . . . . . . . . . . . 33
3.3.2 Client and server side rendering . . . . . . . . . . . . . . . . . . . . . . . . 35
3.3.3 State of the art of shared visualization techniques . . . . . . . . . . . . . . 38
VI
Contents
4 Evaluation of data transmission techniques using web browsers 46
4.1 Visualization transfer . . . . . . . . . . . . . . . . . . . . . . . . . . . . . . . . . . 46
4.1.1 Prototype observations and evaluation . . . . . . . . . . . . . . . . . . . . 46
4.1.2 Motion JPEG vs. pulling JPEG . . . . . . . . . . . . . . . . . . . . . . . 48
4.1.3 Image format choice . . . . . . . . . . . . . . . . . . . . . . . . . . . . . . 49
4.2 Event transfer . . . . . . . . . . . . . . . . . . . . . . . . . . . . . . . . . . . . . . 50
4.3 Expert discussion . . . . . . . . . . . . . . . . . . . . . . . . . . . . . . . . . . . . 51
4.4 Discussion . . . . . . . . . . . . . . . . . . . . . . . . . . . . . . . . . . . . . . . . 51
5 A system design for remote collaborative web-based visualization 53
5.1 System design . . . . . . . . . . . . . . . . . . . . . . . . . . . . . . . . . . . . . . 53
5.1.1 Integration of visualization applications . . . . . . . . . . . . . . . . . . . 55
5.1.2 Internal procession . . . . . . . . . . . . . . . . . . . . . . . . . . . . . . . 56
5.1.3 Interfaces to access and control the visualization . . . . . . . . . . . . . . 57
5.2 Visualization transfer optimization . . . . . . . . . . . . . . . . . . . . . . . . . . 59
5.2.1 Bandwidth optimizations . . . . . . . . . . . . . . . . . . . . . . . . . . . 59
5.2.2 Quality and performance optimization . . . . . . . . . . . . . . . . . . . . 60
5.2.3 Visualization smoothness optimization . . . . . . . . . . . . . . . . . . . . 63
5.3 Event transfer . . . . . . . . . . . . . . . . . . . . . . . . . . . . . . . . . . . . . . 64
5.4 Collaborative multi-user access control . . . . . . . . . . . . . . . . . . . . . . . . 64
5.5 Stereoscopic visualization support . . . . . . . . . . . . . . . . . . . . . . . . . . . 65
5.6 Special classroom additions . . . . . . . . . . . . . . . . . . . . . . . . . . . . . . 67
6 Proof of concept conduction results 71
6.1 CoWebViz usage for collaborative anatomical education . . . . . . . . . . . . . . 71
6.1.1 Procedure of using CoWebViz in class . . . . . . . . . . . . . . . . . . . . 71
6.1.2 Experiences of using CoWebViz in class . . . . . . . . . . . . . . . . . . . 72
6.1.3 Comparison of CoWebViz with the preceding class setup . . . . . . . . . . 76
6.2 Other applications of CoWebViz . . . . . . . . . . . . . . . . . . . . . . . . . . . 77
6.2.1 Anatomical education in medical school . . . . . . . . . . . . . . . . . . . 77
6.2.2 Demonstration in conference rooms . . . . . . . . . . . . . . . . . . . . . . 79
6.2.3 Informing surgeons in the operating room . . . . . . . . . . . . . . . . . . 80
6.2.4 Monoscopic ad-hoc collaborative usage . . . . . . . . . . . . . . . . . . . . 80
VII
Contents
6.3 Integration of CoWebViz into external web-based systems . . . . . . . . . . . . . 80
6.3.1 Viewing visualization in TPM . . . . . . . . . . . . . . . . . . . . . . . . . 81
6.3.2 Integration into a high-performance computing environment . . . . . . . . 81
7 Performance test results and comparison 83
7.1 System performance tests . . . . . . . . . . . . . . . . . . . . . . . . . . . . . . . 83
7.1.1 Comparison of different visualization transfer optimization levels . . . . . 83
7.1.2 Stereoscopic modes . . . . . . . . . . . . . . . . . . . . . . . . . . . . . . . 87
7.1.3 Scalability tests . . . . . . . . . . . . . . . . . . . . . . . . . . . . . . . . . 88
7.2 Comparison to similar tools . . . . . . . . . . . . . . . . . . . . . . . . . . . . . . 90
8 Discussion 92
8.1 Minimum user knowledge and involvement for interactive visualization . . . . . . 93
8.2 Multiple participants at different locations with different stereoscopic systems . . 97
8.3 Generic support of any existing and future visualization application . . . . . . . . 100
8.4 Automatic quality adjustment to optimize between performance and quality . . . 103
9 Conclusion 107
List of Abbreviations IX
List of Figures XII
List of Tables XIV
List of Listings XV
Bibliography XVI
Curriculum Vitae XLI
VIII

1 Introduction
Direct volume visualization is an increasingly important technique to visualize volume imagingdata as acquired for instance by Computed Tomography (CT) and Magnetic Resonance Imaging(MRI). Volume data contains detailed information about the three-dimensional (3D) structure ofa part or the whole human body. In contrast to the direct presentation of volume data as multiplecross-sectional two-dimensional (2D) images, direct volume visualization enables the presentationof a whole volume dataset in a single rendered image. Such condensed information is inevitableto be understood by the people who use it, physicians and other medical staff [1]. They con-siderably depend on the presentation of highly processed and compressed data as created bymedical visualization algorithms (see Section 1.1) in order to optimize the time involvement inthe professional daily life (see Section 1.2). However, compared to other data that is commonlyacquired by medical systems, e.g. high-dimensional structured data for administrative and treat-ment documentation, quantitative data for laboratory results, and sensor data in the scope ofAmbient Assisted Living [2], volume data is unstructured and can become very large in size [3].Because of its high compute hardware and potential network requirements, high quality volumevisualization is bound to special imaging workstations or remote visualization approaches (seeSection 1.3). Easy useable systems, however, have a positive effect on being used [4]. It thereforeis necessary to provide and evaluate a lightweight system that enables high-performing volumevisualization with least requirements on the client side (see Section 1.4).
1.1 Aspects of medical visualization usage
Understanding complex data by utilizing advanced visualization algorithms can be eased by pro-viding interactive functionality, stereoscopic presentation, and shared visualization for discussion.
Interactive functionality. To understand virtual 3D objects as a whole and in all its details,it is necessary to modify the visualization interactively and in real-time for a comprehensive ex-ploration of all regions of interests. Yi at al. [5] sub-divide interactive functionality of informationvisualization into seven categories, which are partially applicable to volume visualization: A userneeds to zoom into or pan a visualization (explore), to rotate the visualized object (reconfigure),to show it in another colorization (encode) [6], to mark a Point of Interest (POI) (select), and tochange the windowing level to highlight for instance bones or muscles (filter). Further categoriesdescribed by Yi at al. are abstract and connect, which have no direct counterpart in volume visu-
1

1 Introduction
alization. For abstract, the addition of an overlaid emphasizing illustrative visualization techniqueis thinkable. Connect could for instance be represented by the linkage of 3D coordinates (POIs)to descriptive data (e.g. labels). Essential for any interactive functionality is the modificationof visualization in real-time, which requires a timely presentation, e.g. few milliseconds, of amodified visualization after it was being requested by the user [7].
Stereoscopic presentation. The presentation technique is another important aspect to en-hance the understanding of the visualized data [8]. The simplest and likely most often usedtechnique is the presentation on a 2D display (monoscopic visualization), which requires a map-ping of the three-dimensional object (the medical volume data) to a two-dimensional image (e.g.direct volume visualization). More advanced techniques provide the viewer with a depth per-ception and/or a better visual immersion [9] (see Section 3.2). Thus, such systems provide moreassisting information with two or more views of the three dimensional object by using stereoscopicor even volumetric displays [10]. Stereoscopic visualization has not yet been used extensively inpractical medical scenarios except for special disciplines (e.g. robotic surgery [11]). Its successin other scientific disciplines and studies about its medical benefit however indicate its possiblefuture importance [8, 12, 13]. Stereoscopic visualization techniques provide the viewer with adepth perception by providing separate views (eye perspectives) for each eye, which can emi-nently support the process of understanding data [14, 15]. The movie industry pushed the usageof stereoscopy with the wider dissemination of stereoscopic techniques to movie theaters andhomes in the past years. This resulted in the common availability of high definition stereoscopicconsumer grade 3D TVs for low costs and a general easier availability of stereoscopic technologies.
Collaborative usage. Another and closely connected aspect that is important in a treatmentworkflow is the consultation between physicians within the scope of telemedicine [16]. Such aconsultation session is about a specific patient, including the patient’s data and images. Theyvary from a simple asynchronous exchange of single or stacked annotated images and mightpotentially result in real-time discussions with interactive and shared advanced visualization inthe future. The need for collaborative consultations between physicians, who are remote to eachother, might get especially interesting with the development of larger hospital corporations andincreasing specialization of physicians [17, 18].
1.2 Usage scenarios for medical volume visualization
Scenarios that could benefit from the provision of volume visualization with the previously de-scribed aspects are manifold and exist in different caregiving medical divisions as well as foreducation.
2
1.2 Usage scenarios for medical volume visualization
Medical practice. In practical medicine, volume visualization is usually based on data thatis directly connected with the treated patient. Such is e.g. used in a surgical planning, which isdone by surgeons before, during or after a surgery to get accustomed with the specific anatomyof the patient, to define the individual steps prior to an invasive procedure, and to evaluate theprocedure afterwards [19, 20]. An easy access to the visualization might be important for thiscase, especially if the surgeon wants to do the planning independently of the location by usingmobile devices before and during the procedure. A use case that could be closely connected isthe remote consultation with multiple professionals who discuss a medical case based on a sharedvisualization [21] (e.g. a surgeon questioning a radiologist about more details pre-operatively).Remote could mean that both physicians are in different hospitals, but it could also mean thatboth are in different departments of the same hospital. The latter case could be useful to reducethe time that would be necessary to do the consultation in person. Besides the before mentioneduse cases, a wider availability of visualization in general can also provide a benefit. An exampleis the presentation of visualization to a patient to explain a planned treatment. Enzenhofer etal. [22] for example showed that the patient’s knowledge and satisfaction increases, when thephysician-patient dialog that is necessary to inform a patient before an invasive procedure iscombined with visualization.
Medical education. Whereas a new technology needs to undergo a complex process priorto its practical application in patient care, educational scenarios without direct patient contactare less restrictive since they only require anonymized data. There are many different levels ofusing visualization of patient data to educate students, which is essential to the understanding ofcomplex structures of the human body. The most basic but likely the most widely spread variantof using medical visualization for education is the presentation of static pictures, screenshotsor short videos from real patients and their data taken from productive systems. They arepresented in the class, books or in a further advanced version distributed via the Internet for pre-or post-lecture self-studies. Examples have been shown that use recorded videos and presentationslides [23, 24]. There are also anatomy self-study tools based on anatomical atlases that can beused to understand the human body part by part, which, however, are usually based on surfacevisualization [25] (see Section 3.1.2). On a next level, this data is provided as interactive insteadof static media on a web page for self-study. Sophisticated viewers are necessary to providefunctionality that can be used to examine interactive pre-processed media. Examples have beenshown that allow the viewing of multiple image types with varying levels of detail and zoom [26]and to provide multiple viewpoints of 3D objects [27–34]. Such tools are easily accessible witha web browser, making them deployable almost everywhere, but usually with the necessity ofadditional software deployments. Compared to the presentation of pre-processed visualization,stereoscopic visualization is rarely used for anatomical education. However, some projects whereinitialized that utilized pre-rendered stereoscopic visualization [13, 35].
3

1 Introduction
The usage of interactive volume visualization in real-time on real patient data is rarely used duringthe lecture session itself nor on web pages, especially not in stereoscopy. But real-time interactivevisualization is also interesting in a classroom scenario [36], because it allows to provide thestudents ad-hoc with the visualization they require for a deeper understanding. Just as importantcould be the usage of advanced and interactive visualization for self-directed learning.
1.3 Necessity for easier accessibility of volume visualization
All previously described use cases require a system with fewest usage barriers as possible. Physi-cians for instance do already need to work with a multitude of systems in their daily life. Theprovision of applications that are similar to already known applications and/or require fewer stepsin order to be used, might reduce the initial learning phase and, thus, increase its acceptance.Departments and institutions more often have stereoscopic hardware deployed in special rooms(e.g. conference rooms). But these might not be in the full control of the people who want to usetheir own stereoscopic visualization. Thus, even in the case of stereoscopic visualization, where ausage almost always requires stereoscopic hardware, it might be of advantage to reduce the needfor additional software deployments. In the case of collaborations with stereoscopic visualization,remote participants might require different stereoscopic content for their setup.
There are basically two visualization types that can be used to render volume data, extractedsurface visualization and direct volume visualization (Section 3.1.2). The former can often berendered on standard computer equipment, which might also be powerful enough to render volumevisualization of small datasets with low interactivity [37]. But the rendering of high-qualityvolume visualizations of large high-resolution volume data sets in real-time and in stereoscopyis only available on special imaging workstations, e.g. tethered clients of imaging modalities.Technical progression of imaging modalities and computer technology leads to increasing computepower but also larger and more detailed data. Because of this and the current necessity to usehigh-performing hardware, it is likely that full quality high-performing volume visualization willalso require more than standard hardware in the future. Access to high-performing medicalvisualization is therefore limited.
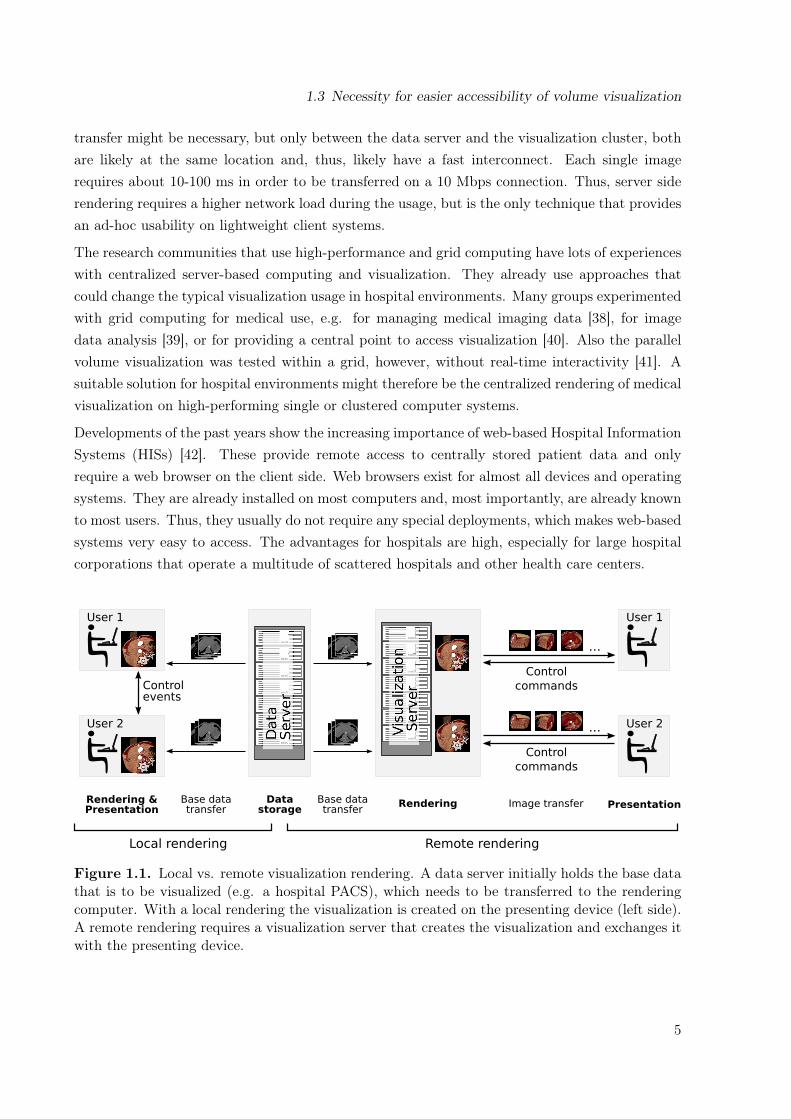
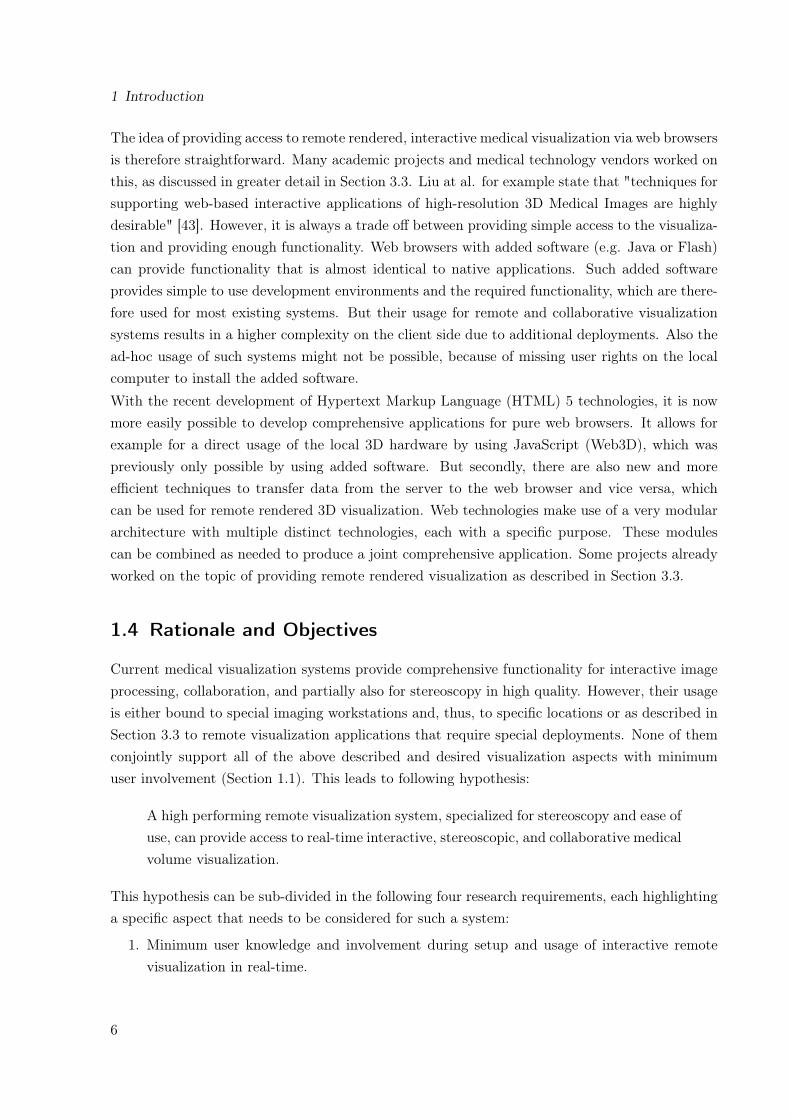
Accessing volume visualization collaboratively by multiple remote participants can basically besolved by rendering the visualization locally on every participating client (client side rendering)or solely on a single server (server side rendering). As described in Section 3.3.2 in more detail,a client side rendering approach requires each participant to have adequate hardware to renderthe desired visualization and a local copy of the data set. In the case of a 0.5-2 GB CT dataset,the data transfer may result in an initial waiting time of 1-3 minutes on a fast 100 Megabit persecond (Mbps) network, but 7 to 27 minutes on a standard connection of 10 Mbps. A server siderendering does not require a specific initial data transfer to each client, but instead a continuousstream of the images that are rendered on the server (see Figure 1.1). A single initial data
4
1.3 Necessity for easier accessibility of volume visualization
transfer might be necessary, but only between the data server and the visualization cluster, bothare likely at the same location and, thus, likely have a fast interconnect. Each single imagerequires about 10-100 ms in order to be transferred on a 10 Mbps connection. Thus, server siderendering requires a higher network load during the usage, but is the only technique that providesan ad-hoc usability on lightweight client systems.
The research communities that use high-performance and grid computing have lots of experienceswith centralized server-based computing and visualization. They already use approaches thatcould change the typical visualization usage in hospital environments. Many groups experimentedwith grid computing for medical use, e.g. for managing medical imaging data [38], for imagedata analysis [39], or for providing a central point to access visualization [40]. Also the parallelvolume visualization was tested within a grid, however, without real-time interactivity [41]. Asuitable solution for hospital environments might therefore be the centralized rendering of medicalvisualization on high-performing single or clustered computer systems.
Developments of the past years show the increasing importance of web-based Hospital InformationSystems (HISs) [42]. These provide remote access to centrally stored patient data and onlyrequire a web browser on the client side. Web browsers exist for almost all devices and operatingsystems. They are already installed on most computers and, most importantly, are already knownto most users. Thus, they usually do not require any special deployments, which makes web-basedsystems very easy to access. The advantages for hospitals are high, especially for large hospitalcorporations that operate a multitude of scattered hospitals and other health care centers.
Controlevents
Control
commands
Control
commands
...
...
Local rendering Remote rendering
Base datatransfer
Rendering &Presentation
RenderingBase datatransfer
Image transfer
User 1
User 2
User 1
User 2
PresentationData
storage
Figure 1.1. Local vs. remote visualization rendering. A data server initially holds the base datathat is to be visualized (e.g. a hospital PACS), which needs to be transferred to the renderingcomputer. With a local rendering the visualization is created on the presenting device (left side).A remote rendering requires a visualization server that creates the visualization and exchanges itwith the presenting device.
5
1 Introduction
The idea of providing access to remote rendered, interactive medical visualization via web browsersis therefore straightforward. Many academic projects and medical technology vendors worked onthis, as discussed in greater detail in Section 3.3. Liu at al. for example state that "techniques forsupporting web-based interactive applications of high-resolution 3D Medical Images are highlydesirable" [43]. However, it is always a trade off between providing simple access to the visualiza-tion and providing enough functionality. Web browsers with added software (e.g. Java or Flash)can provide functionality that is almost identical to native applications. Such added softwareprovides simple to use development environments and the required functionality, which are there-fore used for most existing systems. But their usage for remote and collaborative visualizationsystems results in a higher complexity on the client side due to additional deployments. Also thead-hoc usage of such systems might not be possible, because of missing user rights on the localcomputer to install the added software.With the recent development of Hypertext Markup Language (HTML) 5 technologies, it is nowmore easily possible to develop comprehensive applications for pure web browsers. It allows forexample for a direct usage of the local 3D hardware by using JavaScript (Web3D), which waspreviously only possible by using added software. But secondly, there are also new and moreefficient techniques to transfer data from the server to the web browser and vice versa, whichcan be used for remote rendered 3D visualization. Web technologies make use of a very modulararchitecture with multiple distinct technologies, each with a specific purpose. These modulescan be combined as needed to produce a joint comprehensive application. Some projects alreadyworked on the topic of providing remote rendered visualization as described in Section 3.3.
1.4 Rationale and Objectives
Current medical visualization systems provide comprehensive functionality for interactive imageprocessing, collaboration, and partially also for stereoscopy in high quality. However, their usageis either bound to special imaging workstations and, thus, to specific locations or as described inSection 3.3 to remote visualization applications that require special deployments. None of themconjointly support all of the above described and desired visualization aspects with minimumuser involvement (Section 1.1). This leads to following hypothesis:
A high performing remote visualization system, specialized for stereoscopy and ease ofuse, can provide access to real-time interactive, stereoscopic, and collaborative medicalvolume visualization.
This hypothesis can be sub-divided in the following four research requirements, each highlightinga specific aspect that needs to be considered for such a system:
1. Minimum user knowledge and involvement during setup and usage of interactive remotevisualization in real-time.
6
1.4 Rationale and Objectives
2. Support of multiple participants at different locations with different stereoscopic systemssimultaneously.
3. Generic support of any existing and future visualization application.4. Automatic quality adjustment during the runtime to optimize the balance between perfor-
mance and quality on a given network condition.
Many applications, including modern Hospital Information Systems (HISs) and recent relatedwork systems, are of pure web-based nature, which results in a wide availability of web browsersand people being familiar with it. Thus, an equally simple provision of highly interactive andstereoscopic volume visualization via pure web browsers would be beneficial. The following mainquestion arose:
Can we evoke a solution that fulfills all requirements by only using a pure standardweb browser at the client side?
As described in Section 3.3.3, none of the related work systems can be used simultaneously withmultiple stereoscopic setups nor do the pure web-based systems provide an optimized performancefor the real-time usage on different network conditions. Thus, the focus of this work lies onfulfilling all requirements, but especially on requirement 2 and requirement 4. It is expected thatsuch a system is used by not more than four simultaneously collaborating remote groups (e.g.classrooms) as discussed in Section 8.2.
7

2 Methodology
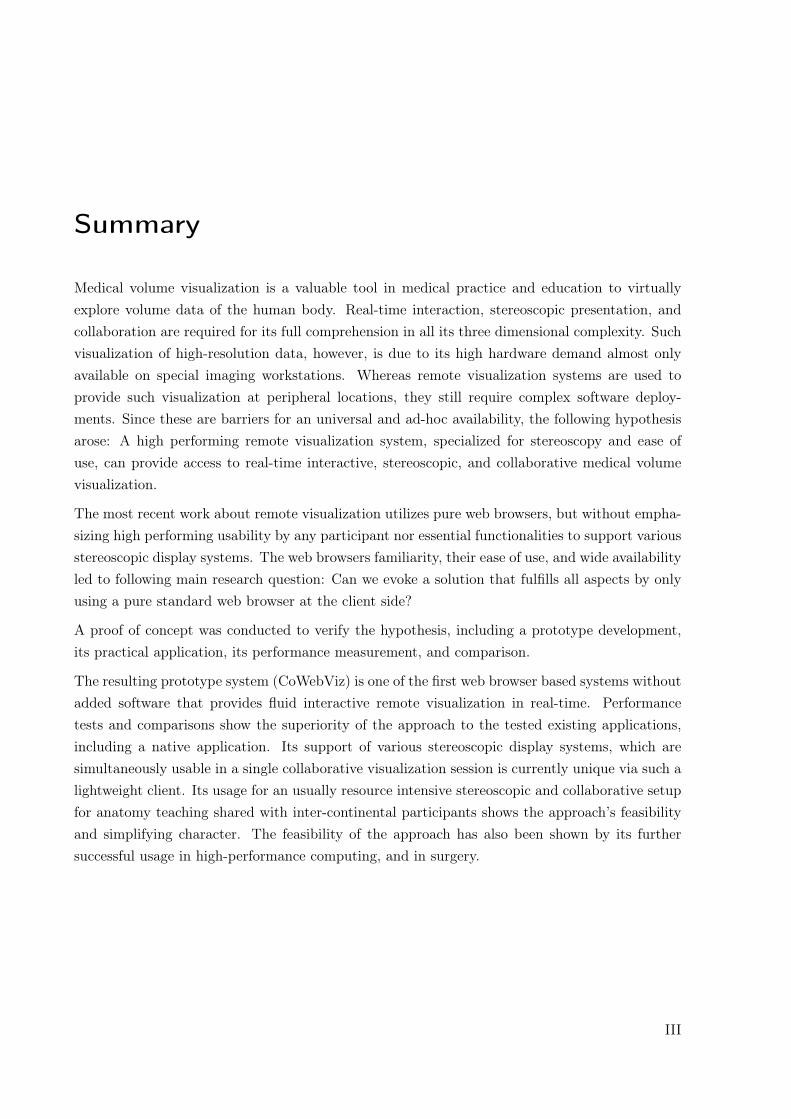
A proof of concept conduction is a suitable method to test the feasibility of using web browserswithout added software to remotely access stereoscopic volume visualization in real-time andcollaboration. A proof of concept is "taking an idea and investigating to see if the idea hasmerit" [44, Ch. 2.2.1]. Thus, the basic idea of this thesis was the development of a prototypeapplication that implements the approach introduced in Chapter 1 and its usage in a real practicalscenario. The overall methodology is illustrated in Figure 2.1 by referencing the correspondingmethodology and result sections.The first task was to identify existing approaches that allow to answer the given problem ofdistributing visualization by only requiring a pure web-browser. This was done via a literatureanalysis and resulted in a state-of-the-art description of related work and enabling techniques,which is described in Section 2.1.Several of these techniques were potentially usable for the development of a prototype system. Itwas therefore necessary to evaluate these techniques in order to find the most promising techniquefor an efficient data transfer. This evaluation was done by developing, testing, discussing, andgrading several simple rapid prototype applications based on the requirements, which is describedin Section 2.2.This evaluation resulted in a single technique selection, which was then used to develop a moresophisticated prototype that implements the whole approach as described in the introduction (seeSection 1.4). This system was then used for an inter-continentally shared medical anatomy classand further scenarios, which resulted in observations that led to further prototype improvements.The optimized prototype was tested in detail to compare it with other visualization transfermethods and related work (see Section 2.3).
2.1 Literature analysis
The literature analysis was done on two levels: (1.) Finding literature about projects with thesame topic and (2.) finding methods and techniques that enable such a system.In order to get a quick overview about the topic in the beginning, the databases Pubmed [45] andGoogle Scholar [46] were searched. Pubmed is ideal to find publications in the field of medicineand medical informatics. Google Scholar in contrast has indexed a much broader scope of scientificand other publications (e.g. patents) and, thus, is a good addition to Pubmed. Google Scholarresulted in a very fast acquisition of popular literature ranked by search algorithms, but also in a
8

2.1 Literature analysis
Analysis of literature andexisting techniques (Section 2.1)
State of the art techniqueoverview (Chapter 3)
Evaluation of enabling techniquesvia rapid prototypes (Section 2.2)
Grading and techniqueselection (Chapter 4)
Development of a prototype(Section 2.3)
Prototype:CoWebViz (Chapter 5)
Show feasibility via practicalusage in classroom(Section 2.3.2.2)
Observations (Chapter 6)
Measure performanceand compare to relatedwork (Section 2.3.2.3)
Performance comparison(Chapter 7)
Verification againstrequirements (Chapter 8)
Figure 2.1. Flow diagram of the overall methodology (white boxes) and subsequent results(gray rounded boxes), each linked to the corresponding sections and chapters.
very large amount of publications that were off-topic. Among others, following search terms whereused on both databases: "shared collaborative visualization", "shared medical visualization","stereoscopic classroom", "state of the art visualization", "web visualization education", and"web-based remote visualization". In case of Pubmed, it was also tested to find literature via theMeSH terms "Education" and "Depth Perception" [47], which, however, only resulted in medicalarticles that were not relevant for the very technical problem of this thesis.
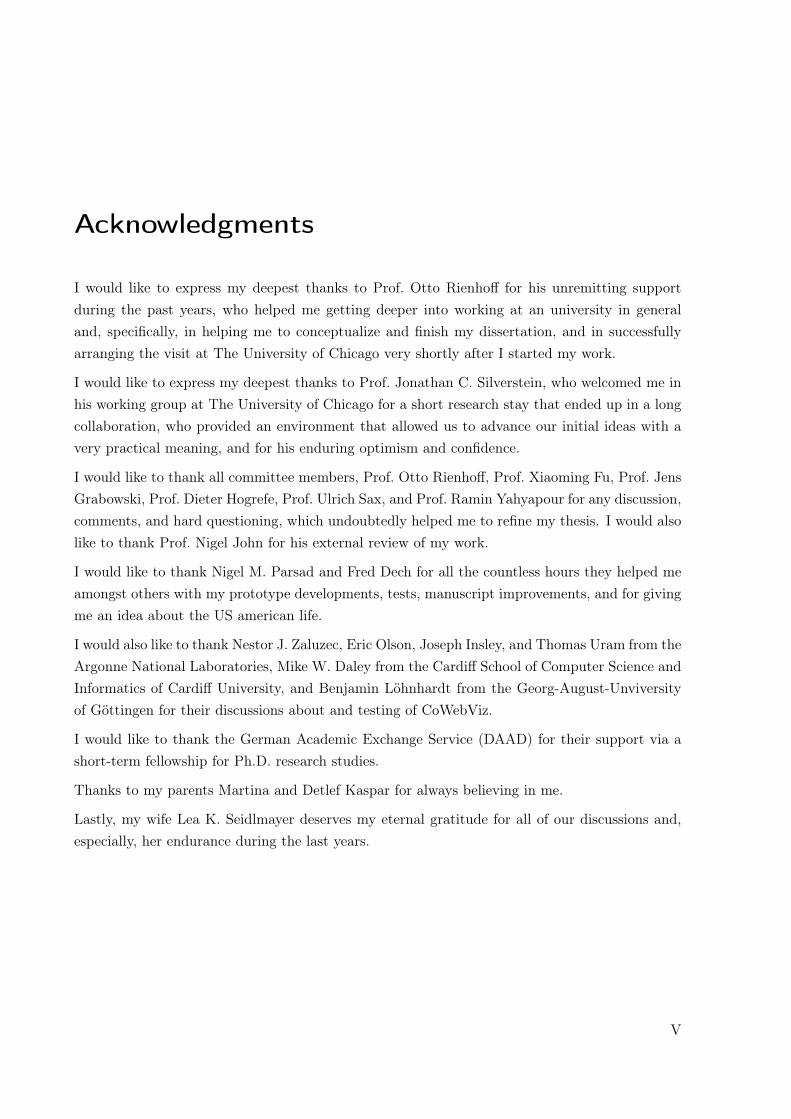
A systematic literature analysis was done afterwards to get a profound state of the art descriptionof current systems, which is illustrated by a flow diagram in Figure 2.2. Pubmed was usedagain to find the usage of the desired systems in the medical discipline. IEEE Xplore digitallibrary (IEEE DL) [48] and ACM digital library (ACM DL) [49] were used to find related workin technical disciplines. The search term that was used on each database was "remote ANDvisualization AND (browser OR web based)", which was adapted to each specific database search
9

2 Methodology
Identified articles through searchin following databases:• Pubmed (n=353)• IEEE DL (n=69)• ACM DL (n=230)
Removal of duplicate articles(n=652) Articles removed (n=69)
Screening of titles and abstracts(n=583)
Articles removed because of topical mis-match (n=146)
Screening of full-text articles(n=437)
Removed articles (n=400)• Off-topic, e.g. not web-based nor
interactive (n=193)• Information visualization with
HTML 5 (n=53) and applets (n=49)• Interactive local 3D visualization
with HTML 5 (n=11) and applets(n=85)• Interactive, but pre-rendered (n=12)
Direct relating work (n=15)• Remote interactive
visualization usingHTML 5 (n=15)
Work with similar goal, butdifferent approach (n=19)• Remote interactive
visualization using addedsoftware (n=19)
Figure 2.2. Flow chart of the literature analysis.
engine. The search was conducted in December 2011 without constraining the publication date.However, due to the search term, the first publications were not older than the early 1990’s. Thesearch was updated in February 2013 by constraining the publication date to the years 2011 to2013. The process resulted in 583 publications after duplicate removal. These publications werescreened on the basis of their title and abstract, which led to the removal of 146 publications.The resulting 437 articles were screened and categorized based on their full text. Categories are1) "off-topic", 2) "information visualization"1, 3) "interactive local 3D visualization", 4) "pre-rendered visualization" (such was often used for web-based medical education), and 5) "interactiveremote 3D visualization". Categories 2, 3, and 5 were further sub-divided into a) "utilizing
1Information visualization is a field of research about the visual representation of "non-spatial abstract data" [50],which is frequently used on web-browsers.
10
2.2 Techniques evaluation via rapid prototypes
additional software" and b) "utilizing a pure web-browser". All articles categorized under 5 utilizea remote visualization rendering approach, but only the 15 articles in 5b ("interactive remote 3Dvisualization utilizing a pure web-browser") are considered as directly relating to this work [51–65], since they have the same scope of simple visualization access. The other 19 articles [66–84]were categorized under 5a ("interactive remote 3D visualization utilizing additional software").To find the very technical methods of distributing the visualization, it was also necessary to findstate of the art products and technologies that allow to distribute visualization via a network toa pure web-browser. The literature analysis described above was important for that, since theresulting articles most often describe utilized techniques. But it was also necessary to do standardweb searches to find products and specifications. The HTML specification [85] was an importantsource to find potential web-based technologies.The techniques found are presented in Section 3.3 and the most promising were evaluated inSection 4.
2.2 Techniques evaluation via rapid prototypes
The literature analysis resulted in the description of several projects, which utilize different tech-niques with potentials to transfer data from a server to a web browser client and vice versa (seeSection 3.3). This section describes the evaluation process that was necessary to identify a singlebest performing technique suitable to develop a sophisticated prototype for the proof of conceptconduction. This step was necessary, because web browsers were initially not being developedfor real-time interactive data transmissions, which resulted in the development of many datatransmission techniques, partially built around very basic connectionless techniques.
2.2.1 Method
The desired technique that is to be selected for the proof of concept conduction needs to fulfill theresearch requirements defined in Section 1.4. It needs to allow for interactive remote visualizationin real-time (requirement 1) with potentials of being most performing (requirement 4). Theprototype evaluation described in Section 2.2.2 was based on more granular aspects of theserequirements, which are described in Table 2.1. Requirements 2 and 3 are not related to the basicvisualization transfer technique and therefore not considered in this evaluation.A rapid prototype is a prototype that implements a basic aspect of a system to show its feasibil-ity [86]. In the case of this evaluation, the basic aspect is the transfer of visualization to a webbrowser and, vice versa, the control commands to the server. Several rapid prototypes were de-veloped to test visualization and command event transfer techniques on the web browsers Firefox(Version 3.5.9 and 3.6.3), Google Chrome (Version 5), Safari (Version 4.0.5), and Internet Ex-plorer (Version 8) on Ubuntu 10.04, Windows XP/7, and Mac OS 10.6. To keep the developmenteffort low, they were based on existing software and, only in some cases, additional programming.
11

2 Methodology
Table 2.1. Success criteria that need to be fulfilled by the desired technique to transfer visual-ization to a web browser.
Number Criteria
1 The technique does only need a web browser without added software.2 The technique shall provide remote visualization in real-time at the client side.3 The technique should provide a high frame rate with a possible high efficiency.4 The technique is useable with as many web browsers as possible.
Following rapid prototypes were tested:
Prototype 1: HTML 5 video steaming: HTML 5 video streaming is the streaming to andplayback of stored or real-time video by pure web browsers [85] (see background in Sec-tion 3.3.3.2, Video streaming).
The HTML 5 video streaming solution was tested in two setups. (1.) The first setup wasbased on VLC2 (Version 1.0.2), which was configured to capture a desktop metaphor and toprovide it as video stream via its built-in Hypertext Transfer Protocol (HTTP) interface ona specified Uniform Resource Locator (URL). This setup was tested with the video codecsH.264 and Ogg/Theora on Firefox, Safari and Internet Explorer. (2.) The second setupwas similar to the first, but used an additional Icecast2 streaming server3 (Version 2.3) asmiddleware between VLC and the web browser.
Prototype 2: Pulling single images: Continuous pulling JPEG (pJPEG) is the continuous re-questing and loading of the most recent image via a standard HTTP GET request [89] (seeSection 3.3.3.2, Single image transfer).
The distribution of visualization by consecutively pulling single images from the web browserwas tested using VLC (Version 1.0.2) and an HTML page with JavaScript. VLC wasconfigured to consecutively capture images from a desktop metaphor and to store each asJoint Photographic Experts Group (JPEG) images on a web server directory. A JavaScriptwas executed simultaneously to the server software on the client side web browser, whichconsecutively updated the image source URL and, thus, the visualization image.
Prototype 3: Pushing/pulling Base64 images: The continuous pulling or pushing of Base64images is the transfer of JPEG images that are converted to Base64 (see Section 3.3.3.2,Single image transfer).
2VideoLAN Client (VLC) is an open source media player and streaming platform that supports various streamingprotocols and file formats [87].
3Icecast2 is an open source streaming server [88].
12

2.2 Techniques evaluation via rapid prototypes
Only the pushing approach was tested via a comet style design pattern [90], which is aspecific technique that allows to push data from a server application to a web browser byonly requiring client side requests4. VLC (Version 1.0.2) was used to capture the desktopmetaphor and store the images on a server side non-web-accessible directory. A JBoss server[91] (Version 5.1) was used to run a simple Java web application that continuously capturedthe newest image, to encode it to Base64, and to send it to the web browser by utilizingthe Direct Web Remoting Ajax and comet programming library [90] (Version 3.0).
Prototype 4: Pushing motion JPEG: Pushing motion JPEG (mJPEG) is the concept of concate-nating multiple JPEG images in one file or stream. Web browsers support mJPEG streamsin the format of a Multipurpose Internet Mail Extension (MIME) multipart message [92]as shown in Listing 5.2 on page 57 (see Section 3.3.3.2, Single image transfer).
The mJPEG version was initially tested by including the streams of already existing web-cams to web browsers, e.g. from the TelePresence Microscopy Collaboratoration (TPM) (seeSection 3.3.3.2). The web browser only requires a very simple web page without JavaScriptto be viewable. Afterwards VLC (Version 1.0.2) was used to capture a desktop metaphorand to stream mJPEG via its built-in HTTP server.
Another important aspect of real-time interactivity is the well performing transfer of the controlcommands from the client to the server. There are only two basic techniques qualified to transferdata from the web browser to the server: the Representational State Transfer (REST) styledesign paradigm and WebSockets. However, the real practical importance of optimizing the eventtransfer was only discovered after experiencing delays with the REST interface in the classroom.The comparison of both techniques was therefore done retrospectively by utilizing the proof ofconcept prototype as described in Section 5. It was extended on the server- and client side inthe following way to measure the timing and rates of the command event transfers on differentnetwork types: On the client side, a JavaScript method sends a sequence of control events oneafter another to the server, which answers each command with an acknowledgment. The clientmeasures the round-trip transfer times of each event during test runs of 30 seconds. Multipletests were conducted for each network type and method, which are presented as mean.
2.2.2 Verification
Each of the visualization transfer rapid prototypes was tested to demonstrate its technical feasi-bility. This was done between a Desktop PC and a Laptop via a fast 90 Mbps connection (seetest environment in Section 2.3.2.1). However, since these prototypes were very simple imple-mentations utilizing different existing software, they were not comparable in terms of detailedperformance measurements. The evaluation in Section 4.1.1 is therefore based on observations
4Server pushing via a persistent connection was not feasible without the usage of added software before thedevelopment of WebSockets.
13
2 Methodology
made during the prototype testing and the discussion with the success criteria (see Table 2.1)and related work. The resulting evaluation is summarized in Table 4.1 (page 47) sub-divided bythe success criteria. Each prototype’s support of the criteria is graded on a scale from 1 (badsupport) to 3 (good support) and "/ " (exclusion), which is summed up as a simple score in thetable’s right-most column. Two of the techniques resulted in an almost equal score and werefurther compared analytically in Section 4.1.2.
In contrast to the visualization prototypes, the event transfer techniques were tested retrospec-tively by elevating real test data. These tests were conducted several times on networks withdifferent bandwidth conditions between two cloud computing instances, which are described inSection 2.3.2.1. The results are summarized and scored equally to the visualization prototypesand presented as mean values in Table 4.2 on page 50.
The results were discussed within the working group and external scientists at the ArgonneNational Laboratories.
2.3 Proof of concept conduction
The rapid prototypes of the previously described technique evaluation did not have the requiredfunctionality to access interactive stereoscopic visualization in real-time. A more sophisticatedprototype development was therefore necessary to answer all research questions described in Sec-tion 1.4, based on the rapid prototype technique evaluation. This prototype is called CollaborativeWeb-based Visualization (CoWebViz) and was used in several practical scenarios and its perfor-mance tested.
2.3.1 Method
A proof of concept is to put a new idea or an approach into practice of a specific scenario,examine its feasibility and show whether it has merit [44]. Hence, a sophisticated prototype wasdeveloped that implements the approach defined by the hypothesis and the research requirementsand, afterwards, utilized in different practical scenarios. The prototype development consists offollowing single steps, based on Agarwal et al. [93]:
a) Communication – an idea is discussed and leads to a quick plan: The foundational ideawas the extension of the virtual anatomy class [36] by the usage of a much simpler to useclient environment for the stereoscopic visualization (see introduction in Chapter 1).
b) Quick design – a quick design is modeled that represents the idea: An architecture draftwas created and discussed in the working group. This included illustrations and descriptionsof necessary functionalities, which were refined to the architectural illustrations in Chapter 5and the requirements in Section 1.4. A further direct consequence of this phase was the
14
2.3 Proof of concept conduction
analysis of techniques in Section 2.2, which resulted in further discussions within the workinggroup and external visualization experts (see Section 4.4).
c) Construction – the prototype is developed: C++ was selected as programming language as itallows for the development of a high performing system with all required external libraries.CoWebViz was developed as a web-based front-end for possibly every visualization applica-tion and therefore relies on applications that provide the visualization. In the tests and theproof of concept conduction this system was mainly vl3 and Med ical Volume Visualization(MedVolViz) (see Section 2.3.2.1). CoWebViz was developed for the main usage on Linuxsystems, since most scientific visualization applications are available on Linux, if not evendeveloped mainly for Linux. The development and test environment is described furtherdown in Section 2.3.2.1. The final prototype architecture is described in Chapter 5.
d) Deploy and use – the prototype is deployed and used to obtain experience: The resultingCoWebViz version was deployed on a visualization cluster and used in the virtual anatomyclass in 2010 and subsequently also in other scenarios. The usage/test environment isdescribed in the following Subsection 2.3.2. Its results are described in Section 6.
e) Verification – the results are verified against all research requirements: The verificationmethod is described in the following Section 2.3.2.
f) Repeat – if necessary, conduct another prototype iteration: Two iterations of the prototypedevelopment have been conducted according to these steps. CoWebViz version 0.1 wasearly taken to a practical usage, after having an adequate usage opportunity in the virtualanatomy class of 2010. Since this version did not fulfill all research requirements, theprototype architecture was further extended to CoWebViz version 0.2, which was used forperformance tests and further scenarios.
2.3.2 Verification
The developed prototype was constantly improved along with its practical application. Never-theless, the development process can be sub-divided into the two versions CoWebViz 0.1 and 0.2.The most extensive practical application was the usage of CoWebViz 0.1 in the virtual anatomyclass. This version was the state of the art available at the time the class started and is de-scribed in the beginning of Chapter 5. It did not have all the optimizations of CoWebViz 0.2,but had all the necessary enhancements in a basic version to ease access to the visualization bystill requiring some manual technical involvement. The overall class procedure is described in thefollowing Subsection 2.3.2.2. The specific steps of using CoWebViz, observations made duringits usage about its technique und usability, and the advancements it provides compared to theprevious class setup are described in the results (see Section 6.1). CoWebViz’s class usage shows
15

2 Methodology
the feasibility of the approach, but does not show the fulfillment of all research requirements de-fined in Section 1.4. The prototype architecture was therefore further extended to CoWebViz 0.2.Subsequent utilizations of CoWebViz 0.2 in other scenarios are described, additionally to theclass observations in Section 6.2 in order to provide a hint of its feasibility and its importance forother scenarios.
CoWebViz’s usage shows the feasibility of most research requirements in part or completely.These results, however, cannot be compared with other tools or projects, which led to the con-duction of detailed performance tests of CoWebViz 0.1 and 0.2 presented in Chapter 7. The testswere conducted as described in the following paragraphs and subsections in order to verify thehypothesis by verifying the proof of concept conduction against the four requirements.
1. To present an overview of CoWebViz’s performance and to verify the interactive usability inreal-time (requirement 1), CoWebViz was tested and measured in monoscopic visualizationmode. These tests show the different optimization steps of CoWebViz itself, but also providea hint to the performance of other existing tools that utilize these patterns. These resultsalso show the improvements originated by the automatic quality adjustment algorithm(requirement 4). In the test conduction, the visualization was transferred via differentmethods or rather design patterns to the client (e.g. send all processed images in staticquality) as described in the first paragraph of Section 2.3.2.3. The tests were conducted ona visualization cluster (lightsaber) as server and a Laptop as client connected via differentnetwork types (1 Mbps, 3 Mbps, 11 Mbps, and 90 Mbps) using Google Chrome. Theresulting data about frame rate, network throughput, quality, and CPU usage are presentedas mean and standard deviation in Section 7.1. The data represents all recorded data entriesthat were marked as "in modification phase" by the test script.
2. The feasibility of providing different stereoscopic techniques (requirement 2) is verified byproviding performance data of the supported stereoscopic visualization content types, whichis then compared to the monoscopic test data. The test environment and data presentationis equal to the test environment described previously. The results are presented in Section7.1.2 and shall be used to verify the first part of requirement 2 about the support of multiplestereoscopic systems.The second part of requirements 2 is the verification of supporting multiple simultaneouslyaccessing users. This is done by a scalability test of using CoWebViz with 1 to 6 simulta-neously accessing clients. These tests were conducted on a visualization cluster (lightsaber)as server and 1 to 6 cloud computing instances as client connected via different bandwidthtypes (1 Mbps, 3 Mbps, and 10 Mbps) using Google Chrome. The resulting data aboutJPEG quality, image file size, frame rate, and network throughput are presented as meanand standard deviation in Section 7.1.3. The data represents all recorded data entries thathad a frame rate greater than 0. However, the selected cloud computing instance type wasnot equipped with a comprehensive connection of a continuously high bandwidth. This led
16

2.3 Proof of concept conduction
to phases without any data transfer rate at all while transferring larger amounts of data tomultiple clients during this scalability test. Thus, the data represents all data entries witha frame rate above its median with the aim to represent the peak performance usage.
3. The generic support of any existing and future visualization application cannot be testedpractically, but is a direct consequence of the system architecture. It is discussed in Chap-ter 8 by relating CoWebViz’s approach to existing work.
4. In order to compare CoWebViz’s performance and the automatic quality adjustment algo-rithm directly to the related work, two applications of the related work were chosen, testedand compared with CoWebViz (see Section 7.2). The first tool is the Virtual Network Com-puting (VNC) client Vinagre version 3.4 [94]. VNC [95] was chosen, because of its frequentusage for remote desktop access. VNC is a protocol that is implemented in numerous specificapplications, mostly as native application. The second tool was screenleap.com [96], a re-cently developed purely web-based remote desktop sharing service. Screenleap.com allowedfor no remote control at the time of testing, but its technique is similar to other related workand, in contrast to others, is freely available for testing. The tests were done by executingand equally measuring the frame rate of each application (in the case of screenleep.comby using CoWebViz’s WebSocket event transfer). The frame rate was measured on theclient side via a special application described in the second paragraph of Subsection 2.3.2.3.These tests were conducted multiple times on a visualization cluster (lightsaber) as serverand a cloud computing instance as client connected via different bandwidth types (see Sec-tion 2.3.2.1) using Google Chrome. The resulting data about frame rate are presented inSection 7.2 as mean and standard deviation of the whole test session data and divided byquartiles in order to show highest and lowest performing phases.
The final verification of this proof of concept conduction is the verification of all observed andmeasured results described in Chapter 6 and 7 against the research requirements, which is donein the discussion (Chapter 8).
2.3.2.1 System environment
This section describes the environment of the proof of concept conduction, which includes thedevelopment, testing, and usage of CoWebViz.
Development environment. CoWebViz is a server application developed in C++ using theVim editor [97] and Eclipse C/C++ Development Tooling [98] to write the source code and theGNU GCC 4.6.3 [99] for the compilation. It is build on top of following additional libraries:
• The Boost C++ libraries [100] provide a comprehensive collection of well performing andhelpful functions and constructs, which are published under the permissive Boost SoftwareLicense. CoWebViz requires Boost as a dependency for Pion, for the thread managementand shared pointer.
17
2 Methodology
• The Pion network library [101] provides the functionality of a lightweight HTTP serverthat is included into CoWebViz to manage most HTTP transactions. It largely utilizes theBoost asio library [102] and is therefore also published under the Boost Software License.
• The X library (Xlib) [103] is provided by the X-Server to use its functionality programmat-ically. It is published under the MIT License and required by CoWebViz to screen-scrapethe visualization from a visualization application and to send control commands to thevisualization.
• libjpeg-turbo [104] is a library that has the same interface and functionality as the Inde-pendent JPEG Group’s standard library [105] with the addition of being 2-4 times faster.It is published under the wxWindows Library License and is required for its faster JPEGcompression.
• FFmpeg [106] is a cross-platform library with various functionalities for multimedia han-dling. It is published under LGPL and GPL and required for its image scaling functionalityand its various input and output formats, e.g. to integrate webcam streams.
• jQuery [107] is a JavaScript library that provides a common interface to the functionality ofmost existing web browsers. It is published under the GPL and required for various clientside functionalities, especially for capturing mouse and keyboard events.
Server environments. CoWebViz currently depends on other applications to render the visu-alization, which was MedVolViz during the proof of concept conduction. MedVolViz is a medicalvolume-rendering engine based on the parallel-processing volume rendering engine vl3. vl3 wasdeveloped by collaborators of the working group at the Argonne National Laboratories. Med-VolViz was mainly developed by Nigel M. Parsad at the University of Chicago’s Department ofSurgery. Together, it is a visualization engine for the usage on clustered computers in order torender high-resolution volume visualization with high-performance. Besides the high-performingnature, MedVolViz provides all the basic manipulation mechanisms to explore a medical vol-ume dataset, as for example rotating, panning, zooming, clipping, and transfer function manip-ulations. MedVolViz supports multiple colorization modes, creating either standard grayscaleor automatic realistic, spectral, and thermal colorized visualizations in a default or perceptualmode [6]. MedVolViz can render high-resolution stereoscopic images displayed as side-by-sidestereoscopic content. [108]
CoWebViz was mostly used on lightsaber (including all performance test runs), which is a visu-alization cluster located at the University of Chicago’s Computation Institute. Lightsaber had 8worker nodes and 1 head node, each with an Intel Core i7-920 quad-core processor, 6GB of DDR31066 RAM and two NVIDIA 275GTX GPUs running in SLI mode. The head node merged the vi-sualization rendered in parallel by the worker nodes. CoWebViz ran on the head node to capturethe final visualization.
18

2.3 Proof of concept conduction
Client environment. CoWebViz’s client was tested and used on following computer types:1. Laptop: with a 2.4GHz Intel Core 2 Duo CPU, 4GB of DDR3 1067 RAM and a NVIDIA
GeForce 9400M graphics card, running Mac OS X Lion2. Desktop PC: with a 2.8GHz Xeon Nocona CPU, 1GB RAM and a Radion 9250 graphics
card, running Windows XP3. Cloud instance: Amazon EC2 Micro Instances with a 613MB RAM and no graphics card
in zone us-east-1b, running Ubuntu 12.04Most tests were conducted within the University of Chicago network, having following downloadconditions at the time of the test conduction:
1. LAN at the Crerar Library of the University of Chicago: ∼40 Mbps2. LAN at the Computation Institute: ∼90 Mbps3. WI-FI at the Computation Institute: ∼10 Mbps4. LAN at the EC2 instance: ∼80 Mbps (The available throughput varied heavily during the
test conduction using the micro instance)5. Lower connections were tested via bandwidth throttling using wondershaper5
2.3.2.2 Evaluation methodology for the immersive virtual anatomy class
Since 2006 an immersive virtual anatomy class was held to undergraduate biology students atthe University of Chicago [36]. The class evolved over time from a simple setup (with a directvisualization cluster connection) to a class with "multi-location, multi-direction and multi-streamsharing of video, audio, desktop applications and cluster based stereo volume rendering" [108].Since this thesis’ results affect the class procedure, the previous class usage is described in thissection and the resulting modifications related to the usage of CoWebViz in Chapter 5.
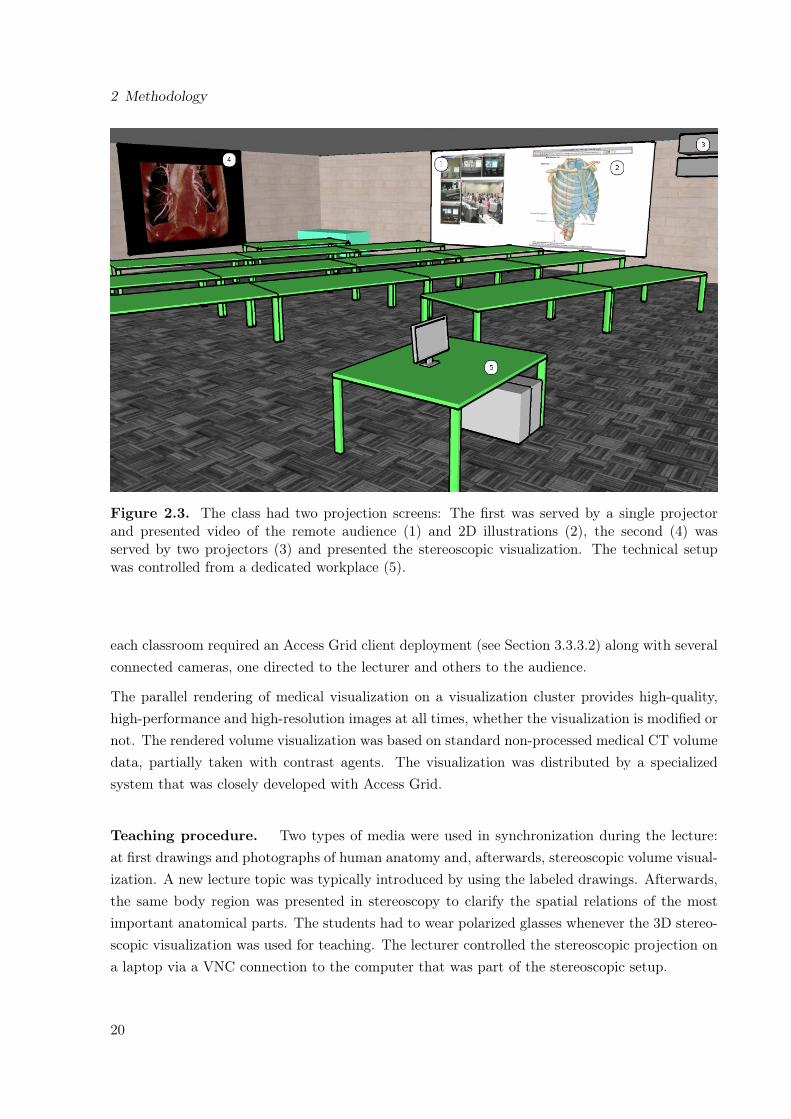
The class environment. The class was lectured live at the University of Chicago (Chicago,IL, USA), but was setup to be completely shareable with remote classrooms. In recent years, itwas shared with the Cardiff School of Computer Science and Informatics of Cardiff University(Cardiff, UK).The local setup of a single classroom is illustrated in Figure 2.3. Each classroom had two projec-tion screens: The first was used for the group-to-group videoconferencing system Access Grid [110]to display streams of the remote group (Fig. 2.3–1) and the shared web browser (Fig. 2.3–2).The latter was used to share 2D illustrations and photographs of human anatomy, which werestored on a web-accessible HTTP server directory. The second projection screen was part of atwo-projection stereoscopic setup (see GeoWall in Section 3.2.2.4) and was used to present 3Dstereoscopic visualization based on CT data (Fig. 2.3–3/4).The class’ collaborative functionality completely relied on Access Grid, which was used to streamvideo streams from the lecturer and the audiences to and from a remote location. Consecutively,
5The Wondershapter is a traffic shaper that allows to reduce the bandwidth connection [109].
19
2 Methodology
Figure 2.3. The class had two projection screens: The first was served by a single projectorand presented video of the remote audience (1) and 2D illustrations (2), the second (4) wasserved by two projectors (3) and presented the stereoscopic visualization. The technical setupwas controlled from a dedicated workplace (5).
each classroom required an Access Grid client deployment (see Section 3.3.3.2) along with severalconnected cameras, one directed to the lecturer and others to the audience.
The parallel rendering of medical visualization on a visualization cluster provides high-quality,high-performance and high-resolution images at all times, whether the visualization is modified ornot. The rendered volume visualization was based on standard non-processed medical CT volumedata, partially taken with contrast agents. The visualization was distributed by a specializedsystem that was closely developed with Access Grid.
Teaching procedure. Two types of media were used in synchronization during the lecture:at first drawings and photographs of human anatomy and, afterwards, stereoscopic volume visual-ization. A new lecture topic was typically introduced by using the labeled drawings. Afterwards,the same body region was presented in stereoscopy to clarify the spatial relations of the mostimportant anatomical parts. The students had to wear polarized glasses whenever the 3D stereo-scopic visualization was used for teaching. The lecturer controlled the stereoscopic projection ona laptop via a VNC connection to the computer that was part of the stereoscopic setup.
20

2.3 Proof of concept conduction
2.3.2.3 Performance test procedure
All performance tests were conducted via following methodology, which was required for a con-sistent data collection.
Testing CoWebViz and its specific visualization transfer methods. The test datadescribed in Section 7.1 was created by a broad metadata logging functionality on the server- andclient side. The data on the server side were recorded by CoWebViz’s internal logging functionalitythat allowed to record data of any functionality, especially the sending of new images to the client.The visualization output channel was monitored to collect the JPEG quality, the image resolution,the current file size and other internal values. The control input channel was monitored to collectarriving command events. On the operating system level, CoWebViz was monitored by a processthat continuously collects the following performance values using the Linux command top6: CPUload in percent and the real and virtual memory usage. During some tests, also the client’s webbrowser was monitored by collecting the same performance values via top6 as on the server side.The data was collected as summary of one second of the test conduction.The tests itselves were conducted via a strict protocol with alternating sequences of modifyingand not modifying the visualization for 180 seconds, with each sequence being 30 seconds longstarting with a non-modification phase. The modification was conducted manually on the webbrowser by moving the mouse as fast as possible in order to demonstrate the peak performanceusage. The mouse modification did not need to be automated because the event rate was higherthan the visualization rate.
Testing and comparing CoWebViz and related work applications. The performancecomparison of CoWebViz with related work applications described in Section 7.2 required blackbox testing on the client side. A simple Java application was written that simulated a visualizationusage and measured the resulting visualization changes. As input, it sends mouse events in adefined area on the test system’s desktop, where the visualization application was located duringthe test session. It keeps track of the colorization changes in a desktop’s single pixel within thesame desktop area as previously described and logs the delay between these changes. The outputis a list of frame rates for each second of the test session. For each application, the test wasconducted for 30 seconds at two different daytimes.
6Top is a standard Linux tool to display information about current processes.
21
3 Background and related work
This chapter starts with the presentation of background information about medical visualization(Section 3.1) and visualization with depth perception (Section 3.2). Both are essential parts ofthis proof of concept conduction and necessary to fully understand the thesis’ overall approach.
Related work about techniques that enable collaborations of remote groups with shared visual-ization – the key interest of this thesis – is described in Section 3.3. It starts with an overviewabout the different sharing approaches and ends with the specific state of the art of sharingvisualization.
3.1 Medical Visualization
The early beginnings of medical imaging technologies – technologies that image the interior of aliving human body without surgery – lie in the end of the 19th century. At this time the discoveryof X-ray beams led to first products that were capable of producing flat two-dimensional (2D)images of the three-dimensional (3D) body [111]. This development was followed by other 2Dimaging modalities, as e.g. sonography and nuclear medical imaging. But still today, X-ray isone of the most important imaging modalities and builds the foundation of medical imaging [42].
The 3D data acquisition of a living body was not possible until about 1972 [112], when thedevelopment of computed tomography (CT) allowed the first time the recording of 3D image rep-resentations of the living human body. 3D/4D Sonography, MRI, Positron Emission Tomography(PET), and Single Photon Emission Computed Tomography (SPECT) are examples for furtherimportant developments that acquire 3D data [113, Ch. 3].
The new possibilities given by the acquisition of CT volume data stimulated medical imagingtechnologies, which concluded in the beginning of medical visualization as new scientific field inthe late 1980s. Medical visualization is a specialty of scientific visualization and deals "with theanalysis, visualization, and exploration of medical image data" [113, Ch. 1].
The following sections describe the basic concepts of 3D visualization in order to highlight the needfor volume visualization and the need to use it via remote visualization approaches (Section 3.1.2),based on an overview about 2D and 3D data types (Section 3.1.1).
22

3.1 Medical Visualization
Figure 3.1. A single cross-sectional CT image on the left and cutouts on the right. Each cutoutis magnified to show its pixel structure.
3.1.1 Imaging data types
This section provides a basic overview about 2D and 3D imaging. Both imaging types are alsoused for more advanced imaging techniques, as e.g. time-resolved, multi-modal imaging, or acombination of both [114].
2D imaging. Technically, a 2D image is a 2D array of pixels (a raster graphic). The pixelstructure is illustrated in Figure 3.1, with a CT image slice on the left and two magnified cutoutson the right. Pixels have an image-specific bit size that may be further divided into sub-pixels.In the case of grayscale, the whole image pixel bit size is used for a single gray value, which e.g.allows in the case of a 12 bit image one of 212 = 4096 distinct gray values for each pixel. In thecase of color images, the bit rate is divided by the number of sub-pixels. An RGB1 True-Color2
image allows for instance for 256 distinct values for each color, which results in 16,777,216 distinctcolor values for a pixel. The bit rate values and image resolution directly results in a specific filesize of an uncompressed image. Compression algorithms are used to reduce the image size bymultiples of the original. [3, Ch. 3]
Digital Imaging and Communications in Medicine (DICOM) is the main standard for imageprocessing (e.g. storage and transfer) in medicine [115]. It supports a built-in native imageformat without compression and various external encapsulatable standards. Among them are RunLength Encoding (RLE), JPEG file interchange format (JIF, JPEG), JPEG lossless, JPEG 2000,and MPEG2 [116].
Over 60% of all diagnostic imaging procedures are based on the 2D projection of X-rays [3].An X-ray image is the result of the projection of X-ray beams on a film cassette or a digitaldetector array, which are created in a vacuum tube. The resolution of X-ray images differsdepending on the application. A typical X-ray resolution is 2048x2048 to 1780x2160 pixel with12 bit per pixel. The image resolution for a mammography is higher with up to 4000x5000 pixel.
1RGB is a color model consisting of the three colors red, green, and blue.2True-Color uses 24 bit per pixel, with 8 bit per sub-pixel that leads to 28 = 256 color values per sub-pixel.
23
3 Background and related work
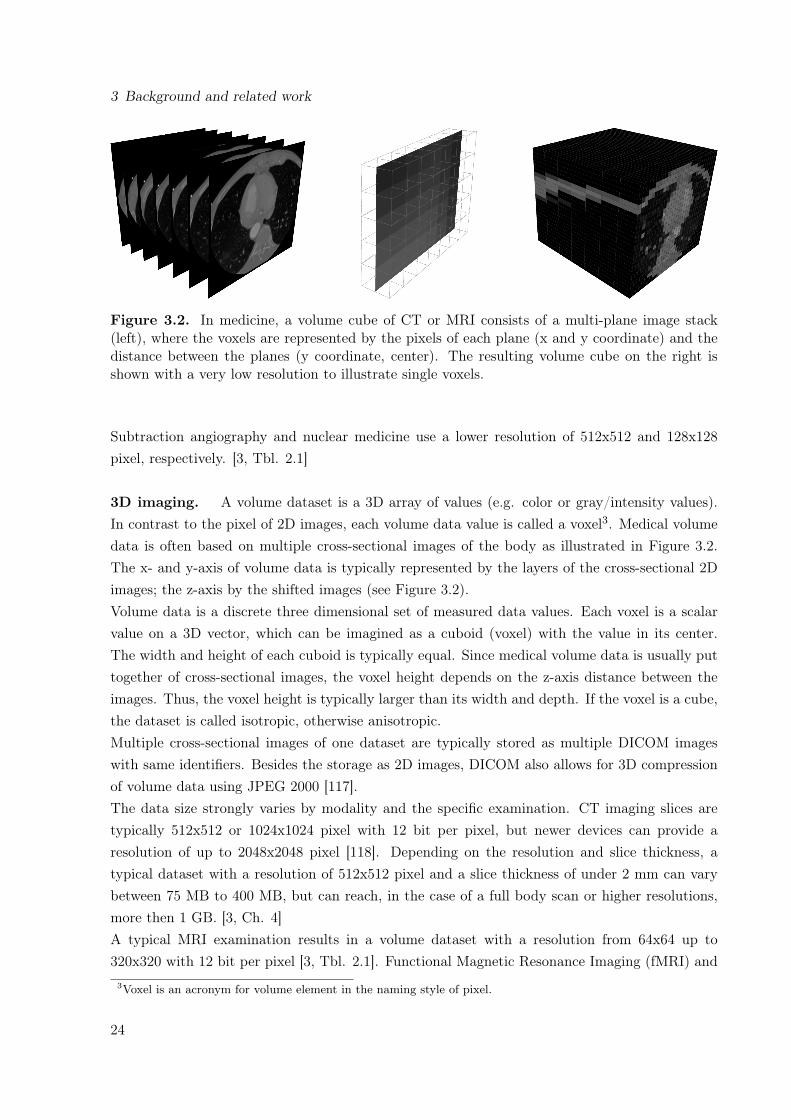
Figure 3.2. In medicine, a volume cube of CT or MRI consists of a multi-plane image stack(left), where the voxels are represented by the pixels of each plane (x and y coordinate) and thedistance between the planes (y coordinate, center). The resulting volume cube on the right isshown with a very low resolution to illustrate single voxels.
Subtraction angiography and nuclear medicine use a lower resolution of 512x512 and 128x128pixel, respectively. [3, Tbl. 2.1]
3D imaging. A volume dataset is a 3D array of values (e.g. color or gray/intensity values).In contrast to the pixel of 2D images, each volume data value is called a voxel3. Medical volumedata is often based on multiple cross-sectional images of the body as illustrated in Figure 3.2.The x- and y-axis of volume data is typically represented by the layers of the cross-sectional 2Dimages; the z-axis by the shifted images (see Figure 3.2).Volume data is a discrete three dimensional set of measured data values. Each voxel is a scalarvalue on a 3D vector, which can be imagined as a cuboid (voxel) with the value in its center.The width and height of each cuboid is typically equal. Since medical volume data is usually puttogether of cross-sectional images, the voxel height depends on the z-axis distance between theimages. Thus, the voxel height is typically larger than its width and depth. If the voxel is a cube,the dataset is called isotropic, otherwise anisotropic.Multiple cross-sectional images of one dataset are typically stored as multiple DICOM imageswith same identifiers. Besides the storage as 2D images, DICOM also allows for 3D compressionof volume data using JPEG 2000 [117].The data size strongly varies by modality and the specific examination. CT imaging slices aretypically 512x512 or 1024x1024 pixel with 12 bit per pixel, but newer devices can provide aresolution of up to 2048x2048 pixel [118]. Depending on the resolution and slice thickness, atypical dataset with a resolution of 512x512 pixel and a slice thickness of under 2 mm can varybetween 75 MB to 400 MB, but can reach, in the case of a full body scan or higher resolutions,more then 1 GB. [3, Ch. 4]A typical MRI examination results in a volume dataset with a resolution from 64x64 up to320x320 with 12 bit per pixel [3, Tbl. 2.1]. Functional Magnetic Resonance Imaging (fMRI) and
3Voxel is an acronym for volume element in the naming style of pixel.
24

3.1 Medical Visualization
Diffusion Tensor Imaging (DTI) techniques need to acquire multiple volume datasets for a singleexamination. In case of fMRI, this can be up to 400 volumes per examination. [3, Ch. 4]
3.1.2 Basic visualization techniques
This section described the two fundamentally differing medical visualization techniques. Whereasvolume visualization is the direct rendering of the volume dataset into a 2D image, surfacevisualization requires additional processing steps via geometrical objects to get a 2D image.
Figure 3.3. The principle of volume visualization: The volume cube introduced in Figure 3.2is shown again with a low voxel resolution. Virtual rays traverse the volume, each directed fromone pixel of a virtual image plane (center) and result in a grayscale volume visualization on theright (Created by MedVolViz [108]).
Volume visualization. Most display devices (e.g. standard displays) require a 2D image asinput. Volume data, in contrast, is a 3D array of values, which needs to be converted into a 2Draster graphic to be displayable. This process, of directly mapping a complete set of volume datato a raster graphic is called (direct) volume visualization. It is a mapping of all volume datavoxels to raster graphic pixels, without the usage of intermediate formats.A very basic algorithm to create such a volume visualization is volume ray casting. In a simplifiedversion, ray casting works as illustrated by a virtual scenery in Figure 3.3. This virtual sceneryhas a camera that is positioned in front of the volume dataset. In-between the camera andthe data is a virtual image plane, a raster with the resolution of the resulting image. For eachimage plane pixel, a virtual ray is sent from the camera that traverses the whole volume. Eachray accumulates every voxel value on its path, which results in a calculated single value for itspixel. Transfer functions are used to select and change the representation of each voxel as theray traverses the volume, e.g. used to colorize or hide specific voxels. [113, Ch. 8]Every modification of the scenery (e.g. zooming or rotating) requires a whole new volume ren-dering. Alternative algorithms have been developed to render a volume with less hardware re-quirements, e.g. shear-warp [119] and splatting [120].
25
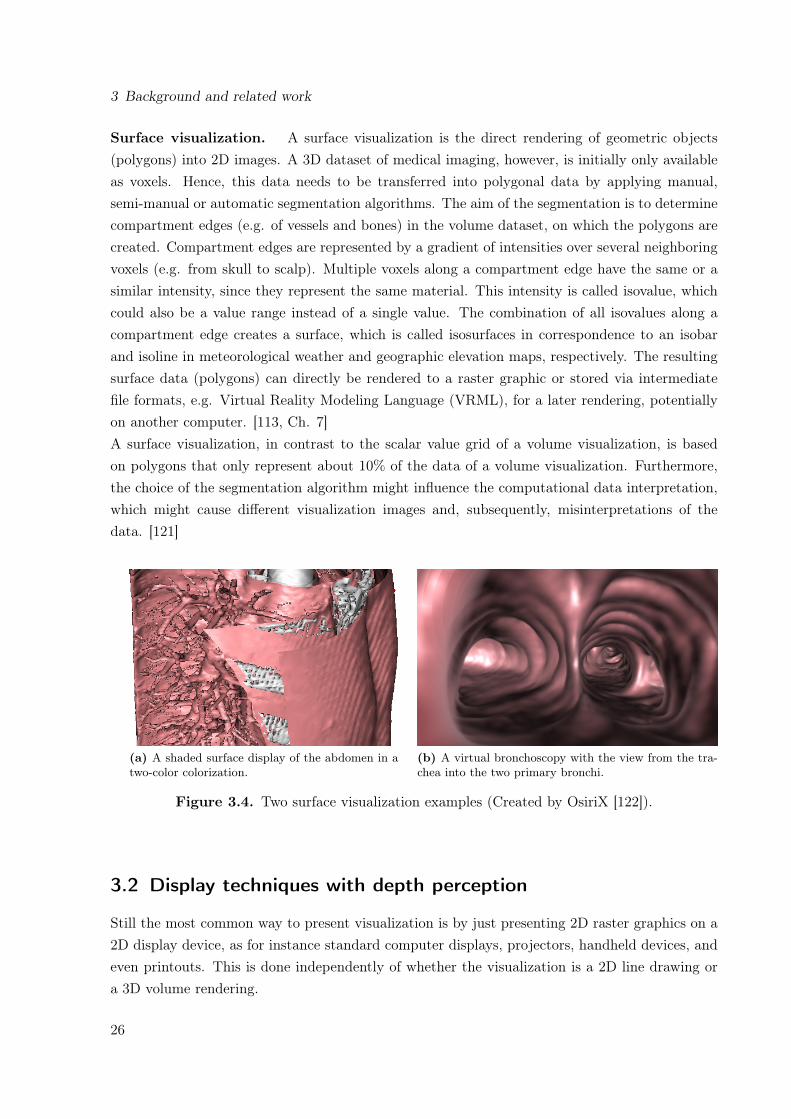
3 Background and related work
Surface visualization. A surface visualization is the direct rendering of geometric objects(polygons) into 2D images. A 3D dataset of medical imaging, however, is initially only availableas voxels. Hence, this data needs to be transferred into polygonal data by applying manual,semi-manual or automatic segmentation algorithms. The aim of the segmentation is to determinecompartment edges (e.g. of vessels and bones) in the volume dataset, on which the polygons arecreated. Compartment edges are represented by a gradient of intensities over several neighboringvoxels (e.g. from skull to scalp). Multiple voxels along a compartment edge have the same or asimilar intensity, since they represent the same material. This intensity is called isovalue, whichcould also be a value range instead of a single value. The combination of all isovalues along acompartment edge creates a surface, which is called isosurfaces in correspondence to an isobarand isoline in meteorological weather and geographic elevation maps, respectively. The resultingsurface data (polygons) can directly be rendered to a raster graphic or stored via intermediatefile formats, e.g. Virtual Reality Modeling Language (VRML), for a later rendering, potentiallyon another computer. [113, Ch. 7]A surface visualization, in contrast to the scalar value grid of a volume visualization, is basedon polygons that only represent about 10% of the data of a volume visualization. Furthermore,the choice of the segmentation algorithm might influence the computational data interpretation,which might cause different visualization images and, subsequently, misinterpretations of thedata. [121]
(a) A shaded surface display of the abdomen in atwo-color colorization.
(b) A virtual bronchoscopy with the view from the tra-chea into the two primary bronchi.
Figure 3.4. Two surface visualization examples (Created by OsiriX [122]).
3.2 Display techniques with depth perception
Still the most common way to present visualization is by just presenting 2D raster graphics on a2D display device, as for instance standard computer displays, projectors, handheld devices, andeven printouts. This is done independently of whether the visualization is a 2D line drawing ora 3D volume rendering.
26

3.2 Display techniques with depth perception
A real-life scenery has, in contrast to such simple display devices, a depth that the human visionsystem perceives via multiple cues, some of which can also be experienced in simple 2D images(a monoscopic image). These depth cues are described on following example with a city streetscenery of cars and houses: A car usually has a known size, which helps to identify the relativesizes of objects that are close by, as for example a house wall. Another car, which is coveredby the first, is clearly farther away from the viewer then the first (interposition). A strong lightsource in the back that leads to long shadows in the front helps to give a cue of the distanceof the light and the distance of the car to the viewer. These and other cues are some of theones that exist in all monoscopic images, which are not solely bound to photographs but alsoto medical visualization types. But if the viewer would have multiple 2D images of the same3D scenery taken from different positions in the scenery, it would see all objects from differentpositions and, thus, would get a much broader impression of the three-dimensional positioning ofall objects. Another way to get this impression is by moving through the scenery via monoscopicimages. Such a motion-parallax can be experienced while moving a virtual or real camera througha virtual scenery or by manipulating (e.g. rotating, zooming) these objects in front of the camera.[123, Chap. 11]
Stereoscopic images additionally allow for stereopsis (also called retinal disparity or stereo par-allax [124]), which simultaneously provides the brain with two images of the same scenery froma slightly different angle (based on distance between the human eyes). As in real-life vision, thebrain can use these images to calculate the depth of all objects and, thus, provide an intuitiveperception of depth. Not all existing depth cues are already served by currently popular stereo-scopic systems, which therefore might still lead to personal discomfort while viewing stereoscopicvisualization [10]. Such cues are for example the ones that are based on eye muscle movements,which are accommodation (the eye’s adaption to the distance) and convergence (the lateral andnasal eye movement) [123, Chap. 11].
Two or more 2D images of the very same object have to be provided for a single stereoscopicvisualization. These images have to be created (e.g. rendered or taken by a camera) in one pointin time from a slightly different angle [125]. A specific stereoscopic content is often necessaryto be used on specific stereoscopic display devices, which is the format in which these imagesare provided to the system. An overview of common stereoscopic systems and often supportedcontent types is therefore provided in Section 3.2.2. These devices have in common that theyprovide a specific method to lead a left and right image to one or multiple user’s left and righteyes, respectively. But they particularly differ in the way, they achieve this. The most basicand existing principles are therefore described in Section 3.2.1. The list and description of thesetechniques is not complete and is rather provided to give an overview of different techniques andideas.
27
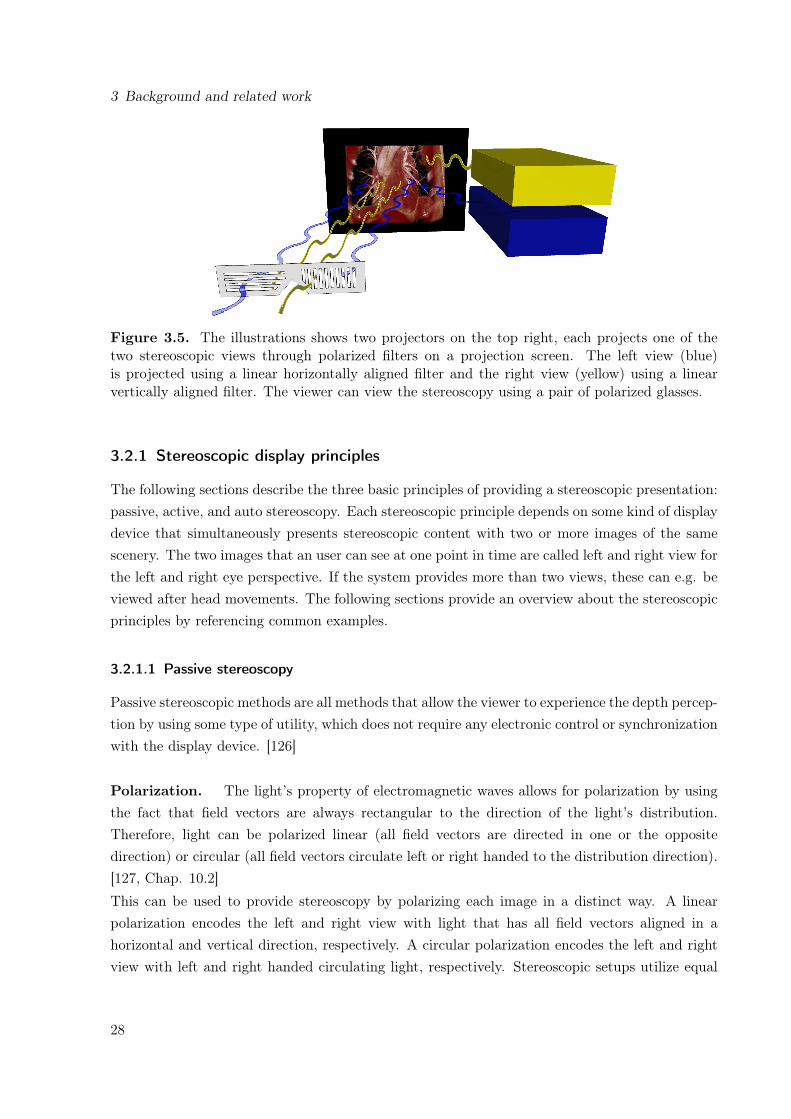
3 Background and related work
Figure 3.5. The illustrations shows two projectors on the top right, each projects one of thetwo stereoscopic views through polarized filters on a projection screen. The left view (blue)is projected using a linear horizontally aligned filter and the right view (yellow) using a linearvertically aligned filter. The viewer can view the stereoscopy using a pair of polarized glasses.
3.2.1 Stereoscopic display principles
The following sections describe the three basic principles of providing a stereoscopic presentation:passive, active, and auto stereoscopy. Each stereoscopic principle depends on some kind of displaydevice that simultaneously presents stereoscopic content with two or more images of the samescenery. The two images that an user can see at one point in time are called left and right view forthe left and right eye perspective. If the system provides more than two views, these can e.g. beviewed after head movements. The following sections provide an overview about the stereoscopicprinciples by referencing common examples.
3.2.1.1 Passive stereoscopy
Passive stereoscopic methods are all methods that allow the viewer to experience the depth percep-tion by using some type of utility, which does not require any electronic control or synchronizationwith the display device. [126]
Polarization. The light’s property of electromagnetic waves allows for polarization by usingthe fact that field vectors are always rectangular to the direction of the light’s distribution.Therefore, light can be polarized linear (all field vectors are directed in one or the oppositedirection) or circular (all field vectors circulate left or right handed to the distribution direction).[127, Chap. 10.2]
This can be used to provide stereoscopy by polarizing each image in a distinct way. A linearpolarization encodes the left and right view with light that has all field vectors aligned in ahorizontal and vertical direction, respectively. A circular polarization encodes the left and rightview with left and right handed circulating light, respectively. Stereoscopic setups utilize equal
28
3.2 Display techniques with depth perception
polarized filters on the projector and viewer side, which are distinct for each eye perspective [128].A viewer can tilt its head without impairment in the case of circular polarization, but not in thecase of a linear polarization. Polarized glasses do not interfere the visible light spectrum and areretaining the view’s correct colorization.
Spectral division. The visualization views can also be encoded into the visible spectrum ofthe light. A long existing technique is anaglyph stereoscopy, which utilizes two views that areencoded in one of two complementary colors superimposed in a single image. A typical colorcombination with a good color representation is red-cyan4 [128, 129]. A viewer wears glasseswith colored lenses, the left and right lens are colored in correspondence to the colored views.However, through to the color encoding, anaglyph images have the disadvantage of providing astereoscopic visualization with colors that are not equal to the original image colors. This principlehas the advantages of being perceivable on almost any display devices (including printouts) byonly requiring low cost glasses and, therefore, is widely available.
A similar variant with a better color experience is INFITEC (INteferenzFIlterTEChnik) [130].This method divides the visible spectrum of the light into six spectral bands, with two bands foreach of the three colors red, green, and blue.
3.2.1.2 Active stereoscopy
Active stereoscopic methods require the viewer to use a special utility (e.g. shutter glasses), whichis synchronized with the display device. [126]
Shutter systems. Shutter systems require each viewer to wear glasses that are synchronizedwith the display device. The left and the right view is shown on a single display device consec-utively one after another, each for a very short time frame. The synchronization is necessaryto prevent the left eye from seeing the right view and vice versa. It is done by blackening theopposing lens of the currently presented view (e.g. the left lens is transparent when displayingthe right view) [126]. The consecutive presentation of both views has to be done with a frequencythat is higher than used on standard displays (e.g. 120 Hz, 60 Hz for each view) to keep up theimpression of a movie and to avoid flickering.
3.2.1.3 Auto stereoscopy
Auto stereoscopic methods provide a stereoscopic perception without any additional tools on theviewer side. A wide range of auto stereoscopic techniques already exist, but many are still indevelopment. [124]
4In the RGB color model, the left view is often encoded in the red channel and the right view in the green andblue channels [129].
29

3 Background and related work
Spatial multiplexing. Spatial multiplexing is the presentation of the whole stereoscopic con-tent simultaneously, with all views being merged into a single image (pixel or sub-pixel wise). Itrequires a special display that is usually based on standard high-resolution display panels, whichis overlaid with an additional optical component directly in front of the panel. This componentis responsible to lead the viewer’s eyes to the proper view’s pixels. Such systems can provide onestereoscopic view (a left and a right view), but also multiple stereoscopic views as e.g. 5 or 8[131]. Multi-view systems allow the viewer to see different stereoscopic views of the same sceneryduring a head movement. [124]
Frequently used techniques are parallax-barrier and lenticular displays. The first for instanceutilizes opaque stripes that block the viewer’s eyes from seeing some pixels from specific viewingpositions [132]. The second uses half-cylindrical lenses to lead the view from specific viewingpositions to the according view pixels [133]. Integral displays are similar to lenticular displays,but use a 2D array of small hemispheric lenses, instead of vertically aligned lenses [134]. Theyallow the viewer to move the head not only to the left and right, but also up and down [135, 136].Spatial multiplexing devices also exist in variations with head tracking [137] to provide specificviewing zones that automatically adapt to one or multiple viewers. Other systems are describedthat use some kind of display or projection technique in correlation with various types of mirrorsto lead the views to the viewer’s eyes [138].
All methods mentioned above have in common that they have optimal viewing zones in frontof the display and that the resolution of the underlying display is virtually reduced with moreviews. In the case of the parallax-barrier and lenticular displays the resolution is only reducedhorizontally, but in the case of the integral display also vertically.
Volumetric. Volumetric systems provide an almost real-life representation of virtual objects,which allows the viewer to walk around the device and view the object from all sides.
Swept volume displays require a moving display device and many single views from all around theobject that is to be presented. While the rendering of the views is complex but straightforward,the presentation needs to be done by some mechanism that allows to present the views at theright position, time, and angle in reality. "The key to this technique lies in interpreting the inputimages as 2D slices of a 4D function – the light field" [139]. Such a presentation could e.g. bedone with a display panel mounted on a rotating plate [140] or by projecting the visualization ona rotating projection surface [141, 142].
A static volume display is a technique that presents any visualization pixel statically at all timesat the right location. One example is the DepthCube, which is presented by Sullivan et al. [143].It consists of a stack of 20 transparent liquid-crystal panels, each presenting a single volume slice.An early stage development to display volumes statically is the usage of infrared lasers to createplasma dots right in the air. Saito et al. [144] describe such a system that can create 1000 dotsper second in a 50x50x50 cm space. Hoshi et al. [145] describe such a system with colorizationthat can even be "touched".
30
3.2 Display techniques with depth perception
Semi-volumetric. Modern handheld devices allow for a completely new way to explore data.Such devices are small and have many built-in sensors that provide enough data to get it’s exactspacial orientation. Subsequently they can be used as a movable window to a virtual datasetin the real world. They do not necessarily provide stereoscopy, but still a depth perception viamotion-parallax. J. Francone et al. [146] describe for instance a system that constantly re-rendersa 3D scenery towards the viewers current viewpoint. This allows the viewer to see other sidesof the visualization after a head or device movement. A built-in front camera is used to get theviewer’s position and distance to the device, which is then used to render the specific visualization.Subsequently, the viewer can explore a virtual object with a tablet PC as if the tablet is a realworld representation of this object itself in the viewer’s hands.
3.2.2 Common visualization setups
The main principles of providing stereoscopic visualization were described in the previous Sec-tion 3.2.1. This section has its emphasis on the technical setups that allow to use stereoscopicvisualization by utilizing these principles.
3.2.2.1 Standard monoscopic displays and projectors
Some stereoscopic principles can be used on standard 2D displays and projection screens. Thesimplest and most easily deployable method is the usage of anaglyph stereoscopy (see Section3.2.1.1), which can be displayed on almost any display type, including printouts. To allow thebest possible quality with fewest ghosting and other stereoscopic artifacts, the display is ideallycolor calibrated. Each viewer does only require to wear glasses that correspond to the colorencoding of the anaglyph images. Such are of low cost and may even be already at hand, becausethey are often shipped with magazines, books, and others. The number of possible viewersdepends on the display size and quality, but is not limited by the technique. Its image quality islow, due to the color encoding.Shutter systems can also be used on standard displays (see Section 3.2.1.2), because the leftand the right view is presented one after the other. However, these systems require additionaltechnical equipment for the synchronization between the computer and each pair of glasses. Suchis available as external hardware for standard displays [147] or included in stereoscopic displays.Such systems are of relative low cost, as they are based on existing hardware. As previously, thenumber of viewers and the quality depends on the display.
3.2.2.2 Stereoscopic displays
Various companies provide stereoscopic displays using passive, active, and auto stereoscopy. Es-pecially active and passive stereoscopic displays are already widely available on the consumermarket, after the movie industry pushed stereoscopic movies in recent years. Some of the dis-
31

3 Background and related work
plays present both views simultaneously at the same time (e.g. passive displays). This, however,leads to a final horizontal resolution, that is divided into halves. The stereoscopic content thatis directly being presented on the display is e.g. half-wide side-by-side, half-high top-to-bottom,interlaced or checkerboard. Such displays usually have a specific range in front of the display,from where the visualization can be experienced best. Thus, the number of viewers is limited bythe space in front of the display and the number of available glasses.Auto stereoscopic displays are also available on the market, but are compared to the passive andactive displays of higher cost. Auto stereoscopic systems also provide two views, but their fullcapabilities can only be experienced with multi-view visualization. Multi-view systems, however,are more complex in terms of creating, processing, especially transferring, and displaying thecontent than in the case of the other two types. Auto stereoscopic displays usually can only beviewed from specific viewing areas in front of the display, which limits the amount of viewers.The visualization content that is directly presentable with depth perception on such a display isa single multi-view image, with all images merged into one (often on the sub-pixel level).
3.2.2.3 Tiled displays
A matrix of multiple horizontally and/or vertically arranged displays is called a tiled display.Simple variations of these are widely used at offices to span an increased desktop across two orthree displays or projectors. More complex systems were developed to display high-resolutionmonoscopic visualization on up to 72 displays [148–150]. In contrast to a single projection screenthat might have the same horizontal and vertical dimensions, a tiled display accumulates theresolution of each display. Tiled displays can be used to present visualization with a resolutionabove 300 Megapixel [150, 151]. Such displays system are not only very expensive, they addition-ally need a clustered computer to manage the high definition desktop metaphor and may needadditional processing power to calculate such a high resolution visualization [152].Tiled displays are also build by using active, passive, and even auto stereoscopic displays. Sandinet al. [153] describes e.g. a tiled autostereoscopic display with passive parallax barrier screentiles, which allows to view a stereoscopic visualization with a resolution of 11,200 x 6,000 pixel.Febrettia et al. describe the CAVE2 [150], a passive tiled display with 36 Megapixel per eye,which are about 98,000 x 55,000 pixels.
3.2.2.4 Special projection screens
Special projection screens can be used to provide various types of large scale stereoscopic visual-izations. Such systems exist that are usable by single persons or small groups as for example theCyberDome [154] or the ImmersaDesk [155].A GeoWall [156] is a passive stereoscopic projection system with consumer grade hardware andpolarized filters (see Section 3.2.1.1). It is one of the cheapest possibilities to build-up a largeprojection-based stereoscopic setup for a larger audience. It uses a polarization pertaining silver-
32
3.3 Remote sharing of interactive visualization in real-time
screen and two aligned projectors. Each projector projects either the left or the right view, bothoverlaid on top of each other on the screen. The similar principle is also used in many movietheaters, however with improved technology [157]. Even auto stereoscopic projection systemswere described [158].A Cave Automatic Virtual Environment (CAVE) is a cube like room with stereoscopic projectionscreens as walls [159]. Either rear or front polarization pertaining projection screens are used,each is typically served by one or two projectors. Each viewer requires polarized glasses andstays inside the cube to fully immerse into the visualization. There are many variants of CAVEprojection systems, that for instance do include all walls, the ceiling, and the floor (full CAVE) oronly include three screens around a corner. A CAVE also allows for improved immersive remotecollaboration types [160].There are even systems that provide a similar environment as a full CAVE, but on a largescale. The Allosphere [161] for instance is a large-scale sphere that combines large surroundingstereoscopic visualizations together with a 3D sound system.
3.3 Remote sharing of interactive visualization in real-time
Sharing interactive visualization in real-time is the viewing and modifying of visualization jointlyby multiple participants at different locations for the specific time of a visualization session. Itis an extension of a pure local visualization usage and requires its sharing, with all of its statechanges between all participants. Thus, the most basic design principle of a remote collaborativevisualization system is the choice of where the visualization that is to be shared is to be rendered.This may be done on a single central location (server side rendering) or on every client computer(client side rendering).Advantages and disadvantages of client- and server side rendering are described in Section 3.3.2.This foundation is then used to describe the state of the art techniques that enable a sharedvisualization in Section 3.3.3. The related work that is directly related to this thesis is describedin Section 3.3.3.2. A summary of it and a selection of additional prominent projects is presentedin Table 3.2.This section starts with the description of basic network characteristics that are important for ashared interactive visualization system in following subsection.
3.3.1 Network aspects of interactive systems
The network type, on which a remotely shared system is based, has a substantial influence onthe visualization performance (e.g. frame rate) and network load (e.g. bandwidth usage). Ingeneral, following basic network aspects are to be considered for such a system: (1) the networkcharacteristics (connection-oriented/less, routing schema, latency, and bandwidth) and (2) thenetwork topology [162]. However, for an application that purely operates on a high level of the
33
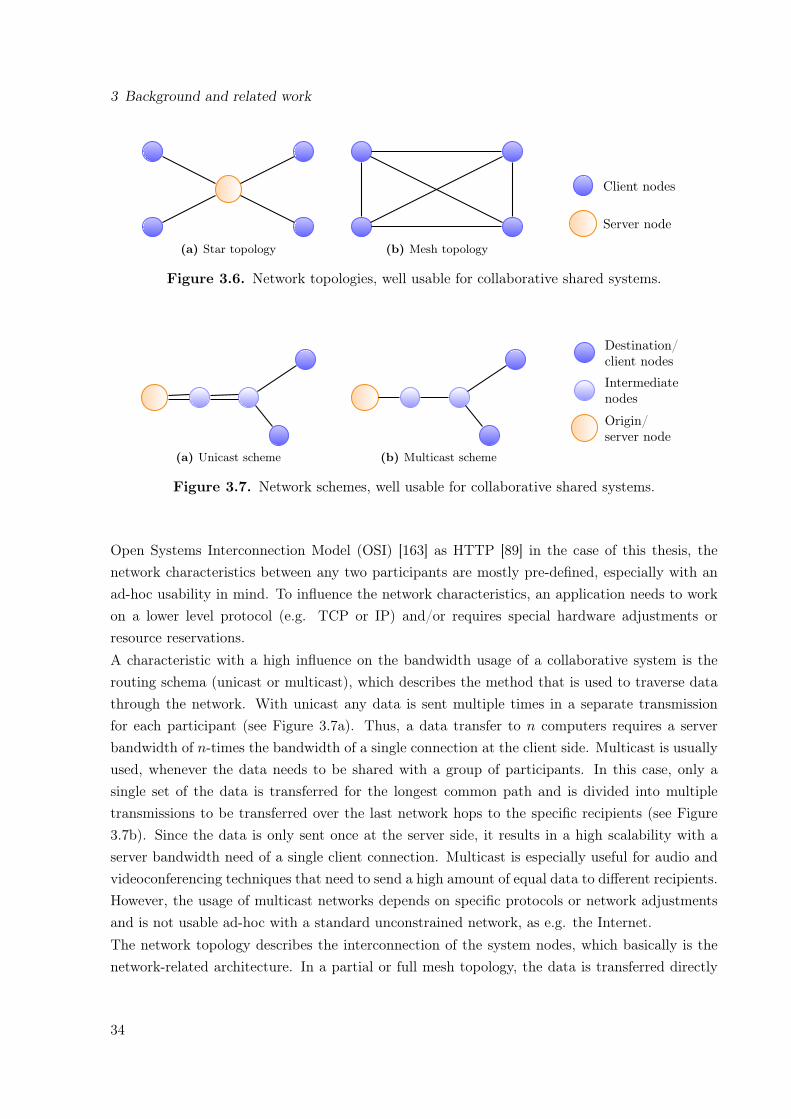
3 Background and related work
(a) Star topology (b) Mesh topology
Server node
Client nodes
Figure 3.6. Network topologies, well usable for collaborative shared systems.
(a) Unicast scheme (b) Multicast scheme
Origin/server node
Intermediatenodes
Destination/client nodes
Figure 3.7. Network schemes, well usable for collaborative shared systems.
Open Systems Interconnection Model (OSI) [163] as HTTP [89] in the case of this thesis, thenetwork characteristics between any two participants are mostly pre-defined, especially with anad-hoc usability in mind. To influence the network characteristics, an application needs to workon a lower level protocol (e.g. TCP or IP) and/or requires special hardware adjustments orresource reservations.A characteristic with a high influence on the bandwidth usage of a collaborative system is therouting schema (unicast or multicast), which describes the method that is used to traverse datathrough the network. With unicast any data is sent multiple times in a separate transmissionfor each participant (see Figure 3.7a). Thus, a data transfer to n computers requires a serverbandwidth of n-times the bandwidth of a single connection at the client side. Multicast is usuallyused, whenever the data needs to be shared with a group of participants. In this case, only asingle set of the data is transferred for the longest common path and is divided into multipletransmissions to be transferred over the last network hops to the specific recipients (see Figure3.7b). Since the data is only sent once at the server side, it results in a high scalability with aserver bandwidth need of a single client connection. Multicast is especially useful for audio andvideoconferencing techniques that need to send a high amount of equal data to different recipients.However, the usage of multicast networks depends on specific protocols or network adjustmentsand is not usable ad-hoc with a standard unconstrained network, as e.g. the Internet.The network topology describes the interconnection of the system nodes, which basically is thenetwork-related architecture. In a partial or full mesh topology, the data is transferred directly
34

3.3 Remote sharing of interactive visualization in real-time
from one computer to one, multiple or all others, each via a separate connection (see Figure 3.6b).A hierarchical or a star topology is used to transfer data via one or several central servers (seeFigure 3.6a). [164]
Another aspect that is not directly related to the network characteristics, but influences anydata transfer of client/server architectures using HTTP is the way the data transfer is initialized,whether it is a push or a pull mechanism [164]. Using pull requires every client to initiate thedata transfer itself. In the case of using push the server decides when to transfer the data [165].HTTP provides several techniques that allow to use push and pull, where push is often based onpull, e.g. using long-lived HTTP connections. When comparing these, the push approach resultsin a higher coherence and network performance [166].
3.3.2 Client and server side rendering
Another aspect that highly impacts on the performance and network load of such a system is thechoice between rendering the visualization on the client or server side.
As described in Section 3.2, almost any current display device is based on 2D display panelsor projection screens to display monoscopic (one image for one eye-perspective) and stereoscopicvisualization (two or more eye-perspective images). Subsequently, the final result of a visualizationcreating process usually is a single or multiple 2D images. If these images are being presentedat the location where they are being rendered, it is called a local or client side rendering. Viceversa, if the images are being presented at a remote location, it is called a remote or server siderendering. In the case of remote rendering, the visualization needs to be transferred via a networkto a remote client computer, where it is then being displayed.
A natural but in terms of performance most determining functionality of interactive visualizationsystems is the modification of the visualization, as for instance to rotate, clip, pan, and zoom it.Any modification command results in a modified image that needs to be presented. In the case ofa local visualization, every newly rendered image is directly being displayed on the display devicevia a fast connection in full quality. But in the case of a remote visualization, each modifiedvisualization needs to be updated to the remote computer via a disproportionally slower networkconnection almost always in reduced quality after compression. For a real-time access to thevisualization, the user requires to view the modified visualization within a very short time frameafter the control command was given. This time should be as short and unrecognizable as possible,which is usually within few milliseconds [7].
Both principles are illustrated in Figure 1.1 on page 5 with the data provisioning as central service.The main advantages and disadvantages of client and server side rendering are summarized inTable 3.1. The following paragraphs describe the problems and prospects acompanied with clientand server side rendering methods for sharing visualization with remote participants.
35

3 Background and related work
Client side rendering. A client side rendering requires every client to have a local copy ofthe base data and an application that handles the visualization rendering and synchronizationwith all other clients. Each client eminently requires proper graphics hardware that is sufficientto render the required visualization. If all participants need to work on identical visualization,each control command (e.g. requests to modify the visualization and system configuration) needsto be managed and synchronized.
The most apparent task of a client side visualization is the initial base data transfer to each client.A fast 100 Mbps network connection allows to transfere a dataset of about 0.5 to 2 GB withinabout 1 to 3 minutes. But it may take about 7 to 27 minutes on a slower but more commonlyavailable connection of 10 Mbps. Whereas a participant might wait 3 minutes in the first case,an initial waiting time of 30 minutes is unfeasible.
A multi-user access control management is necessary to allow only one participant to modify thevisualization at any point in time. The synchronization of all clients is therefore unavoidable toprovide every participant with the exact same view. Technically, this could be solved generically
Table 3.1. Server side versus client side rendering.Type Advantages Disadvantages
Client siderendering
◦ Only control commands need tobe transferred on a continuousbasis◦ The server does only have to
provide data and manage thesynchronization (in specific cases)
◦ A visualization session starts witha possibly large and long-lastingdata transfer from the server tothe clients◦ Every client needs adequate
graphics hardware◦ The synchronization between
multiple clients can becomecomplex
Server siderendering
◦ The visualization session has notime-consuming initializationphase (e.g. base data transfer)◦ The clients do not require special
hardware◦ The data stays on the server
(more secure)◦ State synchronization is less
complex (client to server)
◦ The resulting raster graphics haveto be transferred on a continuousbasis to each client as soon asthey are created; Therefore thenetwork traffic of the wholevisualization session is larger◦ The delay between giving a
control command and seeing theresulting visualization is larger(depending on the longerround-trip time to thevisualization renderer)
36

3.3 Remote sharing of interactive visualization in real-time
on the level of the operating system by recording and distributing the mouse and keyboardcommands of the modifying participant to any other client. But in order to have more controlabout the visualization, it could also be solved on the level of the specific visualization application,by keeping track and distributing all visualization parameters (e.g. camera positions and filters).On principle, the data transmission could be done with both, star and mesh topology. If restrictedto HTTP, however, any transmission needs to be done via the web server, which is a clear decisionfor a star topology. The absence of such synchronization would allow every client to interact inparallel on the same data, but different visualization views.
A real-time system requires the visualization algorithm to render the visualization result withinfew milliseconds to provide the user with the desired frame rate. Whereas the transfer of thecontrol commands to the visualization application is negligibly short, the transfer to the remoteclients causes a delayed rendering at the remote client. However, the data that is to be transferredis very small and, thus, a minor issue.
Transferring only the control commands to synchronize the visualization and not the visualizationitself results in a low network load and allows for high frame rates on according workstations. Insummary, a client side rendering has the main disadvantages of requiring a long lapse of time forthe initial data transfer and high-performing computers for each participant.
Server side rendering. A server side rendering requires the server to have the data and thevisualization application. The latter handles the rendering of the desired visualization and itscontinuous transfers to every client. Every client only requires a lightweight application to con-tinuously receive and present visualization images and to capture and send the control commandsto the server. As a consequence, only the server requires to have access to the base data, whichis a very basic kind of data security. The server requires to have proper graphics hardware torender the desired visualization and the client only basic hardware.
Whereas client side rendering requires a long initial time to transfer the base data, a server siderendering only needs about 8 to 80 ms to transfer each modified image with a size of 10 to 100 KBon a slow 10 Mbps network. These file sizes allow for a theoretical frame rate of about 125 to12.5 frames per second (fps).
The base data might initially be stored on a data server (e.g. a PACS) and therefore mightneed to be transferred to the visualization server. However, both servers will likely have a staticlocation (e.g. the same data center) and, thus, likely have a much faster interconnect. In anycase, only the host of the visualization session (the participant who initiates it) in opposition toany participant might need to wait for this initial data transfer.
Whereas the client side rendering almost only depends on a fast local rendering, the server siderendering depends on a fast transfer of the control commands from and the visualization to theclient. Therefore, the time for a single visualization modification is a summation of the timeto transmit the command from the input device to the visualization application, the time to
37

3 Background and related work
render the visualization, and the time to transmit the visualization to and display it at thedisplay device. By nature, the time to transfer the data from and the visualization to the displaydevice is much higher with a remote than a local visualization rendering. Real-time Interactivevisualization systems therefore highly depend on a fast transmission of control commands andthe subsequently modified visualization.A server side rendering also requires the management of the currently controlling participant,which is clearly done in the same network topology as the visualization transfer (star topology).From using one visualization session with server side rendering follows that each client displaysthe exact same visualization. A second server instance with a second visualization session wouldhave to be initialized, if one user needs to view a specific visualization asynchronous to the otherclients.
3.3.3 State of the art of shared visualization techniques
This section describes the state-of-the art of techniques and projects usable and used for sharedvisualization. Due to the specific research hypothesis, the server side techniques are described ingreater detail. A recent review of such work is also provided by Mouton et al. [55].
3.3.3.1 Client side rendering techniques
Until recently, all existing research projects that use client side 3D rendering were about the pro-vision of special software that runs natively on the operating system or as added software withina web browser. Some of these systems were limited to specific web browsers. Tongleamnak etal. [167] for instance describes the distribution of ActiveX controls to render volume visualiza-tion at the client side, using an Internet Explorer. Also web browser extensions of standard webbrowsers were provided for such collaborations, e.g. the provision of custom sidebars to the Inter-net Explorer to list objects used for a collaborative annotation [168]. An often used framework isJava [169], which takes advantage of having an interpreter that is available on many platforms.Gerth et al. [170] for instance describe a Java web start application that is launchable via aweb browser and can be used to show 3D body models with gene expression patterns. Java alsosupports 3D renderings via Java3D [171], which can directly being used within web browser Javaplugins [172]. More general visualization plugins are used to load and render intermediate fileformats, like VRML and Extensible 3D (X3D) files [37, 173]. In this respect, VRML is a very of-ten used file format for medical visualization as for instance for remote image segmentation [174],exploring anatomical models [175], and many more [176–181]. Melzer et al. described a systemthat provides X3D files of medical data that is interactively viewable via plugins on a big varietyof clients [182]. Such X3D visualization can also be combined with interactive data acquisitionfrom the server [183].With the recent introduction and broader support of HTML 5, there are now technologies topresent 3D visualization with pure web browsers to the user. Interactive 3D visualization can be
38

3.3 Remote sharing of interactive visualization in real-time
rendered within a web browser by using WebGL, which allows to utilize 3D graphics hardwarewith OpenGL commands by just using JavaScript and the HTML 5 canvas element [184]. WebGLcan directly be used for an interactive rendering. Congote et al. [185] implemented for instance aray casting algorithm in WebGL to provide interactive and locally rendered volume visualizationwithin the web browser. WebGL can also be used to render X3D files without the use of plugins.Such is e.g. demonstrated by Birr et al. [33], who presents a surgical teaching application thatrenders anatomical surface visualization. It stores data as X3D file, which is loaded and renderedwith the X3DOM framework [186], a JavaScript library that allows the rendering of X3D andScalable Vector Graphics (SVG) files via WebGL.
3.3.3.2 Server side rendering techniques
Various techniques can be used to distribute interactive visualization rendered on a central vi-sualization server to multiple clients. The basically differing approaches are to transfer multipledistinct images consecutively one after another by using image compression standards and totransfer video streams compressed by a video codec with inter frame compression. The relatedwork of each technique is introduced by describing the systems that deploy native applications,which were typically introduced earlier and are capable of providing the most advanced func-tionality in a rather unrestricted way. Such projects describe applications that transfer thevisualization via any approach, with single images compressed via JPEG [104, 105], JPEG2000[187] or Portable Network Graphics (PNG) or with video codecs compressed via MPEG or H.264[188, 189]. Projects that describe remote visualization approaches via web browser added softwareand pure web browsers are presented afterwards.
Table 3.2 presents an overview of the direct related work and a selection of additional prominentprojects, each is graded by its support of the research requirements (see Section 1.4).
Video streaming. Videoconferencing systems were developed to take a video from a videocamera, encode it via a video codec and stream it to remote locations. Video codecs, e.g. H.264[190] and H.265 [191], utilize similarities in the same and succeeding images with intra and interframe compression to reduce the size of the resulting video stream or file [192].
Standard videoconferencing systems (e.g. H.323 supporting systems [193]) are often used forparticipant-to-participant conferences in an unicast network topology. More efficient and betterperforming videoconferencing systems are used for group-to-group conferences in a multicast net-work topology, e.g. EVO [194] and Access Grid [110]. Videoconferencing systems of each categoryusually provide the functionality to stream a participant’s desktop metaphor, e.g. including avisualization application.
Access Grid was initiated by the Argonne National Laboratories (ANL) in 1994 and developedclosely together with the Globus Toolkit architecture [195]. In the first place, it is a collaborativeroom based group-to-group conferencing software, but it additionally provides an infrastructure of
39

3 Background and related work
videoconferencing rooms (in May 2013: 326 nodes in 32 countries of the world), and at last it alsois an access point to Grid middleware [195]. Access Grid is based on the multicast tools vic andrat [196, 197] and provides extensive functionalities in order to interconnect many different groupsof people. It was and is being used between scientific project partners and for education [36], butalso for other purposes as for instance during the SARS outbreak in Taiwan [198].
The streaming of stereoscopic video content can be realized by using the straight forward wayof compressing a side-by-side or top-to-bottom video. More sophisticated codecs, as e.g. theH.264/MVC (Multiview Video Coding) [199], compress stereoscopic video with inter frame andinter view compression. The latter utilizes similarities of two or more related views. Two-view(stereoscopic) [192, 200, 201] and multi-view compression [202] are already introduced in severalprojects.
Special remote visualization applications can be used to interconnect standard computer up tohigh-end display systems. The access to monoscopic visualization via special software clients anddevices is shown by many projects [204–206]. An example that generically extends visualizationapplications is described by Lamberti et al. [207], which parses the visualization application’sGraphical User Interface (GUI) and provides it in a reconfigurable version for the remote client.Special high-end video streaming applications and network reservations can be used to transferhigh-resolution monoscopic visualization of up to "12,800 x 4,800 pixels or an astonishing 61.44Megapixels per frame" [208] over hugh distances, as shown on conferences [208–210]. Also stereo-scopic displays can be used with remote visualization as described for an auto stereoscopic setupby Christodoulou et al. [211]. In this case, however, the stereoscopic views are transferred sep-arately to the client, where they are then transformed to the specific auto stereoscopic content.Kurillo et al. [212] described the remote interconnect of CAVEs by using special applications andvideo streaming.
Special medical video streaming solutions are for instance being used in operating theaters torecord sessions of endoscopic procedures [213–215] in order to stream them to a remote audiencefor educational use [216, 217]. Also stereoscopic videos of invasive procedures were already usedfor surgical education [218, 219].
The streaming of video is also being widely used on web browsers, as for instance on newssites, video clip sharing sites or commercial movie streaming services. Most commercial videostreaming provider use added software to provide their content, but common video clip sharingsites increased the support of HTML 5 video considerably from 10% in 2010 to over 60% in 2011[220], which likely will further increase. HTML 5 video streaming is a rather new alternative,defined by the W3C that does not require any added software [85], which by now is supportedby most web browsers. However, the specific video container and codec was not defined by theHTML 5 specification, which results in a variety of supported formats by different web browsers.
40
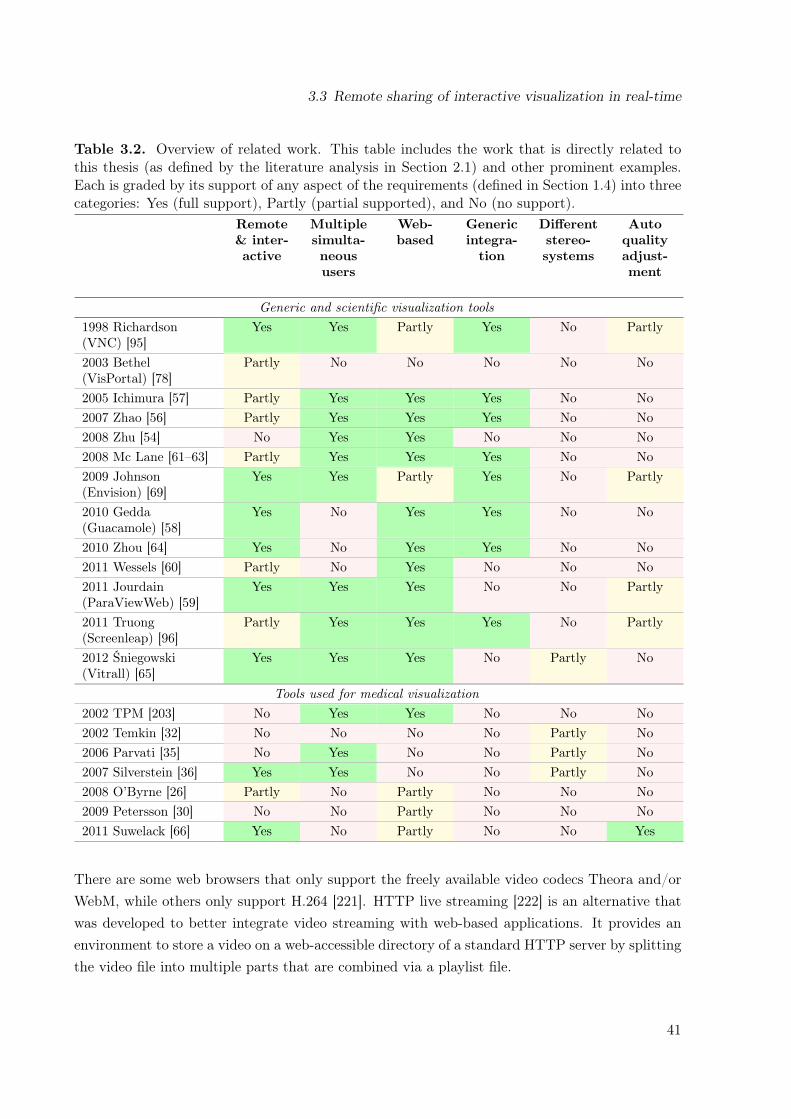
3.3 Remote sharing of interactive visualization in real-time
Table 3.2. Overview of related work. This table includes the work that is directly related tothis thesis (as defined by the literature analysis in Section 2.1) and other prominent examples.Each is graded by its support of any aspect of the requirements (defined in Section 1.4) into threecategories: Yes (full support), Partly (partial supported), and No (no support).
Remote& inter-active
Multiplesimulta-neoususers
Web-based
Genericintegra-tion
Differentstereo-systems
Autoqualityadjust-ment
Generic and scientific visualization tools1998 Richardson(VNC) [95]
Yes Yes Partly Yes No Partly
2003 Bethel(VisPortal) [78]
Partly No No No No No
2005 Ichimura [57] Partly Yes Yes Yes No No2007 Zhao [56] Partly Yes Yes Yes No No2008 Zhu [54] No Yes Yes No No No2008 Mc Lane [61–63] Partly Yes Yes Yes No No2009 Johnson(Envision) [69]
Yes Yes Partly Yes No Partly
2010 Gedda(Guacamole) [58]
Yes No Yes Yes No No
2010 Zhou [64] Yes No Yes Yes No No2011 Wessels [60] Partly No Yes No No No2011 Jourdain(ParaViewWeb) [59]
Yes Yes Yes No No Partly
2011 Truong(Screenleap) [96]
Partly Yes Yes Yes No Partly
2012 Śniegowski(Vitrall) [65]
Yes Yes Yes No Partly No
Tools used for medical visualization2002 TPM [203] No Yes Yes No No No2002 Temkin [32] No No No No Partly No2006 Parvati [35] No Yes No No Partly No2007 Silverstein [36] Yes Yes No No Partly No2008 O’Byrne [26] Partly No Partly No No No2009 Petersson [30] No No Partly No No No2011 Suwelack [66] Yes No Partly No No Yes
There are some web browsers that only support the freely available video codecs Theora and/orWebM, while others only support H.264 [221]. HTTP live streaming [222] is an alternative thatwas developed to better integrate video streaming with web-based applications. It provides anenvironment to store a video on a web-accessible directory of a standard HTTP server by splittingthe video file into multiple parts that are combined via a playlist file.
41
3 Background and related work
Video streaming is used for web-based learning systems via the provision of pre-recorded videoand visualization [23]. Wiecha et al. [24] for instance described a web-based course system thatprovides pre-recorded video files and other materials for self-study. Another technique to providevideo-like but interactive visualization is a Quicktime VR movie. This is a special format thatstores multiple images of all around a 3D object, which is then explorable on the web browserclient using a Quicktime plugin [29]. There are also medical system that utilize plugins to streamvolume visualization as e.g. by using Silverlight [66].
Single image transfer. A computer-generated visualization does not change, if the scenerydoes not change. This stays in contrast with a video recorded by a video camera, which alwaysleads to a different image on the pixel/colorization level, e.g. due to little movements of theobjects. A visualization that is merely modified on an irregular basis can therefore also be trans-ferred as single intra frame compressed images.
In current medical environments, standard non-interactive 2D images are mainly retrieved andtransferred by using DICOM and Health Level Seven (HL7) standards. These standards can forinstance be used with the Integrating the Healthcare Enterprise (IHE) workflow integration pro-file Cross-Enterprise Document Sharing (XDS) [223] to allow an interoperable document transfer.A newer addition to these standards is the Web Access to DICOM Persistent Objects (WADO),which is part of DICOM and can be used to access DICOM images on a server by using an HTTPREST style interface [224]. WADO also allows to convert a requested image to JPEG prior to it’stransfer to be directly displayed via the web browser. It further allows to request image parts tominimize the necessary bandwidth usage, if a specific point of interest is known. Noumeir et al.[187, 225] showed the interconnection of XDS, WADO, and JPIP to access 2D DICOM imagesusing interactive JPEG. This system allows the user to zoom and pan the visualization on the2D layer. There are other medical systems that provide interactive viewers for DICOM imagesthat can be integrated into web-based clients, e.g. of a PACS or HIS [226]. A possible scenariowith these techniques is the viewing of volume data as single cross-sectional 2D images with [227]and without web browser added software [226, 228]. In the latter case, the viewers provide onlyvery basic functionality.
Exceptionally large image files, which are too big in file size and resolution to be transferred anddisplayed as a whole, can be viewed with different resolution and zoom levels by using specialapplications and pure web browsers. Such is for example of interest in digital microscopic imag-ing, as demonstrated for parasitology [229] and pathology [230, 231]. Both are presenting largeimages via pure web-based image viewers, which enable the presentation of multi-layered imagesand different resolutions.
42
3.3 Remote sharing of interactive visualization in real-time
Interactive 3D visualization requires a faster interactive image-reloading functionality than it isprovided and required by the previously described techniques for 2D image transfers.
The most often used application type that allows to access GUI applications on remote computersystems likely are general screen sharing applications. A popular example is Virtual NetworkComputing (VNC), which was introduced in 1998 and allows for an interactive usage of a remotedesktop metaphor [95]. It constantly captures the desktop metaphor and transfers the changedimage data to the client. Further improvements have been made to use remote 3D graphics hard-ware with VNC [232, 233]. VNC supports different kinds of reducing the data transfer, as e.g.sending only updated parts of the screen and having special window managers at the client thateven prevent the transfer of pixel data from the server. VNC clients are developed for varioussystems, which also includes Java web browser plugins [72, 76, 234]. Large data centers have usedsuch VNC plugins to make high-performing visualization accessible via web browsers [69, 71].Alternative systems with a similar principle have been developed by various companies, whichare also being used for research [73, 235, 236].
Many special applications have been described that utilize single image transfers for remote in-teractive visualization, based on web browser added software [77, 83]. Most often, they are builton top of Java [70, 74, 75, 79–82, 84], but also utilize other techniques, e.g. Silverlight [60]. Albuet al. [237] and Vazhkudai et. al [67] for example describe systems with Java-based clients forComputer-aided Design (CAD)-based liver cancer analysis and neutron scattering experiments,respectively.
Compared to the literature of interactive visualization systems that use web browser added soft-ware, the pure web browser based solution is rare (see comparison in Table 3.2). Whereas theprevious paragraphs only provide examples of technique usages, the following paragraphs providea full overview of the pure web-based systems as defined by the literature analysis.
The TelePresence Microscopy Collaboratoration (TPM) [203, 238, 239] is a project that allowsto monitor remote resources (e.g. machinery) using remote web cameras via pure web browsers.It is for example being used to provide remote monitoring for earthquake researchers of theNEESgrid [240]. The system provides the functionality to modify the camera’s point of view(tilt, pan, and zoom) from remote. The TPM cameras use a very simple but effective techniquethat pushes single images in a multipart HTML message to the client. This technique is calledmotion JPEG (mJPEG) and is most widely used for web cameras and, thus, supported by manyweb browsers.
A very early remote visualization system was demonstrated by Bethel et al. [78], who describethe VisPortal, a Grid-computing based rendering system that provides multiple renderings of asingle dataset based on a pure web browser as client. This system, however, did not providereal-time interactive visualization, but rather allowed to render the visualization multiple timesat once, which was afterwards downloadable as video files. Bohne-Lang et al. [241] described
43
3 Background and related work
one of the first systems that allowed for interactive visualization on a pure web browser viacontinuously pulling single images, which however is not optimized for a real-time usage. Similarapplications with no real-time interactive functionality (low frame rate) have been developed formedical volume visualization [242] and other scientific visualization fields [54].
Pure web-based systems were also already being demonstrated to be usable for general screensharing applications. Ichimura et al. [57] describe a very scalable system for remote education,which however can not be controlled from remote. It screen scrapes the desktop metaphor ofthe lecturer with the resulting images being stored as tiled images on a web server, from wherethe clients download the images after polling. Guacamole [58] is a special server applicationthat is a combination of a web server and a VNC client which is accessible from HTML 5 webbrowsers. The system uses a pulling mechanism to fetch full Base64 encoded images. Base64images, however, are about 30% larger than its binary counterpart. Screenleap.com [96] is freelyusable service that allows to share the local desktop metaphor via a Java applet with remoteparticipants. In contrast to the server, the remote participants just require a pure web browser,but do not have interactive control of the desktop.
Web services have also been used to provide interactive visualization as a service. Zhao et al. [56]describe a system that generically integrates visualization applications and can be used on a pureweb browser. However, they also describe an image delivery delay of more than 500 ms perimage, which is not highly interactive. A web service based framework is also used by Mc Laneand Greensy et al. [61–63]. It runs on various web browsers and transfers Base64-encoded JPEGimages. However, the latency of 1 second and 500 ms (in a later version) for a single image resultsin a low interactivity [64]. Jourdain et al. [59] describe ParaViewWeb, a web-based access pointto the ParaView rendering service that provides interactive visualization in real-time. Besides aJava and Flash applet, ParaViewWeb also provides a pure JavaScript-based client interface thatuses long-polling to inform clients about a newly modified image, which then is instantaneouslyloaded as a binary image. Its web server utilizes web service interfaces to connect to the renderingservice, where the rendered visualization is statically compressed with a JPEG quality of 50 inorder to decrease the image delivery time. Wessels et al. [60] suggest to use web sockets totransfer a server side rendered visualization, by pushing an image as soon as available. They alsodescribe the necessity of using Base64 encoding to transfer visualization via WebSockets. Oneof the most recent tools that allows for a pure web based remote visualization is Vitrall [65]. Itprovides remote and collaborative access to visualization, mainly surface visualization renderedwith OpenSceneGraph [243]. Vitrall was also already being used with a remote access to a singlestereoscopic content.
3.3.3.3 Mixed rendering on client and server
Some projects aim to combine the best properties of client and server side rendering, by sendingas less data as possible and/or by processing as much of the performance intensive tasks at the
44

3.3 Remote sharing of interactive visualization in real-time
server to keep the requirements on the client low. However, most of these systems currentlyrequire special software deployments.One method to do this is to reduce the data size by subsampling it for the specific client sys-tem [244]. Engel et al. [245] shows for instance a shared visualization system that emphasizesthis aspect by reducing the data on the server side. It cuts and converts the initial DICOM filesinto VRML textures, which are then renderable with much lower computer power on the client.The usage of surface visualization based on volume visualization is also a type of mixed rendering,where the computation intensive part, the procession of the volume data to geometrical objects(see Section 3.1.2) can be done on the server. The resulting objects can be stored in an intermedi-ate file format (e.g. X3D) to be transferred and rendered on the client. The surface visualizationis usually based on only about 10% of the volume data and, thus, requires less transfer time andperformance than the volume visualization [121].Turner et al. [246] describe a client-server architecture, which provides an instantaneous access toa remote volume rendering, but in background also transfers the dataset to the client. This setupallows for an instantaneous useable server-based visualization and a fast client side visualization,after the base data is available. Another example solution is to utilize the compute performance ofany client and server by dividing the workload as for instance described by Grimstead et al. [68].They describe a parallel rendering system that renders on the client, if enough graphics powerexists, but utilizes remote server side rendering, otherwise.
3.3.3.4 Utilization of compute infrastructures
Many projects have been using grid- and cloud computing infrastructures for various tasks, e.g.with the focus on compute and/or data management [195, 247]. Both infrastructure types providethe user with the capability of using remote storage, CPUs, Graphics Processing Units (GPUs),and General-purpose Computing on a Graphics Processing Unit (GPGPU).Projects in the medical environment also utilized such infrastructures for various image related usecases. Grid computing can for instance be used for server discovery [248], image retrieval [38, 248],and analysis [39]. It was also demonstrated that these infrastructures can be used for distributedvisualization and remote rendering [41, 249, 250]. The main problem of such infrastructures isto simplify the initialization of and access to the visualization session. Such resource reservationsystems have often been solved via web-based systems. The subsequent interactive visualizationusage, however, is mostly provided by special applications, e.g. VNC-like applications [251]. Butin the case of Paraview [252, 253], it can be seen that this paradigm is changing. Paraview isa powerful visualization system that allows to utilize remote visualization resources with localnative client applications. As described earlier, Paraview was recently also being extended by aclient that is usable on pure web browsers.
45

4 Evaluation of data transmission techniquesusing web browsers
The related work projects and applications described in the previous sections utilize differenttechniques to transfer data from and to pure web browsers. This chapter describes the evaluationof these techniques in order to find a single technique selection for the proof of concept conduction.Section 4.1 is about the transfer of images from the server to the client and Section 4.2 is aboutthe transfer of control commands as single events from the clients to the server.
4.1 Visualization transfer
The evaluation of the visualization transfer techniques is based on rapid prototypes, which aredescribed in Section 2.2.1. The results are summarized in Table 4.1 with an overall grading inthe right-most column. Two of the techniques resulted in a similar grading and where furtherevaluation in Section 4.1.2.
4.1.1 Prototype observations and evaluation
Prototype 1: HTML5 video steaming. HTML 5 video is an increasingly often usedmethod to stream video and audio content to pure web browsers and will likely be the futuredirection of streaming video to web browsers. However, any test to load a real-time generatedHTML 5 video stream on a pure web browser resulted in a delayed client side presentation ofmore than one second. The server side test system (VLC) was extensively adjusted by modifyingmost parameters in order to optimize the encoding and transfer, which, however, did not resultin a faster presentation. It was therefore assumed that the delay is caused by a buffering delayadded by the web browser.This observation was later verified by the work from Metzger et al., who state that "the timescale on which streaming applications buffer content lies in the range of seconds" [254]. Theyconducted detailed tests about HTML 5 video streaming and show that the delay of a client sidevideo playback increases after network delays occurred. This behavior can be explained by theHTML 5 video specification [85], which recommends a video playback algorithm for web browsersthat only starts the playback "when it can be ensured that the video can be played withoutinterruption" [254]. The HTML 5 specification currently has no option to control this behavior.This means that a short transmission delay that might even occur on a very fast connection may
46
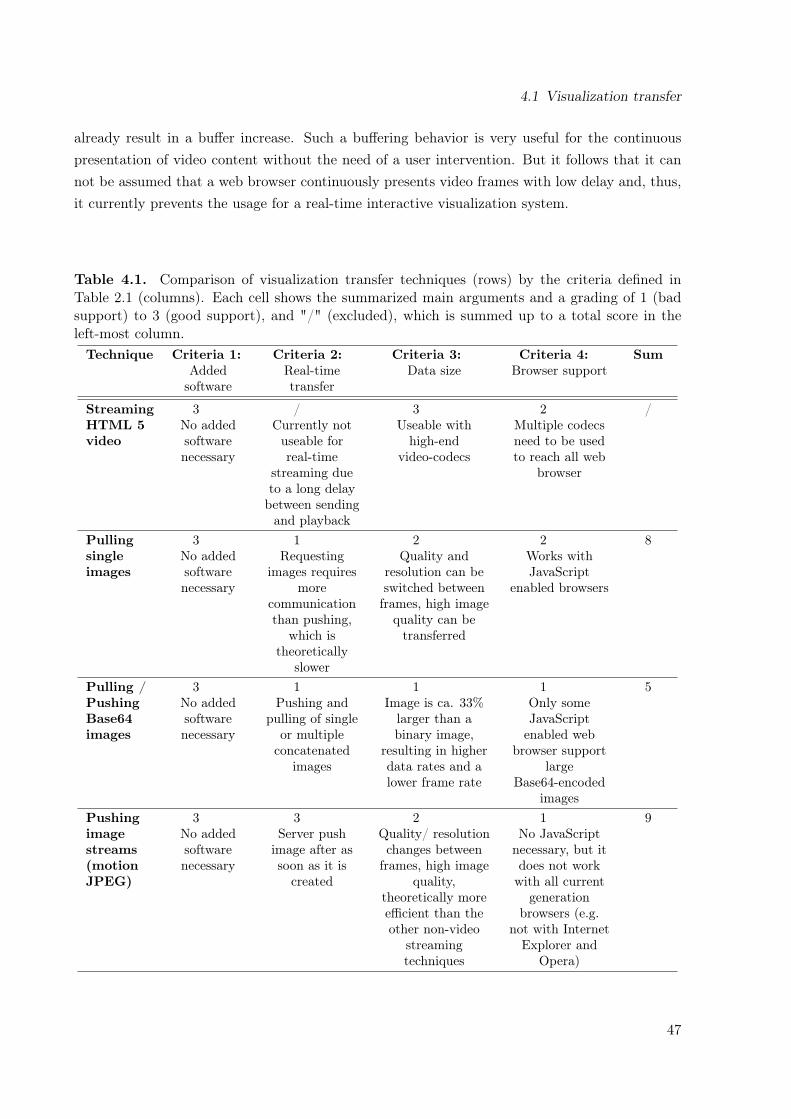
4.1 Visualization transfer
already result in a buffer increase. Such a buffering behavior is very useful for the continuouspresentation of video content without the need of a user intervention. But it follows that it cannot be assumed that a web browser continuously presents video frames with low delay and, thus,it currently prevents the usage for a real-time interactive visualization system.
Table 4.1. Comparison of visualization transfer techniques (rows) by the criteria defined inTable 2.1 (columns). Each cell shows the summarized main arguments and a grading of 1 (badsupport) to 3 (good support), and "/" (excluded), which is summed up to a total score in theleft-most column.Technique Criteria 1:
Addedsoftware
Criteria 2:Real-timetransfer
Criteria 3:Data size
Criteria 4:Browser support
Sum
StreamingHTML 5video
3No addedsoftwarenecessary
/Currently notuseable forreal-time
streaming dueto a long delaybetween sendingand playback
3Useable withhigh-end
video-codecs
2Multiple codecsneed to be usedto reach all web
browser
/
Pullingsingleimages
3No addedsoftwarenecessary
1Requesting
images requiresmore
communicationthan pushing,
which istheoretically
slower
2Quality and
resolution can beswitched betweenframes, high image
quality can betransferred
2Works withJavaScript
enabled browsers
8
Pulling /PushingBase64images
3No addedsoftwarenecessary
1Pushing and
pulling of singleor multipleconcatenated
images
1Image is ca. 33%larger than abinary image,
resulting in higherdata rates and alower frame rate
1Only someJavaScriptenabled web
browser supportlarge
Base64-encodedimages
5
Pushingimagestreams(motionJPEG)
3No addedsoftwarenecessary
3Server push
image after assoon as it is
created
2Quality/ resolutionchanges between
frames, high imagequality,
theoretically moreefficient than theother non-video
streamingtechniques
1No JavaScriptnecessary, but itdoes not workwith all current
generationbrowsers (e.g.
not with InternetExplorer and
Opera)
9
47

4 Evaluation of data transmission techniques using web browsers
Another disadvantage of HTML 5 streaming is the codec support of the web browsers. No singlesupported video codec exists that is supported on any browser [221]. Thus, it would be necessaryto provide specific streaming methods for different web browsers.
Prototype 2: Pulling JPEG (pJPEG). Pulling single images from the client side is a verystraightforward method to transfer the visualization, because it is the default technique to loadimages of web sites. It results in a fluent frame rate with a subjective low delay on the clientside. On the contrary, it requires a communication overhead between the client and the server,because any new image needs to be request separately via a new connection.
Prototype 3: Pushing Base64 images. The continuous pushing of Base64-encoded imagesresulted in a subjective fluent playback. Testing it on a single computer did not result in anoticeable longer delay than the pJPEG image approach. But Base64 image files are on average33% larger than its binary version [255], which results theoretically in either a lower frame rate ora higher network load factor. Transferring Base64-encoded images seems therefore less performantthan the continuous pulling of single JPEG files.
Prototype 4: Pushing motion JPEG (mJPEG). Pushing mJPEG provided a fluentsequence of images on the client with a subjective very fluent playback. In contrast to the othersingle image transfer techniques, it utilizes a single persistent connection to transfer all imagesbinary. Each new image is just pushed to the client via the opened connection. Therefore, it doesnot have the additional communication overhead of prototype 2 and 3 of continuously establishingnew connections and/or larger file sizes.
4.1.2 Motion JPEG vs. pulling JPEG
Whereas pulling JPEG (pJPEG) requires a separate establishment of a network connection foreach image, motion JPEG (mJPEG) only requires a single connection establishment in the begin-ning of a visualization session. Due to this architectural difference, each technique’s performancecapabilities can be easily compared analytically. In a setup with
tinit = time (in milliseconds) required to initialize a new HTTP connection
and the time (in milliseconds) to transfer an image with a file size s (in MB) on a network witha bandwidth b (in Mbps) of
timg(s, b) =s 1000
b8
,
48
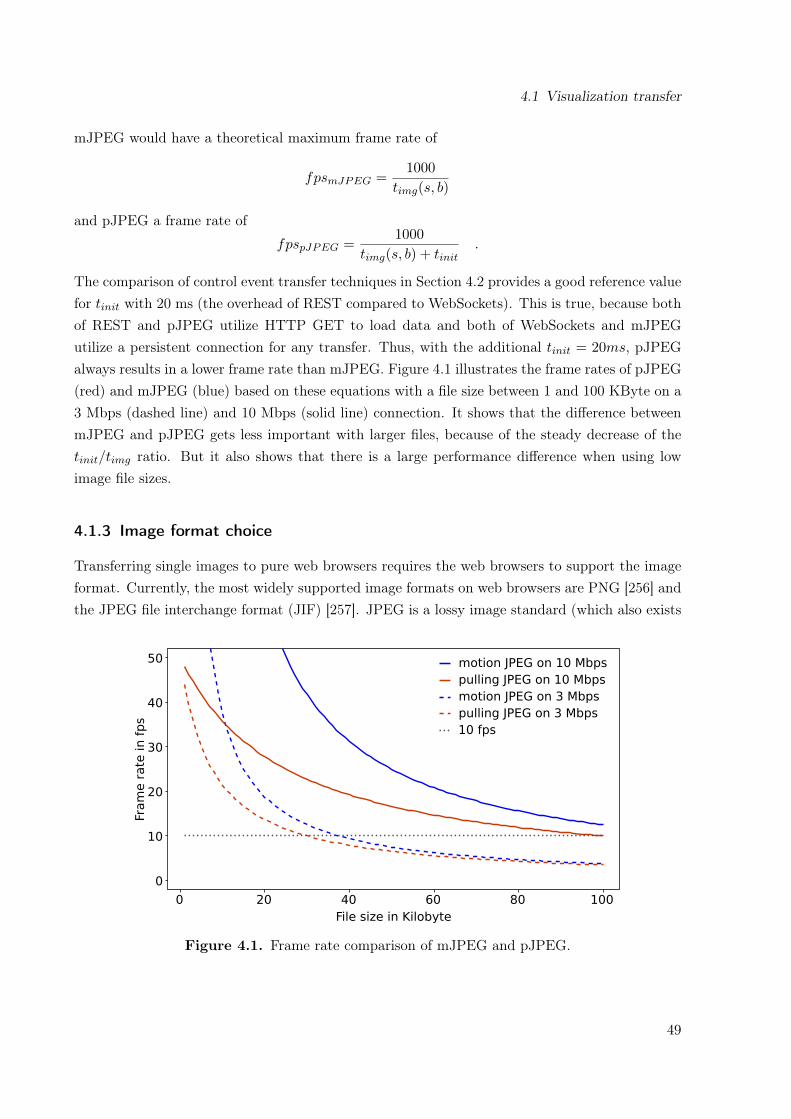
4.1 Visualization transfer
mJPEG would have a theoretical maximum frame rate of
fpsmJPEG =1000
timg(s, b)
and pJPEG a frame rate of
fpspJPEG =1000
timg(s, b) + tinit.
The comparison of control event transfer techniques in Section 4.2 provides a good reference valuefor tinit with 20 ms (the overhead of REST compared to WebSockets). This is true, because bothof REST and pJPEG utilize HTTP GET to load data and both of WebSockets and mJPEGutilize a persistent connection for any transfer. Thus, with the additional tinit = 20ms, pJPEGalways results in a lower frame rate than mJPEG. Figure 4.1 illustrates the frame rates of pJPEG(red) and mJPEG (blue) based on these equations with a file size between 1 and 100 KByte on a3 Mbps (dashed line) and 10 Mbps (solid line) connection. It shows that the difference betweenmJPEG and pJPEG gets less important with larger files, because of the steady decrease of thetinit/timg ratio. But it also shows that there is a large performance difference when using lowimage file sizes.
4.1.3 Image format choice
Transferring single images to pure web browsers requires the web browsers to support the imageformat. Currently, the most widely supported image formats on web browsers are PNG [256] andthe JPEG file interchange format (JIF) [257]. JPEG is a lossy image standard (which also exists
motion JPEG on 10 Mbps
pulling JPEG on 10 Mbps
motion JPEG on 3 Mbps
pulling JPEG on 3 Mbps
10 fps
50
40
0
30
20
10
Fra
me r
ate
in f
ps
File size in Kilobyte
200 10040 60 80
Figure 4.1. Frame rate comparison of mJPEG and pJPEG.
49
4 Evaluation of data transmission techniques using web browsers
in a lossless compression version), which means that an image differs on the pixel level after asingle compression and decompression cycle, even with the highest possible image quality of 100.In return, JPEG provides a good overall image quality with a compression ratio of more than10:1 and is optimized for smooth transitions, as they usually appear in medical visualizations.In contrast, PNG is a lossless image compression standard, optimized for hard transitions ase.g. line drawings [258]. A more efficient image compression format is JPEG2000 [259], whichuses wavelet compression in contrast to the discrete cosine transformation of JPEG, resulting ina better compression ratio [260]. Unfortunately there is almost no web browser available thatsupports JPEG2000 by default. The same is valid for other newer formats as WebP [261] orH.264 intra frame compression [262].
4.2 Event transfer
There are fewer techniques that allow a data transfer from the client to the server than vice versa.Typical techniques are HTTP GET and POST [89], which both are HTTP requests that can beutilized via a separate short lasting connection for each data transfer (e.g. via a REST-styleinterface). Whereas, browser plugins were developed to circumvent this issue by providing longlasting connections, only WebSockets [263], a rather new technology, allows for a similar transferwithout added software.
Both, REST and WebSockets, where tested as described in Section 2.2. The results of their com-parison are presented in Table 4.2. It shows that each technique requires an almost equal transfertime on the different tested networks, with an exception on the very slow 1 Mbps connection.Thus, it seems that the available bandwidth is of minor importance to transfer control events ofvery small size. But, whereas the REST-style interface requires on average 46 ms for each controlevent, WebSockets only requires about 25 ms. Thus, WebSockets are on average 21 ms faster,which results in a faster average event transfer rate of 35 events per second (eps), which are 16events more compared to the 19 eps of the REST-style interface.
Table 4.2. Test results of using REST and WebSockets to transfer control commands on differentnetwork conditions. Presented is the average time to transfer a single event (time in ms) and theaverage event rate (rate in events per second).
1 Mbps 3 Mbps 90 Mbps Averagetime rate time rate time rate time rate
REST 51.3 18 44.2 20 43.0 21 46.2 19WebSockets 34.9 26 21.0 43 20.5 38 25.5 35Difference 16.4 8 23.2 23 22.5 17 20.7 16
50

4.3 Expert discussion
Table 4.3. Comparison of event transfer techniques (rows) by the criteria (columns) defined inTable 2.1. Each cell shows the summarized arguments and a grading of 1 (bad support) to 3(good support), and "/" (excluded), which is summed up to a total score in the left-most column.Technique Criteria 1:
Addedsoftware
Criteria 2:Real-timetransfer
Criteria 3:Data size
Criteria 4:Browser support
Sum
REST-style
3No addedsoftwarenecessary
2Event transferrate is low
1Large overhead due
to continuousconnection
establishment
3Supported on allweb browser
9
Web-Sockets
3No addedsoftwarenecessary
3Event transferrate is high
3Low overhead
1Supported onmany browsers,which will likely
improve
10
4.3 Expert discussion
The possible techniques that are evaluated in this chapter were also discussed with two collab-orating working groups, who had similar aims of high-performing remote visualization and/or asimpler access to it.The first working group1 had extensive knowledge with remote visualization [188, 195, 242, 264].They told us about the problems and solutions they already experienced and linked us to newprojects and thoughts. A key point of the discussion was that they already developed a systemfor a pure web-based remote access that utilized pJPEG [242]. This system, however, resultedin a slow visualization update on the client side. Therefore, they also suggested the usage ofmJPEG to provide a faster transfer.The other collaborator2 was already using mJPEG to stream the video of webcams in the TPM(see Section 3.3.3.2). This system was used to stream video in various projects. The mostinteresting approach, however was the usage in a hospital, which is the same environment asCoWebViz was intended for.
4.4 Discussion
HTML 5 video streaming would be the most desired solution, due to its best performance. How-ever, it is currently be excluded, because it can not be assured that the visualization is instanta-neously transferred and presented on the web browser client.
1Personal communication with Joseph Insley, Eric Olson and Tom Uram, Futures Laboratory, Argonne NationalLaboratory, Argonne, IL, USA.
2Personal communication with Nestor J. Zaluzec, Electron Microscopy Center, Argonne National Laboratory,Argonne, IL, USA.
51

4 Evaluation of data transmission techniques using web browsers
The two best graded techniques are pulling JPEG (pJPEG) and pushing motion JPEG (mJPEG).Both provide a feasible approach to transfer visualization to a web browser. The main disad-vantage of the first is that it requires a separate request/connection for each image, but on thecontrary is capable of providing visualization on the widest range of web browsers. mJPEG’sadvantage is the lower transfer overhead for a fast image transfer, but is not supported on all webbrowsers. Since mJPEG seamed to be the most efficient of the tested techniques, it was chosen tobe used for the proof of concept prototype. This decision was further promoted by the personaldiscussion with collaborating working groups (see previous Section 4.3).The selection of a control command transfer technique was straight forward, since this evaluationwas done after the prototype conduction already started. The first implementation only supportedthe REST-style interface, and WebSockets were additionally implemented after this evaluation.The tests show that both techniques are feasible in terms of transfer rate. Due to the possiblyhigher event rate of WebSockets, it is more preferable than the REST-style interface.
52
5 A system design for remote collaborativeweb-based visualization
The previous section describes the evaluation of possible techniques to transfer visualizationand command control events to and from web browsers, which resulted in a preferred techniqueselection for each type. This technique selection was the foundation of a more sophisticatedprototype developed for the proof of concept conduction, which is called Collaborative Web-based Visualization (CoWebViz). It was developed to fulfill all research requirements definedin Section 1.4 by utilizing a pure web browser as client system for collaborations with remote,interactive, and stereoscopic volume visualization. The primary goal of this prototype was toease the deployment and conduction of the virtual anatomy class (see Section 2.3.2.2). Theprototype usage experience in the class is described in Chapter 6 and detailed performance testsin Chapter 7.This chapter describes the system design and necessary functionality of the prototype, which waspartially already published in [51, 265, 266]. The development and test environment is describedin Section 2.3.2.1. The final prototype is CoWebViz 0.2 and includes the entire functionalitythat is described in this chapter. CoWebViz 0.1 is a subset of CoWebViz 0.2, which was alreadycapable to access monoscopic and two-view stereoscopic visualization from remote, but did nothave the current visualization and event transfer optimizations nor the parallel architecture thatare described in Section 5.2 and 5.3. The image transfer of CoWebViz 0.1 was done via a fixedquality and resolution as described in configuration A of Section 7.1.1.
5.1 System design
The anatomy class relied on MedVolViz to create interactive medical volume visualization (seeSection 2.3.2.1). Thus, CoWebViz required to meet all requirements necessary to be used withMedVolViz in the first place. But on the same time it also required to be generically usable withother applications to meet future changes of MedVolViz or the class. The system was thereforedesigned to incorporate visualization of an external base application (see Section 5.1.1) and toprovide a server side HTTP interface (see Section 5.1.3) that is easily accessible by a web browser.This basic principle makes CoWebViz to a web-based front-end for potentially every visualizationapplication.CoWebViz is developed as multi-threaded application in C++ with an architecture that shallprovide the greatest possible freedom of use, by providing interchangeable modules. The appli-
53

5 A system design for remote collaborative web-based visualization
Figure 5.1. This data flow diagram shows CoWebViz’s system architecture on the left side andits web browser client instances on the right. The top part shows the event transfer and thebottom the visualization transfer chains. In contrast to the light blue part, the dark blue part ofthe architecture is new, compared to the related work.
cation fulfills two basic tasks, the visualization transfer from the server to the client and, viceversa, the transfer of control commands as single events from the client to the server. Both tasksare implemented as following separate process chains [265]:
Visualization transfer chain: This chain directs from the the server to the client. It is attachedto a base visualization application, from where it continuously takes rendered visualizationimages, forwards them to an HTTP interface that provides functionality to send the im-ages to any currently connected client. After receiving a new image the client displays itinstantaneously.
Event transfer chain: This chain directs from the client to the server. It captures mouse andkeyboard events at the client, transfers them to the server side HTTP interface, where theyare being processed and transferred to the base application.
Each chain consists of several modules that fulfill different subtasks, which are illustrated forthe event and visualization transfer chain on the top and bottom part of the Figure 5.1, re-spectively. Each module is represented by a virtual class, which is an implementation blueprint
54

5.1 System design
for various specific implementations that provide the same class methods. Thus, modules areexchangeable with other implementations in order to provide an architecture with customizableand interchangeable functionality. Each module runs in a separate thread, which are connectedvia shared memory.Due to its objective, the system requires modules for data input, data output and intermediateprocessing, which are called input, output, and process channel, respectively. An input channeltakes data from a system-external source, processes it, and puts it to a shared memory. Anoutput channel takes data from a shared memory and provides the data via an interface to anexternal application. Process channels take data from a shared memory and put the processeddata back to another shared memory. The consumer/producer pattern is used for the sharedmemory implementations.The modular architecture enables the parallel execution of multiple modules of the same anddifferent types. The parallel execution of a single module or a whole chain of modules is forinstance necessary to handle multi-view stereoscopic formats (e.g. one for each, the left and righteye view). Multiple modules of the same type are for instance necessary to provide two parallelvisualization output channels, e.g. to simultaneously stream images to a web browser and torecord them to a file.The whole network communication between the application and the web browsers is realized byHTTP interfaces (REST, multipart/x-mixed-replace, WebSockets) on a single integrated HTTPserver, which only requires a single network port.All currently implemented modules (introduced in Figure 5.1) are described in the followingsubsections.
5.1.1 Integration of visualization applications
Visualization input channels are designated to take visualization from external sources intoCoWebViz, where it is converted into an internal uncompressed RGB image format.
The InputX11 module provides functionality to screen scrape visualization from a single basevisualization application that runs on X11. It connects to the specified application and automat-ically recognizes its GUI window size, which is then screen scraped from the desktop metaphorvia a shared memory with the X11 server. Thus, any X11 application can be used as a CoWebVizbase application. Many scientific visualization applications just provide a visualization windowwith no GUI (e.g. MedVolViz). But other applications provide extensive GUIs, which can behandled in two ways, either by screen scraping the whole application window or only the part ofthe window that contains the visualization, as illustrated in Figure 5.2. The latter case, wouldprevent a client user to directly access the GUI-elements and would therefore require the additionof a specific client interface that makes the hidden functionality available (e.g. similar to the clientGUI shown in Section 5.6). A sophisticated example is demonstrated by Lamberti et al. [207].The third method is to connect programmatically to the base application, which is only hinted in
55

5 A system design for remote collaborative web-based visualization
Figure 5.2. Possibilities to integrate existing visualization applications (e.g. Voreen [267]) intoCoWebViz via screen scraping or a direct programmatical connection.
Figure 5.2, because it is enabled by CoWebViz but requires specific additions. Two instances ofthis module can be used to integrate stereoscopic content in the form of a side-by-side or half-wideside-by-side visualization, with a left and a right view displayed in full or halved resolution nextto each other. Each instance is then used to separately screen scrape one of the virtually halvedapplication windows. Side-by-side is the default stereoscopic content provided by MedVolViz.Other types that present full resolution images next to each other, e.g. top-to-bottom or twoviews in separated windows, could be integrated with few modifications.
The InputFfmpeg module provides functionality to integrate visualization from any FFMPEGsource [106], which among others includes most video file formats and video cameras.
Event output channels are designated to send or write control events from CoWebViz to anexternal destination.
The ControlOutputX11 module provides functionality to send control command events to theconnected base application on an X11-Server. It gets CoWebViz internal events from a sharedmemory, converts each to an X11 event and sends it to the connected application. It is thecounterpart to the InputX11 module.
The ControlOutputScriptingFile module provides functionality to write events to a file, whichis necessary to record a whole visualization session for later playback (see Section 5.6). It getsevents from a shared memory and stores each in the format described in Listing 5.1.
5.1.2 Internal procession
Visualization process channels are designated to take one or multiple images from one ormultiple shared memory instances, which are processed and put to another shared memory.
56
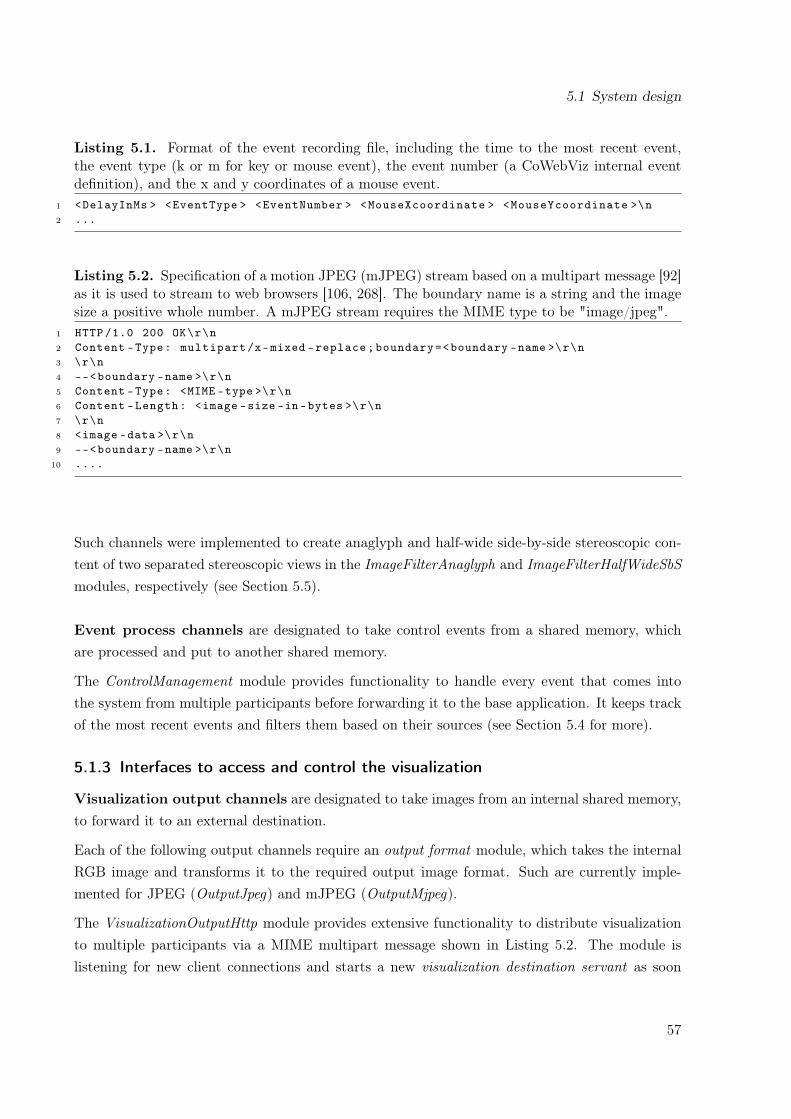
5.1 System design
Listing 5.1. Format of the event recording file, including the time to the most recent event,the event type (k or m for key or mouse event), the event number (a CoWebViz internal eventdefinition), and the x and y coordinates of a mouse event.
1 <DelayInMs > <EventType > <EventNumber > <MouseXcoordinate > <MouseYcoordinate >\n2 ...
Listing 5.2. Specification of a motion JPEG (mJPEG) stream based on a multipart message [92]as it is used to stream to web browsers [106, 268]. The boundary name is a string and the imagesize a positive whole number. A mJPEG stream requires the MIME type to be "image/jpeg".
1 HTTP /1.0 200 OK\r\n2 Content -Type: multipart/x-mixed -replace;boundary=<boundary -name >\r\n3 \r\n4 --<boundary -name >\r\n5 Content -Type: <MIME -type >\r\n6 Content -Length: <image -size -in-bytes >\r\n7 \r\n8 <image -data >\r\n9 --<boundary -name >\r\n
10 ....
Such channels were implemented to create anaglyph and half-wide side-by-side stereoscopic con-tent of two separated stereoscopic views in the ImageFilterAnaglyph and ImageFilterHalfWideSbSmodules, respectively (see Section 5.5).
Event process channels are designated to take control events from a shared memory, whichare processed and put to another shared memory.
The ControlManagement module provides functionality to handle every event that comes intothe system from multiple participants before forwarding it to the base application. It keeps trackof the most recent events and filters them based on their sources (see Section 5.4 for more).
5.1.3 Interfaces to access and control the visualization
Visualization output channels are designated to take images from an internal shared memory,to forward it to an external destination.
Each of the following output channels require an output format module, which takes the internalRGB image and transforms it to the required output image format. Such are currently imple-mented for JPEG (OutputJpeg) and mJPEG (OutputMjpeg).
The VisualizationOutputHttp module provides extensive functionality to distribute visualizationto multiple participants via a MIME multipart message shown in Listing 5.2. The module islistening for new client connections and starts a new visualization destination servant as soon
57
5 A system design for remote collaborative web-based visualization
as a connection request is stated. Each destination servant handles the data transfer of a singleview for a single participant. It is running in its own thread and manages the connection andany data transformation using the output format. At first the destination servant sends a simpleHTTP header (Listing 5.2, line 1) to initiate the HTTP connection. Afterwards, a specific headeris sent for the output format, which is OutputMJPEG in this case (Listing 5.2, line 2-3). Anyconsecutively sent image is transferred as shown in line 4-7. The web browser loads the mJPEGstream via a given URL, as for instance http://<URL>:8080/left. The web browser receivesthe simple HTTP header, recognizes the mJPEG multipart message and consecutively displaysthe following images. The mJPEG stream can be accessed by web browsers, but also by network-enabled video players (e.g. VLC [87]) or other applications. In order to provide the user with acontrol mechanism, a web page is necessary as described further down.
The OutputFile module provides functionality to write each processed image to a single or mul-tiple files, which is necessary to get a session recording (e.g. in mJPEG) or single visualizationsnapshots.
Event input channels are designated to take control command events (e.g. mouse and key-board events) into the system.
Any network data transfer to and from the system is managed by an integrated HTTP server,which provides either services for a web page delivery or data connections. Each service is acces-sible via a specific URL, as e.g. http://<URL>:8080/ctrl for REST-style control events.
The HttpServiceControlInput and HttpServiceWS modules were developed to integrate controlevents via a REST-style and WebSockets interface, respectively. Both are continuously listeningfor new control events, which are transferred as described in Listing 5.3 and 5.4. Each event isconverted into an internal event format and put on a shared memory. These modules are alsolistening for other defined data transfers, which are necessary to configure the system.
The visualization control service provides the web pages that provide the interactive functionalityto a web browser. Different web pages are dynamically created and delivered for specific func-tionalities. They include a superimposed active layer on top of the mJPEG stream with the exactsame size of the stream that captures the events via JavaScript. The visualization is includedinto the web page via the specific mJPEG stream URL. The events are captured and sent to theREST or WebSockets HTTP interface (see previous paragraph). The required URLs (e.g. of themJPEG stream) are already pre-defined in the delivered web page. The user can instantaneouslystart modifying the visualization using the base application’s control functionality (see Figure6.3a and 6.3b).
The control service is basically the same as the visualization control service, but without showingthe mJPEG stream (see Figure 6.3c).
58

5.2 Visualization transfer optimization
The ControlInputScriptingFile module provides functionality to load events from a recorded textfile (see Listing 5.1), which is used to playback a recorded visualization session (see Section 5.6for more).
The file service provides basic functionality to transfer files to the client, as necessary to accessJavaScript libraries or Cascading Style Sheets (CSS) files.
Listing 5.3. Transfer format of a single WebSockets event, including the event number (aCoWebViz internal event definition) and the x and y coordinates of a mouse event.
1 <EventNumber > <MouseXcoordinate > <MouseYcoordinate >
Listing 5.4. Transfer format of a single REST event, including a client user ID, the eventnumber (a CoWebViz internal event definition), and the x and y coordinates of a mouse event.In addition to the WebSocket message, REST requires a user ID, because of its connection-less’.
1 http://<URL >?<EventType >=<UserID >,<EventNumber >,<MouseXcoordinate >,<MouseYcoordinate >
5.2 Visualization transfer optimization
Following methods were utilized to provide each participant with a fluent visualization on itsspecific network conditions.
5.2.1 Bandwidth optimizations
JPEG was chosen as image format, because it still is the one format with the best compressionratio supported on all web browsers (see Section 4.1.3). Its streaming via mJPEG was firstlydone to access web camera videos from the web browsers. In contrast to video, which requires theconstant sending of new images, an interactive visualization only changes after a control commandwas given. Thus, the most significant method to reduce the network throughput is to send only theimages that have been changed. CoWebViz utilizes a simple algorithm that compares consecutiveimages on the sub-pixel level, which starts at the image center and proceeds to the beginning andafterwards to the end. The image center is a good starting point for the comparison, because avolume visualization is typically centered, which means that most modifications while have aneffect on the image center. The algorithm, which is located in the visualization input channel,stops with the first occurrence of an unequal sub-pixel and marks the image as modified or notmodified. Since this image might still be relevant for some specific output channels (e.g. to recorda session movie), it is in the responsibility of the output channel to handle the image accordingly(e.g. send or not send). [51]
59

5 A system design for remote collaborative web-based visualization
Initialization:
- Conduct a bandwidth test
- Calculate the ideal image file size (C1) that is needed to get a desired frame rate
Compress and send the image image
Set image quality to the
quality of the last image of the
previous modification phase
Set image quality
to the maximum
Adjust image quality (C2)
based on last image to
approximately achieve the
ideal file size
yes yes yes
The current image is
the first image
of a modification phase
The current image
differs to the last
The time to the last image
reaches a thresholdno no no
Figure 5.3. This flow chart describes the adjustment of the quality to the specific bandwidthconditions. The calculation of C1 and C2 is illustrated in Figure 5.4a and 5.4b, respectively.
Using mJPEG for the continuous transfer of single images results in an image presentation issuethat we experienced on some web browsers while sending only modified images, which would beof no concern if using mJPEG for its original designation (video transfer). Of two sent images,the first is only displayed if the second is transferred to the web browser. A simple work-aroundwould be to send each image twice, which, however, would result in a large overhead of twice thenecessary data transfer rate. The solution that is implemented in the system is to send the sameimage a second time, after no modification occurred for a specified time (e.g. 500 ms).The usage of this system for a visualization session might lead to a long time without any modi-fications. We never experienced a connection loss during long class visualization sessions, whicheven included periods of up to 30 min with no modification.
5.2.2 Quality and performance optimization
While providing real-time remote interactive visualization, not only the image quality is impor-tant, but also the fluidity in which consecutive images are being presented. The perceived qualitythat a user experiences therefore is a combination of the visualization’s image quality and thefluidity of its presentation.A straightforward method to increase the performance is the reduction of any procession timeon the server side as for instance done by using the improved JPEG compression library libjpeg-turbo [104]. However, most time of a remote visualization process chain is required for the imagetransfer over the network. While sending JPEG images, the image quality is mainly based onthe JPEG quality1 and the image resolution. Rendering and compressing a specific image byapplying a specific JPEG quality and resolution results in a specific image file size. Transferring
1Another variable is the JPEG quantization matrix, which can also be modified to create smaller files [269].However, the standard matrix is recommended for best quality.
60
5.2 Visualization transfer optimization
multiple images over a specific network condition results in a frame rate, which is a commonmetric for the image presentation fluidity. The network condition, however, is mostly pre-definedby external circumstances (in the case of an ad-hoc usability). An automatic adaption of theimage file size towards the specific network condition of each single accessing client is thereforenecessary to provide the best possible perceived quality. Thus, the frame rate and the imagequality needs to be balanced with the current bandwidth condition. The parallel architectureenables such a specific provision for every connecting client.
CoWebViz’s automatic quality algorithm, implemented in the OutputMjpeg/VisualizationOut-putHttp modules, is illustrated as flowchart in Figure 5.3. It basically adjusts the JPEG qualityand image resolution of each consecutive modified images i : 1 . . . n to meet an initially calclu-lated ideal image file size (ifs) that is sufficient to get a desired frame rate (dfps). The algorithmutilizes an abstract quality value φ on a scale from 0 to 100, which is defined as
f : φ 7→ {JPEG quality, image resolution} .
The image file size is increased or decreased by increasing or decreasing φ in the following way [51]:
1. The initial step of the algorithm is the bandwidth measurement of bw in Mbps. bw is thenused to calculate the ideal file size ifs as
f : {bw, dfps, sv} 7→ ifs ,
where ifs is the maximal file size that enables the system to achieve a desired frame rate dfpson the specific network bw. ifs is basically calculated by dividing the available bandwidthby the desired frame rate (see Figure 5.4a). sv is the amount of stereoscopic or othervisualization streams the participant has opened. sv is important, since multiple openvisualization streams result in a multiple of a single stream’s throughput. The single streamthroughput therefore needs to be reduced.
2. A modified image i that is to be sent needs to be compressed using a φi, which results in acompressed image with the file size cfsi (current image file size). This φi is set to a defaultvalue, if the modified image is the first image of the first visualization modification phase ofa visualization session. If the modified image is the first image of a follow-up modificationphase, φi is set to φi−1 (the last non-maximized quality setting of the previous modificationphase).
3. Every following image is compressed with a φi that is calculated based on the a cfsi−1/ifs
ratio (see Figure 5.4b). This difference ratio, is a comparison of the most recently sentimage’s current image file size with the ideal image file size:
f : {ifs, cfsi−1} 7→ diffi .
61

5 A system design for remote collaborative web-based visualization
The file size of the last instead of the current image has to be taken for this calculation,because the current file size is only available after compression. diff is a positive or negativevalue that is used to increase or decrease φ as
f : {diffi} 7→ φi with
increase φi−1 diffi < 1
φi−1 diffi = 1
decrease φi−1 diffi > 1
4. If no modification of the visualization occurs for a specified time (start of a viewing phase),φ is set to its maximum value. Otherwise the loop repeats with step 2.
The CoWebViz client allows to select between this algorithm and two other methods to specify theimage compression handling as shown in Figure 5.5. The automatic quality adjustment furtherallows to slightly balance between quality and fluidity by manually adjustment (see Figure 5.5.A).This is implemented by increasing or decreasing the ideal file size dynamically after request. Thesecond method is a semi automatic adjustment that provides a single slider at the client sideto specify a required quality by modifying φ directly (see Figure 5.5.B). The third method is acomplete manual setting that allows to specify every value separately (see Figure 5.5.C). Thislatter method allows for the most control, but is only useable for development.
0 2 4 6 8 10
01
02
03
04
05
06
07
0
Bandwidth in Mbps
File s
ize in K
byte
to a
chie
ve
a d
esir
ed f
ram
e r
ate
(a) The algorithm’s initial calculation toachieve a desired frame rate during the usage:The ideal image file size (y-axis, in Kbps) iscalculated based on the users bandwidth con-nection (x-axis). [51]
0.0 0.5 1.0 1.5 2.0
-15
-10
-50
51
01
5
Ratio of current file size to ideal file size
Diffe
rence v
alu
e t
o last
image q
uality
(b) The algorithm’s ongoing quality calcula-tion: The comparison of the current and theideal file size (x-axis) maps to a quality dif-ference value (y-axis, greater/lower 1), whichresults in a quality value change for the cur-rent image.
Figure 5.4. The graph in Figure 5.4a illustrates the approach of calculating an ideal file sizebased on the bandwidth. During a modification phase, this visualization’s ideal file size is ap-proximated by modifying the φ based on the current and ideal file size. As shown in Figure 5.4b,a current file size that is larger than the ideal file size (ratio > 1) results in a quality reduction.
62

5.2 Visualization transfer optimization
Another minor method that should increase the frame rate is to limit the resolution of the imagesto the maximum resolution that the client can display. By default, the system sends the sameresolution to the client that the base application provides. But collaborations might also includedevices with smaller screens. Thus, the client’s maximum resolution (the dimensions of the webbrowser window) is exchanged to the server directly after the connection was established or thebrowser window was resized, which is then used as maximum resolution.
Figure 5.5. Illustration of all quality handling methods supported by CoWebViz: A) a completeautomatic quality setting that allows for an optional manual speed adjustment, B) a manualquality setting of a single value that is used for any image without considering the frame rate,and C) a complete manual setting of all parameters.
5.2.3 Visualization smoothness optimization
The modification of visualization using CoWebViz resulted in an observable lag, if it was modifiedat a high pace. This lag could potentially be a very specific issue of using mJPEG on TCPnetworks (defined by the HTTP basis) and could correlate with the non-controllable process ofdecompressing the JPEG images on the client in the following way: If sending multiple imagesthat are completely transferred (because of TCP), each image is decompressed and displayedwith a speed that is too slow to be presented on time. This could finally result in a stepwisedecompression of all images and, thus, a delayed presentation.
CoWebViz’s approach to reduce this observed lag is to set a specific delay after an image has beensent, which the system has to wait for this participant and visualization view before it can sentthe next image. It is implemented in the OutputMjpeg/VisualizationOutputHttp module and is
63
5 A system design for remote collaborative web-based visualization
based on the bandwidth test and the file size of the image that is to be sent (see Section 5.2.2):
f : {bw, cfsi} 7→ delayi .
The delay basically is the time that is theoretically necessary to completely transfer the imageon the specific bandwidth condition from the server to the client. [51]
5.3 Event transfer
A visualization can only be re-rendered by the base application, after it received according controlcommands from the user. The event transfer therefore is an equally important network related as-pect of interactive remote visualization as the visualization transfer. The specific implementationis described in Section 5.1.3.The initial implementation of the event transfer was the REST interface. An example of thisinterface as implemented by CoWebViz is http://<URL>:8080/ctrl?m=1,1,40,50, which has 5specified variables that are the event type (m), the user ID (1), the left button down event (1),and the x- and y position of the mouse event (40,50). The class experience (see Section 6.1.2),however, showed that this interface led to a slow and lagging visualization. The only other newlyavailable technique with a potentially faster transfer was WebSockets, which was implemented asa consequence of this lag. It was later proofed by the analysis in Section 4.2 that it actually isfaster than the REST interface.
5.4 Collaborative multi-user access control
If multiple participants need to have access to a single visualization applications, the access to itscontrol mechanism needs to be managed in order to avoid confusions on the programmatical level(illegal event states) and the user level (notification of who is modifying). Other collaborativesystems utilized various different types of access control mechanisms. A most simple one is toprovide only one participant with the right to control, where all others are only passive viewers(e.g. supported by [95, 270]). Another method is to allow every participant to get dedicatedcontrol, but only after an explicit control request (e.g. supported by [271]). Subjectively, eitherprovides too few flexibility or management overhead.For collaborative usage, CoWebViz requires a parallel running system for personal communicationbetween all participants (e.g. audio and/or video conferencing, or chat systems). Since all userscan communicate with each other, it seems to be natural to just talk about who is using thevisualization next. Leigh et al. [160] suggested to minimize the application management for suchcollaborative cases.The specific implementation of CoWebViz is realized in the ControlManagement module. Thiscontrol mechanism lets every participant freely control the visualization instantaneously as longas wanted, if no other participants is modifying in the beginning. But as soon as the user stops to
64
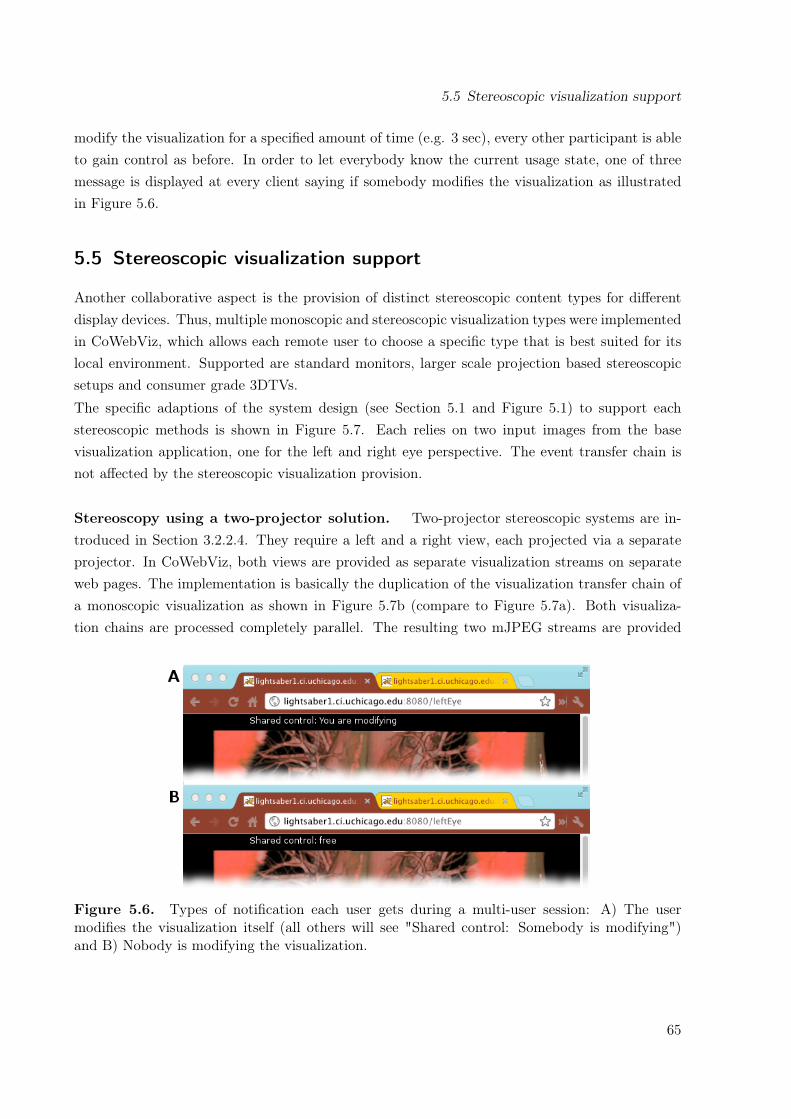
5.5 Stereoscopic visualization support
modify the visualization for a specified amount of time (e.g. 3 sec), every other participant is ableto gain control as before. In order to let everybody know the current usage state, one of threemessage is displayed at every client saying if somebody modifies the visualization as illustratedin Figure 5.6.
5.5 Stereoscopic visualization support
Another collaborative aspect is the provision of distinct stereoscopic content types for differentdisplay devices. Thus, multiple monoscopic and stereoscopic visualization types were implementedin CoWebViz, which allows each remote user to choose a specific type that is best suited for itslocal environment. Supported are standard monitors, larger scale projection based stereoscopicsetups and consumer grade 3DTVs.The specific adaptions of the system design (see Section 5.1 and Figure 5.1) to support eachstereoscopic methods is shown in Figure 5.7. Each relies on two input images from the basevisualization application, one for the left and right eye perspective. The event transfer chain isnot affected by the stereoscopic visualization provision.
Stereoscopy using a two-projector solution. Two-projector stereoscopic systems are in-troduced in Section 3.2.2.4. They require a left and a right view, each projected via a separateprojector. In CoWebViz, both views are provided as separate visualization streams on separateweb pages. The implementation is basically the duplication of the visualization transfer chain ofa monoscopic visualization as shown in Figure 5.7b (compare to Figure 5.7a). Both visualiza-tion chains are processed completely parallel. The resulting two mJPEG streams are provided
Figure 5.6. Types of notification each user gets during a multi-user session: A) The usermodifies the visualization itself (all others will see "Shared control: Somebody is modifying")and B) Nobody is modifying the visualization.
65

5 A system design for remote collaborative web-based visualization
VisualisationInput
Channel
Destinationservant
VisualisationOutputChannel
MedVolViz
(a) Mono-scopic transferchain.
VisualisationInput
Channel
MedVolViz
VisualisationInput
Channel
Destinationservant
VisualisationOutputChannel
Destinationservant
VisualisationOutputChannel
(b) Two-view stereoscopictransfer chain with a dupli-cated monoscopic chain.
VisualisationInput
Channel
MedVolViz
VisualisationInput
Channel
Image FilterAnaglyph
Destinationservant
VisualisationOutputChannel
(c) Anaglyph stereoscopictransfer chain with an imagefilter to create the anaglyphimage of two input images.
VisualisationInput
Channel
MedVolViz
VisualisationInput
Channel
Image FilterHalfWide
SideBySide
Destinationservant
VisualisationOutputChannel
(d) Half-wide side-by-sidetransfer chain with an imagefilter to create the formattedimage of two input images.
VisualisationInput
Channel
MedVolViz
Destinationservant
VisualisationOutputChannel
(e) Half-wide side-by-sidetransfer chain with an imagefilter to create the formattedimage of one input image.
Figure 5.7. CoWebViz’s monoscopic (a) and stereoscopic visualization transfer chains andformats (b-e).
66
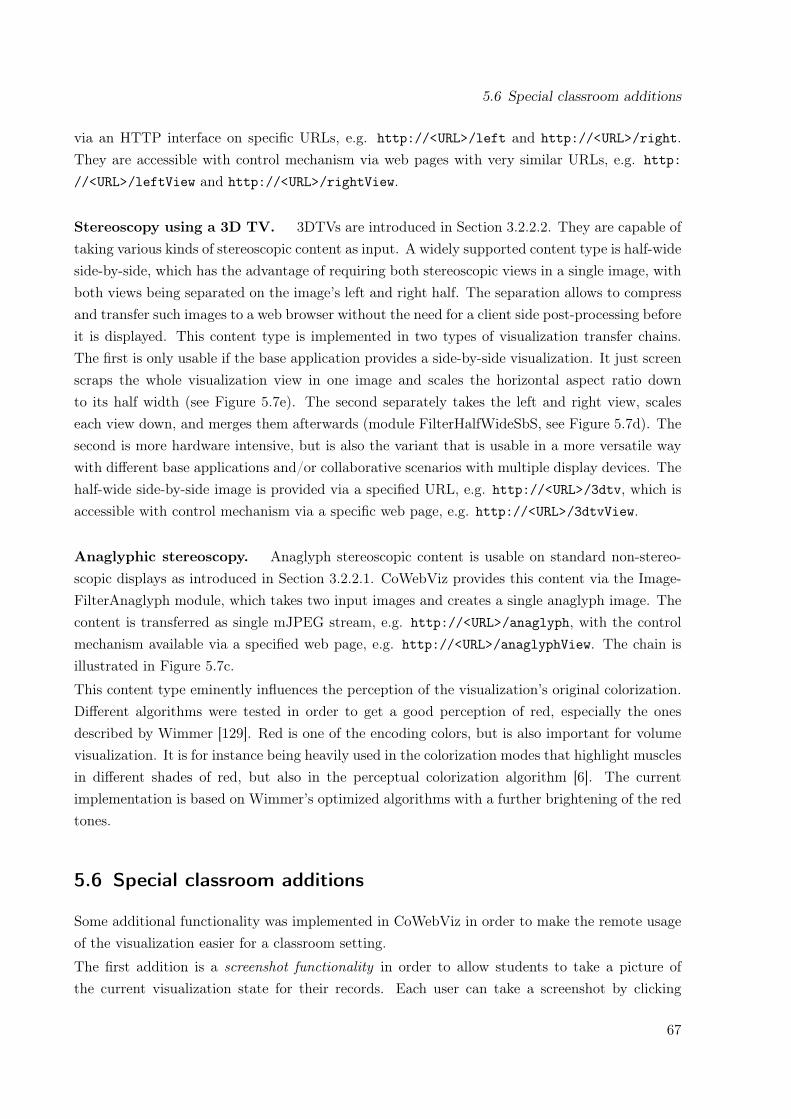
5.6 Special classroom additions
via an HTTP interface on specific URLs, e.g. http://<URL>/left and http://<URL>/right.They are accessible with control mechanism via web pages with very similar URLs, e.g. http:
//<URL>/leftView and http://<URL>/rightView.
Stereoscopy using a 3D TV. 3DTVs are introduced in Section 3.2.2.2. They are capable oftaking various kinds of stereoscopic content as input. A widely supported content type is half-wideside-by-side, which has the advantage of requiring both stereoscopic views in a single image, withboth views being separated on the image’s left and right half. The separation allows to compressand transfer such images to a web browser without the need for a client side post-processing beforeit is displayed. This content type is implemented in two types of visualization transfer chains.The first is only usable if the base application provides a side-by-side visualization. It just screenscraps the whole visualization view in one image and scales the horizontal aspect ratio downto its half width (see Figure 5.7e). The second separately takes the left and right view, scaleseach view down, and merges them afterwards (module FilterHalfWideSbS, see Figure 5.7d). Thesecond is more hardware intensive, but is also the variant that is usable in a more versatile waywith different base applications and/or collaborative scenarios with multiple display devices. Thehalf-wide side-by-side image is provided via a specified URL, e.g. http://<URL>/3dtv, which isaccessible with control mechanism via a specific web page, e.g. http://<URL>/3dtvView.
Anaglyphic stereoscopy. Anaglyph stereoscopic content is usable on standard non-stereo-scopic displays as introduced in Section 3.2.2.1. CoWebViz provides this content via the Image-FilterAnaglyph module, which takes two input images and creates a single anaglyph image. Thecontent is transferred as single mJPEG stream, e.g. http://<URL>/anaglyph, with the controlmechanism available via a specified web page, e.g. http://<URL>/anaglyphView. The chain isillustrated in Figure 5.7c.
This content type eminently influences the perception of the visualization’s original colorization.Different algorithms were tested in order to get a good perception of red, especially the onesdescribed by Wimmer [129]. Red is one of the encoding colors, but is also important for volumevisualization. It is for instance being heavily used in the colorization modes that highlight musclesin different shades of red, but also in the perceptual colorization algorithm [6]. The currentimplementation is based on Wimmer’s optimized algorithms with a further brightening of the redtones.
5.6 Special classroom additions
Some additional functionality was implemented in CoWebViz in order to make the remote usageof the visualization easier for a classroom setting.
The first addition is a screenshot functionality in order to allow students to take a picture ofthe current visualization state for their records. Each user can take a screenshot by clicking
67

5 A system design for remote collaborative web-based visualization
on the according button, as shown in Figure 5.9. The server stores the picture that is beingpresented during the button click in a specific web-accessible directory. Afterwards, all picturesare downloadable via a specific web page, which is shown in Figure 5.8. It is implemented bycombining the visualization output channel OutputFile with the output format for JPEG. Thisimplementation allows to store images of any visualization type, even if the system currently showsanother stereoscopic content type. This means that it allows to take for instance an anaglyphpicture, while watching a two-view stereoscopic visualization in the classroom.The second addition is a client side GUI, implemented to ease the visualization manipulationof the base application as shown in Figure 5.9. CoWebViz is mainly developed for the proofof concept usage with MedVolViz as base visualization application. MedVolViz, however, doesnot provide any GUI by itself, as e.g. for data exploration, but instead is completely controlledvia keyboard events. This allows for a fast visualization-centered usage by people who know theapplication, but slows down people, who are not familiar with it. The GUI itself is implementedas HTML/CSS controls. Each button is assigned with a JavaScript function, which are collectionsof those mouse and/or key events that a user would have to give via the mouse and/or keyboard.On button press, these events are sent to the server.The third addition is a record and playback functionality of a visualization session with the aim toguide a user (e.g. a student) through different states of a visualization without any knowledge ofthe application functionality. In detail, a user can access CoWebViz as usual, start a recording byclicking on a button, use the visualization as usual and eventually stop the recording by clickingon a button (see Figure 7.2: 1). It was implemented by storing all mouse and keyboard eventsthat the user raises during this time (see ControlOutputScriptingFile module), each with thetime difference to the previous event (see Listing 5.1). Multiple of such event sequences can becombined and stored as a lesson (see Figure 7.2: 2). A lesson can be played back, sequence bysequence (see ControlInputScriptingFile module). At every time the user has the opportunity tostop the automatic playback for a manual manipulation of the visualization (see Figure 7.2: 3-5).
68
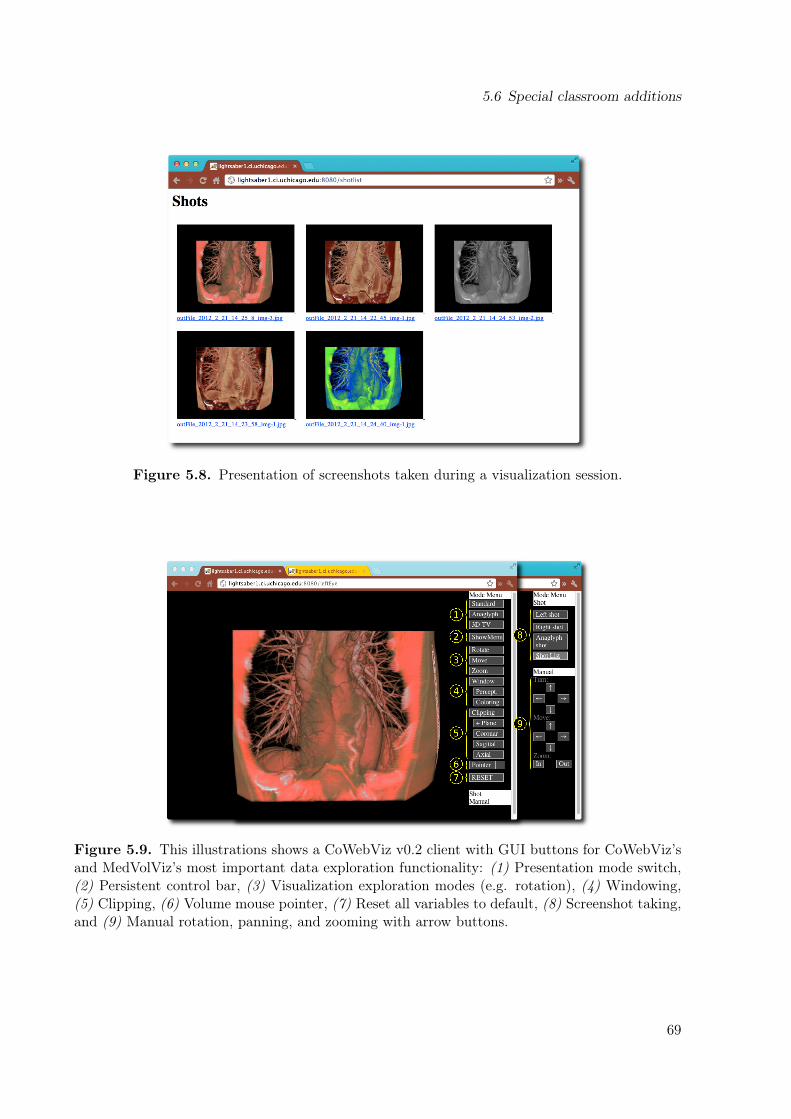
5.6 Special classroom additions
Figure 5.8. Presentation of screenshots taken during a visualization session.
Figure 5.9. This illustrations shows a CoWebViz v0.2 client with GUI buttons for CoWebViz’sand MedVolViz’s most important data exploration functionality: (1) Presentation mode switch,(2) Persistent control bar, (3) Visualization exploration modes (e.g. rotation), (4) Windowing,(5) Clipping, (6) Volume mouse pointer, (7) Reset all variables to default, (8) Screenshot taking,and (9) Manual rotation, panning, and zooming with arrow buttons.
69

5 A system design for remote collaborative web-based visualization
Figure 5.10. This figure illustrates the recording functionality at the client side: (1) Start, stop,and name a new recorded sequence, (2) list recorded sequences for playback and lesson creation,(3) store a new lesson created by the + buttons of (2), (4) select, and (5) play a lesson.
70
6 Proof of concept conduction results
This chapter describes the proof of concept conduction: the practical application of CoWebViz in acollaborative anatomy class with shared stereoscopic visualization. This most eminent utilizationof CoWebViz and its advantages compared to the previous class setup are described in Section 6.1.During the development phase and after the initial classroom usage, CoWebViz was also usedfor other projects by our own working group and collaborators. These applications are brieflydescribed in Section 6.2 and 6.3 to show that the approach is also interesting for other scenarios.An overview of all usages is given in Table 6.1.
6.1 CoWebViz usage for collaborative anatomical education
CoWebViz was introduced in the collaborative virtual anatomy classroom for undergraduate bi-ology students in spring 2010. The overall procedure and previous technical setup of the virtualanatomy class are introduced in Section 2.3.2.2. As before, it was a collaboration for educationbetween two groups. It was held at The University of Chicago’s John Crerar Library in Chicago(IL, USA) with remote participants at the Cardiff School of Computer Science and Informatics inCardiff (UK) (see Section 2.3.2.2, [108, 266]). The University of Chicago room setup was similarto the setup of the previous years, it is illustrated in Figure 2.3 on page 20. An Access Grid clientwith two cameras was used for the videoconferencing, which was projected on a single projectionscreen, together with the 2D illustrations (see Fig. 2.3, right side). The stereoscopic visualiza-tion was rendered by MedVolViz (Section 2.3.2.1) on a visualization cluster at The University ofChicago’s Computation Institute. It was presented via a permanently installed stereoscopic two-projector setup (see GeoWALL in Section 3.2.2.4). The remote classroom had a very similar setup.
The specific procedure of using CoWebViz 0.1 (see Section 5) for the stereoscopic visualizationin the classroom is described in Section 6.1.1. Usage experiences and observations that led to awell performing system are described in Section 6.1.2. In Section 6.1.3, it is compared with theprevious remote visualization system.
6.1.1 Procedure of using CoWebViz in class
On the server side (the visualization cluster), CoWebViz and MedVolViz required to be directlystarted on the command line via a ssh connection (Figure 6.1, step 1). Afterwards the left andright eye view were accessible via previously configured URLs.
71
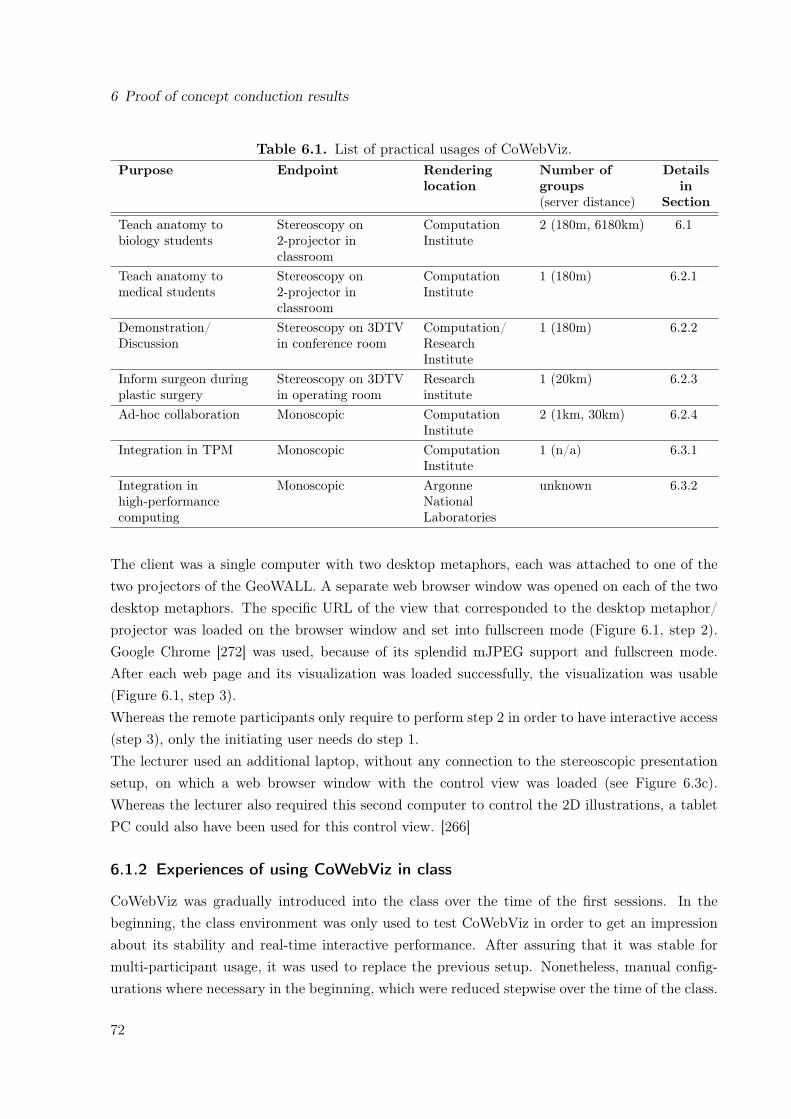
6 Proof of concept conduction results
Table 6.1. List of practical usages of CoWebViz.Purpose Endpoint Rendering
locationNumber ofgroups(server distance)
Detailsin
Section
Teach anatomy tobiology students
Stereoscopy on2-projector inclassroom
ComputationInstitute
2 (180m, 6180km) 6.1
Teach anatomy tomedical students
Stereoscopy on2-projector inclassroom
ComputationInstitute
1 (180m) 6.2.1
Demonstration/Discussion
Stereoscopy on 3DTVin conference room
Computation/ResearchInstitute
1 (180m) 6.2.2
Inform surgeon duringplastic surgery
Stereoscopy on 3DTVin operating room
Researchinstitute
1 (20km) 6.2.3
Ad-hoc collaboration Monoscopic ComputationInstitute
2 (1km, 30km) 6.2.4
Integration in TPM Monoscopic ComputationInstitute
1 (n/a) 6.3.1
Integration inhigh-performancecomputing
Monoscopic ArgonneNationalLaboratories
unknown 6.3.2
The client was a single computer with two desktop metaphors, each was attached to one of thetwo projectors of the GeoWALL. A separate web browser window was opened on each of the twodesktop metaphors. The specific URL of the view that corresponded to the desktop metaphor/projector was loaded on the browser window and set into fullscreen mode (Figure 6.1, step 2).Google Chrome [272] was used, because of its splendid mJPEG support and fullscreen mode.After each web page and its visualization was loaded successfully, the visualization was usable(Figure 6.1, step 3).Whereas the remote participants only require to perform step 2 in order to have interactive access(step 3), only the initiating user needs do step 1.The lecturer used an additional laptop, without any connection to the stereoscopic presentationsetup, on which a web browser window with the control view was loaded (see Figure 6.3c).Whereas the lecturer also required this second computer to control the 2D illustrations, a tabletPC could also have been used for this control view. [266]
6.1.2 Experiences of using CoWebViz in class
CoWebViz was gradually introduced into the class over the time of the first sessions. In thebeginning, the class environment was only used to test CoWebViz in order to get an impressionabout its stability and real-time interactive performance. After assuring that it was stable formulti-participant usage, it was used to replace the previous setup. Nonetheless, manual config-urations where necessary in the beginning, which were reduced stepwise over the time of the class.
72
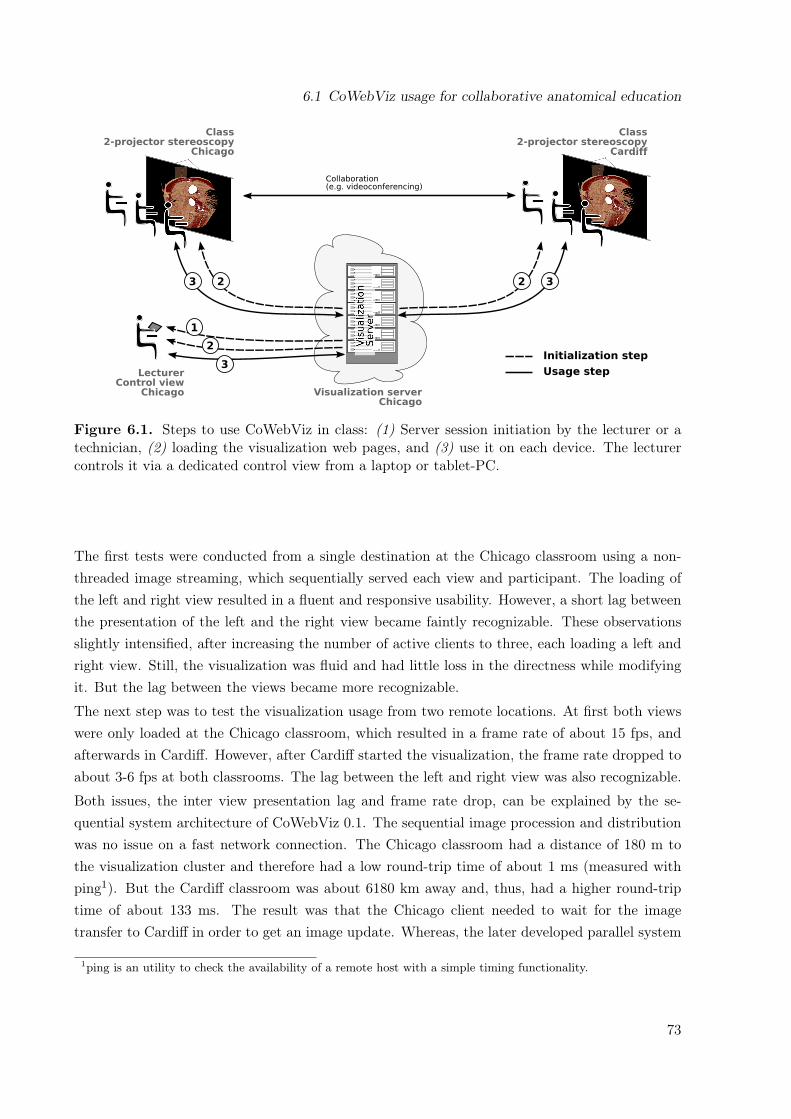
6.1 CoWebViz usage for collaborative anatomical education
Collaboration (e.g. videoconferencing)
Class2-projector stereoscopy
Cardiff
Class2-projector stereoscopy
Chicago
Visualization serverChicago
23 32
3
2
LecturerControl view
Chicago
1
Initialization step
Usage step
Figure 6.1. Steps to use CoWebViz in class: (1) Server session initiation by the lecturer or atechnician, (2) loading the visualization web pages, and (3) use it on each device. The lecturercontrols it via a dedicated control view from a laptop or tablet-PC.
The first tests were conducted from a single destination at the Chicago classroom using a non-threaded image streaming, which sequentially served each view and participant. The loading ofthe left and right view resulted in a fluent and responsive usability. However, a short lag betweenthe presentation of the left and the right view became faintly recognizable. These observationsslightly intensified, after increasing the number of active clients to three, each loading a left andright view. Still, the visualization was fluid and had little loss in the directness while modifyingit. But the lag between the views became more recognizable.
The next step was to test the visualization usage from two remote locations. At first both viewswere only loaded at the Chicago classroom, which resulted in a frame rate of about 15 fps, andafterwards in Cardiff. However, after Cardiff started the visualization, the frame rate dropped toabout 3-6 fps at both classrooms. The lag between the left and right view was also recognizable.
Both issues, the inter view presentation lag and frame rate drop, can be explained by the se-quential system architecture of CoWebViz 0.1. The sequential image procession and distributionwas no issue on a fast network connection. The Chicago classroom had a distance of 180 m tothe visualization cluster and therefore had a low round-trip time of about 1 ms (measured withping1). But the Cardiff classroom was about 6180 km away and, thus, had a higher round-triptime of about 133 ms. The result was that the Chicago client needed to wait for the imagetransfer to Cardiff in order to get an image update. Whereas, the later developed parallel system
1ping is an utility to check the availability of a remote host with a simple timing functionality.
73
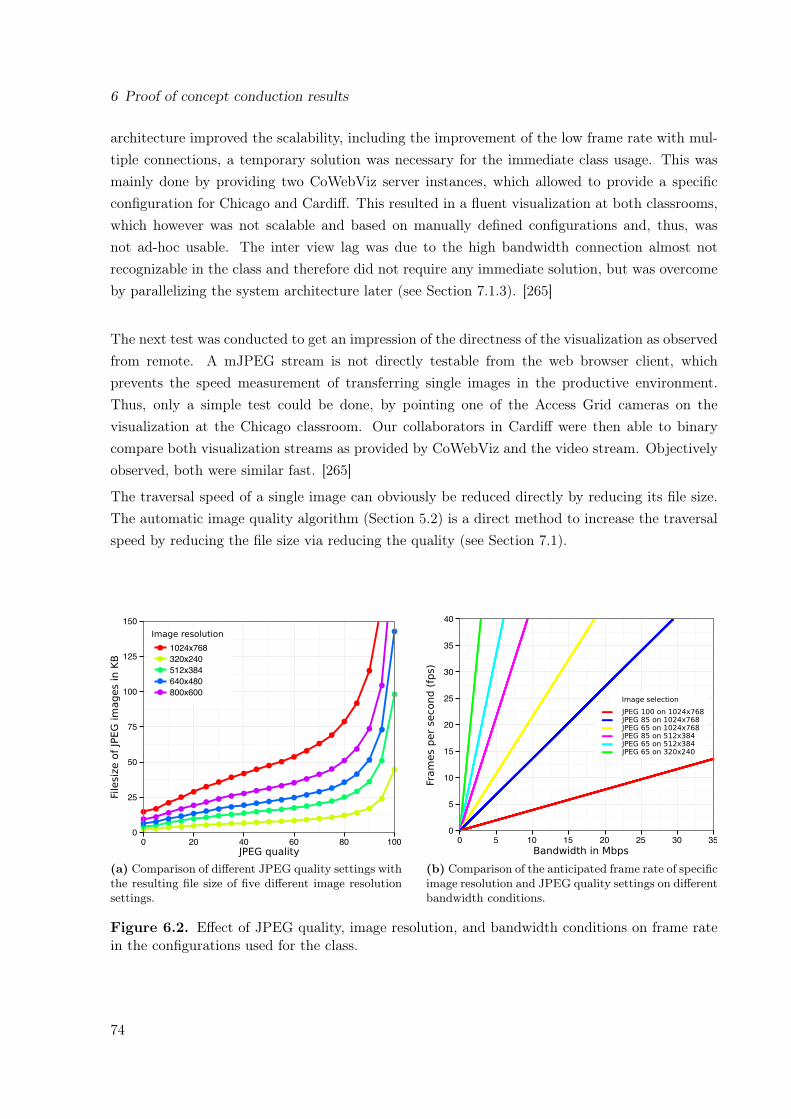
6 Proof of concept conduction results
architecture improved the scalability, including the improvement of the low frame rate with mul-tiple connections, a temporary solution was necessary for the immediate class usage. This wasmainly done by providing two CoWebViz server instances, which allowed to provide a specificconfiguration for Chicago and Cardiff. This resulted in a fluent visualization at both classrooms,which however was not scalable and based on manually defined configurations and, thus, wasnot ad-hoc usable. The inter view lag was due to the high bandwidth connection almost notrecognizable in the class and therefore did not require any immediate solution, but was overcomeby parallelizing the system architecture later (see Section 7.1.3). [265]
The next test was conducted to get an impression of the directness of the visualization as observedfrom remote. A mJPEG stream is not directly testable from the web browser client, whichprevents the speed measurement of transferring single images in the productive environment.Thus, only a simple test could be done, by pointing one of the Access Grid cameras on thevisualization at the Chicago classroom. Our collaborators in Cardiff were then able to binarycompare both visualization streams as provided by CoWebViz and the video stream. Objectivelyobserved, both were similar fast. [265]
The traversal speed of a single image can obviously be reduced directly by reducing its file size.The automatic image quality algorithm (Section 5.2) is a direct method to increase the traversalspeed by reducing the file size via reducing the quality (see Section 7.1).
Filesiz
e o
f JP
EG
im
ages in K
B
Image resolution
JPEG quality
(a) Comparison of different JPEG quality settings withthe resulting file size of five different image resolutionsettings.
Fra
mes p
er
second (
fps)
Bandwidth in Mbps
JPEG 100 on 1024x768
JPEG 65 on 1024x768
JPEG 65 on 320x240JPEG 65 on 512x384
JPEG 85 on 1024x768
JPEG 85 on 512x384
Image selection
(b) Comparison of the anticipated frame rate of specificimage resolution and JPEG quality settings on differentbandwidth conditions.
Figure 6.2. Effect of JPEG quality, image resolution, and bandwidth conditions on frame ratein the configurations used for the class.
74
6.1 CoWebViz usage for collaborative anatomical education
With a remote visualization system, there always is a tradeoff between a good image qualityand a fluent usability. Thus, the next task was to find the best pair of a JPEG quality andimage resolution for a usable system at both classrooms. A matrix of JPEG images with 5different aspect ratios (from 320 x 240 to 1024 x 768) and 21 different JPEG quality levels (from0 to 100) were created and visually compared next to each other. These images were producedwith CoWebViz and show a CT volume visualization rendered by MedVolViz. This graph is toolarge for this thesis, but a small selection is presented in Figure 7.2a. Subjectively, they showedfew loss of detail between a JPEG quality of 70 to 100. Compression artifacts were noticeablebetween a JPEG quality of 50 to about 70 and strongly noticeable below 50. The file size of theseimages was compared to each other in Figure 6.2a, which shows a strong file size increase with aJPEG quality above about 85.
Figure 6.2b presents the bandwidth usage that some of the previously defined image quality/resolution settings (see Figure 6.2a) would require in order to get a desired frame rate. TheChicago classroom had a very high bandwidth connection to the visualization cluster and, thus,was provided with the best quality (image resolution: 1024 x 768, JPEG quality: 85). Thisresulted in a very high throughput of about 25 Mbps for both streams, each with 17 fps (seeFigure 6.2b). Cardiff had a much lower, but still decent network connection. After several testsessions we ended up in sending them a quarter of the original resolution and a lower quality(image resolution: 512 x 384, JPEG quality: 65), which resulted in about 11 Mbps for bothstreams, each with 7 fps. The previous class system only allowed to stream a static aspect ratioof 704 x 576 pixels (also see Section 6.1.3). Its peak bandwidth usage during modification phaseswas about 2.8 Mbps. Extrapolated to the aspect ratios 512 x 384 and 1024 x 7682 as used byCoWebViz, it resulted in 1.4 and 5.4 Mbps, respectively. [266]
The previous system utilized inter frame compression, which naturally has a much lower networkutilization. Consequently, the usage of CoWebViz 0.1 resulted in a significantly higher band-width usage. The later developed automatic quality adjustment optimizes the frame rate as wellas the image quality, but still has a high bandwidth usage compared to video codecs (Section5.2). Compared to the static resolution of the previous class system, these optimizations alsoimprove the presented quality during viewing phases, which is then maximized to full resolutionand full JPEG quality. [266]
In order to test the collaborative functionality more extensively, a test session with three remoteclients was conducted. The visualization was rendered as usual on the visualization cluster inChicago and loaded at clients in Chicago, Cardiff (UK) and Göttingen (Germany) with an aspectratio/JPEG quality of 1024 x 768/85 for the Chicago class and 512 x 384/65 for Cardiff andGöttingen. The visualization was fluid at all locations, but lagged few milliseconds up to 1 to 2seconds behind, if controlled from Europe. Each client had different frame rates of 4 fps, 6 fps,and 15 fps, depending on the specific network connections in Göttingen, Cardiff, and Chicago,
2This is valid, under the assumption that the bandwidth usage increases linear with the resolution.
75

6 Proof of concept conduction results
respectively. It seemed that the frame rate was higher in Cardiff and Göttingen, when controlledfrom Chicago compared to the controlling from their clients. [266]The lagging visualization could therefore be explained by a slow control event transmission bythe REST interface. This issue was optimized by implementing WebSockets for the event transfer(Section 5.3), which brought a further speedup to the interactivity shown in Section 4.2. An-other observation during this session was that it was not always clear for everybody, who wasmodifying at any point in time if multiple participants started to modify. This issue was solvedby additionally implementing the multi-user access control module as well as providing statusnotifications of who is currently modifying (see Section 5.3). [266]
6.1.3 Comparison of CoWebViz with the preceding class setup
While the previous section describes the observations made during the usage in the classroom byreferencing associated improvements, CoWebViz’s application in the class itself already improvedthe situation compared to the class’ previous remote visualization system.
The most basic and most significant difference is the usage of a web browser as client applicationinstead of a special native application. The previously used application was a special development,which was tied to the server application. It required to be specifically deployed with additionaldependencies (e.g. Python [273] and vic [196]) and managed on the client computer. Associatedwith this is the continuous development overhead due to the client provision for multiple clientenvironments (MacOS and Windows). Such is necessary, because every little change of the baseenvironment may break the system, as happened with Python updates on the previous clientapplication. The usage of an external application as the web browser in this case, may also resultin the necessity of maintainance. But this only affects the server side, since web browsers areusually already being maintained.
The initial steps that were necessary to perform a class session were reduced by switching toCoWebViz. Now, the usage is as simple as using any other web application after the server isstarted: open a web browser and load a specified URL. A stereoscopic two-projector visualizationonly requires to open a second window and to set both into fullscreen mode (see Figure 6.3a and6.3b). Previously, it was additionally necessary to manually align the left and right stereoscopicview exactly on top of each other (each provided via a single application window). This was nec-essary, because the application did not support full screen mode and no automatic centering. Buta web-application is much simpler extendable and thus simply allowed to center a visualizationstream in a web browser window with fullscreen functionality.
Previously, a specific H.261 video streamer was included in the visualization application and usedto stream the visualization to the classrooms. Meanwhile, H.261 is a rather old video format, butis still frequently used in Access Grid. H.261 only supports a restricted set of aspect ratios with
76
6.2 Other applications of CoWebViz
the largest being Common Intermediate Format (CIF), which has an aspect ratio of 352 x 288pixels. The previous remote visualization system therefore utilized a complex system of foursingle CIF streams for each eye perspective, resulting in a static aspect ratio of 4x CommonIntermediate Format (4CIF) (704 x 576 pixels) and 8 streams [108].CoWebViz allows to use a single stream, in contrast to the previous four streams, with an ar-bitrary choice of the aspect ratio. This allowed for a much easier handling and, thus, simplerclient system. This can for instance be seen in the differentiation between the destinations duringthe first class sessions, where it was easily possible to send a specific higher aspect ratio to theChicago classroom and a lower to the Cardiff classroom. But still, our collaborators empiricalopinion at Cardiff was that the CoWebViz usage resulted in a better overall visualization qualityin terms of compression artifacts and colorization. [265]
The usability of the base visualization application’s remote usage via CoWebViz is on principleequal to its direct local usage. An obvious difference of both remote applications (CoWebVizand previous system) is the slightly slower performance, because there always is a noticeable lagbetween the finished rendering on the server side and its presentation on the remote client. Butwhereas the previous remote system was only able to exactly stream the two stereoscopic streamsto the client, CoWebViz also allowed for other usage patterns. Previously, both stereoscopicstreams needed to be loaded on the computer that was responsible for the stereoscopic projection.The lecturer, however, required to sit in front of the class with a separate computer to controlthe 2D and 3D visualization. It was therefore required to connect the lecturer’s computer via aVNC connection to the computer of the stereoscopic setup in order to control the stereoscopicvisualization.CoWebViz in contrast simply allowed to open a specific control view (see Figure 6.3c) that showsno visualization but allows to fully control the visualization without further deployment.
6.2 Other applications of CoWebViz
The previous section describes the utilization of CoWebViz 0.1 on a two-projector stereoscopicsystem. The optimized CoWebViz 0.2 was developed und used for other scenarios and stereoscopicsetups, which are described in this section. Whereas, each of these stereoscopic content types canbe used solely, they can also be used simultaneously in a single collaborative session as enabledby the parallel architecture (see Section 5.1) and illustrated in Figure 6.4.
6.2.1 Anatomical education in medical school
CoWebViz was used to teach anatomy to medical students at The University of Chicago’s PritzkerSchool of Medicine in August/September 2011. The class was conceptualized as an optionalsession additional to the standard medical anatomy class. The visualization was presented on a
77

6 Proof of concept conduction results
(a) Client instance: stereoscopic left eye view. (b) Client instance: stereoscopic right eye view.
(c) Client instance: control view.
Figure 6.3. CoWebViz’s distinct client instances (web pages) as used in the classroom. Eachcan be used to control the visualization, but the control view is dedicated to this functionality.
stereoscopic two-projector system, which required two CoWebViz client instances (one for eachview). Teaching assistants held the class and controlled the visualization via a CoWebViz controlclient instance (see Fig. 6.3c) on a Laptop. They did not have any experience with this setupbefore the class started. We therefore developed several additions in order to help them usingit: the client side GUI controls and the visualization scripting, both described in Section 5.6.Whereas the scripting was not used, the GUI was supportive for an instantaneous system usage.But since they used the system the first time in class, they quickly switched to take our directpersonal support with the keyboard based control. The class was only realized for two sessions.
This class was based on the same setup as the previously described anatomy class for biologystudents (Section 6.1), but had no second participating remote group.
78

6.2 Other applications of CoWebViz
Figure 6.4. Stereoscopic visualization types for a sole or simultaneous usage as provided byCoWebViz (based on [51]).
The usage of the optimized CoWebViz version 0.2 in this class showed the advantages of therevised design in a practical setting. The main observations where that the inter view lag (lag be-tween the presentation of the left and right view) was not recognizable anymore. The system wasalso usable without specific server side configurations, but delivered a fluent usable visualizationduring modification phases and maximum quality when viewing.
6.2.2 Demonstration in conference rooms
CoWebViz was and is occasionally used to present stereoscopic visualization for various reasonsto current or potential future collaborators. The visualization was presented on state of theart 3DTVs at two locations, The University of Chicago Hospital and the NorthShore Univer-sity HealthSystem Research Institute. These sessions usually required several client instances ofCoWebViz, one for the 3DTV and others to control it on a Laptop. Such TVs are much eas-ier deployable than two-projector setups. It was therefore also possible for a colleague to useCoWebViz instantaneously on his private 3DTV.
The technical environment was in principle and apart from the stereoscopic presentation identicalto the class setup. Due to its simplified system architecture, few effort was necessary to extendCoWebViz to support a stereoscopic content type that is supported by 3DTVs (see Section 5.5).The visualization was rendered by MedVolViz either on a visualization cluster at The Universityof Chicago or a high performing single computer at NorthShore University HealthSystem.
The usage in conference rooms was CoWebViz’s first usage on 3DTVs and therefore showed itsfeasibility.
79
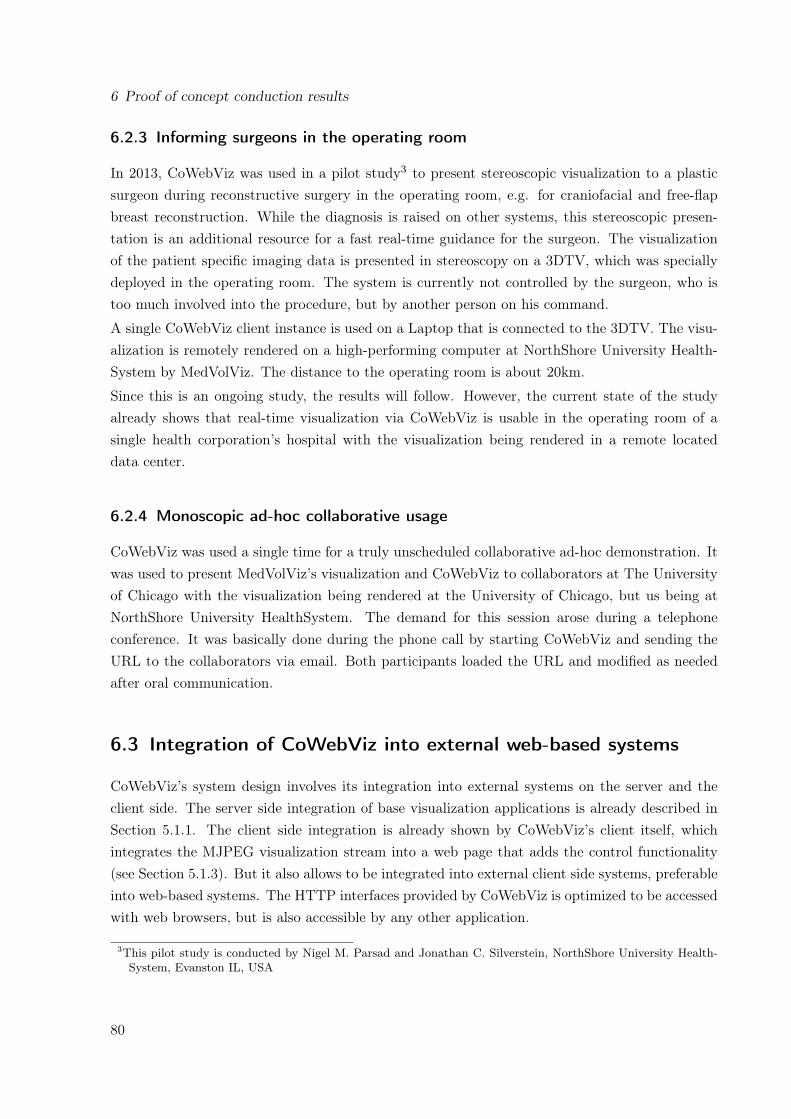
6 Proof of concept conduction results
6.2.3 Informing surgeons in the operating room
In 2013, CoWebViz was used in a pilot study3 to present stereoscopic visualization to a plasticsurgeon during reconstructive surgery in the operating room, e.g. for craniofacial and free-flapbreast reconstruction. While the diagnosis is raised on other systems, this stereoscopic presen-tation is an additional resource for a fast real-time guidance for the surgeon. The visualizationof the patient specific imaging data is presented in stereoscopy on a 3DTV, which was speciallydeployed in the operating room. The system is currently not controlled by the surgeon, who istoo much involved into the procedure, but by another person on his command.
A single CoWebViz client instance is used on a Laptop that is connected to the 3DTV. The visu-alization is remotely rendered on a high-performing computer at NorthShore University Health-System by MedVolViz. The distance to the operating room is about 20km.
Since this is an ongoing study, the results will follow. However, the current state of the studyalready shows that real-time visualization via CoWebViz is usable in the operating room of asingle health corporation’s hospital with the visualization being rendered in a remote locateddata center.
6.2.4 Monoscopic ad-hoc collaborative usage
CoWebViz was used a single time for a truly unscheduled collaborative ad-hoc demonstration. Itwas used to present MedVolViz’s visualization and CoWebViz to collaborators at The Universityof Chicago with the visualization being rendered at the University of Chicago, but us being atNorthShore University HealthSystem. The demand for this session arose during a telephoneconference. It was basically done during the phone call by starting CoWebViz and sending theURL to the collaborators via email. Both participants loaded the URL and modified as neededafter oral communication.
6.3 Integration of CoWebViz into external web-based systems
CoWebViz’s system design involves its integration into external systems on the server and theclient side. The server side integration of base visualization applications is already described inSection 5.1.1. The client side integration is already shown by CoWebViz’s client itself, whichintegrates the MJPEG visualization stream into a web page that adds the control functionality(see Section 5.1.3). But it also allows to be integrated into external client side systems, preferableinto web-based systems. The HTTP interfaces provided by CoWebViz is optimized to be accessedwith web browsers, but is also accessible by any other application.
3This pilot study is conducted by Nigel M. Parsad and Jonathan C. Silverstein, NorthShore University Health-System, Evanston IL, USA
80
6.3 Integration of CoWebViz into external web-based systems
Figure 6.5. This screenshot shows the integration of CoWebViz as web-based front-end of a high-performing visualization cluster setup at the Argonne National Laboratories. This screenshot wasprovided by Tom Uram.
6.3.1 Viewing visualization in TPM
CoWebViz’s monoscopic visualization was integrated into the TelePresence Microscopy Collabo-ratoration (TPM) [238] for testing purpose without its control functionality4 (see Section 3.3.3.2).The visualization was rendered and stored as mJPEG file using MedVolViz and CoWebViz on avisualization cluster at the University of Chicago’s Computation Institute. CoWebViz was thenstarted without base application to play the recorded visualization session in loop on a definedURL. Since the TPM is a system that already provides access to various mJPEG web camerastreams, the integration of CoWebViz’s mJPEG stream was straight forward. This setup can beused as described above to play a recorded visualization session. But a pure real-time renderedvisualization stream can also be integrated into TPM or any other external web application, withthe user modifying the visualization directly via CoWebViz’s control client instance.TPM is used to stream real-time video from a hospital’s operating room to a hospital’s conferenceroom. This integration test might be of interest for the audience, since it shows that a monoscopicor stereoscopic visualization can be integrated additionally to a surgical video stream.
6.3.2 Integration into a high-performance computing environment
CoWebViz was used to provide high-performing interactive visualization to researchers who rendervisualization on a visualization cluster at the Argonne National Laboratory’s Future Laboratories(e.g. for astrophysics).
4The integration into TPM was tested together with Nestor J. Zaluzec, Electron Microscopy Center, ArgonneNational Laboratory, Argonne, IL, USA.
81
6 Proof of concept conduction results
CoWebViz was integrated with full functionality into a web application as part of a Grid com-puting setup to be seamlessly usable from a pure web browser. The external web applicationhandles the user authentication (via MyProxy [274]), the data selection, the initialization, andthe management of the visualization session5. The integrated CoWebViz provides the interactiveaccess to the visualization. Figure 6.5 shows a screenshot of CoWebViz as it is integrated intothis Grid web application. The top menu bar shows the user information, a help button for ad-ditional information, and all necessary functionality to manage the visualization. The large partof the application screen is reserved for the visualization presentation, which is equally usable asa standalone CoWebViz.
5The integration of CoWebViz, including information and screenshot are provided by Tom Uram (ArgonneNational Laboratories Future Laboratories).
82

7 Performance test results and comparison
This section provides detailed performance test results of CoWebViz’s usage under peak perfor-mance in defined test environments and its comparison to a selection of the related work tools.These measured results stay in contrast to the pure observations based on the practical utilizationdescribed in the previous chapter.The performance comparison in Section 7.1 compares different methods of transferring the vi-sualization by starting with the class configuration and ending with a configuration that usesall optimizations. This comparison provides a quantified description of CoWebViz’s usability,but also provides a hint of the performance of other applications that use these methods. Thiscomparison of the principles, based on CoWebViz’s implementation, is of interest, because mostapplications are either not freely available or bound to specific visualization applications, whichprevents a direct comparison.Performance test results of the supported stereoscopic visualization types show each type’s us-ability (see Section 7.1.2). The scalability test results show the possible usability with up to 6simultaneous clients (see Section 7.1.2).All of these tests are based on CoWebViz internal measurements, which provides detailed informa-tion, but can not be compared with related work. Thus, a self-developed frame rate counter (seeSection 2.3.2.3) was used on the client side to provide a performance comparison of CoWebViz,VNC, and ScreenLeap (see Section 7.2).
7.1 System performance tests
The monoscopic, stereoscopic, and scalability performance test results of the following sectionswere conducted as described in the Section 2.3.
7.1.1 Comparison of different visualization transfer optimization levels
The baseline configuration (A) is the transfer of any processed image with a fixed quality, as usedin the virtual anatomy class (CoWebViz 0.1). The second configuration (B) is the transfer of onlythose images that have been modified with a fixed quality, which is also used by other web-basedvisualization applications. The third test configuration (C) is the transfer of only those imagesthat have been modified with an automatic quality/network adaption, which is the optimizedversion of CoWebViz 0.2. The quantified results of these tested configurations are presented inTable 7.1.
83

7 Performance test results and comparison
1 Mbps
3 Mbps
10 Mbps
100 Mbps
Filesiz
e p
er
Fra
me in M
bit
Fixed
quality
Automatic
quality
0.45
0.40
0.35
0.30
0.25
0.20
0.15
0.10
0.05
0
Resolu
tion in %
100
80
60
40
20
0Fixed
quality
Automatic
quality
JPEG
Quality
100
80
60
40
20
0Fixed
quality
Automatic
quality
Fixed
quality
Automatic
quality
0
10
20
30
40
50
60
70
80
Fra
me R
ate
in F
ram
es p
er
Second (
fps)
A B
C D
Figure 7.1. Comparison of different variables of the most simple (all processed images withfixed quality settings, see configuration A in Table 7.1) and most advanced image transfer type(modified images with automatic quality settings, see configuration C in Table 7.1): (A) The filesize per image, (B) the frame rate, (C) the JPEG quality, and (D) the resolution (partially basedon [51]).
A. Fixed quality, send always: The transmission of all processed images (regardless of whetherthe image has modifications or not) with a fixed JPEG quality of 80 and a resolution of1024 x 768 results in a very high maximum frame rate of 76.2 fps on a fast network (seeTable 7.1, A). Associated with this high frame rate is a very high network throughput of25 Mbps, but also a high server (51.7%), and client CPU usage (86.7%). On the other side,if using a slow connection of 1 Mbps, the frame rate is very low (2.9 fps). Both, the highand low image transfer rate is a direct consequence of the available network bandwidth.Since only few of the transmitted images are actually modified this method has a hugeredundancy. [51]
B. Fixed quality, send modified: The sole transmission of the modified images with a fixedquality and resolution eliminates the previously observed redundancy (see Table 7.1, B).The maximal possible frame rate therefore is the base application’s frame rate. This method
84

7.1 System performance tests
is often used by other web-based remote visualization systems, with the difference of pullingsingle images instead of a persistent motion JPEG connection. On the 11 and 90 Mbpsnetworks, the frame rate is reduced by 59.5 fps (78%) and 18.0 fps (54%) and the networkthroughput by 19.6 Mbps (78%) and 6.2 Mbps (54%), respectively. On the 3 and 1 Mbpsnetworks, the frame rate and throughput reduces only insignificantly by less than 1 fps and1 Mbps. This almost non-existing decrease on the slow networks shows that the networkin configuration A was already on its full capacity. If there is no modified visualization atthe base application, no images are transmitted. Consequently the frame rate and networkthroughput decreases to 0 and the client and sever CPU usage go into an idle state. [51]
C. Auto quality, send modified: The automatic quality adjustment towards the available net-work conditions and the sole transfer of modified images is a necessary step to provideinteractive usability on all network types (see Table 7.1, C). On the higher bandwidthconnections of 11 and 90 Mbps, the frame rate slightly changes by less than 1 fps to-wards configuration B. But due to the JPEG quality increase of 5.7 and 4.1, the networkthroughput also increases by 1.2 and 0.2 Mbps, on both networks. On the lower bandwidthconnections of 3 and 1 Mbps, however, the frame rate increases by 2.0 fps (24%) and 7 fps(374%), respectively. Due to the associated JPEG quality decrease of 9.9 and 56.5 and aimage resolution decrease of 31.6% and 92.4%, the network throughput is almost similar toconfiguration B. Accompanied with the frame rate increase is the client/server CPU usageincrease of 11%/13.3% and 6.8%/13.2%, on the 3 and 1 Mbps network, respectively. Thisis caused by the higher image procession need. As previously, if there is no modified visu-alization, there is no active image transfer with a frame rate of 0. But in contrast to theprevious system, each user is provided with an image of maximal quality, which results inthe best possible image quality on all network types during a viewing phase. This behavioris illustrated in in Figure 7.2, which shows the recording of several parameters during awhole visualization session. [51]
Figure 7.1 illustrates the differences caused by the automatic quality adjustment (configuration C)compared to the fixed quality setting (configuration A). The fixed quality setup results in a lowfile size variation (Fig. 7.1A) but in a large frame rate variation (Fig. 7.1B) on different networks.Vice versa, the automatic quality setup results in a large file size variation, but a low frame ratevariation. This difference between the two setups is caused by the adapted JPEG quality andimage resolution towards the available bandwidth as shown in Fig. 7.1C/D. These subfiguresshow equal JPEG quality and image resolution settings on the fixed setup, but varying values onthe automatic quality setup. The latter leads to reduced file sizes and consequently results in thehigher frame rate. [51]Figure 7.2 illustrates the auto quality adjustment’s behavior of the JPEG quality (Fig. 7.2b),frame rate (Fig. 7.2c), bandwidth (Fig. 7.2d) and the mouse event rate (Fig. 7.2e) over the courseof a 140 second visualization session. Example image cutouts of selected phases are presented
85
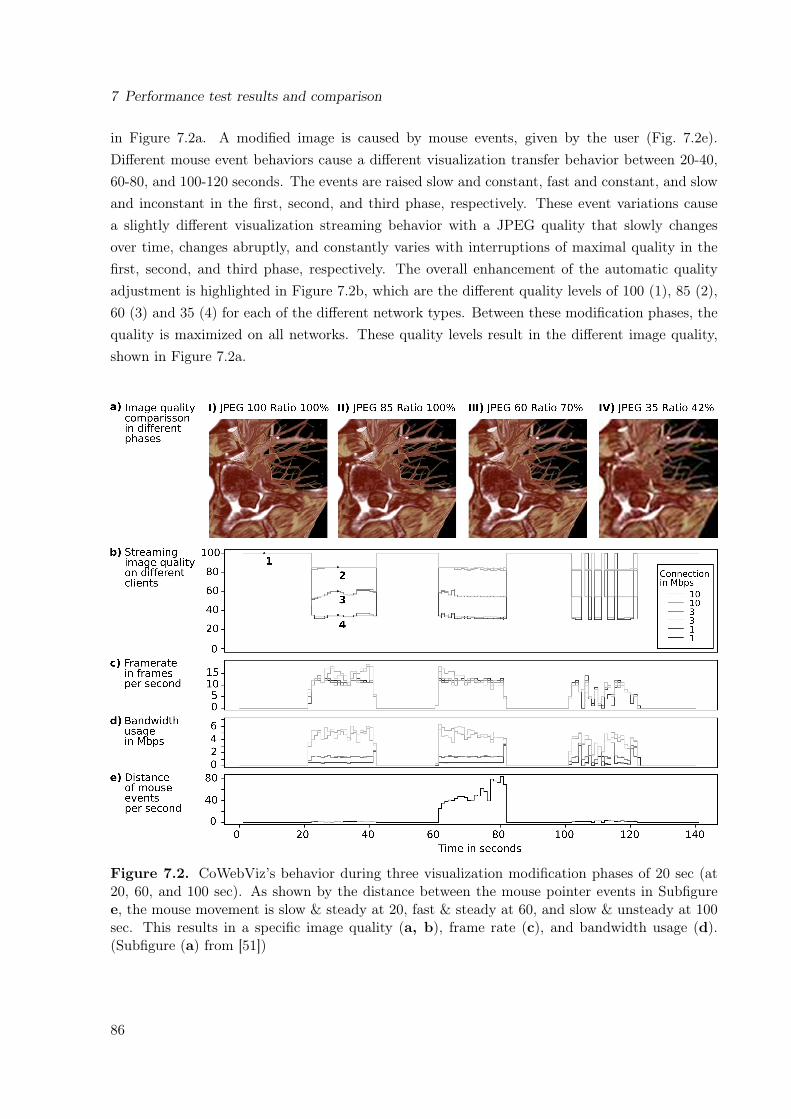
7 Performance test results and comparison
in Figure 7.2a. A modified image is caused by mouse events, given by the user (Fig. 7.2e).Different mouse event behaviors cause a different visualization transfer behavior between 20-40,60-80, and 100-120 seconds. The events are raised slow and constant, fast and constant, and slowand inconstant in the first, second, and third phase, respectively. These event variations causea slightly different visualization streaming behavior with a JPEG quality that slowly changesover time, changes abruptly, and constantly varies with interruptions of maximal quality in thefirst, second, and third phase, respectively. The overall enhancement of the automatic qualityadjustment is highlighted in Figure 7.2b, which are the different quality levels of 100 (1), 85 (2),60 (3) and 35 (4) for each of the different network types. Between these modification phases, thequality is maximized on all networks. These quality levels result in the different image quality,shown in Figure 7.2a.
Figure 7.2. CoWebViz’s behavior during three visualization modification phases of 20 sec (at20, 60, and 100 sec). As shown by the distance between the mouse pointer events in Subfiguree, the mouse movement is slow & steady at 20, fast & steady at 60, and slow & unsteady at 100sec. This results in a specific image quality (a, b), frame rate (c), and bandwidth usage (d).(Subfigure (a) from [51])
86

7.1 System performance tests
Table 7.1. Performance measurement results of different algorithm settings (I) and stereoscopictransfer types (II). The values are presented as mean ± standard deviation. (fixed resolution =1024 x 768, fixed JPEG quality = 80; partially based on [51])Configuration Network
TypeFramerate in
fps
Through-put inMbps
ClientCPU
usage in%
ServerCPU
usage in%
JPEGquality
Imageresolu-tion in
%I. Method comparison on the basis of monoscopic visualization
A. Send all images,fixed resolution/JPEG quality
90 Mbps 76.2±3.0 25.2±0.1 86.7±1.5 51.7±0.2 80±0.0 100±0.011 Mbps 33.5±6.2 11.4±0.1 85.6±1.7 23.6±0.4 80±0.0 100±0.03 Mbps 7.7±1.4 2.6±0.0 46.1±0.5 13.0±0.3 80±0.0 100±0.01 Mbps 2.9±0.7 0.9±0.2 15.9±20.1 7.7±3.3 80±0.0 100±0.0
B. Send modifiedimages, fixedresolution/ JPEGquality
90 Mbps 16.7±0.2 5.6±0.1 54.1±1.2 18.5±0.4 80±0.0 100±0.011 Mbps 15.5±4.0 5.2±0.1 61.8±1.9 16.5±0.3 80±0.0 100±0.03 Mbps 8.2±0.1 2.6±0.0 44.6±1.2 13.6±0.3 80±0.0 100±0.01 Mbps 2.7±1.2 0.9±0.4 7.9±6.8 8.0±3.5 80±0.0 100±0.0
C. Send modifiedimages: automaticsetting of resolution/JPEG quality
90 Mbps 17.3±0.3 6.8±0.1 52.5±1.5 17.6±0.5 85.7±0.2 100±0.011 Mbps 15.5±0.3 5.4±0.1 63.7±1.9 21.7±0.8 84.1±0.3 97.6±0.23 Mbps 10.2±0.2 2.1±0.0 55.6±2.0 26.9±0.9 70.1±0.6 68.4±0.51 Mbps 10.1±2.3 0.3±0.5 14.7±3.5 21.2±4.6 23.5±9.2 7.6±9.2
II. Comparison of stereoscopic visualization transfer techniques based on Configuration 3D. Anaglyphstereoscopy
90 Mbps 14.9±6.1 5.3±2.5 44.6±20.3 121.3±8.6 85.7±3.1 100±0.111 Mbps 14.9±5.1 5.6±2.1 63.0±23.5 130.0±17.7 82.7±5.9 94.3±4.5
E. 3D TV90 Mbps 16.2±5.1 6.2±1.8 64.5±27.2 40.7±17.1 85.8±3.3 100±0.011 Mbps 15.1±4.9 5.8±1.9 70.3±28.2 37.6±14.8 85.5±3.5 99.6±1.3
F. Send two eyeperspective views
90 Mbps16.4±4.6 5.1±1.8
77.3±28.0 73.9±37.5 79.3±6.3 89.1±7.115.8±5.2 5.0±1.9 80.1±7.0 89.7±6.8
11 Mbps13.9±4.1 2.9±1.1
79.7±27.7 59.2±25.6 66.9±11.5 63.9±13.813.8±4.5 2.8±1.1 66.4±13.1 62.1±14.7
7.1.2 Stereoscopic modes
All stereoscopic visualization tests are based on configuration C of Section 7.1.1.
The utilization of anaglyphic visualization results in a similar client side observable performanceas it does for monoscopic visualization. The one big difference lies in the server CPU usage in-crease of 103% and 108% on the 90 Mbps and 11 Mbps networks, respectively. This high increaseis caused by the constant merging of two input images into one anaglyph image. This proces-sion overhead causes a slight frame rate decrease on the fast networks (-2.4 fps, -0.6 fps), whichin turn causes a slight decrease of the network throughput (-1.4 Mbps) and, subsequently, in aslightly lower client side CPU usage. The JPEG quality and image resolution is slightly loweron the 11 Mbps network, which is likely caused by a different bandwidth availability during thealgorithm’s initial bandwidth test.
87
7 Performance test results and comparison
Half-wide side-by-side stereoscopic content also results in a similar performance as the anaglyphcontent, although with a lower extra CPU usage, when using the single view capturer. The framerate and throughput are almost equal. The slight JPEG quality and image resolution differenceon the 11 Mbps network is likely again a result off the bandwidth availability during the algo-rithm’s initial bandwidth test.
The two-view stereoscopy requires to transfer two streams from the server to the client for asingle stereoscopic presentation. On each tested network, both related streams have very similarvalues of ±1. This is an expected behavior, since both are streamed in a single session, conductedwith equal network conditions and initial bandwidth test. However, these minimal differencesbetween the values (including the one slightly larger difference of the image resolution at the11 Mbps network) point out that both streams are transferred independently from each other.Whereas the difference between two related streams are very small, there is a larger differencewhen comparing a single stream to the standard monoscopic visualization (configuration C).On the 90 and 11 Mbps network, all but the CPU usage values are decreased. The automaticquality adjustment algorithm results in a reduced JPEG quality (about -6.5 and -17.5) and imageresolution (about -10.5% and -34.0%). Despite this decrease of the quality values, also the framerate is slightly decreased by 0.6 and 1.6 fps on the 90 and 11 Mbps networks, respectively. Thesechanges are a direct consequence of the automatic quality algorithm, which accounts for multipleviews. This fact can be seen in the increased client (24.8% and 16.0%) and server side CPU usage(56.3% and 37.5%), which increases despite the fact that all other values are lower. [51]
7.1.3 Scalability tests
In order to show CoWebViz’s scalability, it was tested with 1 to 6 simultaneous accessing clientsas described in the Section 2.3.2. The results are presented in Figure 7.3. They show differentperformance behaviors on the client (Fig. 7.3A-D) and server side (Fig. 7.3E-F).CoWebViz retains a steady performance on each network type, independently of the amount ofthe tested 1 to 6 simultaneous accessing clients. This can be seen in a similar average framerate of 10.5 fps, 11.4 fps, and 10.9 fps (Fig. 7.3C) per network type. This similar frame rateis caused at the expense of the image file size (Fig. 7.3B) and, consequently, the JPEG quality(Fig. 7.3A), both are showing separate curves on each network type. Averaged over all 6 tests,it results in a specific JPEG quality of 26.3, 56.9, and 69.4 (Fig. 7.3A) and consequently in aspecific image file size of 3165 KByte, 15238 KByte, and 25519 KByte (Fig. 7.3B) on a 1 Mbps,3 Mbps and 10 Mbps network, respectively. The small variations of each graph are caused bynetwork variations. The combination of the frame rate and the file size leads to an average clientside bandwidth usage of 0.3 Mbps, 1.4 Mbps, and 2.2 Mbps (Fig. 7.3D).Whereas the client side performance is almost constant between 1 and 6 clients, the server sideis marked by constantly increasing values with an increasing number of connected clients. The
88

7.1 System performance tests
5
0
15
10B
andw
idth
in M
bps p
er
client
1 2 3 4 5 6
Number of accessing clients
5
0
15
10
Overa
ll s
erv
er-
sid
e b
andw
idth
in M
bps
1 2 3 4 5 6
Number of accessing clients
1 2 3 4 5 6
Number of accessing clients
10
5
0
Fra
me r
ate
in f
ps
150
100
50
01 2 3 4 5 6
Number of accessing clients
Overa
l serv
er-
sid
e C
PU
usage in %
30
20
10
01 2 3 4 5 6
Number of accessing clients
Image f
ile s
ize in K
Byte
1 2 3 4 5 6
Number of accessing clients
100
75
50
25
0
JPEG
quality
A
C
E
B
D
F
1 Mbps
Connection type
3 Mbps10 Mbps
1 Mbps 3 Mbps10 Mbps
Figure 7.3. Scalability of CoWebViz using monoscopic visualization. The figures show themean and standard deviation of following variables while simultaneously accessing with differentnumbers of clients. The client side behavior is described by the JPEG quality (A), file size perimage (B), frame rate (C), and bandwidth usage (D). Notable parameters on the server side arethe server side CPU usage (E) and overall bandwidth usage (F).
89
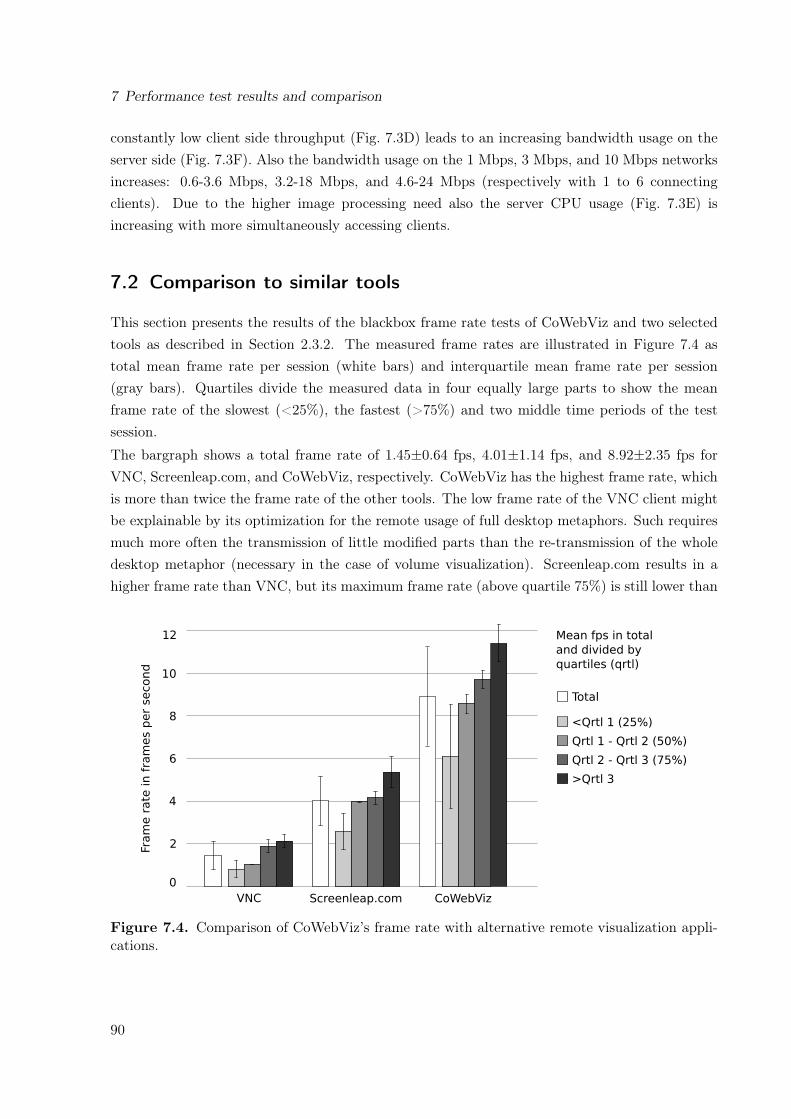
7 Performance test results and comparison
constantly low client side throughput (Fig. 7.3D) leads to an increasing bandwidth usage on theserver side (Fig. 7.3F). Also the bandwidth usage on the 1 Mbps, 3 Mbps, and 10 Mbps networksincreases: 0.6-3.6 Mbps, 3.2-18 Mbps, and 4.6-24 Mbps (respectively with 1 to 6 connectingclients). Due to the higher image processing need also the server CPU usage (Fig. 7.3E) isincreasing with more simultaneously accessing clients.
7.2 Comparison to similar tools
This section presents the results of the blackbox frame rate tests of CoWebViz and two selectedtools as described in Section 2.3.2. The measured frame rates are illustrated in Figure 7.4 astotal mean frame rate per session (white bars) and interquartile mean frame rate per session(gray bars). Quartiles divide the measured data in four equally large parts to show the meanframe rate of the slowest (<25%), the fastest (>75%) and two middle time periods of the testsession.
The bargraph shows a total frame rate of 1.45±0.64 fps, 4.01±1.14 fps, and 8.92±2.35 fps forVNC, Screenleap.com, and CoWebViz, respectively. CoWebViz has the highest frame rate, whichis more than twice the frame rate of the other tools. The low frame rate of the VNC client mightbe explainable by its optimization for the remote usage of full desktop metaphors. Such requiresmuch more often the transmission of little modified parts than the re-transmission of the wholedesktop metaphor (necessary in the case of volume visualization). Screenleap.com results in ahigher frame rate than VNC, but its maximum frame rate (above quartile 75%) is still lower than
12
10
8
6
4
2
0
Fra
me r
ate
in f
ram
es p
er
second
Qrtl 2 - Qrtl 3 (75%)
>Qrtl 3
<Qrtl 1 (25%)
Qrtl 1 - Qrtl 2 (50%)
Mean fps in total
and divided by
quartiles (qrtl)
Total
CoWebVizScreenleap.comVNC
Figure 7.4. Comparison of CoWebViz’s frame rate with alternative remote visualization appli-cations.
90
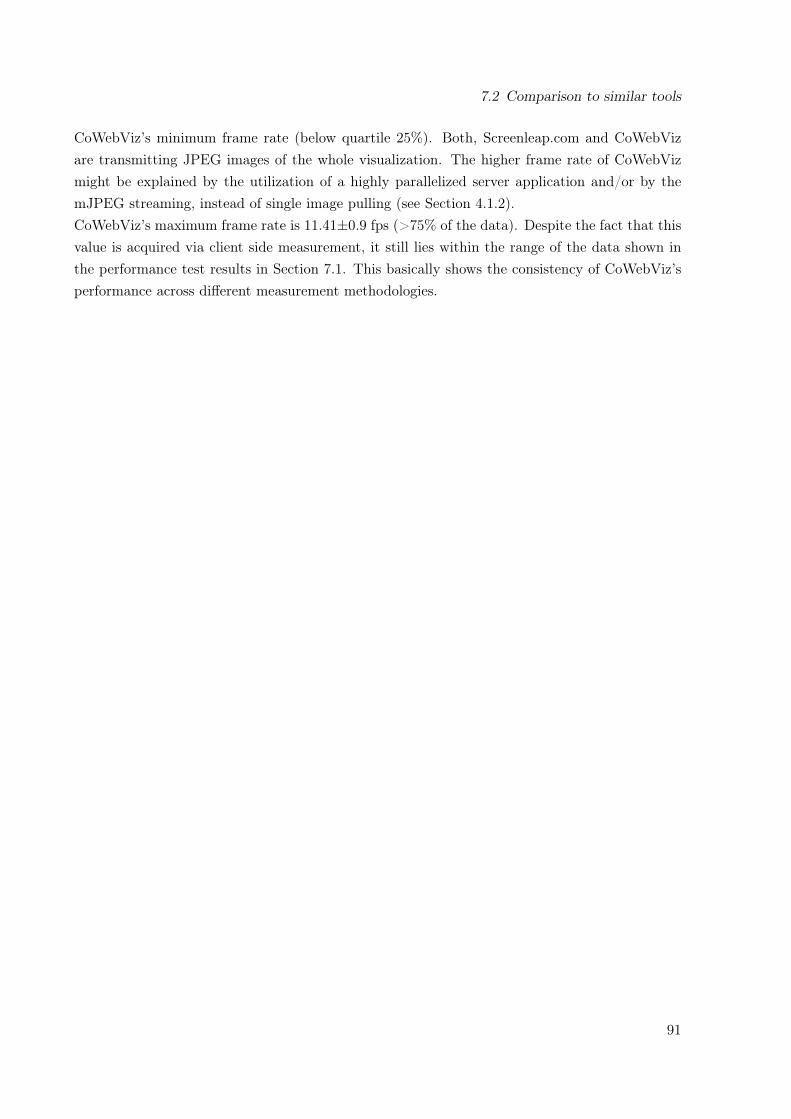
7.2 Comparison to similar tools
CoWebViz’s minimum frame rate (below quartile 25%). Both, Screenleap.com and CoWebVizare transmitting JPEG images of the whole visualization. The higher frame rate of CoWebVizmight be explained by the utilization of a highly parallelized server application and/or by themJPEG streaming, instead of single image pulling (see Section 4.1.2).CoWebViz’s maximum frame rate is 11.41±0.9 fps (>75% of the data). Despite the fact that thisvalue is acquired via client side measurement, it still lies within the range of the data shown inthe performance test results in Section 7.1. This basically shows the consistency of CoWebViz’sperformance across different measurement methodologies.
91

8 Discussion
An educational scenario that requires the most dynamic and life-like volume visualization of thehuman body to present visual answers to all emerging questions from the students is its usage inan interactive and remotely shared gross anatomical class. It requires interactive and stereoscopicvolume visualization, rendered on full resolution volume data of modern imaging modalities (e.g.Computed Tomography (CT) or Magnetic Resonance Imaging (MRI)). Because such visualizationcan not be rendered on any computer (e.g. available in a typical classroom), remote visualizationneeds to be provided using client software that is as simply deployable and usable as possible.This is particularly important if remote participants need to be involed in the scenario.
The approach proposed by this work provides volume visualization with all desired aspects(see Section 1.4) and lowest software requirements on the client side by using a pure standardweb browser. The importance of pure web browser solutions is for example being shown bythe literature analysis, which shows a shift from the usage of web browsers with added software(mean publication date: 2005, N=21) towards the usage of pure web browsers in recent years(mean publication date: 2010, N=15). In contrast to each single visualization aspect (interactive,stereoscopic, collaborative), which was previously possible, this approach combines all conceptsallowing for various extensive use cases with reduced user involvement.
The feasibility of this approach was analyzed via a proof of concept conduction in an educationalclass scenario. A proof of concept conduction is an adequate methodology, because it allows toanalyze new concepts in a real-world application with direct observations and experience feedback.The virtual anatomy class was a use case with exceptional high exploitation of different techniquesand media and, thus, very suitable to test a complex scenario. However, due to the class design,the developed prototype Collaborative Web-based Visualization (CoWebViz) was only beingused by the lecturer. Its application in other uses cases, e.g. presentations on a conference room’s3DTV (Section 6.2.2), high-performance computing environments (Section 6.3.2), and clinicalsurgery (Section 6.2.3), show their basic feasibility and benefit. CoWebViz’s usage in defined testenvironments shows the technical feasibility via performance comparisons with different transfermethods and related work tools.
The proof of concept conduction and any subsequent performance test proofs the initially definedhypothesis valid. The four research requirements that need to be fulfilled are discussed in thefollowing sections.
92
8.1 Minimum user knowledge and involvement for interactive visualization
8.1 Minimum user knowledge and involvement during setup andusage of interactive remote visualization in real-time
The setup phase includes all steps that need to be done before the system can be used. Theapproach of this work was to reduce these steps by reducing client requirements. In case ofthe proof of concept conduction, the stereoscopic presentation system was already available ata designated location on the university campus. The specific steps that were necessary to usethis setup with CoWebViz are described in Section 6.1 and compared with the previous classsystem in Section 6.1.3. From these descriptions follows that CoWebViz requires less steps forthe setup then the previous system. When the server application is started, a participant isonly required to open a web browser and to load the specified Uniform Resource Locator (URL),which is comparable to the usage of most other web applications. The host of the visualizationsession, however, still needs to initialize the server session on the server command line, which isnot straight forward for a naïve user. But the remote session initiation and data upload via pureweb browser front-ends is straight forward and was already shown by other projects [69, 251].
The approach of using pure web browsers is especially interesting, if it is to be used on a corporateor hospital computer, which is mostly associated with limited user rights. Such an environmentwould aggravate the instantaneous deployment and usage of native applications, including web-based applications with added software (e.g. Java or Flash [169, 275]). In turn, no furtherdeployment is required if only a standard web browser is required. The capability of being ad-hocusable on a remote computer without deployments was shown by a daily-life incident where thesystem needed to be demonstrated to remote collaborators without prior scheduling (see Section6.2.4). Due to their wide availability, usage, and ease of use, web-based applications are familiarto most people and, thus, have a positive effect in people using it [4].
CoWebViz’s approach to ease the system’s usage phase is to provide an experience that is asclose to the local usage of the base application as possible with the aim of being most transpar-ent to the user. CoWebViz was developed as web-based front-end for possibly any visualizationapplication and is specialized for remote and collaborative stereoscopic visualization on differentstereoscopic systems. In case of the class usage, the base application was already known to thelecturer and, thus, did not require any new learning. But the second class scenario was lecturedby student teaching assistants (see Section 6.2.1), who had never used the system before. A clientside Graphical User Interface (GUI) with domain specific vocabulary was implemented specifi-cally for them on top of the base application’s control mechanism (see Section 5.6). However,they used this GUI only in the beginning. With our direct support available in these sessions,they quickly switched to the faster but non-graphical control mechanism of the base visualiza-tion application. The first class scenario shows that the system reduces the need to acquire newknowledge by extending existing base applications (see generic integration discussion in Section8.3). The second scenario shows that the added GUI might be of some value for people who
93

8 Discussion
have no direct personal support, e.g. because they are remote. Because the teaching assistantsonly needed to learn the specific commands of the base application, it also shows that CoWebVizallows for a transparent usage of the base application.
There are various other software systems available that could potentially be used to provideremote and collaborative visualization, including web-based approaches. Most of them differ toCoWebViz’s approach by requiring special software and/or hardware deployments and especiallyby not having the necessary stereoscopic functionality. The work that is partially and directlyrelated to this work as defined by the requirements is shown in Table 3.2 on page 41 and discussedin following paragraphs.
Video/audio conferencing systems can most often be used to share a desktop metaphor witha visualization application. Group-to-group conferencing systems (e.g. Access Grid [110], EVO[194]) provide an environment that brings multiple participants from multiple remote locationsvirtually close together (tele-presense) by using multicast, multiple cameras and microphones ateach location. They are used for large cooperative projects or for special events, e.g. for the SARSoutbreak in 2004 [198]. Such systems provide extensive functionality and require a relatively lowbandwidth due to the frequent usage of multicast, but are complex in deployment and usage [276].Standard person-to-person video conferencing systems (e.g. H.323-based systems [193]) provide asimilar but usually inferior functionality [277, 278]. They are widely available by being deployedat conference rooms of almost every department. Both system types utilize high-performingvideo codecs that provide a decent quality with a low network load [279]. However, they are notprimarily designed to be used for visualization and, thus, may require specific configurations atthe server and client side, as for example to provide stereoscopic visualization, a desired imagequality/resolution, and interactive access [108]. They usually require a specific software and/orhardware deployment. Even if some web-based conference systems with added software exist (e.g.EVO [194] or Portable Access Grid [280]), pure web browsers cannot fulfill all requirements of avideo conferencing system yet and, thus, rely on added software [85].
General remote screen sharing applications were developed by many companies [95, 281–283] and are widely applied to access remote desktop metaphors [69], which might include avisualization application [284]. Such systems utilize various kinds of algorithms to reduce thedata transfer [234, 285], as discussed in Section 8.4. Whereas early systems required a specialsoftware deployment at the client side, some have been developed that run within web browsers,but still rely on added software. Envision for example provides a pure web browser interface formost tasks, but requires a Virtual Network Computing (VNC) Java plugin for the interactivevisualization itself [69]. In recent years, many long existing systems were extended by a browser-based access method [281, 282]. Other systems were specifically developed for the pure web-basedaccess purpose [57, 58]. Guacamole [58] for example provides a VNC server access via a pureweb browser for a single participant. Ischimura et al. [57] provides a highly scalable web-based
94

8.1 Minimum user knowledge and involvement for interactive visualization
approach via a standard web server, which however is due to its architecture not highly interactive.ScreenLeap.com [96] provides a pure web-based remote viewing access to a desktop metaphor viaa Java web-start application as server, but is not controllable from the client side. However,these applications are usually specialized for the remote access to the whole desktop metaphor.In order to be used with stereoscopic visualization applications (see Section 8.2) and a multitudeof stereoscopic display devices, they would require special configurations and/or developments.
Special visualization streaming applications provide all the required functionality for spe-cific use cases of projects and communities, which are not or not without special configurationspossible by general screen sharing applications. They are used to access visualization applicationsin many scientific disciplines [75, 82, 286] and are sometimes optimized to transfer very high pixelamounts for tiled displays [208–210]. But similar to the general screen sharing applications, theymostly require specific software deployments at the client side. Only very few and the most recentprojects provide a remote visualization via pure web browsers [56, 59, 61–65]. ParaViewWeb [59]is the remote visualization system of the ParaView server. Its client is either based on pure webbrowsers, Java, or Flash. Its web-based part is similar to CoWebViz’s technique regarding theweb-based access, but without the specific stereoscopic functionality (see Section 8.2 and 8.4).Another very recent development is Vitrall [65], which provides a visualization access via pureweb browsers but also native software. Vitrall mainly provides remote and collaborative accessto surface visualization via OpenSceneGraph [243], but is extendable. Vitrall was already testedwith remote access to a one-view stereoscopic system. The other systems are less advanced and,due to their system design, provide a lower frame rate [56, 61–64]. None of the related work pro-vides an automatic quality setting specific for each user’s network condition as required to serveparticipants with low bandwidth connections (see Section 8.4) nor do they provide functionalityfor different stereoscopic display systems (see Section 8.2).
The technology that CoWebViz applies to transfer visualization to a web browser is the pushingof binary Joint Photographic Experts Group (JPEG) images via a persistent multipart HypertextTransfer Protocol (HTTP) message, which is called motion JPEG (mJPEG). mJPEG was chosen,because: 1. it is potentially the best performing choice (see Chapter 4), 2. many web browserssupport it for the playback of webcam video streams, and 3. because of the positive experiencesin the external project TelePresence Microscopy Collaboratoration (TPM) (see Section 6.3.1).TPM was used to stream video from an operating room to the audience at a conference room ofthe University of Chicago hospital1. This scenario is important, because of its technical similarityto remote visualization and its usage in the same environment as CoWebViz was planned for.
CoWebviz’s feasibility to provide remote access to interactive volume visualization in real-time was shown by its usage in the virtual anatomy class (see Section 6.1.1) and associatedcomparative tests with a parallel running Access Grid deployment (Section 6.1.2). Real-time
1Personal communication with Nestor J. Zaluzec and John C. Alverdy, University of Chicago, IL, USA.
95

8 Discussion
interactivity requires a timely presentation of a modified visualization after it was requested by theuser (e.g. using a mouse and/or keyboard). Real-time interactivity highly depends on the specificnetwork connection, the transfer compression, the specific application’s implementation, and theutilized hardware. Such applications therefore have high optimization potentials. CoWebViz’sapproach to retain interactivity is an automatic quality adjustment algorithm, which is discussedin Section 8.4. This system cannot be compared directly to most web-based systems of the relatedwork, because they are not freely available or utilize other visualization types. However, theirimplemented methods were compared analytically (see Section 4.1.2) and by black box frame ratemeasurements on the client side (see Section 7.2). The superiority of CoWebViz’s approach wasshown in both cases.
Hypertext Markup Language (HTML) 5 video streaming enables the utilization of high-endvideo codecs, as e.g. H.264, on pure web browsers. Using such codecs with efficient inter framecompression would seem to be a better choice than mJPEG. But the evaluation in Section 4.1.1shows that HTML 5 currently results in a delayed visualization presentation. This is mainlycaused by the buffering algorithm suggested by the HTML 5 specification [85], which is optimizedfor a continuous non-interrupting instead of an instantaneous presentation [254]. Thus, HTML 5does not provide a reliable low presentation delay on the web browser, which currently makesthis choice not usable for real-time visualization.
Streaming inter frame compressed video results in a continuous low bit-rate stream witha high frame rate (in movies about 30 frames per second (fps)). Sending an equivalent framerate via single images would result in a very high bandwidth usage. But in order to reach sucha high frame rate with an interactive visualization system, the user would need to modify thevisualization continuously at a great pace without any time for viewing. In practice, visualizationis modified gradually (modification phases) and then viewed for a period of time (viewing phase).This was also the case in the virtual anatomy class, where modification phases were usually shorterthan viewing phases. There were even periods of up to 30 minutes without any visualizationusage at all. But despite sending only modified images, a peak performance usage might lead to ahigh bandwidth load (see Chapter 7). Nevertheless, due to frequent viewing breaks without anybandwidth usage at all, the overall summarized network usage of sending single images is only afraction of the short peaks of high network usage.
Another alternative to mJPEG is the continuous transfer of single Base64 compressed images[287]. These have the advantage of being trouble-free transferable on web-based systems [60].They can be pushed to (e.g. via WebSockets [60]) and pulled from a web browser (HTTPrequests or a Comet-style application as used by Guacamole [58]). The big disadvantage is thatsuch images are about 30% larger than its binary counterpart (see Section 4.1.3), which makesthis choice less efficient.
The best other alternative to mJPEG is the continuous pulling of single binary images froma web browser (see Section 4.1.2). This is the default technique used to load images of standardweb pages, which makes this technique to be best supported on all web browsers (see Section
96

8.2 Multiple participants at different locations with different stereoscopic systems
4.1). However, every image needs to be requested by a separate connection [89], which results in ahigher transfer overhead and thus in a slower possible frame rate (see Section 4.1.2). In contrast,mJPEG just pushes a new image on the initially opened connection and thus has a lower networkoverhead. Many of the existing web-based visualization applications use this transfer technique,as e.g. ParaViewWeb [59].
The technique analysis in Section 4.1.1 shows that mJPEG is a favorable and well performingchoice. However, it is currently not usable on all web browsers, because Internet Explorer andOpera do not support mJPEG by default. Providing interactive visualization with best perfor-mance and quality on all web browsers would therefore require to provide different methods. Theneed of providing fallback mechanisms is a big disadvantage of several web technologies, e.g. videostreaming [221]. Regardless, a specific fallback mechanism without added software as substituteto mJPEG (Safari, Chrome and Firefox) could be pulling single JPEG images (Internet Explorer,Opera) as described by ParaViewWeb or, alternatively, the transfer via WebSockets [60]. Thespecific image transfer technique is independent of the stereoscopic presentation discussed in Sec-tion 8.2 and the automatic quality adjustment discussed in Section 8.4.
The requirement of using pure web browsers reduces the choice of image codecs to JPEG [257]and Portable Network Graphics (PNG) [256] (see Section 4.1.3). PNG is ideal to compress text orline drawings with hard edges and lossy JPEG to compress images with smooth transitions, to getlow file sizes [288]. The typical volume visualization of the human body shows muscles, organs,and bones, each usually with smooth transitions. JPEG is therefore a good choice to compressthe visualization. Another image format is JPEG 2000 [259], which utilizes wavelet compressioninstead of the discrete cosine transformation of JPEG, and results in a higher quality/file sizeratio. Since this is ideal for remote visualization, it is used in many projects that utilize nativeapplications. But since JPEG 2000 and other newer image compression formats, e.g. WebP [261]and H.264 intra frame compression [262], are not supported by default on any web browser, theycan not be used.
8.2 Support of multiple participants at different locations withdifferent stereoscopic systems simultaneously
The previous discussion in Section 8.1 highlights the importance of the easy accessibility of inter-active visualization and discusses available remote visualization approaches and implementationsusing web browsers. The described pure web-based systems were mostly developed for a mono-scopic usage. Stereoscopic remote visualization, in contrast, is less frequently used and mainlybased on native applications, e.g. the special Access Grid-based deployment of the previous vir-tual class setup [108]. The general screen sharing applications (e.g. Guacamole [58]) might only
97

8 Discussion
be able to provide a well performing interactive remote stereoscopic visualization with special con-figurations or additional developments. The specific web-based applications (e.g. ParaViewWeb[59]) are used together with a base application and, thus, are bound to the stereoscopic capabilitiesand visualization algorithms of their base application. Only Vitrall [65] provides a specific singlestereoscopic content type. The simultaneous provision of multiple stereoscopic content types toserve different stereoscopic systems simultaneously would require additional development in eachof the described cases. No literature was found that describes such an easy to use system forstereoscopic volume visualization.
CoWebViz fills this gap and provides the same ease of use for stereoscopic remote visualizationon different stereoscopic display systems via a pure web browser as it does for monoscopic vi-sualization. Its feasibility is shown by its usage in different practical scenarios for stereoscopicbut also monoscopic visualization (see Section 6.1 to 6.3), which is underpinned by performancetests in Section 7.1.2 (see also discussion in Section 8.4). As described in Section 3.2, variousstereoscopic display systems exist, which partially utilize differing content types. Thus, in orderto provide ad-hoc usability in a remotely scattered group with different stereoscopic systems,multiple content types need to be provided simultaneously. CoWebViz provides three differentstereoscopic content types (two-view, side-by-side and anaglyph), which can be used on differentclasses of stereoscopic display devices (projector-based setups, three-dimensional (3D) displaysand standard two-dimensional (2D) displays). This is a range from standard desktop and tabletcomputers to large-scale projection setups.
The projector-based setup was used successfully during the anatomy classes. Due to its largepresentation, this display technique provides a high degree of visual immersion.
The side-by-side stereoscopic visualization on a 3DTV was successfully used in multiple scenarios.At first it was used for several visualization demonstration sessions in a hospital conference room.But to be highlighted is the stereoscopic usage within an operating room to inform a plasticsurgeon during reconstructive surgery, which shows the feasibility of CoWebViz’s usage in a realpractical medical scenario. The usage on 3DTVs is an important use case, because of the lowcost of such TVs and their simple setup.
A content type that requires no stereoscopic hardware deployment at all, is anaglyph stereoscopicvisualization, which only requires low-cost glasses. Its big disadvantage is the color shift causedby the colorized lenses, which, however, is still under research and can be considerable minimized[289, 290]. But its ubiquitous usability makes this technique still interesting for simple use cases[291]. Because of this simple accessibility, it was implemented to be used for self-directed learningon-campus, but was only tested in test sessions.
Monoscopic visualization was also used for different scenarios, e.g. an ad-hoc demonstrationof CoWebViz to collaborators with a parallel teleconference and to provide researchers withinteractive visualization rendered on a remote visualization cluster.
98
8.2 Multiple participants at different locations with different stereoscopic systems
Auto stereoscopic systems are increasingly often used, because of their advantage of notrequiring any personal gear (e.g. polarized glasses). Such systems, however, are currently notsupported by CoWebViz, because they require a specific content type that has all stereoscopicviews merged into a single image. This means that any two neighboring pixels or sub-pixels ofan image presented on most auto stereoscopic 3DTVs represent another stereoscopic view. Sucha merged image cannot be transferred with image compression and would require client sideprocession, which would entail further research.
Stereoscopic displays are not yet available as widely as standard monoscopic displays, whichare provided with every computer workstation. But stereoscopic display devices are increasinglyoften deployed at special visualization centers [161, 292], conference rooms/lecture halls [293], ordirectly at the demanding departments [236]. An important factor that influences the availabilityof stereoscopic devices is the movie industries’ initiative of producing more stereoscopic moviesin the past years, which entailed an increased production and wider availability of stereoscopicdevices. Whereas the hardware is more often available, the specific software for interactive visu-alization still needs to be deployed, which is eased by CoWebViz.
CoWebViz can be used simultaneously by multiple participants from different remote locations.The scalability analysis (see Section 7.1.3) shows that the system has a good performance withup to the maximal tested six simultaneously accessing participants. It is further shown thatthe server’s Central Processing Unit (CPU) usage and network throughput increases with everyadditional user. Thus, the maximal possible number of simultaneously accessing users highlydepends on the environment in which the system is used. But it is expected that most use casesare not requiring more than about four simultaneously accessing groups, which is discussed bythe following examples.
The proof of concept conduction in the class involved two participating groups, each with atwo-view stereoscopic visualization. While this could be slightly increased to provide visualizationto more than two groups, a real contrast would be the usage for self-directed learning by students.This could potentially require the synchronous access by 10 to 100 students, depending on the classsize. This scenario, however, would not be viable, since only one student would be able to modifythe visualization at any time. Providing each student with a freely controllable visualization wouldrequire a separate server instance for every student. This, however, would be a whole anotheruse case with only one participant per instance. It is therefore estimated that a small group ofup to four remote participants is realistic, at least for education use cases. Four participantswith a two-view stereoscopic visualization (each view 1024x768 and a JPEG quality of 85 and apeak frame rate of 15 fps) would result in a peak network usage of about 25 Mbits. This is high,but currently viable with a high-performing network on the server side. A possible solution toprovide visualization to more participants would be the usage of multicast networks. Multicasthowever requires special network arrangements between the server and each client, which wouldreduce the ad-hoc usability. An alternative that does not require any specific client adjustments
99

8 Discussion
but more effort on the server side would be the addition of load-balancing servers. This issue,however, was not a central topic of this work, because the proof of concept conduction did notrequire large amounts of simultaneously accessing users. The central issue rather was the networkthroughput optimization to each single client as discussed in Section 8.4.
The sharing of monoscopic visualization is not new compared to the other web-based andnon web-based systems. However, while developing such a system, the pattern of how remoteusers interact with each other needs to be considered. Interactive systems with multiple usershave been used with different interaction methods. Prominent methods are to give only one per-son the right to modify and the others only the right to view [270], to give all participants theright to modify after a request [271], and to let every participant freely modify after oral coor-dination [160]. The idea behind the proof of concept was to provide a most simple system withleast required user knowledge. Thus, CoWebViz’s method is to inform the participants aboutthe current state and to give everyone the instantaneous right to just modify, if nobody else ismodifying. Because of the few direct users in the proof of concept conduction, these methodscould not be evaluated against each other. But this method seems to be as natural as possiblewithout any system restrains. It requires mutual oral coordination, which is always necessaryfor synchronous collaborative working and can be done via video and/or teleconferencing. Nobarriers regarding this method were observed during the proof of concept conduction.
CoWebViz’s stereoscopic and collaborative functionality can be seen as a stereoscopic remotevisualization service, which is a mix of a stereoscopic player [129] (taking stereoscopic inputformats and providing desired output formats) and a video-streaming server (taking input andstreaming to multiple participants). By requiring no special software deployment, CoWebVizallows for various advanced use cases with the utilization of interactive 3D and stereoscopicvisualization on remote computers and multiple participants.
8.3 Generic support of any existing and future visualizationapplication
The provision of different stereoscopic content types at the client side as discussed in the previoussection is necessary to include various display devices and, thus, participants. In contrast, thegeneric integration of different visualization applications and stereoscopic content types at theserver side is necessary to be independent of a single visualization type and application. In thefirst place, this is important for keeping the development overhead low via functional separationand to provide a quick access to existing visualization applications. In the second place, it hasthe advantage of providing remote access to existing applications, which are already familiar tothe user. The familiarity of an application and/or application logic potentially reduces the timethat needs to be spent for learning because it keeps the knowledge that a user requires low.
100

8.3 Generic support of any existing and future visualization application
The generic integration of whole desktop metaphors and specific monoscopic visualization ap-plications is already widely used on native and pure web-based remote visualization applications[58, 69, 95]. It is also already possible to integrate some single stereoscopic content types via ex-isting applications (e.g. half-wide side-by-side for 3DTVs) handled as monoscopic visualization.However, the simultaneous usage of different display devices and more complex stereoscopic vi-sualization formats (e.g. two-view stereoscopy) requires a specific handling and processing of thestereoscopic input content. Existing remote visualization applications (see Table 3.2 on page 41)would require substantial development in order to achieve this, while keeping the client siderequirements low.
CoWebViz’s architecture shows the feasibility of integrating an existing visualization appli-cation with a two-view side-by-side stereoscopy (see Section 6.1.1 and 5.5). The effort, requiredto integrate another stereoscopic format highly depends on the specific format (e.g. very simpleis top-to-bottom and interlaced), but is basically enabled by the architecture. While CoWebVizcurrently integrates a stereoscopic application with two views, some stereoscopic display devicesrequire more than two views to provide a higher visual immersion, e.g. a partial CAVE with threeor four walls, a floor, and/or a ceiling (introduced in Section 3.2.2.4). The integration of morethan two views is possible, but would require few straightforward modifications. The integrationof monoscopic visualization is a subset of the stereoscopic streaming with only one instead of twoviews.
The generic integration is solved by using screen scraping, which is already used by otherremote applications [58, 95, 96]. It uses an operating system’s window system (e.g. the LinuxX-Server [103]) as an intermediate layer and is therefore generic towards any existing and futureapplication that runs on this window system. The proof of concept conduction shows that thisapproach is simple to use and is capable of providing an adequate performance for an interactiveusage (see test in Chapter 7). A disadvantage of this approach is that the server always requires awindow system. This causes technical complexity in case of servers without a connected display,which is common on visualization clusters. Other methods were described that allow the integra-tion of visualization by utilizing knowledge about the visualization application’s interior design.TechViz for example integrates visualization generically for OpenGL applications, by accessingthe OpenGL data (e.g. vertices) on a low operating system level to modify the visualizationapplication’s rendering to custom needs [294]. This however is only possible with a specific appli-cation’s insight (e.g. the application is OpenGL based). In contrast, volume visualization is oftendeveloped specifically for each application with CPU or Graphics Processing Unit (GPU)-basedrendering and, thus, can not be integrated generically. The most generic access to different kindsof visualization applications therefore is to screen scrape, where the word "generic" relates to thewindow system.
Direct connections to specific visualization applications are not generic anymore, but mightenable a more efficient connection as well as more technical possibilities. CoWebViz generally
101

8 Discussion
supports such cases by providing an architecture that eases the development of specific modulesto integrate visualization libraries (e.g. VTK [295]) or external visualization applications viashared memory (see Section 5.1.1), as it was used by the previous classroom’s setup [188].
Med ical Volume Visualization (MedVolViz) is the stereoscopic visualization application that wasused for the proof of concept conduction. It has no GUI in order to emphasize on the visualizationitself. A new user only requires to learn few key commands to access all necessary functionalityfor a quick and full usability. But, due to the need of remembering these key commands, whichmight complicate a usage, we provided a GUI on top of these commands. This was simply doneon the layer on which CoWebViz works: the event transfer. Buttons were created on the clientside that release the specified events on button press (see Section 5.6). This functionality wasfurther extended by the session recording/playback functionality (see Section 5.6). As alreadydiscussed in Section 8.1, both were not used besides tests, but could potentially be of value inthe described class environment. In contrast, an often used extension is the pure control viewthat only allows to modify the visualization. Such is necessary to reduce the bandwidth usage inenvironments that already have a large projection of the visualization, e.g. the class. This viewwas only used by the lecturer and the teaching assistants but could be used by any participantof an audience, which allows for new scenarios by including all participants instantaneously anddirectly in the visualization usage via pure web-browser.
An obstacle with the generic integration of many visualization applications is the GUI.While the quality of the application window’s visualization part can be reduced without a directusage limitation (apart from not being able to see all details), the GUI needs to be availablein high quality for readability. CoWebViz is developed to screen scrape the whole or a part ofa window in order to allow the remote access of pure visualization. While the first method isad-hoc usable without specific additions, the second method requires to add specific client sideadditions (one time only) in order to make the hidden functionality available (see Section 5.1.1).Such a solution is the addition of GUI controls or key commands at the client side that providecontrol commands, necessary to access the hidden GUI (as discussed in the previous paragraph).CoWebViz could easily be configured specifically for a new application with hidden GUI. But anautomated and much broader solution is already proposed by Lamberti et al. [207], who providea framework that analyses the GUI as image and automatically identifies control elements (e.g.buttons), which are then linkable to a new remote client GUI.
In contrast to the other web-based remote visualization applications, CoWebViz provides addi-tional functionality specifically for educational scenarios (see Section 5.6). The session scripting(record, organization in lectures, playback) might ease the usage for the lecturer and people whohave never used the system before [296]. Other visualization input types (e.g. a movie withoutsound or a webcam stream) can also be streamed, as for instance to play a recorded visualiza-
102

8.4 Automatic quality adjustment to optimize between performance and quality
tion session or an animation from remote. A screenshot taking functionality was added to allowstudents or any other participant to take a stereoscopic (anaglyph) or monoscopic image for per-sonal documentation. These additions, however, have only been developed and tested, but notyet evaluated in the educational scenario.
Hospital Information Systems (HISs) are being more often developed as web-based systems[42]. But their imaging functionality is mostly being integrated via added software [297–299].This development choice is presumably chosen because of its simple way to get comprehensivefunctionalities. However, the native integration of pure web-based visualization into a pure web-based application seems natural and the technical possibilities provided by pure web browsers arecontinuously increasing [85]. It would provide for a seamless usability by not requiring differingtechniques and therefore again reduce the user involvement. The feasibility of such an integrationon the client side was already successfully shown with CoWebViz (see Section 6.3.1). In the firstscenario, this was done via the direct integration of the pure monoscopic visualization (withoutinteractivity) into the TPM [203] and in the second scenario by integrating the whole CoWebVizfunctionality into a large visualization cluster environment with a web-based Grid-computingscheduler2.
8.4 Automatic quality adjustment during the runtime to optimizethe balance between performance and quality on a givennetwork condition
CoWebViz’s performance optimization is a direct result of the additional development follow-ing the first practical usage in the virtual anatomy class. These developments are the parallelarchitecture, the automatic quality adjustment algorithm and the event transfer optimization.CoWebViz’s automatic quality algorithm continuously adjusts the visualization quality specifi-cally for every user’s bandwidth connection (see Section 7.1). It retains a minimum interactivityon different very low to high bandwidth conditions (see Figure 5.4 on page 62). Such an adap-tion is especially necessary to allow a real-time visualization usage in collaborative settings withmultiple client systems connected via standard unconstrained networks (e.g. the Internet).
Movie and video streaming services cover such varying environments via client side bufferingand by providing multiple versions of a video stream, each for a specific class of bandwidth envi-ronments. They retain the frame rate by utilizing state of the art video codecs and compressiontowards defined bitrates, each allowing for a fluent playback with according best quality on thecorrelating network. Frame rate is a common descriptive metric in computer graphics and videotechniques to describe performance of video-like techniques (continuous images), which gives a
2Personal communication with Nestor J. Zaluzec (2011) and Tom Uram (2012), Argonne National Laboratories,IL, USA.
103

8 Discussion
hint to the fluency perceived by a user. In contrast to videos with consecutively changing images,visualization is only changed after requested and only needs to be transferred in these cases. Adescriptive metric for interactive visualization could therefore also be the round-trip time fromgiving an event to seeing the resulting visualization. This event-to-image-time should be as shortas possible (usually few milliseconds [7]). Frame rate, however, is a common and well knownmetric and multiple event-to-image-times, considered over time, result again in the frame rate.But a maximum frame rate is only reached with a continuous modification and, thus, is only ametric of maximum performance, as presented in the performance tests in Chapter 7. Because ofthese reasons, the modification and viewing phases (see Section 8.1) need to be considered sepa-rately while discussing algorithms to improve the access to highly interactive remote visualization.
CoWebViz’s automatic quality adjustment algorithm calculates an ideal (maximal) image file sizefor each specific network connection in order to provide a desired frame rate during a visualizationmodification phase. This calculation is basically the division of the available bandwidth by theamount of the desired frame rate. The ideal image file size provides a reference value towardswhich the image quality of each image is continuously adapted. Maximizing the image qualityafter a specified time of no modification results in an optimal visualization presentation for theviewing phase.
While this adaption includes a tradeoff between a decreased JPEG quality/resolution andperformance, the theoretical best-case scenario is to continuously send every modified image withhigh frame rate and a constant high quality. However, this case is only possible in real-time onhigh-performing networks (16.7 fps with a quality of 80 on 90 Megabit per second (Mbps) and15.5 fps with a quality of 80 on 11 Mbps). On a low bandwidth network of 1 Mbps it results inonly 2.7 fps. Thus, it is necessary to provide specific quality settings for any participant insteadof a static quality (see Section 7.1.1 B vs. C).
Most related web-based systems transfer each single modified image with a static pre-defined quality setting. Single images can be reduced by manipulating many specific parameters,as e.g. in case of JPEG the JPEG quality and image resolution, but also the JPEG quantizationmatrix [269]. But the usage of a statically defined quality results in decreasing frame rateswith decreasing bandwidth conditions. Of the web-based related work, only ParaViewWeb alsomodified the quality according to the two phases (e.g. maximizing the quality for viewing).ParaViewWeb [59] provides the most advanced approach of the related work by using a pre-defined JPEG quality of 50 for every connection type during the modification phase and 100during the viewing phase. But as shown in Section 7.1.1 and 7.2, a static quality setting does notaccount for different bandwidth conditions for any client.
A theoretical maximum performance of CoWebViz is shown by transferring every image thatCoWebViz processes. This setup resulted in the transfer of as much as 76 frames per second on avery high bandwidth connection of 90 Mbps and a static JPEG quality of 80 (see Section 7.1.1 A).
104

8.4 Automatic quality adjustment to optimize between performance and quality
While the base application is not rendering on such a high pace, these frame rates include lots ofduplicate frames and, subsequently, a high network overhead (see Section 7.1.1 A vs. B).
Compared to the related work, CoWebViz’s approach is a very performant method (seeSection 7.1.1 and 7.2). General non-web-based remote screen sharing systems utilize all kindsof algorithms in order to prevent and/or reduce the transfer of image data, e.g. moving imageparts on the client side while transferring only the missing data in VNC. Such methods are verybeneficial to access standard desktop metaphors, including multiple windows with standard GUIelements and little fast changing visualization. But as shown in Section 7.2 this approach seemsnot to be as sufficient for highly interactive visualization with content where almost any pixelchanges between any two consecutive modified images.
CoWebViz, in contrast to the related web-based work, also includes the stereoscopic visu-alization with multiple views into the quality adjustment (see Section 5.2.2). This is done byreducing the ideal image file size by the number of opened views for each participant’s networkconnection. As described in the Section 5.2.2, this results again in a quality reduction for eachseparate view of a two-view stereoscopic visualization, but is the straightforward continuance ofthe algorithm. The initiation of multiple views occurs while using e.g. a two-view stereoscopicvisualization as well as the parallel usage of two identical views. An anaglyph stereoscopic visu-alization, in contrast, is equal to the monoscopic visualization with a higher server load for thecreation of the anaglyph visualization. A side-by-side stereoscopic visualization for state of theart 3DTVs is comparable to monoscopic visualization with a high resolution.
CoWebViz’s parallel executing architecture is a consequence of the requirement to provide aspecific image quality for every connected client. Serving each client with a specific quality isnecessary to optimally balance the visualization quality with the available bandwidth that ispreset and specific between the server and each connected client. The architecture allows tosend multiple streams, each with a specific configuration to one or multiple other participantssimultaneously. During a viewing phase the system requires very few resources, including no datatransfer and a low server CPU usage of 9.6% to 40.5% for 1 to 6 participants, respectively, but atthe same time having a maximum quality. During a modification phase, these values change. Asdescribed in Section 7.1.3, the automatic quality algorithm retains the frame rate and the qualityof a single user session, independently of the amount of participants (from 1 to 6). However, on theserver side the CPU and bandwidth usage increases linear from 21.8% to 82.5% on 1 to 6 clients,respectively. This causes the existence of an upper limit of simultaneously accessing participants,depending on the available server side CPU and network conditions. However, high numbers ofsimultaneous users are not feasible, as already discussed in Section 8.3. But utilizing the systemwith about 6 participants is also no performance issue for most state of the art servers, because itonly requires about 1-2 cores of a standard computer and a network of 15 Mbps, which is usuallyavailable at universities. The procession of image scaling and compression could further be spedup by using General-purpose Computing on a Graphics Processing Unit (e.g. CUDA [300]).
105

8 Discussion
Whereas the image transfer is the largest data transfer of the event-to-image time, the othercrucial transfer is the control event transfer from the client to the server. Web browsers wereinitially not developed for interactive real-time systems. The common technique to transfer datafrom the client to the server is therefore a Representational State Transfer (REST)-style interface,which is still used by most applications. It requires the establishment of a new connection for anyevent, which results in unnecessary network overhead. Since the visualization on a remote serverwill only be modified after the corresponding events reached the server, the event transfer needsto be as fast as possible. WebSockets is still a new but very promising development allowing forfaster data transfers and thus is a more appropriate mechanism to transfer data in real-time. Thisis shown by CoWebViz’s WebSockets implementation which is almost 50% faster than the REST-style interface (see Section 4.2). In the related work, the event transfer technique is not always asclearly described as the visualization transfer. It is very likely that most of the systems still use aREST-style interface and only some already use WebSockets (e.g. Vitrall [65]). CoWebViz mainlyutilizes WebSockets. But, since WebSockets are still in development and REST-style interfacesseemed to be more robust against network issues and available on every web browser, they arevery appropriate as fallback mechanism.
106

9 Conclusion
This dissertation’s contribution is a proof of concept conduction that shows the feasibility ofconjointly using interactive, stereoscopic, and remote collaborative visualization for anatomicaleducation via pure web browser based clients.
The system (CoWebViz) described in Chapter 5 is one of the first systems that provides fluidinteractive visualization in real-time via pure web browsers. Only recent developments madesuch extensive applications on web browsers without added software possible. To the best of ourknowledge, the combination of supporting all requirements stated in the introduction Section 1.4is currently unique, which allows for extensive use cases.
Stereoscopic and real-time interactive medical volume visualization for collaborative usage is notbound to special software deployments. Due to the system’s stereoscopic emphasize described inSection 5.5, it is simultaneously usable with different stereoscopic content types to serve differentstereoscopic setups at different locations. This is made possible by the separate treatment of eachstereoscopic input view on the server side, as discussed for the generic integration in Section 8.3.Chapter 6 shows that not only setups with a single stream (half-wide side-by-side, anaglyph),but also setups with multiple streams can be served (two-projector solutions). To the best of ourknowledge, this support of various stereoscopic systems via such a lightweight client is currentlyunique.
The quality and performance optimization described in Section 5.2.2 is a newly combined ap-proach to provide fluid interactivity for each simultaneously accessing user by adjusting towardseach user’s specific bandwidth connection. As shown in Chapter 7, this approach is superior tothe tested existing applications, including a native application.
Web browsers are known for their familiarity and web-based applications for their simple deploy-ability. CoWebViz’s practical usage described in Chapter 6 shows that the usage of web browserssupports the reduction of time-consuming steps, necessary before and during a system usage. Tothe best of our knowledge, this is the first time that such a pure web-based system has been usedfor such an usually resource intensive stereoscopic and collaborative setup in medical education.
The interest of its usage across the boundaries of anatomical education is shown by other appli-cations described in Section 6.2 and 6.3. To emphasize is CoWebViz’s current usage to informsurgeons during reconstructive surgery in the operating room, which shows the interest and fea-sibility of its usage in practical medicine. Its usage as a visualization service in a data center forremote scientists shows its relevance for the field of high-performance scientific visualization.
107

List of Abbreviations
2D two-dimensional.
3D three-dimensional.
4CIF 4x Common Intermediate Format.
ACM DL ACM digital library.
CAD Computer-aided Design.
CAVE Cave Automatic Virtual Environment.
CIF Common Intermediate Format.
CoWebViz Collaborative Web-based Visualization.
CPU Central Processing Unit.
CSS Cascading Style Sheets.
CT Computed Tomography.
DICOM Digital Imaging and Communications in Medicine.
DTI Diffusion Tensor Imaging.
eps events per second.
fMRI Functional Magnetic Resonance Imaging.
fps frames per second.
GPGPU General-purpose Computing on a Graphics Processing Unit.
GPU Graphics Processing Unit.
GUI Graphical User Interface.
HIS Hospital Information System.
IX
List of Abbreviations
HL7 Health Level Seven.
HTML Hypertext Markup Language.
HTTP Hypertext Transfer Protocol.
IEEE DL IEEE Xplore digital library.
IHE Integrating the Healthcare Enterprise.
JIF JPEG file interchange format.
JPEG Joint Photographic Experts Group.
Mbps Megabit per second.
MedVolViz Med ical Volume Visualization.
MIME Multipurpose Internet Mail Extension.
mJPEG motion JPEG.
MRI Magnetic Resonance Imaging.
OSI Open Systems Interconnection Model.
PACS Picture Archiving and Communication System.
pJPEG pulling JPEG.
PNG Portable Network Graphics.
POI Point of Interest.
REST Representational State Transfer.
SVG Scalable Vector Graphics.
TPM TelePresence Microscopy Collaboratoration.
URL Uniform Resource Locator.
VNC Virtual Network Computing.
VRML Virtual Reality Modeling Language.
X

List of Abbreviations
WADO Web Access to DICOM Persistent Objects.
X3D Extensible 3D.
XDS Cross-Enterprise Document Sharing.
XI
List of Figures
1.1 Local versus remote visualization rendering . . . . . . . . . . . . . . . . . . . . . 5
2.1 Flow diagram of the thesis methodology . . . . . . . . . . . . . . . . . . . . . . . 9
2.2 Flow chart of the literature analysis. . . . . . . . . . . . . . . . . . . . . . . . . . 10
2.3 The class room . . . . . . . . . . . . . . . . . . . . . . . . . . . . . . . . . . . . . 20
3.1 2D cross-sectional CT image . . . . . . . . . . . . . . . . . . . . . . . . . . . . . . 23
3.2 3D CT volume cube . . . . . . . . . . . . . . . . . . . . . . . . . . . . . . . . . . 24
3.3 The principle of volume visualization . . . . . . . . . . . . . . . . . . . . . . . . . 25
3.4 Surface visualization examples . . . . . . . . . . . . . . . . . . . . . . . . . . . . . 26
3.5 Stereoscopic visualization via polarized filters . . . . . . . . . . . . . . . . . . . . 28
3.6 Network topologies, well usable for collaborative shared systems. . . . . . . . . . 34
3.7 Network schemes, well usable for collaborative shared systems. . . . . . . . . . . 34
4.1 Frame rate comparison of mJPEG and pJPEG. . . . . . . . . . . . . . . . . . . . 49
5.1 Data flow diagram of the CoWebViz’s architecture . . . . . . . . . . . . . . . . . 54
5.2 Integration of external applications . . . . . . . . . . . . . . . . . . . . . . . . . . 56
5.3 Flow chart of the automatic quality adjustment . . . . . . . . . . . . . . . . . . . 60
5.4 Illustration of calculating the ideal file size and adjusting to it . . . . . . . . . . . 62
5.5 CoWebViz’s methods to manage the image quality . . . . . . . . . . . . . . . . . 63
5.6 User notification for multi-user sessions . . . . . . . . . . . . . . . . . . . . . . . . 65
5.7 CoWebViz’s visualization transfer chains . . . . . . . . . . . . . . . . . . . . . . . 66
5.8 Presentation of screenshots taken during a visualization session. . . . . . . . . . . 69
5.9 CoWebViz’s client side interface to control the visualization . . . . . . . . . . . . 69
5.10 CoWebViz’s client side interface for session recording and playback . . . . . . . . 70
6.1 Steps to use CoWebViz . . . . . . . . . . . . . . . . . . . . . . . . . . . . . . . . 73
6.2 Effect of JPEG quality and resolution on file size and frame rate . . . . . . . . . 74
6.3 CoWebViz client instances as used in the class . . . . . . . . . . . . . . . . . . . . 78
6.4 Stereoscopic visualization types provided by CoWebViz . . . . . . . . . . . . . . . 79
6.5 Integration in a high-performing visualization cluster setup . . . . . . . . . . . . 81
XII

List of Figures
7.1 Performance comparison of CoWebViz with fixed and automatic quality setting . 847.2 Profile of performance variables during a visualization session . . . . . . . . . . . 867.3 CoWebViz’s scalability . . . . . . . . . . . . . . . . . . . . . . . . . . . . . . . . . 897.4 Comparison of CoWebViz’s frame rate with related work . . . . . . . . . . . . . . 90
XIII

List of Tables
2.1 Success criteria for evaluating visualization transfer techniques . . . . . . . . . . . 12
3.1 Server side versus client side rendering. . . . . . . . . . . . . . . . . . . . . . . . . 363.2 Overview of related work . . . . . . . . . . . . . . . . . . . . . . . . . . . . . . . . 41
4.1 Comparison of visualization transfer techniques . . . . . . . . . . . . . . . . . . . 474.2 Performance comparison of the event transfer using REST and WebSockets . . . 504.3 Comparison of event transfer techniques . . . . . . . . . . . . . . . . . . . . . . . 51
6.1 List of practical usages of CoWebViz. . . . . . . . . . . . . . . . . . . . . . . . . . 72
7.1 Performance measurement results of different algorithm settings . . . . . . . . . . 87
XIV

List of Listings
5.1 Format of the event recording file . . . . . . . . . . . . . . . . . . . . . . . . . . . 575.2 Multipart message specification used for motion JPEG . . . . . . . . . . . . . . . 575.3 Transfer format of a single WebSockets event . . . . . . . . . . . . . . . . . . . . 595.4 Transfer format of a single REST event . . . . . . . . . . . . . . . . . . . . . . . 59
XV
Bibliography
[1] Munzner T, Johnson C, Moorhead R, Pfister H, Rheingans P, and Yoo TS. NIH-NSFvisualization research challenges report summary. IEEE Comput Graph Appl, 26(2):20–4,2006.
[2] Nußbeck G. Taxonomy-based assessment of personal health monitoring in ambient assistedliving. In Ambient Assisted Living, pages 199–211. Springer, 2012.
[3] Huang HK. PACS and Imaging Informatics: Basic Principles and Applications. Wiley-Blackwell, 2 edition, 1 2010. ISBN 9780470373729.
[4] Yi MY and Hwang Y. Predicting the use of web-based information systems: self-efficacy,enjoyment, learning goal orientation, and the technology acceptance model. InternationalJournal of Human-Computer Studies, 59(4):431–449, 2003.
[5] Yi JS, ah Kang Y, Stasko JT, and Jacko JA. Toward a deeper understanding of the role ofinteraction in information visualization. IEEE Transactions on Visualization and ComputerGraphics, 13(6):1224–1231, 2007.
[6] Silverstein JC, Parsad NM, and Tsirline V. Automatic perceptual color map generation forrealistic volume visualization. J Biomed Inform, 41(6):927–35, Dec 2008.
[7] Schulzrinne H, Casner S, Frederick R, and Jacobson V. RTP: A Transport Protocol forReal-Time Applications. In Request for Comments, number 3550 in Request for Comments.Internet Engineering Task Force, IETF, June 2003.
[8] Price A, Subbarao M, and Wyatt R. Two Eyes, 3D: Stereoscopic Design Principles. InAmerican Astronomical Society Meeting Abstracts, volume 221 of American AstronomicalSociety Meeting Abstracts, page 302.01. January 2013.
[9] Laha B, Sensharma K, Schiffbauer JD, and Bowman DA. Effects of immersion on visualanalysis of volume data. IEEE Trans Vis Comput Graph, 18(4):597–606, Apr 2012. doi:10.1109/TVCG.2012.42.
[10] Reichelt S, Häussler R, Fütterer G, and Leister N. Depth cues in human visual perceptionand their realization in 3d displays. In Society of Photo-Optical Instrumentation Engineers(SPIE) Conference Series, volume 7690, page 10. 2010. ISSN 0277-786X.
XVI

Bibliography
[11] Ishikawa N, Watanabe G, Iino K, Tomita S, Yamaguchi S, Higashidani K, Kawachi K,and Inaki N. Robotic internal thoracic artery harvesting. Surg Today, 37(11):944–6, 2007.doi:10.1007/s00595-007-3542-4.
[12] Wang J, Wang X, Xie M, He L, Lv Q, and Wang L. Clinical value of stereoscopicthree-dimensional echocardiography in assessment of atrial septal defects: feasibilityand efficiency. J Huazhong Univ Sci Technolog Med Sci, 29(6):791–4, Dec 2009. doi:10.1007/s11596-009-0624-0.
[13] Brown PM, Hamilton NM, and Denison AR. A novel 3d stereoscopic anatomy tutorial. TheClinical Teacher, 9(1):50–53, 2012. ISSN 1743-498X. doi:10.1111/j.1743-498X.2011.00488.x.
[14] Sielhorst T, Bichlmeier C, Heining S, and Navab N. Depth perception–a major issue inmedical ar: evaluation study by twenty surgeons. Medical Image Computing and Computer-Assisted Intervention–MICCAI 2006, pages 364–372, 2006.
[15] Fraser JF, Allen B, Anand VK, and Schwartz TH. Three-dimensional neurostereoendoscopy:subjective and objective comparison to 2d. Minim Invasive Neurosurg, 52(1):25–31, Feb2009. doi:10.1055/s-0028-1104567.
[16] Isenberg P, Elmqvist N, Scholtz J, Cernea D, Ma KL, and Hagen H. Collaborative visualiza-tion: definition, challenges, and research agenda. Information Visualization, 10(4):310–326,2011.
[17] Lievens F and Jordanova M. Is there a contradiction between telemedicine and business?Journal of telemedicine and telecare, 10(suppl 1):71–74, 2004.
[18] Helck A, Matzko M, Trumm C, Grosse C, Piltz S, Reiser M, and Ertl-Wagner B. In-terdisciplinary expert consultation via a teleradiology platform-influence on therapeuticdecision-making and patient referral rates to an academic tertiary care center. In RöFo-Fortschritte auf dem Gebiet der Röntgenstrahlen und der bildgebenden Verfahren, volume181, pages 1180–1184. Georg Thieme Verlag, 2009.
[19] Cardoen B, Demeulemeester E, and Beliën J. Operating room planning and scheduling: Aliterature review. European Journal of Operational Research, 201(3):921–932, 2010.
[20] Gering DT, Nabavi A, Kikinis R, Hata N, O’Donnell LJ, Grimson WE, Jolesz FA, BlackPM, and Wells WM 3rd. An integrated visualization system for surgical planning andguidance using image fusion and an open mr. J Magn Reson Imaging, 13(6):967–75, Jun2001.
[21] Mlyniec P, Jerald J, Yoganandan A, Seagull FJ, Toledo F, and Schultheis U. imedic: a two-handed immersive medical environment for distributed interactive consultation. MedicineMeets Virtual Reality 18: NextMed, 163:372, 2011.
XVII
Bibliography
[22] Enzenhofer M, Bludau HB, Komm N, Wild B, Mueller K, Herzog W, and HochlehnertA. Improvement of the educational process by computer-based visualization of procedures:Randomized controlled trial. Journal of Medical Internet Research, 6(2), 2004.
[23] Craig P, Wozniak H, Hyde S, and Burn D. Student use of web based lecture technologiesin blended learning: Do these reflect study patterns. In ASCILITE. Same places, differentspaces. 2009.
[24] Wiecha JM, Gramling R, Joachim P, and Vanderschmidt H. Collaborative e-learning usingstreaming video and asynchronous discussion boards to teach the cognitive foundation ofmedical interviewing: a case study. Journal of medical Internet research, 5(2), 2003.
[25] Cyber-Anatomy Corp. Cyber-anatomy med. URL http://www.cyber-anatomy.com, LastAccessed: 14. June 2013.
[26] O’Byrne PJ, Patry A, and Carnegie JA. The development of interactive online learning toolsfor the study of anatomy. Med Teach, 30(8):e260–71, 2008. doi:10.1080/01421590802232818.
[27] Han J, Kim J, Lee D, Lee J, Kim J, Park K, and Kang H. Three-dimensional visualizationof human vocal organ on the web. J Digit Imaging, 15 Suppl 1:264–6, 2002. doi:10.1007/s10278-002-5050-9.
[28] Silverstein JC, Amine M, Dech F, Jurek P, Pires I, Tsirline V, and Walsh C. Web-basedviewer for systematic combination of anatomy and nomenclature. Stud Health TechnolInform, 119:518–22, 2006.
[29] Silén C, Wirell S, Kvist J, Nylander E, and Smedby O. Advanced 3d visualization instudent-centred medical education. Med Teach, 30(5):e115–24, Jun 2008. doi:10.1080/01421590801932228.
[30] Petersson H, Sinkvist D, Wang C, and Smedby O. Web-based interactive 3d visualizationas a tool for improved anatomy learning. Anat Sci Educ, 2(2):61–8, Mar 2009. doi:10.1002/ase.76.
[31] Crossingham JL, Jenkinson J, Woolridge N, Gallinger S, Tait GA, and Moulton CAE. Inter-preting three-dimensional structures from two-dimensional images: a web-based interactive3d teaching model of surgical liver anatomy. HPB, 11(6):523–528, 2009.
[32] Temkin B, Acosta E, Hatfield P, Onal E, and Tong A. Web-based three-dimensional virtualbody structures: W3d-vbs. J Am Med Inform Assoc, 9(5):425–36, 2002.
[33] Birr S, Mönch J, Sommerfeld D, and Preim B. A novel Real-Time Web3D Surgical TeachingTool based on WebGL. In Bildverarbeitung für die Medizin (BVM), page to appear. 2012.
XVIII

Bibliography
[34] Qualter J, Sculli F, Oliker A, Napier Z, Lee S, Garcia J, Frenkel S, Harnik V, and Triola M.The biodigital human: a web-based 3d platform for medical visualization and education.Stud Health Technol Inform, 173:359–61, 2012.
[35] Dev P, Srivastava S, and Senger S. Collaborative learning using internet2 and remotecollections of stereo dissection images. Clin Anat, 19(3):275–83, Apr 2006. doi:10.1002/ca.20313.
[36] Silverstein JC, Walsh C, Dech F, Olson E, Papka ME, Parsad N, and Stevens R. Immersivevirtual anatomy course using a cluster of volume visualization machines and passive stereo.Stud Health Technol Inform, 125:439–44, 2007.
[37] John NW. The impact of web3d technologies on medical education and training. Computers& Education, 49(1):19–31, August 2007.
[38] Montagnat J, Jouvenot D, Pera C, Frohner A, Kunszt P, Koblitz B, Santos N, and LoomisC. Bridging clinical information systems and grid middleware: a medical data manager.Stud Health Technol Inform, 120:14–24, 2006.
[39] Germain C, Breton V, Clarysse P, Gaudeau Y, Glatard T, Jeannot E, Legré Y, LoomisC, Magnin I, Montagnat J, Moureaux JM, Osorio A, Pennec X, and Texier R. Grid-enabling medical image analysis. J Clin Monit Comput, 19(4-5):339–49, Oct 2005. doi:10.1007/s10877-005-0679-9.
[40] Wu J, Siewert R, Specovius S, Löhnhardt B, Grütz R, Dickmann F, Brandt A, Scheel M, Os-wald D, and Krefting D. Web-based interactive visualization of grid-enabled neuroimagingapplications. Stud Health Technol Inform, 175:107, 2012.
[41] Kunihiko N, Toru H, Kenji O, Bisser R, Toru T, and Kazufumi K. Volume rendering usinggrid computing for large-scale volume data. In Computer-Aided Design and ComputerGraphics, 2009. CAD/Graphics’ 09. 11th IEEE International Conference on, pages 470–475. IEEE, 2009.
[42] Huang HK. From PACS to web-based ePR system with image distribution for enterprise-level filmless healthcare delivery. Radiol Phys Technol, 4(2):91–108, Jul 2011. doi:10.1007/s12194-011-0122-5.
[43] Liu D, Hua KA, and Yu N. Enable web-based interactive applications of high-resolution3d medical image data. In IEEE International Conference on Multimedia and Expo, pages679–682. IEEE, 2007.
[44] Helgeson JW. The Software Audit Guide. ASQ Quality Press, 2009. ISBN 9780873897730.
XIX

Bibliography
[45] National Center for Biotechnology Information (NCBI). PubMed.gov – US National Libraryof Medicine National Institutes of Health. URL http://www.ncbi.nlm.nih.gov/pubmed/,Last Accessed: 14. June 2013.
[46] Google. Google Scholar. URL http://scholar.google.com, Last Accessed: 14. June 2013.
[47] National Center for Biotechnology Information (NCBI). Mesh (medical subject headings).URL http://www.nlm.nih.gov/mesh, Last Accessed: 14. June 2013.
[48] IEEE. IEEE Xplore Digital Library. URL http://ieeexplore.ieee.org/Xplore, LastAccessed: 14. June 2013.
[49] ACM. ACM Digital Library. URL http://dl.acm.org/, Last Accessed: 14. June 2013.
[50] Rohrer RM and Swing E. Web-based information visualization. Computer Graphics andApplications, IEEE, 17(4):52–59, 1997.
[51] Kaspar M, Parsad NM, and Silverstein JC. An optimized web-based approach for collabo-rative stereoscopic medical visualization. J Am Med Inform Assoc, 0:1–9, 2012.
[52] Kaspar M, Parsad NM, and Silverstein JC. CoWebViz: interactive collaborative sharingof 3D stereoscopic visualization among browsers with no added software. In Proceedings ofthe 1st ACM International Health Informatics Symposium, IHI ’10, pages 809–816. ACM,New York, NY, USA, 2010. ISBN 978-1-4503-0030-8. doi:10.1145/1882992.1883113.
[53] Kaspar M, Dech F, Parsad NM, and Silverstein JC. Web-based stereoscopic visualization forthe global anatomy classroom. Studies in Health Technology and Informatics, 163:264–270,2011. ISSN 0926-9630.
[54] Zhu M and Yadav NK. A distributed system for parallel simulations. In GlobalTelecommunications Conference, pages 1–5. IEEE, 2008. ISBN 978-1-4244-2324-8. doi:10.1109/GLOCOM.2008.ECP.335.
[55] Mouton C and Grimstead I. Collaborative visualization current systems and future trends.In Proceedings of the 16th International Conference on 3D Web Technology, pages 101–110.ACM, 2011.
[56] Zhao Y, Hu C, Huang Y, and Ma D. Collaborative visualization of large scale datasetsusing web services. In Proceedings of the Second International Conference on Internet andWeb Applications and Services, pages 62–. IEEE Computer Society, Washington, DC, USA,2007. ISBN 0-7695-2844-9. doi:10.1109/ICIW.2007.22.
[57] Ichimura S and Matsushita Y. Lightweight desktop-sharing system for web browsers. In In-formation Technology and Applications, 2005. ICITA 2005. Third International Conferenceon, volume 2, pages 136–141. IEEE, 2005.
XX

Bibliography
[58] Gedda R. Need desktop access over the web? try some guacamole, 2010. URLhttp://www.techworld.com.au/article/345260/need_desktop_access_over_web_try_
some_guacamole/, Last Accessed: 14. June 2013.
[59] Jourdain S, Ayachit U, and Geveci B. Paraviewweb, a web framework for 3d visualizationand data processing. International Journal of Computer Information Systems and IndustrialManagement Applications, 3:870–877, 2011.
[60] Wessels A, Purvis M, Jackson J, and Rahman SS. Remote data visualization through web-sockets. In Information Technology: New Generations (ITNG), 2011 Eighth InternationalConference on, pages 1050–1051. IEEE, 2011.
[61] Mc Lane JC, Czech WW, Yuen DA, Knox MR, Greensky JB, Kameyama MC, Wheeler VM,Panday R, and Senshu H. Ubiquitous interactive visualization of 3-D mantle convectionthrough web applications using java. In Proceedings of the 4th International Symposiumon Advances in Visual Computing, Part II, ISVC ’08, pages 1011–1021. Springer-Verlag,Berlin, Heidelberg, 2008. ISBN 978-3-540-89645-6. doi:10.1007/978-3-540-89646-3_101.
[62] Greensky JBSG, Czech WW, Yuen DA, Knox MR, Damon MR, Chen SS, and KameyamaMC. Ubiquitous interactive visualization of 3d mantle convection using a web-portal withjava and ajax framework. Visual Geosciences, 2008.
[63] McLane JC, Czech WW, Yuen DA, Knox MR, Wang S, Greensky JBS, and Sevre EOD.Ubiquitous interactive visualization of large-scale simulations in geosciences over a java-based web-portal. Concurr Comput : Pract Exper, 22(12):1750–1773, August 2010. ISSN1532-0626. doi:10.1002/cpe.v22:12.
[64] Zhou Y, Weiss RM, McArthur E, Sanchez D, Yao X, Yuen D, Knox MR, and Czech WW.Webviz: A web-based collaborative interactive visualization system for large-scale data sets.In AGU Fall Meeting Abstracts, volume 1, page 1354. 2010.
[65] Śniegowski P, Błażewicz M, Grzelachowski G, Kuczyński T, Kurowski K, and LudwiczakB. Vitrall: web-based distributed visualization system for creation of collaborative workingenvironments. In Proceedings of the 9th international conference on Parallel Processing andApplied Mathematics - Volume Part I, PPAM’11, pages 337–346. Springer-Verlag, Berlin,Heidelberg, 2012. ISBN 978-3-642-31463-6. doi:10.1007/978-3-642-31464-3_34.
[66] Suwelack S, Maier S, Unterhinninghofen R, and Dillmann R. Web-based interactive volumerendering. Stud Health Technol Inform, 163:635–7, 2011.
[67] Vazhkudai SS, Kohl JA, and Schwidder J. A java-based science portal for neutron scatteringexperiments. In Proceedings of the 5th international symposium on Principles and practice
XXI
Bibliography
of programming in Java, PPPJ ’07, pages 21–30. ACM, New York, NY, USA, 2007. ISBN978-1-59593-672-1. doi:10.1145/1294325.1294329.
[68] Grimstead IJ, Avis NJ, and Walker DW. Automatic distribution of rendering workloads in agrid enabled collaborative visualization environment. In Proceedings of the 2004 ACM/IEEEconference on Supercomputing, page 1. IEEE Computer Society, 2004.
[69] Johnson GP, Mock SA, Westing BM, and Johnson GS. EnVision: a Web-Based tool forscientific visualization. In Proceedings of the 2009 9th IEEE/ACM International Symposiumon Cluster Computing and the Grid, CCGRID ’09, pages 603–608. IEEE Computer Society,Washington, DC, USA, 2009. ISBN 978-0-7695-3622-4. doi:10.1109/CCGRID.2009.80.
[70] Holmes VP, Linebarger JM, Miller DJ, Vandewart RL, and Crowley CP. Evolving the web-based distributed SI/PDO architecture for High-Performance visualization. In Proceedingsof the 34th Annual Simulation Symposium (SS01), pages 151–158. IEEE Computer Society,Washington, DC, USA, 2001.
[71] Qiao W, McLennan M, Kennell R, Ebert DS, and Klimeck G. Hub-based simulation andgraphics hardware accelerated visualization for nanotechnology applications. IEEE Trans-actions on Visualization and Computer Graphics, 12(5):1061–1068, October 2006. ISSN1077-2626. doi:10.1109/TVCG.2006.150.
[72] Xiao M, Liang Q, and Xiao Y. Implementation of campus Grid-Based visualization tech-niques. In Wireless Communications, Networking and Mobile Computing, pages 1–4. IEEE,October 2008. ISBN 978-1-4244-2107-7. doi:10.1109/WiCom.2008.2993.
[73] Eichberger G, Perry C, Walker H, Hastings P, Linsen L, and Frank L. Interactive 3Dgraphics for web-based data analysis and visualization for the digital fish library (DFL).In ACM SIGGRAPH 2006 Research posters, SIGGRAPH ’06. ACM, New York, NY, USA,2006. ISBN 1-59593-364-6. doi:10.1145/1179622.1179818.
[74] Chen J, Yoon I, and Bethel W. Interactive, internet delivery of visualization via structuredprerendered multiresolution imagery. IEEE Trans Vis Comput Graph, 14(2):302–12, 2008.doi:10.1109/TVCG.2007.70428.
[75] Poliakov AV, Albright E, Corina D, Ojemann G, Martin RF, and Brinkley JF. Server-basedapproach to web visualization of integrated 3-D medical image data. Proceedings / AMIAAnnual Symposium AMIA Symposium, pages 533–537, 2001. ISSN 1531-605X.
[76] Xiao Y, Yi M, Li Y, and Xiao M. Study on application of long-distance education resourcegrid. In E-Business and E-Government (ICEE), pages 62–65. IEEE, May 2010. ISBN978-1-4244-6647-4. doi:10.1109/ICEE.2010.23.
XXII
Bibliography
[77] Doyle MD, Ang CS, Martin DC, and Noe A. The visible embryo project: embeddedprogram objects for knowledge access, creation and management through the world wideweb. Comput Med Imaging Graph, 20(6):423–31, 1996.
[78] Bethel W, Siegerist C, Shalf J, Shetty P, Jankun-Kelly T, Kreylos O, and Ma KL. Visportal:Deploying grid-enabled visualization tools through a web-portal interface. In Workshop onAdvanced Collaborative Environments. Citeseer, Seattle, WA (US), 06/22/2003, 2003.
[79] Jankun-Kelly TJ and Ma K. VisSheet redux: redesigning a visualization exploration spread-sheet for the web. In ACM SIGGRAPH 2002 conference abstracts and applications, SIG-GRAPH ’02, pages 329–329. ACM, New York, NY, USA, 2002. ISBN 1-58113-525-4. doi:10.1145/1242073.1242337.
[80] Lefer W and Pierson JM. Visualization services on the web. In SNPD’00 (InternationalConference on Software Engineering Applied to Networking and Parallel/Distributed Com-puting). Citeseer, 2000.
[81] Kačeniauskas A and Pacevič R. VizLitG: grid visualization e-Service enabling partialdataset transfer from storage elements of gLite-based grid infrastructure. J Grid Com-put, 9(4):573–589, December 2011. ISSN 1570-7873. doi:10.1007/s10723-011-9193-0.
[82] Lamberti F, Sanna A, and Henao Ramirez EA. Web-based 3D visualization for intelligentstreet lighting. In Proceedings of the 16th International Conference on 3D Web Technology,Web3D ’11, pages 151–154. ACM, New York, NY, USA, 2011. ISBN 978-1-4503-0774-1.doi:10.1145/2010425.2010452.
[83] Vickery R, Martin J, Fowler J, Moorehead R, Dandass Y, Atkinson T, Cedilnik A, AdamsP, and Clarke J. Web-Based high performance remote visualization. In Proceedings of the2007 DoD High Performance Computing Modernization Program Users Group Conference,HPCMP-UGC ’07, pages 364–369. IEEE Computer Society, Washington, DC, USA, 2007.ISBN 0-7695-3088-5. doi:10.1109/HPCMP-UGC.2007.82.
[84] Elmaghraby AS, Elfayoumy SA, Karachiwala IS, Graham JH, Emam AZ, and Sleem A.Web-based performance visualization of distributed discrete event simulation. In Proceed-ings of the 31st conference on Winter simulation: Simulation—a bridge to the future -Volume 2, WSC ’99, pages 1618–1623. ACM, New York, NY, USA, 1999. ISBN 0-7803-5780-9. doi:10.1145/324898.325346.
[85] Berjon R, Leithead T, Navara ED, O’Connor E, and Pfeiffer S. HTML 5.1. a vocabu-lary and associated APIs for HTML and XHTML. W3c working draft, W3C, Dec 2012.Http://www.w3.org/TR/2012/WD-html51-20121217/, Last Accessed: 17. March 2013.
XXIII
Bibliography
[86] Kordon F et al. An introduction to rapid system prototyping. Software Engineering, IEEETransactions on, 28(9):817–821, 2002.
[87] VideoLAN. Videolan project (vlc). URL http://www.videolan.org, Last Accessed:14. June 2013.
[88] The xiph open source community. icecast server software for streaming multimedia. URLhttp://www.icecast.org/, Last Accessed: 14. June 2013.
[89] Fielding R, Gettys J, Mogul J, Frystyk H, Masinter L, Leach P, and Berners-Lee T. Hy-pertext Transfer Protocol – HTTP/1.1. In Request for Comments, number 2616 in Requestfor Comments. Internet Engineering Task Force, IETF, June 1999.
[90] DWR Community. Direct Web Remoting (DWR), easy AJAX for JAVA. URL http:
//directwebremoting.org/dwr/index.html, Last Accessed: 14. June 2013.
[91] Jboss Community. Jboss application server. URL http://www.jboss.org, Last Accessed:14. June 2013.
[92] Levinson E. The mime multipart/related content-type. In Request for Comments, number2387 in Request for Comments. Internet Engineering Task Force, IETF, 1998.
[93] Agarwal B, Tayal S, and Gupta M. Software engineering & testing: an introduction. InfinityScience Press, har/cdr edition, 2009. ISBN 1934015555.
[94] King D and Wendell J. Vinagre – a VNC client for the GNOME desktop. URL http:
//projects.gnome.org/vinagre/, Last Accessed: 14. June 2013.
[95] Richardson T, Stafford-Fraser Q, Wood KR, and Hopper A. Virtual network computing.IEEE Internet Computing, 2(1):33–38, 1998.
[96] Truong T, Huynh A, Gentilello L, and Liu S. Screenleap, 2011. URL http://www.
screenleap.com, Last Accessed: 14. June 2013.
[97] Moolenaar B. Vim – the editor. URL http://www.vim.org/, Last Accessed: 14. June 2013.
[98] The Eclipse Foundation. The Eclipse C/C++ Development Tooling. URL http://www.
eclipse.org/cdt/, Last Accessed: 14. June 2013.
[99] Free Software Foundation, Inc. The GNU compiler collection. URL http://gcc.gnu.org/,Last Accessed: 14. June 2013.
[100] boost community. boost c++ library. URL http://www.boost.org, Last Accessed:14. June 2013.
XXIV

Bibliography
[101] Cloudmeter, Inc. Pion network library. URL https://github.com/cloudmeter/pion, LastAccessed: 14. June 2013.
[102] Kohlhoff CM. Boost.asio. URL http://www.boost.org/libs/asio, Last Accessed:14. June 2013.
[103] XOrg foundation. X window system. URL http://www.x.org, Last Accessed:14. June 2013.
[104] VirtualGL community. libjpeg-turbo. URL http://libjpeg-turbo.virtualgl.org, LastAccessed: 14. June 2013.
[105] Independent JPEG Group. JPEG standard library. URL http://www.ijg.org, Last Ac-cessed: 14. June 2013.
[106] FFmpeg. Ffmpeg complete, cross-platform solution to record, convert and stream audioand video. URL http://www.ffmpeg.org, Last Accessed: 14. June 2013.
[107] jQuery Foundation. jquery. URL http://jquery.com, Last Accessed: 14. June 2013.
[108] Silverstein JC, Walsh C, Dech F, Olson E, Papka M, Parsad N, and Stevens R. Multi-parallel open technology to enable collaborative volume visualization: how to create globalimmersive virtual anatomy classrooms. Stud Health Technol Inform, 132:463–8, 2008.
[109] Hubert B. The wonder shaper. URL http://lartc.org/wondershaper/, Last Accessed:14. June 2013.
[110] Access Grid Community. Access Grid. URL http://www.accessgrid.org, Last Accessed:14. June 2013.
[111] Röntgen WC. Eine neue Art von Strahlen. Verlag und Druck der Stahel’schen K. Hof-undUniversitäts-Buch-und Kunsthandlung, 1896.
[112] Hounsfield GN. Computed medical imaging. Journal of Computer Assisted Tomography,4(5):665, 1980. ISSN 0363-8715.
[113] Preim B and Bartz D. Visualization in Medicine: Theory, Algorithms, and Applications(The Morgan Kaufmann Series in Computer Graphics). Morgan Kaufmann, 1 edition, 72007. ISBN 9780123705969.
[114] Jin M, Wernick M, Yang Y, Brankov J, Gravier E, Feng B, and King M. 5d image re-construction for tomographic image sequences. In Signals, Systems and Computers, 2006.ACSSC’06. Fortieth Asilomar Conference on, pages 1973–1977. IEEE, 2006.
[115] NEMA. Digital Imaging and Communications in Medicine (DICOM). National ElectricalManufacturers Association, Virginia, USA, 2009.
XXV

Bibliography
[116] NEMA. DICOM - Part 5: Data Structures and Encoding. National Electrical ManufacturersAssociation, Virginia, USA, 2009.
[117] Tzannes A. Compression of 3-dimensional medical image data using part 2 of jpeg 2000.Aware Inc, Nov, 2003.
[118] Purchasing N and Agency S. Comparative specifications: 64 slice ct scanners. Techni-cal Report CEP08027, NHS, 2009. URL http://www.impactscan.org, Last Accessed:14. June 2013.
[119] Lacroute P and Levoy M. Fast volume rendering using a shear-warp factorization of theviewing transformation. In Proceedings of the 21st annual conference on Computer graphicsand interactive techniques, pages 451–458. ACM, 1994. ISBN 0897916670.
[120] Neophytou N and Mueller K. Gpu accelerated image aligned splatting. In Fourth Interna-tional Workshop on Volume Graphics, 2005., pages 197–242. IEEE, 2005. ISSN 1727-8376.
[121] Muller MA, Marincek B, and Frauenfelder T. State of the art 3d imaging of abdominalorgans. JBR-BTR, 90(6):467–74, 2007.
[122] Rosset A, Spadola L, and Ratib O. Osirix: An open-source software for navigating inmultidimensional dicom images. Journal of Digital Imaging, 17(3):205–216, 2004. ISSN0897-1889. doi:10.1007/s10278-004-1014-6.
[123] Tovée MJ. An introduction to the visual system. Cambridge University Press, Cambridge,UK, 2nd ed edition, 2008. ISBN 9780521883191.
[124] Dodgson NA. Autostereoscopic 3d displays. Computer, 38(8):31–36, 2005.
[125] Jones GR, Lee D, Holliman NS, and Ezra D. Controlling perceived depth in stereoscopicimages. In Stereoscopic displays and applications VIII. Proceedings of SPIE, pages 42–53.SPIE, 2001.
[126] McAllister DF. Stereo and 3-d display technologies. Encyclopedia of imaging science andtechnology, 2002.
[127] Meschede D and Vogel H. Gerthsen Physik, 23. Auflage. Springer Verlag, 2006. ISBN9783540254218.
[128] Minoli D. 3D Television (3DTV) Technology, Systems, and Deployment: Rolling Out theInfrastructure for Next-Generation Entertainment. CRC Press, 2010. ISBN 1439840660.
[129] Wimmer P. Anaglyph methods comparison, 2010. URL http://3dtv.at/Knowhow/
AnaglyphComparison_en.aspx, Last Accessed: 14. June 2013.
XXVI

Bibliography
[130] Jorke H and Fritz M. Infitec - a new stereoscopic visualisation tool by wavelength multipleximaging. Journal of Three Dimensional Images, 19:50–56, 2005.
[131] Moore JR, Dodgson NA, Travis ARL, and Lang SR. Time-multiplexed color autostereo-scopic display. In Proceedings of SPIE (the international society for optical engineering),pages 10–19. Citeseer, 1996.
[132] Sandin DJ, Sandor E, Cunnally W, Resch M, DeFanti TA, and Brown MD. Computer-generated barrier-strip autostereography. In Proc SPIE, Non-Holographic True 3D DisplayTechnologies, volume 1083, pages 65–75. 1989.
[133] van Berkel C and Clarke JA. Characterisation and optimisation of 3d-lcd module design.In Proc. SPIE, volume 3012, pages 179–186. 1997.
[134] Yeom S, Stern A, and Javidi B. Compression of 3d color integral images. Optics Express,12(8):1632–1642, April 2004.
[135] Min SW, Kim J, and Lee B. Three-dimensional electro-floating display system based on in-tegral imaging technique. Stereoscopic Displays and Applications XVI, Electronics Imaging,paper 5664A-37, San Jose, CA, 2005.
[136] Halle M. Autostereoscopic displays and computer graphics. In ACM SIGGRAPH 2005Courses, page 104. ACM, 2005.
[137] Perlin K, Poultney C, Kollin JS, Kristjansson DT, and Paxia S. Recent advances in the nyuautostereoscopic display. In Proceedings of SPIE, volume 4297, page 196. Citeseer, 2001.
[138] Matusik W and Pfister H. 3D TV: a scalable system for real-time acquisition, transmission,and autostereoscopic display of dynamic scenes. In ACM SIGGRAPH 2004 Papers, pages814–824. ACM, 2004.
[139] Levoy M and Hanrahan P. Light field rendering. In Proceedings of the 23rd annual conferenceon Computer graphics and interactive techniques, pages 31–42. ACM, 1996.
[140] Maeda H, Hirose K, Yamashita J, Hirota K, and Hirose M. All-around display for videoavatar in real world. In ISMAR, pages 288–289. IEEE Computer Society, 2003. ISBN0-7695-2006-5.
[141] Jones A, McDowall I, Yamada H, Bolas M, and Debevec P. An interactive 360 light fielddisplay. In ACM SIGGRAPH 2007 emerging technologies, page 13. ACM, 2007.
[142] Favalora G, Dorval RK, Hall DM, Giovinco M, and Napoli J. Volumetric three-dimensionaldisplay system with rasterization hardware. In Proc SPIE, volume 4297, pages 227–235.2001.
XXVII
Bibliography
[143] Sullivan A. 3-deep: New displays render images you can almost reach out and touch.Spectrum, IEEE, 42(4):30–35, 2005. ISSN 0018-9235.
[144] Saito H, Kimura H, Shimada S, Naemura T, Kayahara J, Jarusirisawad S, Nozick V,Ishikawa H, Murakami T, Aoki J, et al. Laser-plasma scanning 3d display for puttingdigital contents in free space. In Proceedings of International Symposium on ElectronicImaging, Stereoscopic Displays and Applications, volume 19, pages 6803–07. 2008.
[145] Hoshi T, Takahashi M, Nakatsuma K, and Shinoda H. Touchable holography. In ACMSIGGRAPH 2009 Emerging Technologies, page 23. ACM, 2009.
[146] Francone J and Nigay L. Using the user s point of view for interaction on mobile de-vices. In IHM ’11, the 23th ACM International Conference of the Association Francophoned’Interaction Homme-Machine. 2011.
[147] NVIDIA. Nvidia 3d vision. URL http://www.nvidia.com/object/3d-vision-about.
html, Last Accessed: 14. June 2013.
[148] Krishnaprasad NK, Vishwanath V, Venkataraman S, Rao AG, Renambot L, Leigh J, John-son AE, and Davis B. JuxtaView-a tool for interactive visualization of large imagery onscalable tiled displays. In cluster, pages 411–420. IEEE, 2004.
[149] Chae S, Majumder A, and Gopi M. Hd-graphviz: highly distributed graph visualizationon tiled displays. In Proceedings of the Eighth Indian Conference on Computer Vision,Graphics and Image Processing, page 43. ACM, 2012.
[150] Febretti A, Nishimoto A, Thigpen T, Talandis J, Long L, Pirtle J, Peterka T, Verlo A,Brown M, Plepys D, et al. Cave2: a hybrid reality environment for immersive simula-tion and information analysis. In IS&T/SPIE Electronic Imaging, pages 864903–864903.International Society for Optics and Photonics, 2013.
[151] Renambot L, Rao A, Singh R, Jeong B, Krishnaprasad N, Vishwanath V, ChandrasekharV, Schwarz N, Spale A, Zhang C, et al. Sage: the scalable adaptive graphics environment.In Proceedings of WACE, pages 2004–09. Citeseer, 2004.
[152] Johnson G, Abram G, Westing B, Navr’til P, and Gaither K. Displaycluster: An interactivevisualization environment for tiled displays. In IEEE International Conference on ClusterComputing, pages 239–247. 2012. doi:10.1109/CLUSTER.2012.78.
[153] Sandin DJ, Margolis T, Ge J, Girado J, Peterka T, and DeFanti TA. The varrier autostereo-scopic virtual reality display. ACM Transactions on Graphics, 24(3):894–903, 2005. ISSN0730-0301.
XXVIII
Bibliography
[154] Shibano N, Hareesh PV, Hoshino H, Kawamura R, Yamamoto A, Kahiwagi M, and SawadaK. Cyberdome: Pc clustered hemi spherical immersive projection display. In ICAT. 2003.
[155] Czernuszenko M, Pape D, Sandin D, DeFanti T, Dawe GL, and Brown MD. The im-mersadesk and infinity wall projection-based virtual reality displays. ACM SIGGRAPHComputer Graphics, 31(2):46–49, 1997. ISSN 0097-8930.
[156] Johnson AE, Leigh J, Morin P, and Keken PV. Geowall: Stereoscopic visualization forgeoscience research and education. IEEE Computer Graphics and Applications, 26(6):10–14, 2006.
[157] RealD. RealD – the new 3D. URL http://www.reald.com, Last Accessed: 14. June 2013.
[158] Krah CH. Three dimensional display system. United States patent US 7843449, November2010.
[159] DeFanti T, Cruz-Neira C, and Sandin D. Surround screen projection-based virtual reality:The design and implementation of the cave. In Conference Proceedings, ACM SIGGRAPH,volume 93. 1993.
[160] Leigh J, Johnson AE, DeFanti TA, and Brown MD. A review of tele-immersive applicationsin the cave research network. In Virtual Reality, pages 180–187. 1999.
[161] Höllerer T, Kuchera-Morin J, and Amatriain X. The allosphere: a large-scale immersivesurround-view instrument. In C Cruz-Neira and D Reiners, editors, EDT, volume 252 ofACM International Conference Proceeding Series, page 3. ACM, 2007. ISBN 978-1-59593-669-1.
[162] Funkhouser TA. Network topologies for scalable multi-user virtual environments. In Pro-ceedings of the 1996 Virtual Reality Annual International Symposium (VRAIS 96), page222. Citeseer, 1996. ISBN 0818672951.
[163] ITU-T. Information technology – open systems interconnection – basic reference model:The basic model. In ITU-T Recommendation, ITU-T Recommendation. Telecommunicationstandardization sector of ITU, ITU-T, 1994.
[164] Oppenheimer P. Top-Down Network Design, Third Edition. Cisco Press, 2011.
[165] Deolasee P, Katkar A, Panchbudhe A, Ramamritham K, and Shenoy P. Adaptive push-pull:disseminating dynamic web data. In Proceedings of the 10th international conference onWorld Wide Web, pages 265–274. ACM, 2001.
[166] Bozdag E, Mesbah A, and Van Deursen A. A comparison of push and pull techniques forajax. In Web Site Evolution, 2007. WSE 2007. 9th IEEE International Workshop on, pages15–22. IEEE, 2007.
XXIX
Bibliography
[167] Tongleamnak S, Covavisaruch N, and Vatanawood W. Programmable web-based volumevisualization. In The 1st ECTI Annual Conference. 2004.
[168] Hunter J, Henderson M, and Khan I. Collaborative annotation of 3d crystallographicmodels. J Chem Inf Model, 47(6):2475–84, 2007.
[169] Sun Microsystems, Oracle. Java. URL http://www.oracle.com/technetwork/java/
index.html, Last Accessed: 14. June 2013.
[170] Gerth VE and Vize PD. A java tool for dynamic web-based 3D visualization of anatomyand overlapping gene or protein expression patterns. Bioinformatics (Oxford, England),21(7):1278–1279, April 2005. ISSN 1367-4803. doi:10.1093/bioinformatics/bti120.
[171] Oracle. Java 3d. URL https://java3d.java.net/, Last Accessed: 14. June 2013.
[172] Ding R, Gao J, Chen B, Siepmann JI, and Liu Y. Web-Based visualization of atmo-spheric nucleation processes using Java3D. In Proceedings of the 2009 9th IEEE/ACMInternational Symposium on Cluster Computing and the Grid, CCGRID ’09, pages 597–602. IEEE Computer Society, Washington, DC, USA, 2009. ISBN 978-0-7695-3622-4. doi:10.1109/CCGRID.2009.56.
[173] ISO/IEC 19775/19776/19777. Extensible 3d (X3D). In International Organization forStandardization. ISO, Geneva, Switzerland, 2010.
[174] Kelle O. Remote brain image segmentation. In Information Technology Applications inBiomedicine. IEEE, 1999. doi:10.1109/ITAB.1999.842313.
[175] Villasenor M, Flores F, and Algorri M. Anatomical models for virtual reality and web-basedapplications. In Engineering in Medicine and Biology Society, 2001. Proceedings of the 23rdAnnual International Conference of the IEEE, volume 4, pages 3769–3772. IEEE, 2001.
[176] Raposo A, Magalhaes L, and Ricarte I. Working with remote VRML scenes through low-bandwidth connections. In Computer Graphics and Image Processing, pages 34–41. IEEE,1997. ISBN 0-8186-8102-0. doi:10.1109/SIGRA.1997.625145.
[177] Moore C, McClurg D, Soreide N, Hermann A, Lascara C, and Wheless G. Exploring 3-dimensional oceanographic data sets on the web using virtual reality modeling language.In OCEANS ’99 MTS/IEEE. Riding the Crest into the 21st Century, volume 3, pages1501–1503. IEEE, 1999. ISBN 0-7803-5628-4. doi:10.1109/OCEANS.1999.800217.
[178] Lee KW, Truong N, Rhodes B, Mclaren J, and Wang L. Development of a remote accesscontrol laboratory using xPC target and virtual reality modeling language. In Intelligentand Advanced Systems (ICIAS), pages 1–6. IEEE, June 2010. ISBN 978-1-4244-6623-8.doi:10.1109/ICIAS.2010.5716182.
XXX

Bibliography
[179] Kostaridis A, Biniaris C, Foukarakis I, Kaklamani D, and Venieris I. A web-based dis-tributed computing framework for antenna array modeling. IEEE Communications Maga-zine, 42(10):81–87, October 2004. ISSN 0163-6804. doi:10.1109/MCOM.2004.1341265.
[180] Jacinto H, Kéchichian R, Desvignes M, Prost R, and Valette S. A web interface for 3dvisualization and interactive segmentation of medical images. In Proceedings of the 17thInternational Conference on 3D Web Technology, pages 51–58. ACM, 2012.
[181] Kim N, Lee DH, Kim JH, Kim Y, and Cho HJ. Web based 3-d medical image visualizationon the pc. Stud Health Technol Inform, 52 Pt 2:1105–10, 1998.
[182] Melzer K, Lipinski HG, and Grönemeyer DHW. X3d-technologies for medical image visu-alization. In ACM SIGGRAPH 2004 Posters, page 112. ACM, 2004. ISBN 1581138962.
[183] Huang J and Cheng B. Interactive visualization for 3D pipelines using Ajax3D. In Pro-ceedings of the 2009 International Conference on Networking and Digital Society - Volume01, pages 21–24. IEEE Computer Society, Washington, DC, USA, 2009. ISBN 978-0-7695-3635-4-01. doi:10.1109/ICNDS.2009.12.
[184] Marrin C. WebGL Specification, Version 1.0. Khronos Group, Beaverton, Oregon, USA,February 2011.
[185] Congote J, Segura A, Kabongo L, Moreno A, Posada J, and Ruiz O. Interactive visualiza-tion of volumetric data with webgl in real-time. In Proceedings of the 16th InternationalConference on 3D Web Technology, pages 137–146. ACM, 2011.
[186] Behr J, Eschler P, Jung Y, and Zöllner M. X3DOM: a DOM-based HTML5/X3D integrationmodel. In Proceedings of the 14th International Conference on 3D Web Technology, pages127–135. ACM, 2009.
[187] Noumeir R and Pambrun JF. Using jpeg 2000 interactive protocol to stream a large image ora large image set. J Digit Imaging, 24(5):833–43, Oct 2011. doi:10.1007/s10278-010-9343-0.
[188] Hereld M, Papka ME, Insley JA, Norman ML, Olson EC, and Wagner R. Interactive largedata exploration over the wide area. In Proceedings of the 2011 TeraGrid Conference:Extreme Digital Discovery, page 19. ACM, 2011.
[189] Lamberti F and Sanna A. A streaming-based solution for remote visualization of 3d graphicson mobile devices. IEEE Trans Vis Comput Graph, 13(2):247–60, 2007. doi:10.1109/TVCG.2007.29.
[190] Halbach T and Wien M. Concepts and performance of next-generation video compressionstandardization. In 5th Nordic Signal Processing Symposium (NORSIG-2002). 2002.
XXXI
Bibliography
[191] JTC 1/SC 29. Text of ISO/IEC FDIS 23008-1/2 information technology – high efficiencycoding and media delivery in heterogeneous environments. Technical report, ISO/IEC,2013.
[192] Hewage C, Karim H, Worrall S, Dogan S, and Kondoz A. Comparison of stereo videocoding support in mpeg-4 mac, h. 264/avc and h. 264/svc. Proc of IET Visual InformationEngineering-VIE07, 2007.
[193] ITU-T. H.323 (12/09). packet-based multimedia communications systems. In ITU-T Rec-ommendation, ITU-T Recommendation. Telecommunication standardization sector of ITU,ITU-T, Nov 2000.
[194] Caltech. Evo – the collaborative network, 2009. URL http://evo.caltech.edu/evoGate/,Last Accessed: 14. June 2013.
[195] Foster I and Kesselman C. The grid: blueprint for a new computing infrastructure. MorganKaufmann, Amsterdam, 2nd ed edition, 2004. ISBN 1558609334.
[196] Nets Group, Computer Science, University College London. vic - video con-ferencing tool. URL http://mediatools.cs.ucl.ac.uk/nets/mmedia/wiki/VicWiki#
VideoconferencingToolVIC, Last Accessed: 14. June 2013.
[197] Nets Group, Computer Science, University College London. Robust audio tool(rat), 2008. URL http://mediatools.cs.ucl.ac.uk/nets/mmedia/wiki/RatWiki#
RobustAudioToolRAT, Last Accessed: 14. June 2013.
[198] San Diego Supercomputer Center. High-tech collaboration helps taiwan fight sars, 2003.URL http://www.sdsc.edu/News%20Items/PR052903.html, Last Accessed: 14. June 2013.
[199] JTC 1/SC 29/WG 11. Text of ISO/IEC 14496-10:200X/FDAM 1 multiview video coding(doc. n9978). Technical report, ISO/IEC, Hannover, Germany, 2008.
[200] Zhentang J and Xiaotai N. Stereo video communication and key techniques. In SecondInternational Symposium on Electronic Commerce and Security. 2009.
[201] Reveiu A, Dardala M, and Smeureanu I. A MPEG-21 based architecture for data visualiza-tion in multimedia web applications. In Proceedings of the 2008 International ConferenceVisualisation, pages 84–89. IEEE Computer Society, Washington, DC, USA, 2008. ISBN978-0-7695-3271-4. doi:10.1109/VIS.2008.13.
[202] Merkle P, Brust H, Dix K, Müller K, and Wiegand T. Stereo video compression for mobile3d services. In 3DTV Conference: The True Vision-Capture, Transmission and Display of3D Video, 2009, pages 1–4. 2009.
XXXII

Bibliography
[203] Zaluzec NJ. Telepresence system overview - white paper - (draft). Technical report, ElectronMicroscopy Center, Materials Science Division Argonne National Laboratory, 2002. URLhttp://tpm.amc.anl.gov/TPMDocs/TPMOverview2002.pdf, Last Accessed: 14. June 2013.
[204] Lamberti F, Zunino C, Sanna A, Fiume A, and Maniezzo M. An accelerated remote graphicsarchitecture for pdas. In Proc. the 8th International Conference on 3D Web Technology.Citeseer, 2003.
[205] Sanna A, Paravati G, Godio E, and Fiorella D. Victory project workpackage delivery:Visualization of 3d complex scenes on mobile devices. Technical report, Information SocietyTechnologies (IST) Programme, 2007.
[206] He L, Ming X, Ding W, and Liu Q. A novel approach to remote access picture archivingand communication system on mobile devices over wireless networks. In Biomedical andHealth Informatics (BHI), 2012 IEEE-EMBS International Conference on, pages 581–583.IEEE, 2012.
[207] Lamberti F and Sanna A. Extensible guis for remote application control on mobile devices.Ieee Computer Graphics and Applications, 28(4):50–57, Jul-Aug 2008.
[208] Giordani A. Feature - ultra-fast networks: The final frontier, 2010. URL http://www.
isgtw.org/?pid=1002828, Last Accessed: 14. June 2013.
[209] Taylor E. Argonne streaming visualization sends images across the world, January2010. URL http://www.ci.uchicago.edu/news/detail.php?id=257, Last Accessed:14. June 2013.
[210] Karonis N, Papka M, Binns J, Bresnahan J, Insley J, Jones D, and Link J. High-resolutionremote rendering of large datasets in a collaborative environment. Future Generation Com-puter Systems, 19(6):909–917, August 2003. doi:10.1016/S0167-739X(03)00070-0.
[211] Christodoulou L, Mayron LM, Kalva H, Marques O, and Furht B. 3d tv using mpeg-2 andh.264 view coding and autostereoscopic displays. In ACM Multimedia, pages 505–506. 2006.
[212] Kurillo G, Bajcsy R, Kreylos O, and Rodriguez R. Teleimmersive environment for remotemedical collaboration. Stud Health Technol Inform, 142:148–50, 2009.
[213] Bandwidth A. Wireless live streaming video of laparoscopic surgery: A bandwidth analysisfor handheld computers. Medicine meets virtual reality 02/10: digital upgrades, applyingMoore’s law to health, 85:150, 2002.
[214] Eolas Technologies Inc. Eolas. URL http://www.eolas.com/, Last Accessed:14. June 2013.
XXXIII

Bibliography
[215] Image Stream Medical, Inc. Livestream network. URL http://www.imagestreammedical.
com, Last Accessed: 14. June 2013.
[216] Hahm JS, Lee HL, Kim SI, Shimizh S, Choi HS, Ko Y, Lee KG, Kim TE, Yun JW, Park YJ,et al. A remote educational system in medicine using digital video. Hepato-gastroenterology,54(74):373–376, 2007.
[217] Shimizu S, HAN HOS, Okamura K, Yamaguchi K, and Tanaka M. Live demonstrationof surgery across international borders with uncompressed high-definition quality. HPB,9(5):398–399, 2007.
[218] Ilgner JFR, Kawai T, Shibata T, Yamazoe T, and Westhofen M. Evaluation of stereoscopicmedical video content on an autostereoscopic display for undergraduate medical education.In Proceedings of SPIE, volume 6055, page 605506. 2006.
[219] Justus Ilgner M, Park JJH, Daniel Labbé M, and Westhofen M. Using a high-definitionstereoscopic video system to teach microscopic surgery. Stereoscopic Displays and VirtualReality Systems XIV, 6490, 2007.
[220] Sinton FC. Html5 video available on the web, Feb 2011. URL http://blog.mefeedia.
com/html5-feb-2011, Last Accessed: 14. June 2013.
[221] Pilgrim M. Video on the web. URL http://diveintohtml5.org/video.html, Last Ac-cessed: 14. June 2013.
[222] Pantos R and May W. HTTP Live Streaming. In Informational Internet-Draft. InternetEngineering Task Force, IETF, Oct 2012.
[223] IHE International, Inc. It infrastructure technical framework volume ii revision 8 - trans-actions. Technical report, IHE International, Inc., 2011. URL http://www.ihe.net/
Technical_Framework/index.cfm#IT, Last Accessed: 14. June 2013.
[224] NEMA. Digital imaging and communications in medicine (dicom); part 18: Web access todicom persistent objects (wado). Technical report, National Electrical Manufacturers As-sociation, 2006. URL ftp://medical.nema.org/medical/dicom/2006/06_18pu.pdf, LastAccessed: 14. June 2013.
[225] Noumeir R and Pambrun JF. Images within the electronic health record. In Image Process-ing (ICIP), 2009 16th IEEE International Conference on, pages 1761–1764. IEEE, 2009.ISSN 1522-4880.
[226] Engelmann U. Teleradiologie: Der weg von der forschung in die regelversorgung (german).MDI, 2011.
XXXIV

Bibliography
[227] Arguiñ andarena EJC, Macchi JE, Escobar PP, del Fresno M, Massa JM, and SantiagoMA. Dcm-ar: A fast flash-based web-pacs viewer for displaying large dicom images. InEngineering in Medicine and Biology Society (EMBC), 2010 Annual International Con-ference of the IEEE, pages 3463 –3466. 31 2010-sept. 4 2010. ISSN 1557-170X. doi:10.1109/IEMBS.2010.5627827.
[228] Open source clinical image and object management, 2010. URL http://www.dcm4che.org,Last Accessed: 14. June 2013.
[229] Linder E, Lundin M, Thors C, Lebbad M, Winiecka-Krusnell J, Helin H, Leiva B, Isola J,and Lundin J. Web-based virtual microscopy for parasitology: a novel tool for education andquality assurance. PLoS Negl Trop Dis, 2(10):e315, 2008. doi:10.1371/journal.pntd.0000315.
[230] Lien CY, Teng HC, Chen DJ, Chu WC, and Hsiao CH. A web-based solution for viewinglarge-sized microscopic images. Journal of Digital Imaging, 22(3):275–285, 2009.
[231] Tous R, Delgado J, Zinkl T, Toran P, Alcalde G, Goetz M, and Ferrer Roca O. The anatomyof an optical biopsy semantic retrieval system. Multimedia, IEEE, 19(2):16–27, 2012.
[232] Stegmaier S, Diepstraten J, Weiler M, and Ertl T. Widening the remote visualization bot-tleneck. In Proceedings of the 3rd International Symposium on Image and Signal Processingand Analysis, volume 1, pages 174–179. IEEE, 2003. ISBN 953184061X. ISSN 1330-1012.
[233] Commander D. The VirtualGL Project, 2009. URL http://www.virtualgl.org, LastAccessed: 14. June 2013.
[234] Stegmaier S, Magallón M, and Ertl T. A generic solution for hardware-accelerated remotevisualization. In Proceedings of the symposium on Data Visualisation 2002. EurographicsAssociation Aire-la-Ville, Switzerland, 2002.
[235] Löhnhardt B, Dickmann F, Quade M, Skrowny D, Heppner S, Kaspar M, Kepper N, Kreft-ing D, Steinke T, and Sax U. Workshop: Evaluation of visualization approaches in abiomedical grid environment. In 2010 Sixth IEEE International Conference on e-ScienceWorkshops. 2010.
[236] Kaspar M, Löhnhardt B, Kepper N, Knoch TA, Krefting D, Steinke T, Viezens F, Dick-mann F, and Sax U. Poster: Interaktive 3d/4d-visualisierung in biomedizinischen grid-infrastrukturen. In 54. Jahrestagung der Deutschen Gesellschaft für Medizinische Infor-matik, Biometrie und Epidemiologie e.V. (GMDS). 2009.
[237] Branzan Albu A, Laurendeau D, Gurtner M, and Martel C. A web-based remote collabo-rative system for visualization and assessment of semi-automatic diagnosis of liver cancerfrom ct images. Stud Health Technol Inform, 111:75–8, 2005.
XXXV

Bibliography
[238] Zaluzec NJ. TelePresence Microscopy Collaboration. URL http://tpm.amc.anl.gov, LastAccessed: 14. June 2013.
[239] Postek MT, Bennett MH, and Zaluzec NJ. Telepresence: A new paradigm for solvingcontamination problems. In Analytical and diagnostic techniques for semiconductor mate-rials, devices, and processes: joint proceedings of the symposia on: ALTECH 99: satellitesymposium to ESSDERC 99: Leuven, Belgium: The Electrochemical Society Symposiumon Diagnostic Techniques for Semiconductor materials and Devices, page 331. The Electro-chemical Society, 1999. ISBN 1566772397.
[240] Stokoe KH, Rathje E, Wilson CR, Rosenblad BL, and Menq FY. Development of the neeslarge-scale mobile shakers and associated instrumentation for in situ evaluation of nonlinearcharacteristics and liquefaction resistance of soils. In 13th World Conference on EarthquakeEngineering, pages 1–6. 2004.
[241] Bohne-Lang A, Groch WD, and Ranzinger R. Aismig–an interactive server-side moleculeimage generator. Nucleic Acids Res, 33(Web Server issue):W705–9, Jul 2005.
[242] University of Chicago. Anatomically correct, April 2009. URL http://press.mcs.anl.
gov/futureslab/2009/04/10/anatomically-correct, Last Accessed: 14. June 2013.
[243] OSG Community. Openscenegraph. URL http://www.openscenegraph.org, Last Ac-cessed: 14. June 2013.
[244] Freitag LA and Loy RM. Comparison of remote visualization strategies for interactiveexploration of large data sets. In Proc. of the 15th Int. Parallel & Distributed ProcessingSymposium (IPDPS, Los Alamitos, USA), pp. 1/281/2-1/283, Apr, pages 23–27. Citeseer,2001.
[245] Engel K and Ertl T. Texture-based volume visualization for multiple users on the worldwide web. In 5th Eurographics Workshop on Virtual Environments, pages 115–124. Citeseer,1999.
[246] Turner D, Papageorgiou P, Chin C, Yates C, and Kimpe T. Server-client architecture inmedical imaging. United States patent US 7,890,573, 2011.
[247] Liu D, Hua KA, and Sugaya K. A framework for Web-Based interactive applications ofHigh-Resolution 3D medical image data. In Proceedings of the 19th IEEE Symposium onComputer-Based Medical Systems, pages 119–124. IEEE Computer Society, Washington,DC, USA, 2006. ISBN 0-7695-2517-1. doi:10.1109/CBMS.2006.12.
[248] Baker M and Ong H. A grid enabled liquid crystal structure modelling and visualizationweb portal. Technical report, DSG Technical Report 2002.02, 2002.
XXXVI
Bibliography
[249] Foster I, Insley J, von Laszewski G, Kesselman C, and Thiebaux M. Distance visualization:Data exploration on the grid. Computer, 32(12):36, December 1999.
[250] Pan Z, Yang B, Zhang M, Yu Q, and Lin H. Remote visualization based on grid computing.In ICCSA (2), pages 236–245. 2004.
[251] Löhnhardt B, Kaspar M, Grütz R, Viezens F, and Dickmann F. Workshop: A prototypesystem for advance reservations in a biomedical grid computing visualization infrastructure.In 7th IEEE International Conference on e-Science, Computing Advances in Life Scienceworkshop. University of Göttingen, 2011.
[252] Kitware. Paraview - open source scientific visualization. URL http://www.paraview.org/,Last Accessed: 14. June 2013.
[253] Binns J, DiCarlo J, Insley JA, Leggett T, Lueninghoener C, Navarro JP, and Papka ME. En-abling community access to teragrid visualization resources. Concurrency and Computation-Practice & Experience, 19(6):783–794, April 2007. doi:DOI10.1002/cpe.1080.
[254] Metzger F, Rafetseder A, and Tutschku K. A performance evaluation framework for videostreaming. In Packet Video Workshop (PV), 2012 19th International, pages 19–24. IEEE,2012.
[255] Ng A, Greenfield P, and Chen S. A study of the impact of compression and binary encodingon soap performance. In Proceedings of the Sixth Australasian Workshop on Software andSystem Architectures (AWSA2005), pages 46–56. Citeseer, 2005.
[256] ISO/IEC 15948. Information technology – computer graphics and image processing –portable network graphics (png): Functional specification. In International Organizationfor Standardization. ISO, Geneva, Switzerland, 2004.
[257] Wallace GK. The jpeg still picture compression standard. Communications of the ACM,34(4):30–44, 1991.
[258] Miano J. Compressed image file formats: Jpeg, png, gif, xbm, bmp. Addison-Wesley Pro-fessional, 1999.
[259] ISO/IEC 15444. Information technology – jpeg 2000 image coding system. In InternationalOrganization for Standardization. ISO, Geneva, Switzerland, 2004.
[260] Skodras A, Christopoulos C, and Ebrahimi T. The jpeg 2000 still image compressionstandard. Signal Processing Magazine, IEEE, 18(5):36–58, 2001.
[261] Google. WebP – A new image format for the Web. URL https://developers.google.
com/speed/webp/, Last Accessed: 14. June 2013.
XXXVII
Bibliography
[262] ITU-T. H.264 advanced video coding for generic audiovisual services. Technical report,ITU-T, 2007.
[263] Hickson I. The web sockets API. W3C working draft, W3C, December 2009.Http://www.w3.org/TR/2009/WD-websockets-20091222/, Last Accessed: 17. March 2013.
[264] Wu W, Uram T, and Papka ME. Web 2.0-based social informatics data grid. In Proceedingsof the 5th Grid Computing Environments Workshop, pages 1–7. ACM, 2009.
[265] Kaspar M, Parsad NM, and Silverstein JC. Cowebviz – interactive collaborative sharingof 3d stereoscopic visualization among browsers with no added software. In 1st ACMInternational Health Informatics Symposium. 11 2010.
[266] Kaspar M, Dech F, Parsad NM, and Silverstein JC. Web-based stereoscopic visualizationfor the global anatomy classroom. Stud Health Technol Inform, 163:264–70, 2011.
[267] Meyer-Spradow J, Ropinski T, Mensmann J, and Hinrichs K. Voreen: A rapid-prototypingenvironment for ray-casting-based volume visualizations. Computer Graphics and Applica-tions, IEEE, 29(6):6–13, 2009.
[268] Axis Communications. URL http://www.axis.com/, Last Accessed: 14. June 2013.
[269] Weinstock N, Baumann M, Anderson S, and Fiedler R. Architecture and method for remoteplatform control management. United States patent US 7970859 B2, 2011.
[270] Hewlett-Packard. Remote graphics software. URL http://www.hp.com/united-states/
campaigns/workstations/remote-graphics-software.html, Last Accessed:14. June 2013.
[271] Cisco. Webex meetings. URL http://www.webex.de/, Last Accessed: 14. June 2013.
[272] Google. chrome. URL http://www.google.com/chrome, Last Accessed: 14. June 2013.
[273] Python Software Foundation. Python Programming Language. URL http://python.org/,Last Accessed: 14. June 2013.
[274] Novotny J, Tuecke S, and Welch V. An online credential repository for the grid: Myproxy.In High Performance Distributed Computing, 2001. Proceedings. 10th IEEE InternationalSymposium on, pages 104–111. IEEE, 2001.
[275] Adobe Systems Software Ireland Ltd. Adobe flash professional. URL http://www.adobe.
com/de/products/flash.html, Last Accessed: 14. June 2013.
[276] Lewis GJ, Hasan SM, Alexandrov VN, Dove MT, and Calleja M. Multicast applicationsharing tool–facilitating the eminerals virtual organisation. In Computational Science–ICCS2005, pages 359–366. Springer, 2005.
XXXVIII
Bibliography
[277] Polycom. URL http://www.polycom.de/, Last Accessed: 14. June 2013.
[278] Cisco. URL http://www.cisco.com/, Last Accessed: 14. June 2013.
[279] Kamaci N and Altunbasak Y. Performance comparison of the emerging h. 264 video codingstandard with the existing standards. InMultimedia and Expo, 2003. ICME’03. Proceedings.2003 International Conference on, volume 1, pages I–345. IEEE, 2003.
[280] Portlet Access Grid (PAG), 2009. URL http://www.rcs.manchester.ac.uk/research/
PAG, Last Accessed: 14. June 2013.
[281] Microsoft. Windows Server 2012 – Remote Desktop Services Overview. URL http://
technet.microsoft.com/en-us/library/hh831447.aspx, Last Accessed: 14. June 2013.
[282] Citrix. Citrix XenApp. URL http://www.citrix.de/products/xenapp/overview.html,Last Accessed: 14. June 2013.
[283] TeamViewer. TeamViewer - the All-In-One Software for Remote Support and Online Meet-ings. URL http://www.teamviewer.com, Last Accessed: 14. June 2013.
[284] Ito K, Shimada J, Katoh D, Nishimura M, Yanada M, Okada S, Ishihara S, and IchiseK. Interactive multicentre teleconferences using open source software in a team of thoracicsurgeons. Journal of telemedicine and telecare, 18(8):465–469, 2012.
[285] Zhang X and Takahashi H. A hybrid data compression scheme for improved vnc. Systemics,Cybernetics and Informatics, 5(2):1–4, 2007.
[286] Hobona G, James P, and Fairbairn D. Web-based visualization of 3D geospatial data usingJava3D. IEEE Computer Graphics and Applications, 26(4):28–33, August 2006. ISSN0272-1716.
[287] Josefsson S. The Base16, Base32, and Base64 Data Encodings. In Request for Comments,number 4648 in Request for Comments. Internet Engineering Task Force, IETF, October2006.
[288] Wiggins RH, Davidson HC, Harnsberger HR, Lauman JR, and Goede PA. Image fileformats: Past, present, and future1. Radiographics, 21(3):789–798, 2001.
[289] McAllister DF, Zhou Y, and Sullivan S. Methods for computing color anaglyphs. InProceedings of SPIE, volume 7524, page 75240S. 2010.
[290] Didyk P, Ritschel T, Eisemann E, Myszkowski K, and Seidel HP. A perceptual model fordisparity. ACM Trans Graph, 30(4):96, 2011.
[291] Dodgson NA. Optical devices: 3d without the glasses. Nature, 495(7441):316–317, 2013.
XXXIX

Bibliography
[292] McGinity M, Shaw J, Kuchelmeister V, Hardjono A, and Favero DD. Avie: a versatile multi-user stereo 360 interactive vr theatre. In Proceedings of the 2007 workshop on Emergingdisplays technologies: images and beyond: the future of displays and interacton, page 2.ACM, 2007.
[293] Kaspar M, Dech F, Parsad NM, and Silverstein JC. Web-based Stereoscopic Visualizationfor the Global Anatomy Classroom, volume Studies in Health Technology and Informatics,pages 264–270. IOS Press, 2011.
[294] Techviz. URL http://www.techviz.net/, Last Accessed: 14. June 2013.
[295] The medical imaging interaction toolkit (mitk), 2009. URL http://www.mitk.org/, LastAccessed: 14. June 2013.
[296] Hughes CE, Stapleton CB, Hughes DE, and Smith EM. Mixed reality in education, enter-tainment, and training. Computer Graphics and Applications, IEEE, 25(6):24–30, 2005.
[297] Hasselberg M, Wolf I, Nolden M, Seitel M, Meinzer H, and Engelmann U. Mitk als telekon-ferenzfähiges plugin in der chili-workstation. In Bildverarbeitung für die Medizin. CEURWorkshop Proceedings, 2007.
[298] Arguinarena EJC, Macchi JE, Escobar PP, Del Fresno M, Massa JM, and Santiago MA.Dcm-ar: a fast flash-based web-pacs viewer for displaying large dicom images. Conf ProcIEEE Eng Med Biol Soc, 2010:3463–6, 2010. doi:10.1109/IEMBS.2010.5627827.
[299] CHILI. Digital radiology. URL http://www.chili-radiology.com/de, Last Accessed:14. June 2013.
[300] Lietsch S and Marquardt O. A cuda-supported approach to remote rendering. Advances inVisual Computing, pages 724–733, 2007.
XL
Mathias Kaspar
Education
01/2009 - 08/2013 Ph.D. studentGeorg-August-University, Göttingen, Germany
10/2005 - 02/2008 Master of Science - Medical InformaticsGeorg-August-University, Göttingen, GermanyThesis: Import of genomic data into clinical and medical researchsystems
10/2002 - 09/2005 Bachelor of Science - Medical InformaticsGeorg-August-University, Göttingen, GermanyThesis: Analysis of tools to create CDA-documents
Professional experience
Since 05/2012 Research assistantComprehensive Heart Failure Center, University Medical CenterWürzburg, Germany
04/2011 - 10/2011 Research assistantNorthShore University HealthSystem, Evanston IL, USA
10/2009 - 10/2011 Visiting studentComputation Institute, University of Chicago, Chicago IL, USA
11/2011 - 04/2012 &01/2009 - 09/2009
Research assistantGeorg-August-Universität, Dept. Medical Informatics, Göttingen, Ger-many
XLI

04/2008 - 12/2008 Software Test Engineer / Software DeveloperSiemens AG, Industry-Sector, Erlangen, Germany
10/2006 - 03/2007 Internship as software developer in the USSiemens Medical Solutions, Soarian Enterprise, Malvern PA, USA
10/2004 - 02/2008 Student research assistantGeorg-August-University, Dept. of General Medicine, Göttingen, Ger-many
Grants
10/2009 - 02/2010 DAAD stipend for Ph.D. students
Professional Memberships
Since 01/2012 Deutsche Gesellschaft für Medizinische Informatik, Biometrieund Epidemiologie (GMDS)
Publications
Mathias Kaspar, Nigel M. Parsad, and Jonathan C. Silverstein. An optimized web-basedapproach for collaborative stereoscopic medical visualization. J Am Med Inform Assoc, 20(3):535-43, 2012.
Mathias Kaspar, Fred Dech, Nigel M. Parsad, and Jonathan C. Silverstein. Web-based stereo-scopic visualization for the global anatomy classroom. Stud Health Technol Inform, 2011, 163:264-270. IOS Press.
Mathias Kaspar, Nigel M. Parsad, and Jonathan C. Silverstein. Cowebviz – interactive collab-orative sharing of 3d stereoscopic visualization among browsers with no added software. In 1stACM International Health Informatics Symposium, November 2010.

Benjamin Löhnhardt, Frank Dickmann, Matthias Quade, Daniela Skrowny, Sabrina Heppner,Mathias Kaspar, Nick Kepper, Dagmar Krefting, Thomas Steinke, and Ulrich Sax. Evalua-tion of visualization approaches in a biomedical grid environment. In Sixth IEEE InternationalConference, 2010.
Frank Dickmann, Mathias Kaspar, Benjamin Löhnhardt, Nick Kepper, Fred Viezens, FrankHertel, Michael Lesnussa, Yassene Mohammed, Andreas Thiel, Thomas Steinke, JohannesBernarding, Dagmar Krefting, Tobias A. Knoch, and Ulrich Sax. Visualization in health gridenvironments: A novel service and business approach. In Grid Economics and Business Models:6th International Workshop, GECON 2009, Delft, the Netherlands, August 24, 2009, Proceedings,page 150. Springer, 2009.
Frank Dickmann, Mathias Kaspar, Benjamin Löhnhardt, Tobias A. Knoch, and Ulrich Sax.Perspectives of medigrid. Stud Health Technol Inform, 147, 2009.
Conference posters
Mathias Kaspar, Benjamin Löhnhardt, Nikolaus Kepper, and Dagmar Krefting. Poster: Pro-viding easy access to visualization for biomedical research. In 13th International Congress onMedical and Health Informatics, 09 2010.
Mathias Kaspar, Benjamin Löhnhardt, Nikolaus Kepper, Tobias A. Knoch, Dagmar Krefting,Thomas Steinke, Fred Viezens, Frank Dickmann, and Ulrich Sax. Poster: Interaktive 3d/4d-visualisierung in biomedizinischen grid-infrastrukturen. In 54. Jahrestagung der DeutschenGesellschaft für Medizinische Informatik, Biometrie und Epidemiologie e.V. (GMDS), 2009.
Würzburg, July 3, 2013
Related Documents