(IJACSA) International Journal of Advanced Computer Science and Applications, Vol. 11, No. 9, 2020 31 | Page www.ijacsa.thesai.org Weather Variability Forecasting Model through Data Mining Techniques Sultan Shekana 1 , Addisu Mulugeta 2 Lecturer, AMiT, Arba Minch University Arba Minch, Ethiopia Durga Prasad Sharma 3 Professor, AMUIT, MOEFDRE under UNDP Expat International Consultant ILO (United Nations) Abstract—Climate and weather variability are thought- provoking for world communities. In this apprehension, weather variability imposes a broad impact on the economy and the survival of the living entities. In relation to the African continent country Ethiopia, it is desirable to have great attention on the weather variability. The Ethiopian Dodota Woreda region is continuously affected by repeated droughts. It gives a great alarm to investigate and analyze the factors which are major causes of the frequent occurrence of drought. Although the weather scientists and domain experts are overwhelmed with meteorological data but lacking in analyzing and revealing the hidden knowledge or patterns about weather variability. This paper is an effort to design an enhanced predictive model for weather variability forecasting through Data Mining Techniques. The parameters used in this research are temperature, dew point, sunshine, rainfall, wind speed, maximum temperature, minimum temperature, and relative humidity to enhance the accuracy of forecasting. To improve the accuracy, we used the Multilayer-perceptron (MLP), Naïve Bayes, and multinomial logistic regression algorithms to design a proposed Predictive Model. The knowledge discovery in database (KDD) process model was used as a framework for the modeling purpose. The research findings revealed that the aforementioned parameters have a strong positive relationship with weather forecasting in meteorology sectors. The MLP model with selected parameters presents an interesting predictive accuracy result i.e. 98.3908% as correctly classified instances. The most performing algorithm, MLP was chosen and used to generate interesting patterns. The domain experts (meteorologists) validated the discovered patterns for the improved accuracy of weather variability forecasting. Keywords—Meteorological data; weather forecasting; multilayer-perceptron; Naïve Bayes; multinomial logistic regression algorithms I. INTRODUCTION The prime objective of this study is to design an enhanced predictive model for weather variability forecasting of Dodota Woreda (a region of Ethiopia) site using data mining techniques. Primarily it was aimed to rigorously review the existing models to find out the deficiencies in weather variability forecasting. This review was done in special reference to the site (Dodota Woreda) selected for the study and primary data collection. The determinant parameters that affect the weather variability were targeted to identify and select suitable data mining techniques for designing a predictive model. The performance of the model was validated by domain experts i.e. meteorologists. It was also marked to identify which data mining algorithm is better performing in weather variability forecasting. The data set for this study was collected from the national meteorology agency of the Dodota Woreda region and Awash- Melkasa station. 10 years of the daily dataset from 2006 to 2016 were collected to analyze the objectives specified in the study. The meteorological dataset selected for this research contains 7 parameters and 5282 records. The major limitation of this research study is the unavailability of sufficient datasets for some of the selected parameters of the climate. The significance of this research study is to support the meteorology department for accurate weather variability forecasting. For this purpose, the research efforts were made to design a predictive model with enhanced performance. The interesting patterns/rules extracted from this research can be used to support the decision-making processes in the domain. Timely information about the weather variability allows people to make better precautions and preparations to alleviate the disastrous challenges. The enhanced forecasting can also help in improved decision-making processes such as: 1) weather threatens to life and property, 2) daily planning for outdoor activities, and 3) routine weather dependent economic activities. In general, the research can help in improving the current forecasting methods/mechanism especially in minimizing the forecasting errors. In addition, the Govt. institutions like the National Meteorology Agency, Agriculture Department, Dodota Woreda Administration, Community, and Non-Govt. Institution can also use the outcomes of this research. The major challenges faced by the world Meteorologist are the accuracy of the weather variability and its predictive analysis [1]. Scientists have tried to forecast meteorological characteristics using numerous methods. Some of these methods being used provide better accuracy than others [2]. The current practices of the weather variability forecasting include ground observation, observation from the ships, aircraft, Doppler radars and satellites. We need accurate judgments of temperature at a particular time for various reasons such as the planning for the individuals’ daily activity, the farmers need for planting and harvesting their crops, agricultural and technical systems need the assessment of the natural hazards, and to design the solar energy systems [3]. The necessity for accurate weather variability prediction is not questionable when the benefits are higher than the expanses.

Welcome message from author
This document is posted to help you gain knowledge. Please leave a comment to let me know what you think about it! Share it to your friends and learn new things together.
Transcript
(IJACSA) International Journal of Advanced Computer Science and Applications, Vol. 11, No. 9, 2020
31 | P a g e www.ijacsa.thesai.org
Weather Variability Forecasting Model through Data
Mining Techniques
Sultan Shekana1, Addisu Mulugeta2
Lecturer, AMiT,
Arba Minch University
Arba Minch, Ethiopia
Durga Prasad Sharma3
Professor, AMUIT, MOEFDRE under UNDP
Expat International Consultant ILO (United Nations)
Abstract—Climate and weather variability are thought-
provoking for world communities. In this apprehension, weather
variability imposes a broad impact on the economy and the
survival of the living entities. In relation to the African continent
country Ethiopia, it is desirable to have great attention on the
weather variability. The Ethiopian Dodota Woreda region is
continuously affected by repeated droughts. It gives a great
alarm to investigate and analyze the factors which are major
causes of the frequent occurrence of drought. Although the
weather scientists and domain experts are overwhelmed with
meteorological data but lacking in analyzing and revealing the
hidden knowledge or patterns about weather variability. This
paper is an effort to design an enhanced predictive model for
weather variability forecasting through Data Mining Techniques.
The parameters used in this research are temperature, dew
point, sunshine, rainfall, wind speed, maximum temperature,
minimum temperature, and relative humidity to enhance the
accuracy of forecasting. To improve the accuracy, we used the
Multilayer-perceptron (MLP), Naïve Bayes, and multinomial
logistic regression algorithms to design a proposed Predictive
Model. The knowledge discovery in database (KDD) process
model was used as a framework for the modeling purpose. The
research findings revealed that the aforementioned parameters
have a strong positive relationship with weather forecasting in
meteorology sectors. The MLP model with selected parameters
presents an interesting predictive accuracy result i.e. 98.3908%
as correctly classified instances. The most performing algorithm,
MLP was chosen and used to generate interesting patterns. The
domain experts (meteorologists) validated the discovered
patterns for the improved accuracy of weather variability
forecasting.
Keywords—Meteorological data; weather forecasting;
multilayer-perceptron; Naïve Bayes; multinomial logistic
regression algorithms
I. INTRODUCTION
The prime objective of this study is to design an enhanced predictive model for weather variability forecasting of Dodota Woreda (a region of Ethiopia) site using data mining techniques. Primarily it was aimed to rigorously review the existing models to find out the deficiencies in weather variability forecasting. This review was done in special reference to the site (Dodota Woreda) selected for the study and primary data collection. The determinant parameters that affect the weather variability were targeted to identify and select suitable data mining techniques for designing a predictive model. The performance of the model was validated
by domain experts i.e. meteorologists. It was also marked to identify which data mining algorithm is better performing in weather variability forecasting.
The data set for this study was collected from the national meteorology agency of the Dodota Woreda region and Awash-Melkasa station. 10 years of the daily dataset from 2006 to 2016 were collected to analyze the objectives specified in the study. The meteorological dataset selected for this research contains 7 parameters and 5282 records. The major limitation of this research study is the unavailability of sufficient datasets for some of the selected parameters of the climate.
The significance of this research study is to support the meteorology department for accurate weather variability forecasting. For this purpose, the research efforts were made to design a predictive model with enhanced performance. The interesting patterns/rules extracted from this research can be used to support the decision-making processes in the domain. Timely information about the weather variability allows people to make better precautions and preparations to alleviate the disastrous challenges. The enhanced forecasting can also help in improved decision-making processes such as: 1) weather threatens to life and property, 2) daily planning for outdoor activities, and 3) routine weather dependent economic activities.
In general, the research can help in improving the current forecasting methods/mechanism especially in minimizing the forecasting errors. In addition, the Govt. institutions like the National Meteorology Agency, Agriculture Department, Dodota Woreda Administration, Community, and Non-Govt. Institution can also use the outcomes of this research. The major challenges faced by the world Meteorologist are the accuracy of the weather variability and its predictive analysis [1]. Scientists have tried to forecast meteorological characteristics using numerous methods. Some of these methods being used provide better accuracy than others [2]. The current practices of the weather variability forecasting include ground observation, observation from the ships, aircraft, Doppler radars and satellites. We need accurate judgments of temperature at a particular time for various reasons such as the planning for the individuals’ daily activity, the farmers need for planting and harvesting their crops, agricultural and technical systems need the assessment of the natural hazards, and to design the solar energy systems [3]. The necessity for accurate weather variability prediction is not questionable when the benefits are higher than the expanses.
(IJACSA) International Journal of Advanced Computer Science and Applications, Vol. 11, No. 9, 2020
32 | P a g e www.ijacsa.thesai.org
Accuracy of the weather variability is based on the selected algorithms and parameters. Numerous techniques such as linear regression, auto-regression, Multi-Layer Perceptron, and back-propagation neural network is being applied to predict the weather variability using parameters such as temperature, wind speed, rainfall, dew point, and meteorological pollution etc. [4]. The most effective way to minimize the disastrous damage due to weather variability is forewarning. Though the accurate prediction may not stop a famine or flood, they can help people to prepare in advance.
The meteorological office of the forecasting of Ethiopia uses a model 24*7*365 of the year, using one of the world’s fastest supercomputers to predict the weather variability for hours, days, weeks, seasons, and even years ahead. Despite all such efforts, weather forecasting still needs a significant improvement in forecasting accuracy. This is due to the complexity of the atmosphere and lack of observational data with limited consideration of weather parameters [5]. Even though, a huge amount of the meteorological dataset is available at the meteorology department, but it is not adequately, and properly analyzed for weather variability forecasting. The discovered new knowledge and hidden insights can be useful support in decision making and strategic planning processes.
The world Climate and Weather are the two critical phenomena that affect human lives. Weather is a short-term phenomenon and its variability has a broad and far-reaching set of impact by imposing significant loss of lives and cause illness. It also affects the economy in terms of transportation blockage, the decline in agricultural production, and land erosion. Although some of the research studies and projects have been undertaken in the Dodota Woreda region covering limited knowledge with scientific observations on weather forecasting and its impacts. These studies used different sets of parameters for predicting weather variability in terms of sunny, cloudy, and rainy which are used for the precautionary measures for the community lives, economic development, and to save the community from drought, food security, unpredictable rain, flood, and soil erosion.
In the year 2008 (ETC) many people at Dodota Woreda faced weather variability challenges and died due to great famine and drought shocks. The food shortage and drought were tightly coupled with the rainfall variability and caused a situation of high dependency on national and international food aids. During the preliminary assessment, it was found that the number of farmers at Dodota Woreda was displaced due to disastrous weather and soil erosions. With the researcher's point of view, the impact of weather variability is still continued and considered to be one of the important study focus areas for the Dodota Woreda region. The extremes of damages by climatic disasters and weather variability cannot be avoided completely, but a forewarning or an advance warning can minimize or alleviate such disastrous damages by advanced precautions and decision makings. This could certainly be a noble help to minimize the adverse effect of weather variability. Hence it was observed that an accurate and enhanced forecasting method for weather variability can be an important research initiative.
In data science analytics, there may be numerous hidden rules/patterns available in a massive amount of meteorological dataset. These patterns/rules can be very evident but cannot easily be discovered by domain experts. For this reason, numerous researchers tried to predict weather variability with different meteorological parameters through different data mining techniques. When we use different predictive models with low performance in decision-making processes; definitely decisions cannot be effective on-ground in reality. From the researcher’s point of view, we need to have improved models so as to enhance the accuracy of the weather variability forecasting. These enhanced or improved models can provide better and accurate weather variability forecasting to support decision-making processes.
The Data Mining techniques have proved encouraging results in the prediction of weather variability but the variability of the parameters could lead to a deficiency in the results. In this study, efforts are made to enhance the accuracy of weather variability forecasting with extended parameters. The different types of weather parameters such as rainfall, wind speed, humidity, dew point, and sunshine, etc. were added as additional parameters along with the parameters used by the prior researches. It was done to check the impact on the accuracy of the weather variability forecasting. This the research applies “Multilayer perceptron or Back Propagation, Naïve Bayes, and Multinomial logistic regression algorithms”. In this research, we used WEKA software for data analysis.
Initially, it was observed that the Dodota Woreda of Ethiopia is being affected by serious weather variability disasters such as socio-economic crisis, transport blockage, cattle deaths, illness, and food shortage because of lack of accurate weather forecasting. This results in a displacement of the people from one region to another. This phenomenon needs serious attention. The significant research question raised to initiate this research study were: 1) What are the major challenges in the accurate forecasting of the weather variability in general and at Dodota Woreda region as a case? 2) What are the forecasting accuracy gaps in the prior research studies in the 1) region? and 3) How a better research contribution can enhance the forecasting accuracy of the weather variability so as to support the decision-makers for better preparation to alleviate the adverse impacts. The main motivation of this research was to design an enhanced predictive model that can accurately forecast the weather variability using data mining techniques. Finally, the designed predictive model and the hidden knowledge/pattern discovered from this research are presented. This knowledge as rules/patterns discovered from the massive meteorology dataset can help agencies to provide better weather variability information to the public and decision-makers.
The study expected a significant contribution to the new knowledge domain of the weather forecasting in the region. Hence, this study is an attempt to analyze the massive amount of meteorological data to design an enhanced predictive model that can support the forecasting of weather variability using data mining techniques. The study was focused on the Dodota Woreda region located in the Arsi zone in the Oromia Region of Ethiopia.
(IJACSA) International Journal of Advanced Computer Science and Applications, Vol. 11, No. 9, 2020
33 | P a g e www.ijacsa.thesai.org
II. REVIEW OF LITERATURE
A massive amount of data is essential to generate new information and knowledge. The data retrieval is not enough to hold and process relevant data stored in databases and other repositories. It requires alternative techniques such as data mining. These techniques facilitate several powerful tools for classification, analysis, interpretation, and modeling of the massive amount of data that could aid or support in decision-making processes. Different data mining techniques and algorithms are being used to predict or forecast the weather variability. This can help the organizations, agencies, and individuals to take knowledge-driven proactive precautionary decisions.
The weather is the current state of the atmosphere around us and characterized by temperature, atmospheric pressure, humidity, wind speed, cloudiness, and others. The Climate is the state of the atmosphere over a long period of time, such as over years, decades, centuries, or greater. Weather variability forecasting is the application of data science and technology to estimate the future whether the conditions will be the same or not such as in an hour, tomorrow, next week, or next month. Accurate weather variability forecasts are important for planning day-to-day activities. Farmers need the information to help them plan for the planting and harvesting of their crops. Airlines need to know about the local weather conditions in order to schedule flights. Weather forecasting helps to make a more informed daily decision and may even help (keep) us from danger [6] [7].
Forewarnings and forecasting services that provide information about weather impacts are expressed in contributions focusing on very different national and user contexts [8]. The weather forecasts are divided into the many categories. Now-casting, Short-range forecast, Medium range forecasts (4 to 10 days), and Long-range forecasts (more than 10 days to season): there is no rigid definition for long-range forecasting, which may range from a monthly to a seasonal forecast. This type of forecast is good for the long decision-making process and in the agricultural product that is based on seasonal weather conditions. Especially for the farmers to plant and harvest their crops, they need to know the weather variability of more than 15 days to a month or maybe the season [9].
Weather variability forecasting is the application of science and technology to predict the state of the atmosphere for a given location. Ancient weather forecasting methods usually relied on observed patterns of events, also termed pattern recognition [10]. Ancient times it might be observed that if the sunset is particularly red, the following day often brought fair weather. However, not all of these predictions were proved reliable. The data mining techniques developed recently can successfully be applied for accurate prediction of the weather variability. Data mining is a process that uses a variety of data analysis tools to discover patterns and relationships in data that may be used to make valid predictions. Some of the applications of data mining include the discovery of interesting patterns, clustering of data based on parameters, and prediction of results using the existing data [11]. Data are raw facts or measurements that can be recorded about events, assets, and
have no significance beyond its existence [12]. The data needs to be collected, organized, summarized and analyzed for decision-making purposes. Information is the processed data that has a certain meaning, and the knowledge is the appropriate discovery of hidden facts in the collected and processed data or information in a contextualized form. Usages of computers and storage technologies in different sectors have dramatically increased the availability of digital data in every sector. Like other sectors data captured in the Meteorology, sector has also increased dramatically, and thus huge amounts of datasets are the basic input that administrators and decision-makers use to build theories and models. But the analysis capability to build patterns and model from these available datasets are very slow when compared with the availability of the datasets increasing exponentially. Due to the huge sum of data collected/ recorded by the meteorology offices, the application of traditional tools become unreasonable to discover the hidden pattern in terms of new knowledge that can be helpful in the decision-making processes. Data does not replace skilled business analysts or managers, but rather gives them powerful tools and techniques to improve the job they do.
Data mining is defined as the application of algorithms for discovering hidden patterns and relationships in the variables of data using a variety of data analysis tools to make valid predictions. The data mining objective is to provide accurate knowledge in the form of useful rules, techniques, visual graphs, and models for weather variability forecasting [13] [14]. The interesting patterns are selected based on subjective or objective problems. This knowledge can be used to support decision-making processes in specified sectors such as agriculture, weather, and irrigation. Data mining itself is not able to automatically derive useful knowledge from a vast amount of dataset without machine-oriented guidance. This implies that collecting, processing, exploring, and selecting a suitable tool and technique is critically an important issue. The Predictive model works for making predictions from datasets. The predictive model reveals the unknown patterns as a result of different datasets to predict the future. [15] [16].
The classification is one of the predictive data mining tasks and used to find a model that describes and distinguishes classes or concepts.
The time series is a sequence of events where the next event is determined by one or more of the preceding events. The weather parameters such as wind speed, rainfall, relative humidity, sunshine, dew point, maximum temperature, minimum temperature, and months are used to predict the weather condition such as sunny, cloudy, and rainy and depicted in Fig. 1.
Data mining is a complex process which needs a proper combination of various data mining tools, techniques, and human experts. The process model can help experts to have a common reference and will increase the understanding of complex data mining issues. Modeling of data mining is used to select the best data mining techniques and methodology that fits with the expected patterns and features in data mining applications. Different data mining process models available are: CRISP-DM (Cross-industry Standard Process for Data Mining), SEMMA (Sample, Explore, Modify, Model, and

(IJACSA) International Journal of Advanced Computer Science and Applications, Vol. 11, No. 9, 2020
34 | P a g e www.ijacsa.thesai.org
Assess), KDD (Knowledge Discovery in Database), and Hybrid model.
Fig. 1. Conceptual Frameworks of the Research Study.
Some of the studies accomplished prior to this research are reviewed and critically analyzed in this paper. A research conducted by Nishchala et al. [17] for Classification and Forecasting of weather using ANN, k-NN, and Naïve Bayes Algorithms is reviewed and analyzed in this paper. This study conducted a comparison between MLP, k-NN, and Naïve Bayes algorithms to predict and classify the future conditions of the weather. It shows that k-NN provides better accuracy in classification and also in terms of the execution time required. The numeric prediction results also showed that the Naïve Bayes gives better results compared to k-NN and MLP. From the above results, a hybrid system can be developed through Naïve Bayes for numeric prediction and k-NN for classification. This model can provide better accuracy because a single system cannot satisfy all the constraints.
Research of Abhishek Saxena et al. [18] presented the review of weather prediction using Artificial Neural Networks. It yields better results and can be considered as an alternative to the traditional meteorological approach. The study expressed the capability of artificial neural network in predicting various weather phenomena such as temperature, thunderstorms, rainfall, wind speed and concluded that major architecture like BP, MLP is suitable to predict the weather phenomenon.
Another similar research was carried out in Dire Dawa, Dereje region of Ethiopia on Meteorological Data Analysis for designing a Predictive Model to Support Weather Forecasting using Data Mining techniques [5]. This research recommended filling the gaps in the cumulative knowledge in the area. This study used only three parameters i.e. maximum temperature, minimum temperature, and relative humidity which is not sufficient for the promising accuracy of the forecasting results. The research also recommends enhancing the forecasting accuracy by adding some additional parameters like rainfall, wind speed, and dew point. This research used Artificial Neural Network and decision tree algorithms to achieve encouraging results. Another research [19] concluded that the decision tree has limitations with a continuous variable or with complex variables. The decision tree uses the “divide and conquer” method, and therefore it can perform better if the relevant parameters exist in a limited number. If too many complex interactions are present then it can perform poorly. This research recommended testing the alternative
classification algorithms. These algorithms can be tested to investigate their applicability to the problem domain. Therefore, this research proposed to focus on the four parameters i.e. rainfall, wind speed, sunshine, and dew point with three different algorithms like Naïve Bayes, MLP, and multinomial logistic regression.
III. RESEARCH METHODOLOGY
This research study is a design science, experimental research which mainly focuses on the quantitative approach. To achieve the desired goal, the study followed KDD (Knowledge Discovery in Databases) modeling approach.
CRISP is an industry-standard process while KDD is most preferable for academic purposes. KDD is selected for three main reasons: 1) KDD is the best suited for academic purposes; 2) KDD reduces the skill required for knowledge discovery to the non-experts [20], and 3) KDD is independent of any tool and technique and therefore any technique can be used. Hence, the steps of the KDD process followed are data understanding and data selection, preprocessing, transformation, data mining, evaluation, and interpretation of the mined data to discover the new knowledge or pattern. The five steps involved in the KDD process are [21] presented in Fig. 2.
A. Data Sampling, Collection, and Understanding
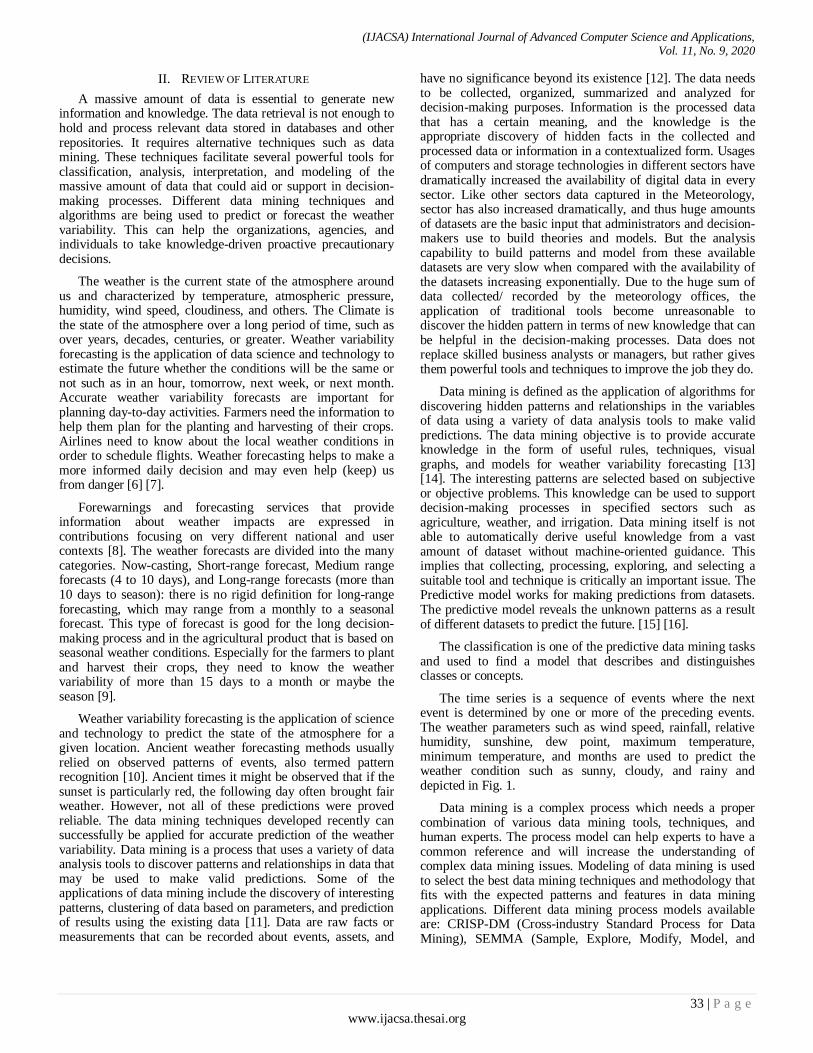
In this study, datasets were collected from primary and secondary sources as presented in Fig. 3. After the interpretation, a weather variability forecasting model was designed and demonstrated to the domain experts. The potential source of data was the national meteorology agency at Dodota Woreda and Awash Melkasa station. To design a model for weather variability forecasting, 10 years of daily datasets from 2006 to 2016 were collected from national meteorology agencies. To extract new knowledge about weather variability from these large datasets, the researchers used data mining techniques and tools.
The obtained data record includes ‘Ghid’, ‘Name’, ‘latitude’, ‘longitude’, year, month, date, time, wind speed, Relative Humidity, Maximum temperature, Minimum temperature, sunshine, rainfall & dew point, evaporation, and precipitation. This step of the study contains, what research strategies should be set to utilize, the selection of the study outline and strategy of data collection, management, and analysis.
Fig. 2. Steps in KDD and Methodology of the Research.
(IJACSA) International Journal of Advanced Computer Science and Applications, Vol. 11, No. 9, 2020
35 | P a g e www.ijacsa.thesai.org
To understand the nature of the data, descriptive statistics techniques were applied. This step includes collecting sample data and deciding which data, including format and size, will be needed. Background knowledge can be used to guide these efforts. Data were checked for completeness, redundancy, missing values, and the plausibility of attribute values, etc. To discover the profound knowledge from the data, the researchers worked closely with the domain experts. The original meteorological datasets contain 20 parameters and 8967 records. From these collected datasets, the study used only 7 parameters and 5282 records. The data collection methods and procedures are presented in Fig. 3.
B. Preprocessing
Data preprocessing is an important and time-consuming phase in the knowledge discovery process. It must be taken into consideration with care in the mining of data streams. Poor quality of data is the main challenge for the knowledge discovery process. Thus, to get accurate results, the researcher preprocessed the data carefully to remove the noisy and unwanted climatic parameters.
C. Attribute/Feature selection
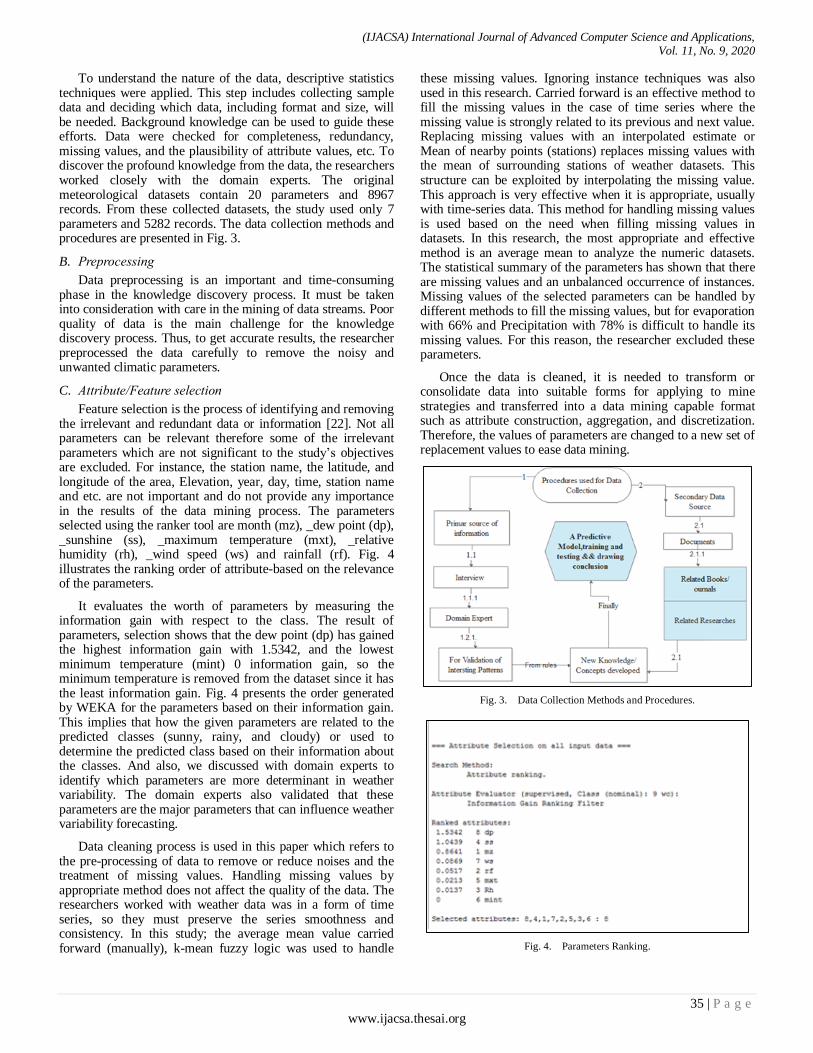
Feature selection is the process of identifying and removing the irrelevant and redundant data or information [22]. Not all parameters can be relevant therefore some of the irrelevant parameters which are not significant to the study’s objectives are excluded. For instance, the station name, the latitude, and longitude of the area, Elevation, year, day, time, station name and etc. are not important and do not provide any importance in the results of the data mining process. The parameters selected using the ranker tool are month (mz), _dew point (dp), _sunshine (ss), _maximum temperature (mxt), _relative humidity (rh), _wind speed (ws) and rainfall (rf). Fig. 4 illustrates the ranking order of attribute-based on the relevance of the parameters.
It evaluates the worth of parameters by measuring the information gain with respect to the class. The result of parameters, selection shows that the dew point (dp) has gained the highest information gain with 1.5342, and the lowest minimum temperature (mint) 0 information gain, so the minimum temperature is removed from the dataset since it has the least information gain. Fig. 4 presents the order generated by WEKA for the parameters based on their information gain. This implies that how the given parameters are related to the predicted classes (sunny, rainy, and cloudy) or used to determine the predicted class based on their information about the classes. And also, we discussed with domain experts to identify which parameters are more determinant in weather variability. The domain experts also validated that these parameters are the major parameters that can influence weather variability forecasting.
Data cleaning process is used in this paper which refers to the pre-processing of data to remove or reduce noises and the treatment of missing values. Handling missing values by appropriate method does not affect the quality of the data. The researchers worked with weather data was in a form of time series, so they must preserve the series smoothness and consistency. In this study; the average mean value carried forward (manually), k-mean fuzzy logic was used to handle
these missing values. Ignoring instance techniques was also used in this research. Carried forward is an effective method to fill the missing values in the case of time series where the missing value is strongly related to its previous and next value. Replacing missing values with an interpolated estimate or Mean of nearby points (stations) replaces missing values with the mean of surrounding stations of weather datasets. This structure can be exploited by interpolating the missing value. This approach is very effective when it is appropriate, usually with time-series data. This method for handling missing values is used based on the need when filling missing values in datasets. In this research, the most appropriate and effective method is an average mean to analyze the numeric datasets. The statistical summary of the parameters has shown that there are missing values and an unbalanced occurrence of instances. Missing values of the selected parameters can be handled by different methods to fill the missing values, but for evaporation with 66% and Precipitation with 78% is difficult to handle its missing values. For this reason, the researcher excluded these parameters.
Once the data is cleaned, it is needed to transform or consolidate data into suitable forms for applying to mine strategies and transferred into a data mining capable format such as attribute construction, aggregation, and discretization. Therefore, the values of parameters are changed to a new set of replacement values to ease data mining.
Fig. 3. Data Collection Methods and Procedures.
Fig. 4. Parameters Ranking.
(IJACSA) International Journal of Advanced Computer Science and Applications, Vol. 11, No. 9, 2020
36 | P a g e www.ijacsa.thesai.org
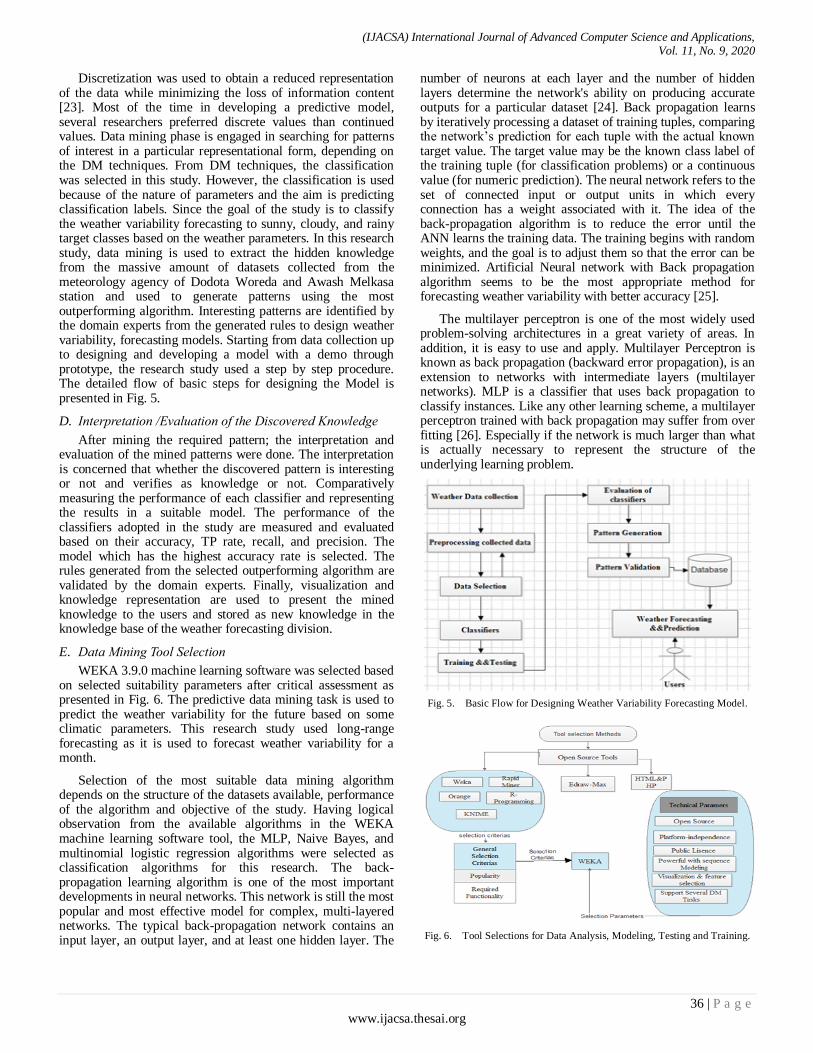
Discretization was used to obtain a reduced representation of the data while minimizing the loss of information content [23]. Most of the time in developing a predictive model, several researchers preferred discrete values than continued values. Data mining phase is engaged in searching for patterns of interest in a particular representational form, depending on the DM techniques. From DM techniques, the classification was selected in this study. However, the classification is used because of the nature of parameters and the aim is predicting classification labels. Since the goal of the study is to classify the weather variability forecasting to sunny, cloudy, and rainy target classes based on the weather parameters. In this research study, data mining is used to extract the hidden knowledge from the massive amount of datasets collected from the meteorology agency of Dodota Woreda and Awash Melkasa station and used to generate patterns using the most outperforming algorithm. Interesting patterns are identified by the domain experts from the generated rules to design weather variability, forecasting models. Starting from data collection up to designing and developing a model with a demo through prototype, the research study used a step by step procedure. The detailed flow of basic steps for designing the Model is presented in Fig. 5.
D. Interpretation /Evaluation of the Discovered Knowledge
After mining the required pattern; the interpretation and evaluation of the mined patterns were done. The interpretation is concerned that whether the discovered pattern is interesting or not and verifies as knowledge or not. Comparatively measuring the performance of each classifier and representing the results in a suitable model. The performance of the classifiers adopted in the study are measured and evaluated based on their accuracy, TP rate, recall, and precision. The model which has the highest accuracy rate is selected. The rules generated from the selected outperforming algorithm are validated by the domain experts. Finally, visualization and knowledge representation are used to present the mined knowledge to the users and stored as new knowledge in the knowledge base of the weather forecasting division.
E. Data Mining Tool Selection
WEKA 3.9.0 machine learning software was selected based on selected suitability parameters after critical assessment as presented in Fig. 6. The predictive data mining task is used to predict the weather variability for the future based on some climatic parameters. This research study used long-range forecasting as it is used to forecast weather variability for a month.
Selection of the most suitable data mining algorithm depends on the structure of the datasets available, performance of the algorithm and objective of the study. Having logical observation from the available algorithms in the WEKA machine learning software tool, the MLP, Naive Bayes, and multinomial logistic regression algorithms were selected as classification algorithms for this research. The back-propagation learning algorithm is one of the most important developments in neural networks. This network is still the most popular and most effective model for complex, multi-layered networks. The typical back-propagation network contains an input layer, an output layer, and at least one hidden layer. The
number of neurons at each layer and the number of hidden layers determine the network's ability on producing accurate outputs for a particular dataset [24]. Back propagation learns by iteratively processing a dataset of training tuples, comparing the network’s prediction for each tuple with the actual known target value. The target value may be the known class label of the training tuple (for classification problems) or a continuous value (for numeric prediction). The neural network refers to the set of connected input or output units in which every connection has a weight associated with it. The idea of the back-propagation algorithm is to reduce the error until the ANN learns the training data. The training begins with random weights, and the goal is to adjust them so that the error can be minimized. Artificial Neural network with Back propagation algorithm seems to be the most appropriate method for forecasting weather variability with better accuracy [25].
The multilayer perceptron is one of the most widely used problem-solving architectures in a great variety of areas. In addition, it is easy to use and apply. Multilayer Perceptron is known as back propagation (backward error propagation), is an extension to networks with intermediate layers (multilayer networks). MLP is a classifier that uses back propagation to classify instances. Like any other learning scheme, a multilayer perceptron trained with back propagation may suffer from over fitting [26]. Especially if the network is much larger than what is actually necessary to represent the structure of the underlying learning problem.
Fig. 5. Basic Flow for Designing Weather Variability Forecasting Model.
Fig. 6. Tool Selections for Data Analysis, Modeling, Testing and Training.
(IJACSA) International Journal of Advanced Computer Science and Applications, Vol. 11, No. 9, 2020
37 | P a g e www.ijacsa.thesai.org
An advantage of the naive Bayes classifier is that it requires a small amount of training time to estimate the parameters necessary for classification [27].
It performs better in many complex real-world situations like Spam Classification, Medical Diagnosis, and Weather forecasting [27]. This algorithm is important for several reasons. It is very easy to construct, not needing any complicated iterative parameter estimation schemes. This means it may be readily applied to huge datasets. It is easy to interpret, so users unskilled in classifier technology can easily understand why it is making the classification. For the prediction of future events, Naïve Bayes uses knowledge of prior events. Suppose we have more than one evidence for building our Naïve Bayes model, we could run into a problem of dependencies, i.e., some evidence may depend on one or more of other evidence. For instance, the evidence “dark cloud” directly depends on the evidence “high humidity”. However, including dependencies into the model will make it
very complicated. This is because one evidence could depend on many other pieces of evidence.
Logistic regression analysis studies the association between a categorical dependent variable and a set of independent (explanatory) variables. The name logistic regression is used when the dependent variable has only two values, such as 0 and 1 or Yes and No. Multinomial logistic regression is used to predict categorical placement in or the probability of category membership on a dependent variable based on multiple independent variables. The binary logistic regression, multinomial logistic regression uses maximum likelihood estimation to evaluate the probability of categorical membership. Logistic regression competes with discriminant analysis as a method for analyzing categorical-response variables. This program computes binary logistic regression and multinomial logistic regression on both numeric and categorical independent variables. It reports on the regression equation as well as the goodness of fit, odds ratios, confidence limits, likelihood, and deviance. It can perform an independent variable subset selection search, looking for the best regression model with the fewest independent variables. It provides confidence intervals on predicted values and provides ROC curves to help determine the best cutoff point for classification. It allows validating the results by automatically classifying rows that are not used during the analysis.
The classifiers were evaluated by cross-validation using the number of folds. K-fold is a natural number used to check the performance of the model through k–times. In this paper 20-folds, 15-folds and 10-fold cross-validation was recommended for estimating accuracy and achieved the highest accuracy in experimentations. The classifiers were tested for 40%, 50%, 66% (the default), 76%, 86%, and 96% for training split percentages and the remaining for testing and different values of learning rates and a number of hidden layers were also used.
F. Methods of Analysis and Evaluation of System
Performance
Once a model is built using training data, one can be curious to know how the model will perform in the future or compare the forecasting accuracy of multiple models for the same forecasting problem and to decide on the real-world
decision making. To do this we need to measure the performance and accuracy of the model. Commonly, predictive models with higher accuracy are viewed as better. The following evaluation metric was used.
1) Precision and Recall- precision is the fraction of true
positive from the predicted instance, while recall is the fraction
of relevant instances that are retrieved. Precision can be
thought of as a measure of exactness or quality, whereas recall
is a measure of completeness or quantity [28].
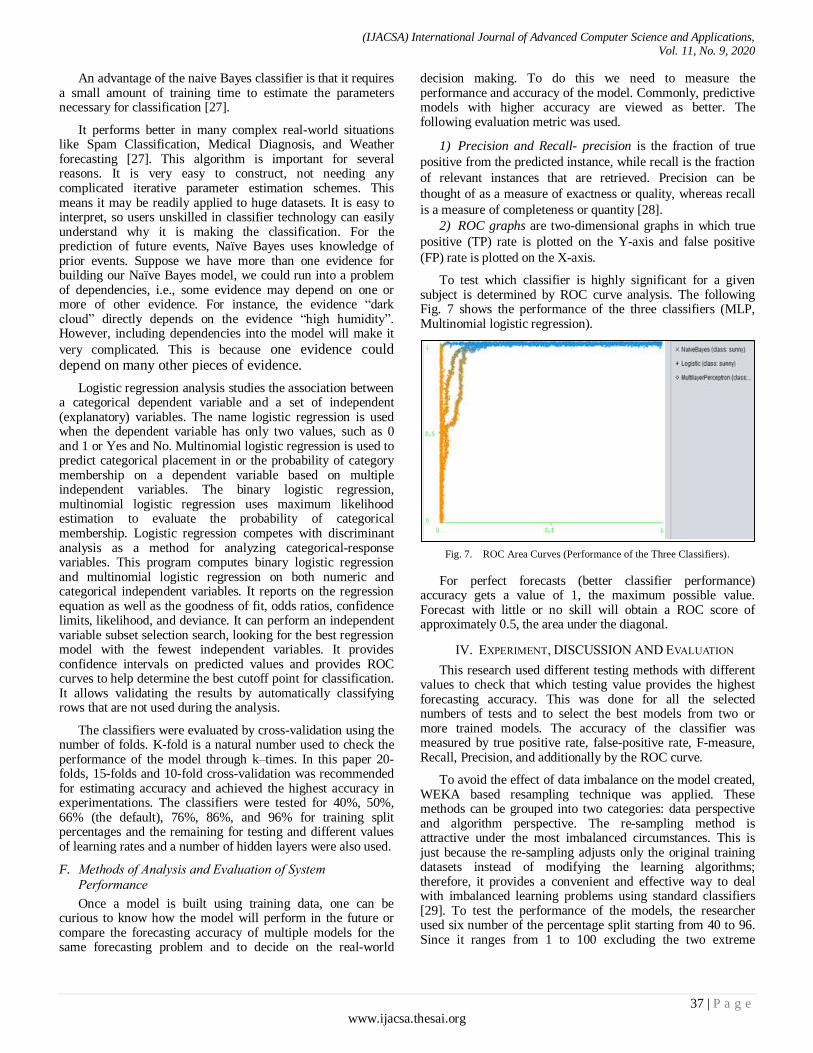
2) ROC graphs are two-dimensional graphs in which true
positive (TP) rate is plotted on the Y-axis and false positive
(FP) rate is plotted on the X-axis.
To test which classifier is highly significant for a given subject is determined by ROC curve analysis. The following Fig. 7 shows the performance of the three classifiers (MLP, Multinomial logistic regression).
Fig. 7. ROC Area Curves (Performance of the Three Classifiers).
For perfect forecasts (better classifier performance) accuracy gets a value of 1, the maximum possible value. Forecast with little or no skill will obtain a ROC score of approximately 0.5, the area under the diagonal.
IV. EXPERIMENT, DISCUSSION AND EVALUATION
This research used different testing methods with different values to check that which testing value provides the highest forecasting accuracy. This was done for all the selected numbers of tests and to select the best models from two or more trained models. The accuracy of the classifier was measured by true positive rate, false-positive rate, F-measure, Recall, Precision, and additionally by the ROC curve.
To avoid the effect of data imbalance on the model created, WEKA based resampling technique was applied. These methods can be grouped into two categories: data perspective and algorithm perspective. The re-sampling method is attractive under the most imbalanced circumstances. This is just because the re-sampling adjusts only the original training datasets instead of modifying the learning algorithms; therefore, it provides a convenient and effective way to deal with imbalanced learning problems using standard classifiers [29]. To test the performance of the models, the researcher used six number of the percentage split starting from 40 to 96. Since it ranges from 1 to 100 excluding the two extreme
(IJACSA) International Journal of Advanced Computer Science and Applications, Vol. 11, No. 9, 2020
38 | P a g e www.ijacsa.thesai.org
borders, different numbers of k-folds from 2-folds to 20-folds, hidden layers from single to multiple hidden layers, and learning rates from (0.01 to 0.9).
A. Model Designing using Naïve Bayes Classifier
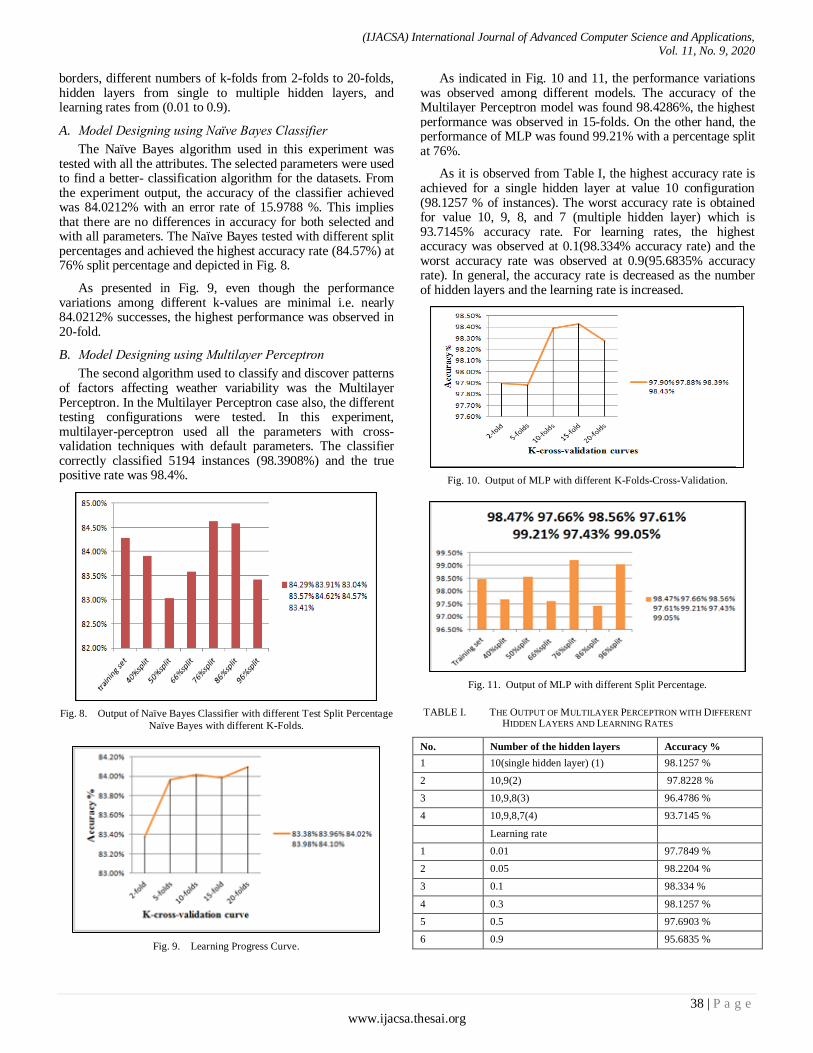
The Naïve Bayes algorithm used in this experiment was tested with all the attributes. The selected parameters were used to find a better- classification algorithm for the datasets. From the experiment output, the accuracy of the classifier achieved was 84.0212% with an error rate of 15.9788 %. This implies that there are no differences in accuracy for both selected and with all parameters. The Naïve Bayes tested with different split percentages and achieved the highest accuracy rate (84.57%) at 76% split percentage and depicted in Fig. 8.
As presented in Fig. 9, even though the performance variations among different k-values are minimal i.e. nearly 84.0212% successes, the highest performance was observed in 20-fold.
B. Model Designing using Multilayer Perceptron
The second algorithm used to classify and discover patterns of factors affecting weather variability was the Multilayer Perceptron. In the Multilayer Perceptron case also, the different testing configurations were tested. In this experiment, multilayer-perceptron used all the parameters with cross-validation techniques with default parameters. The classifier correctly classified 5194 instances (98.3908%) and the true positive rate was 98.4%.
Fig. 8. Output of Naïve Bayes Classifier with different Test Split Percentage
Naïve Bayes with different K-Folds.
Fig. 9. Learning Progress Curve.
As indicated in Fig. 10 and 11, the performance variations was observed among different models. The accuracy of the Multilayer Perceptron model was found 98.4286%, the highest performance was observed in 15-folds. On the other hand, the performance of MLP was found 99.21% with a percentage split at 76%.
As it is observed from Table I, the highest accuracy rate is achieved for a single hidden layer at value 10 configuration (98.1257 % of instances). The worst accuracy rate is obtained for value 10, 9, 8, and 7 (multiple hidden layer) which is 93.7145% accuracy rate. For learning rates, the highest accuracy was observed at 0.1(98.334% accuracy rate) and the worst accuracy rate was observed at 0.9(95.6835% accuracy rate). In general, the accuracy rate is decreased as the number of hidden layers and the learning rate is increased.
Fig. 10. Output of MLP with different K-Folds-Cross-Validation.
Fig. 11. Output of MLP with different Split Percentage.
TABLE I. THE OUTPUT OF MULTILAYER PERCEPTRON WITH DIFFERENT
HIDDEN LAYERS AND LEARNING RATES
No. Number of the hidden layers Accuracy %
1 10(single hidden layer) (1) 98.1257 %
2 10,9(2) 97.8228 %
3 10,9,8(3) 96.4786 %
4 10,9,8,7(4) 93.7145 %
Learning rate
1 0.01 97.7849 %
2 0.05 98.2204 %
3 0.1 98.334 %
4 0.3 98.1257 %
5 0.5 97.6903 %
6 0.9 95.6835 %
(IJACSA) International Journal of Advanced Computer Science and Applications, Vol. 11, No. 9, 2020
39 | P a g e www.ijacsa.thesai.org
C. Model Designing using Logistic Regression Classifier
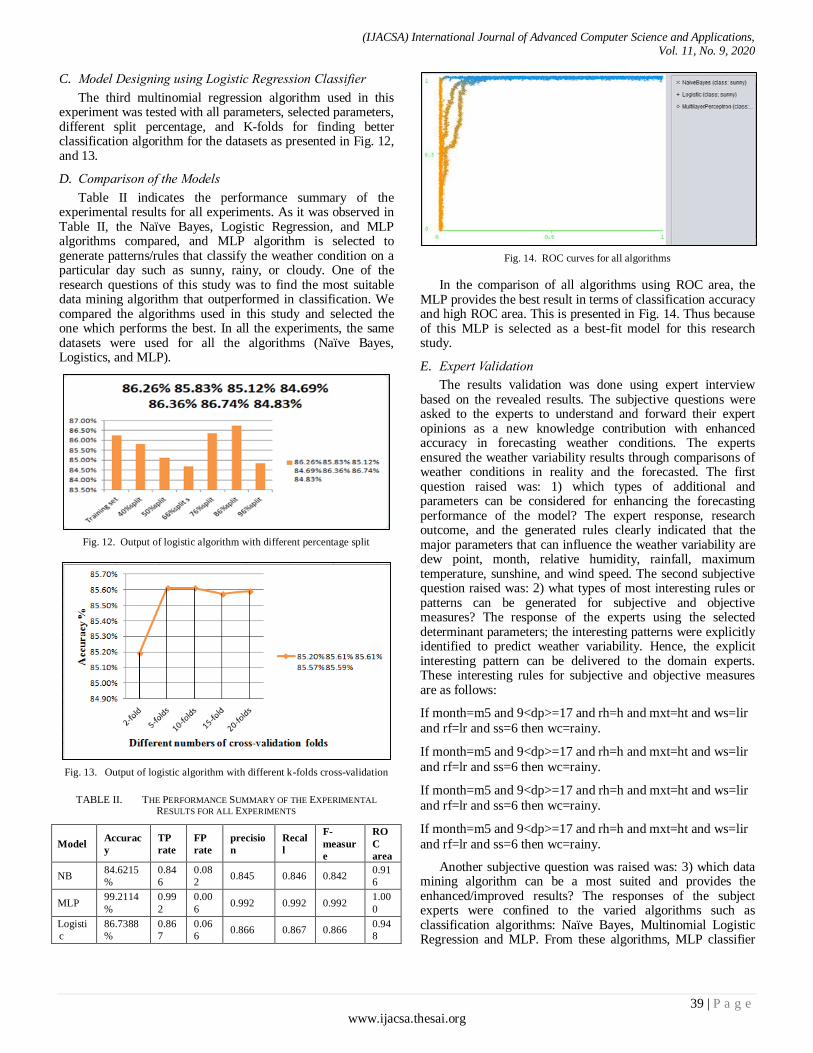
The third multinomial regression algorithm used in this experiment was tested with all parameters, selected parameters, different split percentage, and K-folds for finding better classification algorithm for the datasets as presented in Fig. 12, and 13.
D. Comparison of the Models
Table II indicates the performance summary of the experimental results for all experiments. As it was observed in Table II, the Naïve Bayes, Logistic Regression, and MLP algorithms compared, and MLP algorithm is selected to generate patterns/rules that classify the weather condition on a particular day such as sunny, rainy, or cloudy. One of the research questions of this study was to find the most suitable data mining algorithm that outperformed in classification. We compared the algorithms used in this study and selected the one which performs the best. In all the experiments, the same datasets were used for all the algorithms (Naïve Bayes, Logistics, and MLP).
Fig. 12. Output of logistic algorithm with different percentage split
Fig. 13. Output of logistic algorithm with different k-folds cross-validation
TABLE II. THE PERFORMANCE SUMMARY OF THE EXPERIMENTAL
RESULTS FOR ALL EXPERIMENTS
Model Accurac
y
TP
rate
FP
rate
precisio
n
Recal
l
F-
measur
e
RO
C
area
NB 84.6215
%
0.84
6
0.08
2 0.845 0.846 0.842
0.91
6
MLP 99.2114
%
0.99
2
0.00
6 0.992 0.992 0.992
1.00
0
Logisti
c
86.7388
%
0.86
7
0.06
6 0.866 0.867 0.866
0.94
8
Fig. 14. ROC curves for all algorithms
In the comparison of all algorithms using ROC area, the MLP provides the best result in terms of classification accuracy and high ROC area. This is presented in Fig. 14. Thus because of this MLP is selected as a best-fit model for this research study.
E. Expert Validation
The results validation was done using expert interview based on the revealed results. The subjective questions were asked to the experts to understand and forward their expert opinions as a new knowledge contribution with enhanced accuracy in forecasting weather conditions. The experts ensured the weather variability results through comparisons of weather conditions in reality and the forecasted. The first question raised was: 1) which types of additional and parameters can be considered for enhancing the forecasting performance of the model? The expert response, research outcome, and the generated rules clearly indicated that the major parameters that can influence the weather variability are dew point, month, relative humidity, rainfall, maximum temperature, sunshine, and wind speed. The second subjective question raised was: 2) what types of most interesting rules or patterns can be generated for subjective and objective measures? The response of the experts using the selected determinant parameters; the interesting patterns were explicitly identified to predict weather variability. Hence, the explicit interesting pattern can be delivered to the domain experts. These interesting rules for subjective and objective measures are as follows:
If month=m5 and 9<dp>=17 and rh=h and mxt=ht and ws=lir
and rf=lr and ss=6 then wc=rainy.
If month=m5 and 9<dp>=17 and rh=h and mxt=ht and ws=lir
and rf=lr and ss=6 then wc=rainy.
If month=m5 and 9<dp>=17 and rh=h and mxt=ht and ws=lir
and rf=lr and ss=6 then wc=rainy.
If month=m5 and 9<dp>=17 and rh=h and mxt=ht and ws=lir
and rf=lr and ss=6 then wc=rainy.
Another subjective question was raised was: 3) which data mining algorithm can be a most suited and provides the enhanced/improved results? The responses of the subject experts were confined to the varied algorithms such as classification algorithms: Naïve Bayes, Multinomial Logistic Regression and MLP. From these algorithms, MLP classifier

(IJACSA) International Journal of Advanced Computer Science and Applications, Vol. 11, No. 9, 2020
40 | P a g e www.ijacsa.thesai.org
algorithm with selected parameters achieved relatively better classification accuracy as compared to other two algorithms for weather variability forecasting.
V. CONCLUSION
Applications of data mining techniques have been increasingly getting popularity and proved to be relevant for the sectors like meteorology, health care, telecommunications, and banking etc. In particular, the meteorology sector has significant possibilities where data mining can be applied for weather variability forecasting to improve the accuracy of weather forecasting and to support decision-makers towards better disaster management. This research study is an attempt to design a forecasting model for the weather variability using data mining techniques in general and Dodota Woreda region as a case. At the end of the study, data mining model was developed using three data mining classification algorithms. In this model, the classifier extracts the hidden knowledge from ten years of massive amounts of meteorological dataset. The algorithm was trained, tested, evaluated against a test dataset. The model was also validated using cost-sensitive evaluation method, ROC curve of the classifier, precision, recall and f-measure methods. In this model was evaluated for the effectiveness. KDD process model was used in this study. WEKA was used as a tool for preprocessing and analyzing the weather variability datasets for the forecasting. Three different models were designed using Naïve Bayes, Multinomial Logistic Regression, and MLP algorithms through adjustment settings to come up with understandable and meaningful results. The comparison of the results produced by all the models showed that the encouraging results obtained with MLP classifier is the most appropriate for classification and weather variability forecasting. MLP model with selected parameters presents an interesting (the highest) forecasting accuracy in the results. MLP classification algorithm can be used to generate rules to classify weather variability parameters such as maximum temperature, minimum temperature, relative humidity, dew point, rainfall, and sunshine to sunny, cloudy, and rainy target classes. Findings of this research revealed that these parameters have strong positive relationship with weather forecasting in meteorology sectors. Also, the detailed discussion on the discovered patterns was done with domain experts. It was proved that this research study can be a significant support to the meteorologists in decision making processes. Also, the improvement in the accuracy of weather variability forecasting can play a vital role in taking better precautionary measures. The outcome of this research can be used by meteorology agencies to help the meteorologist to make consistent forecasts, to support agricultural institutions and other business organizations.
Overall, the major contribution of this research is to find out the relationships among variables (parameters) that bring weather variability, data mining techniques offer great capacity in supporting meteorology agency towards making better decisions. The extracted knowledge generated rules (patterns) by the model can be a significant new knowledge-based input for improving the decision-making processes.
VI. RECOMMENDATIONS
In due consideration of the results of the research, the following recommendations are forwarded for future researches in the weather variability forecasting domain:
In this study, the forecasting model used seven climatic parameters such as rainfall, maximum temperature, minimum temperature, relative humidity, dew point, sunshine, and wind speed. However, some other important parameters like precipitation, evaporation, environmental/sea level pressure, wind direction, cloud coverage, and much more remains and needs to be considered for further study to check the impacts on the model’s accuracy. In data collection, the researcher used only one station; however, the study can focus on expanding the scope for other weather-sensitive stations.
Even though there are many data mining techniques, but this research used only the three classification algorithms such as Naïve Bayes, Multinomial Logistic Regression, and MLP. The other data mining algorithms like the K-NN algorithm, Vector Machine, Weighted Bayesian, are overlooked for testing, and forecasting in this research study. It might be important to design a forecasting model for weather variability forecasting using these different algorithms too.
ACKNOWLEDGMENTS
It is great pleasure for us to express our heartfelt gratitude to the National Meteorology Agency and Awash Melkasa Meteorology station, Ethiopia for providing the relevant datasets required for this research. Also, authors express their gratitude to the professional scientists and the staff of the station for their consistent support and inputs to complete this study on time. Special thanks to our expert adviser Prof. DP Sharma for his consistent technical support and guidance despite of his hectic engagements in multidisciplinary assignments.
REFERENCES
[1] M Ramzan Talib, Toseef Ullah, M Umer Sarwar, M Kashif Hanif and Nafees Ayub, "Application of Data Mining Techniques in Weather Data
Analysis," IJCSNS International Journal of Computer Science and Network Security, vol. 17, no. 6, pp. 22-28, June 2017.
[2] D. Santhi Jeslet,S. Jeevanandham, "Climate Change Analysis Using
Data Mining Techniques," International Journal of Advance Research In Science And Engineering,(IJARSE), vol. 4, no. 03, pp. 46-53, March
2015.
[3] S. Kotsiantis, A. Kostoulas, S. Lykoudis, A. Argiriou, K. Menagias, "Using Data mining Techniques for estimating minimum, maximum and
average daily tempreture values," International journal of Mathematical ,Physical and engineering science, vol. 1, no. 1307-7465, pp. 16-20,
January 2008.
[4] Y.Radhika and M.Shashi, "Atmospheric T emperature Prediction using
Support V ector Machines," International Journal of Computer Theory and Engineering, vol. 1, no. 1, pp. 55-58, April 2009.
[5] M. E. Dereje, "Meteorological Data analysis for creating predictive
model that support weather forecasting using data mining techniques," p. 4, 15 july 2014.
(IJACSA) International Journal of Advanced Computer Science and Applications, Vol. 11, No. 9, 2020
41 | P a g e www.ijacsa.thesai.org
[6] Kristine Inchausti,Michele McLeod,Stacie Pierpoint, "Weather-
forecasting," Annenberg Foundation, 23 july 2016. [Online]. Available: https://www.learner.org/exhibits/weather/forecasting.html. [Accessed 7
December 2017].
[7] Kapil Khandelwal, Durga Prasad Sharma, "Hybrid Reasoning Model for Strengthening the problem solving capability of Expert Systems,"
(IJACSA) International Journal of Advanced Computer Science and Applications, vol. 4, no. 10, pp. 88-94, 2013.
[8] Andrea Taylor, Thomas Kox, David Johnston, "Communicating High
Impact Weather: Improving warnings and decision making processes," International Journal of Disaster Risk Reduction, vol. 30, no. 4, pp. 18-
24, 2018.
[9] P. V. B. N. Ganesh P. Gaikwad, "Different Rainfall Prediction Models And General Data Mining Rainfall Prediction Model," vol. 2, no. 7, July
- 2013.
[10] Nevonproject, "weather forecasting using data mining," NevonProjects, 12 March 2012. [Online]. Available: http://nevonprojects.com/weather-
forecasting-using-data-mining/. [Accessed 11 December 2017].
[11] Alazar Baharu,Durga Prasad Sharma, "Performance Metrics for
Decision Support in Big Data vs. Traditional RDBMS Tools & Technologies," (IJACSA) International Journal of Advanced Computer
Science and Applications,, vol. 7, no. 11, pp. 222-228, 2016.
[12] M. K. KELEŞ, "An Overview: The Impact of Data Mining Applications on Various Sectors," Technical Journal , Vol. 3, No. 11, pp. 128-132,
2017.
[13] M Ramzan Talib, Toseef Ullah, M Umer Sarwar, M Kashif Hanif and Nafees Ayub, "Application of Data Mining Techniques in Weather Data
Analysis," IJCSNS International Journal of Computer Science and Network Security, vol. 17, no. 6, pp. 22-28, June 2017.
[14] D.P. Sharma and Kapil Khandelwal, "Knowledge-Based Systems,
Problem Solving Competence and Learnability," Springer-Verlag Berlin Heidelberg 2011, vol. 250, no. 2011, pp. 543-547, 2011.
[15] P. P. Sondwale, "Overview of Predictive and Descriptive Data Mining
Techniques," vol. 5, no. 4, , April 2015.
[16] Durga Prasad Sharma, "Integrating Multi Criteria Decision Making Model With Geographic Information System For Land Management,"
International Journal of Decision Science & Information Technology, Vol. 3, No. 1, pp. 32-42, 2011.
[17] Nishchala C. Barde,Mrunalinee Patole, "Classification and Forecasting
of Weather using ANN, k-NN and Naïve Bayes Algorithms,"
International Journal of Science and Research (IJSR), vol. 5, no. 2, pp. 17-42, February 2016.
[18] N. V. D. K. C. T. Abhishek Saxena, "the review of weather prediction
using artificial neural networks," International Journal of Engineering Research & Technology, vol. 2, no. 11, p. 222.340, (November - 2013).
[19] S.Saraswathi and Dr. Mary Immaculate Sheela, "Comparative Study of
Different Clustering and Decision Tree for Data Mining Algorithm," International Journal of Computer Science and Mobile Computing, vol.
3, no. 11, p. 422 – 428, November 2014.
[20] V. Goebel, Knowledge Discovery in Databases (KDD) - Data Mining (DM), Department of Informatics, University of Oslo, 2014.
[21] Ravindra Changala, D.Rajeswara Rao, T Janardhana Rao, P Kiran
Kumar, Kareemunnisa, "Knowledge Discovery Process: The Next Step for Knowledge Search," vol. 3, no. 5, May 2015.
[22] Thu Zar Phyu, Nyein Nyein Oo, "Performance Comparison of Feature Selection Methods," EDP Sciences, vol. 42, no. 06002, p. 4, 2016.
[23] Jiawei Han,Micheline Kamber, Jian Pei, Data Mining Concepts and
Techniques, Simon Fraser University: Elsevier, 2012.
[24] Abhishek Saxena, Neeta Verma ,Dr K. C. Tripathi, "A Review Study of Weather Forecasting Using Artificial Neural Network Approach,"
International Journal of Engineering Research & Technology (IJERT), vol. 2, no. 11, pp. 2029-2035, November - 2013.
[25] Meera Narvekar, Priyanca Fargose, "Daily Weather Forecasting using
Artificial Neural Network," International Journal of Computer Applications, vol. 121, no. 22, pp. 9-13, July 2015.
[26] Yukle, "Data Mining: Practical Machine Learning Tools and Techniques,
Second Edition," Artificial Intelligency , 6 june 2017. [Online]. Available: http://genderi.org/data-mining-practical-machine-learning-
tools-and-techniques-se.html?page=111. [Accessed 30 December 2017].
[27] Shweta Kharya,Sunita Soni, "Weighted Naive Bayes Classifier: A Predictive Model for Breast Cancer Detection," International Journal of
Computer Applications , vol. 133, no. 9, pp. 32-37, January 2016.
[28] Jiawei Han,Micheline Kamber,Jian Pei, Data Mining Concepts and
Techniques, Elsevier., 2012.
[29] Peng Cao,Xiaoli Liua,Jian Zhang,Dazhe Zhao,Min Huang,Osmar Zaiane, "norm regularized multi-kernel based joint nonlinear feature
selection and over-sampling for imbalanced data classification," Neurocomputing, vol. 234, no. x, pp. 38-57, 19 April 2017.
Related Documents