Weather Models and Pest Management Decision Timing Len Coop, Assistant Professor (Senior Research) Integrated Plant Protection Center, Botany & Plant Pathology Dept. Oregon State University

Weather Models and Pest Management Decision Timing Len Coop, Assistant Professor (Senior Research) Integrated Plant Protection Center, Botany & Plant Pathology.
Dec 15, 2015
Welcome message from author
This document is posted to help you gain knowledge. Please leave a comment to let me know what you think about it! Share it to your friends and learn new things together.
Transcript
Weather Models and Pest Management Decision Timing
Len Coop, Assistant Professor (Senior Research)Integrated Plant Protection Center, Botany & Plant Pathology Dept.
Oregon State University
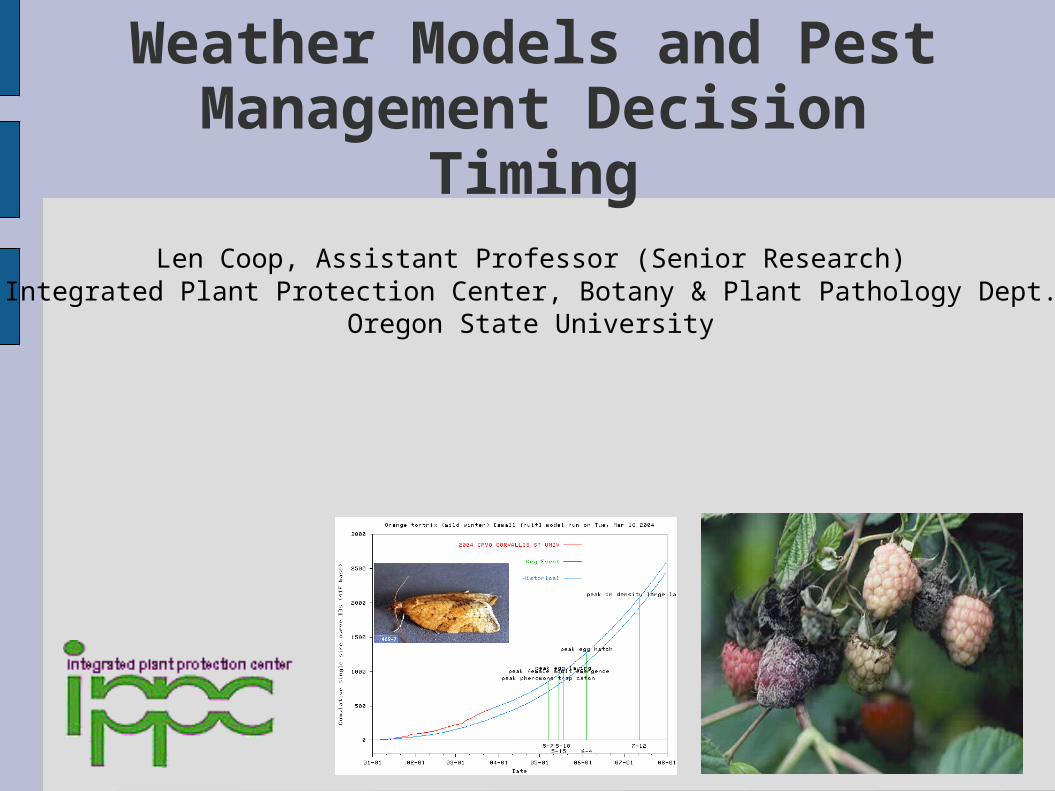
Topics for today's talk:
● Weather data -driven models: degree-day and disease risk models - concepts and examples● Some uses and features of the IPPC "Online weather data and degree-days" website, http://pnwpest.org/wea ● Focus on caneberries and phenology models● Reasons for modeling

Typical IPM questions and representative decision tools:
● "Who?" and "What?"Identification keys, diagnostic guides, management
guides • "When?"
Phenology models (crops, insects, weeds), Risk models (plant diseases)
• "If?" Economic thresholds, crop loss models, sequential and
binomial sampling plans• "Where?"
GPS, GIS, precision agriculture

Weather and Degree-day Concepts in IPM
• Degree-days: a unit of accumulated heat, used to estimate development of insects, fungi, plants, and other organisms which depend on temperature for growth.
• Calculation of degree-days: (one of several methods) DDs = avg. temperature - threshold. So, if the daily max and min are 80 and 60, and the threshold is 50, then we accumulate
» (80+60)/2 - 50 = 20 DDs for the day
Weather and Degree-day Concepts
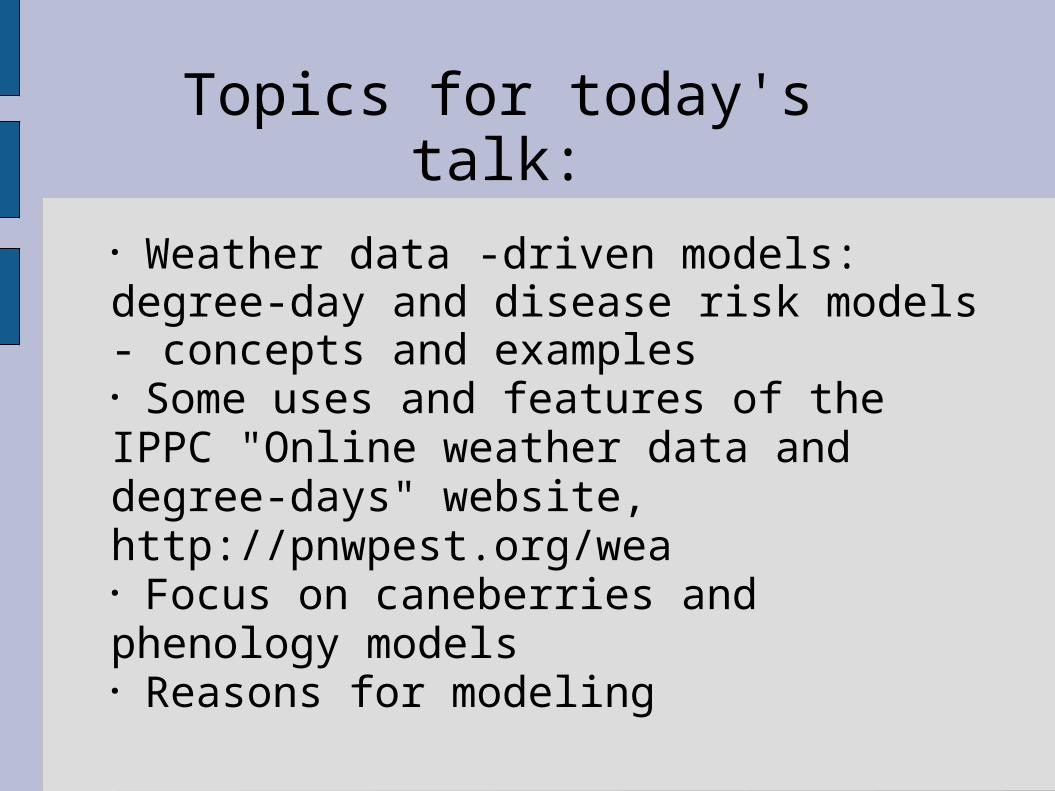
1)Degree-day models: accumulate a daily "heat unit index" (DD total) until some event is expected (e. g. egg hatch)
38
20
18
32
14
22
20
26
daily:
cumulative: 20
70
84
106
126
152
Eggs hatch: 152 cumulative DDs
Eggs start developing: 0 DDs
70o(avg)-50o(threshold)=20DD
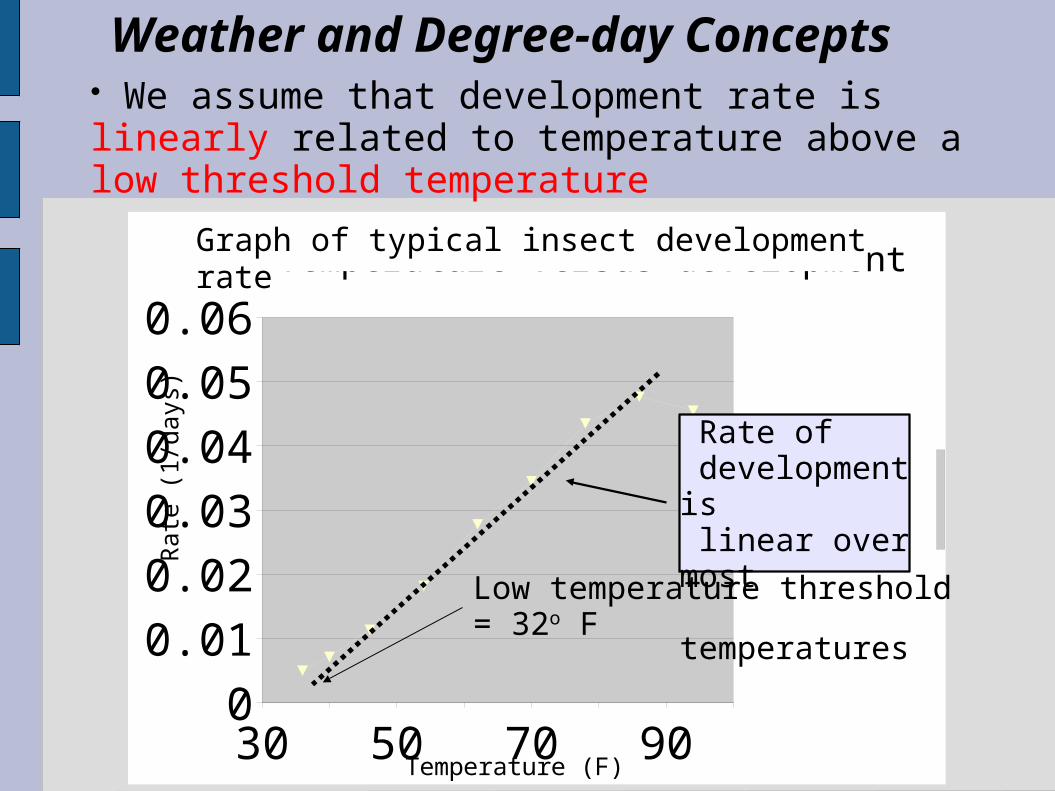
Weather and Degree-day Concepts • We assume that development rate is linearly related
to temperature above a low threshold temperature
30 40 50 60 70 80 901000
0.01
0.02
0.03
0.04
0.05
0.06Temperature versus development
Development time (days)Rate (1/days)
Temperature (F)
Rat
e (1
/day
s)
Low temperature threshold = 32o F
Graph of typical insect development rate
Rate of development is linear over most temperatures
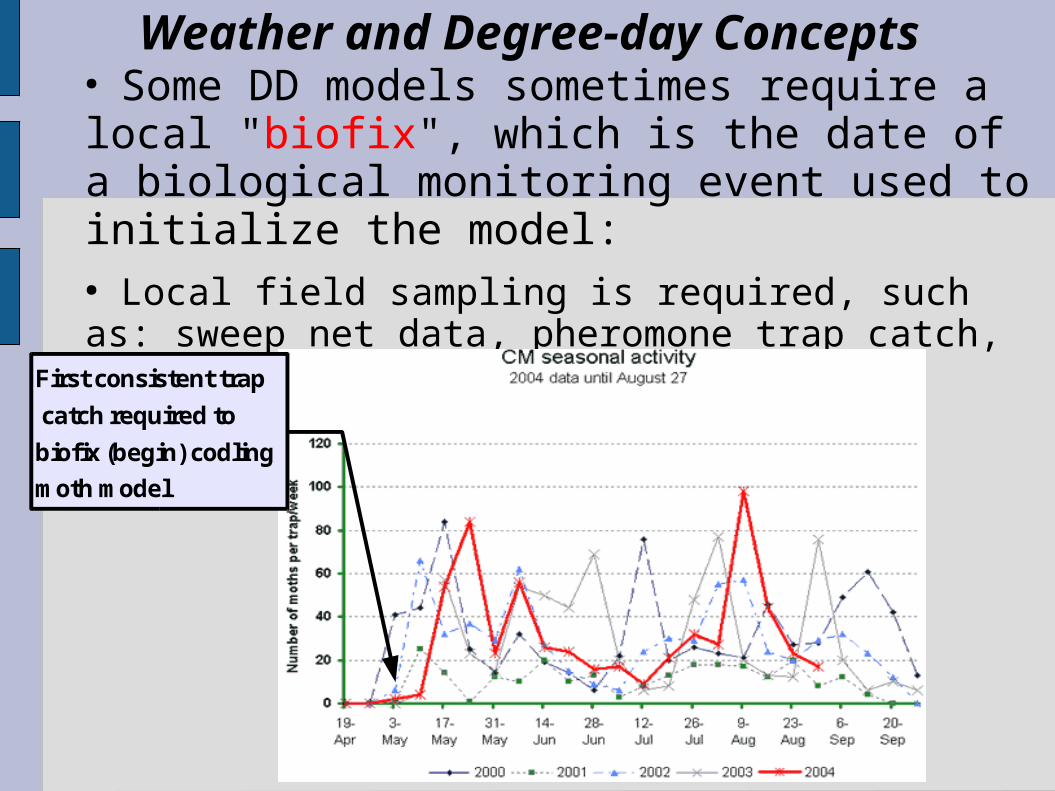
Weather and Degree-day Concepts● Some DD models sometimes require a local "biofix", which is the date of a biological monitoring event used to initialize the model:● Local field sampling is required, such as: sweep net data, pheromone trap catch, etc.
First consistent trap
catch required to
biofix (begin) codling
moth model

IPPC weather data homepage (http://pnwpest.org/wea)
Degree-day maps
Degree-day
calculator and
models
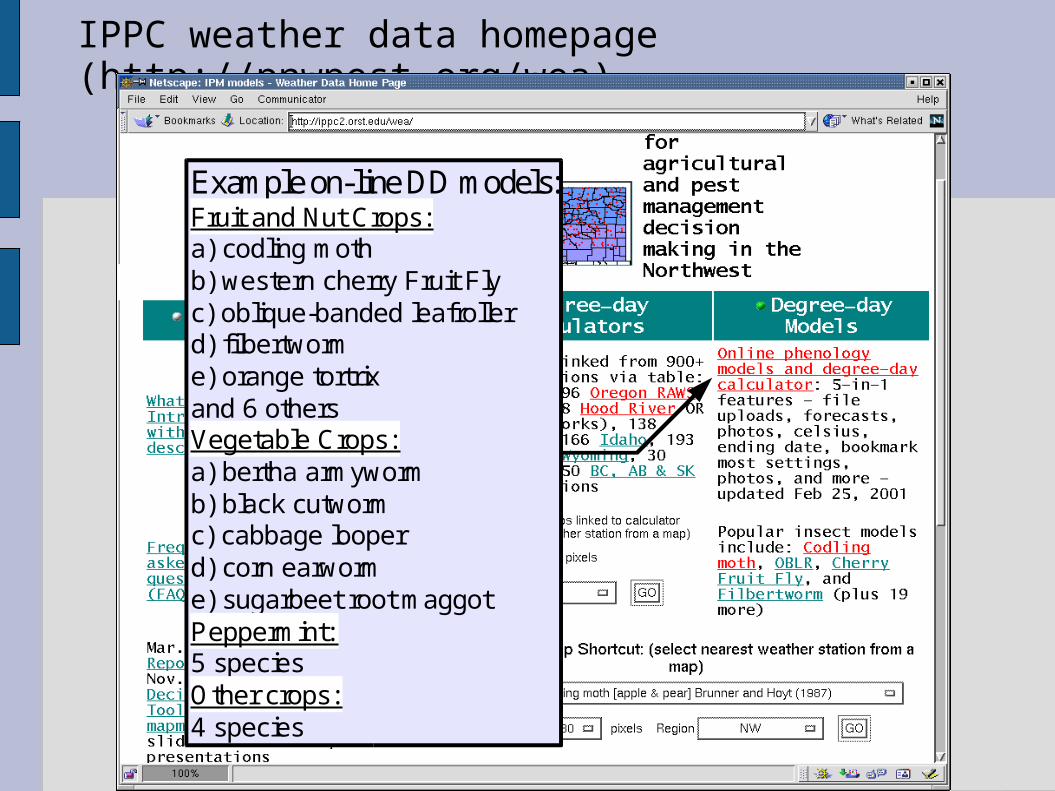
IPPC weather data homepage (http://pnwpest.org/wea)
Example on-line DD models:Fruit and Nut Crops:a) codling mothb) western cherry Fruit Flyc) oblique-banded leafrollerd) filbertworme) orange tortrixand 6 othersVegetable Crops:a) bertha armywormb) black cutwormc) cabbage looperd) corn earworme) sugarbeet root maggotPeppermint:5 speciesOther crops:4 species
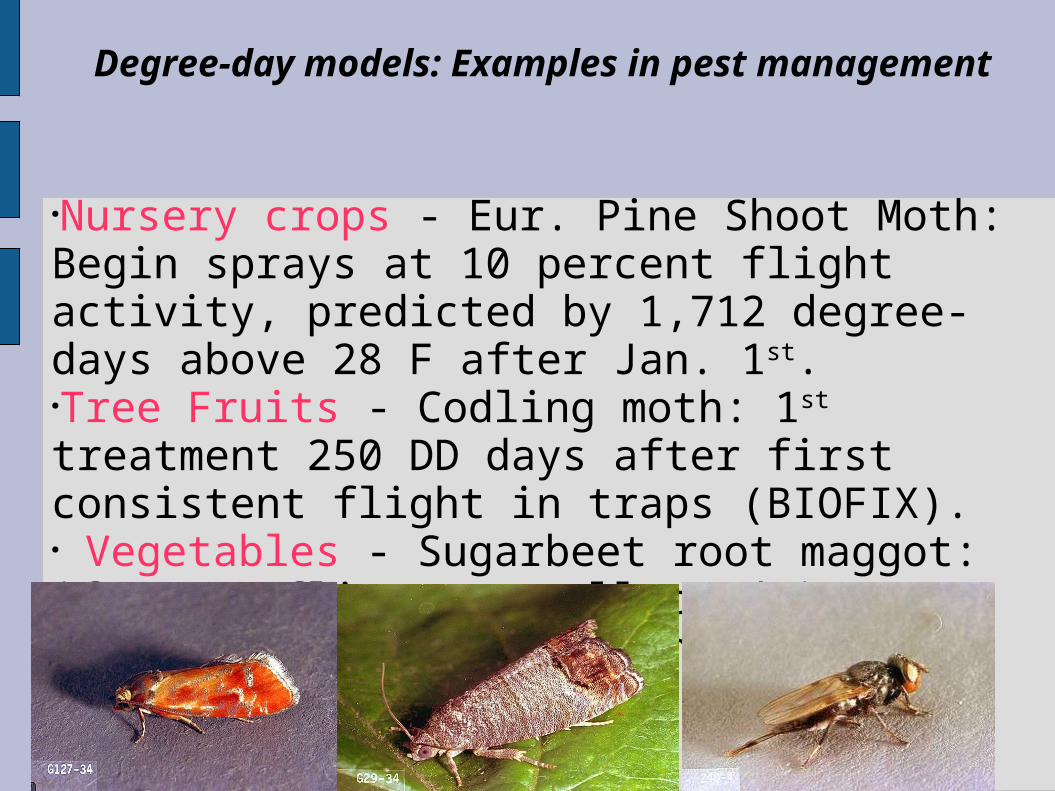
Degree-day models: Examples in pest management
●Nursery crops - Eur. Pine Shoot Moth: Begin sprays at 10 percent flight activity, predicted by 1,712 degree-days above 28 F after Jan. 1st.●Tree Fruits - Codling moth: 1st treatment 250 DD days after first consistent flight in traps (BIOFIX).● Vegetables - Sugarbeet root maggot: if 40-50 flies are collected in traps by 360 DD from March 1 then treat.
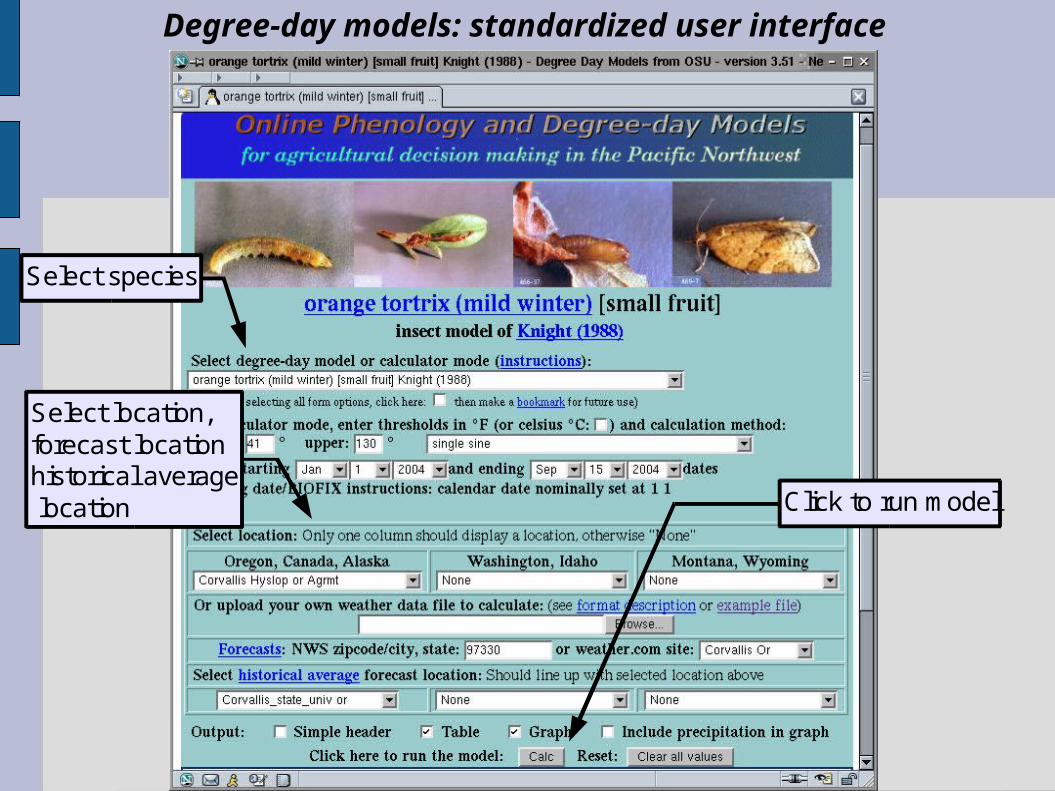
Degree-day models: standardized user interface
Select species
Select location,forecast locationhistorical average location Click to run model
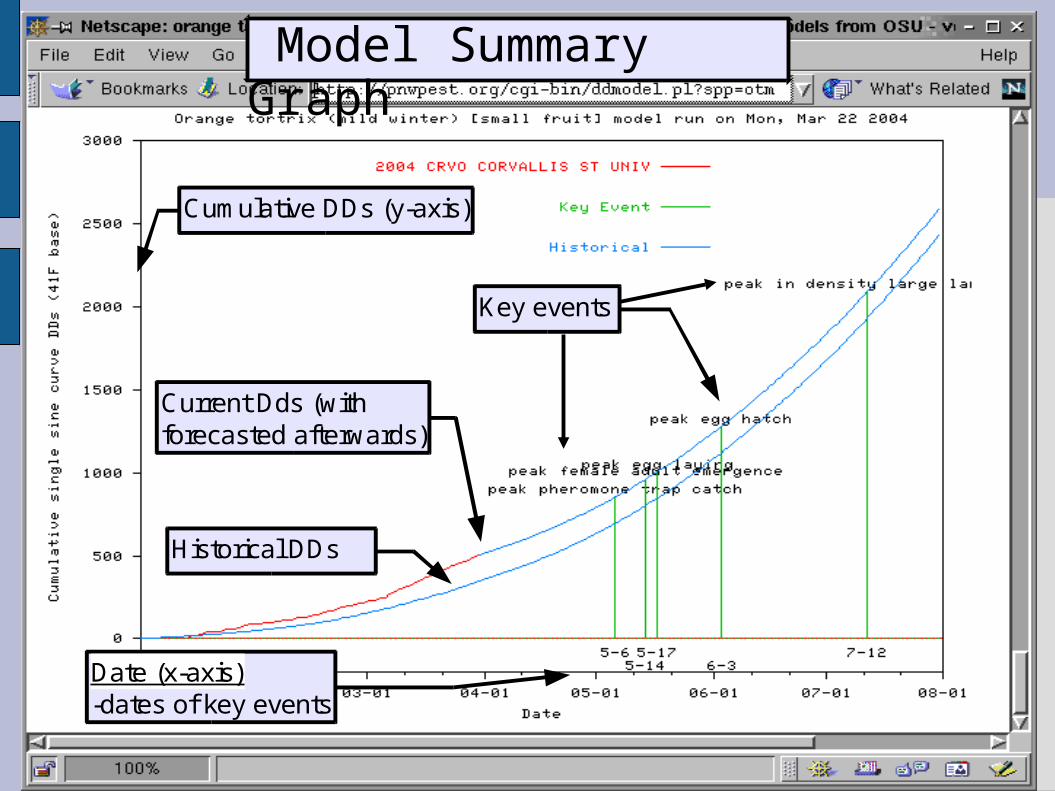
Model Summary Graph
Cumulative DDs (y-axis)
Current Dds (with forecasted afterwards)
Historical DDs
Date (x-axis)-dates of key events
Key events

Key events table:-cumulative DDs-name of event
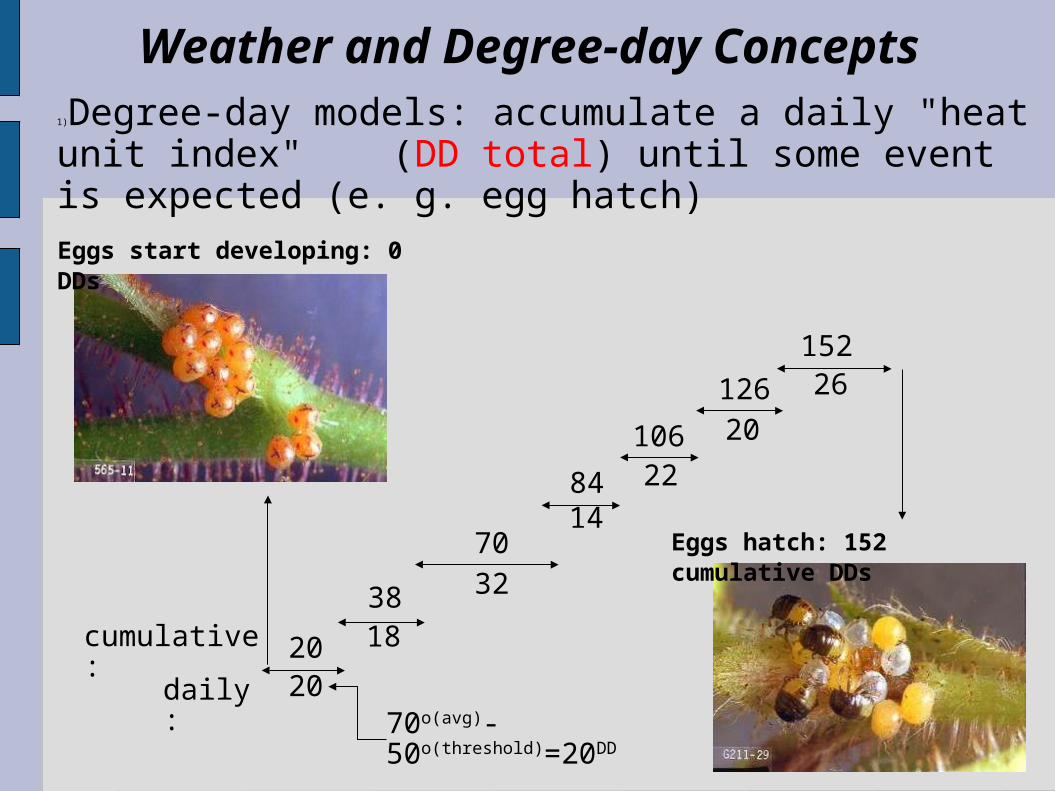
Degree-day models: Orange tortrix example
Model outputs:-month, day, max, min-precipitation-daily and cumulative Dds-events
Model inputs:-links to documentation-model description-validation status

Model outputs:-month, day, max, min-precipitation-daily and cumulative Dds-events
Degree-day models: Orange tortrix example (cont.)

Forecasted weather link into the system: 1) weather.com 45 sites (10-day) 2) NWS zone forecasts entire US (7-day)
Degree-day models: forecast weather

Thinking in degree-days: Predator mites example - very little activity Oct-Mar (Oct-Apr in C. OR)
Jan Feb Mar Apr May Jun Jul Aug Sep Oct Nov Dec0
50
100
150
200
250
300
350
Predator mite avg DDs/month - W. OR
De
gre
e-d
ays/
mo
nth
http://pnwpest.org/cgi-bin/ddmodel.pl?spp=nfa
Active Period
Jan Feb Mar Apr May Jun Jul Aug Sep Oct Nov Dec0
50
100
150
200
250
300
350
400
Predator mite avg DDs/month - Bend OR
Active Period

New version of US Degree-day mapping calculator
1. Specify all regions and each state in 48-state US2. Uses all 3200+ US weather stations (current year)3. Makes maps for current year, last year, diffs from last year, hist. Avg, diffs from hist. Avg maps

New version of US Degree-day mapping calculator
4. Animated show of steps used to create degree-day maps

New version of US Degree - day mapping calculator
5. Revised GRASSLinks interface6. Improved map legends
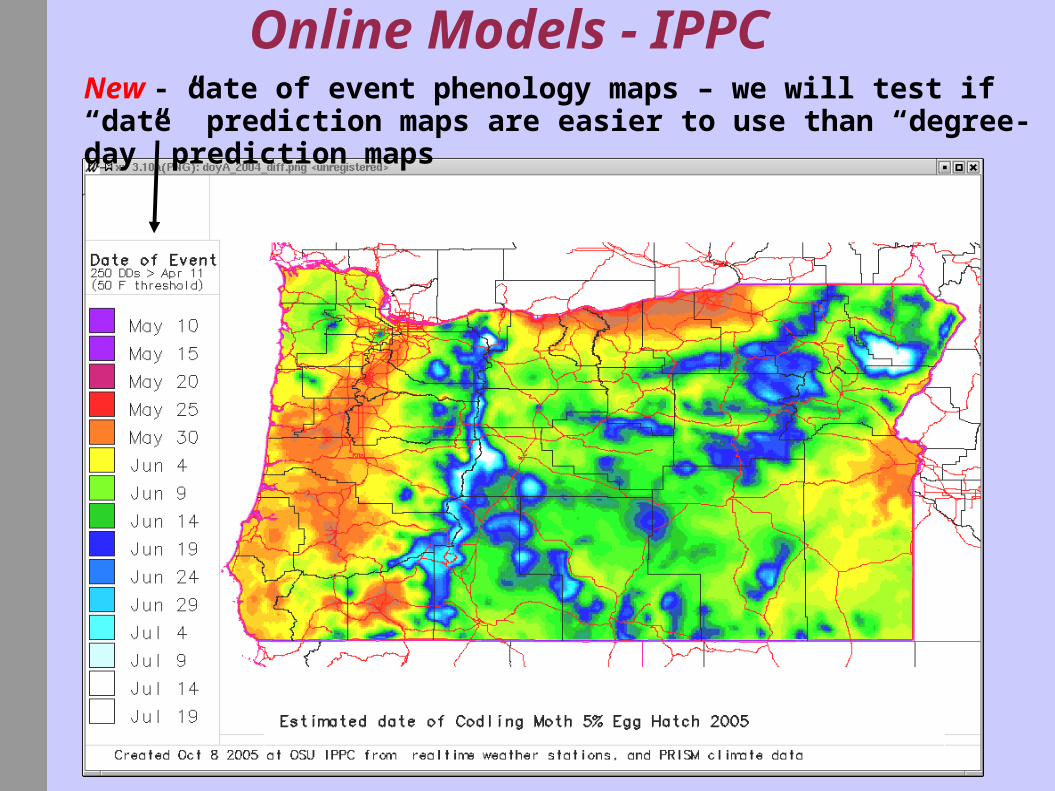
Online Models - IPPCNew - date of event phenology maps – we will test if “date” prediction maps are easier to use than “degree-day” prediction maps
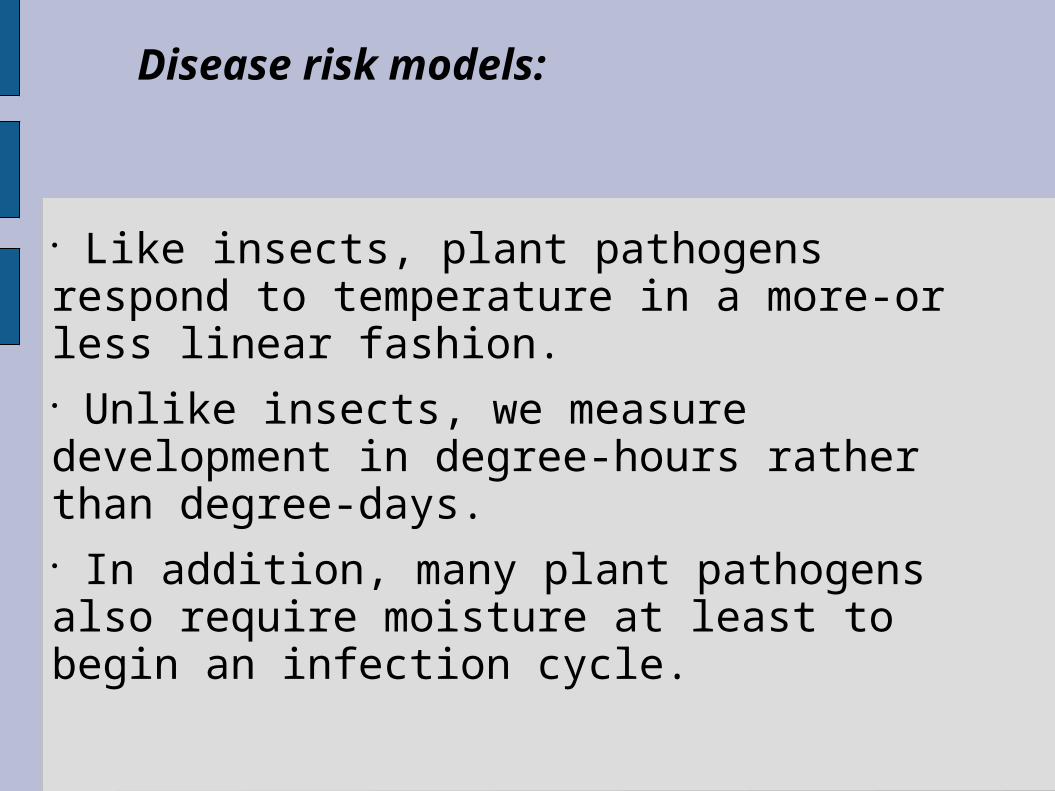
Disease risk models:
• Like insects, plant pathogens respond to temperature in a more-or less linear fashion. • Unlike insects, we measure development in degree-hours rather than degree-days.• In addition, many plant pathogens also require moisture at least to begin an infection cycle.
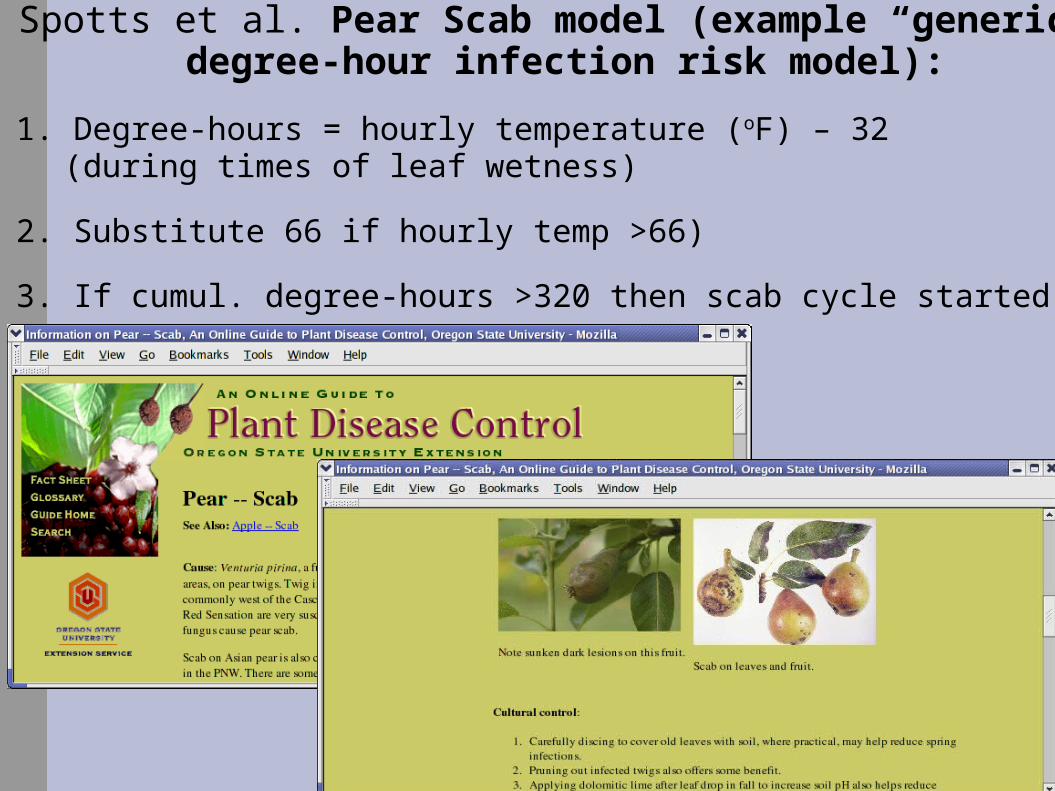
Spotts et al. Pear Scab model (example “generic” degree-hour infection risk model):
1. Degree-hours = hourly temperature (oF) – 32(during times of leaf wetness)
2. Substitute 66 if hourly temp >66)
3. If cumul. degree-hours >320 then scab cycle started
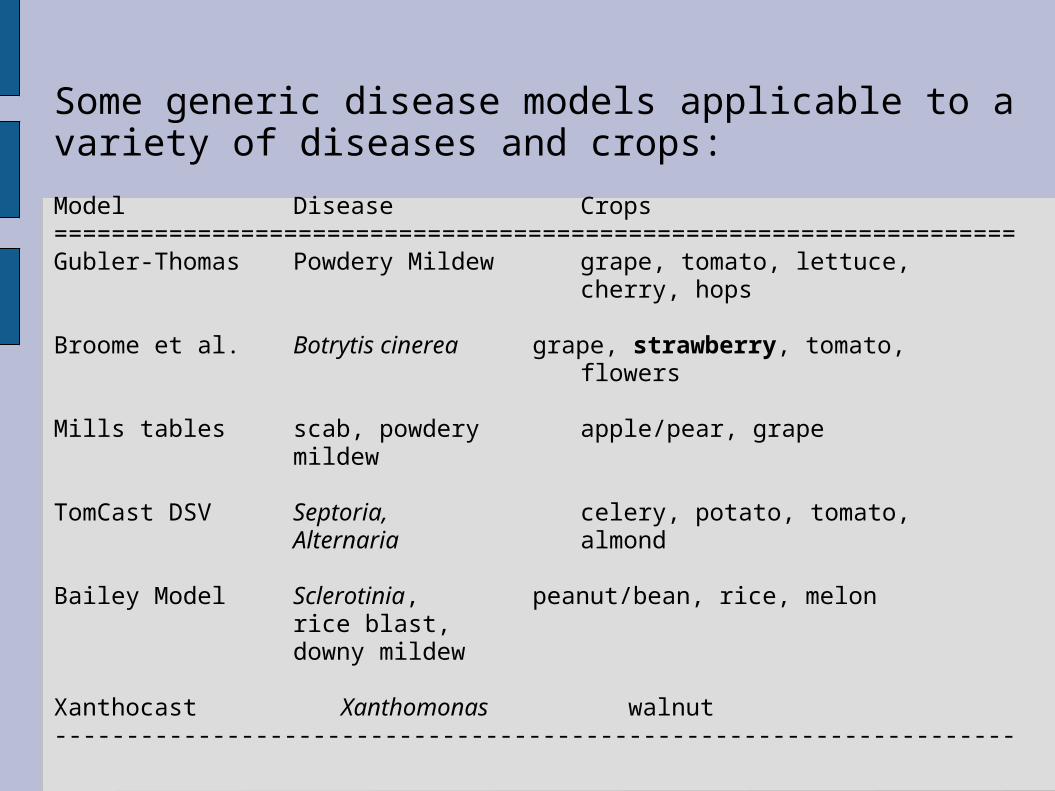
Some generic disease models applicable to a variety of diseases and crops:
Model Disease Crops===================================================================Gubler-Thomas Powdery Mildew grape, tomato, lettuce,
cherry, hops
Broome et al. Botrytis cinerea grape, strawberry, tomato,flowers
Mills tables scab, powdery apple/pear, grapemildew
TomCast DSV Septoria, celery, potato, tomato, Alternaria almond
Bailey Model Sclerotinia, peanut/bean, rice, melon rice blast,
downy mildew
Xanthocast Xanthomonas walnut-------------------------------------------------------------------
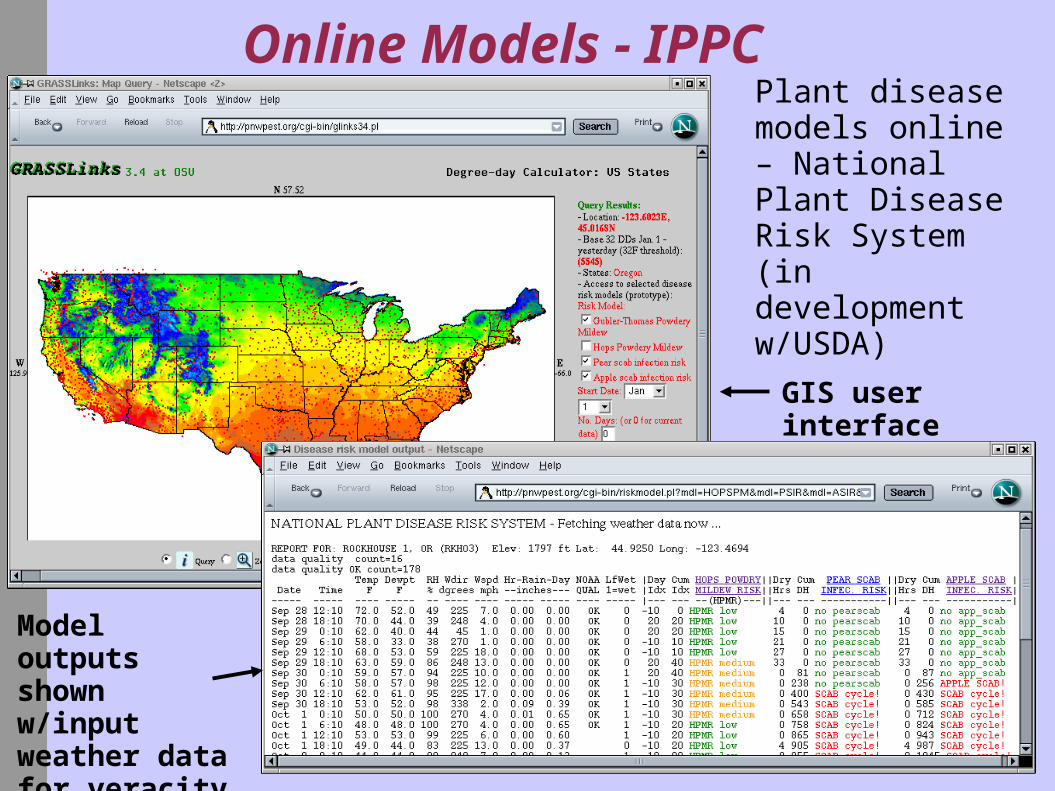
Online Models - IPPCPlant disease models online – National Plant Disease Risk System (in development w/USDA)
Model outputs shown w/input weather data for veracity
GIS user interface
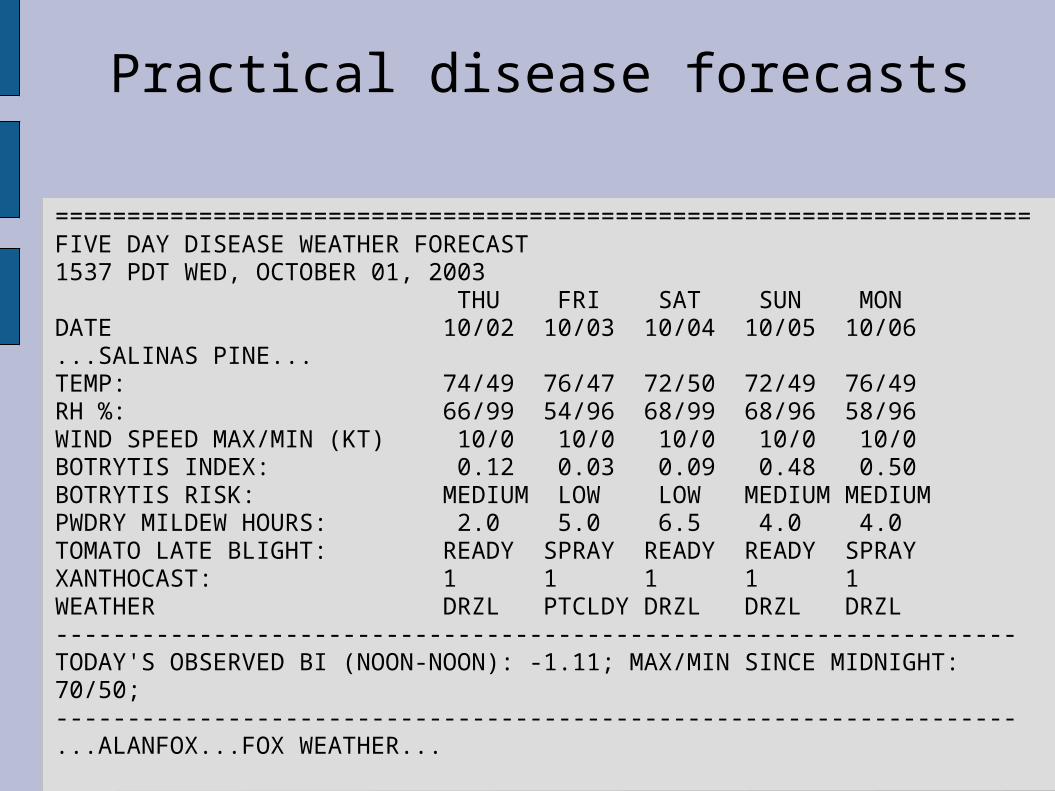
Practical disease forecasts
====================================================================FIVE DAY DISEASE WEATHER FORECAST1537 PDT WED, OCTOBER 01, 2003 THU FRI SAT SUN MONDATE 10/02 10/03 10/04 10/05 10/06...SALINAS PINE...TEMP: 74/49 76/47 72/50 72/49 76/49RH %: 66/99 54/96 68/99 68/96 58/96WIND SPEED MAX/MIN (KT) 10/0 10/0 10/0 10/0 10/0BOTRYTIS INDEX: 0.12 0.03 0.09 0.48 0.50BOTRYTIS RISK: MEDIUM LOW LOW MEDIUM MEDIUMPWDRY MILDEW HOURS: 2.0 5.0 6.5 4.0 4.0TOMATO LATE BLIGHT: READY SPRAY READY READY SPRAYXANTHOCAST: 1 1 1 1 1WEATHER DRZL PTCLDY DRZL DRZL DRZL-------------------------------------------------------------------TODAY'S OBSERVED BI (NOON-NOON): -1.11; MAX/MIN SINCE MIDNIGHT: 70/50;-------------------------------------------------------------------...ALANFOX...FOX WEATHER...

● Pest models provide quantitative estimates of pest activity and behavior (often hard to detect): they can take much of the guess work out of timing control measures● Pest models are expected to become NRCS cost share approved practices for certain crops and pests, proper spray timing is a recognized pesticide risk mitigation practice● Models can be tied to local biological and weather inputs for custom predictions, and account for local population variations and terrain differences● Models can be tied to forecasted weather to predict future events
Why weather-driven models for IPM?
Related Documents