WEATHER MAPS Climate & Weather Climate & Weather

WEATHER MAPS
Dec 30, 2015
WEATHER MAPS. Climate & Weather. Weather Maps. Weather is the state of the atmosphere at any one place or time . This includes: humidity, temperature, sunshine hours, cloud cover, precipitation. - PowerPoint PPT Presentation
Welcome message from author
This document is posted to help you gain knowledge. Please leave a comment to let me know what you think about it! Share it to your friends and learn new things together.
Transcript
WEATHER MAPS
Climate & WeatherClimate & Weather
Weather and Climate Weather is the state
of the atmosphere at any one place or time. This includes: humidity, temperature, sunshine hours, cloud cover, precipitation.
Climate is the average or long term weather conditions of a region. It is the result of years of research into data.
Barometric pressure
• Barometric pressure or atmospheric pressure is the pressure exerted by the weight of the air on the earth’s surface.
• Atmospheric pressure is measured in hectopascals (hPa).
• Atmospheric pressure is mapped to form isobars.
Isobars
• Are lines on a synoptic chart joining places of equal atmospheric pressure.
• To estimate atmospheric pressure you need to refer to the two nearest isobars. e.g. if point “A” is situated half way between 1006 hPa and 1008 hPa, “A” would be > 1006 but < 1008 hPa.
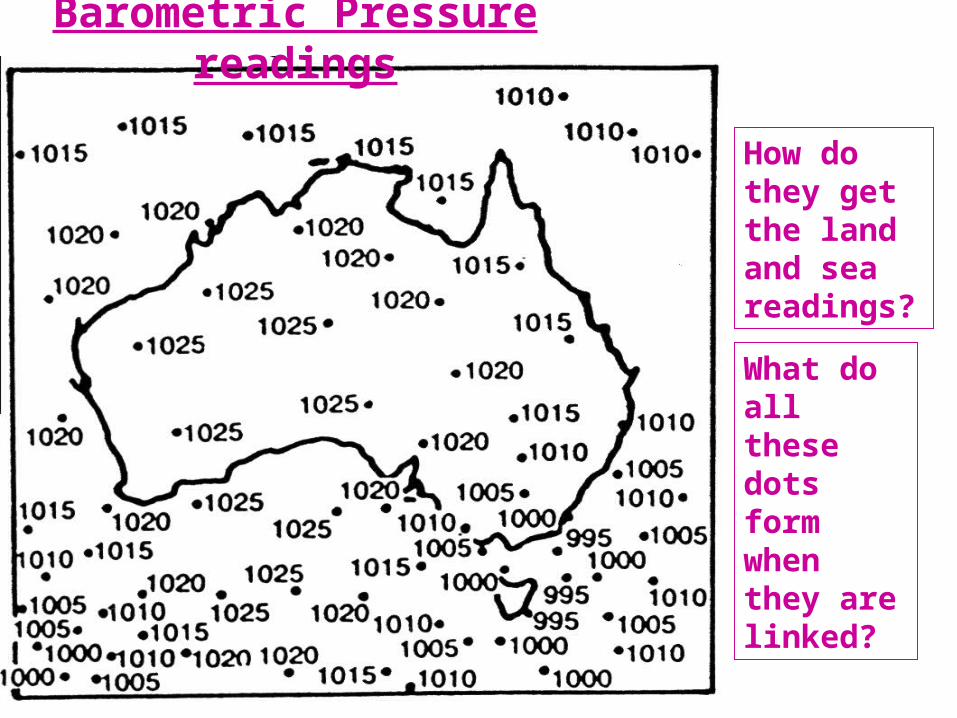
Barometric Pressure readings
How do they get the land and sea readings?
What do all these dots form when they are linked?
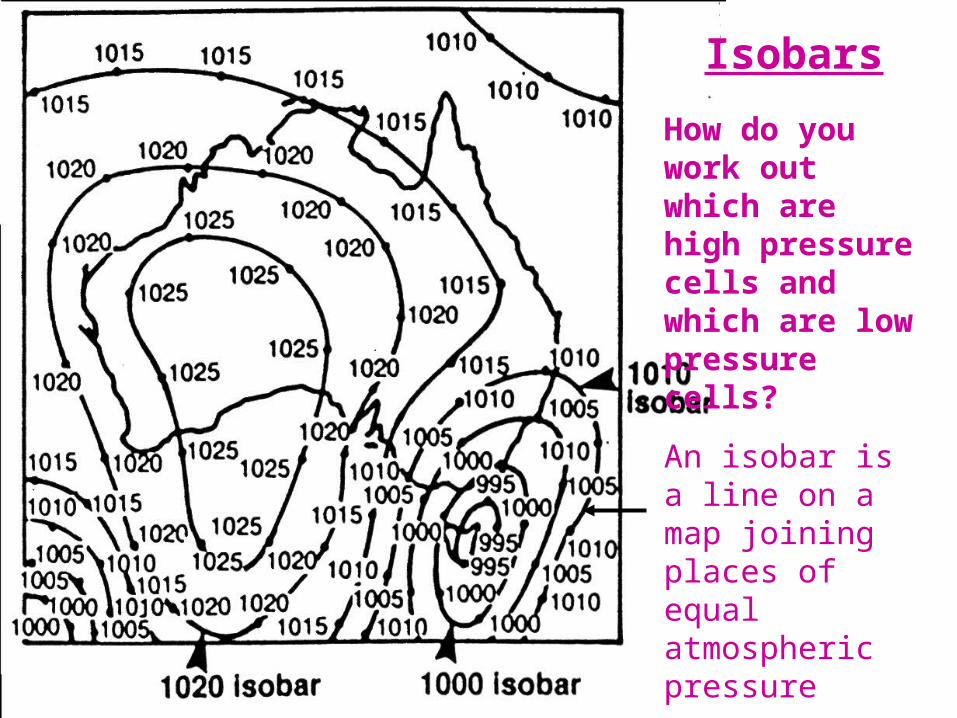
Isobars
How do you work out which are high pressure cells and which are low pressure cells?
An isobar is a line on a map joining places of equal atmospheric pressure
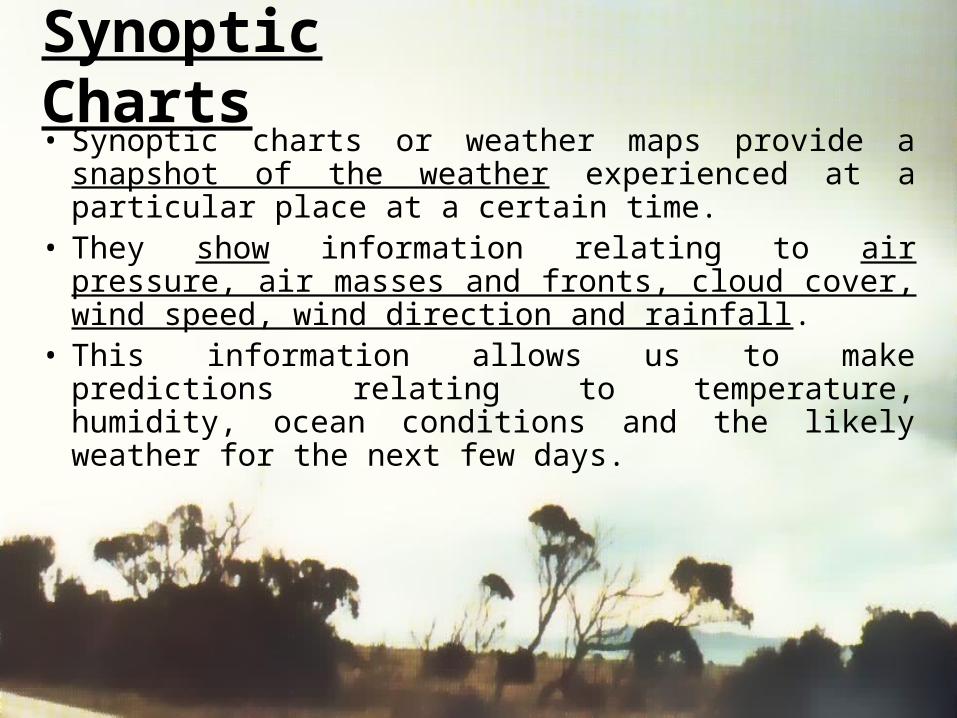
Synoptic Charts• Synoptic charts or weather maps provide a snapshot of
the weather experienced at a particular place at a certain time.
• They show information relating to air pressure, air masses and fronts, cloud cover, wind speed, wind direction and rainfall.
• This information allows us to make predictions relating to temperature, humidity, ocean conditions and the likely weather for the next few days.
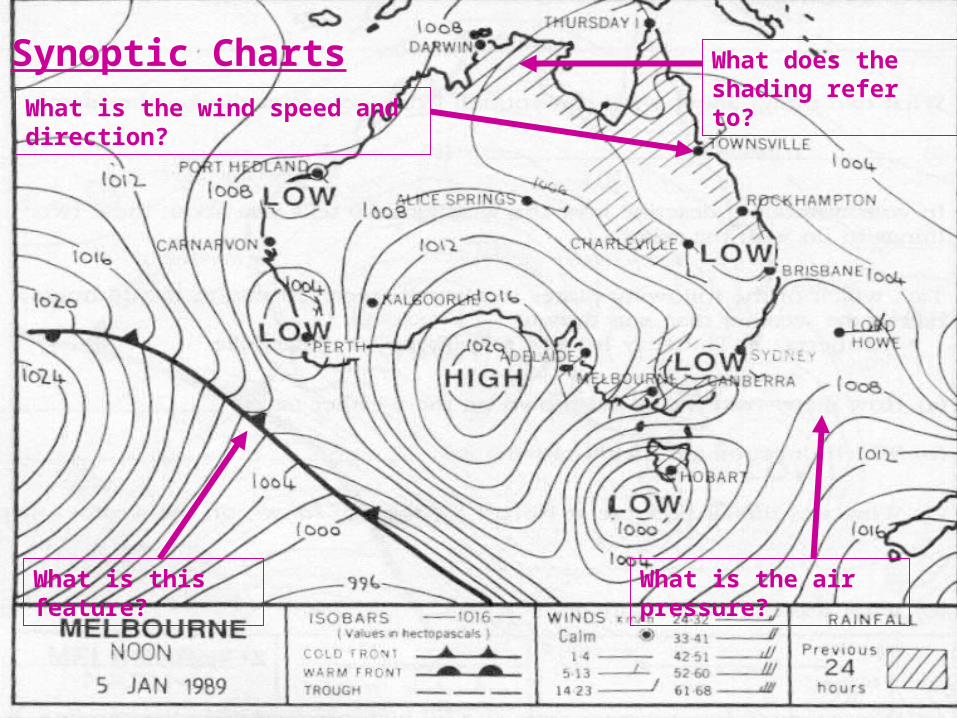
Synoptic ChartsSynoptic Charts
What is this feature?
What does the shading refer to?
What is the wind speed and direction?
What is the air pressure?

Pressure cells - are defined by the patterns formed by isobars. •Are these high pressure cell s or a low pressure cells?
•How can you tell?
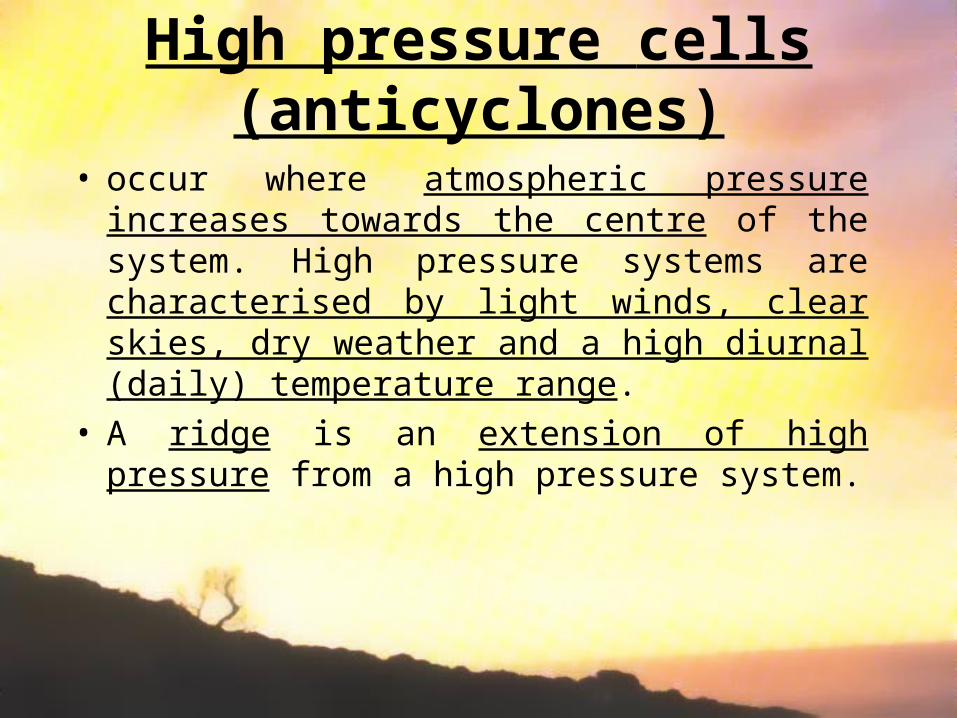
High pressure cells (anticyclones)
• occur where atmospheric pressure increases towards the centre of the system. High pressure systems are characterised by light winds, clear skies, dry weather and a high diurnal (daily) temperature range.
• A ridge is an extension of high pressure from a high pressure system.
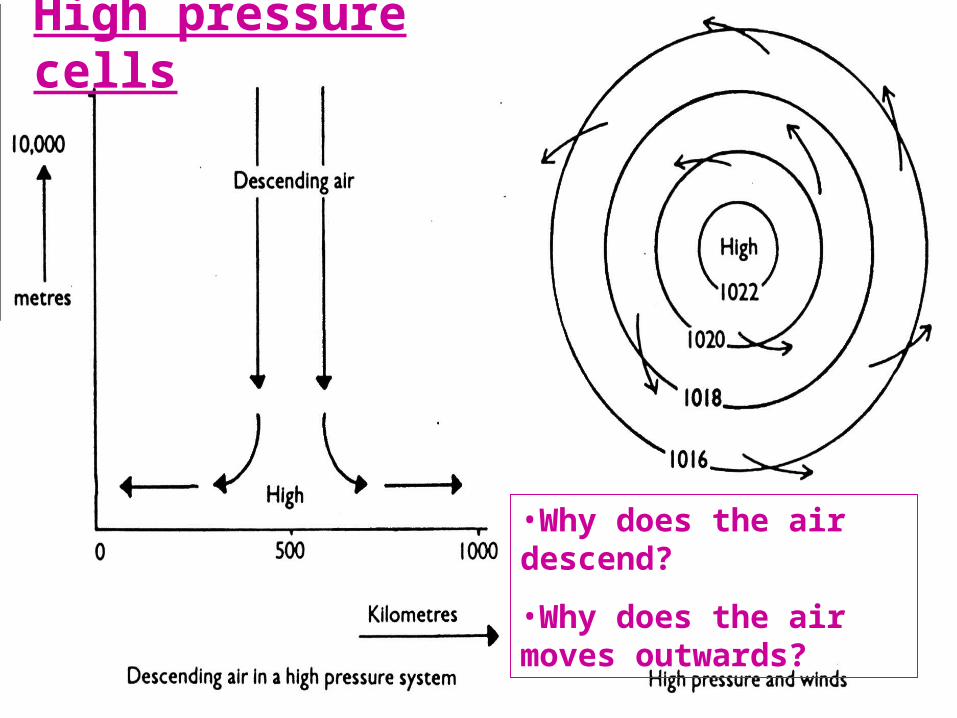
High pressure cells
•Why does the air descend?
•Why does the air moves outwards?
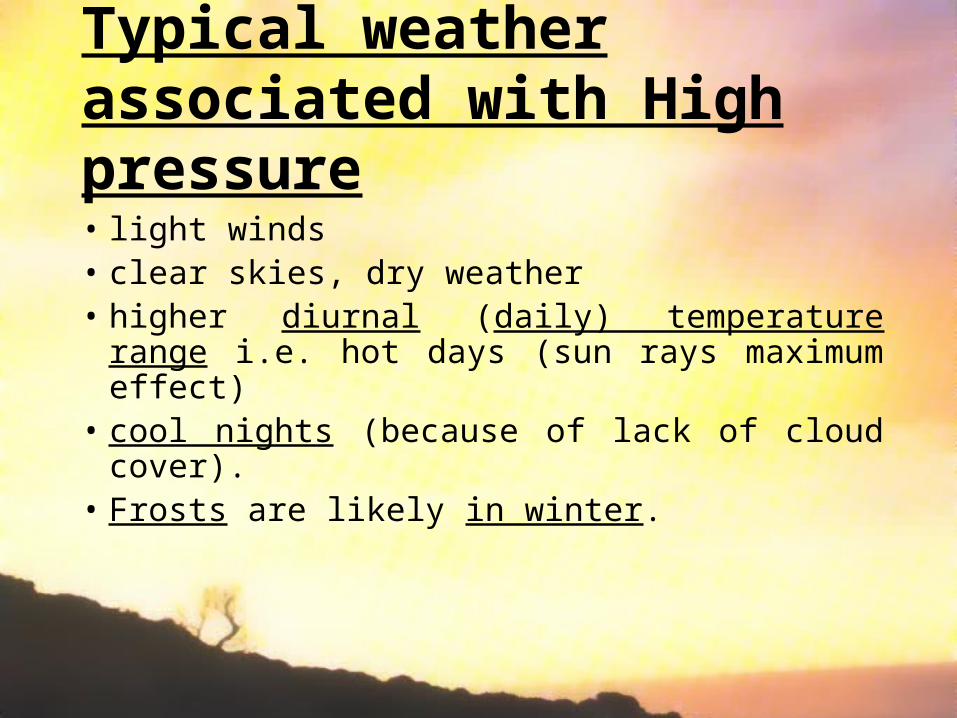
Typical weather associated with High pressure• light winds• clear skies, dry weather • higher diurnal (daily) temperature range i.e.
hot days (sun rays maximum effect) • cool nights (because of lack of cloud cover). • Frosts are likely in winter.

Clear skies allow the sun’s rays to have maximum effect. Daytime temperatures
are usually high.
At night, clear skies allow heat to be lost causing temperatures to fall. In winter frosts are likely.
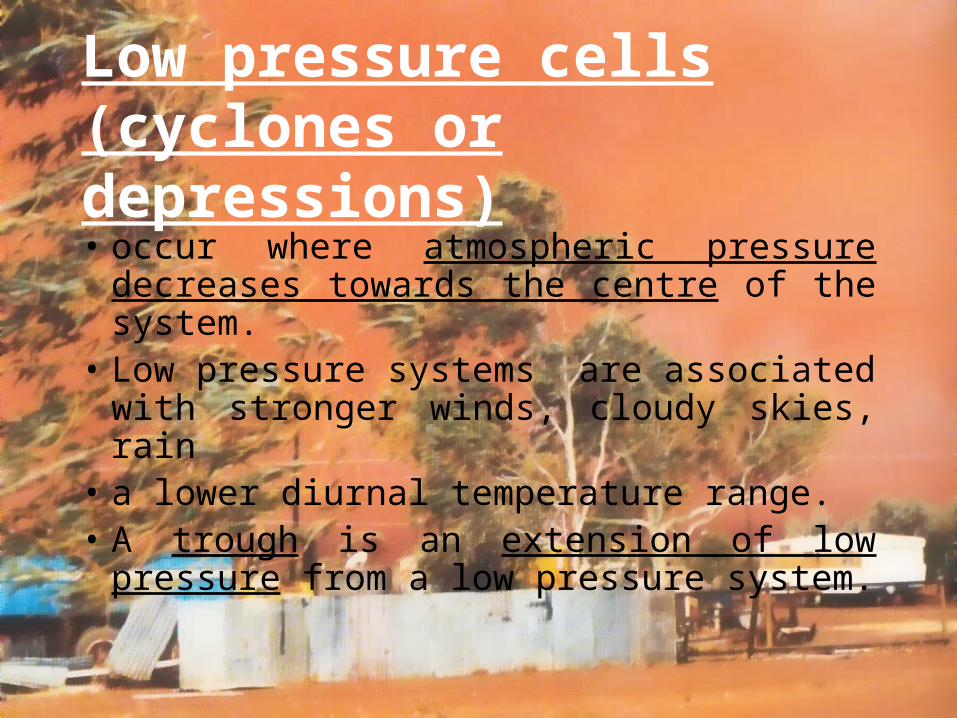
Low pressure cells (cyclones or depressions)• occur where atmospheric pressure
decreases towards the centre of the system.
• Low pressure systems are associated with stronger winds, cloudy skies, rain
• a lower diurnal temperature range. • A trough is an extension of low pressure
from a low pressure system.
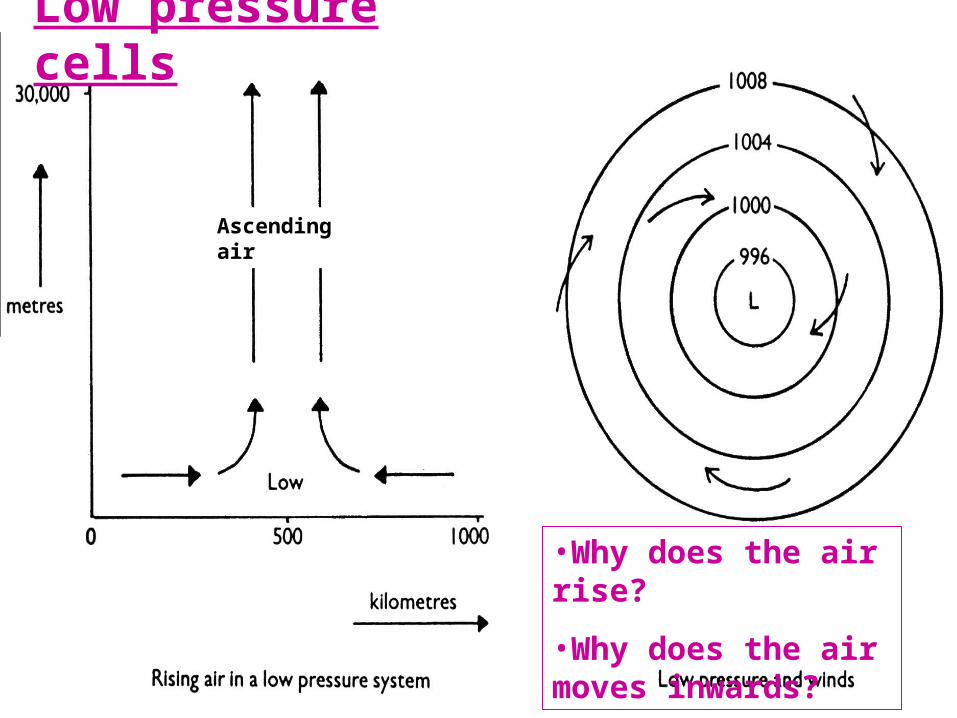
Low pressure cells
Ascending air
•Why does the air rise?
•Why does the air moves inwards?
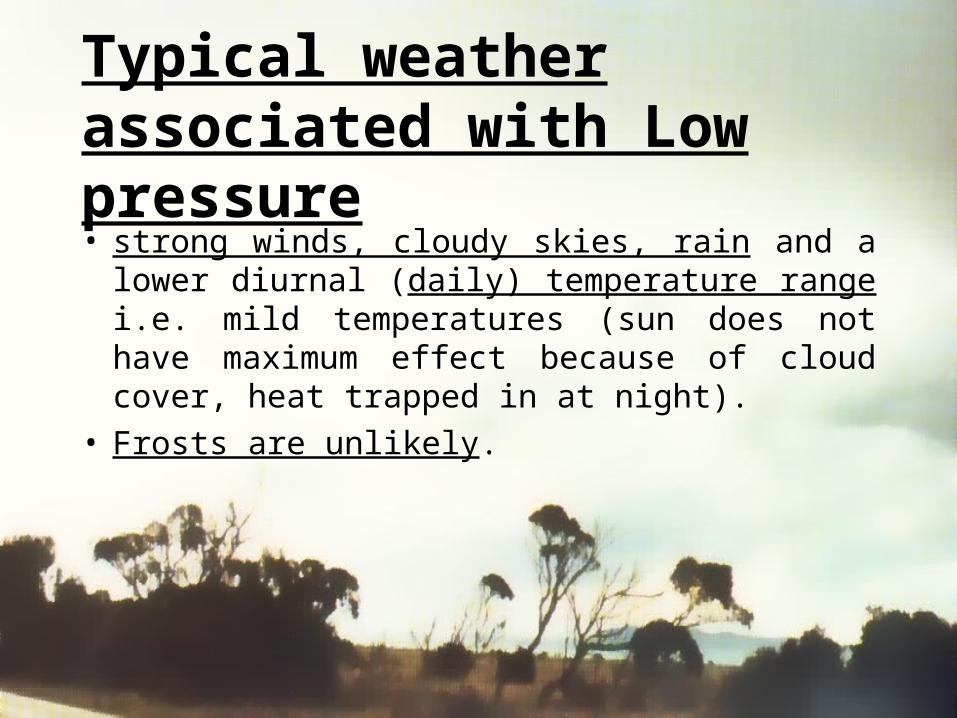
Typical weather associated with Low pressure• strong winds, cloudy skies, rain and a lower
diurnal (daily) temperature range i.e. mild temperatures (sun does not have maximum effect because of cloud cover, heat trapped in at night).
• Frosts are unlikely.
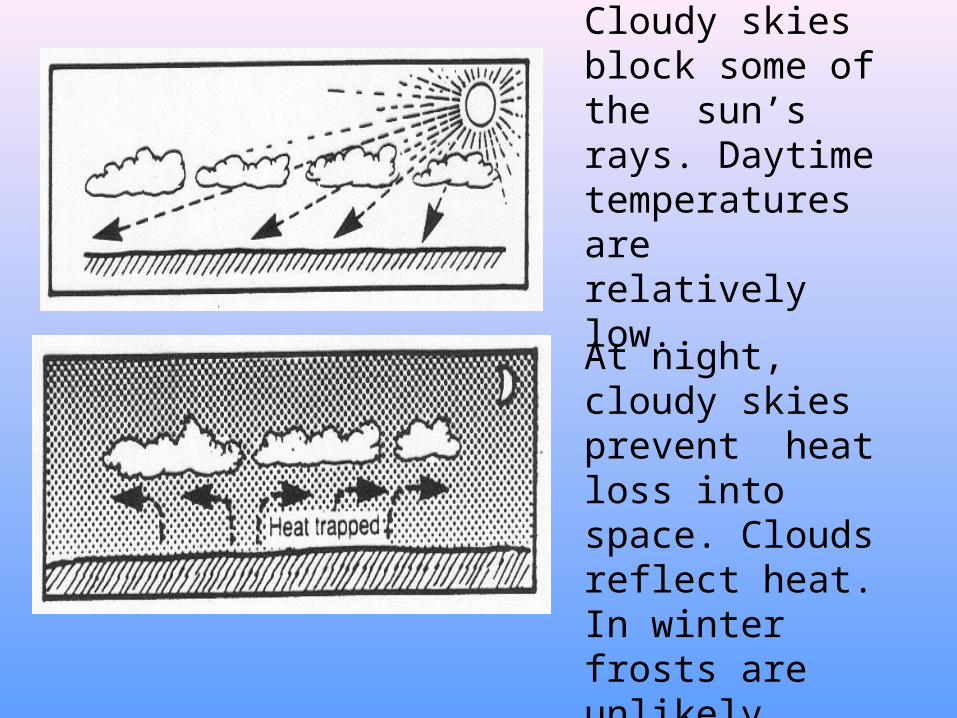
Cloudy skies block some of the sun’s rays. Daytime temperatures are relatively low.
At night, cloudy skies prevent heat loss into space. Clouds reflect heat. In winter frosts are unlikely.
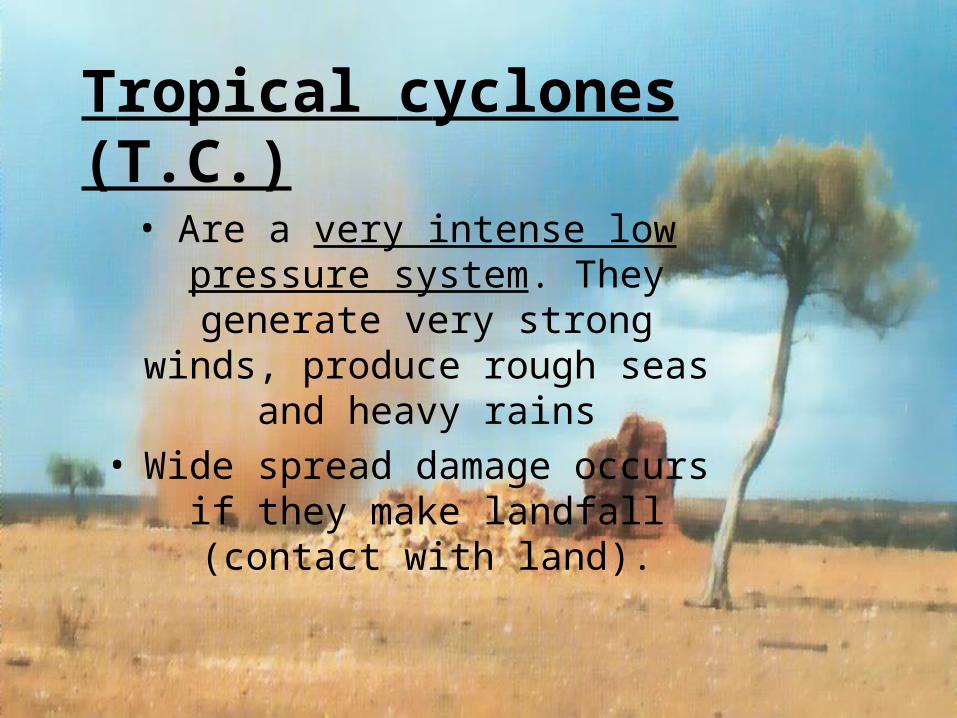
Tropical cyclones (T.C.)
• Are a very intense low pressure system. They generate very strong winds, produce rough
seas and heavy rains
• Wide spread damage occurs if they make landfall (contact with
land).
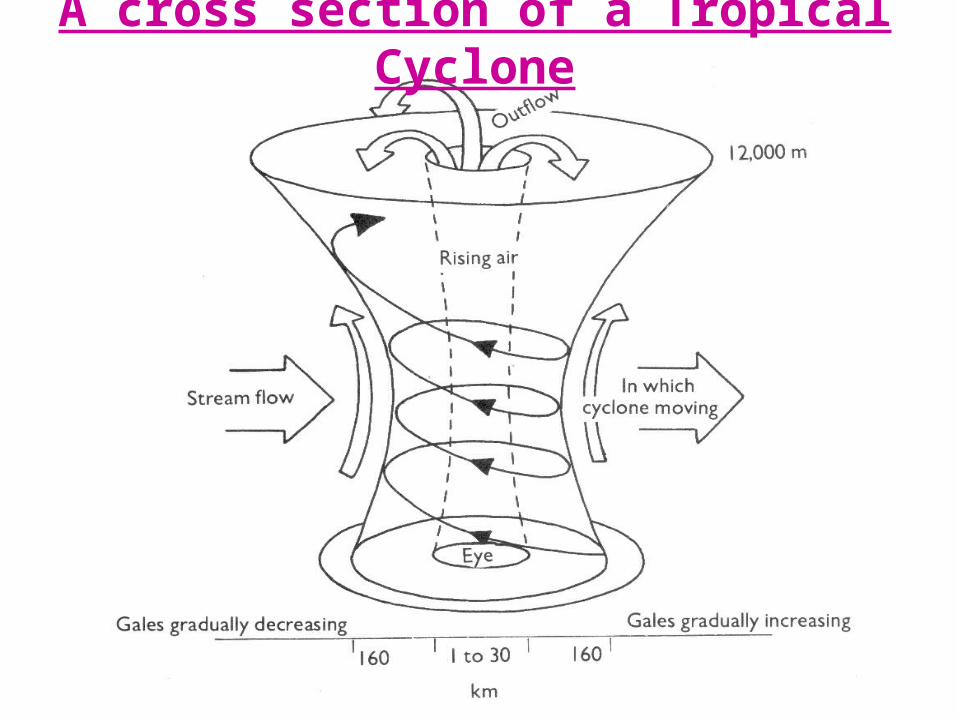
A cross section of a Tropical Cyclone
Wind speed
• is determined by the closeness of the isobars. The closer the isobars the stronger the winds.
• A steep pressure gradient exists where isobars are close together.
• If isobars are far apart a place will generally experience light winds. This is called a slight pressure gradient.

Note the closeness of the isobars
Note the spaced isobars
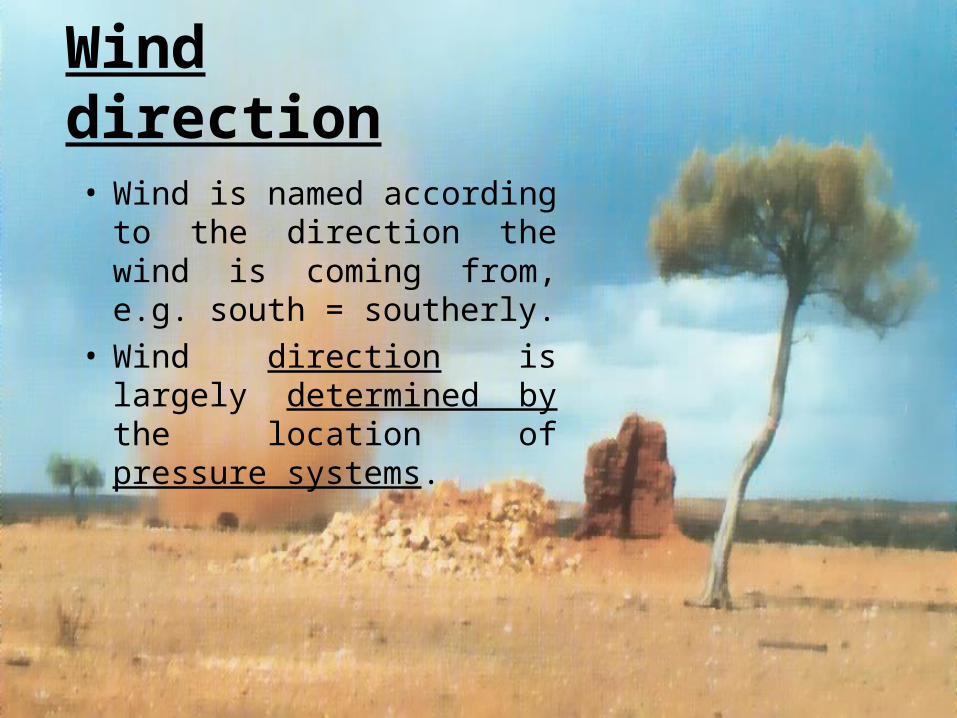
Wind direction
• Wind is named according to the direction the wind is coming from, e.g. south = southerly.
• Wind direction is largely determined by the location of pressure systems.
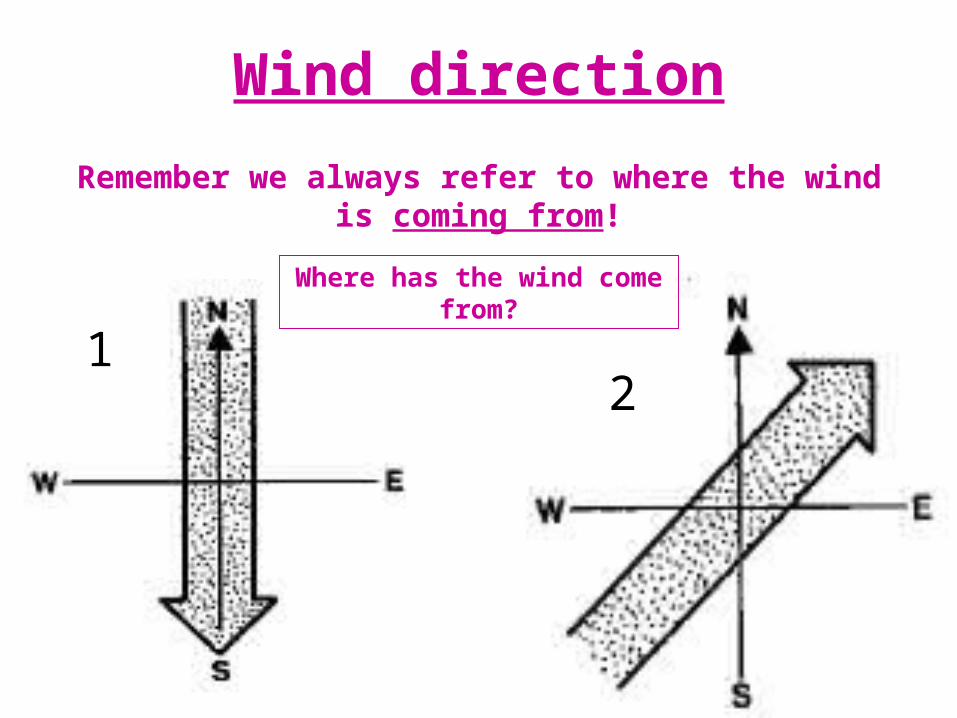
Wind direction
Remember we always refer to where the wind is coming from!
Where has the wind come from?
12
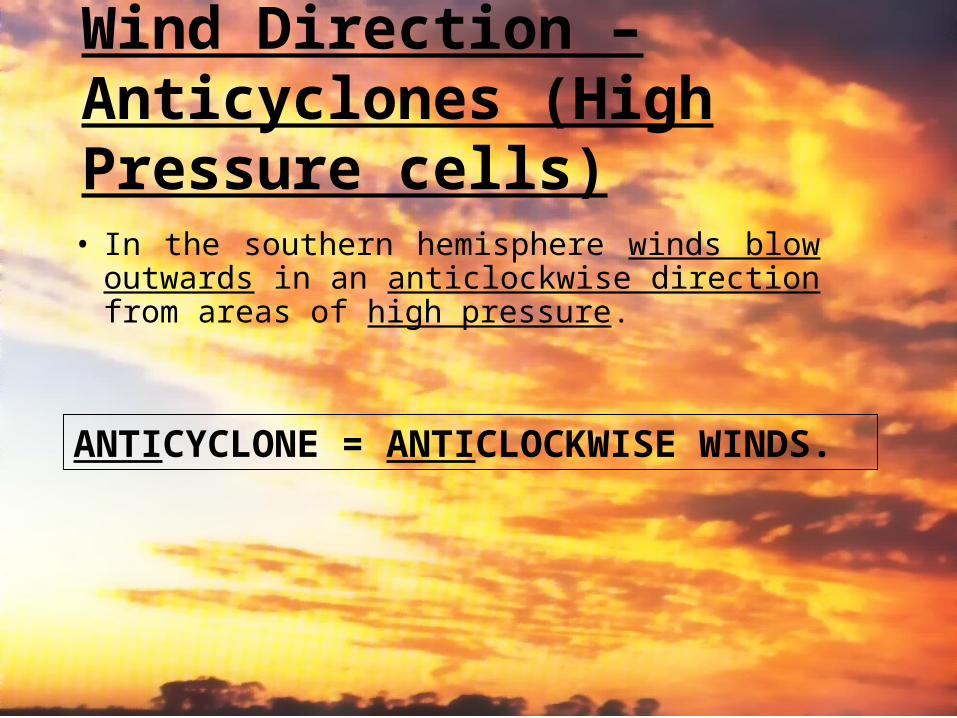
Wind Direction – Anticyclones (High Pressure cells)
• In the southern hemisphere winds blow outwards in an anticlockwise direction from areas of high pressure.
ANTICYCLONE = ANTICLOCKWISE WINDS.
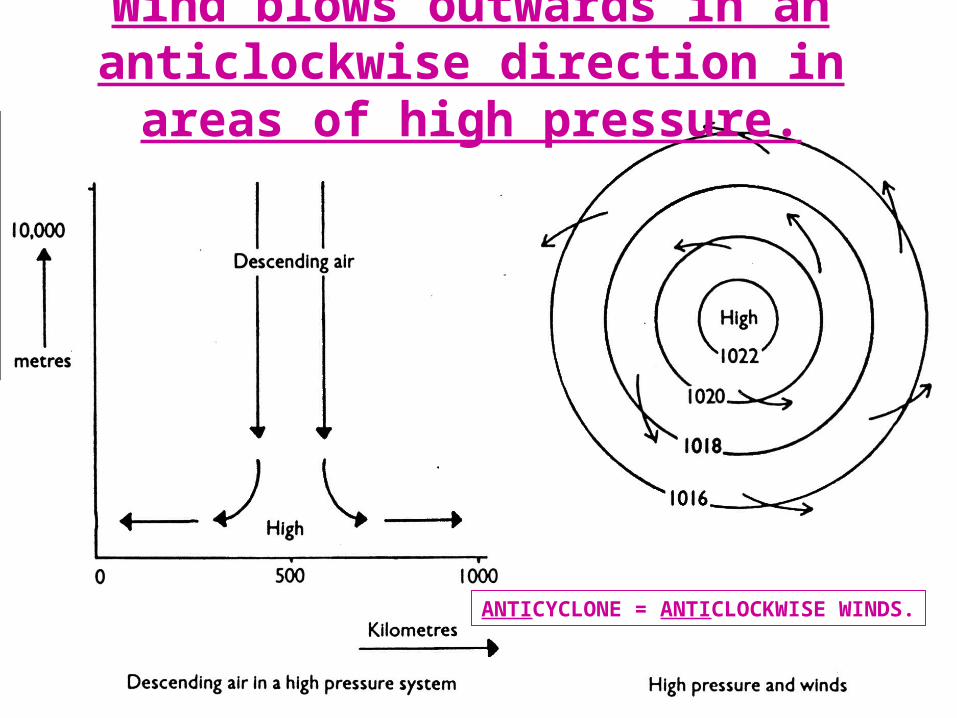
Wind blows outwards in an anticlockwise direction in areas of high pressure.
ANTICYCLONE = ANTICLOCKWISE WINDS.
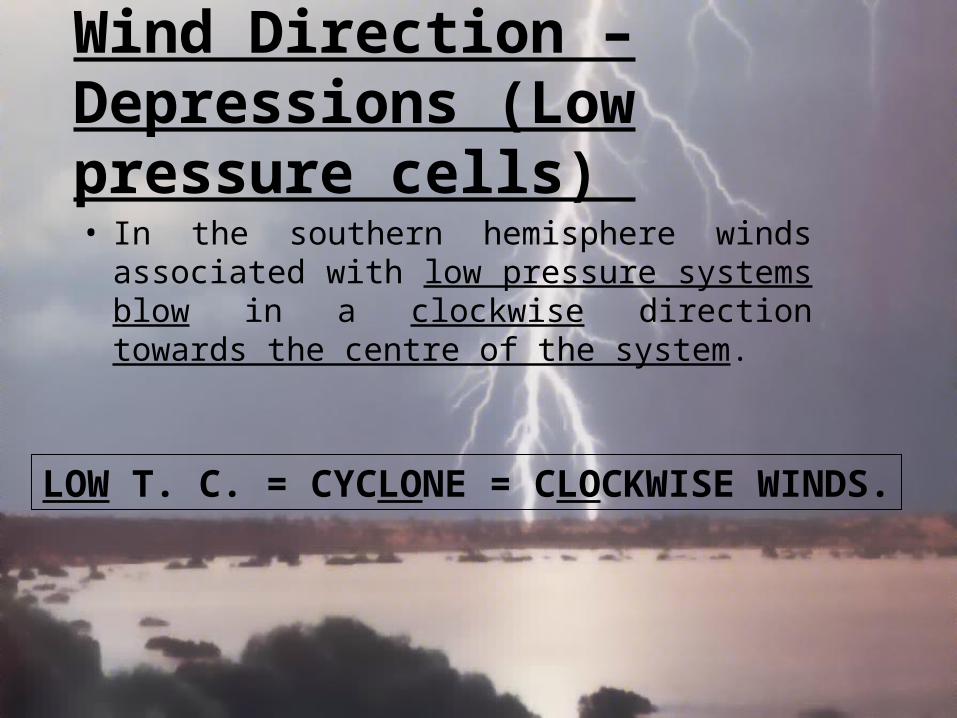
Wind Direction – Depressions (Low pressure cells)
• In the southern hemisphere winds associated with low pressure systems blow in a clockwise direction towards the centre of the system.
LOW T. C. = CYCLONE = CLOCKWISE WINDS.
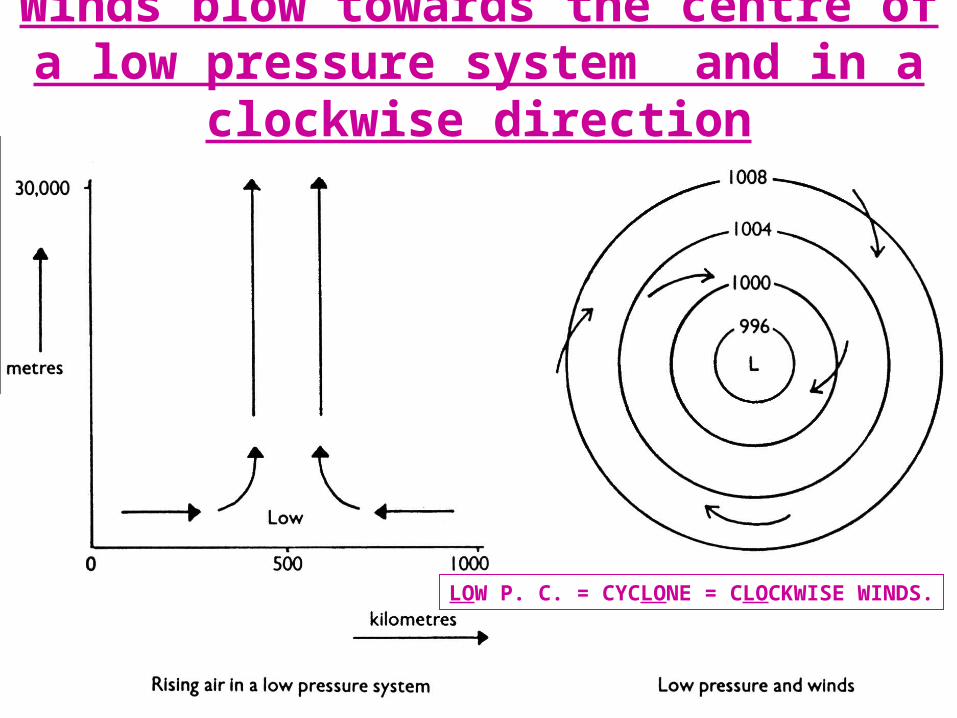
Winds blow towards the centre of a low pressure system and in a clockwise direction
LOW P. C. = CYCLONE = CLOCKWISE WINDS.
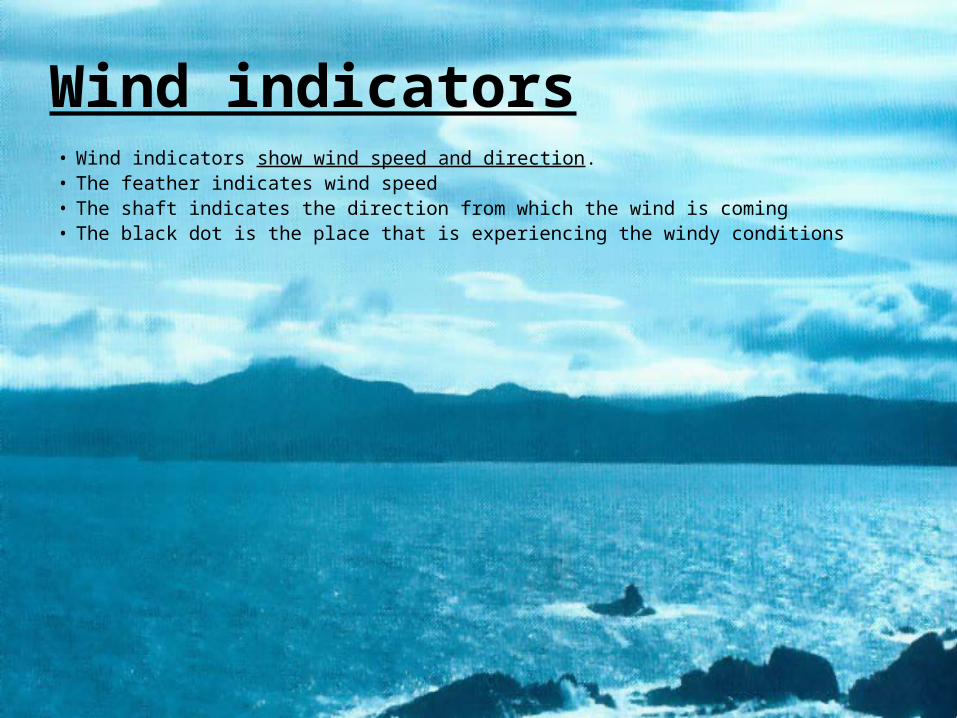
Wind indicators • Wind indicators show wind speed and direction.• The feather indicates wind speed• The shaft indicates the direction from which the wind is coming• The black dot is the place that is experiencing the windy conditions
Identifying wind direction• First - Identify the type of pressure system.• Southern Hemisphere
LOW =clockwise
HIGH = anticlockwise.• (the reverse is true in the northern hemisphere)
• Wind, generally speaking, moves across the isobars
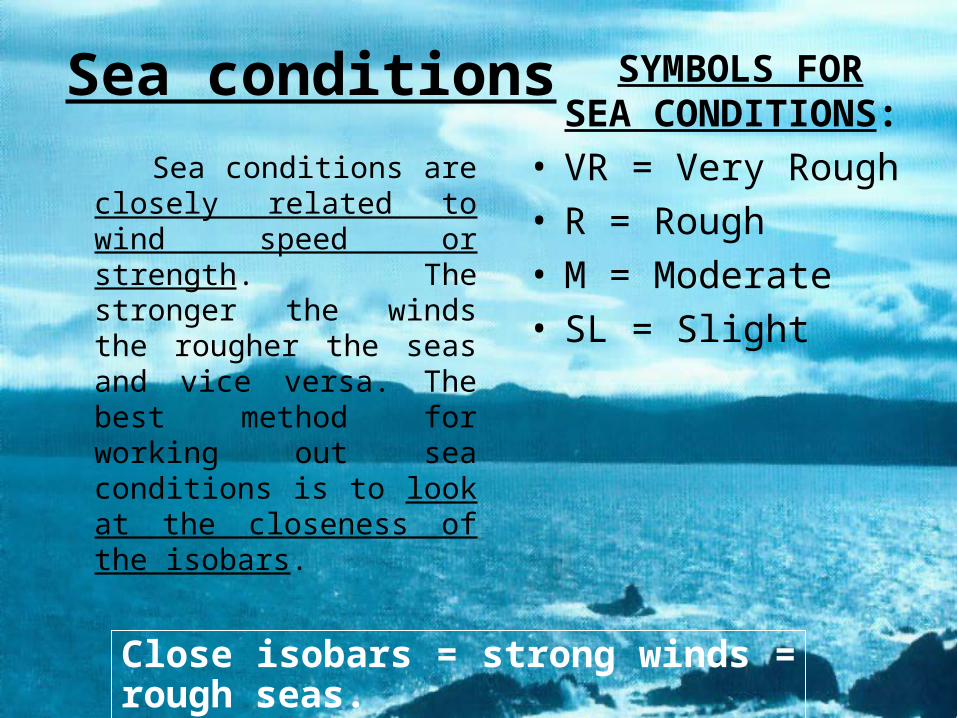
Sea conditions
Sea conditions are closely related to wind speed or strength. The stronger the winds the rougher the seas and vice versa. The best method for working out sea conditions is to look at the closeness of the isobars.
SYMBOLS FOR SEA CONDITIONS:
• VR = Very Rough• R = Rough• M = Moderate• SL = Slight
Close isobars = strong winds = rough seas.
FRONTS
• A front is the leading edge of change. They are the border zone between warm and cold air. There are two types of fronts:
• Warm fronts occur when warm air is pushed into a cold air mass. These are very rare in Australia. They result drizzle and light rain over a few days.

A warm front
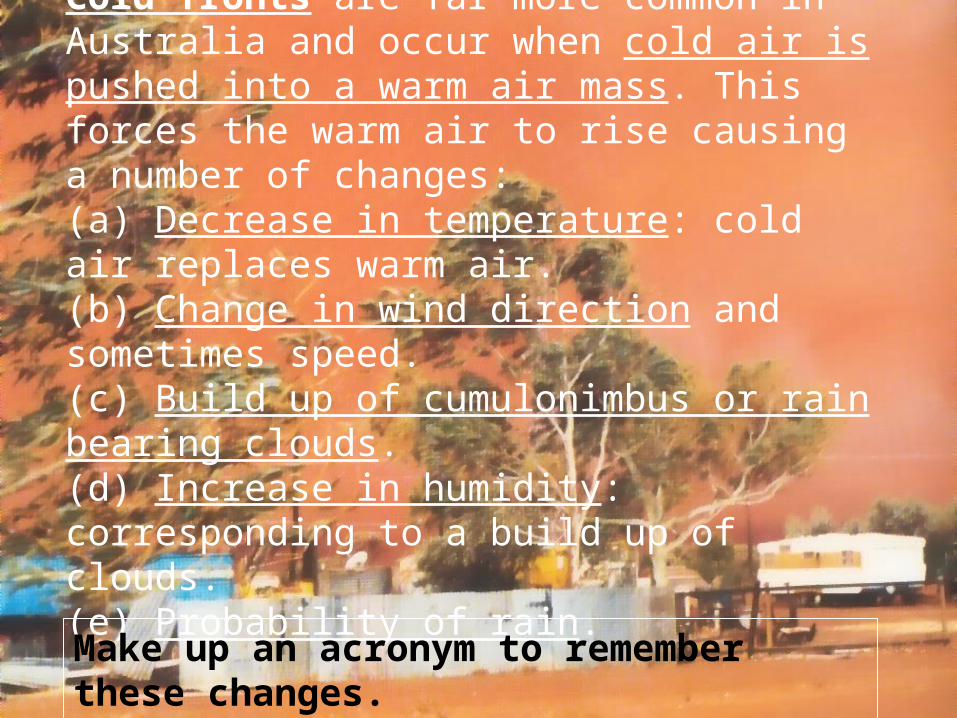
Cold fronts are far more common in Australia and occur when cold air is pushed into a warm air mass. This forces the warm air to rise causing a number of changes:(a) Decrease in temperature: cold air replaces warm air.(b) Change in wind direction and sometimes speed.(c) Build up of cumulonimbus or rain bearing clouds.(d) Increase in humidity: corresponding to a build up of clouds.(e) Probability of rain.
Make up an acronym to remember these changes.
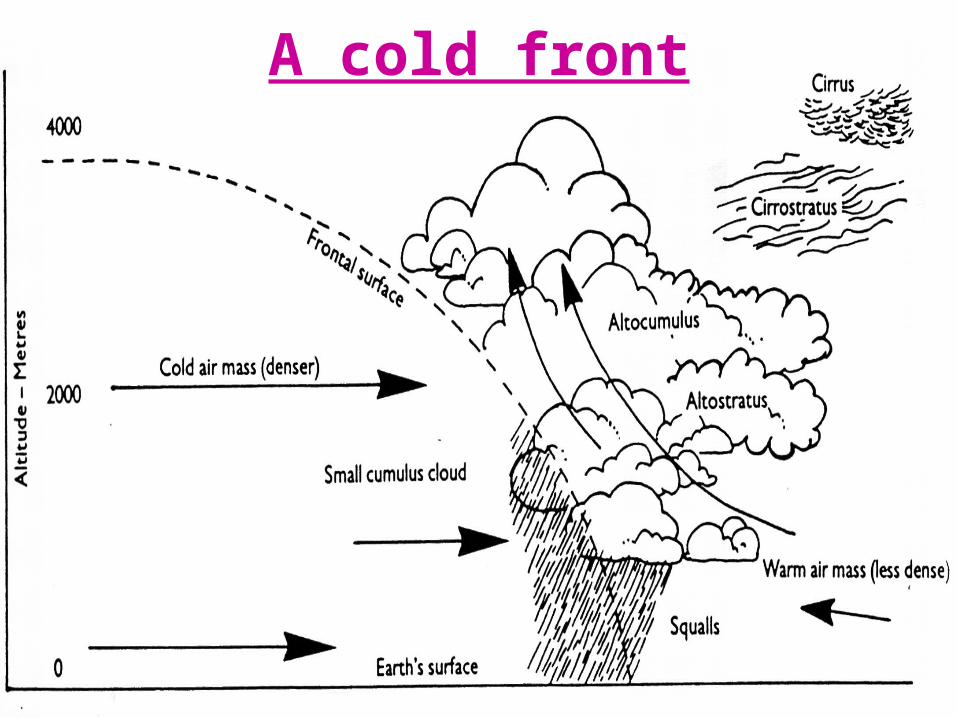
A cold front
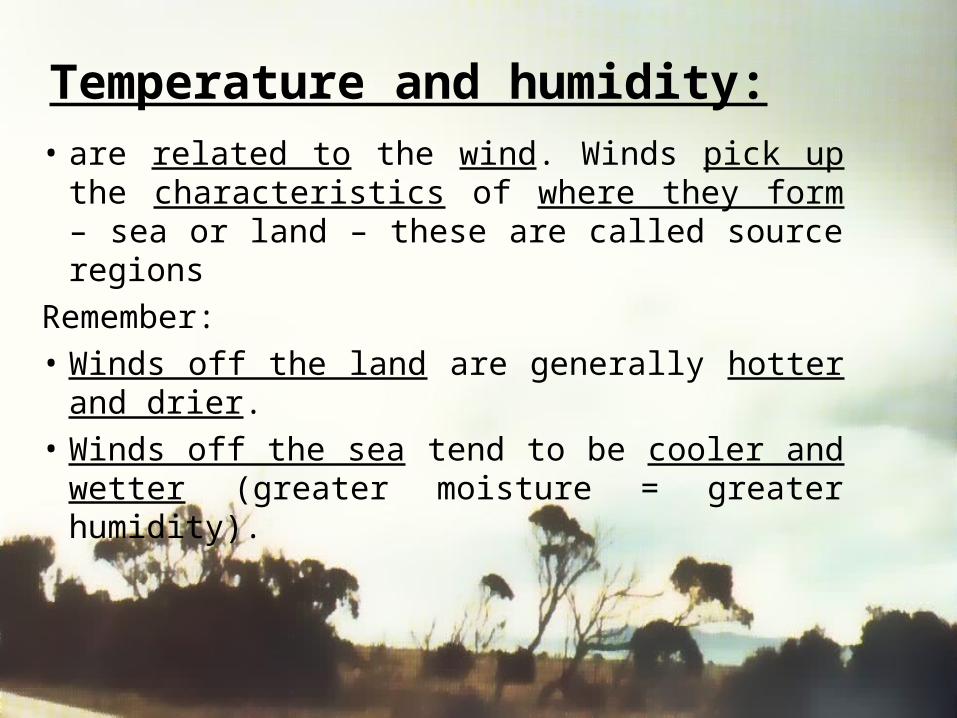
Temperature and humidity:
• are related to the wind. Winds pick up the characteristics of where they form – sea or land – these are called source regions
Remember:• Winds off the land are generally hotter and
drier.• Winds off the sea tend to be cooler and
wetter (greater moisture = greater humidity).
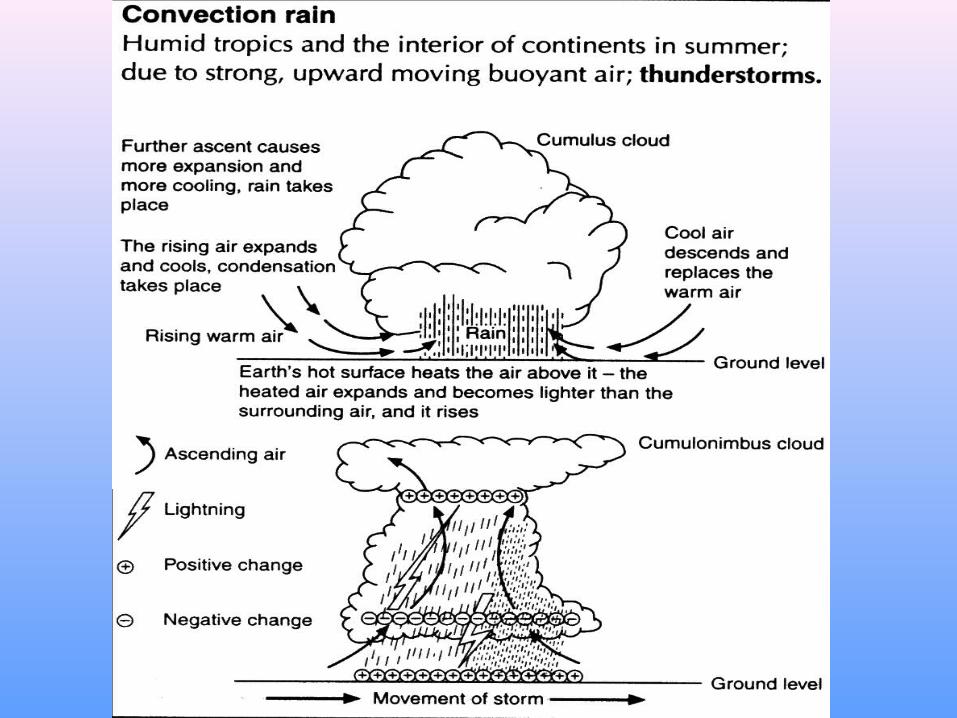
Types of rainfall: Convection
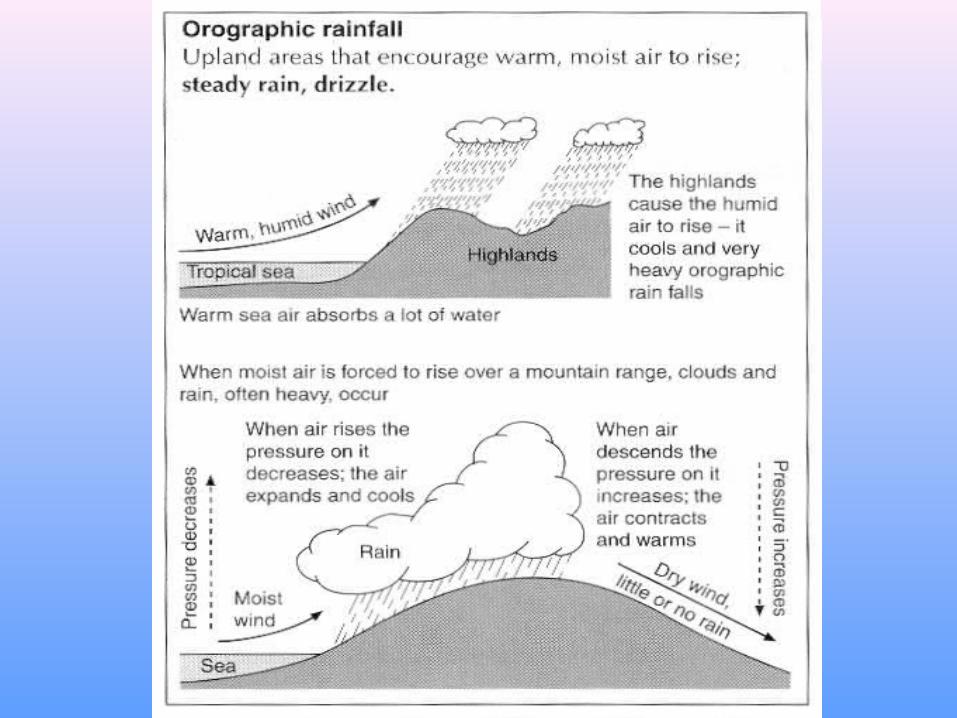
Types of rainfall: Orographic
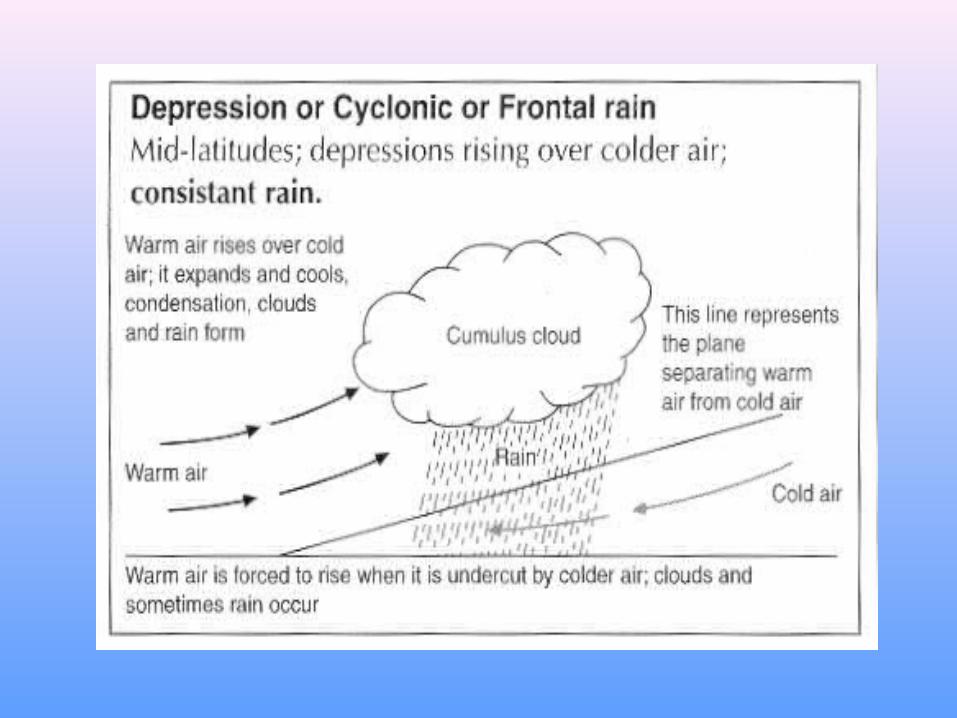
Types of rainfall: Frontal
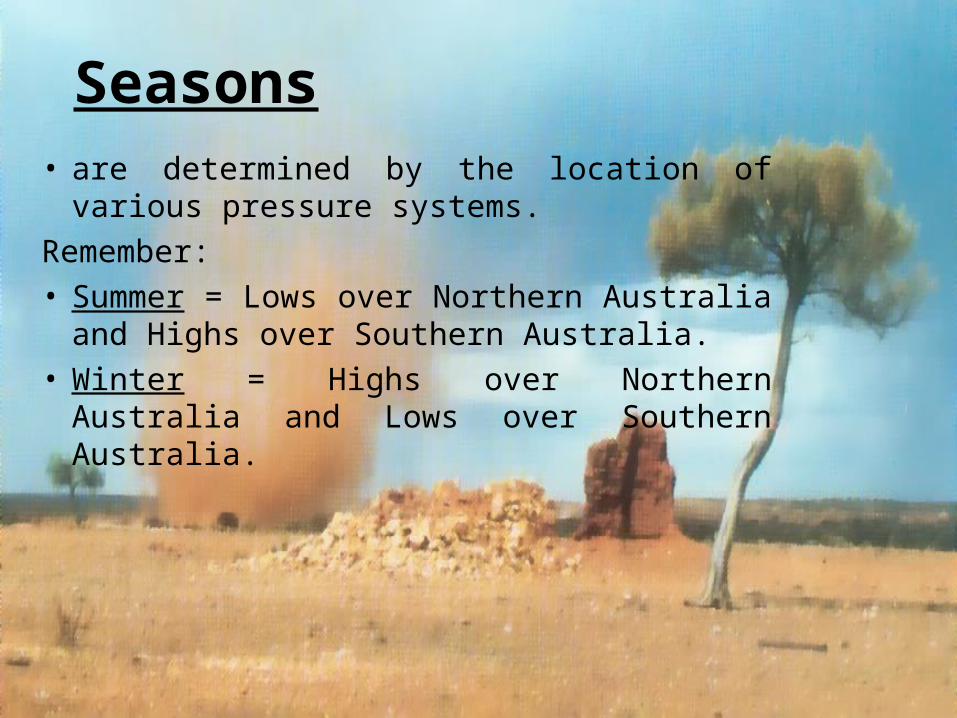
Seasons• are determined by the location of various
pressure systems.
Remember: • Summer = Lows over Northern Australia
and Highs over Southern Australia.• Winter = Highs over Northern Australia
and Lows over Southern Australia.
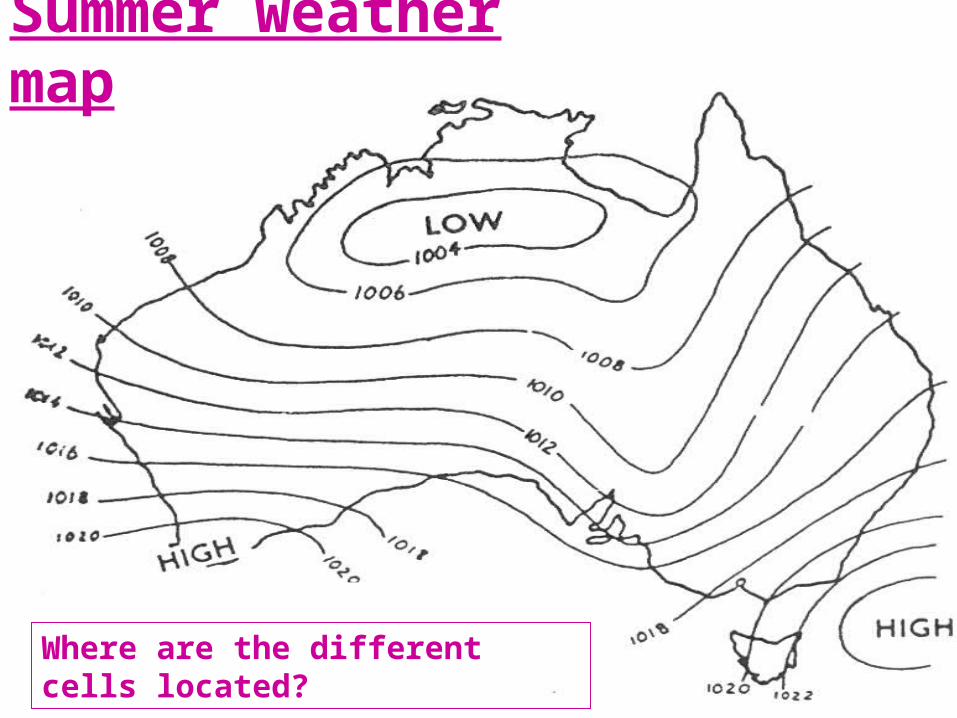
Summer weather map
Where are the different cells located?
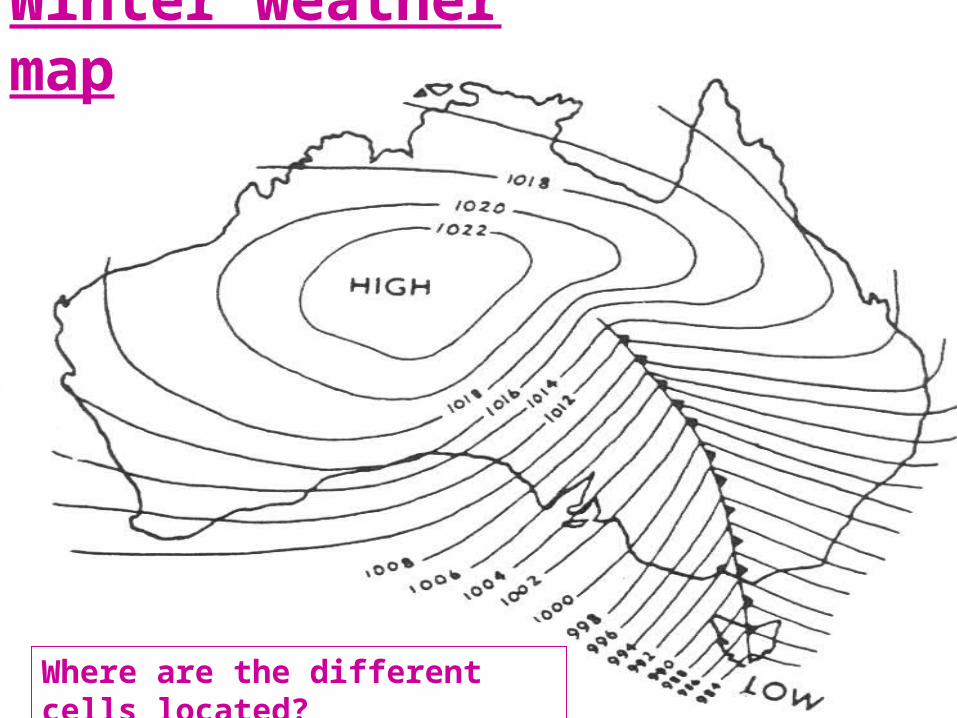
Winter weather map
Where are the different cells located?
References• B. Crowder, The Wonders of Weather, AGPS,
Canberra, 1995.• G. Nagle and K. Spencer, Advanced Geography,
OUP, Oxford, 1997.• G. Underwood, Geomasters, Brooks Waterloo,
Melbourne, 1988.• L. Bryant, Studying Contour and Weather Maps,
Jacaranda Press, Milton, 1990. • Special Thanks – Mr N. Shute Knox 2003
Related Documents