Weather, Water and Hazards Climate Vol - 3, Issue - 28, February 2017 HIGHLIGHTS 2016 Hot Weather Season (March to May) Outlook for 2017 Update on Agriculture in India: 2017 Water Level in Reservoirs Delhi Pollution Update Teacher Resource Student Resource IRI ENSO Forecast Global Highlights: 2016 History of Earth’s Surface Temperature 1880-2016 NOAA’s GOES-16 Satellite Sends First Images to Earth Global Climate Risk Index 2017

Welcome message from author
This document is posted to help you gain knowledge. Please leave a comment to let me know what you think about it! Share it to your friends and learn new things together.
Transcript
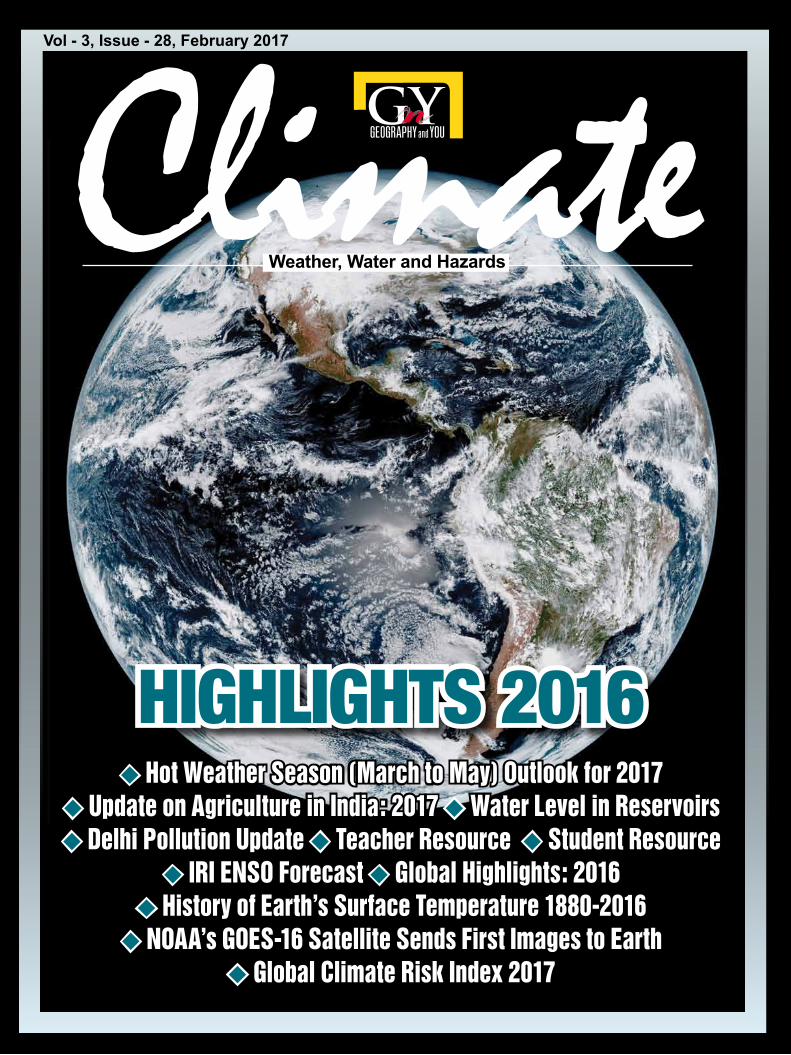
Weather, Water and HazardsClimate
Vol - 3, Issue - 28, February 2017
HigHligHts 2016 Hot Weather Season (March to May) Outlook for 2017
Update on Agriculture in India: 2017 Water Level in Reservoirs Delhi Pollution Update Teacher Resource Student Resource
IRI ENSO Forecast Global Highlights: 2016 History of Earth’s Surface Temperature 1880-2016 NOAA’s GOES-16 Satellite Sends First Images to Earth
Global Climate Risk Index 2017
2 G'nY CLIMATE
Volume 3 • Issue 28 • February 2017FREE COPY
ClimateA monthly online magazine on
weather, water and hazards
AdvisorAir Vice Marshal (Retd.) Dr. Ajit Tyagi,Former Director General, India Meteorological Department
Editor Sulagna Chattopadhyay
Legal Advisor Krishnendu Datta
Content Pranav Jain
Technical Assistant Nilesh Kumar
Correspondence/Editorial Office707, Bhikaji Cama Bhawan, R. K. Puram, New Delhi-110066 Phone: 011-26186350, 46041233For G'nY subscriptions, renewals, enquiries please contact:Circulation Manager E-mail: [email protected] visit our site at www.geographyandyou.com for further information
©IRIS Publication Pvt. Ltd.All rights reserved throughout the world. Reproduction in any manner, part or whole, is prohibited. Printed, published and owned by Sulagna Chattopadhyay
Research Credit LIGHTS (Learning in Geography, Humanities, Technology and Science) a not-for-profit research foundation
Published at IRIS Publication Pvt. Ltd. Geography and You does not take any responsibility for returning unsolicited publication material.
All disputes are subjected to the exclusive jurisdiction of competent courts and forums in Delhi/New Delhi only.
December 2016 ● Volume 2 ● Issue 262
3G'nY CLIMATE February 2017 ● Volume 3 ● Issue 27
Features4 Hot Weather Season (March
to May) Outlook for 20176 U.N. Reports Antarctica’s
Highest Temperatures on Record
6 Update on Agriculture inIndia: 2017
7 Water Level in Reservoirs9 Delhi Pollution Update10 Teacher Resource11 Student Resource11 MoES Commissions Higher
Resolution Weather Prediction Model
12 IRI ENSO Forecast14 Global Highlights: 201616 History of Earth’s Surface
Temperature 1880-201616 NOAA’s GOES-16 Satellite
Sends First Images to Earth18 Global Climate Risk
Index 201719 Flooding in Southern Thailand19 News Updates21 Conference Alerts21 Weather Tourism
ContentsAdvisor's DeskDear readers,
Winter season over north India extends from December to January. Day to day life in this season depends on the whims of weather. Of three winter months, severe winter condition
occurs in the month of January. In Kashmir, the period from December 21 till end of January is known as ‘Chilla Kalan’- the period of severe winter and harsh living conditions. The valley experiences snow and gets covered with white sheet, the sky is mostly overcast and the sun is hardly visible. In the plains, lowest minimum temperatures, winter rains, fog and cold waves are experienced in the month of January. Fog causes delay in air, rail and road traffic and causes many road accidents. Stable atmospheric conditions and lower temperatures worsens air quality. It is sad that common citizen has resigned to the fate and accepted poor air quality as a way of life and Air Quality Index of 400 has become a new norm. Media and, activists will make hue and cry when it reaches four figures or when there is no other issue to debate. Poor Air Quality is no more a localized problem but extends to a large part of the country. None of the 168 cities surveyed by Greenpeace complied with Global Air Quality norms. The Greenpeace study showed that air pollution killed 1.2 million Indians annually and about 3 per cent of country’s GDP is lost because of air pollution. Still no alarms have been raised at the national level. It is high time that Government of India takes steps like U.K. Clear Act passed in 1956 after the Great London Smog killed 12,000 people.
From the first issue of 2017, G’nY Climate team will be including a student as well as a teacher’s resource. Both the resources will be interlinked with each other. For example, in this month’s issue, we will talk about precipitation and its forms relevant to India which will be a teacher’s resource. Similarly, we have included how to measure rainfall and snowfall at home which will be for the students.
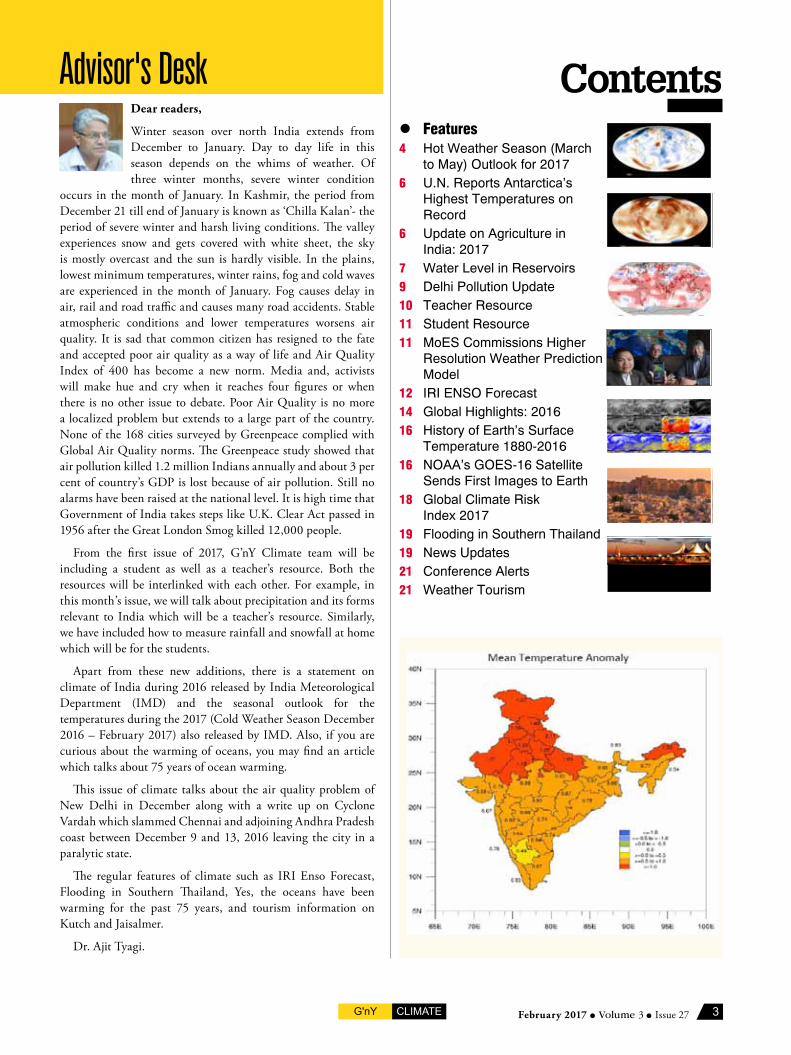
Apart from these new additions, there is a statement on climate of India during 2016 released by India Meteorological Department (IMD) and the seasonal outlook for the temperatures during the 2017 (Cold Weather Season December 2016 – February 2017) also released by IMD. Also, if you are curious about the warming of oceans, you may find an article which talks about 75 years of ocean warming.
This issue of climate talks about the air quality problem of New Delhi in December along with a write up on Cyclone Vardah which slammed Chennai and adjoining Andhra Pradesh coast between December 9 and 13, 2016 leaving the city in a paralytic state.
The regular features of climate such as IRI Enso Forecast, Flooding in Southern Thailand, Yes, the oceans have been warming for the past 75 years, and tourism information on Kutch and Jaisalmer.
Dr. Ajit Tyagi.
4 G'nY CLIMATEFebruary 2017 ● Volume 3 ● Issue 27
temperatures over many subdivisions over northwest and central India during the period 1982-2008.
ENSO cONditiONS iN thE Pacific OcEaNThe border line/ weak La Nina conditions are prevailing over the Pacific Ocean since July, 2016. The latest forecasts indicate that border line/ weak La Nina conditions are likely to weaken and reach ENSO neutral conditions during the 2017 pre-monsoon season. Therefore, ENSO conditions (as neutral conditions expected during the season) are unlikely to influence the pre-monsoon temperatures over the country.
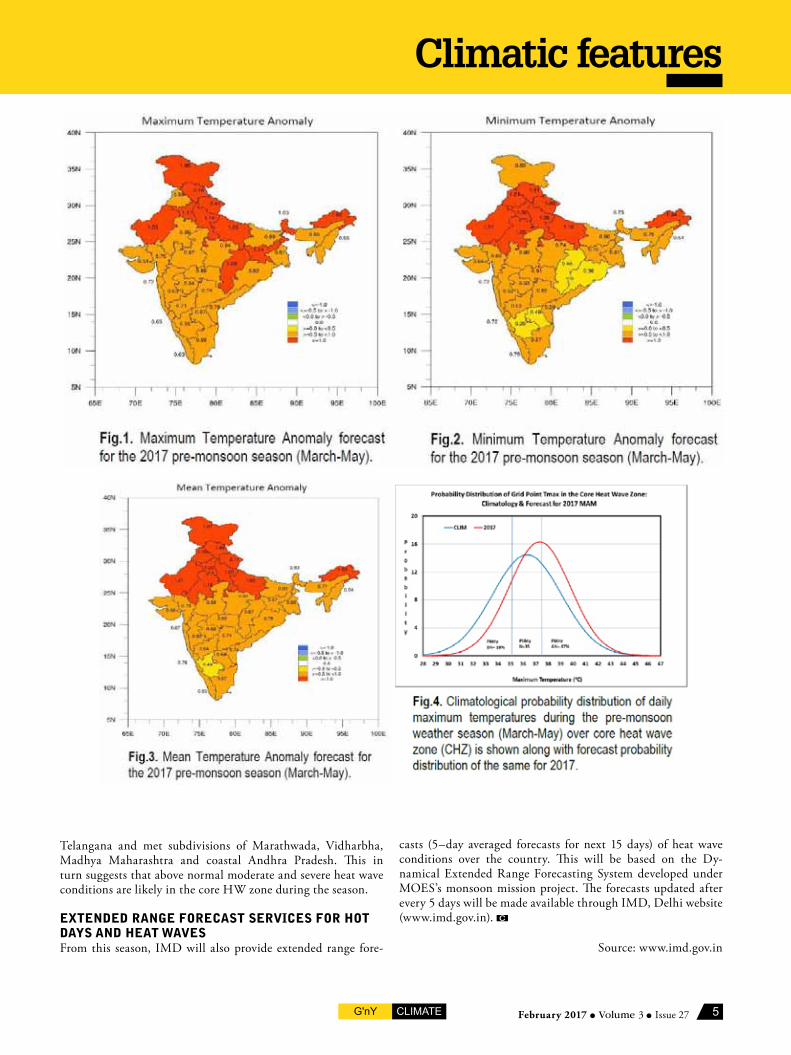
fOrEcaSt fOr thE 2017 PrE-mONSOON SEaSON (march tO may)Fig.1, Fig.2 & Fig.3 show the forecast for the subdivision averaged maximum, minimum and mean temperature anomalies (departures from the long term normal) respectively over India for the 2017 pre-monsoon season. The forecast indicates that during the season, temperatures (mean, maximum and minimum) in all the sub-divisions are likely to be above normal. All the temperatures (maximum, minimum and mean) of most of the subdivisions from northwest India and along the plains of Himalayas are likely to be above normal by ≥1.0oC. Overall, the temperature anomaly patterns show increase in the magnitudes of the anomalies as move from southern part of the country to northern part.
The season averaged maximum temperatures (Fig.1) are likely to be warmer than normal by ≥1oC in most of the subdivisions from north, northwest India and few subdivisions from neighboring east central India, and by 0.5oC to 1oCin remaining subdivisions.
The season averaged minimum temperatures (Fig.2) are likely to be warmer than normal by ≥ 1oC in most of the subdivisions from northwest India and along the plains of Himalayas, by <0.5oC in Orissa, Chhattisgarh, south Interior Karnataka and Rayalseema, and by 0.5oC to 1oC in the other subdivisions, which are mainly from peninsular, west central and northeastern parts of the country.
The season averaged mean temperatures (Fig.3) are likely to be warmer than normal by ≥1oC in most of the subdivisions from north, northwest India and along the plains of Himalayas, by <0.5oC in south Interior Karnataka, and by 0.5oC to 1oC in other subdivisions.
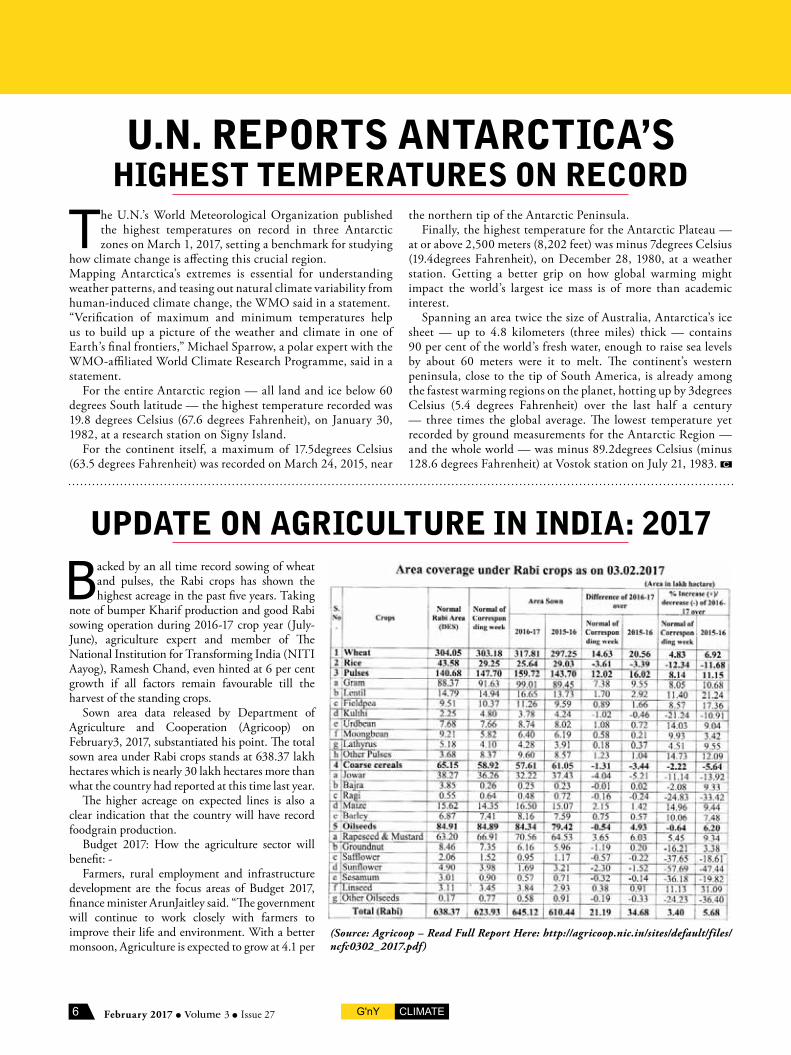
There is about 47 per cent probability of maximum temperatures in the core HW zone during the 2017 pre-monsoon season to be above normal (Fig.4). Core HW zone covers states of Punjab, Himachal Pradesh, Uttarakhand, Delhi, Haryana, Rajasthan, Uttar Pradesh, Gujarat, Madhya Pradesh, Chhattisgarh, Bihar, Jharkhand, West Bengal, Orissa and
In 2016, the country averaged annual mean temperatures was warmest (+0.91oC above the 1961-1990 average) ever on record since 1901 in line with warmest ever annual global
mean temperatures observed during the year. The warmed ever country averaged was mainly caused by the significantly above normal country averaged seasonal mean temperatures during the winter season (January- February, with anomaly +01.43oC, warmest since 1901) and the pre-monsoon season (March-May, with anomaly +1.36oC, second warmest ever since 1901). The country averaged monthly mean temperature during January 2017 was also significantly above normal with anomalies of 0.67oC, which is eighth warmest ever since 1901.
The country experiences hot weather during March to July period. March to May season is known as the pre-monsoon season with many parts of the country experience heat wave conditions (days with abnormally warmer temperatures) resulting adverse impacts on the human health, water resources and power generation and outage. Studies also indicate increasing trends in the frequency and duration of heat waves over the country, which can be attributed to increasing trends in the greenhouse gases and the warming of the sea surface temperatures over the equatorial Indian and Pacific oceans.
In view of its social relevance, since 2016, India Meteorological Department (IMD), Ministry of Earth Sciences (MoES) has started to issue seasonal forecast outlooks for summer temperatures over the country based on predictions using an ocean-atmosphere coupled climate model. In addition, IMD also issues heat wave alerts and warnings based on the same model on every five days which will be valid for next 15 days. Seasonal forecast outlook for the 2017 pre-monsoon season (March-May) is presented here.
thE cOuPlEd dyNamical fOrEcaSt SyStEmUnder the Monsoon Mission, the Indian Institute of Tropical Meteorology (IITM), Pune Ministry of Earth Sciences has been developing a state-of-the-art coupled climate model for generating monsoon forecasts. The model has a spatial resolution of about 38 km and improved modules of model physics. The model was used to prepare the monsoon forecasts since 2012. The analysis has also shown useful skill for this climate model for predicting seasonal temperatures over India. Therefore, this climate model was used to prepare an outlook for the 2016 summer as well as 2017 winter temperatures. The model climatology was prepared using retrospective forecasts generated for 27 years (1982-2008). Now, this model has been used to prepare the seasonal temperature forecast outlook for the 2017 pre-monsoon season (March-May) based on the 2017 February initial conditions. The forecast was prepared using 34 ensemble member forecasts. The model showed moderate skill for summer
hOt WEathEr SEaSON (march tO may) OutlOOk fOr 2017
5G'nY CLIMATE February 2017 ● Volume 3 ● Issue 27
Climatic features
remaining subdivisions. The season averaged minimum temperatures (Fig.2) are likely to be warmer than normal by ≥ 1oC in most of the subdivisions from northwest India and along the plains of Himalayas, by <0.5oC in Orissa, Chhattisgarh, south Interior Karnataka and Rayalseema, and by 0.5oC to 1oC in the other subdivisions, which are mainly from peninsular, west central and northeastern parts of the country. The season averaged mean temperatures (Fig.3) are likely to be warmer than normal by ≥1oC in most of the subdivisions from north, northwest India and along the plains of Himalayas, by <0.5oC in south Interior Karnataka, and by 0.5oC to 1oC in other subdivisions. There is about 47 per cent probability of maximum temperatures in the core HW zone during the 2017 pre-monsoon season to be above normal (Fig.4). Core HW zone covers states of Punjab, Himachal Pradesh, Uttarakhand, Delhi, Haryana, Rajasthan, Uttar Pradesh, Gujarat, Madhya Pradesh, Chhattisgarh, Bihar, Jharkhand, West Bengal, Orissa and Telangana and met subdivisions of Marathwada, Vidharbha, Madhya Maharashtra and coastal Andhra Pradesh. This in turn suggests that above normal moderate and severe heat wave conditions are likely in the core HW zone during the season.
Extended Range Forecast Services for Hot Days and Heat Waves From this season, IMD will also provide extended range forecasts (5–day averaged forecasts for next 15 days) of heat wave conditions over the country. This will be based on the Dynamical Extended Range Forecasting System developed under MOES’s monsoon mission project. The forecasts updated after every 5 days will be made available through IMD, Delhi website (www.imd.gov.in).
Telangana and met subdivisions of Marathwada, Vidharbha, Madhya Maharashtra and coastal Andhra Pradesh. This in turn suggests that above normal moderate and severe heat wave conditions are likely in the core HW zone during the season.
ExtENdEd raNgE fOrEcaSt SErvicES fOr hOt dayS aNd hEat WavESFrom this season, IMD will also provide extended range fore-
casts (5–day averaged forecasts for next 15 days) of heat wave conditions over the country. This will be based on the Dy-namical Extended Range Forecasting System developed under MOES’s monsoon mission project. The forecasts updated after every 5 days will be made available through IMD, Delhi website (www.imd.gov.in).
Source: www.imd.gov.in
6 G'nY CLIMATEFebruary 2017 ● Volume 3 ● Issue 27
u.N. rEPOrtS aNtarctica’S highESt tEmPEraturES ON rEcOrd
uPdatE ON agriculturE iN iNdia: 2017
the northern tip of the Antarctic Peninsula.Finally, the highest temperature for the Antarctic Plateau —
at or above 2,500 meters (8,202 feet) was minus 7degrees Celsius (19.4degrees Fahrenheit), on December 28, 1980, at a weather station. Getting a better grip on how global warming might impact the world’s largest ice mass is of more than academic interest.
Spanning an area twice the size of Australia, Antarctica’s ice sheet — up to 4.8 kilometers (three miles) thick — contains 90 per cent of the world’s fresh water, enough to raise sea levels by about 60 meters were it to melt. The continent’s western peninsula, close to the tip of South America, is already among the fastest warming regions on the planet, hotting up by 3degrees Celsius (5.4 degrees Fahrenheit) over the last half a century — three times the global average. The lowest temperature yet recorded by ground measurements for the Antarctic Region — and the whole world — was minus 89.2degrees Celsius (minus 128.6 degrees Fahrenheit) at Vostok station on July 21, 1983.
The U.N.’s World Meteorological Organization published the highest temperatures on record in three Antarctic zones on March 1, 2017, setting a benchmark for studying
how climate change is affecting this crucial region.Mapping Antarctica’s extremes is essential for understanding weather patterns, and teasing out natural climate variability from human-induced climate change, the WMO said in a statement.“Verification of maximum and minimum temperatures help us to build up a picture of the weather and climate in one of Earth’s final frontiers,” Michael Sparrow, a polar expert with the WMO-affiliated World Climate Research Programme, said in a statement.
For the entire Antarctic region — all land and ice below 60 degrees South latitude — the highest temperature recorded was 19.8 degrees Celsius (67.6 degrees Fahrenheit), on January 30, 1982, at a research station on Signy Island.
For the continent itself, a maximum of 17.5degrees Celsius (63.5 degrees Fahrenheit) was recorded on March 24, 2015, near
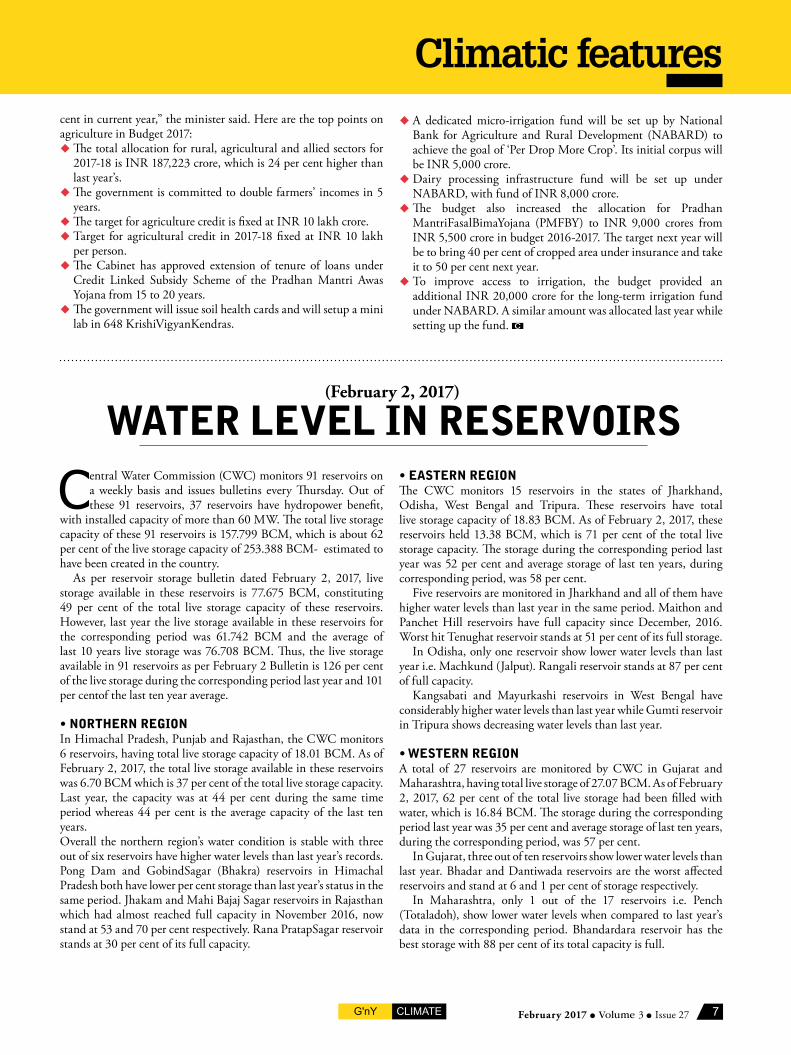
Backed by an all time record sowing of wheat and pulses, the Rabi crops has shown the highest acreage in the past five years. Taking
note of bumper Kharif production and good Rabi sowing operation during 2016-17 crop year (July-June), agriculture expert and member of The National Institution for Transforming India (NITI Aayog), Ramesh Chand, even hinted at 6 per cent growth if all factors remain favourable till the harvest of the standing crops.
Sown area data released by Department of Agriculture and Cooperation (Agricoop) on February3, 2017, substantiated his point. The total sown area under Rabi crops stands at 638.37 lakh hectares which is nearly 30 lakh hectares more than what the country had reported at this time last year.
The higher acreage on expected lines is also a clear indication that the country will have record foodgrain production.
Budget 2017: How the agriculture sector will benefit: -
Farmers, rural employment and infrastructure development are the focus areas of Budget 2017, finance minister ArunJaitley said. “The government will continue to work closely with farmers to improve their life and environment. With a better monsoon, Agriculture is expected to grow at 4.1 per
(Source: Agricoop – Read Full Report Here: http://agricoop.nic.in/sites/default/files/ncfc0302_2017.pdf)
Update on Agriculture in India: 2017 Backed by an all time record sowing of wheat and pulses, the Rabi crops has shown the highest acreage in the past five years. Taking note of bumper Kharif production and good Rabi sowing operation during 2016-17 crop year (July-June), agriculture expert and member of The National Institution for Transforming India (NITI Aayog), Ramesh Chand, even hinted at 6 per cent growth if all factors remain favourable till the harvest of the standing crops.
Sown area data released by Department of Agriculture and Cooperation (Agricoop) on February3, 2017, substantiated his point. The total sown area under Rabi crops stands at 638.37 lakh hectares which is nearly 30 lakh hectares more than what the country had reported at this time last year.
The higher acreage on expected lines is also a clear indication that the country will have record foodgrain production.
(Source: Agricoop – Read Full Report Here: http://agricoop.nic.in/sites/default/files/ncfc0302_2017.pdf)
Budget 2017: How the agriculture sector will benefit: - Farmers, rural employment and infrastructure development are the focus areas of Budget 2017, finance minister ArunJaitley said. "The government will continue to work closely with farmers to improve their life and environment. With a better monsoon, Agriculture is expected to grow at 4.1 per cent in current year," the minister said. Here are the top points on agriculture in Budget 2017:
• The total allocation for rural, agricultural and allied sectors for 2017-18 is INR 187,223 crore, which is 24 per cent higher than last year's.
• The government is committed to double farmers' incomes in 5 years. • The target for agriculture credit is fixed at INR 10 lakh crore. • Target for agricultural credit in 2017-18 fixed at INR 10 lakh per person. • The Cabinet has approved extension of tenure of loans under Credit Linked Subsidy Scheme of the Pradhan
MantriAwasYojana from 15 to 20 years. • The government will issue soil health cards and will setup a mini lab in 648 KrishiVigyanKendras. • A dedicated micro-irrigation fund will be set up by National Bank for Agriculture and Rural Development
(NABARD) to achieve the goal of 'Per Drop More Crop'. Its initial corpus will be INR 5,000 crore. • Dairy processing infrastructure fund will be set up under NABARD, with fund of INR 8,000 crore. • The budget also increased the allocation for Pradhan MantriFasalBimaYojana (PMFBY) to INR 9,000 crores from
INR 5,500 crore in budget 2016-2017. The target next year will be to bring 40 per cent of cropped area under insurance and take it to 50 per cent next year.
• To improve access to irrigation, the budget provided an additional INR 20,000 crore for the long-term irrigation fund under NABARD. A similar amount was allocated last year while setting up the fund.
7G'nY CLIMATE February 2017 ● Volume 3 ● Issue 27
Climatic featurescent in current year,” the minister said. Here are the top points on agriculture in Budget 2017: The total allocation for rural, agricultural and allied sectors for
2017-18 is INR 187,223 crore, which is 24 per cent higher than last year’s.
The government is committed to double farmers’ incomes in 5 years.
The target for agriculture credit is fixed at INR 10 lakh crore. Target for agricultural credit in 2017-18 fixed at INR 10 lakh
per person. The Cabinet has approved extension of tenure of loans under
Credit Linked Subsidy Scheme of the Pradhan Mantri Awas Yojana from 15 to 20 years.
The government will issue soil health cards and will setup a mini lab in 648 KrishiVigyanKendras.
Central Water Commission (CWC) monitors 91 reservoirs on a weekly basis and issues bulletins every Thursday. Out of these 91 reservoirs, 37 reservoirs have hydropower benefit,
with installed capacity of more than 60 MW. The total live storage capacity of these 91 reservoirs is 157.799 BCM, which is about 62 per cent of the live storage capacity of 253.388 BCM- estimated to have been created in the country.
As per reservoir storage bulletin dated February 2, 2017, live storage available in these reservoirs is 77.675 BCM, constituting 49 per cent of the total live storage capacity of these reservoirs. However, last year the live storage available in these reservoirs for the corresponding period was 61.742 BCM and the average of last 10 years live storage was 76.708 BCM. Thus, the live storage available in 91 reservoirs as per February 2 Bulletin is 126 per cent of the live storage during the corresponding period last year and 101 per centof the last ten year average.
• NortherN regioNIn Himachal Pradesh, Punjab and Rajasthan, the CWC monitors 6 reservoirs, having total live storage capacity of 18.01 BCM. As of February 2, 2017, the total live storage available in these reservoirs was 6.70 BCM which is 37 per cent of the total live storage capacity. Last year, the capacity was at 44 per cent during the same time period whereas 44 per cent is the average capacity of the last ten years.Overall the northern region’s water condition is stable with three out of six reservoirs have higher water levels than last year’s records. Pong Dam and GobindSagar (Bhakra) reservoirs in Himachal Pradesh both have lower per cent storage than last year’s status in the same period. Jhakam and Mahi Bajaj Sagar reservoirs in Rajasthan which had almost reached full capacity in November 2016, now stand at 53 and 70 per cent respectively. Rana PratapSagar reservoir stands at 30 per cent of its full capacity.
A dedicated micro-irrigation fund will be set up by National Bank for Agriculture and Rural Development (NABARD) to achieve the goal of ‘Per Drop More Crop’. Its initial corpus will be INR 5,000 crore.
Dairy processing infrastructure fund will be set up under NABARD, with fund of INR 8,000 crore.
The budget also increased the allocation for Pradhan MantriFasalBimaYojana (PMFBY) to INR 9,000 crores from INR 5,500 crore in budget 2016-2017. The target next year will be to bring 40 per cent of cropped area under insurance and take it to 50 per cent next year.
To improve access to irrigation, the budget provided an additional INR 20,000 crore for the long-term irrigation fund under NABARD. A similar amount was allocated last year while setting up the fund.
WatEr lEvEl iN rESErvOirS(February 2, 2017)
• easterN regioNThe CWC monitors 15 reservoirs in the states of Jharkhand, Odisha, West Bengal and Tripura. These reservoirs have total live storage capacity of 18.83 BCM. As of February 2, 2017, these reservoirs held 13.38 BCM, which is 71 per cent of the total live storage capacity. The storage during the corresponding period last year was 52 per cent and average storage of last ten years, during corresponding period, was 58 per cent.
Five reservoirs are monitored in Jharkhand and all of them have higher water levels than last year in the same period. Maithon and Panchet Hill reservoirs have full capacity since December, 2016. Worst hit Tenughat reservoir stands at 51 per cent of its full storage.
In Odisha, only one reservoir show lower water levels than last year i.e. Machkund (Jalput). Rangali reservoir stands at 87 per cent of full capacity.
Kangsabati and Mayurkashi reservoirs in West Bengal have considerably higher water levels than last year while Gumti reservoir in Tripura shows decreasing water levels than last year.
• WesterN regioNA total of 27 reservoirs are monitored by CWC in Gujarat and Maharashtra, having total live storage of 27.07 BCM. As of February 2, 2017, 62 per cent of the total live storage had been filled with water, which is 16.84 BCM. The storage during the corresponding period last year was 35 per cent and average storage of last ten years, during the corresponding period, was 57 per cent.
In Gujarat, three out of ten reservoirs show lower water levels than last year. Bhadar and Dantiwada reservoirs are the worst affected reservoirs and stand at 6 and 1 per cent of storage respectively.
In Maharashtra, only 1 out of the 17 reservoirs i.e. Pench (Totaladoh), show lower water levels when compared to last year’s data in the corresponding period. Bhandardara reservoir has the best storage with 88 per cent of its total capacity is full.
8 G'nY CLIMATEFebruary 2017 ● Volume 3 ● Issue 27
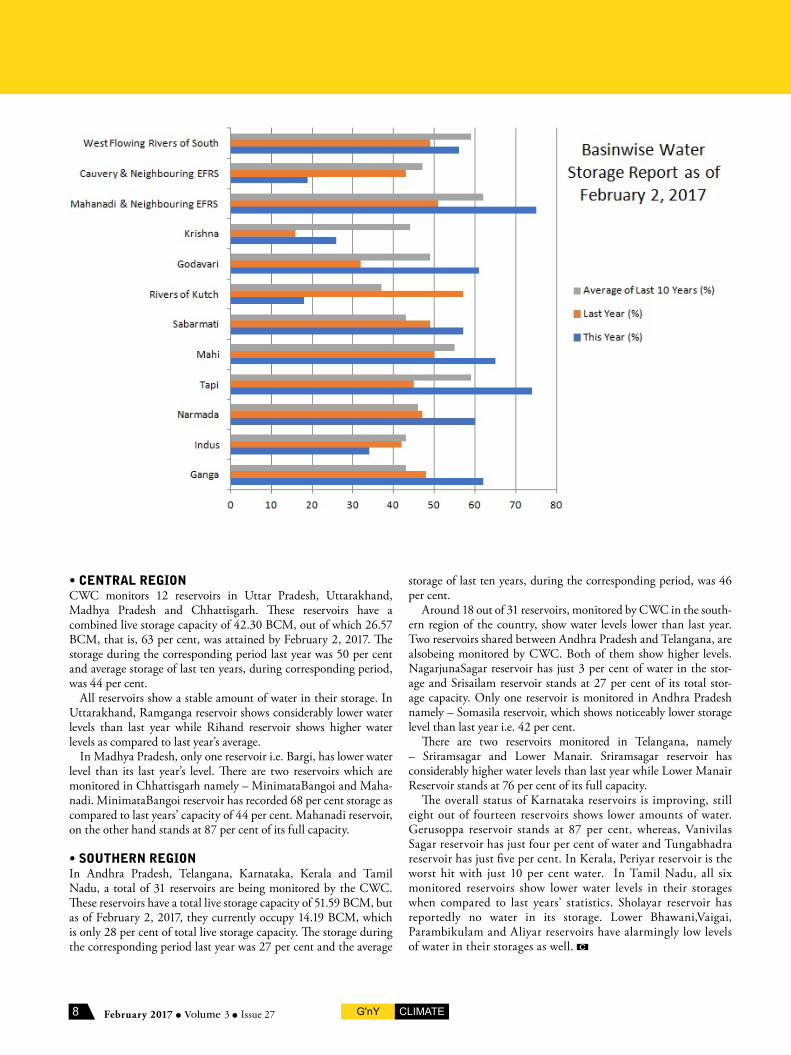
• CeNtral regioNCWC monitors 12 reservoirs in Uttar Pradesh, Uttarakhand, Madhya Pradesh and Chhattisgarh. These reservoirs have a combined live storage capacity of 42.30 BCM, out of which 26.57 BCM, that is, 63 per cent, was attained by February 2, 2017. The storage during the corresponding period last year was 50 per cent and average storage of last ten years, during corresponding period, was 44 per cent.
All reservoirs show a stable amount of water in their storage. In Uttarakhand, Ramganga reservoir shows considerably lower water levels than last year while Rihand reservoir shows higher water levels as compared to last year’s average.
In Madhya Pradesh, only one reservoir i.e. Bargi, has lower water level than its last year’s level. There are two reservoirs which are monitored in Chhattisgarh namely – MinimataBangoi and Maha-nadi. MinimataBangoi reservoir has recorded 68 per cent storage as compared to last years’ capacity of 44 per cent. Mahanadi reservoir, on the other hand stands at 87 per cent of its full capacity.
• southerN regioNIn Andhra Pradesh, Telangana, Karnataka, Kerala and Tamil Nadu, a total of 31 reservoirs are being monitored by the CWC. These reservoirs have a total live storage capacity of 51.59 BCM, but as of February 2, 2017, they currently occupy 14.19 BCM, which is only 28 per cent of total live storage capacity. The storage during the corresponding period last year was 27 per cent and the average
All reservoirs show a stable amount of water in their storage. In Uttarakhand, Ramganga reservoir shows considerably lower water levels than last year while Rihand reservoir shows higher water levels as compared to last year’s average. In Madhya Pradesh, only one reservoir i.e. Bargi, has lower water level than its last year’s level. There are two reservoirs which are monitored in Chhattisgarh namely – MinimataBangoi and Mahanadi. MinimataBangoi reservoir has recorded 68 per cent storage as compared to last years’ capacity of 44 per cent. Mahanadi reservoir, on the other hand stands at 87 per cent of its full capacity.
• Southern Region In Andhra Pradesh, Telangana, Karnataka, Kerala and Tamil Nadu, a total of 31 reservoirs are being monitored by the CWC. These reservoirs have a total live storage capacity of 51.59 BCM, but as of February 2, 2017, they currently occupy 14.19 BCM, which is only 28 per cent of total live storage capacity. The storage during the corresponding period last year was 27 per cent and the average storage of last ten years, during the corresponding period, was 46 per cent. Around 18 out of 31 reservoirs, monitored by CWC in the southern region of the country, show water levels lower than last year. Two reservoirs shared between Andhra Pradesh and Telangana, are alsobeing monitored by CWC. Both of them show higher levels. NagarjunaSagar reservoir has just 3 per cent of water in the storage and Srisailam reservoir stands at 27 per cent of its total storage capacity. Only one reservoir is monitored in Andhra Pradesh namely – Somasila reservoir, which shows noticeably lower storage level than last year i.e. 42 per cent. There are two reservoirs monitored in Telangana, namely – Sriramsagar and Lower Manair. Sriramsagar reservoir has considerably higher water levels than last year while Lower Manair Reservoir stands at 76 per cent of its full capacity. The overall status of Karnataka reservoirs is improving, still eight out of fourteen reservoirs shows lower amounts of water. Gerusoppa reservoir stands at 87 per cent, whereas, VanivilasSagar reservoir has just four per cent of water and Tungabhadra reservoir has just five per cent. In Kerala, Periyar reservoir is the worst hit with just 10 per cent water. In Tamil Nadu, all six monitored reservoirs show lower water levels in their storages when compared to last years’ statistics. Sholayar reservoir has reportedly no water in its storage. Lower Bhawani,Vaigai, Parambikulam and Aliyar reservoirs have alarmingly low levels of water in their storages as well.
(Read full report: http://202.159.215.250:83/DocumentUploadRoot/DocumentId_8046/02.02.2017.pdf) (Source:http://www.cwc.nic.in/)
storage of last ten years, during the corresponding period, was 46 per cent.
Around 18 out of 31 reservoirs, monitored by CWC in the south-ern region of the country, show water levels lower than last year. Two reservoirs shared between Andhra Pradesh and Telangana, are alsobeing monitored by CWC. Both of them show higher levels. NagarjunaSagar reservoir has just 3 per cent of water in the stor-age and Srisailam reservoir stands at 27 per cent of its total stor-age capacity. Only one reservoir is monitored in Andhra Pradesh namely – Somasila reservoir, which shows noticeably lower storage level than last year i.e. 42 per cent.
There are two reservoirs monitored in Telangana, namely – Sriramsagar and Lower Manair. Sriramsagar reservoir has considerably higher water levels than last year while Lower Manair Reservoir stands at 76 per cent of its full capacity.
The overall status of Karnataka reservoirs is improving, still eight out of fourteen reservoirs shows lower amounts of water. Gerusoppa reservoir stands at 87 per cent, whereas, Vanivilas Sagar reservoir has just four per cent of water and Tungabhadra reservoir has just five per cent. In Kerala, Periyar reservoir is the worst hit with just 10 per cent water. In Tamil Nadu, all six monitored reservoirs show lower water levels in their storages when compared to last years’ statistics. Sholayar reservoir has reportedly no water in its storage. Lower Bhawani,Vaigai, Parambikulam and Aliyar reservoirs have alarmingly low levels of water in their storages as well.
9G'nY CLIMATE February 2017 ● Volume 3 ● Issue 27
Climatic features
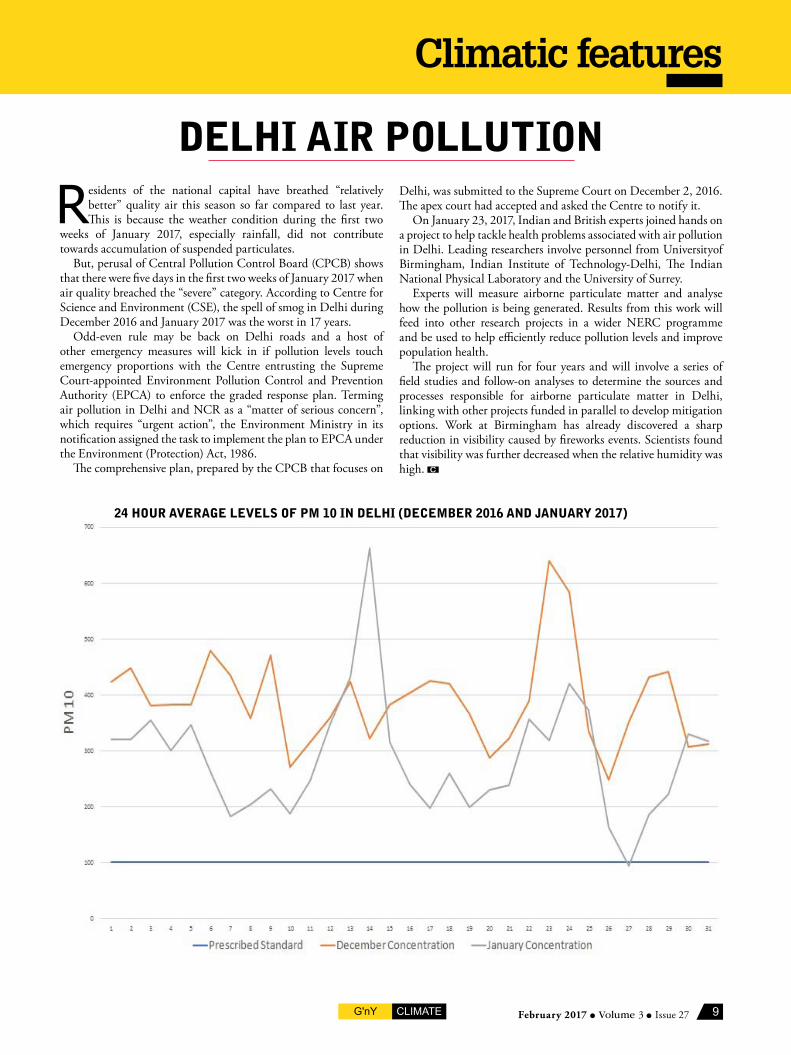
dElhi air POllutiON
Residents of the national capital have breathed “relatively better” quality air this season so far compared to last year. This is because the weather condition during the first two
weeks of January 2017, especially rainfall, did not contribute towards accumulation of suspended particulates.
But, perusal of Central Pollution Control Board (CPCB) shows that there were five days in the first two weeks of January 2017 when air quality breached the “severe” category. According to Centre for Science and Environment (CSE), the spell of smog in Delhi during December 2016 and January 2017 was the worst in 17 years.
Odd-even rule may be back on Delhi roads and a host of other emergency measures will kick in if pollution levels touch emergency proportions with the Centre entrusting the Supreme Court-appointed Environment Pollution Control and Prevention Authority (EPCA) to enforce the graded response plan. Terming air pollution in Delhi and NCR as a “matter of serious concern”, which requires “urgent action”, the Environment Ministry in its notification assigned the task to implement the plan to EPCA under the Environment (Protection) Act, 1986.
The comprehensive plan, prepared by the CPCB that focuses on
Delhi Pollution Update Residents of the national capital have breathed “relatively better” quality air this season so far compared to last year. This is because the weather condition during the first two weeks of January 2017, especially rainfall, did not contribute towards accumulation of suspended particulates.
But, perusal of Central Pollution Control Board (CPCB) shows that there were five days in the first two weeks of January 2017 when air quality breached the “severe” category. According to Centre for Science and Environment (CSE), the spell of smog in Delhi during December 2016 and January 2017 was the worst in 17 years.
Odd-even rule may be back on Delhi roads and a host of other emergency measures will kick in if pollution levels touch emergency proportions with the Centre entrusting the Supreme Court-appointed Environment Pollution Control and Prevention Authority (EPCA) to enforce the graded response plan. Terming air pollution in Delhi and NCR as a "matter of serious concern", which requires "urgent action", the Environment Ministry in its notification assigned the task to implement the plan to EPCA under the Environment (Protection) Act, 1986.
The comprehensive plan, prepared by the CPCB that focuses on Delhi, was submitted to the Supreme Court on December 2, 2016. The apex court had accepted and asked the Centre to notify it.
On January 23, 2017, Indian and British experts joined hands on a project to help tackle health problems associated with air pollution in Delhi. Leading researchers involve personnel from Universityof Birmingham, Indian Institute of Technology-Delhi, The Indian National Physical Laboratory and the University of Surrey. Experts will measure airborne particulate matter and analyse how the pollution is being generated. Results from this work will feed into other research projects in a wider NERC programme and be used to help efficiently reduce pollution levels and improve population health.
The project will run for four years and will involve a series of field studies and follow-on analyses to determine the sources and processes responsible for airborne particulate matter in Delhi, linking with other projects funded in parallel to develop mitigation options. Work at Birmingham has already discovered a sharp reduction in visibility caused by fireworks events. Scientists found that visibility was further decreased when the relative humidity was high.
Delhi, was submitted to the Supreme Court on December 2, 2016. The apex court had accepted and asked the Centre to notify it.
On January 23, 2017, Indian and British experts joined hands on a project to help tackle health problems associated with air pollution in Delhi. Leading researchers involve personnel from Universityof Birmingham, Indian Institute of Technology-Delhi, The Indian National Physical Laboratory and the University of Surrey.
Experts will measure airborne particulate matter and analyse how the pollution is being generated. Results from this work will feed into other research projects in a wider NERC programme and be used to help efficiently reduce pollution levels and improve population health.
The project will run for four years and will involve a series of field studies and follow-on analyses to determine the sources and processes responsible for airborne particulate matter in Delhi, linking with other projects funded in parallel to develop mitigation options. Work at Birmingham has already discovered a sharp reduction in visibility caused by fireworks events. Scientists found that visibility was further decreased when the relative humidity was high.
24 hOur avEragE lEvElS Of Pm 10 iN dElhi (dEcEmbEr 2016 aNd jaNuary 2017)
10 G'nY CLIMATEFebruary 2017 ● Volume 3 ● Issue 27
tEachEr rESOurcE
Following our teacher resource in the G’nY Climate January 2017 edition on the forms of precipitation, we will now be talking about the types of precipitation in this issue. The
resource also includes information on precipitation relevant to Indian sub-continent.
tyPES Of PrEciPitatiONCyclonic precipitation: It is caused by the lifting of air mass due to pressure difference. A cyclone is a large low pressure region with circular wind motion. There are two types of cyclones – viz. tropical cyclones and extratropical cyclones.
Tropical cyclones (called cyclone in India, hurricane in the USA and typhoon in SE Asia) is a wind system associated with an intense depression. The center of the cyclone called the eye may extend about 10-50km in diameter and is generally calm. Right outside the eye wind speeds can be as high as bout 200kmph. Pressure also increases outwards. Generally heavy rainfall occurs in the entire area occupied by the cyclone.
Extratropical cyclones are formed in locations outside the tropical zone. These are associated with a frontal system. The magnitude of precipitation and wind velocities are lower than that of tropical cyclones. However, they have larger areal extent and generally result in longer duration of precipitation.
Anticyclones: High pressure regions of large areal extent. These causes clockwise wind circulation and Winds are of moderate speed. It is usually calm at the center and precipitation occurs at the outer edges.Frontal precipitation A boarder region between two adjacent air masses having different characteristics such as temperature and humidity is called a front. When a flow of warm and moist air mass from the south meets cold air mass of polar region, the cold air being heavier, under run the warm air flow in the form of flat wedge forcing the warm air aloft. The lifted warm air mass cools down at high altitudes causing precipitation. A front may be warm front or cold front depending upon whether there is active or passive ascent of warm air masses over cold air mass.N o n - f r o n t a l precipitation: In this case, the moist warm air mass is stationary and moving cold air mass meets it. Thus, due to lightness of the warm air, there is passive ascent of warm air over clod air owing to the
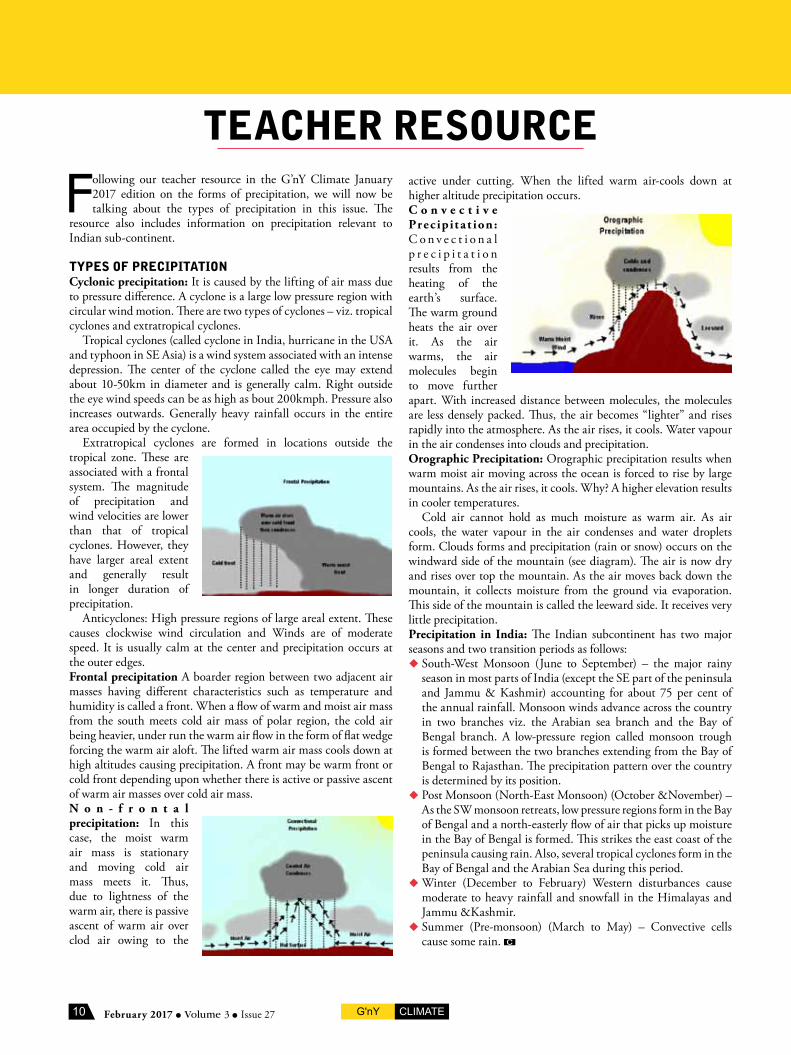
active under cutting. When the lifted warm air-cools down at higher altitude precipitation occurs.C o n v e c t i v e Prec ipit a t ion : C o n v e c t i o n a l p r e c i p i t a t i o n results from the heating of the earth’s surface. The warm ground heats the air over it. As the air warms, the air molecules begin to move further apart. With increased distance between molecules, the molecules are less densely packed. Thus, the air becomes “lighter” and rises rapidly into the atmosphere. As the air rises, it cools. Water vapour in the air condenses into clouds and precipitation.Orographic Precipitation: Orographic precipitation results when warm moist air moving across the ocean is forced to rise by large mountains. As the air rises, it cools. Why? A higher elevation results in cooler temperatures.
Cold air cannot hold as much moisture as warm air. As air cools, the water vapour in the air condenses and water droplets form. Clouds forms and precipitation (rain or snow) occurs on the windward side of the mountain (see diagram). The air is now dry and rises over top the mountain. As the air moves back down the mountain, it collects moisture from the ground via evaporation. This side of the mountain is called the leeward side. It receives very little precipitation.Precipitation in India: The Indian subcontinent has two major seasons and two transition periods as follows: South-West Monsoon (June to September) – the major rainy
season in most parts of India (except the SE part of the peninsula and Jammu & Kashmir) accounting for about 75 per cent of the annual rainfall. Monsoon winds advance across the country in two branches viz. the Arabian sea branch and the Bay of Bengal branch. A low-pressure region called monsoon trough is formed between the two branches extending from the Bay of Bengal to Rajasthan. The precipitation pattern over the country is determined by its position.
Post Monsoon (North-East Monsoon) (October &November) – As the SW monsoon retreats, low pressure regions form in the Bay of Bengal and a north-easterly flow of air that picks up moisture in the Bay of Bengal is formed. This strikes the east coast of the peninsula causing rain. Also, several tropical cyclones form in the Bay of Bengal and the Arabian Sea during this period.
Winter (December to February) Western disturbances cause moderate to heavy rainfall and snowfall in the Himalayas and Jammu &Kashmir.
Summer (Pre-monsoon) (March to May) – Convective cells cause some rain.
11G'nY CLIMATE February 2017 ● Volume 3 ● Issue 27
StudENt rESOurcE
mOES cOmmiSSiONS highEr rESOlutiON WEathEr PrEdictiON mOdEl
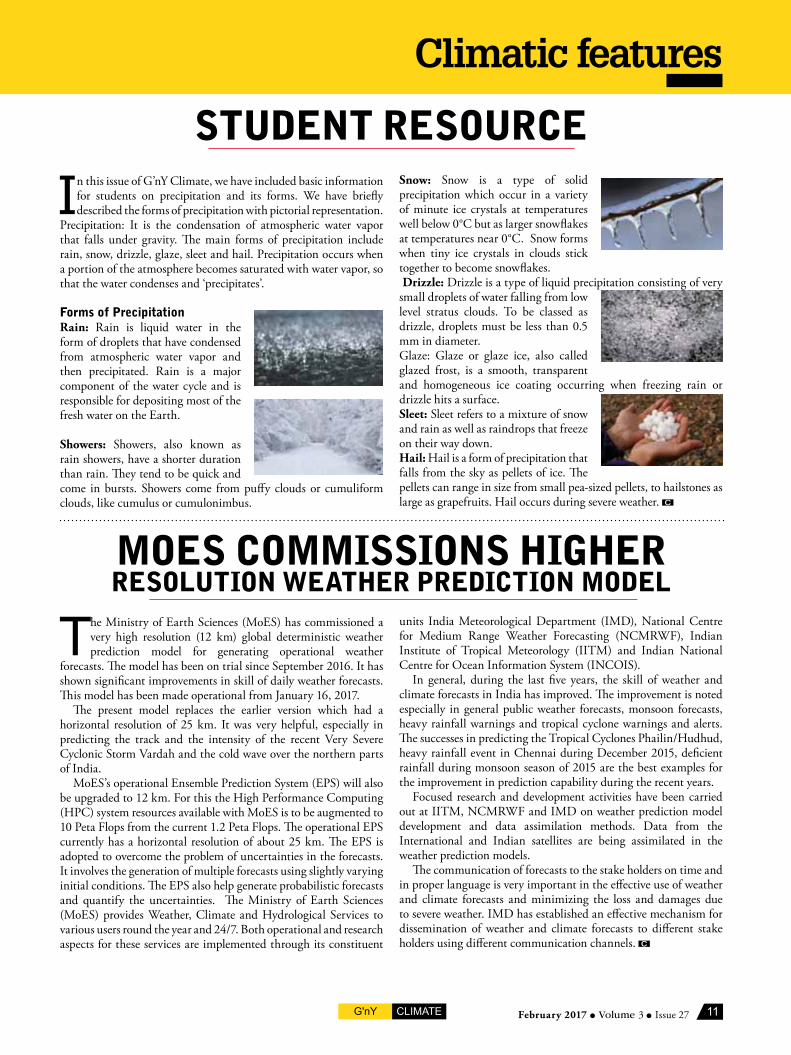
In this issue of G’nY Climate, we have included basic information for students on precipitation and its forms. We have briefly described the forms of precipitation with pictorial representation.
Precipitation: It is the condensation of atmospheric water vapor that falls under gravity. The main forms of precipitation include rain, snow, drizzle, glaze, sleet and hail. Precipitation occurs when a portion of the atmosphere becomes saturated with water vapor, so that the water condenses and ‘precipitates’.
forms of PrecipitationRain: Rain is liquid water in the form of droplets that have condensed from atmospheric water vapor and then precipitated. Rain is a major component of the water cycle and is responsible for depositing most of the fresh water on the Earth.
Showers: Showers, also known as rain showers, have a shorter duration than rain. They tend to be quick and come in bursts. Showers come from puffy clouds or cumuliform clouds, like cumulus or cumulonimbus.
The Ministry of Earth Sciences (MoES) has commissioned a very high resolution (12 km) global deterministic weather prediction model for generating operational weather
forecasts. The model has been on trial since September 2016. It has shown significant improvements in skill of daily weather forecasts. This model has been made operational from January 16, 2017.
The present model replaces the earlier version which had a horizontal resolution of 25 km. It was very helpful, especially in predicting the track and the intensity of the recent Very Severe Cyclonic Storm Vardah and the cold wave over the northern parts of India.
MoES’s operational Ensemble Prediction System (EPS) will also be upgraded to 12 km. For this the High Performance Computing (HPC) system resources available with MoES is to be augmented to 10 Peta Flops from the current 1.2 Peta Flops. The operational EPS currently has a horizontal resolution of about 25 km. The EPS is adopted to overcome the problem of uncertainties in the forecasts. It involves the generation of multiple forecasts using slightly varying initial conditions. The EPS also help generate probabilistic forecasts and quantify the uncertainties. The Ministry of Earth Sciences (MoES) provides Weather, Climate and Hydrological Services to various users round the year and 24/7. Both operational and research aspects for these services are implemented through its constituent
Snow: Snow is a type of solid precipitation which occur in a variety of minute ice crystals at temperatures well below 0°C but as larger snowflakes at temperatures near 0°C. Snow forms when tiny ice crystals in clouds stick together to become snowflakes. Drizzle: Drizzle is a type of liquid precipitation consisting of very small droplets of water falling from low level stratus clouds. To be classed as drizzle, droplets must be less than 0.5 mm in diameter.Glaze: Glaze or glaze ice, also called glazed frost, is a smooth, transparent and homogeneous ice coating occurring when freezing rain or drizzle hits a surface.Sleet: Sleet refers to a mixture of snow and rain as well as raindrops that freeze on their way down.Hail: Hail is a form of precipitation that falls from the sky as pellets of ice. The pellets can range in size from small pea-sized pellets, to hailstones as large as grapefruits. Hail occurs during severe weather.
Climatic features
units India Meteorological Department (IMD), National Centre for Medium Range Weather Forecasting (NCMRWF), Indian Institute of Tropical Meteorology (IITM) and Indian National Centre for Ocean Information System (INCOIS).
In general, during the last five years, the skill of weather and climate forecasts in India has improved. The improvement is noted especially in general public weather forecasts, monsoon forecasts, heavy rainfall warnings and tropical cyclone warnings and alerts. The successes in predicting the Tropical Cyclones Phailin/Hudhud, heavy rainfall event in Chennai during December 2015, deficient rainfall during monsoon season of 2015 are the best examples for the improvement in prediction capability during the recent years.
Focused research and development activities have been carried out at IITM, NCMRWF and IMD on weather prediction model development and data assimilation methods. Data from the International and Indian satellites are being assimilated in the weather prediction models.
The communication of forecasts to the stake holders on time and in proper language is very important in the effective use of weather and climate forecasts and minimizing the loss and damages due to severe weather. IMD has established an effective mechanism for dissemination of weather and climate forecasts to different stake holders using different communication channels.
12 G'nY CLIMATEFebruary 2017 ● Volume 3 ● Issue 27
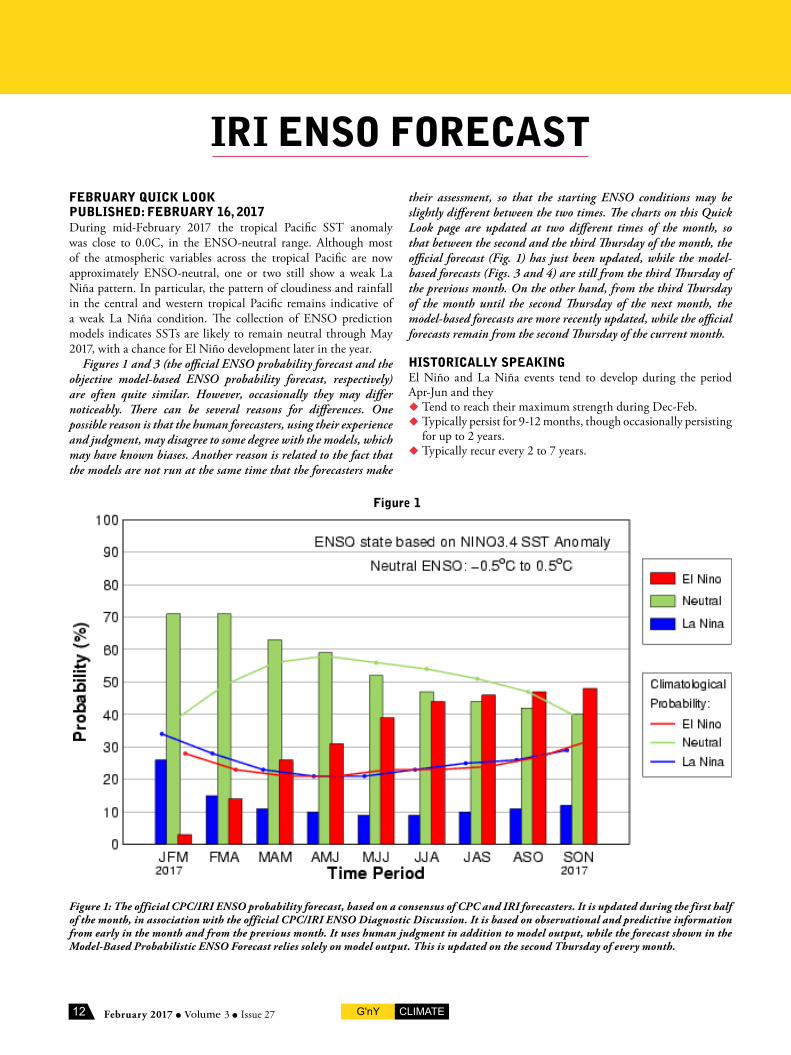
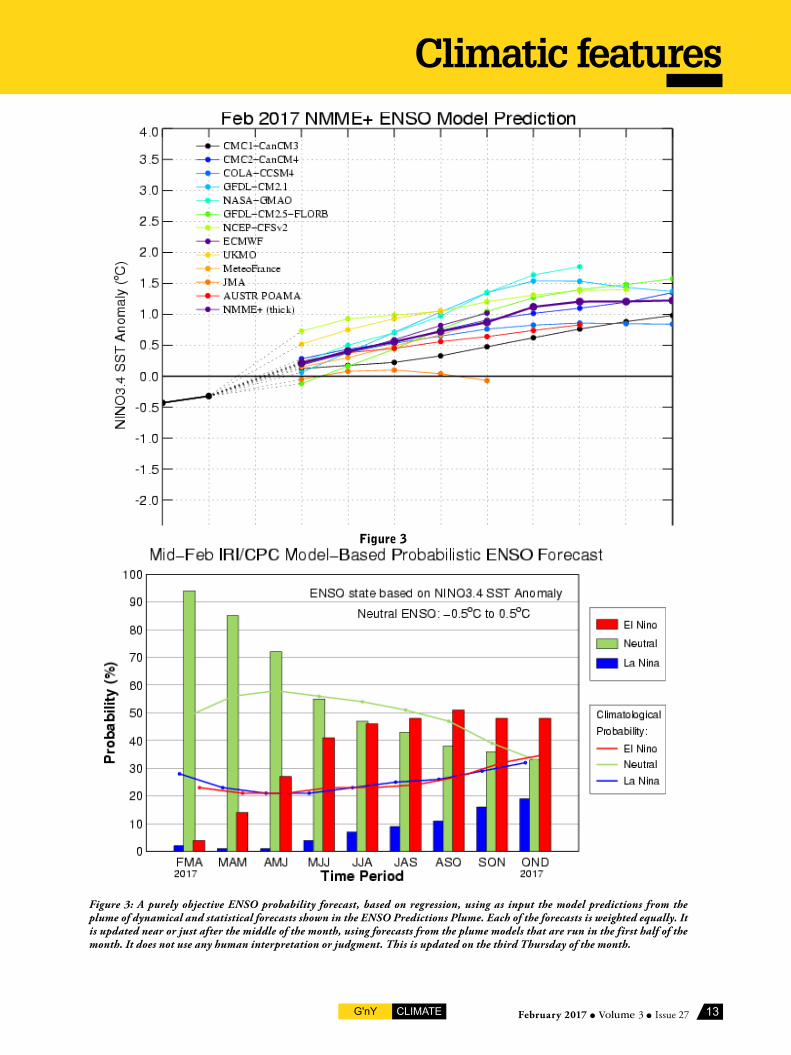
fEbruary Quick lOOkPubliShEd: fEbruary 16, 2017During mid-February 2017 the tropical Pacific SST anomaly was close to 0.0C, in the ENSO-neutral range. Although most of the atmospheric variables across the tropical Pacific are now approximately ENSO-neutral, one or two still show a weak La Niña pattern. In particular, the pattern of cloudiness and rainfall in the central and western tropical Pacific remains indicative of a weak La Niña condition. The collection of ENSO prediction models indicates SSTs are likely to remain neutral through May 2017, with a chance for El Niño development later in the year.
Figures 1 and 3 (the official ENSO probability forecast and the objective model-based ENSO probability forecast, respectively) are often quite similar. However, occasionally they may differ noticeably. There can be several reasons for differences. One possible reason is that the human forecasters, using their experience and judgment, may disagree to some degree with the models, which may have known biases. Another reason is related to the fact that the models are not run at the same time that the forecasters make
iri ENSO fOrEcaSttheir assessment, so that the starting ENSO conditions may be slightly different between the two times. The charts on this Quick Look page are updated at two different times of the month, so that between the second and the third Thursday of the month, the official forecast (Fig. 1) has just been updated, while the model-based forecasts (Figs. 3 and 4) are still from the third Thursday of the previous month. On the other hand, from the third Thursday of the month until the second Thursday of the next month, the model-based forecasts are more recently updated, while the official forecasts remain from the second Thursday of the current month.
hiStOrically SPEakiNgEl Niño and La Niña events tend to develop during the period Apr-Jun and they Tend to reach their maximum strength during Dec-Feb. Typically persist for 9-12 months, though occasionally persisting
for up to 2 years. Typically recur every 2 to 7 years.
figure 1
Figure 1: The official CPC/IRI ENSO probability forecast, based on a consensus of CPC and IRI forecasters. It is updated during the first half of the month, in association with the official CPC/IRI ENSO Diagnostic Discussion. It is based on observational and predictive information from early in the month and from the previous month. It uses human judgment in addition to model output, while the forecast shown in the Model-Based Probabilistic ENSO Forecast relies solely on model output. This is updated on the second Thursday of every month.
13G'nY CLIMATE February 2017 ● Volume 3 ● Issue 27
Climatic features
figure 3
Figure 3: A purely objective ENSO probability forecast, based on regression, using as input the model predictions from the plume of dynamical and statistical forecasts shown in the ENSO Predictions Plume. Each of the forecasts is weighted equally. It is updated near or just after the middle of the month, using forecasts from the plume models that are run in the first half of the month. It does not use any human interpretation or judgment. This is updated on the third Thursday of the month.
14 G'nY CLIMATEFebruary 2017 ● Volume 3 ● Issue 27
glObal highlightS: 2016The globally averaged temperature over land and ocean surfaces
for 2016 was the highest among all years since record keeping began in 1880. During the final month, the December
combined global land and ocean average surface temperature was the third highest for December in the 137-year record. During 2016, the average temperature across global land and
ocean surfaces was 1.69°F (0.94°C) above the 20th century average. This was the highest among all 137 years in the 1880–2016 record, surpassing the previous record set last year by 0.07°F (0.04°C). The first eight months of the year had record high temperatures for their respective months. Since the start of the 21st century, the annual global temperature record has been broken five times (2005, 2010, 2014, 2015, and 2016). The record warmth in 2016 was broadly spread around the world.
During 2016, the globally-averaged land surface temperature
figure 4
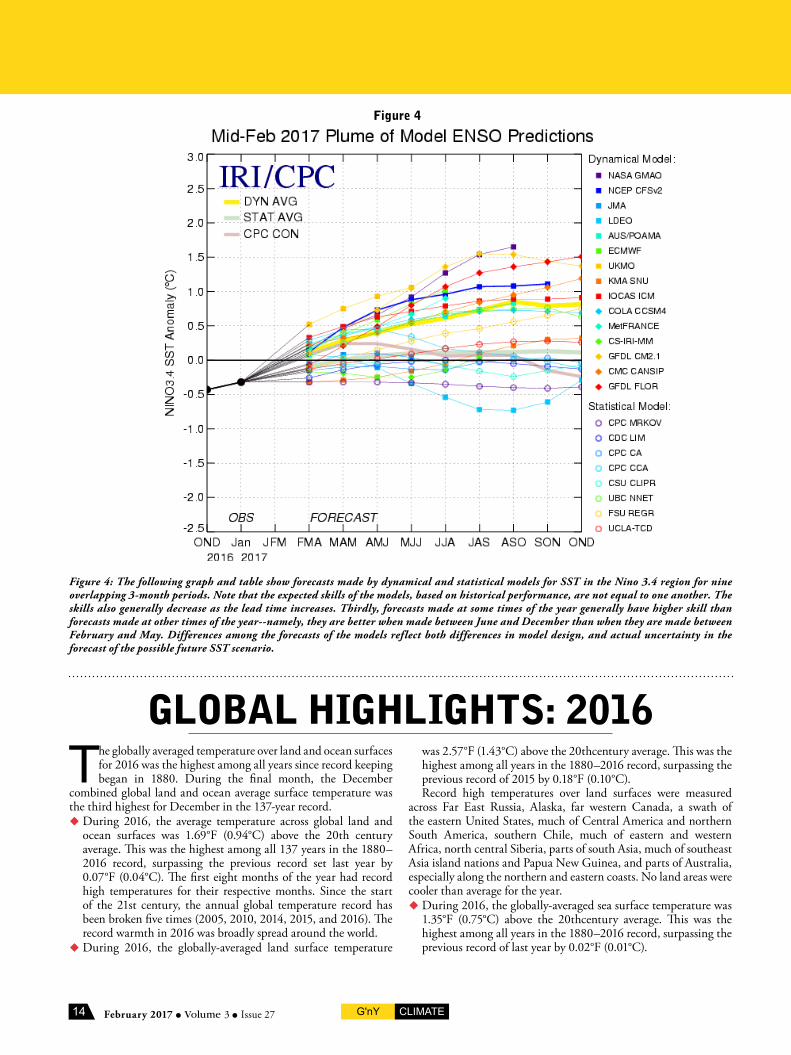
Figure 4: The following graph and table show forecasts made by dynamical and statistical models for SST in the Nino 3.4 region for nine overlapping 3-month periods. Note that the expected skills of the models, based on historical performance, are not equal to one another. The skills also generally decrease as the lead time increases. Thirdly, forecasts made at some times of the year generally have higher skill than forecasts made at other times of the year--namely, they are better when made between June and December than when they are made between February and May. Differences among the forecasts of the models reflect both differences in model design, and actual uncertainty in the forecast of the possible future SST scenario.
was 2.57°F (1.43°C) above the 20thcentury average. This was the highest among all years in the 1880–2016 record, surpassing the previous record of 2015 by 0.18°F (0.10°C).Record high temperatures over land surfaces were measured
across Far East Russia, Alaska, far western Canada, a swath of the eastern United States, much of Central America and northern South America, southern Chile, much of eastern and western Africa, north central Siberia, parts of south Asia, much of southeast Asia island nations and Papua New Guinea, and parts of Australia, especially along the northern and eastern coasts. No land areas were cooler than average for the year. During 2016, the globally-averaged sea surface temperature was
1.35°F (0.75°C) above the 20thcentury average. This was the highest among all years in the 1880–2016 record, surpassing the previous record of last year by 0.02°F (0.01°C).
15G'nY CLIMATE February 2017 ● Volume 3 ● Issue 27
Climatic features
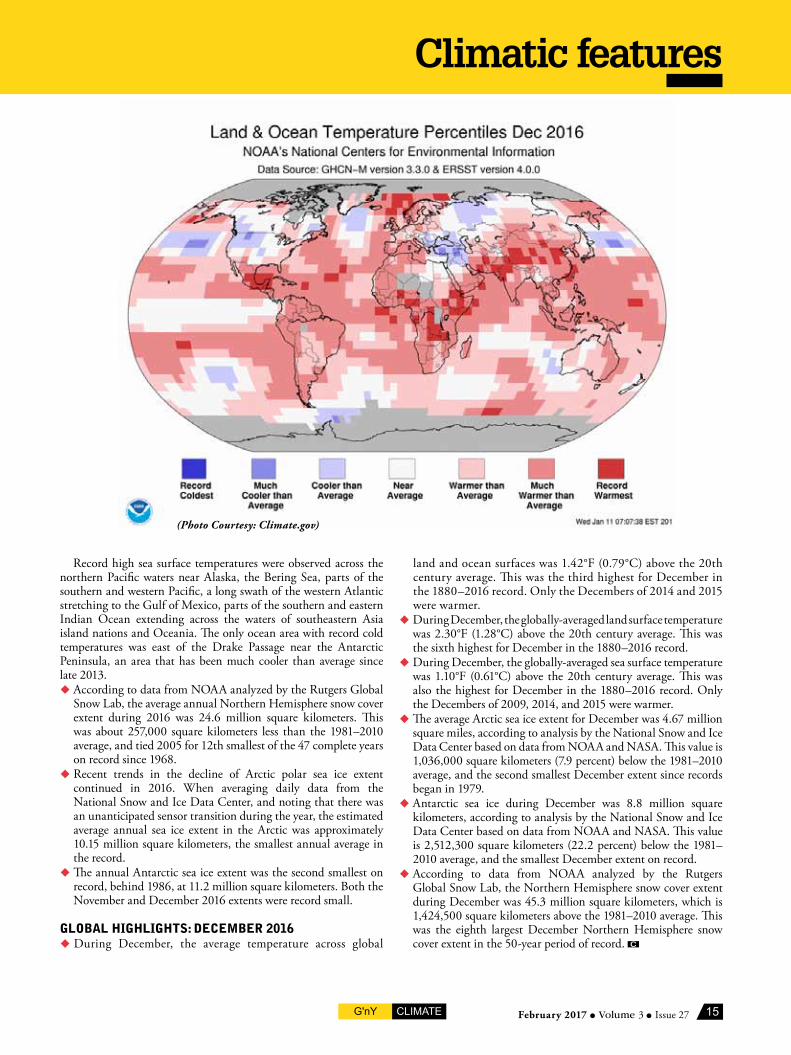
Record high sea surface temperatures were observed across the northern Pacific waters near Alaska, the Bering Sea, parts of the southern and western Pacific, a long swath of the western Atlantic stretching to the Gulf of Mexico, parts of the southern and eastern Indian Ocean extending across the waters of southeastern Asia island nations and Oceania. The only ocean area with record cold temperatures was east of the Drake Passage near the Antarctic Peninsula, an area that has been much cooler than average since late 2013. According to data from NOAA analyzed by the Rutgers Global
Snow Lab, the average annual Northern Hemisphere snow cover extent during 2016 was 24.6 million square kilometers. This was about 257,000 square kilometers less than the 1981–2010 average, and tied 2005 for 12th smallest of the 47 complete years on record since 1968.
Recent trends in the decline of Arctic polar sea ice extent continued in 2016. When averaging daily data from the National Snow and Ice Data Center, and noting that there was an unanticipated sensor transition during the year, the estimated average annual sea ice extent in the Arctic was approximately 10.15 million square kilometers, the smallest annual average in the record.
The annual Antarctic sea ice extent was the second smallest on record, behind 1986, at 11.2 million square kilometers. Both the November and December 2016 extents were record small.
glObal highlightS: dEcEmbEr 2016 During December, the average temperature across global
land and ocean surfaces was 1.42°F (0.79°C) above the 20th century average. This was the third highest for December in the 1880–2016 record. Only the Decembers of 2014 and 2015 were warmer.
During December, the globally-averaged land surface temperature was 2.30°F (1.28°C) above the 20th century average. This was the sixth highest for December in the 1880–2016 record.
During December, the globally-averaged sea surface temperature was 1.10°F (0.61°C) above the 20th century average. This was also the highest for December in the 1880–2016 record. Only the Decembers of 2009, 2014, and 2015 were warmer.
The average Arctic sea ice extent for December was 4.67 million square miles, according to analysis by the National Snow and Ice Data Center based on data from NOAA and NASA. This value is 1,036,000 square kilometers (7.9 percent) below the 1981–2010 average, and the second smallest December extent since records began in 1979.
Antarctic sea ice during December was 8.8 million square kilometers, according to analysis by the National Snow and Ice Data Center based on data from NOAA and NASA. This value is 2,512,300 square kilometers (22.2 percent) below the 1981–2010 average, and the smallest December extent on record.
According to data from NOAA analyzed by the Rutgers Global Snow Lab, the Northern Hemisphere snow cover extent during December was 45.3 million square kilometers, which is 1,424,500 square kilometers above the 1981–2010 average. This was the eighth largest December Northern Hemisphere snow cover extent in the 50-year period of record.
(Photo Courtesy: Climate.gov)
16 G'nY CLIMATEFebruary 2017 ● Volume 3 ● Issue 27
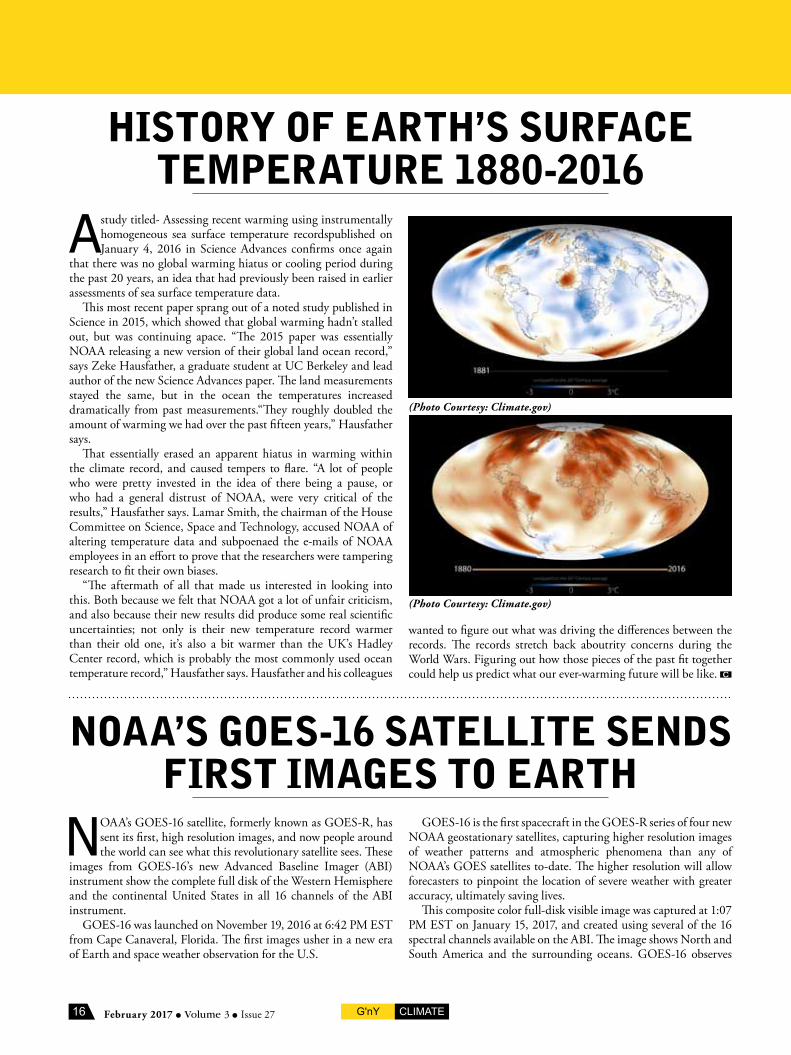
A study titled- Assessing recent warming using instrumentally homogeneous sea surface temperature recordspublished on January 4, 2016 in Science Advances confirms once again
that there was no global warming hiatus or cooling period during the past 20 years, an idea that had previously been raised in earlier assessments of sea surface temperature data.
This most recent paper sprang out of a noted study published in Science in 2015, which showed that global warming hadn’t stalled out, but was continuing apace. “The 2015 paper was essentially NOAA releasing a new version of their global land ocean record,” says Zeke Hausfather, a graduate student at UC Berkeley and lead author of the new Science Advances paper. The land measurements stayed the same, but in the ocean the temperatures increased dramatically from past measurements.“They roughly doubled the amount of warming we had over the past fifteen years,” Hausfather says.
That essentially erased an apparent hiatus in warming within the climate record, and caused tempers to flare. “A lot of people who were pretty invested in the idea of there being a pause, or who had a general distrust of NOAA, were very critical of the results,” Hausfather says. Lamar Smith, the chairman of the House Committee on Science, Space and Technology, accused NOAA of altering temperature data and subpoenaed the e-mails of NOAA employees in an effort to prove that the researchers were tampering research to fit their own biases.
“The aftermath of all that made us interested in looking into this. Both because we felt that NOAA got a lot of unfair criticism, and also because their new results did produce some real scientific uncertainties; not only is their new temperature record warmer than their old one, it’s also a bit warmer than the UK’s Hadley Center record, which is probably the most commonly used ocean temperature record,” Hausfather says. Hausfather and his colleagues
hiStOry Of Earth’S SurfacE tEmPEraturE 1880-2016
NOaa’S gOES-16 SatEllitE SENdS firSt imagES tO Earth
(Photo Courtesy: Climate.gov)
(Photo Courtesy: Climate.gov)
wanted to figure out what was driving the differences between the records. The records stretch back aboutrity concerns during the World Wars. Figuring out how those pieces of the past fit together could help us predict what our ever-warming future will be like.
NOAA’s GOES-16 satellite, formerly known as GOES-R, has sent its first, high resolution images, and now people around the world can see what this revolutionary satellite sees. These
images from GOES-16’s new Advanced Baseline Imager (ABI) instrument show the complete full disk of the Western Hemisphere and the continental United States in all 16 channels of the ABI instrument.
GOES-16 was launched on November 19, 2016 at 6:42 PM EST from Cape Canaveral, Florida. The first images usher in a new era of Earth and space weather observation for the U.S.
GOES-16 is the first spacecraft in the GOES-R series of four new NOAA geostationary satellites, capturing higher resolution images of weather patterns and atmospheric phenomena than any of NOAA’s GOES satellites to-date. The higher resolution will allow forecasters to pinpoint the location of severe weather with greater accuracy, ultimately saving lives.
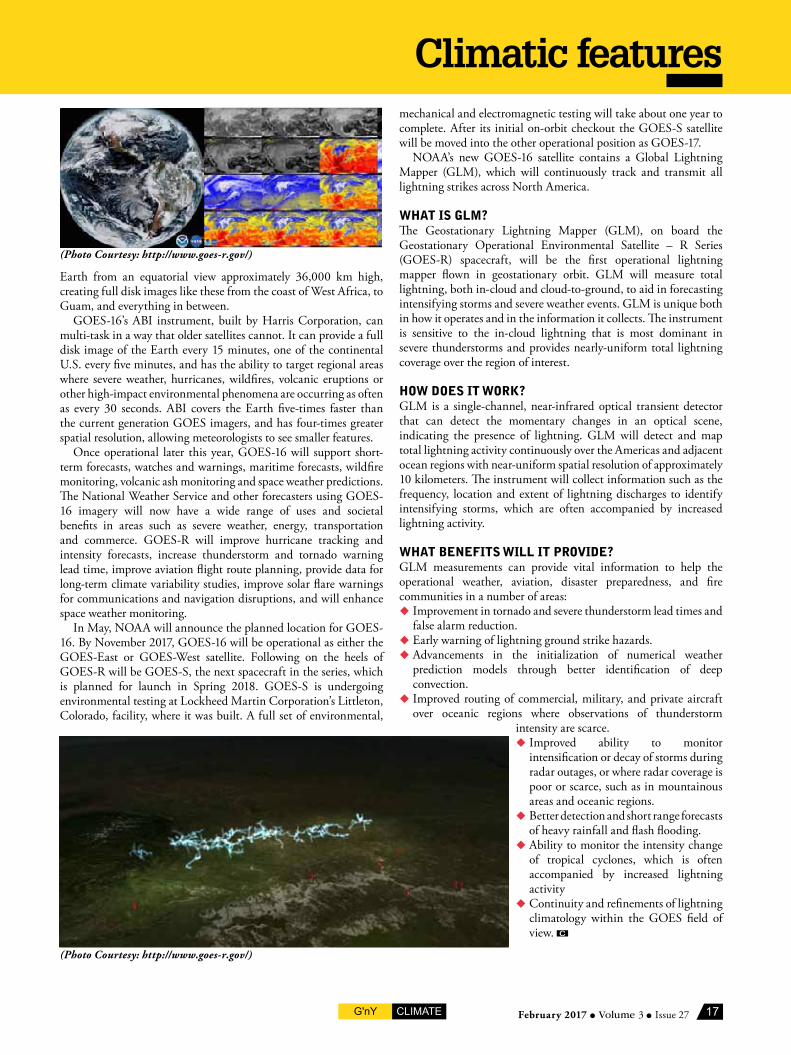
This composite color full-disk visible image was captured at 1:07 PM EST on January 15, 2017, and created using several of the 16 spectral channels available on the ABI. The image shows North and South America and the surrounding oceans. GOES-16 observes
17G'nY CLIMATE February 2017 ● Volume 3 ● Issue 27
Climatic features
Earth from an equatorial view approximately 36,000 km high, creating full disk images like these from the coast of West Africa, to Guam, and everything in between.
GOES-16’s ABI instrument, built by Harris Corporation, can multi-task in a way that older satellites cannot. It can provide a full disk image of the Earth every 15 minutes, one of the continental U.S. every five minutes, and has the ability to target regional areas where severe weather, hurricanes, wildfires, volcanic eruptions or other high-impact environmental phenomena are occurring as often as every 30 seconds. ABI covers the Earth five-times faster than the current generation GOES imagers, and has four-times greater spatial resolution, allowing meteorologists to see smaller features.
Once operational later this year, GOES-16 will support short-term forecasts, watches and warnings, maritime forecasts, wildfire monitoring, volcanic ash monitoring and space weather predictions. The National Weather Service and other forecasters using GOES-16 imagery will now have a wide range of uses and societal benefits in areas such as severe weather, energy, transportation and commerce. GOES-R will improve hurricane tracking and intensity forecasts, increase thunderstorm and tornado warning lead time, improve aviation flight route planning, provide data for long-term climate variability studies, improve solar flare warnings for communications and navigation disruptions, and will enhance space weather monitoring.
In May, NOAA will announce the planned location for GOES-16. By November 2017, GOES-16 will be operational as either the GOES-East or GOES-West satellite. Following on the heels of GOES-R will be GOES-S, the next spacecraft in the series, which is planned for launch in Spring 2018. GOES-S is undergoing environmental testing at Lockheed Martin Corporation’s Littleton, Colorado, facility, where it was built. A full set of environmental,
mechanical and electromagnetic testing will take about one year to complete. After its initial on-orbit checkout the GOES-S satellite will be moved into the other operational position as GOES-17.
NOAA’s new GOES-16 satellite contains a Global Lightning Mapper (GLM), which will continuously track and transmit all lightning strikes across North America.
What iS glm?The Geostationary Lightning Mapper (GLM), on board the Geostationary Operational Environmental Satellite – R Series (GOES-R) spacecraft, will be the first operational lightning mapper flown in geostationary orbit. GLM will measure total lightning, both in-cloud and cloud-to-ground, to aid in forecasting intensifying storms and severe weather events. GLM is unique both in how it operates and in the information it collects. The instrument is sensitive to the in-cloud lightning that is most dominant in severe thunderstorms and provides nearly-uniform total lightning coverage over the region of interest.
hOW dOES it WOrk?GLM is a single-channel, near-infrared optical transient detector that can detect the momentary changes in an optical scene, indicating the presence of lightning. GLM will detect and map total lightning activity continuously over the Americas and adjacent ocean regions with near-uniform spatial resolution of approximately 10 kilometers. The instrument will collect information such as the frequency, location and extent of lightning discharges to identify intensifying storms, which are often accompanied by increased lightning activity.
What bENEfitS Will it PrOvidE?GLM measurements can provide vital information to help the operational weather, aviation, disaster preparedness, and fire communities in a number of areas: Improvement in tornado and severe thunderstorm lead times and
false alarm reduction. Early warning of lightning ground strike hazards. Advancements in the initialization of numerical weather
prediction models through better identification of deep convection.
Improved routing of commercial, military, and private aircraft over oceanic regions where observations of thunderstorm
intensity are scarce. Improved ability to monitor
intensification or decay of storms during radar outages, or where radar coverage is poor or scarce, such as in mountainous areas and oceanic regions.
Better detection and short range forecasts of heavy rainfall and flash flooding.
Ability to monitor the intensity change of tropical cyclones, which is often accompanied by increased lightning activity
Continuity and refinements of lightning climatology within the GOES field of view.
NOAA’s new GOES-16 satellite contains a Global Lightning Mapper (GLM), which will continuously track and transmit all lightning strikes across North America.
What is GLM? The Geostationary Lightning Mapper (GLM), on board the Geostationary Operational Environmental Satellite – R Series (GOES-R) spacecraft, will be the first operational lightning mapper flown in geostationary orbit. GLM will measure total lightning, both in-cloud and cloud-to-ground, to aid in forecasting intensifying storms and severe weather events. GLM is unique both in how it operates and in the information it collects. The instrument is sensitive to the in-cloud lightning that is most dominant in severe thunderstorms and provides nearly-uniform total lightning coverage over the region of interest.
How does it work? GLM is a single-channel, near-infrared optical transient detector that can detect the momentary changes in an optical scene, indicating the presence of lightning. GLM will detect and map total lightning activity continuously over the Americas and adjacent ocean regions with near-uniform spatial resolution of approximately 10 kilometers. The instrument will collect information such as the frequency, location and extent of lightning discharges to identify intensifying storms, which are often accompanied by increased lightning activity.
(Photo Courtesy: http://www.goes-r.gov/)
What benefits will it provide? GLM measurements can provide vital information to help the operational weather, aviation, disaster preparedness, and fire communities in a number of areas:
• Improvement in tornado and severe thunderstorm lead times and false alarm reduction • Early warning of lightning ground strike hazards • Advancements in the initialization of numerical weather prediction models through better identification of deep
convection • Improved routing of commercial, military, and private aircraft over oceanic regions where observations of
thunderstorm intensity are scarce • Improved ability to monitor intensification or decay of storms during radar outages, or where radar coverage is
poor or scarce, such as in mountainous areas and oceanic regions • Better detection and short range forecasts of heavy rainfall and flash flooding • Ability to monitor the intensity change of tropical cyclones, which is often accompanied by increased lightning
activity • Continuity and refinements of lightning climatology within the GOES field of view
For more information, visit: http://www.goes-r.gov/spacesegment/glm.html
(Photo Courtesy: http://www.goes-r.gov/)
NOAA’s GOES-16 Satellite Sends First Images to Earth NOAA’s GOES-16 satellite, formerly known as GOES-R, has sent its first, high resolution images, and now people around the world can see what this revolutionary satellite sees. These images from GOES-16’s new Advanced Baseline Imager (ABI) instrument show the complete full disk of the Western Hemisphere and the continental United States in all 16 channels of the ABI instrument.
GOES-16 was launched on November 19, 2016 at 6:42 PM EST from Cape Canaveral, Florida. The first images usher in a new era of Earth and space weather observation for the U.S.
GOES-16 is the first spacecraft in the GOES-R series of four new NOAA geostationary satellites, capturing higher resolution images of weather patterns and atmospheric phenomena than any of NOAA’s GOES satellites to-date. The higher resolution will allow forecasters to pinpoint the location of severe weather with greater accuracy, ultimately saving lives.
This composite color full-disk visible image was captured at 1:07 PM EST on January 15, 2017, and created using several of the 16 spectral channels available on the ABI. The image shows North and South America and the surrounding oceans. GOES-16 observes Earth from an equatorial view approximately 36,000 km high, creating full disk images like these from the coast of West Africa, to Guam, and everything in between.
(Photo Courtesy: http://www.goes-r.gov/)
GOES-16’s ABI instrument, built by Harris Corporation, can multi-task in a way that older satellites cannot. It can provide a full disk image of the Earth every 15 minutes, one of the continental U.S. every five minutes, and has the ability to target regional areas where severe weather, hurricanes, wildfires, volcanic eruptions or other high-impact environmental phenomena are occurring as often as every 30 seconds. ABI covers the Earth five-times faster than the current generation GOES imagers, and has four-times greater spatial resolution, allowing meteorologists to see smaller features.
Once operational later this year, GOES-16 will support short-term forecasts, watches and warnings, maritime forecasts, wildfire monitoring, volcanic ash monitoring and space weather predictions. The National Weather Service and other forecasters using GOES-16 imagery will now have a wide range of uses and societal benefits in areas such as severe weather, energy, transportation and commerce. GOES-R will improve hurricane tracking and intensity forecasts, increase thunderstorm and tornado warning lead time, improve aviation flight route planning, provide data for long-term climate variability studies, improve solar flare warnings for communications and navigation disruptions, and will enhance space weather monitoring.
In May, NOAA will announce the planned location for GOES-16. By November 2017, GOES-16 will be operational as either the GOES-East or GOES-West satellite. Following on the heels of GOES-R will be GOES-S, the next spacecraft in the series, which is planned for launch in Spring 2018. GOES-S is undergoing environmental testing at Lockheed Martin Corporation’s Littleton, Colorado, facility, where it was built. A full set of environmental, mechanical and electromagnetic testing will take about one year to complete. After its initial on-orbit checkout the GOES-S satellite will be moved into the other operational position as GOES-17.
(Photo Courtesy: http://www.goes-r.gov/)
18 G'nY CLIMATEFebruary 2017 ● Volume 3 ● Issue 27
German watch has published a briefing paper, titled ‘Global Climate Risk Index 2017,’ analyzing the extent to which countries have been affected by the impacts of extreme
weather events. The analysis is based on data for 2015 and for the 1996-2015 period.
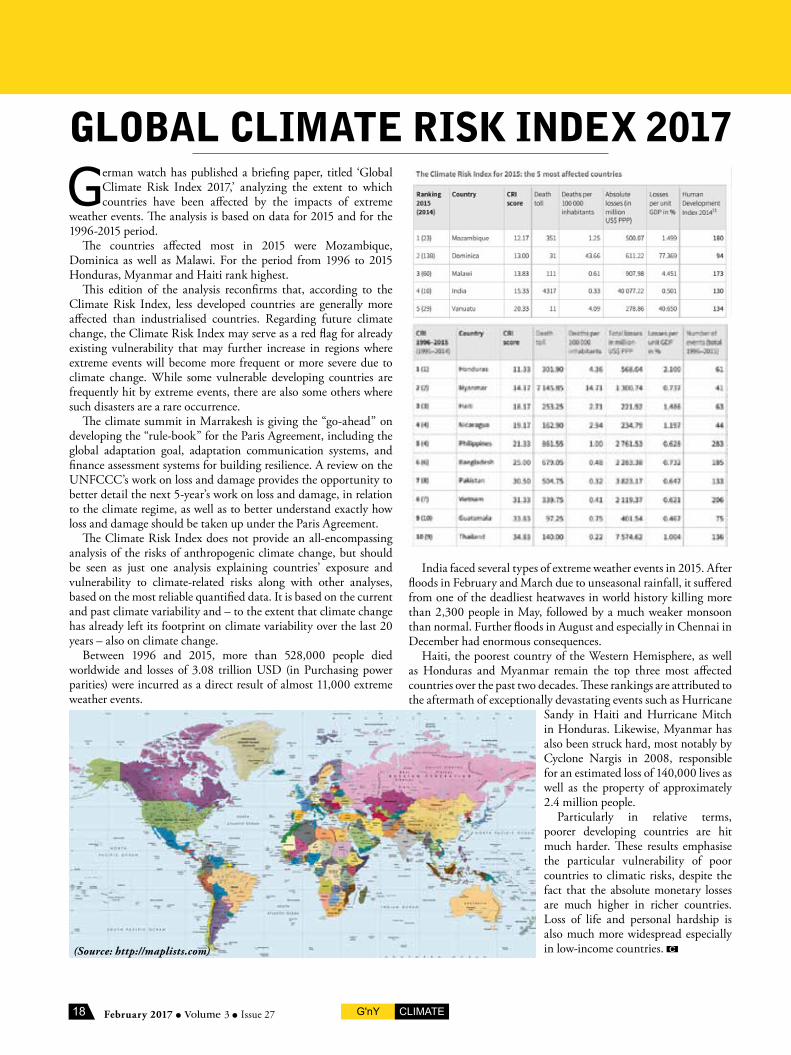
The countries affected most in 2015 were Mozambique, Dominica as well as Malawi. For the period from 1996 to 2015 Honduras, Myanmar and Haiti rank highest.
This edition of the analysis reconfirms that, according to the Climate Risk Index, less developed countries are generally more affected than industrialised countries. Regarding future climate change, the Climate Risk Index may serve as a red flag for already existing vulnerability that may further increase in regions where extreme events will become more frequent or more severe due to climate change. While some vulnerable developing countries are frequently hit by extreme events, there are also some others where such disasters are a rare occurrence.
The climate summit in Marrakesh is giving the “go-ahead” on developing the “rule-book” for the Paris Agreement, including the global adaptation goal, adaptation communication systems, and finance assessment systems for building resilience. A review on the UNFCCC’s work on loss and damage provides the opportunity to better detail the next 5-year’s work on loss and damage, in relation to the climate regime, as well as to better understand exactly how loss and damage should be taken up under the Paris Agreement.
The Climate Risk Index does not provide an all-encompassing analysis of the risks of anthropogenic climate change, but should be seen as just one analysis explaining countries’ exposure and vulnerability to climate-related risks along with other analyses, based on the most reliable quantified data. It is based on the current and past climate variability and – to the extent that climate change has already left its footprint on climate variability over the last 20 years – also on climate change.
Between 1996 and 2015, more than 528,000 people died worldwide and losses of 3.08 trillion USD (in Purchasing power parities) were incurred as a direct result of almost 11,000 extreme weather events.
glObal climatE riSk iNdEx 2017
Global Climate Risk Index 2017 Germanwatch has published a briefing paper, titled ‘Global Climate Risk Index 2017,’ analyzing the extent to which countries have been affected by the impacts of extreme weather events. The analysis is based on data for 2015 and for the 1996-2015 period.
The countries affected most in 2015 were Mozambique, Dominica as well as Malawi. For the period from 1996 to 2015 Honduras, Myanmar and Haiti rank highest.
This edition of the analysis reconfirms that, according to the Climate Risk Index, less developed countries are generally more affected than industrialised countries. Regarding future climate change, the Climate Risk Index may serve as a red flag for already existing vulnerability that may further increase in regions where extreme events will become more frequent or more severe due to climate change. While some vulnerable developing countries are frequently hit by extreme events, there are also some others where such disasters are a rare occurrence.
The climate summit in Marrakesh is giving the “go-ahead” on developing the “rule-book” for the Paris Agreement, including the global adaptation goal, adaptation communication systems, and finance assessment systems for building resilience. A review on the UNFCCC’s work on loss and damage provides the opportunity to better detail the next 5-year’s work on loss and damage, in relation to the climate regime, as well as to better understand exactly how loss and damage should be taken up under the Paris Agreement.
The Climate Risk Index does not provide an all-encompassing analysis of the risks of anthropogenic climate change, but should be seen as just one analysis explaining countries’ exposure and vulnerability to climate-related risks along with other analyses, based on the most reliable quantified data. It is based on the current and past climate variability and – to the extent that climate change has already left its footprint on climate variability over the last 20 years – also on climate change.
Between 1996 and 2015, more than 528,000 people died worldwide and losses of 3.08 trillion USD (in Purchasing power parities) were incurred as a direct result of almost 11,000 extreme weather events.
India faced several types of extreme weather events in 2015. After floods in February and March due to unseasonal rainfall, it suffered from one of the deadliest heatwaves in world history killing more than 2,300 people in May, followed by a much weaker monsoon than normal. Further floods in August and especially in Chennai in December had enormous consequences.
Haiti, the poorest country of the Western Hemisphere, as well as Honduras and Myanmar remain the top three most affected countries over the past two decades. These rankings are attributed to the aftermath of exceptionally devastating events such as Hurricane Sandy in Haiti and Hurricane Mitch in Honduras. Likewise, Myanmar has also been struck hard, most notably by Cyclone Nargis in 2008, responsible for an estimated loss of 140,000 lives as well as the property of approximately 2.4 million people.
Particularly in relative terms, poorer developing countries are hit much harder. These results emphasise the particular vulnerability of poor countries to climatic risks, despite the fact that the absolute monetary losses are much higher in richer countries. Loss of life and personal hardship is also much more widespread especially in low-income countries.
View Full Report at: https://germanwatch.org/de/download/16411.pdf
India faced several types of extreme weather events in 2015. After floods in February and March due to unseasonal rainfall, it suffered from one of the deadliest heatwaves in world history killing more than 2,300 people in May, followed by a much weaker monsoon than normal. Further floods in August and especially in Chennai in December had enormous consequences.
Haiti, the poorest country of the Western Hemisphere, as well as Honduras and Myanmar remain the top three most affected countries over the past two decades. These rankings are attributed to the aftermath of exceptionally devastating events such as Hurricane
Sandy in Haiti and Hurricane Mitch in Honduras. Likewise, Myanmar has also been struck hard, most notably by Cyclone Nargis in 2008, responsible for an estimated loss of 140,000 lives as well as the property of approximately 2.4 million people.
Particularly in relative terms, poorer developing countries are hit much harder. These results emphasise the particular vulnerability of poor countries to climatic risks, despite the fact that the absolute monetary losses are much higher in richer countries. Loss of life and personal hardship is also much more widespread especially in low-income countries. (Source: http://maplists.com)
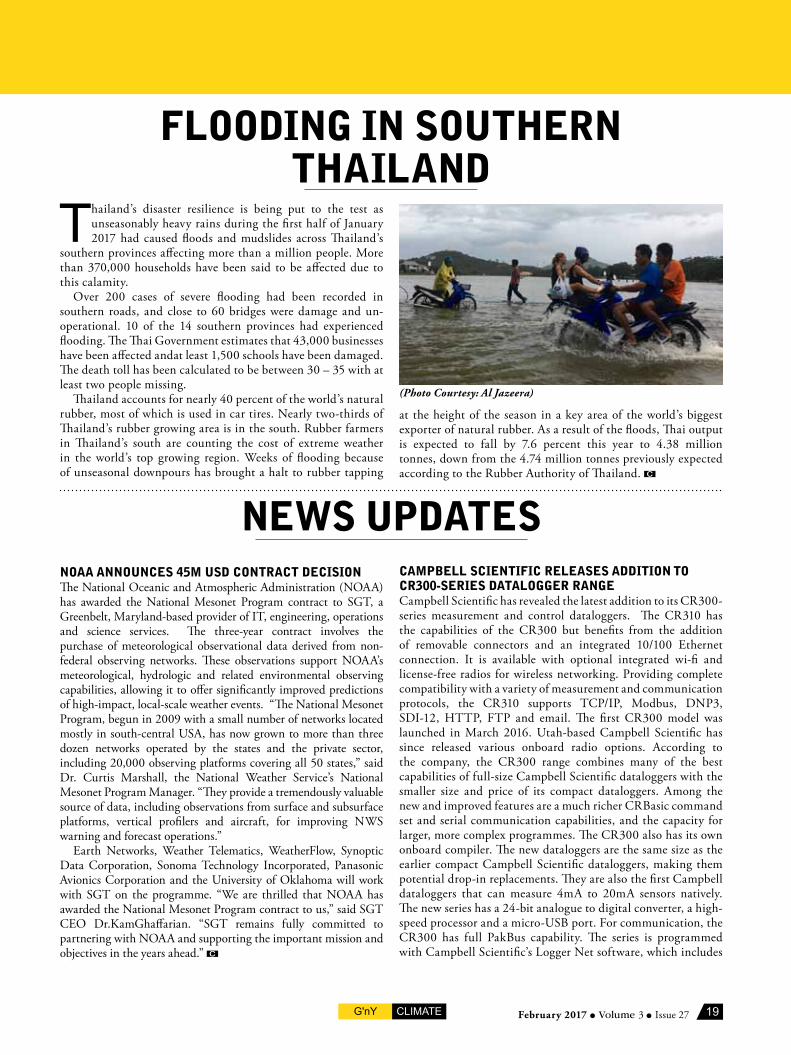
19G'nY CLIMATE February 2017 ● Volume 3 ● Issue 27
flOOdiNg iN SOuthErN thailaNd
Thailand’s disaster resilience is being put to the test as unseasonably heavy rains during the first half of January 2017 had caused floods and mudslides across Thailand’s
southern provinces affecting more than a million people. More than 370,000 households have been said to be affected due to this calamity.
Over 200 cases of severe flooding had been recorded in southern roads, and close to 60 bridges were damage and un-operational. 10 of the 14 southern provinces had experienced flooding. The Thai Government estimates that 43,000 businesses have been affected andat least 1,500 schools have been damaged. The death toll has been calculated to be between 30 – 35 with at least two people missing.
Thailand accounts for nearly 40 percent of the world’s natural rubber, most of which is used in car tires. Nearly two-thirds of Thailand’s rubber growing area is in the south. Rubber farmers in Thailand’s south are counting the cost of extreme weather in the world’s top growing region. Weeks of flooding because of unseasonal downpours has brought a halt to rubber tapping
at the height of the season in a key area of the world’s biggest exporter of natural rubber. As a result of the floods, Thai output is expected to fall by 7.6 percent this year to 4.38 million tonnes, down from the 4.74 million tonnes previously expected according to the Rubber Authority of Thailand.
(Photo Courtesy: Al Jazeera)
NEWS uPdatESNOaa aNNOuNcES 45m uSd cONtract dEciSiONThe National Oceanic and Atmospheric Administration (NOAA) has awarded the National Mesonet Program contract to SGT, a Greenbelt, Maryland-based provider of IT, engineering, operations and science services. The three-year contract involves the purchase of meteorological observational data derived from non-federal observing networks. These observations support NOAA’s meteorological, hydrologic and related environmental observing capabilities, allowing it to offer significantly improved predictions of high-impact, local-scale weather events. “The National Mesonet Program, begun in 2009 with a small number of networks located mostly in south-central USA, has now grown to more than three dozen networks operated by the states and the private sector, including 20,000 observing platforms covering all 50 states,” said Dr. Curtis Marshall, the National Weather Service’s National Mesonet Program Manager. “They provide a tremendously valuable source of data, including observations from surface and subsurface platforms, vertical profilers and aircraft, for improving NWS warning and forecast operations.”
Earth Networks, Weather Telematics, WeatherFlow, Synoptic Data Corporation, Sonoma Technology Incorporated, Panasonic Avionics Corporation and the University of Oklahoma will work with SGT on the programme. “We are thrilled that NOAA has awarded the National Mesonet Program contract to us,” said SGT CEO Dr.KamGhaffarian. “SGT remains fully committed to partnering with NOAA and supporting the important mission and objectives in the years ahead.”
camPbEll SciENtific rElEaSES additiON tO cr300-SEriES datalOggEr raNgECampbell Scientific has revealed the latest addition to its CR300-series measurement and control dataloggers. The CR310 has the capabilities of the CR300 but benefits from the addition of removable connectors and an integrated 10/100 Ethernet connection. It is available with optional integrated wi-fi and license-free radios for wireless networking. Providing complete compatibility with a variety of measurement and communication protocols, the CR310 supports TCP/IP, Modbus, DNP3, SDI-12, HTTP, FTP and email. The first CR300 model was launched in March 2016. Utah-based Campbell Scientific has since released various onboard radio options. According to the company, the CR300 range combines many of the best capabilities of full-size Campbell Scientific dataloggers with the smaller size and price of its compact dataloggers. Among the new and improved features are a much richer CRBasic command set and serial communication capabilities, and the capacity for larger, more complex programmes. The CR300 also has its own onboard compiler. The new dataloggers are the same size as the earlier compact Campbell Scientific dataloggers, making them potential drop-in replacements. They are also the first Campbell dataloggers that can measure 4mA to 20mA sensors natively. The new series has a 24-bit analogue to digital converter, a high-speed processor and a micro-USB port. For communication, the CR300 has full PakBus capability. The series is programmed with Campbell Scientific’s Logger Net software, which includes
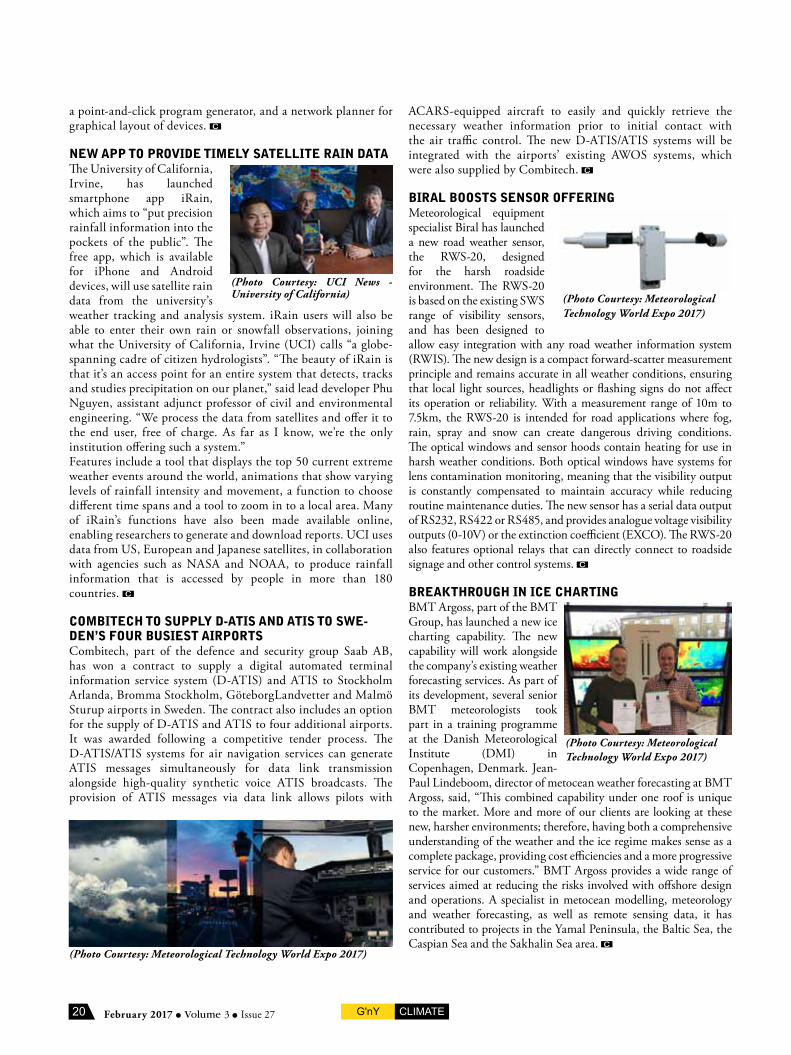
20 G'nY CLIMATEFebruary 2017 ● Volume 3 ● Issue 27
ACARS-equipped aircraft to easily and quickly retrieve the necessary weather information prior to initial contact with the air traffic control. The new D-ATIS/ATIS systems will be integrated with the airports’ existing AWOS systems, which were also supplied by Combitech.
biral bOOStS SENSOr OffEriNgMeteorological equipment specialist Biral has launched a new road weather sensor, the RWS-20, designed for the harsh roadside environment. The RWS-20 is based on the existing SWS range of visibility sensors, and has been designed to allow easy integration with any road weather information system (RWIS). The new design is a compact forward-scatter measurement principle and remains accurate in all weather conditions, ensuring that local light sources, headlights or flashing signs do not affect its operation or reliability. With a measurement range of 10m to 7.5km, the RWS-20 is intended for road applications where fog, rain, spray and snow can create dangerous driving conditions. The optical windows and sensor hoods contain heating for use in harsh weather conditions. Both optical windows have systems for lens contamination monitoring, meaning that the visibility output is constantly compensated to maintain accuracy while reducing routine maintenance duties. The new sensor has a serial data output of RS232, RS422 or RS485, and provides analogue voltage visibility outputs (0-10V) or the extinction coefficient (EXCO). The RWS-20 also features optional relays that can directly connect to roadside signage and other control systems.
brEakthrOugh iN icE chartiNgBMT Argoss, part of the BMT Group, has launched a new ice charting capability. The new capability will work alongside the company’s existing weather forecasting services. As part of its development, several senior BMT meteorologists took part in a training programme at the Danish Meteorological Institute (DMI) in Copenhagen, Denmark. Jean-Paul Lindeboom, director of metocean weather forecasting at BMT Argoss, said, “This combined capability under one roof is unique to the market. More and more of our clients are looking at these new, harsher environments; therefore, having both a comprehensive understanding of the weather and the ice regime makes sense as a complete package, providing cost efficiencies and a more progressive service for our customers.” BMT Argoss provides a wide range of services aimed at reducing the risks involved with offshore design and operations. A specialist in metocean modelling, meteorology and weather forecasting, as well as remote sensing data, it has contributed to projects in the Yamal Peninsula, the Baltic Sea, the Caspian Sea and the Sakhalin Sea area.
a point-and-click program generator, and a network planner for graphical layout of devices.
NEW aPP tO PrOvidE timEly SatEllitE raiN dataThe University of California, Irvine, has launched smartphone app iRain, which aims to “put precision rainfall information into the pockets of the public”. The free app, which is available for iPhone and Android devices, will use satellite rain data from the university’s weather tracking and analysis system. iRain users will also be able to enter their own rain or snowfall observations, joining what the University of California, Irvine (UCI) calls “a globe-spanning cadre of citizen hydrologists”. “The beauty of iRain is that it’s an access point for an entire system that detects, tracks and studies precipitation on our planet,” said lead developer Phu Nguyen, assistant adjunct professor of civil and environmental engineering. “We process the data from satellites and offer it to the end user, free of charge. As far as I know, we’re the only institution offering such a system.” Features include a tool that displays the top 50 current extreme weather events around the world, animations that show varying levels of rainfall intensity and movement, a function to choose different time spans and a tool to zoom in to a local area. Many of iRain’s functions have also been made available online, enabling researchers to generate and download reports. UCI uses data from US, European and Japanese satellites, in collaboration with agencies such as NASA and NOAA, to produce rainfall information that is accessed by people in more than 180 countries.
cOmbitEch tO SuPPly d-atiS aNd atiS tO SWE-dEN’S fOur buSiESt airPOrtSCombitech, part of the defence and security group Saab AB, has won a contract to supply a digital automated terminal information service system (D-ATIS) and ATIS to Stockholm Arlanda, Bromma Stockholm, GöteborgLandvetter and Malmö Sturup airports in Sweden. The contract also includes an option for the supply of D-ATIS and ATIS to four additional airports. It was awarded following a competitive tender process. The D-ATIS/ATIS systems for air navigation services can generate ATIS messages simultaneously for data link transmission alongside high-quality synthetic voice ATIS broadcasts. The provision of ATIS messages via data link allows pilots with
(Photo Courtesy: Meteorological Technology World Expo 2017)
(Photo Courtesy: UCI News - University of California)
New app to provide timely satellite rain data
The University of California, Irvine, has launched smartphone app iRain, which aims to “put precision rainfall information into the pockets of the public”.
The free app, which is available for iPhone and Android devices, will use satellite rain data from the university’s weather tracking and analysis system. iRain users will also be able to enter their own rain or snowfall observations, joining what the University of California, Irvine (UCI) calls “a globe-spanning cadre of citizen hydrologists”.
“The beauty of iRain is that it’s an access point for an entire system that detects, tracks and studies precipitation on our planet,” said lead developer Phu Nguyen, assistant adjunct professor of civil and environmental engineering. “We process the data from satellites and offer it to the end user, free of charge. As far as I know, we’re the only institution offering such a system.”
Features include a tool that displays the top 50 current extreme weather events around the world, animations that show varying levels of rainfall intensity and movement, a function to choose different time spans and a tool to zoom in to a local area. Many of iRain’s functions have also been made available online, enabling researchers to generate and download reports.
UCI uses data from US, European and Japanese satellites, in collaboration with agencies such as NASA and NOAA, to produce rainfall information that is accessed by people in more than 180 countries.
(Photo Courtesy: UCI News - University of California)
Combitech to supply D-ATIS and ATIS to Sweden’s four busiest airports
Combitech, part of the defence and security group Saab AB, has won a contract to supply a digital automated terminal information service system (D-ATIS) and ATIS to Stockholm Arlanda, Bromma Stockholm, GöteborgLandvetter and Malmö Sturup airports in Sweden.
The contract also includes an option for the supply of D-ATIS and ATIS to four additional airports. It was awarded following a competitive tender process.
The D-ATIS/ATIS systems for air navigation services can generate ATIS messages simultaneously for data link transmission alongside high-quality synthetic voice ATIS broadcasts. The provision of ATIS messages via data link allows pilots with ACARS-equipped aircraft to easily and quickly retrieve the necessary weather information prior to initial contact with the air traffic control. The new D-ATIS/ATIS systems will be integrated with the airports’ existing AWOS systems, which were also supplied by Combitech.
(Photo Courtesy: Meteorological Technology World Expo 2017)
(Photo Courtesy: Meteorological Technology World Expo 2017)
(Photo Courtesy: Meteorological Technology World Expo 2017)
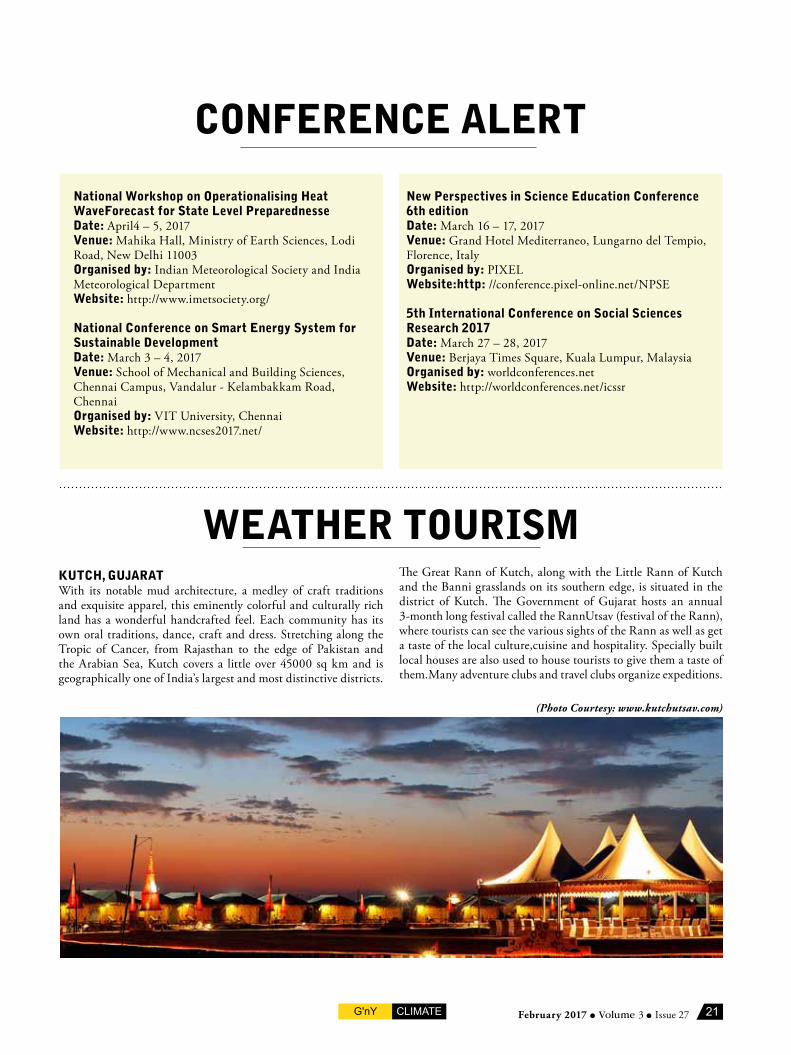
21G'nY CLIMATE February 2017 ● Volume 3 ● Issue 27
cONfErENcE alErt
National Workshop on Operationalising heat Waveforecast for State level Preparednessedate: April4 – 5, 2017venue: Mahika Hall, Ministry of Earth Sciences, Lodi Road, New Delhi 11003Organised by: Indian Meteorological Society and India Meteorological DepartmentWebsite: http://www.imetsociety.org/
National conference on Smart Energy System for Sustainable developmentdate: March 3 – 4, 2017venue: School of Mechanical and Building Sciences, Chennai Campus, Vandalur - Kelambakkam Road, ChennaiOrganised by: VIT University, ChennaiWebsite: http://www.ncses2017.net/
New Perspectives in Science Education conference 6th editiondate: March 16 – 17, 2017venue: Grand Hotel Mediterraneo, Lungarno del Tempio, Florence, ItalyOrganised by: PIXELWebsite:http: //conference.pixel-online.net/NPSE
5th international conference on Social Sciences research 2017date: March 27 – 28, 2017venue: Berjaya Times Square, Kuala Lumpur, MalaysiaOrganised by: worldconferences.netWebsite: http://worldconferences.net/icssr
kutch, gujaratWith its notable mud architecture, a medley of craft traditions and exquisite apparel, this eminently colorful and culturally rich land has a wonderful handcrafted feel. Each community has its own oral traditions, dance, craft and dress. Stretching along the Tropic of Cancer, from Rajasthan to the edge of Pakistan and the Arabian Sea, Kutch covers a little over 45000 sq km and is geographically one of India’s largest and most distinctive districts.
WEathEr tOuriSmThe Great Rann of Kutch, along with the Little Rann of Kutch and the Banni grasslands on its southern edge, is situated in the district of Kutch. The Government of Gujarat hosts an annual 3-month long festival called the RannUtsav (festival of the Rann), where tourists can see the various sights of the Rann as well as get a taste of the local culture,cuisine and hospitality. Specially built local houses are also used to house tourists to give them a taste of them.Many adventure clubs and travel clubs organize expeditions.
(Photo Courtesy: www.kutchutsav.com)
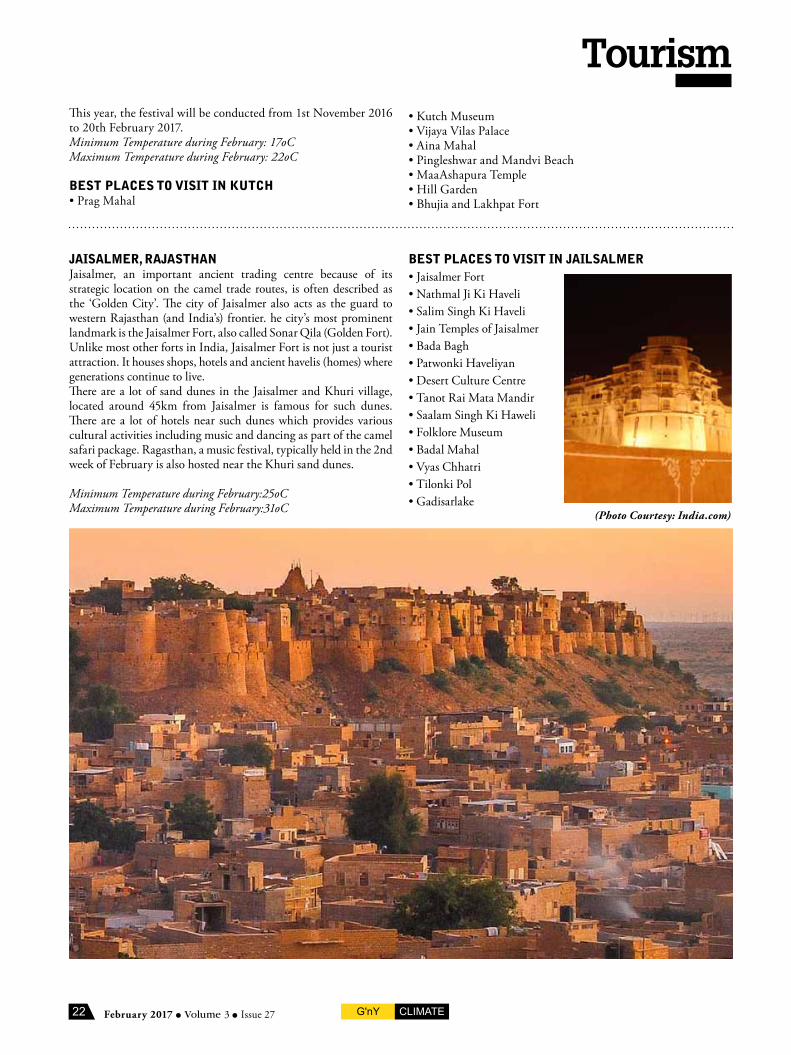
22 G'nY CLIMATEFebruary 2017 ● Volume 3 ● Issue 27
Tourism
jaiSalmEr, rajaSthaNJaisalmer, an important ancient trading centre because of its strategic location on the camel trade routes, is often described as the ‘Golden City’. The city of Jaisalmer also acts as the guard to western Rajasthan (and India’s) frontier. he city’s most prominent landmark is the Jaisalmer Fort, also called Sonar Qila (Golden Fort). Unlike most other forts in India, Jaisalmer Fort is not just a tourist attraction. It houses shops, hotels and ancient havelis (homes) where generations continue to live.There are a lot of sand dunes in the Jaisalmer and Khuri village, located around 45km from Jaisalmer is famous for such dunes. There are a lot of hotels near such dunes which provides various cultural activities including music and dancing as part of the camel safari package. Ragasthan, a music festival, typically held in the 2nd week of February is also hosted near the Khuri sand dunes.
Minimum Temperature during February:25oCMaximum Temperature during February:31oC
bESt PlacES tO viSit iN jailSalmEr• Jaisalmer Fort• Nathmal Ji Ki Haveli• Salim Singh Ki Haveli• Jain Temples of Jaisalmer• Bada Bagh• Patwonki Haveliyan• Desert Culture Centre• Tanot Rai Mata Mandir• Saalam Singh Ki Haweli• Folklore Museum• Badal Mahal• Vyas Chhatri• Tilonki Pol• Gadisarlake
(Photo Courtesy: India.com)
This year, the festival will be conducted from 1st November 2016 to 20th February 2017.Minimum Temperature during February: 17oCMaximum Temperature during February: 22oC
bESt PlacES tO viSit iN kutch• Prag Mahal
• Kutch Museum• Vijaya Vilas Palace• Aina Mahal• Pingleshwar and Mandvi Beach• MaaAshapura Temple• Hill Garden• Bhujia and Lakhpat Fort
Related Documents