The World Bank Agriculture and Rural Development Discussion Paper 13 Weather-based Insurance in Southern Africa The Case of Malawi Ulrich Hess Joanna Syroka

Welcome message from author
This document is posted to help you gain knowledge. Please leave a comment to let me know what you think about it! Share it to your friends and learn new things together.
Transcript

The World Bank
Agriculture and Rural Development Discussion Paper 13
Weather-based Insurance in Southern Africa The Case of Malawi
Ulrich Hess Joanna Syroka

© 2005 The International Bank for Reconstruction and Development / The World Bank
1818 H Street, NW
Washington, DC 20433
Telephone 202-473-1000
Internet www.worldbank.org/rural
E-mail [email protected]
All rights reserved.
The findings, interpretations, and conclusions expressed herein are those of the author(s) and do not necessarily reflect the views of the Board of Executive Directors of the World Bank or the governments they represent.
The World Bank does not guarantee the accuracy of the data included in this work. The boundaries, colors, denominations, and other information shown on any map in this work do not imply any judgment on the part of the World Bank concerning the legal status of any territory or the endorsement or acceptance of such boundaries.
Rights and Permissions
The material in this work is copyrighted. Copying and/or transmitting portions or all of this work without permission may be a violation of applicable law. The World Bank encourages dissemination of its work and will normally grant permission promptly.
For permission to photocopy or reprint any part of this work, please send a request with complete information to the Copyright Clearance Center, Inc., 222 Rosewood Drive, Danvers, MA 01923, USA, telephone 978-750-8400, fax 978-750-4470, www.copyright.com.
All other queries on rights and licenses, including subsidiary rights, should be addressed to the Office of the Publisher, World Bank, 1818 H Street NW, Washington, DC 20433, USA, fax 202-522-2422, e-mail [email protected].
About the authors
Ulrich Hess is senior economist at the World Bank. Joanna Syroka, PhD, is consultant with the commodity risk management group at ARD, World Bank.
Cover art
Malawi corn field. Joanna Syroka. 2004.

iii
CONTENTS
ACKNOWLEDGMENTS ..........................................................................................................VI
EXECUTIVE SUMMARY ...................................................................................................... VII
1. INTRODUCTION................................................................................................................. 1
2. THE CONTEXT: IMPROVE FOOD SECURITY AND REDUCE POVERTY ........... 4 FUNCTIONING MARKETS.............................................................................................................. 5
HIGHER SMALLHOLDER PRODUCTIVITY ...................................................................................... 8
ESTABLISHMENT OF SOCIAL SAFETY NETS AND EMERGENCY RISK MANAGEMENT SYSTEMS... 10
ALLEVIATION OF WEATHER SHOCK-INDUCED POVERTY .......................................................... 14
3. ONE INSTRUMENT: WEATHER-BASED INSURANCE ........................................... 14 TRADITIONAL CROP INSURANCE VERSUS WEATHER INDEX INSURANCE.................................... 15
WEATHER RISK: COUNTRY (EXAMPLE MALAWI) AND SADC LEVEL ....................................... 16
SADC RISK PROFILE ................................................................................................................... 20
MICRO LEVEL: WEATHER-BASED INSURANCE AGAINST PRODUCTION RISK............................. 23
LILONGWE FARMER MAIZE PRODUCTION INDEX....................................................................... 24
THE CASE OF MALAWI RURAL FINANCE COMPANY (MRFC) ................................................... 31
BASIS RISK – OR: HOW GOOD IS THIS INSURANCE? .................................................................. 36
MACRO LEVEL: MALAWI DROUGHT INSURANCE....................................................................... 38
SADC LEVEL: WEATHER-RISK FUND......................................................................................... 47
WEATHER INSURANCE REQUIREMENTS AND PRECONDITIONS ................................................... 52
4. CONCLUSIONS ................................................................................................................. 54
5. NEXT STEPS ...................................................................................................................... 55
APPENDIX 1: ARTES RAINFALL DATA............................................................................. 57
APPENDIX 2: SPATIAL VARIABILITY OF RAINFALL IN THE SADC REGION....... 58
APPENDIX 3: RAINFALL INSURANCE – PILOT PROJECT IN ANDHRA PRADESH, INDIA, FOLLOW-UP PROJECTS 2004 ................................................................................. 60
REFERENCES............................................................................................................................ 66
Tables
TABLE 1: PERSONS AFFECTED BY HUNGER IN SOUTHERN AFRICA ............................................... 2
TABLE 2. MALAWI: YIELD GAP BETWEEN SMALLHOLDER FARMER AND RESEARCH................... 10

iv
TABLE 3: TOTAL NUMBER OF STATIONS EXPERIENCING A METEOROLOGICAL DROUGHT, HARVEST YEARS 1965-2003 ..................................................................................................... 18
TABLE 4: OCTOBER-APRIL CUMULATIVE RAINFALL STATISTICS, HARVEST YEARS 1965-2003 19
TABLE 5: CORRELATION COEFFICIENTS (CCS) OF CUMULATIVE OCTOBER-APRIL RAINFALL TOTALS RECORDED AT EACH STATION 1-13, 1965-2003............................................................ 20
TABLE 6: SADC OCTOBER-APRIL CUMULATIVE RAINFALL STATISTICS, HARVEST YEARS 1979-2000........................................................................................................................................... 21
TABLE 7: CORRELATION COEFFICIENTS (CCS) OF CUMULATIVE OCTOBER-APRIL RAINFALL FOR SADC MEMBER COUNTRIES 1-14, 1979-2000 .......................................................................... 22
TABLE 8. TOTAL NUMBER OF COUNTRIES EXPERIENCING A METEOROLOGICAL DROUGHT, HARVEST YEARS 1979-2000....................................................................................................... 23
TABLE 9: WEIGHTS FOR MAIZE GROWING PHASES.................................................................... 25
TABLE 10: MAIZE RAINFALL INDICES (MRI) FOR MALAWI WEATHER STATIONS, 1965-2003 .. 40
TABLE 11: WEATHER-RISK VULNERABILITY PROFILE FOR SADC MEMBERS ............................ 49
TABLE 12: SIMULATION SUMMARY - DROUGHT EVENT FREQUENCY AND FINANCIAL IMPACT IN SADC REGION ........................................................................................................................... 50
TABLE 13: RISK LAYERS AND RISK TRANSFER WITHIN THE SADC REGION ................................ 51
TABLE 14: GROUNDNUT FARMER PACKAGE, CLAIM SLABS, AND RATE OF COMPENSATION ........ 61
TABLE 15: INDEMNITY PAYMENTS ............................................................................................. 61
TABLE 16: INDEX WEIGHTS FOR MAHBUBNAGAR GROUNDNUT ................................................. 64
Figures FIGURE 1: FOOD SECURITY PYRAMID ........................................................................................... 5
FIGURE 2: US FOOD AID SHIPMENTS AND GRAIN PRICES.............................................................. 7
FIGURE 3: MAIZE YIELDS IN SADC COUNTRIES 1990 - 2003 (FAO STATS) ................................. 9
FIGURE 4: MAIZE YIELDS IN MALAWI .......................................................................................... 9
FIGURE 5: MAIZE CROP CALENDAR ............................................................................................ 24
FIGURE 6: MAIZE YIELD VS. MAIZE RAINFALL INDEX ................................................................. 26
FIGURE 7: MAIZE YIELD VS. MAIZE RAINFALL INDEX REGRESSION............................................. 28
FIGURE 8: PAYOUT STRUCTURE OF MAIZE RAINFALL INDEX (NET OF PREMIUM)......................... 29
FIGURE 9: HISTORICAL PAYOUTS OF DROUGHT PROTECTION COVER .......................................... 29
FIGURE 10: RAINFALL INDEXED LOAN: PAYOUT STRUCTURE ..................................................... 33
FIGURE 11: HISTORICAL PAYOUTS OF RAINFALL INDEXED LOAN ............................................... 34
FIGURE 12: MALAWI MAIZE PRODUCTION INDEX AND SIMPLE CUMULATIVE RAINFALL ............. 41
v
FIGURE 13: MMPI VS. MAIZE PRODUCTION AND YIELDS.......................................................... 42
FIGURE 14: HISTORICAL MMPI INSURANCE PAYOUTS .............................................................. 44
FIGURE 15: PAYOUT FUNCTION FOR MMPI INSURANCE STRUCTURE ........................................ 45
FIGURE 16: FOOD SECURITY RISK MANAGEMENT - LAYERING APPROACH – THREE SCENARIOS .. 47
FIGURE 17: HISTOGRAM OF SIMULATED SADC DROUGHT EVENTS........................................... 52
FIGURE 18: EOF1 OCTOBER-APRIL NORMALIZED GPCC RAINFALL, 1986-2003 ..................... 59
FIGURE 19: EOF2 OCTOBER-APRIL NORMALIZED GPCC RAINFALL, 1986-2003 ..................... 59

vi
ACKNOWLEDGMENTS
The authors would like to thank Harold Alderman of the World Bank, who played a major role in bringing the weather-based insurance subject to the forefront and contributed conceptually and with very thorough comments. The authors are grateful for helpful comments from Panos Varangis, John Nash, Antonio Nucifora, Henri Josserand (FAO), Richard Wilcox, Bronwyn Cousins (WFP). The authors especially acknowledge Erin Bryla for her substantive editing and John Nash for guidance on the food aid subject and Hector Ibarra for his substantive contribution on food security risk management optimization. We would like to thank our peer reviewers Derek Byerlee, Kalanidhi Subbarao and Paul Dorosh for very substantial comments and advice. This work was financed by the Regional Integration Department of the Africa Region, and Joanna Syroka’s time and travel was supported by SECO, the Trade Department of the Swiss government.
vii
EXECUTIVE SUMMARY
The main purpose of this report is to conceptualize an ex-ante risk management framework for weather risk in the Southern African Development Community (SADC) region. The report lays out an overall food security policy context and analyzes the role of weather risk management techniques for food security at the national level, taking Malawi as a case study, and the regional level for the entire SADC region. Malawi was chosen as a case study because it is one of the more drought-prone countries in the region, and hence experiences chronic food crises, and is one of the members currently in the process of developing food security policy options1. In addition, and rather significantly, Malawi is reputedly a sound source of weather-related data.
Food security and weather risk management are inextricably linked: weather risk management, or the lack of it, determines the level of systemic risk in the food security system. The exposure to weather risk drives overall food insecurity. This systemic risk can be internalized and managed well and/or it can be transferred. First, society should manage the drought risk by adapting production, making markets function, establishing safety nets, and preparing for emergencies through ex-ante emergency risk management, all of which are explained in greater detail below. Secondly, people can transfer part of the risk out of the country for a premium at all levels: micro, meso, and macro.
The management of drought risk involves food security being achieved through:
• Functioning markets.
• Higher smallholder productivity.
• Social safety nets and distinct emergency risk management.
Functioning markets and the right incentives form the foundation upon which higher smallholder productivity can be achieved and proper production and markets form the platform upon which social safety nets and emergency risk management can function effectively. However, without social safety nets and food available in times of real food crises through proper ex-ante and ex-post emergency risk management, it is politically and socially problematic to establish functioning markets. Weather-risk management and objective drought-triggered access to resources in cases of predictable food emergencies is complementary to properly functioning input and output markets, good governance in the management of strategic grain reserves, and adequate smallholder productivity.
Functioning input, output, and storage markets are the basis for food security. Only if farmers and traders have proper incentives to produce and intermediate goods, will people have access to food in times of crises. With incomplete or failed markets, particularly for storage purposes,
1 Zambia is at a similar juncture, but the data collection process is not yet finalized.

viii
remote areas will tend to be underserved by food traders, especially if traders can expect the government or donors to intervene with free or under-priced food supplies.
Smallholder productivity, in the appropriate crops, needs to be raised. Extension services, private sector providers of inputs and services to farmers, supported by modern farming advice need to upgrade quality and availability of technical support to farmers. In the end, costs will be minimized through optimal input applications as yields rise.
Government and donors need to distinguish between social safety nets and emergency risk management: the target groups, the types of intervention, and the timing of interventions are very different for each of these schemes. A foreign food aid influx that is not governed by a clear and targeted emergency risk management strategy can further distort incentives within the food market. Effective ex-ante emergency risk management requires improved early warning systems and accurate production estimates. Food emergencies require two immediate response factors: small national physical strategic grain reserve (SGR) and emergency relief cash. The SGR would be governed by clear, simple, and transparent rules for the purchase, roll-over, and release of grain and the emergency relief cash. This would be made accessible to SADC, governments, intermediaries, maize producers, and consumers in the form of vouchers or actual cash.2
At the farm level, weather-based index insurance allows for more stable income streams and could thus be a way to protect peoples’ livelihoods and improve their access to finance. Weather-based insurance instruments provide financial protection based on the performance of a specified index in relation to a specified trigger and they offer protection against the uncertainty in revenue accruement that results from volume volatility. Buyers are compensated for unfavorable weather fluctuations that adversely impact physical production so a farmer or a group of farmers could buy such a product to reduce the weather risks in farming. For example, an insurance product can be based on a maize production index constructed from weather data recorded at Lilongwe airport weather station. Analysis and simulations conducted for the Lilongwe area, capital of Malawi, indicate that the match between potential insurance payouts and farm yield losses would be adequate. All that is needed is for demand to be aggregated at farm level and product distribution channels such as the National Smallholders Association (NASFAM) to be found. Rural finance institutions could finance the premium and lower interest rates since they stand to benefit from reduced default risk.
At the intermediary level, banks can package a loan and the weather insurance based on the farmers areas index into a single product: the weather-indexed maize production loan. The farmer would enter into a loan agreement with a higher interest rate that includes the weather insurance premium that the bank pays to the insurer. In case of a severe drought impacting maize yields, the borrower would pay only a fraction of the usual loan due and would be less likely to default, thus strengthening the bank’s portfolio and risk profile. Historical simulations of such a product in Malawi demonstrate that the years of reduced loan-dues payments coincide with the drought years in which farmers suffered from much lower yields, mainly the years 1992 and 1994.
At the macro level, a specific nation-wide maize production index for the entire country could form the basis of an index-based insurance policy or an objective trigger to a contingent credit
2 Regional physical grain reserves are not an adequate answer to the problem of food insecurity at this stage.

ix
line for the government in the event of food emergencies that put pressure on government budgets. Applying the Lilongwe maize farmer index approach to the macro situation, we can define a Malawi Maize Production Index (MMPI) as the weighted average of farmer maize indices measured at weather stations located throughout the country, with each station’s contribution weighted by the corresponding average or expected maize production in that location.
Weather-indexed insurance products could be reinsured in the global weather-risk market, effectively transferring the risk from Malawi to the international reinsurance and capital markets. Judging by other country experiences, weather market players, from both the reinsurance and financial communities, are interested in these new developing country transactions. The new risks and locations, introduced by the new countries, allow for more diversification and hence enhance the risk/return characteristics of portfolios. This should ultimately lead to more aggressive pricing of weather insurance products in the global market, more new firms entering the sector because of greater market liquidity and thus to greater business growth and expansion through broadening product offerings and increasing global networks.
Given the objective nature of the MMPI, and the quality of weather data from the Malawi Meteorological Office, such a structure could be placed in the weather-risk reinsurance market. Analysis shows that Malawi could need up to $70 million per year to financially compensate the government in case of an extreme food emergency. Given the size, such a transaction would be treated on a stand-alone basis, with an estimated premium of approximately three times the expected loss for the reinsurer. In this case, the expected loss - given 40 years of historical rainfall data and assuming that the government retains the cost associated with deviations in maize production up to 25% away from normal - is $2.32 million implying a premium $6.96 million or an insurance rate of 10% for such a product.
The weather-indexed drought-risk management approach suggested for Malawi is one that could be extended to a regional level to include all members of SADC at some point in the future. Weather-risk can be retained and managed internally if the areas under management are significantly diverse in their weather-risk characteristics. This immediately suggests that the weather sensitivity of neighboring countries, the SADC members, must be taken into account when considering Malawi’s weather-risk profile and its need for outside insurance. Analysis of the SADC region shows that on average, two countries suffer a drought each year. However, the distribution of drought events in SADC is extremely long-tailed, with the possibility of widespread drought events that could potentially devastate the region. This indicates that the most efficient way to layer, and thus manage the risk is as follows:
A. SADC Fund: If the average financial impact of four average droughts in the region is approximately $80 million dollars, this could be the size of the SADC fund, with each member contributing its share determined by an actuarially fair assessment of the expected claim of each country.
B. Reinsurance and/or contingent credit lines: SADC-wide events incurring a financial loss of $80million-$350million could be transferred to the weather-risk reinsurance/professional investor market. Alternatively, the SADC members could have access to a World Bank contingent credit line in such situations.
C. Securitization: The final and extreme tranche of risk, such as droughts in 10 countries, occurring 1% of the time, could be securitized and issued as a cat bond (investors lose

x
principal if event occurs in exchange for higher coupon) in the capital markets. Advantage of this risk transfer into capital markets is its longer tenure of up to three years, possibly longer.
A more efficient means of transferring risk implies that costs could be greatly reduced for the member countries by transferring risk as part of a regional strategy rather than by transferring that risk one country at a time. For example, the SADC fund approach above would reduce insurance costs by 22% for Malawi due to risk pooling effects.
In order to implement a successful weather-risk management program, with risk transfer into international markets, the data used to construct the underlying weather indices must adhere to strict quality requirements. In particular, the following aspects are essential:
• Reliable and trustworthy on-going daily collection and reporting procedures.
• Daily quality control and cleaning.
• A long, clean historical record to allow for a proper actuarial analysis of the weather risks involved.
Weather reporting networks may not be of the necessary high standard in all SADC countries. An alternative is to use satellite-based products to measure the pertinent weather parameters or the impact of weather. A feasibility study is currently underway to see if these products could be used as viable alternatives to weather stations on the ground. If the results of this study are positive, managing weather-risk through indexed insurance could be possible in all regions of the world.
In order to strengthen the ex-ante emergency risk management part, the World Bank could provide a contingent credit facility to the SADC countries through the SADC fund. Thus, the World Bank would “back-up” the SADC fund with a credit facility that can be called upon when the SADC fund is insufficient to cover all member country claims. The World Bank funds disbursed to the member countries would then become loans3. The donor community could also subsidize premiums or provide some of the SADC fund back-up facility as grants rather than loans. For securitization, the World Bank could guarantee the bi-annual premium payments by SADC to the cat bond holders. Such an AAA guarantee would be necessary to place this bond in the markets with a competitive rating. The International Finance Corporation (IFC) could play a significant role by investing in warehouse receipt systems and in weather-risk transfer mechanisms through private risk funds.
3 Currently the World Bank offers a Deferred Draw Down Option (DDO) for IBRD countries that allows countries to access funds as needed up to two or three times throughout the life of the loan standby period for a commitment fee. A similar mechanism would have to be designed for IDA countries.

1
1. INTRODUCTION
SADC countries are subject to periodically recurring weather shocks. This weather risk destabilizes households and countries and creates food insecurity, as is evident in Table 1.
Within this table, the number of people requiring external food assistance in countries classified as those facing food emergencies, and not having sufficient capacity to deal with the emergency effectively on their own is shown. Food emergencies may be declared in the event of natural disasters, conflict, or economic problems. Natural disasters caused by hazards such as drought, floods, frost, pest attacks and adverse weather involving poor and/or excessive rains can all lead to sharp declines in agricultural productivity and losses of stored crops, and create temporary food shortages for both farmers and urban consumers. War and civil strife create temporary food insecurity for internally displaced persons (IDPs) and refugees while the conflicts are in progress; in the aftermath of conflict, IDPs and returnees require temporary assistance until their livelihood systems can be restored. Economic problems and disruptions cause loss of productive capacity and consequent loss of purchasing power for affected persons.
In many emergency-prone countries in Africa, natural or manmade disasters keep recurring in a context where the food security situation is already fragile. In addition to a current emergency, past emergencies may be having a cumulative negative impact for a significant portion of the population. Often it is the interplay of several factors, and not only a single disastrous event, that creates the emergency. At present, there are no internationally agreed criteria for defining the causes of declared humanitarian emergencies, other than the very general ones mentioned above. Because of this, the attribution of reasons for the food emergencies listed in this table should be regarded as indicative only.
The numbers given for persons affected by these emergencies should also be used with caution. While the numbers probably reflect reasonably well the size of the population that has been affected at a given point in time, the period during which an affected person may require help can vary from a few days or weeks, to several months, to a whole year, depending on the nature and severity of the emergency. Estimates of food aid requirements in an emergency situation are prepared on the basis of: the number of persons affected, the length of time for which assistance is needed, and the magnitude and type of the food deficit to be covered.
Governments and donors react to these shocks rather than managing the risk in an ex-ante mode. These emergency reactions can lead to distortions, a waste of resources, and rent seeking. The assistance that has been administered to cope with the aftermath of shocks has been large in magnitude4, often ad hoc, and sometimes untimely. In fact, a recent World Bank Board briefing paper stated:
4 The World Bank alone has lent more than $43 billion for over 550 natural disaster related projects, excluding reallocation from on-going projects, but the amount of support goes unrecognized and this portfolio is not managed strategically.

2
“the need to explore…financial instruments that incorporate a certain degree of automat city in providing timely additional finance to cope with the aftermath of an exogenous shock.”5
This briefing paper further stated the:
“need to re-examine whether there is scope for the international community to facilitate low-income countries access to marked-based mechanisms such as hedging and insurance, for example…insurance markets for weather risks. The use of market mechanisms should be part of exploring ex-ante responses to shocks.”6
Table 1: Persons affected by hunger in Southern Africa
Southern Africa
Reasons, 1999 Reasons, 2000 Reasons, 2001 Reasons, 2002 Reasons, 2003
Angola Civil strife Civil strife Civil strife Civil strife Civil strife
Lesotho Adverse weather Drought, frost
Madagascar Floods, cyclones Drought, economic problems
Drought, economic problems
Malawi Adverse weather
Mozambique Drought in parts Floods, cyclones Drought in parts Drought in parts Adverse weather
Swaziland Drought Drought
Zambia Adverse weather Adverse weather
Zimbabwe Drought, economic disruption
Drought, economic disruption
Approximate number of affected persons
(thousand)
Southern Africa 1 825 2 350 4 425 16 700 9 500
Source: FAO Global Information and Early Warning System, internal communication based on qualitative information gleaned by GIEWS analysis from government sources, WFP assessments and emergency operations plans, UN appeals, UN reports on nutrition situations of refugees and displaced populations, among others.
In response to the recurring food security issues experienced in SADC countries and this World Bank briefing paper, the main purpose of this report is to conceptualize an ex-ante risk management framework for weather-risk in the SADC region. It analyzes the role of weather-
5 Exogenous shocks in low income countries: Policy Issues and the Role of the World Bank, Technical Briefing to the Board, ARD/PREM/FRM, March 2004, p.28.

3
risk management techniques for agriculture in SADC countries, using Malawi as a case study, and for food security regimes. A related objective is to explore ways to better predict food emergency situations. How would these techniques work in SADC countries? What are the benefits for drought-exposed parties at macro, meso, and micro levels? The report also simulates the use of these instruments and provides pricing scenarios, thereby providing case studies that can serve as a blue print for projects. Finally, this report places these risk management questions into a broader food security framework and discusses policy options that could improve prevention and ex-ante management of food crises.
Malawi was chosen as a case study because it is one of the more drought-prone countries in the region, and hence experiences chronic food crises, as well as being one of the members currently in the process of developing food security policy options. In addition, and rather significantly, Malawi has been reputed to have a sound source of weather-related data. The general food security country context is as follows: the predominant staple food, maize, has very low yields; stock-piling at private and even public levels are underdeveloped; the financial system is weak and the government is preparing a new food security policy that seeks to determine the appropriate levels of strategic grain reserves.
This report responds directly to requests from clients within and outside the World Bank such as the following:
• The Africa Social Protection Group (Haque/Alderman)7 of the World Bank is interested in the use of weather-risk management tools for social transfer payments at the micro and meso level.
• The Rural and Agriculture Sector Group Southern Africa (Nucifora/Hess)8 of the World Bank is interested in the role of weather-based index insurance for food security systems in the region.
• The World Food Program (WFP) run by Richard Wilcox in the Treasury Unit wants to determine if the weather-risk management tools can be used to reinsure WFP’s extreme drought exposures or to allocate emergency aid in the territory more efficiently.
• Food and Agriculture Organization’s (FAO’s) Commodities Division, Early Warning System Group (GIEWS) partnered with the Commodity Risk Management Group (CRMG) in ARD wants to determine if index-based insurance can be a tool to protect farmers around the world and whether or not the early warning system can be improved with these indices.
The advantages of index insurance products derive from the objective nature of the settlement basis, which cannot be impacted by the insured party’s behavior. This is provided that the index is well constructed and the payout corresponds to the damage suffered by the farmer, in particular when the coverage is catastrophic. In other words, basis risk, the potential mismatch between insurance payouts and actual losses, needs to be managed and made transparent. It must be stressed that weather-risk management and drought-triggered access to resources in cases of
7 Study on Insurance against Covariate Shocks: Role of Food Aid & Social Protection in Africa. 8 Strategies to respond to food emergency crises in the SADC region; the role of weather-indexed insurance and commodity stockpiling.

4
(upcoming) food emergencies is complementary to properly functioning input and output marketing systems, good governance in the management of public resources, and adequate smallholder productivity. Automatic access to weather triggered contingent credit lines or insurance payouts do not replace “putting one’s house in order.”
The principles of this study and the weather-risk management approach are simplicity, transparency, and objectivity. Risk transfer from one party to another is made possible by these principles as well as solid analytical work for the insurance design. The insurance index needs to be simple, but sophisticated enough to effectively transfer the risk. The index is the common language that two parties need to master equally well. Southern African governments and international insurance or capital market players have one language in common - weather parameters. A millimeter of rain is a universally accepted concept, not even music manages that type of global reach! A good index overcomes asymmetric information by leveling the playing field; it creates trust and ultimately reduces risk transfer costs.
Chapter 2 of this report places the weather-risk management instrument in the context of an analytical framework for the food security complex whilst chapter 3 analyzes the weather-based insurance concept and its applications in the SADC region at the micro, meso, macro, and regional level. The report will finally conclude with general recommendations and an explanation of the potential World Bank Group role in this promising scheme.
2. THE CONTEXT: IMPROVE FOOD SECURITY AND REDUCE POVERTY
Food security and weather-risk management are inextricably linked: drought risk management, or the lack of it, determines the level of systemic risk in the food security system. The exposure to drought risk drives overall food insecurity. This big risk can be internalized and managed well and/or it can be transferred. The management of drought risk involves adapting production, making markets function, establishing effective social safety nets and preparing for food emergencies through ex-ante emergency risk management.
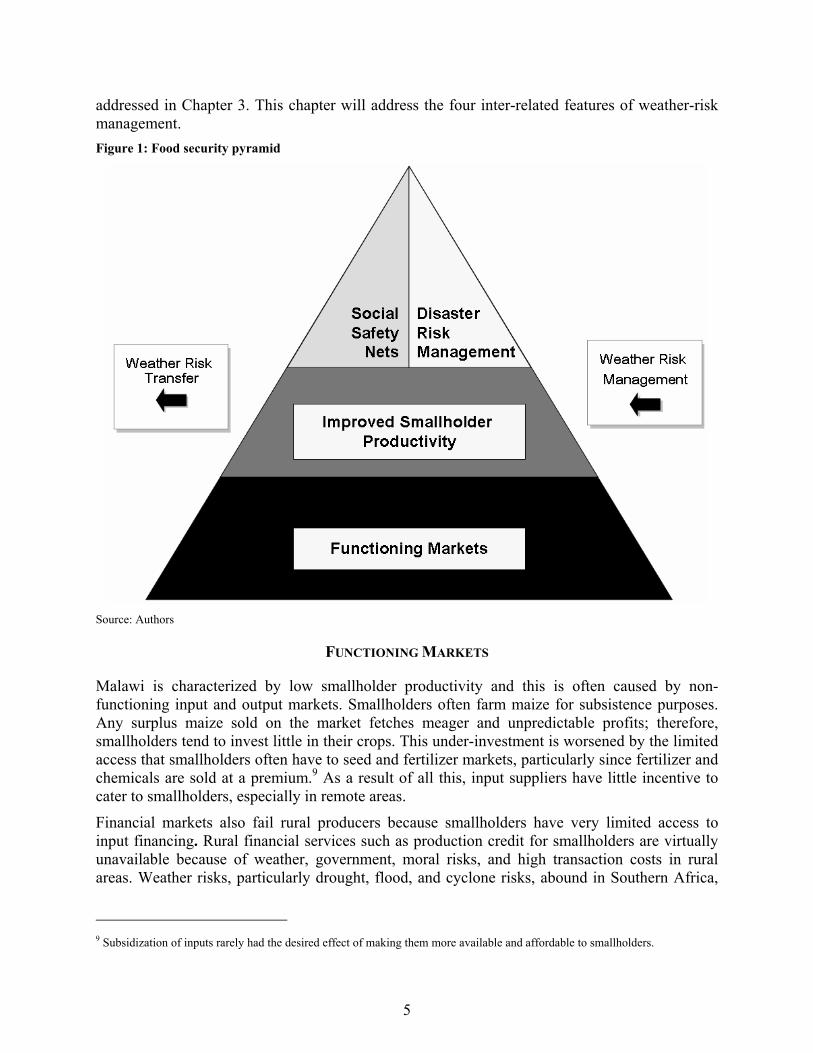
The pyramid in Figure 1 demonstrates how weather risk permeates these four main interdependent components involved in food security. The components may be interdependent, but not in an equal manner. Functioning markets form the firm foundation, without which higher smallholder productivity cannot be achieved. Consequently, social safety nets and emergency risk management schemes cannot function effectively. The characteristic of interdependence arises during times of real food crises. Without social safety nets and food, which is supplied through effective ex-ante and ex-post emergency risk management schemes, it is politically and socially problematic to establish functioning markets.
As is evident in Figure 1, weather-risk transfer is one potentially important element of each of these four components. This transfer of drought risk occurs at all levels – micro, meso, and macro – where society can transfer part of the risk out of the country for a premium, a feature
5
addressed in Chapter 3. This chapter will address the four inter-related features of weather-risk management. Figure 1: Food security pyramid
Source: Authors
FUNCTIONING MARKETS
Malawi is characterized by low smallholder productivity and this is often caused by non-functioning input and output markets. Smallholders often farm maize for subsistence purposes. Any surplus maize sold on the market fetches meager and unpredictable profits; therefore, smallholders tend to invest little in their crops. This under-investment is worsened by the limited access that smallholders often have to seed and fertilizer markets, particularly since fertilizer and chemicals are sold at a premium.9 As a result of all this, input suppliers have little incentive to cater to smallholders, especially in remote areas.
Financial markets also fail rural producers because smallholders have very limited access to input financing. Rural financial services such as production credit for smallholders are virtually unavailable because of weather, government, moral risks, and high transaction costs in rural areas. Weather risks, particularly drought, flood, and cyclone risks, abound in Southern Africa,
9 Subsidization of inputs rarely had the desired effect of making them more available and affordable to smallholders.

6
which leads to widespread defaults on loans. Since smallholders have little or no collateral besides their crops, this systemic or covariate risk can wipe out entire rural finance portfolios and create a high entry barrier for banks. Drought-exposed maize, in particular, attracts very little financing.10 Moreover, until recently, banks in the area were comfortable investing in profitable low-risk government securities.11
Government intervention in input and output prices for maize farming make the business environment for input suppliers and traders very unpredictable and risky. Thus, traditional transmission mechanisms do not work and input and output markets fail the participants with the least purchasing power and the highest transaction costs – mainly smallholders. Maize output markets are often distorted by state interventions in supply and prices. For instance, in Malawi the state maize marketing board used to guarantee a maize purchase price of 17 MK, which was meant to benefit consumers across the country, but effectively dis-intermediated local markets. The unpredictable nature of maize purchases and maize releases by the Agricultural Development and Marketing Corporation (ADMARC) and the National Food Reserve Agency (NFRA) distorted markets and negatively affected producer incentives.
Functioning markets are the way forward. Functioning input, output, and storage markets are the basis for food security. Only if farmers and traders have proper incentives to produce any intermediate goods, will people have access to food in times of crises. Markets for goods, services, and labor need to function across boundaries. Trade restrictions such as high tariffs and even temporary bans on food exports, for example, distort incentives and disrupt traditional markets that transcend borders.12 For instance, in Malawi the transition from a tightly controlled centrally planned marketing board-run maize regime to a liberalized market is difficult. In fact, an incomplete liberalization, such as free input markets but not fully privatized output markets13 can lead to worse outcomes for farmers and consumers. In summary, there is no reason why countries such as Malawi and Zambia should not be net exporters of food since agro-climatic conditions are relatively good, despite the volatility in rainfall patterns.
With incomplete or failed markets, remote areas tend to be underserved by traders, especially if traders can expect the government or donors to intervene with free or under-priced food supplies. Functioning markets for storage and financial services are therefore crucial, especially in remote areas. If traders have access to storage in or near these areas and even access to financing based
10 The comparison with cotton farming in Zambia is interesting. Cotton ginners and traders finance inputs and provide advice to farmers with extremely low default rates. Margins are higher and predictable due to: a) the absence of state interventions in that market b) drought resistance of cotton and c) labor intensity of cotton, which makes it very competitive in Zambia. These same traders would never touch the highly politicized and lower margin maize. 11 Government risk is constituted by the following: a) the threat of debt moratoriums or other interventions in the creditor-debtor relationship in the name of social motives and b) intervention in price markets that devalue the only collateral that smallholders hold: their crops. 12 For example, Southern Malawi and Northern Mozambique share the same markets, people, and languages and traditionally trade with each other across the (artificial) border that separates the two countries. 13 In Malawi there are signs that ADMARC cannot afford to store or purchase inputs in any meaningful manner, but private sector players have largely held back due to concerns over potentially adverse unpredictable price interventions by ADMARC or NFRA. The most recent FAO Food Crops and Shortages states that “ADMARC has now been mandated to operate as a commercial company buying and selling maize and other agricultural commodities for profit. Private traders interviewed by the mission are unsure of the government's subsidization policies and are, therefore, taking a ‘wait and see’ attitude before engaging in maize trading.”

7
on stored commodities (warehouse receipt financing), they can increase turnovers and cost of carrying. As a result, competition in the area increases and food prices decline. At the same time, farmers in the area can store their produce and thereby smooth sales over the season and maximize revenues. Intra-annual maize price swings can go from 5 MK/kg up to 45 MK/kg.14 Small granaries, at the village level, would help to store maize adequately for the lean season (just before harvest). In Malawi, the government could rehabilitate storage space, particularly in remote areas and lease it to private parties. The supervision of maintenance, produce, and warehouse operators, along with a credible pledge not to intervene in output prices are all crucial elements of this venture.
Properly functioning markets would fuel diversification of production and consumption away from the monoculture of maize. The overwhelming importance of maize is not necessarily culturally-determined or culturally-sensitive. Actually, it appears that at the beginning of the century, nutrition patterns in Malawi were much more varied than today. In functioning markets served by traders, information about alternative commodity prices and opportunities as well as farming practices would travel quickly. Regional and global markets need to function better through free trade of grains across borders. Tariff and non-tariff restrictions hamper the flow of food across borders and the most efficient allocation of resources. In addition to transport problems and other logistics, these barriers drive up food prices and exacerbate crises.
The objective of functioning markets requires reforms of the food aid system. Food aid provided in-kind can drive down the domestic price of food, undermining domestic food production. If distributed outside of normal commercial marketing channels, it can also displace local traders and reduce their incentives to invest in infrastructure, especially in food deficit regions. Furthermore, food aid has often been poorly timed because decisions are driven more by the need of donor countries to dispose of surpluses to maintain high domestic prices, rather than the needs of food-deficit countries. This is illustrated by the strong negative correlation between food aid shipments and US Wheat Prices, as seen in Figure 2.
Figure 2: US Food aid shipments and Grain prices
14Crisis year 2002. In May and June 2001 in Salima, Central Malawi average maize prices were around 5 MK/kg and reached 43 MK/kg in March 2002 (just before harvest). Even in normal years prices can go up to 25 MK/kg during the lean season. Source: FEWS-Net Malawi, quoted by Malawi Emergency Food Security Assessment Report, February 2003; p. 18.

8
Source: USDA and World Bank
Governments can facilitate private input and output markets in remote areas. It could do so through provision, subsidization, or leasing of existing infrastructure (warehouses, shops), warehouse receipt financing, and small granaries. In Malawi, the warehouse receipts system could provide for an ongoing productive role for ADMARC’s storage and market facilities around the country. In addition, the government can tender subsidies for traders and input suppliers for the coverage of remote areas. Clearly, the government should stay out of grain trading. Centrally planned buying and pan-territorial pricing might encourage the growing of rain fed white maize in places where soil and/or climatic conditions are not suited to that crop.
HIGHER SMALLHOLDER PRODUCTIVITY
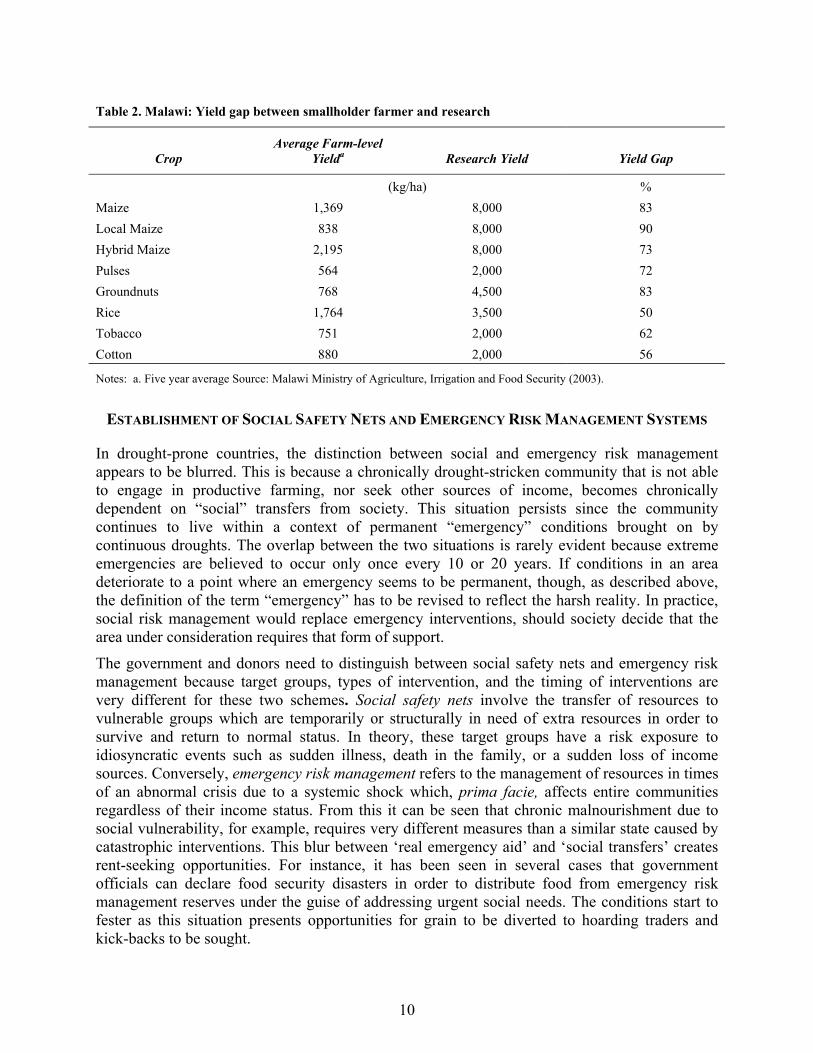
Food security is based on adequate smallholder productivity so smallholder productivity in the appropriate crops needs to be raised. Food security has a supply-side dimension only to the extent that increased national food production may bring down the price of food-stuffs below import parity. There is ample room for increased and sustainable national food production. Most of smallholder agriculture in Southern Africa outside South Africa produces in sub-optimal conditions and with dismal yield results due to market and technological factors, as seen in figure 3. Local maize average yield across all extension planning areas between 1984 and 2002 was 0.88 MT/hectare, 2.2 MT/hectare for hybrid maize, as seen in figure 4. Extension services have been reduced due to budget cuts. Area-specific farming practice advice is not available for most smallholders. For example, in some areas in Malawi, maize production is inappropriate, but farming advice regarding proper crop choices and farming practices is difficult to come by for most smallholders. Choice of seed and fertilizer follow a blanket Malawi crop calendar and input schedule that extension service promotes across the country. However, soils and agro-climatic conditions vary significantly15. Soil analyses could reveal yield potentials for each agro-climatically homogenous area.16
15 The authors suggest to improve upon the public extension service by adapting available precision farming techniques to smallholder farming conditions and available public and private extension channels. Thus, specific localized farming advice can be given. In Malawi and Zambia, the mission proposes a pilot project for smallholders. 16 For example, Malawi has 153 relatively homogenous extension planning areas (EPAs).

9
Figure 3: Maize yields in SADC countries 1990 - 2003 (FAO stats)
Source: Authors
Figure 4: Maize yields in Malawi
Source: Authors
10
Table 2. Malawi: Yield gap between smallholder farmer and research
Crop Average Farm-level
Yielda Research Yield Yield Gap
(kg/ha) % Maize 1,369 8,000 83 Local Maize 838 8,000 90 Hybrid Maize 2,195 8,000 73 Pulses 564 2,000 72 Groundnuts 768 4,500 83 Rice 1,764 3,500 50 Tobacco 751 2,000 62 Cotton 880 2,000 56
Notes: a. Five year average Source: Malawi Ministry of Agriculture, Irrigation and Food Security (2003).
ESTABLISHMENT OF SOCIAL SAFETY NETS AND EMERGENCY RISK MANAGEMENT SYSTEMS
In drought-prone countries, the distinction between social and emergency risk management appears to be blurred. This is because a chronically drought-stricken community that is not able to engage in productive farming, nor seek other sources of income, becomes chronically dependent on “social” transfers from society. This situation persists since the community continues to live within a context of permanent “emergency” conditions brought on by continuous droughts. The overlap between the two situations is rarely evident because extreme emergencies are believed to occur only once every 10 or 20 years. If conditions in an area deteriorate to a point where an emergency seems to be permanent, though, as described above, the definition of the term “emergency” has to be revised to reflect the harsh reality. In practice, social risk management would replace emergency interventions, should society decide that the area under consideration requires that form of support.
The government and donors need to distinguish between social safety nets and emergency risk management because target groups, types of intervention, and the timing of interventions are very different for these two schemes. Social safety nets involve the transfer of resources to vulnerable groups which are temporarily or structurally in need of extra resources in order to survive and return to normal status. In theory, these target groups have a risk exposure to idiosyncratic events such as sudden illness, death in the family, or a sudden loss of income sources. Conversely, emergency risk management refers to the management of resources in times of an abnormal crisis due to a systemic shock which, prima facie, affects entire communities regardless of their income status. From this it can be seen that chronic malnourishment due to social vulnerability, for example, requires very different measures than a similar state caused by catastrophic interventions. This blur between ‘real emergency aid’ and ‘social transfers’ creates rent-seeking opportunities. For instance, it has been seen in several cases that government officials can declare food security disasters in order to distribute food from emergency risk management reserves under the guise of addressing urgent social needs. The conditions start to fester as this situation presents opportunities for grain to be diverted to hoarding traders and kick-backs to be sought.

11
There is another reason why government policy needs to distinguish between the two types of intervention – to protect the integrity and effectiveness of emergency risk management. A government that uses national physical strategic grain reserves (SGRs) to remedy perceived or real short-term food needs of certain parts of population jeopardizes the system when it will need to address a real food emergency, which, it must be stressed, is the raison d’être for the existence of such an SGR. This has been witnessed in some cases where the SGRs have simply been depleted before a predictable crisis situation and have had to be replenished in high price periods. It has also been seen that the distribution of cheap grain in pre-electoral times, to woo voters, can further distort incentives for farmers to produce and market grains. Rent-seeking opportunities further compound the problem of un-timely and inefficient grain reserve distribution.
An influx of foreign food aid which is not governed by a clear and targeted emergency risk management strategy can further distort incentives in the market. World Bank staff have suggested some principles to guide donors and beneficiaries in designing and administering food aid schemes (Nash, 2004):
• Food aid should be made in full grant form, and should only be used to address the needs of vulnerable groups or as a response to an emergency (to be determined by the United Nations (UN)).
• Cash aid should be used unless in-kind food aid is a more appropriate response to the crisis (for example, because marketing channels do not function effectively, or in-kind aid can be better targeted to the individuals in need).
• As a general rule, food purchases should be made from other developing countries and from food-surplus areas of the country that are being assisted. The country receiving food aid should never be used as grounds for food-surplus disposal from industrial countries.
• Food aid, particularly if given in-kind, should be targeted in order to avoid disrupting local markets.17 Impact assessment on marketing and local incentives should be undertaken, and designs altered, or mitigation undertaken when negative impacts are observed.
• Food aid should be integrated into a broader rural development strategy that looks at the best investments to provide food security and poverty reduction over the medium term. This will almost always mean a rapid phase-out of the food aid once growth starts.
• Food for work should be the exception whilst work for cash should be the norm.
The most appropriate level at which long-term structural food insecurity should be addressed is the household (Nash, 2004). The fundamental cause of long-term structural food insecurity is poverty, that is, the lack of purchasing power. There are ample supplies of food in global markets to feed the world and a well-established trading system to ensure that it gets to areas where there is the demand for it. If the poor had sufficient incomes, this would translate into effective demand, and food insecurity would cease to be a problem except in certain transitory situations, such as natural emergencies. Since structural food insecurity exists primarily because of a demand-side problem – lack of purchasing power by the poor – it must be addressed by raising
17 Following a policy that is not biased against non-food production is not actually bad for food production – rather the two go hand in hand. General good agricultural policy environment is good for both; cash crops give funds to buy inputs for food production.

12
incomes of this group. There are legitimate concerns over short-term disruptions to supply, from either manmade or natural disasters. But the effects of temporary disruptions could be mitigated through other measures, such as stockpiling of moderate reserves, improving distribution channels, reforming food aid which would be much less costly than efforts to achieve self-sufficiency. Barring war, natural disasters, artificial barriers to trade, and macroeconomic disruptions sufficiently severe to impede imports—if individual households have adequate purchasing power, national food security follows almost automatically.
Many social safety net schemes exist. Key lessons for establishing cost-effective safety nets in low income countries are:
• Safety net expenditures need to include the finance of some productive investments in order to contribute to longer-term poverty reduction.
• Pure transfer programs need to target very selective groups.
• Programs need to have multiplier effects and leverage funds to help households reduce risks and/or diversify activities.
• To deal with information problems, programs need to be self-targeting.
• The timing of these programs is important to provide counter-cyclical funding following shocks.
• Programs need to be kept as simple as possible to deal with the administrative constraints in low-income countries, for example, avoiding multiple, overlapping programs in favor of one or two simple programs that could be easily implemented (Smith and Subbarao, 2003).
Effective ex-ante emergency risk management requires good early warning systems and accurate production estimates. Accurate localized production estimates of all crops are the indispensable basis for effective interventions. Currently, early warning systems by FEWS (United States Agency for International Development (USAID)) and GIEWS (FAO) provide good indications as to the direction of production but fail to accurately predict catastrophes or to provide accurate production estimates.18 Satellite imagery-based production estimates based on vegetative indices are often inaccurate due to the low resolution of the images and the insufficient geo-referencing or “ground-truthing” of the production areas.19 Thus, most practitioners tend to take early warning system information with a touch of skepticism, using it as an indicator rather than fact. However, GIEWS and FEWS provide local maize market price developments that are often the best early indicator for upcoming shortages.
18 For Example in Malawi, March 2002, FEWS NET acknowledged that its previous assertions about the level of food availability in Malawi may have been over-optimistic, being biased by exaggerated production estimates for root and tuber crops. “There is debate over high production figures of cassava, including sweet potatoes, with some suggestion that these figures are over-estimated”.18 FEWS NET attributed this over-estimate to the Ministry of Agriculture’s practice of estimating the amount of cassava in the ground, rather than the amount ready for harvesting in a given year. In Malawi FEWS NET relies, or at least used to rely, strongly on Ministry of Agriculture production estimates. Indeed, FEWS NET contributes to and guides these production estimates as well. 19 For example in Zambia FEWS NET tended to predict large flood damage in the Southwest of the country, whereas the situation on the ground was relatively normal. In fact, flooding is a recurrent phenomenon in certain areas.
13
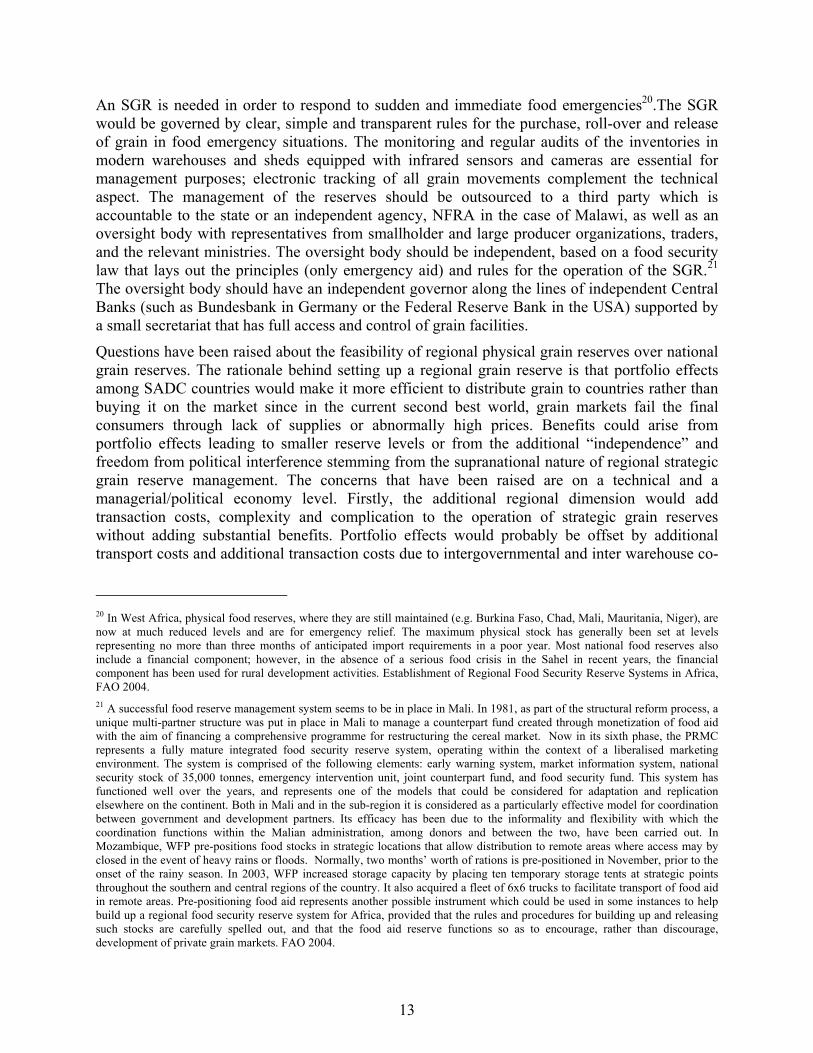
An SGR is needed in order to respond to sudden and immediate food emergencies20.The SGR would be governed by clear, simple and transparent rules for the purchase, roll-over and release of grain in food emergency situations. The monitoring and regular audits of the inventories in modern warehouses and sheds equipped with infrared sensors and cameras are essential for management purposes; electronic tracking of all grain movements complement the technical aspect. The management of the reserves should be outsourced to a third party which is accountable to the state or an independent agency, NFRA in the case of Malawi, as well as an oversight body with representatives from smallholder and large producer organizations, traders, and the relevant ministries. The oversight body should be independent, based on a food security law that lays out the principles (only emergency aid) and rules for the operation of the SGR.21 The oversight body should have an independent governor along the lines of independent Central Banks (such as Bundesbank in Germany or the Federal Reserve Bank in the USA) supported by a small secretariat that has full access and control of grain facilities.
Questions have been raised about the feasibility of regional physical grain reserves over national grain reserves. The rationale behind setting up a regional grain reserve is that portfolio effects among SADC countries would make it more efficient to distribute grain to countries rather than buying it on the market since in the current second best world, grain markets fail the final consumers through lack of supplies or abnormally high prices. Benefits could arise from portfolio effects leading to smaller reserve levels or from the additional “independence” and freedom from political interference stemming from the supranational nature of regional strategic grain reserve management. The concerns that have been raised are on a technical and a managerial/political economy level. Firstly, the additional regional dimension would add transaction costs, complexity and complication to the operation of strategic grain reserves without adding substantial benefits. Portfolio effects would probably be offset by additional transport costs and additional transaction costs due to intergovernmental and inter warehouse co-
20 In West Africa, physical food reserves, where they are still maintained (e.g. Burkina Faso, Chad, Mali, Mauritania, Niger), are now at much reduced levels and are for emergency relief. The maximum physical stock has generally been set at levels representing no more than three months of anticipated import requirements in a poor year. Most national food reserves also include a financial component; however, in the absence of a serious food crisis in the Sahel in recent years, the financial component has been used for rural development activities. Establishment of Regional Food Security Reserve Systems in Africa, FAO 2004. 21 A successful food reserve management system seems to be in place in Mali. In 1981, as part of the structural reform process, a unique multi-partner structure was put in place in Mali to manage a counterpart fund created through monetization of food aid with the aim of financing a comprehensive programme for restructuring the cereal market. Now in its sixth phase, the PRMC represents a fully mature integrated food security reserve system, operating within the context of a liberalised marketing environment. The system is comprised of the following elements: early warning system, market information system, national security stock of 35,000 tonnes, emergency intervention unit, joint counterpart fund, and food security fund. This system has functioned well over the years, and represents one of the models that could be considered for adaptation and replication elsewhere on the continent. Both in Mali and in the sub-region it is considered as a particularly effective model for coordination between government and development partners. Its efficacy has been due to the informality and flexibility with which the coordination functions within the Malian administration, among donors and between the two, have been carried out. In Mozambique, WFP pre-positions food stocks in strategic locations that allow distribution to remote areas where access may by closed in the event of heavy rains or floods. Normally, two months’ worth of rations is pre-positioned in November, prior to the onset of the rainy season. In 2003, WFP increased storage capacity by placing ten temporary storage tents at strategic points throughout the southern and central regions of the country. It also acquired a fleet of 6x6 trucks to facilitate transport of food aid in remote areas. Pre-positioning food aid represents another possible instrument which could be used in some instances to help build up a regional food security reserve system for Africa, provided that the rules and procedures for building up and releasing such stocks are carefully spelled out, and that the food aid reserve functions so as to encourage, rather than discourage, development of private grain markets. FAO 2004.

14
ordination needs. The second potential benefit of supranational independence would probably be outweighed by the difficulty of administering grain releases and avoiding free-rider problems. That aside, the biggest obstacles for a regional physical grain reserve can be found in its set-up, rules of access, management, political feasibility and sustainability, and lack of successful precedent. These difficulties are not to be undermined. In West Africa, for instance, an attempt to set up a physical regional strategic grain reserve failed.
ALLEVIATION OF WEATHER SHOCK-INDUCED POVERTY
Weather shocks and the coping strategies that people adopt in response to these shocks, tend to increase poverty levels. This is because the shocks deprive people of their assets, and the coping strategies often result in reduced endowment levels. Ex-ante risk management strategies, namely over-diversification of crops and assets as well as under-investment in crops, trap people in poverty. The poor and vulnerable therefore lose income due to these portfolio choices and subsequently become less likely to adopt new technologies. This cycle of events impedes capital accumulation.
The ex-post weather shock has an impact on household incomes over long periods (5-10 years). Evidence on nutrition and education suggests that, for instance, in Zimbabwe, after a drought, children face up to 7% lower lifetime earnings due to lower height and lower school attainment. Evidence from India and Indonesia indicates that children are taken out of school with possible permanent effects (Dercon, 2004). In Madagascar, simulations of poverty change show that 75% of the predicted change in household economic well-being and poverty incidence can be traced to the effects of drought (Paternostro, 2001). In Ethiopia, evidence on growth in food consumption between 1989 and 1997 in six villages surveyed by Dercon reveals that bad rainfall shocks have long-lasting impact (lower growth for 5-10 years). The extent of suffering during the famine of 1984-85 affected growth in the 1990s. Evidence on the cost of risk from many contexts, including Ethiopia, points to risk-induced poverty persistence and possibly even ‘poverty traps’, or situations from which no escape is possible using one’s own means and resources, even if there is substantial growth in the economy.
As a response to this, Dercon recommends strengthening ‘risk coping’, mainly stimulating self-insurance, by offering better savings products, accessible to the poor (in-kind and in-cash); building on indigenous insurance schemes (such as community or funeral societies); developing insurance products suitable for the poor – preferably those with easy access and easy triggers (i.e., rainfall insurance, possibly linked to credit for inputs) (Paternostro, 2001).
3. ONE INSTRUMENT: WEATHER-BASED INSURANCE
The study chooses to investigate weather index insurance because food security and weather risk management are inevitably linked: weather risk management, or the lack of it, determines the level of systemic risk in the food security system. Furthermore, weather related agricultural production shocks also conspire to keep smallholders within the poverty trap, preventing the country from reaching its productive potential in the agricultural field.

15
Other forms of insurance, such as traditional crop insurance, are not being considered in this report. Malawi and other countries have experimented with traditional crop insurance without success. In fact, one can go so far as to state that traditional crop insurance is a global failure – multi-peril crop insurance (MPCI), which covers all yield risks and adjusts losses on the individual farm, is plagued by moral hazard22, adverse23 selection, and high monitoring and administrative cost. In the words of Skees, Hazell, and Miranda (2005):
“The financial experience with publicly-provided, multiple-peril crop insurance has been disastrous. In all cases, programs are heavily subsidized and governments not only pay part of the premium, but also most of the delivery and service costs, and they cover aggregate losses even when the losses exceed targeted levels over long periods of time.”
Currently, agricultural insurance products are not available in Malawi. Limited experience in the past (NICO General Insurance Company Ltd.) has proved unsuccessful due mainly to problems with fraud and excessive losses. Also, agricultural insurance in Malawi requires international reinsurance, because total reserves of insurance companies are very limited and crop failure risk is a highly correlated risk with low retention rates. A series of studies have underlined that traditional crop insurance policies do the following: a) depend on subsidies b) tend to distort incentives c) can be costly in terms of excessive environmental risk-taking d) can be inequitable as large farmers tend to pocket most of the subsidies and e) require high levels of expertise in the areas of loss adjustment.
This chapter will delve into the various levels at which weather-based insurance can be used and is divided into several sub-sections. The risk profile at both country-level (Malawi) and regional level (SADC) will be analyzed first. The second sub-section will deal with micro applications of weather-risk management at the farm level whilst the third sub-section will look at the macro level, how Malawi can insure its drought and flood risk in weather-risk markets. The SADC risk-profile will then be analyzed and a possible SADC weather-risk fund, which can insure SADC member countries such as Malawi, is introduced. Finally, the pre-requisites for weather-risk transfer out of the SADC region are outlined.
TRADITIONAL CROP INSURANCE VERSUS WEATHER INDEX INSURANCE
Traditional multiple-peril crop insurance that indemnifies losses on individual farm basis is subject to high administrative costs in order to overcome the problems of adverse selection and moral hazard. It also requires significant investment in monitoring farm yields to prevent both higher losses than the initial rating and serious actuarial problems. Furthermore, multiple-peril crop insurance has large correlated risks, so it requires the extra cost of providing reinsurance. These extra costs can be quite high in an emerging economy with little or no experience in
22 The risk of the insured party altering the outcome of the insured event. 23 The risk of an overrepresentation of high risk (“bad risks”) in the insurance pool. The larger the information asymmetry, the stronger are adverse selection effects.
16
providing insurance of this type. These conditions mean that traditional multiple-peril crop insurance is not a workable solution for most of agriculture in SADC countries.24
One form of agricultural insurance that mitigates these added costs is weather insurance. Payout is determined by an objective parameter such as the combination of a series of weather-related metrics—for example, millimeters of rain, soil moisture, etc. Weather index insurance is well suited to the agricultural production in regions in Ukraine where there are wide spread crop losses due to drought and frost. The monitoring costs of weather insurance are less as there is no need to perform farm-level loss adjustments and the balance of information about the weather is equally shared by the insured and the insurer (unlike with traditional farm-level insurance where the farmer will always know more about the yield than the insurer). Thus, weather insurance could be a preferred alternative to crop insurance, as it avoids moral hazard problems and high administrative costs. Furthermore, the reinsurer is more likely to provide better terms when the insurance is based upon weather events and not farm-level losses.
WEATHER RISK: COUNTRY (EXAMPLE MALAWI) AND SADC LEVEL
Drought: There are four perspectives on drought: meteorological, hydrological, agricultural, and socioeconomic.25 The first three are defined as follows:
• Meteorological drought is usually defined in terms of deviations of precipitation from normal levels and the duration of dry periods in a region.
• Hydrological drought deals with surface and subsurface water supplies such as stream flow, reservoir levels, and ground water. This second type of drought is brought about by extended periods experiencing a lack of precipitation, which causes the afore-mentioned water supplies to drop below normal levels. Since it can take longer periods of time for the lack of precipitation to impact these water supplies, hydrological droughts usually lag behind meteorological droughts.
• Agricultural drought refers to situations in which moisture in the soil is no longer sufficient to meet the needs of crop growing in an area due to insufficient rainfall and other adverse weather conditions. Definitions of agricultural drought must account for the susceptibility of crops during different stages of development, the biological and physiological characteristics of the crop and the properties of the soil.26
The socioeconomic perspective on drought refers to situations that occur when water shortages begin to affect people and their quality of life27. Associating economic impact with elements of meteorological, hydrological and agricultural drought, socioeconomic drought refers to situations where demands for products - drinking water, food, hydro-electric power – cannot be satisfied due to a weather-related short-fall in supply. In developing countries such as Malawi, the impact
24 Only a few large and commercial farmers in some countries such as South Africa would have, or do have, sustainable access to this type of insurance. For others, the added transaction and moral hazard management costs make the product prohibitively expensive. 25 According to the US National Drought Mitigation Center. 26 This section focuses on drought, because it is the most important and pervasive risk in Malawi and across SADC. Clearly there are other weather risks, mostly insurable as well, such as flooding and cyclones. 27 According to the US National Drought Mitigation Center.
17
of socioeconomic drought usually takes the form of food emergencies requiring external donor aid. Whereas, the first two perspectives focus on the operational definitions of a drought by defining drought severity, frequency, and duration, the latter deal with more conceptual issues. These can help establish drought policy for a region by focusing on the crop growth potential of a specific area or on the economic health of a country and its people. There is no single definition of a drought in relation to its socioeconomic impacts. Stress on a system can come in many forms and act on many different temporal and spatial scales.
Tackling the issue of weather-risk management for a Southern African country such as Malawi requires solutions that consider all temporal and spatial scales. In this context, three natural and complimentary approaches to managing risk associated with weather in Malawi arise: a) Micro weather-indexed insurance – agricultural weather insurance for farmers b) Macro weather-indexed insurance - government budget insurance, and c) SADC-wide cooperation, through a regional weather-risk fund.
Malawi: In order to determine Malawi’s weather-risk profile, data analysis was undertaken to determine a) the occurrence of drought over time b) geographical differences in rainfall distribution, and c) the spatial correlation of rainfall in different regions of the country. To this end, rainfall data were collected from 13 of the 22 official Meteorological Office weather stations in Malawi, as seen in the map at the back of the text. These stations exhibited long historical records with very few missing data points and were selected to give a good spatial representation of rainfall throughout the country.
Occurrence of Drought Over Time. A meteorological drought can be defined by seasonal cumulative rainfall (October-April) falling below 75% of the long-term (40-year) average recorded at each weather station. Previous research has shown that this mark of “75% of normal” is often associated with dry events (Hayes). This percent-of-normal definition is a simple and effective method of defining a meteorological drought for a specific region and period. It summarizes how often meteorological droughts have occurred in the past 40 years at each of the 13 stations. On average, two meteorological drought events happen each year and the historical analysis shows that the number of stations experiencing a drought event, at any one time, can range from zero up to seven stations each year. These results indicate that drought situations can and do occur not only on local (for example, 1972, 1988, 1991) and regional (for example, 1966, 1997) scales but also on national levels (for example 1992, 1994, 1995). The latter are usually a combination of a regional drought in the south with another drought event in the central (for example, 1992) or even northern regions (for example 1994). The years 1992 and 1994 correspond to events when the average seasonal rainfall throughout the whole country dropped below the 75% threshold.

18
Table 3: Total Number of Stations Experiencing a Meteorological Drought, Harvest Years 1965-2003
Weather Station Year
Number of meteorological droughts 1 2 3 4 5 6 7 8 9 10 11 12 13
1965 0 1966 3 x x x 1967 3 x x x 1968 3 x x x 1969 0 1970 3 x x x 1971 0 1972 2 x 1 1973 5 1 1 1 1 1 1 1974 0 1975 1 1 1976 0 1977 2 1 1 1978 0 1979 0 1980 0 1981 3 1 1 1 1982 2 1 1 1983 3 1 1 1 1984 3 1 1 1 1985 1 1 1986 0 1987 2 1 1 1988 1 1 1989 0 1990 2 1 1 1991 2 1 1 1992 7 1 1 1 1 1 1 1 1993 1 1 1994 7 1 1 1 1 1 1 1 1995 6 1 1 1 1 1 1 1996 2 1 1 1997 5 1 1 1 1 1 1998 0 1999 0 2000 6 1 1 1 1 1 1 2001 0 2002 0 2003 0
Source: Authors
Geographical Differences in Rainfall Distribution. Malawi exhibits some geographical differences in rainfall variability, particularly concerning drought frequency. Table 4 shows the seasonal (October-April) cumulative rainfall statistics for the 13 weather stations and the frequency of meteorological droughts recorded at each station. A meteorological drought in the

19
hilly region of Dedza (Station 9) is a rare event, happening only twice in the past 40 years. However, in the more variable eastern plains of Salima and Mangochi (Stations 10 and 12), meteorological droughts occur more regularly - on average, four times in every 10 years.
Table 4: October-April Cumulative Rainfall Statistics, Harvest Years 1965-2003
Station Name and Number Code
WMO*No.
Average Rainfall
(mm)
Standard Deviation
Coefficient of Variation
40-yr Met. Drought Frequency
1. CHITIPA 67421 953 202 0.21 6 2. KARONGA 67423 1028 262 0.25 7 3. MZIMBA 67485 869 162 0.19 3 4. MZUZU 67489 1084 234 0.22 9 5. NKHATA BAY 67493 1383 372 0.27 7 6. LILONGWE 67586 845 173 0.20 5 7. CHITEDZE 67585 865 192 0.22 7 8. NKHOTAKOTA 67591 1425 363 0.25 9 9. DEDZA 67689 915 159 0.17 2 10. SALIMA 67597 1227 381 0.31 10 11. CHILENA 67693 858 198 0.23 7 12. MANGOCHI 67695 729 239 0.33 11 13. THYOLO 67793 1128 256 0.23 5 1-13 AVERAGE - 1024 146 0.14 2
* World Meteorological Organization weather station number code. Source: Authors
Spatial Correlation of Rainfall between Regions. From the data in Table 5 it is clear that central and southern stations show some degree of correlation in their inter-annual variability. However, at the same time, correlations between relatively nearby stations can still be weak, like Mangochi and Thyolo (Stations 12 and 13). Stations in the north vary somewhat independently from the rest of the country and only exhibit weak positive correlations between themselves. Given the fat-tailed distribution characteristic of rainfall, the significance of these coefficients should be interpreted with care. Nonetheless, they do give some indication as to the spatial correlation of seasonal rainfall throughout the country.

20
Table 5: Correlation Coefficients (CCs) of Cumulative October-April Rainfall Totals recorded at each Station 1-13, 1965-2003
1 2 3 4 5 6 7 8 9 10 11 12 13
1 1.00*
2 0.52* 1.00*
3 0.27 0.28 1.00*
4 0.37 0.29 0.38 1.00*
5 0.14 0.15 0.21 0.36 1.00*
6 -0.02 -0.04 0.26 0.19 0.29 1.00*
7 0.12 -0.03 0.25 0.31 0.18 0.46* 1.00*
8 0.35 0.35 0.44* 0.33 0.45* 0.17 0.36 1.00*
9 0.01 -0.23 0.17 0.13 0.08 0.60* 0.33 0.20 1.00*
10 0.30 0.13 0.26 0.25 0.42* 0.27 0.52* 0.57* 0.42* 1.00*
11 0.06 0.05 0.19 0.29 0.06 0.47* 0.50* 0.32 0.37 0.50* 1.00*
12 0.12 0.24 0.24 0.42* 0.15 0.26 0.16 0.39 0.32 0.51* 0.45* 1.00*
13 -0.03 -0.04 0.14 0.31 0.30 0.51* 0.56* 0.27 0.27 0.51* 0.68* 0.37 1.00*
(* denotes CCs significant at the 99% confidence levels) Source: Authors
These results indicate that there is some degree of spatial variability in seasonal rainfall throughout the country, particularly between the northern and central/southern zones. However, although there is some diversity of rainfall within the country, suggesting Malawi may be able to manage the impact of localized droughts to some extent internally, there is a clear need for external risk financing in the event of wide-spread drought - particularly in years such as 1992 and 1994 - in order to develop a sustainable and efficient weather-risk management system.
SADC RISK PROFILE
Similar to the risk profiling in the case of Malawi, in order to determine the risk profile of the SADC countries as a group, ARTES28 data was evaluated by analyzing the cumulative rainfall for each country, the spatial correlation of this rainfall, and the frequency of droughts. ARTES data could not be used to write effective insurance for region-specific weather risks as the
28 Annex 1 features a detailed description of the development and background of ARTES data
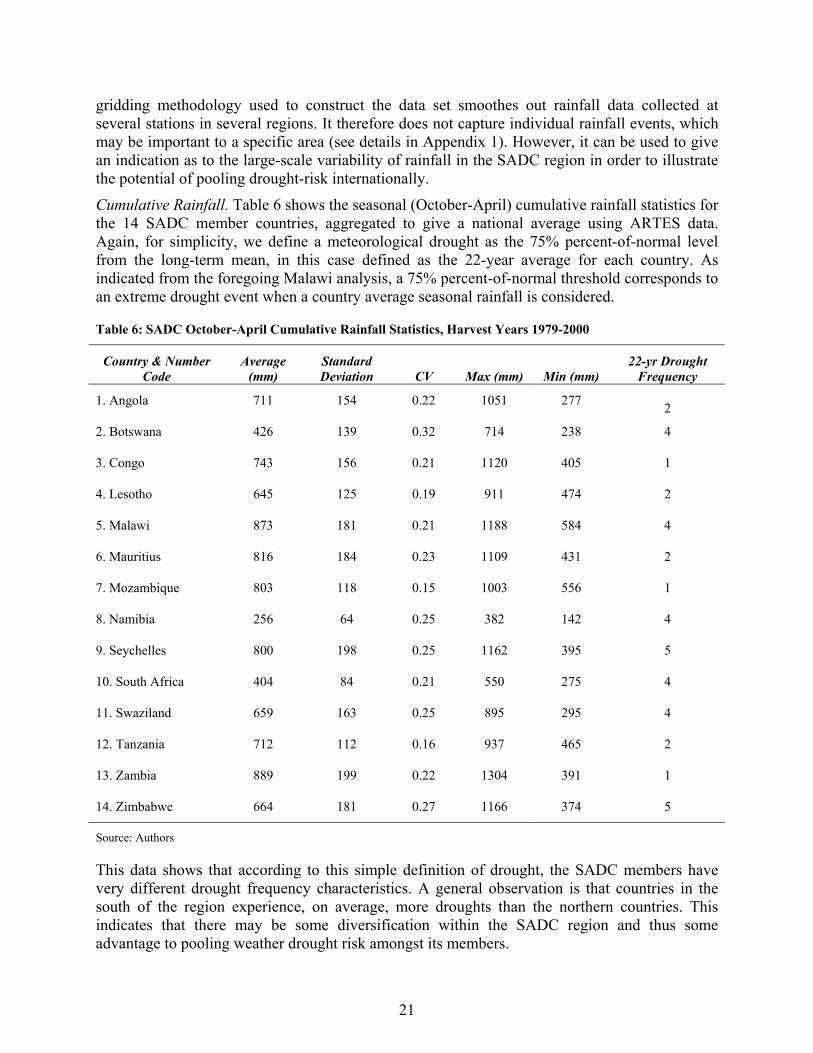
21
gridding methodology used to construct the data set smoothes out rainfall data collected at several stations in several regions. It therefore does not capture individual rainfall events, which may be important to a specific area (see details in Appendix 1). However, it can be used to give an indication as to the large-scale variability of rainfall in the SADC region in order to illustrate the potential of pooling drought-risk internationally.
Cumulative Rainfall. Table 6 shows the seasonal (October-April) cumulative rainfall statistics for the 14 SADC member countries, aggregated to give a national average using ARTES data. Again, for simplicity, we define a meteorological drought as the 75% percent-of-normal level from the long-term mean, in this case defined as the 22-year average for each country. As indicated from the foregoing Malawi analysis, a 75% percent-of-normal threshold corresponds to an extreme drought event when a country average seasonal rainfall is considered.
Table 6: SADC October-April Cumulative Rainfall Statistics, Harvest Years 1979-2000
Country & Number Code
Average (mm)
Standard Deviation CV Max (mm) Min (mm)
22-yr Drought Frequency
1. Angola 711 154 0.22 1051 277 2
2. Botswana 426 139 0.32 714 238 4
3. Congo 743 156 0.21 1120 405 1
4. Lesotho 645 125 0.19 911 474 2
5. Malawi 873 181 0.21 1188 584 4
6. Mauritius 816 184 0.23 1109 431 2
7. Mozambique 803 118 0.15 1003 556 1
8. Namibia 256 64 0.25 382 142 4
9. Seychelles 800 198 0.25 1162 395 5
10. South Africa 404 84 0.21 550 275 4
11. Swaziland 659 163 0.25 895 295 4
12. Tanzania 712 112 0.16 937 465 2
13. Zambia 889 199 0.22 1304 391 1
14. Zimbabwe 664 181 0.27 1166 374 5
Source: Authors
This data shows that according to this simple definition of drought, the SADC members have very different drought frequency characteristics. A general observation is that countries in the south of the region experience, on average, more droughts than the northern countries. This indicates that there may be some diversification within the SADC region and thus some advantage to pooling weather drought risk amongst its members.

22
Regional Correlation of Rainfall. Table 7 shows the correlation coefficients between inter-annual variations in seasonal rainfall for each SADC country from 1979-2000. Given the gridding and aggregation methodology used by ARTES, the short length of the data record and the fat-tailed distribution characteristic of rainfall, these correlation coefficients should be treated with caution. However, they give a first-guess indication as to the spatial correlation of seasonal rainfall throughout the SADC region. There is evidence to suggest a degree of spatial co-variability in seasonal rainfall between the northern and eastern regions, and between the southern and western zones (Appendix 2).
Table 7: Correlation Coefficients (CCs) of Cumulative October-April Rainfall for SADC Member Countries 1-14, 1979-2000
1 2 3 4 5 6 7 8 9 10 11 12 13 14
1 1.00
2 0.47 1.00
3 0.88* 0.43 1.00
4 0.34 0.78* 0.32 1.00
5 0.65* 0.12 0.58* -0.02 1.00
6 0.55* 0.23 0.70 0.10 0.27 1.00
7 0.46 0.27 0.41 0.14 0.72* 0.35 1.00
8 0.49 0.54* 0.28 0.52* 0.27 0.20 0.41 1.00
9 0.56* 0.05 0.70* 0.08 0.24 0.85* 0.08 0.03 1.00
10 0.44 0.86* 0.39 0.83* 0.08 0.23 0.40 0.60* 0.02 1.00
11 0.54* 0.57* 0.46 0.47 0.47 0.24 0.59* 0.44 0.00 0.74* 1.00
12 0.32 -0.04 0.53* -0.16 0.36 0.27 0.26 -0.22 0.35 -0.08 -0.05 1.00
13 0.92* 0.48 0.88* 0.32 0.71* 0.59* 0.56* 0.49 0.55* 0.43 0.51 0.41 1.00
14 0.25 0.62* 0.15 0.34 0.21 0.18 0.58* 0.39 -0.15 0.62* 0.51 0.05 0.40 1.00
* denotes CCs significant at the 99% confidence levels. Source: Authors
On average, two meteorological drought events happen each year and the historical analysis indicates that the number of countries experiencing a drought event at any one time can range from zero up to ten stations each year. Table 8 summarizes information from the ARTES dataset to demonstrate how often meteorological droughts have occurred in the past 22 years. Although there are years where weather events could be managed within the SADC region, widespread drought across the region is certainly a possibility faced by the member states.

23
Table 8. Total number of countries experiencing a meteorological drought, harvest years 1979-2000
SADC Country Code Year
Number of meteorological droughts 1 2 3 4 5 6 7 8 9 10 11 12 13 14
1979 4 x x x x 1980 0 1981 0 1982 0 1983 2 x x 1984 0 1985 2 x x 1986 0 1987 0 1988 0 1989 0 1990 0 1991 1 x 1992 6 x x x x x x 1993 2 x x 1994 2 x x 1995 6 x x x x x x 1996 1 x 1997 1 x 1998 10 x x x x x x x x x x 1999 2 x x 2000 2 x x
Source: Authors
MICRO LEVEL: WEATHER-BASED INSURANCE AGAINST PRODUCTION RISK
This section develops applications of this concept for a rural finance company, an individual farmer and a village. Developing a weather-risk management and transfer program involves four steps:
1) Identifying significant financier/farmer/village exposure to weather.
2) Quantifying the impact of adverse weather on their revenues.
3) Structuring a contract that pays out when adverse weather occurs.
4) Executing the contract in optimal form to reinsure the risk in the capital markets.
In order to illustrate the use of weather-indexed insurance the following section describes an insurance policy that could be sold to individual farmers in Malawi.
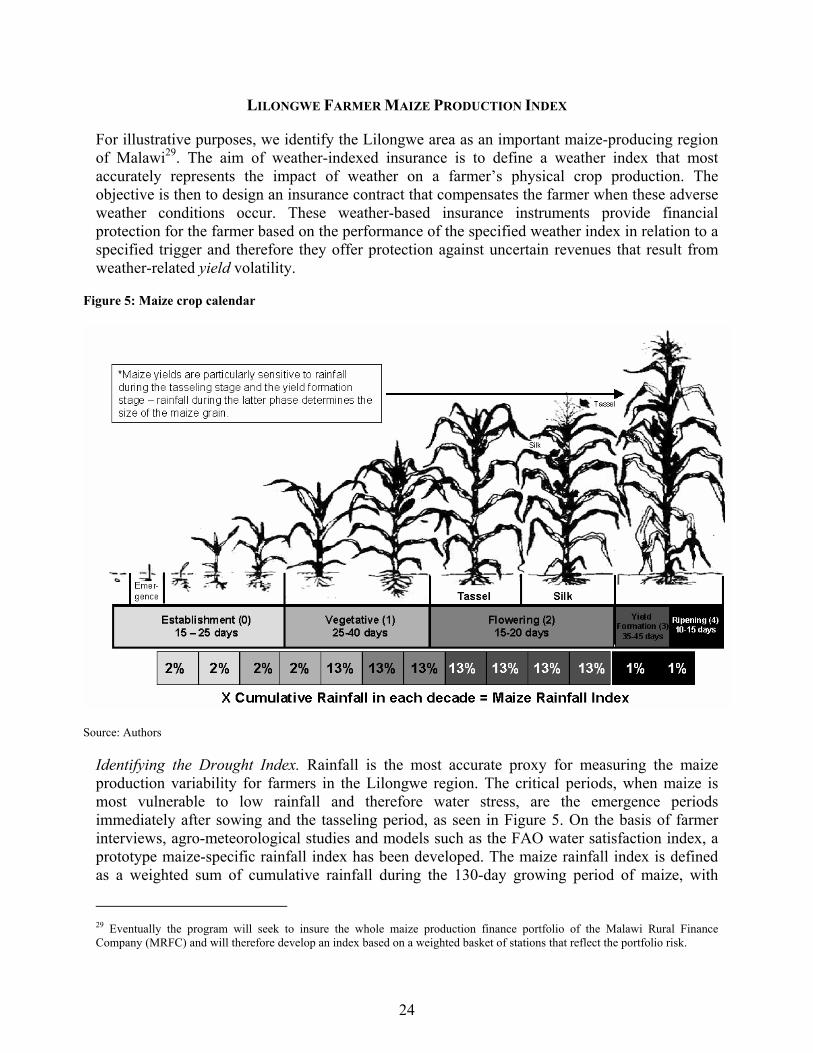
24
LILONGWE FARMER MAIZE PRODUCTION INDEX
For illustrative purposes, we identify the Lilongwe area as an important maize-producing region of Malawi29. The aim of weather-indexed insurance is to define a weather index that most accurately represents the impact of weather on a farmer’s physical crop production. The objective is then to design an insurance contract that compensates the farmer when these adverse weather conditions occur. These weather-based insurance instruments provide financial protection for the farmer based on the performance of the specified weather index in relation to a specified trigger and therefore they offer protection against uncertain revenues that result from weather-related yield volatility.
Figure 5: Maize crop calendar
Source: Authors
Identifying the Drought Index. Rainfall is the most accurate proxy for measuring the maize production variability for farmers in the Lilongwe region. The critical periods, when maize is most vulnerable to low rainfall and therefore water stress, are the emergence periods immediately after sowing and the tasseling period, as seen in Figure 5. On the basis of farmer interviews, agro-meteorological studies and models such as the FAO water satisfaction index, a prototype maize-specific rainfall index has been developed. The maize rainfall index is defined as a weighted sum of cumulative rainfall during the 130-day growing period of maize, with
29 Eventually the program will seek to insure the whole maize production finance portfolio of the Malawi Rural Finance Company (MRFC) and will therefore develop an index based on a weighted basket of stations that reflect the portfolio risk.

25
individual weights assigned to specific phases of the crop’s evolution so the index gives more weight to the more critical periods when maize is most vulnerable to rainfall variability. The individual weights are determined by maize/water requirements, as advised by the FAO, for each of the following stages of growth and development, further elaborated in Table 9.
Table 9: Weights for Maize Growing Phases
Phase Length of Phase Relative Weight Sowing/Establishment 20 days 1.75% Vegetative Growth 30 days 1.75%-13% Flowering (Tasseling & Silk) 20 days 13% Yield Formation 40 days 13% Ripening 20 days 1%
Source: Authors
Sowing occurs during the first 10-day period after 1st October when rainfall is greater than 30mm. This level of rainfall indicates the commencement of rains for the farmers in the region and hence, given the long growing cycle of maize, the optimal time of sowing. The daily rainfall is capped at 50mm to prevent extreme and short-term downpour events contributing to the index. Figure 6 demonstrates that there is correlation between this rainfall index and actual yields in the Lilongwe ADD region. The correlation between the inter-annual variations in the index and the inter-annual variations in both the hybrid and local maize yields in Lilongwe is 56% and 50% respectively for the period 1990-2002. Although these correlations are not strong (56% is just significant at the 95% confidence level), it must be remembered that the index is designed to be a drought-risk indicator, and not designed to capture high yield years. Furthermore, caution should be used when interpreting yield data: non-constant recording techniques and areas, changes and trends in farming practices and technology, etc. is not ideal for this type of analysis. The FAO has agreed to “test” the prototype rainfall index against their Malawi-specific crop models to refine the structure and independently verify its validity for maize yields and hence weather insurance policies for farmers. A revised structure may include temperature and may incorporate excessive rainfall and flooding – another weather risk that often impacts maize production in Malawi (Malawi Emergency Food Security Assessment Report, 2003).
It is a widely believed, in Malawi, that February is the most critical rainfall month for the country’s maize crop. Edward Clay et al (2003) further demonstrated in their study using monthly rainfall totals, that February was the most critical month for maize yields in Malawi during the year. However, Figure 6shows that simple cumulative February rainfall measured at the Lilongwe weather stations does not correspond well with the yields in the region. The correlation between the inter-annual variations in the index and the inter-annual variations in the hybrid and local maize yields in Lilongwe is 24% and 46% respectively. This indicates that a more sophisticated underlying weather indicator, such as weighted daily rainfall index outlined above, capturing sowing dates and critical maize periods, is more appropriate for insuring farmers’ maize crops.

26
Figure 6: Maize yield vs. maize rainfall index
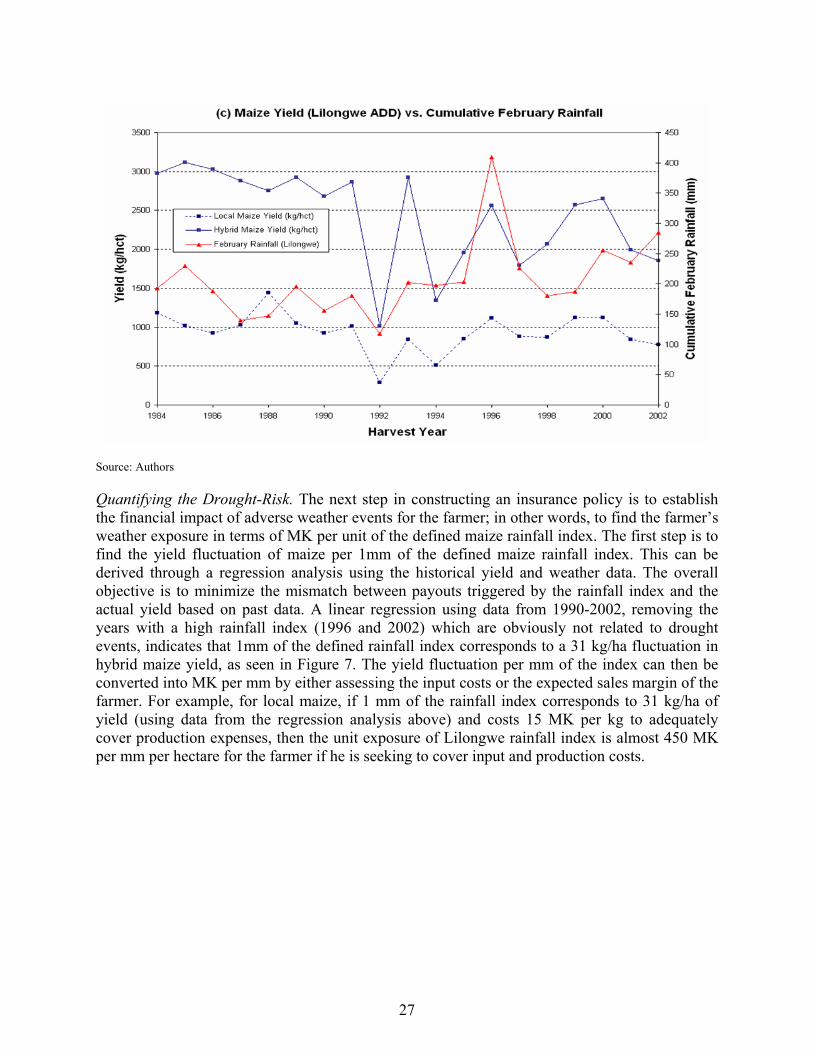
27
Source: Authors
Quantifying the Drought-Risk. The next step in constructing an insurance policy is to establish the financial impact of adverse weather events for the farmer; in other words, to find the farmer’s weather exposure in terms of MK per unit of the defined maize rainfall index. The first step is to find the yield fluctuation of maize per 1mm of the defined maize rainfall index. This can be derived through a regression analysis using the historical yield and weather data. The overall objective is to minimize the mismatch between payouts triggered by the rainfall index and the actual yield based on past data. A linear regression using data from 1990-2002, removing the years with a high rainfall index (1996 and 2002) which are obviously not related to drought events, indicates that 1mm of the defined rainfall index corresponds to a 31 kg/ha fluctuation in hybrid maize yield, as seen in Figure 7. The yield fluctuation per mm of the index can then be converted into MK per mm by either assessing the input costs or the expected sales margin of the farmer. For example, for local maize, if 1 mm of the rainfall index corresponds to 31 kg/ha of yield (using data from the regression analysis above) and costs 15 MK per kg to adequately cover production expenses, then the unit exposure of Lilongwe rainfall index is almost 450 MK per mm per hectare for the farmer if he is seeking to cover input and production costs.

28
Figure 7: Maize yield vs. maize rainfall index regression
Source: Authors
Structuring the Insurance Contract. In this simple example, a farmer could buy a stand-alone insurance product with a straight up-front premium to be paid before the protection period. Perhaps lenders such as the Malawi Rural Finance Company (MRFC) could finance this premium as the farmers may not have the cash to pay before harvest. The average maize rainfall index for Lilongwe weather station is 63mm. A farmer could purchase a weather-indexed insurance contract with a trigger level of 45mm for example, that is a contract that will compensate the farmer if the maize rainfall index for the growing season is recorded to be less than 45mm. From Figure 8 we can see that 45mm corresponds to approximately a 1750 kg/hct yield for hybrid maize. Thus, farmers would in effect have protection against situations where yields would drop below these levels. With the future FAO yield-index analysis described above, the threshold can be determined with a more robust reference to the yield and hence the protection level it represents. An example of the payout structure of such an insurance contract is shown in Figure 8. The maximum compensation a farmer could receive in a worst-case drought scenario is 8000 MK to cover his production costs, visible in Figure 8. The historical payouts of such a contract are shown in Figure 9. It shows that a farmer would have received payouts to compensate for drought-related drops in maize production in 1992 and 1994 – low yield years in the Lilongwe regions.

29
Figure 8: Payout structure of maize rainfall index (net of premium)
Source: Authors
Figure 9: Historical payouts of drought protection cover
Source: Authors

30
Pricing the Contract. Clearly the retention or trigger level, the deductible in insurance parlance, is key to pricing. In the example above the farmer retains the first 30% of index risk himself before the protection begins. Weather-indexed insurance contracts are priced using an actuarially fair assessment of the risk an insurance company selling the contract takes. Hence, a long and gap-free historical record of rainfall data is essential in order for the insurer to be able to price the risk and charge an appropriate premium to the farmer. The expected loss for the insurer is determined by the average payout of the contract using historical rainfall data. In the case of this Lilongwe-based structure, the 40-year average payout is 532 MK. The price of an insurance contract is then determined by the risk preferences of the insurance company - that is how they measure the cost of risk with respect to return for the purposes of pricing, risk management, and capital allocation. This is the most subjective aspect to the risk pricing process as it is largely driven by the business imperatives and risk appetite of the insurance company. However, it is clear that the insurance company will charge the expected loss (EL) plus an additional risk margin for taking the weather risk from the farmer, i.e.
Premium = EL + Risk Margin
From a farmer’s perspective, he/she essentially already holds the cost of EL in his/her business plan – it is the average annual cost (loss) associated with weather risk when farming maize in Lilongwe. Without insurance the farmer can expect to lose this amount on average each year. Therefore, the premium he essentially pays for weather insurance is the risk margin charged by the insurance company.
A full description of theory behind pricing weather insurance contracts is beyond the scope of this paper, however one example of measuring risk and hence determining the risk margin of a risk taker is by considering the Value-at-Risk (VaR)30 of the contract and the return on VaR required by the risk taker, i.e. the “cost of risk” for the insurance contract seller. It is clear from the example above that the VaR of the Lilongwe farmer maize production contract is 8000 MK. Therefore, a very preliminary indication of the premium an insurance company could charge is 532 + 5%*8000 = 932 MK, where the 5% corresponds to required return on VaR for the insurance company. This corresponds to an insurance premium rate of 11%, that is, a premium of 930 MK for 8000 MK of compensation.
The formula, 532 + 5%*8000 = 932 MK, as well as the number of 5%, is a rule of thumb that varies between risk takers. In essence, the premium calculation involves an actuarial calculation asking for the expected payout of the policy based on past data, and a measure of the magnitude of these expected payouts. If past payouts are very volatile, the premium increases as sellers will want to be compensated for taking on more uncertain risk. The loading level depends on the cost of risk for the reinsurer; however, determining the relative value of risk versus return is not necessarily a mathematical process (Henderson, 2002). It depends heavily on the corporate views, risk tolerances, and practical issues such as the existing portfolio and cost of capital of the
30 In the financial markets, Value at Risk (VaR) is defined as the likelihood that a given financial portfolio's losses will exceed a certain amount in a certain time horizon. VaR is usually measured at the 99% confidence level of the distribution of potential losses. It provided an estimate of the total risk in a portfolio of financial assets and is also used by central bank regulators to determine the capital a bank is required to keep to reflect the market risks it is bearing (Jackson et al. 1997). The concept of VaR can be applied to any portfolio of risk.

31
company. Although these factors vary from company to company, the cost of risk can be equated to some risk-loading factor – 5-7% is a level generally observed for these types of transactions.
Executing the Contract. The final step in designing a weather-indexed insurance program is to find a national insurance company to intermediate the insurance contract. The risk transfer structure illustrated below assumes that the farmer buys the product through a national insurance company, which is not necessarily the case as will be outlined in the following section. In practice, farmer aggregators such as NASFAM or MRFC will act as agents for the distribution of the product. A local insurance company may not be required by national insurance regulations. One needs to weigh costs and benefits of local intermediation versus a direct international contract with the distribution agents such as MRFC described in the following section. If a local intermediary is used, the risk needs to be reinsured. This is crucial for the national insurer who cannot retain much systemic risk.
Reinsurers in the global weather-risk market, where the actors are both insurers and banks, are interested in this type of risk because it provides diversification to their books through new locations and risks. This leads to enhanced risk/return portfolio characteristics, which ultimately lead to more competitive pricing. hese new developing country transactions develop weather-market liquidity, thus attracting new market players. In addition, for reinsurers, these transactions lead to business growth and expansion through broadening product offerings and increasing global networks. The reinsurability of weather-indexed insurance products is another benefit of these types of instruments.
Source: Authors.
THE CASE OF MALAWI RURAL FINANCE COMPANY (MRFC)
MRFC is wholly owned by the government and is the successor to the failed smallholder agriculture credit association (SACA). It supplies more than 50% of micro credit in Malawi and

32
high default rates make it somewhat dependent on subsidies (AMAP MicroFinance Chemonics Consortium, 2004). In March 2003, MRFC had 140,000 savings deposits and supplied around 100,000 loans at a value of MK 900 million, including seasonal loans of approximately MK 550 million. MRFC is under evaluation for possible privatization. A three-stage process managed by Malawi’s privatization committee has started with a situational analysis carried out by a PWC team. MRFC uses the group loan methodology for smallholders. Cumulative loan loss provisions of MK 662 million for agriculture loans are around 51% of total principal and accrued interest.31 PWC identified three key challenges for MRFC: repayment of a large World Bank financed loan from Reserve Bank of Malawi requiring much higher profits, and therefore substantial lowering of default rates; rationalization of an overstretched branch network; and information technology upgrading.
MRFC suffers from high default rates, driven to a large extent by systemic risk and loan recovery rates that are relatively low. In 2002, the recovery rates for tobacco-growing clubs reached 82% and non-tobacco clubs 76%. In 2001, the total portfolio recovery rate was 77%. The Annual Report for 2002 states that, “These rates are not adequate for sustainability of operations.” The main reasons for low recovery rates are the following: a) heavy reliance on agriculture, which itself is susceptible to weather variations b) lending to the poor based on social collateral c) the hunger situation impacting all loan repayments, and d) the lack of effective enforcement and threat of enforcement of collateral seizures. The main objective of the MRFC business plan is to “increase quality loan portfolio cost effectively”. It intends to achieve its targets by financing more current and potential activities in agricultural and non-agricultural loans and exploring new financial products to increase portfolio diversification and thus minimize risk. The challenge is to reduce loan default by developing efficient and cost-effective risk management and risk transfer tools that can reach various types of farmers - small, medium, and large - and that can be easily reinsured.
Therefore, as an alternative to the stand-alone weather-indexed insurance for farmers developed in the previous section, the MRFC could combine a weather-based insurance policy with its loan agreement and effectively “index” loan dues to weather. In practice, the farmer would pay only part of the usual loan dues in times of drought.
There is a Lilongwe weather indexed maize production loan. MRFC can package a loan and the insurance based on the Lilongwe maize farmer index described above into one product, the weather-indexed maize production loan (Hess, 2004). The farmer would enter into a loan agreement with a higher interest rate that accounts for the weather insurance premium that MRFC pays to the insurer.32 For a loan of MK 6,000 the normal interest rate is 2.9% per month. Assuming loan duration of six months, MRFC would charge another 1.5% each month for the weather-risk protection, totaling 4.4% per month. In return, the farmer does not repay all its dues in case of a drought, illustrated in Figure 10. In case of a severe drought with the rainfall index at 20 mm or less, instead of paying MK 7,000 (principal and interest), the borrower pays only MK 3,500, or half the usual dues.
31 Restructuring of MRFC: draft final situation assessment data as at March 31, 2003. 32 MRFC could pass on only part of the premium, since it would reduce the risk premium it used to charge the farmer through relatively high interest rates.
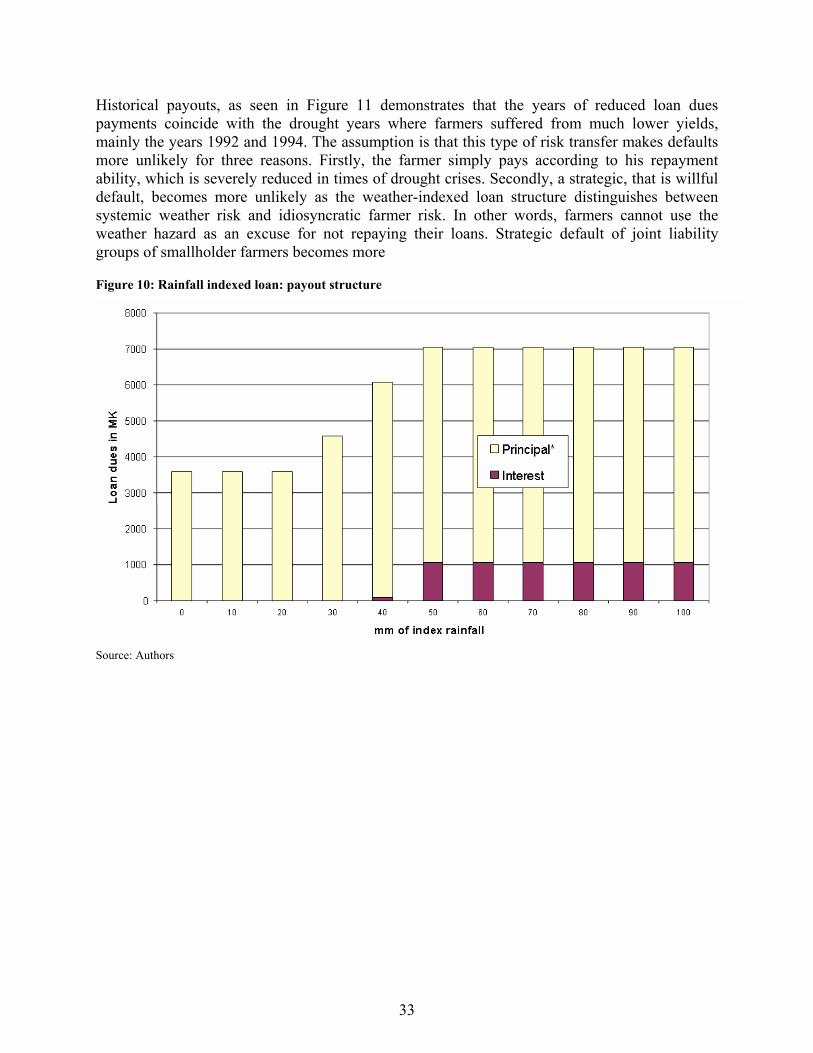
33
Historical payouts, as seen in Figure 11 demonstrates that the years of reduced loan dues payments coincide with the drought years where farmers suffered from much lower yields, mainly the years 1992 and 1994. The assumption is that this type of risk transfer makes defaults more unlikely for three reasons. Firstly, the farmer simply pays according to his repayment ability, which is severely reduced in times of drought crises. Secondly, a strategic, that is willful default, becomes more unlikely as the weather-indexed loan structure distinguishes between systemic weather risk and idiosyncratic farmer risk. In other words, farmers cannot use the weather hazard as an excuse for not repaying their loans. Strategic default of joint liability groups of smallholder farmers becomes more
Figure 10: Rainfall indexed loan: payout structure
Source: Authors

34
Figure 11: Historical payouts of rainfall indexed loan
Source: Authors
unlikely. Thirdly, MRFC is able to continue to lend to farmers throughout crises periods, without painful rescheduling or even moratoriums that are inevitably associated with smallholder loans in times of crises. Instead of defaulting on the whole loan, farmers would pay half their loan dues in a severe crisis, MRFC collects on the insurance policy and the borrower can maintain their credit-worthy record and continue to borrow in the following season.

35
Source: Author
Other micro and meso-level applications. The MRFC, as the aggregator of risk, can also purchase a weather-based crop loan portfolio insurance policy for itself. The protection will allow MRFC to keep lending to drought prone areas by mitigating default risk through the insurance policy payouts in extreme drought years. Such a transaction has recently been entered into by a micro-finance institution in India. This is a new approach to weather insurance in India. Previously, weather insurance contracts have been sold directly to individual smallholder farmers. This approach may have some advantages over individual farmer insurance because the lending institution pools risk across different farmers and areas (see next section on basis risk) and often the rain-gauge network is not sufficient to support all farmers in all regions on an individual insurance basis. Eventually the micro-finance institution could index their crop loans to weather indices as described above.
Another weather-based insurance client in Malawi could be the Malawi Social Action Fund (MASAF), which runs both safety net and public works programs in vulnerable areas of the country. MASAF has expressed an interest for the product in order to make its cash transfers more automatic, timely and predictable in times of developing food crises following a drought (or excess rainfall disasters). The design of an ex-ante risk management scheme with MASAF would entail a contingent plan for work-for-food or work-for-cash programs that would be rolled out with the insurance payout after an emergency. The advantage is that MASAF would not have to go through tedious time and resource-consuming project development and processing work. MASAF would probably buy single weather station products, so as to cater to specific local characteristics that would also act as an early warning type of system, detecting developing crises.

36
Villages could benefit from weather-indexed insurance. Recent assessments in Malawi show that villages tend to redistribute at least some resources in times of crises.33 Members with higher resource endowments support the weaker and vulnerable members but get repaid in kind or cash. This means that a village-level insurance product would effectively protect the village, particularly its poorest and most vulnerable members. A village-level insurance would also alleviate some of the “basis risk” problems (see next section): the likelihood of a weather station located near the village capturing the weather risk of the village is greater than that of capturing a single farmer’s risk yield exposure. Insurance policies could be subsidized by NGOs or other support organizations and pay out to village heads who then distribute the cash according to the informal risk sharing mechanisms in place. Probably, this risk “insurance” approach does not distort as much and is potentially less harmful than the individual food aid targeting effort.
The weather insurance could be tied to input credit. As explained in the poverty alleviation section, farmers tend to cope with weather risk through low or even zero input strategies. The farmers are often wary of up-front investments into certified seed for higher yielding varieties, for example, because a weather shock could diminish final returns below the break-even level. Thus, one way to directly impact farmer behavior in the sense of higher risk/high return strategy adoption is to provide weather insurance on inputs. In practice, the input supplier or financing bank would provide the inputs on credit and charge a premium for weather insurance upon repayment of the credit. Therefore, the insurance policy would be tied to the credit sale. In a case scenario of a normal drought, the farmer would repay only half of the credit and in the case scenario of a severe drought, the farmer could possibly repay nothing. This type of insurance has been piloted in Argentina by major seed companies. In India, input suppliers are currently designing similar policies.
In Malawi, major input suppliers could offer this type of insurance product in order to increase reach and uptake. A seed company such as Monsanto could offer a bag of seed coupled with an insurance policy, such as the farmer maize index product outlined in this section, calibrated to cover the hybrid maize production associated with each bag. In case of a major drought, the farmer would receive the insurance payout in the form of a credit repayment equal to the insurance payout to compensate him for the drought-related reduction in yield.
BASIS RISK: HOW GOOD IS THIS INSURANCE?
A major concern with insurance based on weather or other indices is basis risk, that is, the potential mismatch between insurance payouts and farmers’ losses. Jerry Skees (2003) writes that:
33 Dercon writes on Ethiopia that “when looking at the impact of food aid, we find that there is some within village-sharing of this food aid. … the relatively poor targeting is less a problem then standard analysis would have implied. We find that controlling for household level food aid, the fact that there is food aid to some in the community has an additional impact on consumption and the most likely interpretation of this is that transfers indeed take place. Informal risk-sharing seems to result in better outcomes of the food aid distribution scheme, compensating for some of the poor targeting involved. Furthermore, we also have evidence of some crowding out. There is evidence that villages with food aid seem to protect each other less for idiosyncratic risk, compared to communities without food aid schemes. In other words, this evidence is consistent with weakening informal arrangements because of the presence of a formal system.”p.24 WIDER Discussion Paper No. 2003/09, Food Aid and Informal Insurance, Stefan Dercon and Pramila Krishnan.

37
“[t]he effectiveness of index insurance as a risk management tool depends on how positively correlated farm-yield losses are with the underlying area yield or weather index.”
This concern relates to the question of whether insurance based on a weather index can substitute for traditional crop insurance and indemnify the farmer for his losses. The usual answer is that basis risk can be managed if:
1. The correlation between index and yields is high and the index is measured well.
2. Efficiency gains with index insurance allow for lower deductibles, which partially compensate for the basis risk.
An example of basis risk is seen in Figure 7 in 1994 - it is clear that the maize rainfall index indicates a lower expected maize yield than was actually experienced in the Lilongwe region. The basis risk is to the farmer’s advantage in this particular example. The experience of the Commodity Risk Management Group at the World Bank shows that the relevant question is whether the payout from insurance based on a weather index effectively reduces the insured’s value-at-risk (VAR) rather than compensating for a single crop loss only. In the financial markets, VAR is a standard measure of the market risk of a portfolio. It is defined as the economic loss expected to be exceeded with a given probability within a given time horizon due to adverse changes in market prices of the portfolio contracts occurring in a normal market environment. A farmer's value-at-risk is an effective measure of his overall vulnerability as well as his exposure to income shocks—such as a wedding, a disease, or a sizeable drought. The farmer is interested in maximizing his overall income while minimizing his value-at-risk. Income comes from multiple sources—such as off-farm labor, livestock, as well as field and perennial crops. As stated earlier, diversifying income sources is clearly a way of managing risks and minimizing VAR by sacrificing some of the benefits that could come with specialization and economies of scale.
However, spatial basis risk is a very important concern for farmers. Rainfall patterns vary across space as well as time, as do soil types and even growing patterns. In India, the first two years of experience with this type of weather insurance (2003: 1500 insured farmers, 2004: 18,000 farmers insured) reveals that further growth of this market will depend on the availability insurance contracts written on local rain gauges close to the farmer. In Canada, rainfall insurance in Ontario has been offered on the basis of local rain gauges and the Canadian experience shows that farmers are ready to take insurance on stations up to 30 km away from their fields. Various techniques are available to make these gauges tamper proof. As a result, providing insurance on this basis is a surmountable challenge. One insurer in India is actually providing this type of local rain gauge insurance in 2004, in response to feedback received from farmers involved in the 2003 pilot. Clearly, reinsurers are not ready to write reinsurance contracts on local rain gauges with little or no data history, therefore national insurers will have to step in and assume the basis risk between insurable regional WMO stations and local rain gauges. In the future, other datasets such as satellite rainfall estimates, NDVI or gridded rainfall products could be used as an alternative basis for reinsurance, or even for the insurance if farmers are comfortable with such products over their local rain gauge.
Basis risk, or in other words, the effectiveness of the insurance, is always an issue to be considered when dealing with index-based risk management solutions. Instead of asking the farmer to assume this basis risk, an alternative is to let the financier take the risk. A crop loan

38
portfolio insurance policy might be the better option than insurance directly to farmers because the lending institution assumes the basis risk and mitigates it by pooling loans across different farmers and areas. In this way farmers will also be able to directly benefit from this protection without having his/her expectations raised by purchasing specific stand-alone maize insurance. The ultimate aggregator of weather risk is at the governmental or regional level. These institutions can cope with the prospect of basis risk and have the means to redistribute and smooth insurance payments to regions or target areas where financial aid is required.
Finally, it is important to note that not all food security issues are caused by weather-risk. Civil strife, poor farm-management, and inadequate seed and fertilizer supplies may be as important as weather in triggering food emergency situations. Although unlikely, given the extreme nature of the risk being considered for SADC in the proceeding sections of this report, there is also the possibility that simple weather indices may not fully capture the financial impact of a weather event. Hence, the need for World Bank and donor assistance still remains within the SADC region.
MACRO LEVEL: MALAWI DROUGHT INSURANCE A market-based instrument such as weather-based insurance could generate a supplemental source of emergency financing to support existing resources at the country level. Distinct advantages that can be achieved through index-based ex ante financing include:
• Immediate cash payment
• Structured rules for payment
• Improved correlation between need and provision
• Flexibility of cash payments
• Risk assessment
• Risk mitigation
• Targeted assistance to problem areas (World Bank, 2004)
Rainfall impact on maize yields: the Malawi Maize Production Index: This section looks at the relationship between rainfall and key economic indicators such as domestic maize production in order to understand how rainfall fluctuations influence socioeconomic factors. Solely determining the occurrence of meteorological drought does not describe or quantify the socioeconomic impact of below-average rainfall on a region or country. Socioeconomic impacts can be derived by determining how low rainfall influences the production of maize and, in turn, the domestic levels of consumption. In Malawi, the primary impact of a drought is on the country’s maize production. Malawi requires 2,173,600 MT of food in maize equivalent to feed an estimated 11.4 million people34. The requirement increases to 2,654,080.00 MT in maize equivalent of seed, wastage, and processing losses are taken into account. Over the past two decades, the country has experienced five episodes of food crisis,
34 This is based on the premise that 2,200 kilocalories of energy is required per capita per day. To provide 80% of these calorie requirements, about 190kg of maize flour (mgaiwa) is needed per person per year. An equivalent maize of hproduction of 232 kg per person per year is required, assuming losses of 18% are taken into account for seed, wastage, and processing (UNDP/Malawi Government (1993). Situation Analysis of Poverty in Malawi).

39
as seen in Figure 1, the worst being that of 1991/92 with a food deficit of approximately 1 million MT in maize equivalent terms. In relative terms, the deficits of 1993/94 and 2002/03 estimated at 798,085 MT and 600,000 MT, rank second and third respectively. Average production is around 1.9 million MT, usually not sufficient to cover all national consumption needs. Thus, reductions in maize stocks, due to drought, directly impact the food security of the nation. Defining an agricultural drought-based index could be an effective proxy of Malawi’s domestic production and ultimately food security situation.
Defining the Drought Index. Similar to the individual weather-insurance policies suggested for maize farmers in the previous section, it is possible to go one step further and define a specific nation-wide maize production index for the entire country. Such an indicator could form the basis of an index-based insurance policy or an objective trigger to a contingent credit line for the government in the event of food emergencies that typically put pressure on government budget reserves. Following the methodology of the previous section concerning weather-risk management at the micro level, the first step in defining a Malawi maize production index is to construct a maize rainfall index for each of the 13 Malawi Meteorological Office weather stations, as seen in Figure 5. As before, the rainfall index is defined as a weighted sum of cumulative rainfall during the 130-day growing period of maize, with individual weights assigned to specific phases of the crop’s evolution. As in the previous section, sowing is determined to take place during the first decade or 10-day period after October 1st when rainfall is greater than 30mm. This level of rainfall indicates the commencement of rains for the farmers in the region and hence, given the long growing cycle of maize, the optimal time of sowing.
Defining the Insurance Strategy. There are two alternative methodologies for the development of an index-based drought insurance strategy for the national government: a) writing a weather-indexed insurance contract on each of the 13 weather stations or b) writing an insurance contract on a weighted average, known as a basket. The basket consists of individual contracts taken from across the country with weights chosen to represent the expected maize production in the region, or Extension Planning Areas (EPAs), represented by each weather station. The latter is a cheaper, more efficient and appropriate approach. Firstly, it gives a measure of the countrywide exposure of maize production to drought and serves as a nation-wide food security indicator. The government may be able to cope with small, localized droughts by transporting food supplies from other districts of the country and by sourcing government budget reserves. Retaining such risks will most probably be a more cost-effective solution than seeking insurance and Malawi should be able to take advantage of the natural diversification of the country to reduce its insurance costs. However, in situations where drought affects several districts, or when there is a severe regional drought, this reallocation of resources may not be manageable for the government and it would be appropriate to utilize the basket-based insurance product to measure when such events occur. Secondly, the basket approach will reduce the risk of reliance on one weather station as well as the associated issues of moral hazard and basis risk35. On this note, including more stations in the basket not only gives better national coverage and hence representation of the index, but also increases the placement potential of the structure in the international reinsurance markets. An example for the 13 meteorological stations is shown in Table 10.
35 Potential mismatch between insured party’s actual loss and the insurance payment.

40
This would be incorporated into the design of a Malawi Maize Production Index (MMPI) as the weighted average of all 13 Maize Rainfall Indices (MRIs), weighted by the corresponding average or expected production in each location.
It is worth noting the comparison between the MMPI and the cumulative rainfall, in Malawi, in February. Edward Clay et al (2003), in their studying, using monthly rainfall totals showed that February is the most critical rainfall month for the country’s maize crop. As for the MMPI, a weighted average of February cumulative rainfall for each of the 13 weather stations is calculated - as above the weightings correspond to the average or expected production in each location. The inter-annual variations in the MMPI and the February cumulative rainfall weighted average correlate well with a correlation coefficient of 0.59 (significant at the 99% confidence level). However, it is clear that the MMPI captures very different characteristics of the October-April growing season than the simple February cumulative rainfall weighted average, as seen in Figure 12. For example, it indicates that poorly-timed rains in 1980, 1983 and 1984 implied a worse crop than would be expected by the February rainfall totals alone, again visible in Figure 12. As we do not have a consistent and reliable yield for these early years, it is not straightforward to establish which rainfall indicator would be more representative of Malawi’s maize production. Consulted Malawi agronomists indicate the MMPI is a more robust approach as it captures the sowing date and hence the critical periods of the maize growth cycle. Given the findings in the Micro Level Insurance section, we focus on the MMPI for the remainder of this report.
Table 10: Maize Rainfall Indices (MRI) for Malawi Weather Stations, 1965-2003
Station Average MRI
(mm) Standard Dev. CV Average Production in local
EPAs (10-yr) MTs)
1. CHITIPA 70.64 15.12 0.21 17370 2. KARONGA 65.71 20.95 0.32 12870 3. MZIMBA 67.66 15.90 0.23 72139 4. MZUZU 66.25 22.15 0.33 41708 5. NKHATA BAY 73.74 20.29 0.28 9182 6. LILONGWE 65.32 20.31 0.31 277750 7. CHITEDZE 66.14 19.35 0.29 295846 8. NKHOTAKOTA 95.05 23.72 0.25 25674 9. DEDZA 71.27 16.24 0.23 42865 10. SALIMA 93.97 27.73 0.30 78088 11. CHILEKA 61.07 19.13 0.31 266381 12. MANGOCHI 51.68 22.58 0.44 154881 13. THYOLO 79.51 24.94 0.31 105096
Source: Authors

41
Figure 12: Malawi maize production index and simple cumulative rainfall
Source: Authors
Quantifying Drought Impact. It is difficult to establish a true relationship between variations in the MMPI and total maize production as the maize production record is short and exhibits an increasing trend since 1984. However, we can choose a significant year, such as 1992, when Malawi experienced a severe food emergency situation, to establish a working relationship. Figure 13(a) shows the MMPI against recorded national total maize production since 1984. In 1992, a 1 mm deviation below the 10-year average of the MMPI corresponds to approximately a 30,000 MT shortfall of maize from the 10-year average production level. Thus, in 1992, the MMPI would suggest that Malawi was expecting a shortfall of approximately 900,000 MT. Figure 14 shows the MMPI for harvest years 1965-2003 against the food aid assistance given to Malawi and it is clear that there is a strong correspondence between low MMPI years and food aid imports, particularly the extreme droughts of 1992 and 1994—1,000,000 MT in total (cereal) food aid was given to the country in 1992.
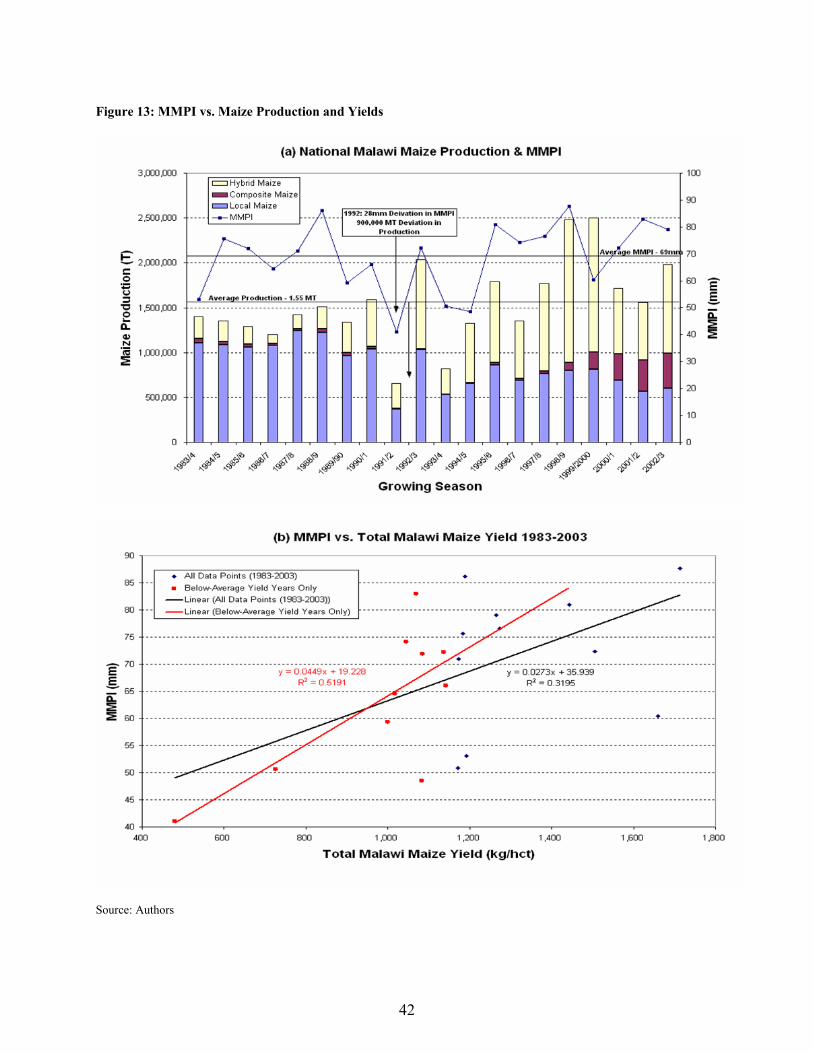
42
Figure 13: MMPI vs. Maize Production and Yields
Source: Authors

43
A straight forward correlation of the MMPI with the national maize yield data (1983-2003) gives a correlation of 57%, which is the MMPI described 32% of the maize yield variability in the past 21 years, as seen in Figure 13(b). However, the MMPI is a prototype drought index, therefore when only below average maize yield years are taken into account (10 years in total) the correlation rises to 72%; i.e. the index describes 52% of the maize variability in low-yield years. An insurance structure based on this index could remove up to 52% of the risk the government of Malawi faces in a poor year due to drought.
The analysis does raise some interesting questions, however, because low rainfall does not always correspond to drops in yields and at times, too much rainfall can also be problematic. The growing season 1999/2000 appears to have experienced deficit rainfall as measured by the MMPI, as seen in, Figure 14(a), yet maize production appears to have been unaffected. The growing season, 2001/2002, on the other hand, saw low maize production levels and subsequent food aid donations; however, there is no evidence of drought at any of the weather stations during that season. In fact, it was excess rainfall and subsequent water logging that caused the 35% yield shortfall.36 Production shortfalls during the previous season resulting in general low maize availability within the country, high maize prices, late planting and erratic rains were also cited as reasons for food aid assistance in 2002 (Malawi Emergency Food Security Assessment Report, 2002). During the growing season of 2002-2003, heavy rains, resulting in flooding and water logging, also negatively impacted the 2003 harvest in central and southern Malawi (Malawi Emergency Food Security Assessment Report 2003). This indicates excess-rain cover should also be incorporated in the MMPI to capture the adverse effects on flooding, as well as drought, on maize yields (Clay et all, 2003). These issues deserve further investigation in order to understand all the uncertainties that factor into Malawi’s food production profile. Work with the FAO will help refine the index with particular emphasis on how excess rainfall can be incorporated into the structure.
36Since the Ministry of Agriculture and Irrigation (MoA&I) estimated that root and tuber production (cassava, sweet potatoes, Irish potatoes) had been “high”, FEWS NET predicted that food availability would be more than adequate, with a surplus over consumption needs (in maize-equivalent terms) of 437,775 MT.36 Also, ADMARC and the National Food Reserve Agency (NFRA) were supposed to hold over 60,000 MT in maize stocks at the start of the new consumption year (April 2001). The flood-triggered maize production shock was compounded by reduced application of agricultural inputs, especially chemical fertilizers, for several reasons: late delivery and reduced coverage of the ‘Starter Pack’ (now renamed the ‘Targeted Input Program'), the introduction of a 50% interest rate on APIP’s input loans, and continued escalations in fertilizer prices (to over MK1,000 per 50kg bag). However, it is simplistic to attribute the famine to cutbacks in the Targeted Input Programme. The production shock was caused by bad weather, and inputs such as fertilizers offer little protection against climatic fluctuations that cause waterlogging of fields. However, research is needed on whether waterlogged fields where fertilizers had been applied managed to achieve better harvests in 2001 than those where fertilizers were not applied. The Malawi Famine Of 2002, Causes, Consequences & Policy Lessons, Stephen Devereux, May 2002.

44
Figure 14: Historical MMPI Insurance Payouts
Source: Authors
Despite these occurrences, the use of an underlying index, such as the MMPI, is a feasible and objective means of providing indexed-insurance compensation for the government in the event of drought-related maize shortfalls. For example, setting the MMPI retention threshold at 25% below the 40-year average and assuming a notional value of 30,000 MT of maize per MMPI unit below the threshold, payments would have been triggered in 1968, 1973, 1992 and 1995 to financially compensate the government for the food emergencies that subsequently occurred in those years, as seen in Figure 14. Assuming a cash equivalent $200 per MT, a payout structure for this insurance is shown in Figure 15, with a maximum payout of $70 million. These numbers are first-order estimates and would need to be revised if an insurance policy was to be bought.
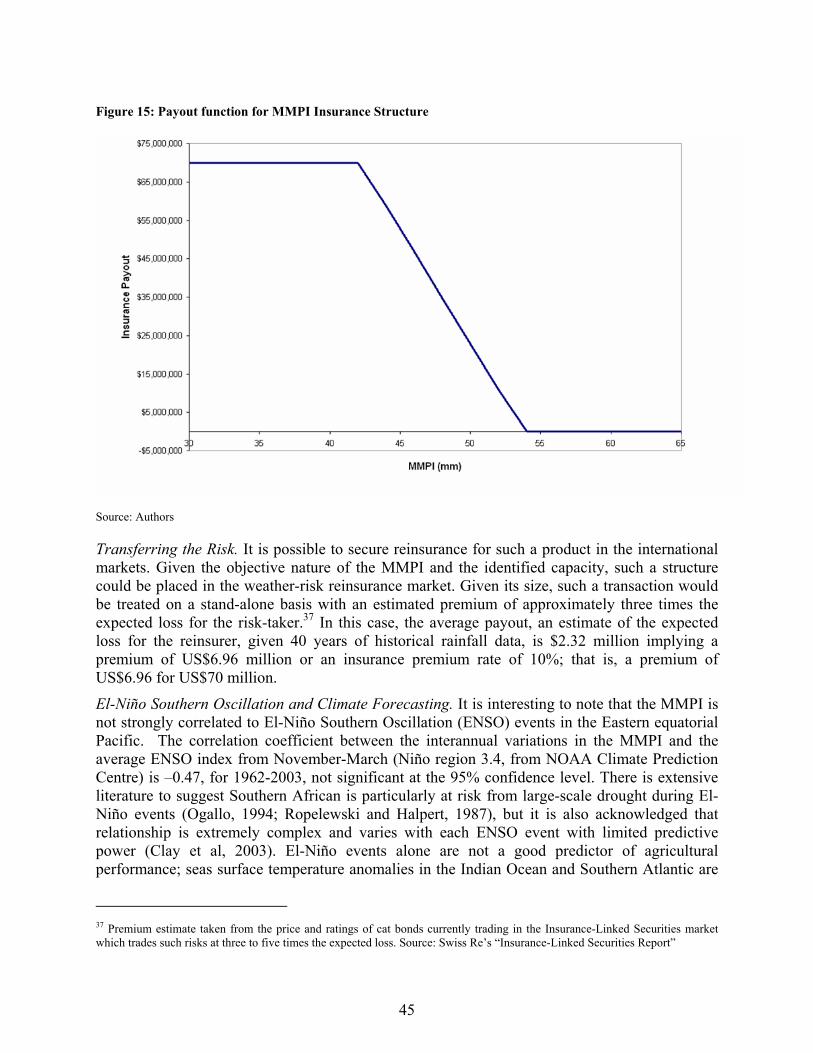
45
Figure 15: Payout function for MMPI Insurance Structure
Source: Authors
Transferring the Risk. It is possible to secure reinsurance for such a product in the international markets. Given the objective nature of the MMPI and the identified capacity, such a structure could be placed in the weather-risk reinsurance market. Given its size, such a transaction would be treated on a stand-alone basis with an estimated premium of approximately three times the expected loss for the risk-taker.37 In this case, the average payout, an estimate of the expected loss for the reinsurer, given 40 years of historical rainfall data, is $2.32 million implying a premium of US$6.96 million or an insurance premium rate of 10%; that is, a premium of US$6.96 for US$70 million.
El-Niño Southern Oscillation and Climate Forecasting. It is interesting to note that the MMPI is not strongly correlated to El-Niño Southern Oscillation (ENSO) events in the Eastern equatorial Pacific. The correlation coefficient between the interannual variations in the MMPI and the average ENSO index from November-March (Niño region 3.4, from NOAA Climate Prediction Centre) is –0.47, for 1962-2003, not significant at the 95% confidence level. There is extensive literature to suggest Southern African is particularly at risk from large-scale drought during El-Niño events (Ogallo, 1994; Ropelewski and Halpert, 1987), but it is also acknowledged that relationship is extremely complex and varies with each ENSO event with limited predictive power (Clay et al, 2003). El-Niño events alone are not a good predictor of agricultural performance; seas surface temperature anomalies in the Indian Ocean and Southern Atlantic are
37 Premium estimate taken from the price and ratings of cat bonds currently trading in the Insurance-Linked Securities market which trades such risks at three to five times the expected loss. Source: Swiss Re’s “Insurance-Linked Securities Report”

46
also considered important, as are the intra-seasonal variations in rainfall, a complex aspect extremely difficult to predict using large-scale indictors (Clay et al, 2003). Given the literature and the findings above, there is no strong element of asymmetric information in transferring this kind of risk to the international markets. Although insurers are likely to have much better access to global and regional medium-term forecasts than the insured, long-lead forecasting is still in its infancy and skill in these forecasts is still not at a sufficient level to be a cause for concern if the transaction is closed within six months of the start date.
Food Security Risk Management – the risk layering approach: The design of a comprehensive risk management approach to finance the potential deficit between food supply and demand when an adverse shock occurs involves the optimal combination of financial and physical strategies. The following responses need to be optimized: commercial imports, grain reserves, and the use of financial contracts to either transfer the risk to a third party or intertemporally smooth the exposure to risk. The selection of the optimal combination includes the determination of attachment points or deductibles (layering of risk) as well as determining the optimal risk allocation arrangements within each layer of risk between each available strategy or instrument at hand.
The layering of risk is therefore a result of both a technical analysis and a market evaluation of available prices for the different financial instruments under consideration. The technical analysis is referred to the definition of a reference loss. The reference loss is a concept derived from the insurance industry. It corresponds to a major loss which insurance companies with average capitalization should take as a basis for deciding on the level of retention of risks and therefore the amount of risk capital to buy from the reinsurance market. The reference losses chosen are such that they are rare but nevertheless possible. For example, the financial markets usually use a return period of 100 years for the risk of hurricane.
For food security risk management, the reference loss can be interpreted as the degree of security the policy makers in a country like Malawi, in combination with the efforts of the international community, would like to pursue to avoid a potential insolvency of their strategy. In other words: what is the probability of a food crisis given an adverse shock? The reference loss actually determines the amount of risk capital a particular country needs to secure the solvency of the strategy for those events with probabilities lower than the reference loss. Once the reference loss is defined and estimated, the layering of risk becomes an issue of cost-efficiency between the different alternatives. The decider has to arbitrage between two or more instruments available to cover events with similar characteristics (mainly frequency and economical loss attached to the event), aiming at the least expensive, both in terms of financial and economical costs.
In order to illustrate the concept a simple prototype example will be discussed. The risk layered emergency risk management scenario, as seen in Figure 16, assumes commercial imports as the first line of defense in case of production shortages and the strategic grain reserve as the second way of remedying short-term needs. The weather insurance described above would function similarly to a cash reserve and would be available in extreme drought cases. A cash reserve would allow the government to choose between vouchers, cash transfers, and food import tenders for in-kind distributions and could therefore minimize market distortions. Finally, in the case of a secular shortfall or weather un-related emergency, cash and/or foreign aid, including food aid, need to be “appealed” for. This food security risk management scenario figure

47
illustrates how timely and predictable weather insurance payouts replace food aid in a severe drought aid scenario.
Figure 16: Food security risk management - layering approach – three scenarios
Source: Authors
SADC LEVEL: WEATHER-RISK FUND
The 2002-2003 food crisis highlighted the vulnerability of the Southern African Development Community (SADC) region to weather-related risks, and the need for external assistance. The weather-indexed drought-risk management approach suggested for Malawi is one that could easily be extended to include all members of SADC. Weather risk can be retained and managed internally if the areas under management are significantly diverse in their weather-risk characteristics. This immediately suggests that by taking neighboring countries into account, the other SADC members, could potentially alter the risk profile of Malawi and its need for outside insurance. The possibility of pooling and sharing risk throughout the SADC region has immediate implications for the cost associated with transferring the excess risk to external reinsurance or capital markets. A more efficient means of transferring risk implies that costs could be greatly reduced for the member countries by transferring risk as part of a regional strategy rather than by transferring that risk one country at a time. There are two additional benefits of pooling the risk within the region:
1. There may not be enough capacity in the reinsurance market for the individual weather-risk of all 14 SADC countries. An upper-bound estimate of the market’s capacity would be around $1 billion maximum.

48
2. In order to attract the capital markets, a securitization must have notable size, with a minimum of $100 million of risk and an expected loss of 1%.
This risk capacity profile indicates that a layered approach is needed when considering possible weather-risk management strategies within SADC which involves finding the most efficient way to structure and transfer weather risk. In the SADC region, this implies a three-tiered approach:
1. SADC Fund: Risks associated with small and localized droughts could be pooled and managed within SADC by the formation of a mutual fund to which each country or donors would contribute. Taking part in this pooling mechanism grants members access to the fund in the event of a well-defined drought or other weather event. In effect, SADC forms its own mutual insurance company.
2. Reinsurance: The SADC fund could seek reinsurance coverage to secure protection for the more extreme events that would exhaust the fund’s capacity. Alternatively, the World Bank could offer a contingent credit line to SADC member countries through the fund.
3. Securitization: The final and extreme tranche of risk, occurring 1% of the time, could be securitized and issued as a cat bond in the capital markets. The advantage of this risk transfer into capital markets is its longer tenure of up to 3 years, possibly even longer. As the potential size of the reinsurance market to weather risk is estimated to be approximately $1 billion, the most efficient option for transferring the most extreme and tail risk would be through securitization. Cat bonds, with an expected-loss around 1%, are rated as “BB” bond in the capital markets.38 This rating for issuing cat bonds is the most popular with capital market investors. Therefore, tranching the risk suitably could open the door to the increased capacity of the capital markets and the associated potential of securing multi-year protection. This is particularly interesting as there is some indication of year-on-year persistence of drought event frequencies in the historical rainfall data.
Modeling SADC Drought-Risk. As we only have 22 years of ARTES data, the best way to illustrate how SADC could share, pool, and transfer its weather-risk is by simulation. A very simple example to illustrate the idea of a SADC risk pool is outlined below. Caveats and the necessary steps required for making this a workable solution will be discussed in the next section. Assuming that each SADC member country faces drought-risk, each country can retain some of this risk on the localized level, but the Malawi example above shows that financial protection, from outside the country, is needed when the country-average seasonal rainfall totals drops below 75% of the expected level. Thus, let us assume that each SADC member defines its
38 Cat bonds are a means by which capital markets investors provide natural catastrophe protection to the (re-)insurance industry. In essence, investors invest funds in a catastrophe bond and if a catastrophe occurs that "triggers" the bond (each bond has a unique trigger mechanism), investors may lose some or all of the capital invested. In the case of an event, the funds are paid to the bond sponsor — an insurer, reinsurer or corporation — to cover losses. In return, the bond sponsors pay interest to investors for this catastrophe protection. Cat bonds offer investors an attractive risk / return profile and serve to diversify portfolio risk. Global cat bond issues reached $2.1 billion in 2003 ($us 1billion in 2002), total outstanding risk in 2003 amounted to $US 4.3 billion. Source: Swiss Re New Markets.

49
drought-risk as drought during the rainy season, October-April, when the recorded rainfall average throughout the country is less than 75% of the long-term normal.
For simplicity and purely for illustration, it shall be assumed, further, that the financial impact of such events for each SADC country is determined by that country’s vulnerability-profile which is partially represented by the average food aid requirements demanded by each country (Table 9) as a total of the overall food aid donations to SADC. Not all countries in SADC draw on food aid, however, all countries face some degree of drought exposure (Table 8). It is, therefore, suggested that for the purpose of illustration, the contribution of each country to the drought-risk pool could be weighted by the following calculation:
80% x Share of Food Aid to SADC + 20% x Share of Total SADC Agricultural GDP
For example, in Table 11, given Malawi would be seeking a maximum coverage of $70 million, this would imply a total SADC drought exposure of $1.1 billion. The $ equivalent capacity of each country to adequately manage the costs of drought are given in Table 13.
Table 11: Weather-Risk Vulnerability Profile for SADC members
Country % Share of Food
Aid to SADC % Share of Total
Ag. GDP for SADC SADC Drought-
Fund Contribution
Maximum Insurance Payout
($) 1. Angola 27% 5.5% 22.74% 252,375,415 2. Botswana 0% 0.8% 0.16% 1,815,078 3. Congo 0% 21.2% 4.24% 47,019,937 4. Lesotho 6% 0.7% 4.63% 51,356,945 5. Malawi 7% 3.9% 6.31% 70,000,000 6. Mauritius 0% 1.7% 0.35% 3,883,607 7. Mozambique 10% 4.7% 9.12% 101,190,407 8. Namibia 0% 1.7% 0.34% 3,782,919 9. Seychelles 0% 0.1% 0.03% 278,195 10. South Africa 0% 22.3% 4.45% 49,403,301 11. Swaziland 1% 0.7% 0.72% 8,001,334 12. Tanzania 10% 24.1% 13.08% 145,190,228 13. Zambia 16% 5% 13.53% 150,157,022 14. Zimbabwe 23% 8% 20.31% 225,442,312
Source: Authors
SADC Fund Simulation Results: In order to give an indication of how drought-risk can be layered and transferred within SADC, seasonal rainfall totals are simulated for each member country on the ARTES rainfall dataset. A Gamma distribution is fitted to each 22-year data record for each SADC country (Table 6) and 140,000 correlated samples (Table 7) are drawn from the distributions in order to simulate 10,000 possible October-April rainy seasons throughout the SADC region. A positive random variable X is Gamma distributed X ~ Gamma(α,β) when
( ) ( )αβ βαα Γ= −− /1 xexxf
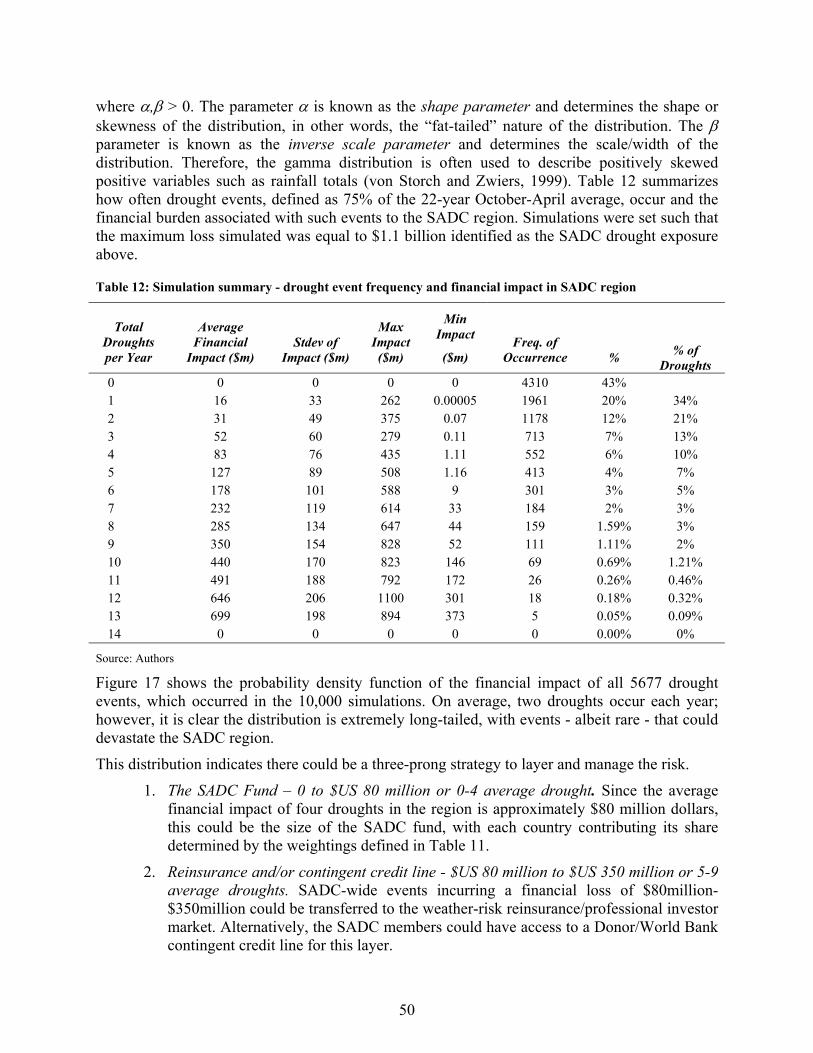
50
where α,β > 0. The parameter α is known as the shape parameter and determines the shape or skewness of the distribution, in other words, the “fat-tailed” nature of the distribution. The β parameter is known as the inverse scale parameter and determines the scale/width of the distribution. Therefore, the gamma distribution is often used to describe positively skewed positive variables such as rainfall totals (von Storch and Zwiers, 1999). Table 12 summarizes how often drought events, defined as 75% of the 22-year October-April average, occur and the financial burden associated with such events to the SADC region. Simulations were set such that the maximum loss simulated was equal to $1.1 billion identified as the SADC drought exposure above.
Table 12: Simulation summary - drought event frequency and financial impact in SADC region
Total Droughts per Year
Average Financial
Impact ($m) Stdev of
Impact ($m)
Max Impact ($m)
Min Impact
($m) Freq. of
Occurrence % % of Droughts
0 0 0 0 0 4310 43% 1 16 33 262 0.00005 1961 20% 34% 2 31 49 375 0.07 1178 12% 21% 3 52 60 279 0.11 713 7% 13% 4 83 76 435 1.11 552 6% 10% 5 127 89 508 1.16 413 4% 7% 6 178 101 588 9 301 3% 5% 7 232 119 614 33 184 2% 3% 8 285 134 647 44 159 1.59% 3% 9 350 154 828 52 111 1.11% 2% 10 440 170 823 146 69 0.69% 1.21% 11 491 188 792 172 26 0.26% 0.46% 12 646 206 1100 301 18 0.18% 0.32% 13 699 198 894 373 5 0.05% 0.09% 14 0 0 0 0 0 0.00% 0%
Source: Authors
Figure 17 shows the probability density function of the financial impact of all 5677 drought events, which occurred in the 10,000 simulations. On average, two droughts occur each year; however, it is clear the distribution is extremely long-tailed, with events - albeit rare - that could devastate the SADC region.
This distribution indicates there could be a three-prong strategy to layer and manage the risk.
1. The SADC Fund – 0 to $US 80 million or 0-4 average drought. Since the average financial impact of four droughts in the region is approximately $80 million dollars, this could be the size of the SADC fund, with each country contributing its share determined by the weightings defined in Table 11.
2. Reinsurance and/or contingent credit line - $US 80 million to $US 350 million or 5-9 average droughts. SADC-wide events incurring a financial loss of $80million-$350million could be transferred to the weather-risk reinsurance/professional investor market. Alternatively, the SADC members could have access to a Donor/World Bank contingent credit line for this layer.

51
3. Securitization – $US 350 to US$1000 million or 10+ average droughts. The final tranche of risk, occurring 1% of the time, could be securitized and issued as a cat bond in the capital markets. Cat bonds with a BB rating currently trade at approximately 3-5 times their expected loss.39
The profiles of each risk layer are shown in table 13. The table indicates that for a SADC-wide coverage of US$1.1 billion, the SADC members would need to post approximately US$100 million annually. Given Malawi’s risk profile, this would indicate a premium of $6.3 million for Malawi.40 From the simulations, a stand-alone reinsurance premium for Malawi would cost approximately $8.1 million annually. Hence, pooling the risk implies a $1.8 million or 22% reduction in premium required to manage Malawi’s drought risk.41
Table 13: Risk layers and risk transfer within the SADC region
Expected Payout
($m)
Standard deviation of Loss
($m) Maximum Loss
($m) Expected
Loss Indicative Premium
($m) SADC Fund 21 32 80 26% 21* Reinsurance 23 66 270 6% 68 Securitization 3.5 31 660 1% 11 Total 47.5 1,100 100
*Following an initial $80 million capitalization of the fund. $US 19 million premium flow into the fund annually and increase its net asset value above $US 75million in normal years. These extra resources build a cushion for worse years. If, on the contrary, the fund is depleted before it can build up the necessary reserves, it requires an extraordinary capital increase by its members. Source: Authors
39 This information is taken from Swiss Re’s “Insurance-Linked Securities Report” issued in April 2004 listing the price and ratings of cat bonds currently trading in the Insurance-Linked Securities market. 40 Since Malawi holds approximately 6.3% of the total SADC risk. 6.3% * $100m = $6.3m. 41 From the simulations, it was found that the average payout for Malawi alone, after 10,000 simulations, was $2.69m - implying an indicative reinsurance premium of $8.1m, or three times the expected loss for the reinsurer. This indicates that risk-pooling effects can reduce this stand-alone hedging premium by 22%.
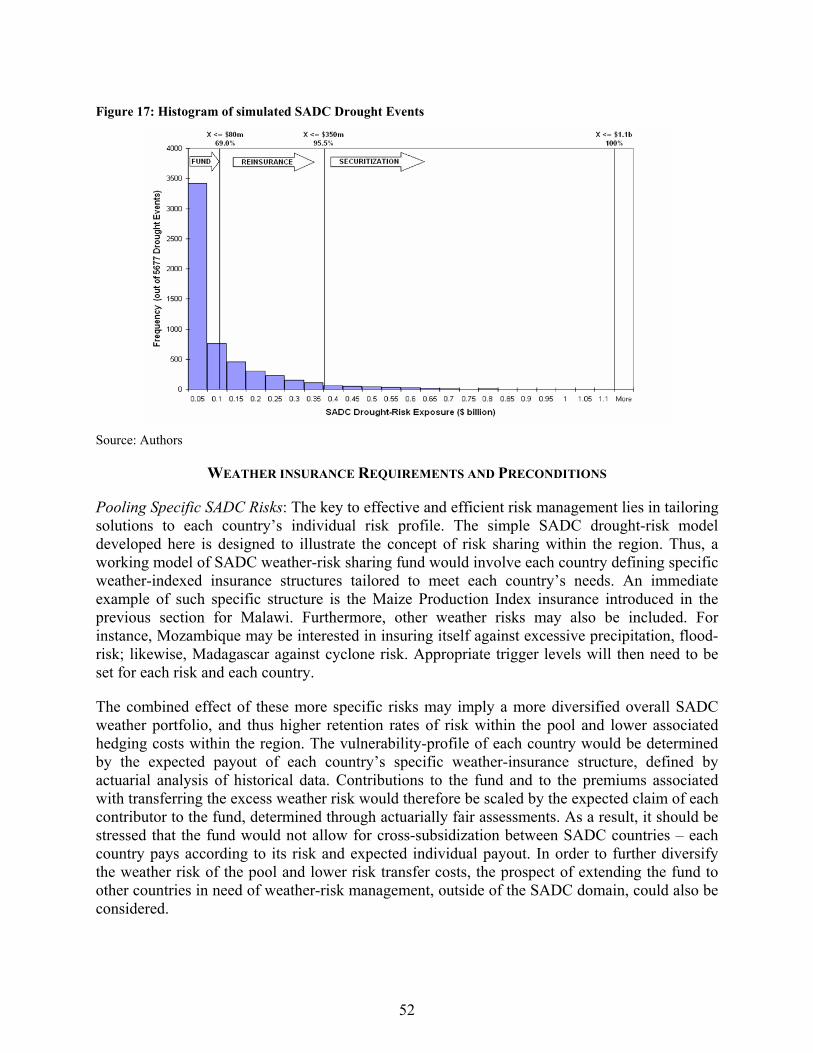
52
Figure 17: Histogram of simulated SADC Drought Events
Source: Authors
WEATHER INSURANCE REQUIREMENTS AND PRECONDITIONS
Pooling Specific SADC Risks: The key to effective and efficient risk management lies in tailoring solutions to each country’s individual risk profile. The simple SADC drought-risk model developed here is designed to illustrate the concept of risk sharing within the region. Thus, a working model of SADC weather-risk sharing fund would involve each country defining specific weather-indexed insurance structures tailored to meet each country’s needs. An immediate example of such specific structure is the Maize Production Index insurance introduced in the previous section for Malawi. Furthermore, other weather risks may also be included. For instance, Mozambique may be interested in insuring itself against excessive precipitation, flood-risk; likewise, Madagascar against cyclone risk. Appropriate trigger levels will then need to be set for each risk and each country.
The combined effect of these more specific risks may imply a more diversified overall SADC weather portfolio, and thus higher retention rates of risk within the pool and lower associated hedging costs within the region. The vulnerability-profile of each country would be determined by the expected payout of each country’s specific weather-insurance structure, defined by actuarial analysis of historical data. Contributions to the fund and to the premiums associated with transferring the excess weather risk would therefore be scaled by the expected claim of each contributor to the fund, determined through actuarially fair assessments. As a result, it should be stressed that the fund would not allow for cross-subsidization between SADC countries – each country pays according to its risk and expected individual payout. In order to further diversify the weather risk of the pool and lower risk transfer costs, the prospect of extending the fund to other countries in need of weather-risk management, outside of the SADC domain, could also be considered.

53
In addition to drought and floods, government budgets are exposed to maize price volatility in drought years and oil price hikes due to its oil import dependence. All three of these risks can be hedged or insured in international markets: weather-risk markets, SAFEX (South African futures exchange) for maize prices, and international oil price risk markets (Brent Spar, other indices for refined oil). Simultaneous oil price increases, a severe drought, and high import maize prices deplete Malawi’s meager reserves. This exposure and the ensuing volatility in government capital accounts depress the country’s credit worthiness. Exchange rates are similarly affected. An effective downside exposure hedge could stabilize government finances and exchange rate.
Data Requirements: While the ARTES data was used in the previous example, this data cannot be relied upon in the implementation of a SADC risk management program. The gridding and interpolation methodology used in constructing the ARTES dataset is not adequate to represent or capture sub-national level weather events. Furthermore, the non-constant numbers of GTS stations involved in the merging algorithm does not allow for rigorous comparison of data-points year-to-year. Therefore, in order to implement a successful SADC weather-risk management program, the data used to construct the underlying weather indices must adhere to strict quality requirements, including:
• Reliable and trustworthy on-going daily collection and reporting procedures.
• Daily quality control and cleaning.
• An independent source of data for verification (for instance, GTS weather stations).
• A long, clean historical record to allow for a proper actuarial analysis of the weather risks involved.
Generally, most weather insurance contracts are written on data collected from official Meteorological Office weather stations. Ideally, these are automated stations that report daily to the GTS – the World Meteorological Organization’s Global Telecommunication System. The quality of the rain-gauge network in Southern Africa, however, is not so clear. In Malawi, although all 22 weather stations are manually operated, most report to the GTS and have complete historical daily records going back at least 40 years. Additionally, the South African rain-gauge network is also known to be of a high quality. Indeed, a weather-indexed insurance contract for a South African apple co-operative has been recently written and transacted. Unfortunately, this is not the case for the entire SADC region. Severe under-funding of the Zambian Meteorological Office, for example, has resulted in large data gaps and poor reporting quality from its weather stations network. Furthermore, the spatial coverage of the rain-gauge network throughout SADC may not be sufficient to fully represent each country’s risk profile.
Given the obvious potential for moral hazard when writing insurance contracts settled on data collected from ground-based observatories, it may not be prudent to place an entire country’s weather risk on data recorded by a network of manual rain-gauges. Automated fallback weather stations placed near the existing rain-gauges are a simple and short-term solution to alleviate the expected moral hazard concerns of the insurance companies taking the weather risk. Automated fallback stations with communication capabilities can be independently monitored and serve as a crosscheck for the measurements recorded at the official weather stations on which the insurance contracts are written. Fully automated weather stations cost approximately $12,000. Using an independent and respected third party to verify and crosscheck the settlement data would also be required, such as the UK Met Office. Another alternative is to use satellite-based products to

54
measure the pertinent weather parameters or the impact of weather. Two strong candidates include satellite-derived precipitation estimates and Normalized Difference Vegetative Index (NDVI) satellite readings. A feasibility study is currently underway within CRMG, in conjunction with the FAO, to see if these products could be used as viable alternatives to rain-gauge stations for Malawi.
4. CONCLUSIONS
Food security in Southern Africa can be enhanced with weather-risk management techniques. Functioning markets, comprising of free markets for storage and possibly warehouse receipt financing systems, improved smallholder productivity, well targeted social safety nets, and a clear emergency risk management system are other elements that should be addressed by a strong food security system. These elements are partly interdependent, mutually reinforcing, and would alleviate poverty by protecting farmers, financial intermediaries, and states against the financial consequences of a severe drought.
Weather-based insurance, that is, insurance based on a weather parameter or another objective index that is well correlated with the insured’s income risk exposure, can help to better absorb severe weather shocks. There is a US$4.6 billion global weather-risk market as well as alternative risk transfer market that can easily insure a good part of the risk in international financial markets. This type of insurance can be written at farmer, financial intermediary, government or even SADC weather-risk fund levels of risk aggregation. This type of insurance is very successful at the farm level in India on a pilot basis.
Weather-risk management for the large systemic drought risk would allow operators at all levels to better manage their risk and improve investment decision-making. At the national level, the predictable instant availability of cash would improve the emergency risk management process and lower costs for national governments and donors alike. National governments could lower the level of strategic grain reserves to the actual unpredictable short-term requirements – different from the extra cash needs in the usual slow onset food crisis situation. Financial intermediaries could optimize their risk premium pricing for customers and strip the systemic risk component and related moral risk out of production finance defaults. At the farm or village level, producers could protect their incomes and vital assets against severe weather shocks affecting the entire portfolio. A SADC drought risk fund could reinsure itself against a large regional weather shock, such as the El Niño related large-scale droughts of 1992.
The World Bank can support the development of a sound food security system through its policy dialogue with governments, technical assistance, and lending for software and hardware required to improve the four components of the food security pyramid: functioning markets, smallholder productivity, social safety nets, and emergency/weather-risk management. In order to strengthen the ex-ante emergency risk management part, the World Bank could provide a contingent credit facility (or an IDA loan with a deferred draw-down option triggered by weather) to the SADC countries through the SADC fund. Thus, the World Bank would “back-up” the SADC fund with this credit facility that can be called upon when the SADC fund is insufficient to cover all

55
member country claims.42 The World Bank funds disbursed to the member countries would become loans. The donor community could co-finance premiums or provide some of the SADC fund back-up facility as grants rather than loans43. In addition, the World Bank and other donors could help to capitalize the SADC fund. The World Bank would also be called upon to intermediate a weather insurance (or derivative) contract between the government, for example, and the weather-risk market. Finally, on the subject of securitization, the World Bank could guarantee the bi-annual premium payments by SADC to the cat bond holders. Such an AAA guarantee would be necessary to place this bond in the markets with a competitive rating. Alternatively, IFC could play a strong complementary role by lending to rural finance institutions and warehouse receipt systems and by investing in silos and private risk transfer mechanisms.
5. NEXT STEPS
The team has held two workshops with key stakeholders in the public and private sectors in Malawi. The Micro workshop agreed that there was a clear need for weather insurance for certain members of the farming community in Malawi and that a pilot for the 2005/2006 growing season should be launched. Cash-crop farmers (seed maize, cotton, groundnut, tobacco) were identified as the appropriate target group for weather insurance – farmers with a high-value crop that would be willing and able to pay a premium for weather protection. It was suggested that the weather insurance contracts should be sold together with a crop loan as a combined package for the farmer. The crops and quality of the weather stations will determine the regions in which the insurance can be piloted. The key driver identified for a successful pilot was the National Smallholder association NASFAM, however at least one financial institution and at least one insurance company must be involved and engaged in the project. A work plan for the potential stakeholders has been drafted. In addition, weather stations must be purchased and installed by the Malawi Meteorological Office so that automated fall-back stations exist for the pilot regions. An independent third party, such as the UK Met Office, must be identified for checking and verifying the settlement data, as well.
The Macro Workshop discussed two scenarios for how weather insurance could be used as part of a wider national drought risk management strategy by GoM:
• Scenario 1: GoM Budget Insurance. This is weather insurance to protect GoM from shortfalls in national maize production, partly replacing the Strategic Grain Reserve (SGR) and cash reserve with an insurance contract designed to trigger payments to GoM in the
42 There are precedents for World Bank projects contemplating backstopping facilities. A livestock development loan in a Mongolian operation can be called on to pay for insurers’ claims on a government reinsurance facility for livestock insurance. 43 There could be case incentives stacked against annual disaster insurance premium payments though, as countries can expect large amounts of free aid in case of large disasters.

56
event of a severe drought, such as in 1992. This scenario was well accepted by the breakout group who supported the proposal to launch a small pilot program based on weather stations in the central region of the country – the main maize producing area of Malawi – with GoM contributing to the risk transfer cost. The key benefits of such a scheme were noted as follows: independence from donors; timely, objective, and predictable source of funds in times of extreme distress; and autonomy for GoM Treasury to allocate funds as they feel appropriate, not only for the purchase of maize but also for funding emergency relief programs in regions most seriously affected by the food shortage crisis - not necessarily in the same regions as the drought. However, drawbacks and issues to keep in mind included: the Malawi food security situation, including issues such as informal trade, must be properly understood and analyzed in order to construct an efficient weather insurance scheme; proper management of the SGR and cash reserves is a prerequisite for a program to be worthwhile; and spending plans must be outlined to ensure insurance payouts are used efficiently in the event of a drought-related food security emergency.
• Scenario 2: Weather Shock Safety Net. This is a weather-linked fund triggering timely payouts to District Assemblies (DAs) in the event of a well-defined drought in their district. Payouts would fund predefined DA projects (e.g. food for work programs, cash transfer schemes) to form an early disaster response by the DAs to drought. The fund could be insured against events where several DAs experience a drought in their district at the same time and therefore exhaust the fund. This scenario was well accepted by the breakout group who supported the action to launch a small pilot program involving 5-10 well-established DAs, with GoM and donors helping to initially capitalize the fund. The key benefits of such a scheme were noted as the availability of timely, objective, and predictable source of funds in times of extreme distress to launch early and efficient disaster response initiatives. However, the primary drawback highlighted by the breakout group was that most of the DAs in Malawi might not be fully prepared to develop good emergency contingency plans and properly manage these weather triggered block grants. Both scenarios will be further studied by GoM Treasury and Ministry of Economic Planning and Development and other key stakeholders in GoM to determine which if any should move into a pilot stage.
APPENDIX 1: ARTES RAINFALL DATA
To develop an initial weather risk profile for the SADC region, data was used for 1978-2000 from the African Rainfall and Temperature Evaluation System (ARTES) developed in collaboration between the DECRG, ENV, ARD, AFTR1 and AFTU1 units of the World Bank and the Climate Prediction Centre of NOAA. The ARTES system provides rainfall and temperature data for the African Continent based on the Gridded African Rainfall and Temperature Climatological Dataset supplied by NOAA. The base dataset is provided in a gridded, binary format covering the Africa domain. More precisely, the spatial domain runs from 20W-55E longitude and 40S-40N latitude. The resolution of all data is the same: 0.5 deg longitude by 0.5 deg latitude. This translates to an area of 56 km by 56 km at equator. A grid at higher latitudes is smaller than the grid at the equator, e.g. at 40 degree north, the size of the grid is approximately 43km by 56km. Daily data is available for the 1978-2000 time period.
This daily climatology covers the time period from 1978-2000 and includes data for daily total precipitation, daily minimum temperature, and daily maximum temperature. For the daily climatology provided, Global Telecommunications System (GTS) station data are strictly the only inputs used to create the gridded products. The GTS is a satellite network used mainly to ingest and relay meteorological data globally, and the GTS data over Africa is a subset of the global daily feed. Daily Africa GTS stations number between 700-900. Many times each day, automated and manual meteorological ground observing stations take measurements and upload this data to a GTS satellite in the vicinity. This data is then transmitted either to other satellites or to a regional ground-based collecting station. Once the data has been collected, any organization with a GTS receiving station may have access to the products. The frequency of data recording and uploading depends on the nature of the meteorological ground station. If automated, data is likely transmitted in 3-6 hour intervals, though stations not automated may report once daily. Precipitation readings used in this dataset are taken from the central NOAA receiving station and are given as a sum of the reports taken throughout the day. Quality control procedures are used for this input GTS data and are generally preformed when downloading the raw data from the global GTS line at the NOAA receiving station.
The gridding procedures described by Xie et al (1996) are applied to each day of input data throughout the 1977-2000 daily climatology. The creation of the daily gridded analysis consists of two major steps: to interpret the irregularly distributed gauge data onto grid points with equal intervals, and to convert these point values to an area mean for each grid box. The method used in this dataset is Shepard’s Spherical Interpolation Method (Shepard, 1968). By this method, datasets of estimated gridded precipitation, minimum temperature, and maximum temperature are obtained. The ARTES system then aggregates this gridded data into area-weighted averages for any selected country, administrative division, or river basin in Africa.

58
Given this gridding methodology, rainfall data from ARTES is expected to be different from the raw meteorological data taken directly from the weather stations, and thus should be treated with caution. For example, the correlation between inter-annual variations in seasonal rainfall totals for Malawi, as aggregated by ARTES and an average of the 13 Malawi Meteorological stations is 0.5 (significant at the 95% confidence level) from 1978-2000. Although this correlation coefficient is statistically significant, it indicates a weak positive relationship, even though the Malawi Meteorological Office reports its data to the GTS daily.
APPENDIX 2: SPATIAL VARIABILITY OF RAINFALL IN THE SADC REGION
To further corroborate the correlation results in Table 7, an Empirical Orthogonal Function (EOF) analysis was performed on raw gridded GTS data for the African region available from the Global Precipitation Climatology Center (GPCC), courtesy of the KNMI Climate Explorer, for October-April precipitation from 1986-2003. An EOF analysis is a technique used to identify patterns of simultaneous variation and identifies modes of variability that dominate historical data. In this case we can look at the results of an EOF analysis to get an idea of how rainfall patterns look over the SADC region and to see if there are specific spatial patterns that occur with regularity or dominate the historical data. Using the EOF technique to extract these dominant patterns from the historical data serves as a visual crosscheck of the correlation coefficients given in Table 7.
Before performing the analysis, the precipitation dataset was normalized by dividing data at each grid-point by the respective standard deviation. By normalizing the data rainfall, variations at different grid-points are given equal weighting in order to identify the spatial patterns, including regions where the magnitude of variability is naturally small, such as Namibia (Table 6). Maps of these dominant patterns therefore represent variations in rainfall in terms of standard deviations away from the long-term average rainfall at each grid-point. Further information on EOF analysis can be found in von Storch and Zwiers (1999).
The first two EOFs—the two most dominant patterns of rainfall over the SADC region—together describe 45% of the total variability of seasonal rainfall observed in the Southern African region from 1986-2003. The first EOF pattern (Figure 18) describes 23% of the total variability of seasonal rainfall observed in the historical data: it indicates that 23% of the time rainfall anomalies during the October-April rainy season were of the same sign over vast swathes of Southern Africa, with the exception of coastal regions in the East and North-West. The second EOF pattern (Figure 19) describes a further 22% of the total variability of seasonal rainfall observed in the historical data and exhibits a North/South pattern in rainfall: it indicates that 22% of the time countries in the southern part of SADC experienced rainfall anomalies of the opposite sign to SADC countries in the north. These two patterns agree with the correlation coefficients given in Table 7, which suggest a degree of spatial co-variability in seasonal rainfall between the northern and eastern regions and between the southern and western zones. However, although there is some diversification between these two regions. Figures 18 and 19 also show the

59
potential for covariant risk, i.e. rainfall anomalies with the same sign, within large-scale zones of the SADC domain. In the context of drought, then, wide-scale drought affecting several SADC countries is a situation that needs to be considered in any drought risk management strategy.
Figure 18: EOF1 October-April Normalized GPCC Rainfall, 1986-2003
Source: KNMI Climate Explorer. http://climexp.knmi.nl. Reprinted with permission.
Figure 19: EOF2 October-April Normalized GPCC Rainfall, 1986-2003
Source: KNMI Climate Explorer. http://climexp.knmi.nl. Reprinted with permission.

60
APPENDIX 3: RAINFALL INSURANCE – PILOT PROJECT IN ANDHRA PRADESH, INDIA, FOLLOW-UP PROJECTS 2004
ICICI Lombard has designed rainfall insurance policies with support from the World Bank, Commodity Risk Management Group.44 A pilot project was carried out in the Mahabubnagar district of Andhra Pradesh through the Krishna Bhima Samruddhi (KBS) Local Area Bank. KBS has been promoted by BASIX and operates in the district of Mahabubnagar in Andhra Pradesh and Raichur and Gulbarga in Karnataka. BASIX is a rural livelihood promotion institution working through an NBFC Bhartiya Samruddhi Finance Limited and an NGO, Indian Grameen Services. The pilot scheme was launched in June 2003 for the kharif season 2003-2004 in Mahabubnagar district. KBS sold policies to 154 groundnut farmers and 76 castor farmers. The policy is limited to crop loans given by KBS to these farmers. All the farmers are members of the Borewell Users Association. (BUA). The BUA had been established as a part of an AP Government project, which provides for 85% of the cost of community bore-wells for irrigation of lands belonging to multiple households from the village. The BUA has been taking loans from KBS on behalf of its members. It had obtained a loan of Rs.4.5 lakhs in 1999 and has grown to borrow Rs.13 lakhs during 2003-2004. It has maintained a 100% repayment rate. Government crop insurance was not required since the loans had been made to the BUA and not to individual farmers.
The insurance policy makes payments if the cumulative rainfall during the season falls below the historical average. This is implemented through a rainfall index. CRMG (World Bank) and ICICI Lombard carried out a technical feasibility study to establish correlation between rainfall and yield of specific crops in Andhra Pradesh. The daily rainfall data for the past 30 years was obtained from the Mahabubnagar district collector. In designing the rainfall insurance product the key task is to develop the appropriate index. The rainfall insurance is then a put option on this index with a strike price and premium amount. Unlike a simple put option, the payoff pattern of rainfall insurance need not be linear in the value of the index.
The main steps in designing the insurance contract are:
1. Identification of the farmer exposure: risk, area - collection of rainfall and production data.
2. Quantification of the exposure – what monetary value is associated with the physical exposure?
3. Structuring of the contract: Selecting the appropriate rainfall period. This is determined primarily by climate and plant physiology. One important consideration is that the last date for purchasing insurance should precede the commencement of the rainfall period by a sufficient number of days. Constructing crop and region specific rainfall indices by assigning weights to different rainfall periods in order to maximize the correlation between yields and rainfall. Agronomic information is used to determine the critical rainfall periods. Moreover, excess rainfall, may not contribute to yields, and during some periods, such as harvesting, even reduce yields.
44 This account draws heavily on a report written by D Sattaiah, Head of Insurance unit at BASIX, India.

61
4. Execution of the contract: regulatory and tax issues play a role here.
The weights used for constructing the groundnut index are given in the Appendix. The significant feature is the double weights assigned to the 10-29 June period, 0 weight to the 30 June-9 July period, and 40% weight assigned to the 9August - 7 September period. These are related to the relative importance of rainfall during the various periods. Farmers receive a payment if the level of the index falls below the predetermined threshold (the strike price of the option). The payment schemes for groundnut is given in the Table 14 below
Table 14: Groundnut farmer package, claim slabs, and rate of compensation
Payment per percentage point for incremental shortfall as a percent of the normal rainfall index (=635)
Size of landholding First 5% 5-25% 25-65% 65-100%
Maximum possible claim
with 100% shortfall
> 5 acres Premium Rs 900
0 Rs 30 Rs 175 Rs 650 Rs 30,000
2.5-5 acres Premium Rs 600
0 Rs 25 Rs 100 Rs 500 Rs 20,000
< 2.5 acres Premium Rs 450
0 Rs 20 Rs 75 Rs 310 Rs 14,000
Source : Authors
Mahabubnagar district received the best rainfall in the past five years. However, the monsoon was delayed, leading to delayed sowing and in turn affecting the yield of groundnut. Given the weights assigned to different time periods, the delayed monsoon resulted in a decline in the index. The groundnut Actual Rainfall Index was 516 mm. This is a shortfall of 21 percentile from 653mm of NRI resulting payments to the farmers.
Table 15: Indemnity payments Details of Landholding
No. of farmers
Claim per farmer Total claim
Premium per farmer
Break-even deficiency %
Total premium
Below 2.5 acres
140 16*20=320 44,800 450 26% 63,000
Between 2.5 and 5 acres
13 16*30=480 6,240 600 25% 7,800
Above 5 acres 1 16*30=480 480 900 900 Total 51,520 71,700
Source: Authors
Farmer’s feedback on the product45: While the farmers were most impressed by the objective nature of the insurance claim settlement and the prompt payment by the insurance company, they perceived a number of problems with the product:
45 Based on a meeting with farmer customers of the rainfall insurance pilot in village Pamireddi Pally, Mandal: Atmakoor, District: Mahaboobnagar on January 29, 2004 documented by D Sattaiah AVP, BASIX.
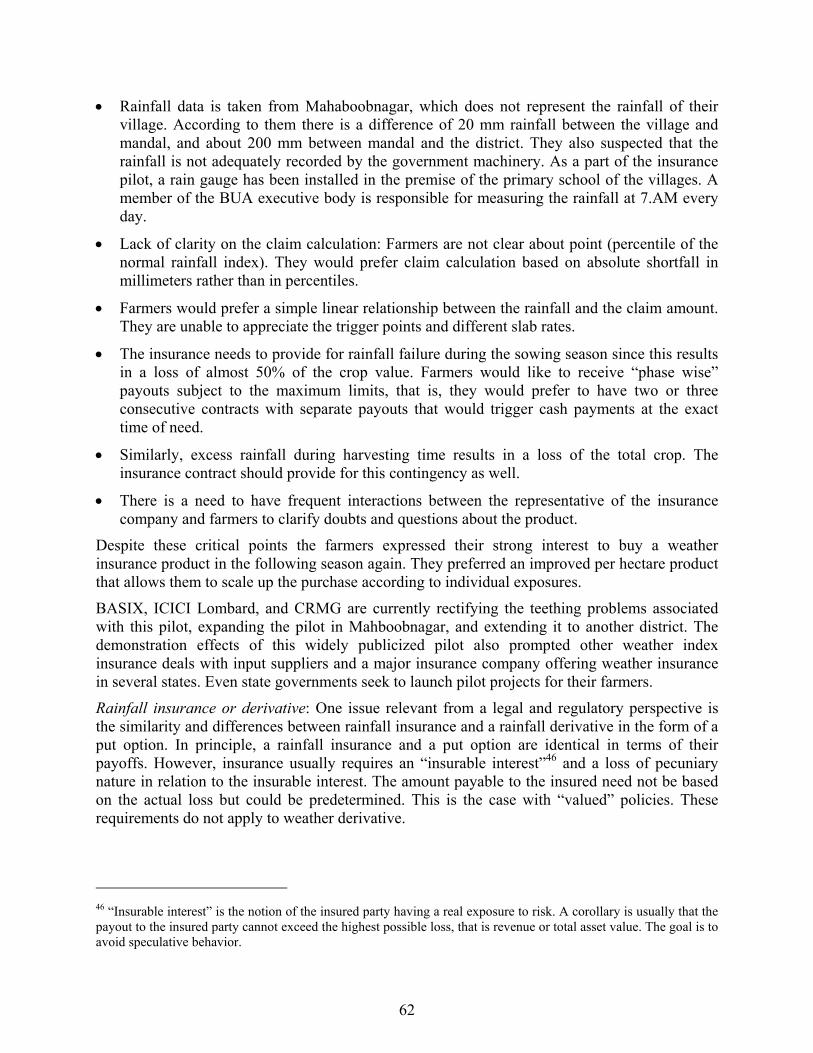
62
• Rainfall data is taken from Mahaboobnagar, which does not represent the rainfall of their village. According to them there is a difference of 20 mm rainfall between the village and mandal, and about 200 mm between mandal and the district. They also suspected that the rainfall is not adequately recorded by the government machinery. As a part of the insurance pilot, a rain gauge has been installed in the premise of the primary school of the villages. A member of the BUA executive body is responsible for measuring the rainfall at 7.AM every day.
• Lack of clarity on the claim calculation: Farmers are not clear about point (percentile of the normal rainfall index). They would prefer claim calculation based on absolute shortfall in millimeters rather than in percentiles.
• Farmers would prefer a simple linear relationship between the rainfall and the claim amount. They are unable to appreciate the trigger points and different slab rates.
• The insurance needs to provide for rainfall failure during the sowing season since this results in a loss of almost 50% of the crop value. Farmers would like to receive “phase wise” payouts subject to the maximum limits, that is, they would prefer to have two or three consecutive contracts with separate payouts that would trigger cash payments at the exact time of need.
• Similarly, excess rainfall during harvesting time results in a loss of the total crop. The insurance contract should provide for this contingency as well.
• There is a need to have frequent interactions between the representative of the insurance company and farmers to clarify doubts and questions about the product.
Despite these critical points the farmers expressed their strong interest to buy a weather insurance product in the following season again. They preferred an improved per hectare product that allows them to scale up the purchase according to individual exposures.
BASIX, ICICI Lombard, and CRMG are currently rectifying the teething problems associated with this pilot, expanding the pilot in Mahboobnagar, and extending it to another district. The demonstration effects of this widely publicized pilot also prompted other weather index insurance deals with input suppliers and a major insurance company offering weather insurance in several states. Even state governments seek to launch pilot projects for their farmers.
Rainfall insurance or derivative: One issue relevant from a legal and regulatory perspective is the similarity and differences between rainfall insurance and a rainfall derivative in the form of a put option. In principle, a rainfall insurance and a put option are identical in terms of their payoffs. However, insurance usually requires an “insurable interest”46 and a loss of pecuniary nature in relation to the insurable interest. The amount payable to the insured need not be based on the actual loss but could be predetermined. This is the case with “valued” policies. These requirements do not apply to weather derivative.
46 “Insurable interest” is the notion of the insured party having a real exposure to risk. A corollary is usually that the payout to the insured party cannot exceed the highest possible loss, that is revenue or total asset value. The goal is to avoid speculative behavior.

63
The groundnut rainfall contract for Mahbubnagar is clearly associated with an insurable loss. This has been achieved through the weights used in the construction of the rainfall index and the relationship between the payoffs and the level of the index. The weights have been chosen to maximize the correlation between the rainfall index and groundnut yield in the region. The payoff pattern is supposed to capture the increasing severity of losses with progressive rainfall efficiency. These features tend to increase the complexity of the product and harden for the farmers to understand. However, if the weights were removed and the payoff made linear, the product would become closer to a derivative.
Follow-up projects in 2004: 18,000 farmers insured against weather shocks: In 2004, 3678 orange farmers bought weather insurance in a Government of Rajasthan 50%-subsidized project in Jhalawar District in conjunction with ICICI Lombard. The Government of Rajasthan is keen to scale up the weather insurance pilot with a Rabi crop project this winter and potentially extending the scheme to 14 crops for next Kharif. However, GoR stressed that a scale-up will only be successful if insurance contracts are written on tesil weather stations, i.e. stations local to the farmers. This year the weather insurance was written on the Jhalawar District IMD weather station.
Approximately 18,000 farmers in total have bought weather insurance in over 20 districts of India through three insurance companies (AIC, IFFCO-Tokio and ICICI Lombard) in 2004. Generally, farmers were happy with the insurance; in particular, they appreciated they transparent nature of products and the claims. However, it is clear that farmers need weather insurance to be written on rain gauges local to their fields. To date, only ICICI Lombard is doing this (only in A.P.) in response to comments received from farmers involved in last year’s project. In total, 600 of these groundnut and castor policies were sold in A.P. this year, more than twice as many as during last year's pilot. However, given the quality of these local rain gauges, it is not clear how long a commercial company can continue underwriting such risk - the rain gauges can be easily tampered with and do not always report on a daily basis; furthermore, they cannot be used for reinsurance. Strengthening the rainfall observing and reporting network in India will be essential for the future growth of this market and the success of this new type of insurance for farmers, SHGs, and CIGs. ITC are beginning to consider the possibility of installing GMS-enabled weather stations on their e-coupal kiosks. Cell-phone towers and electricity boards have also been suggested as locations for potential new weather stations.
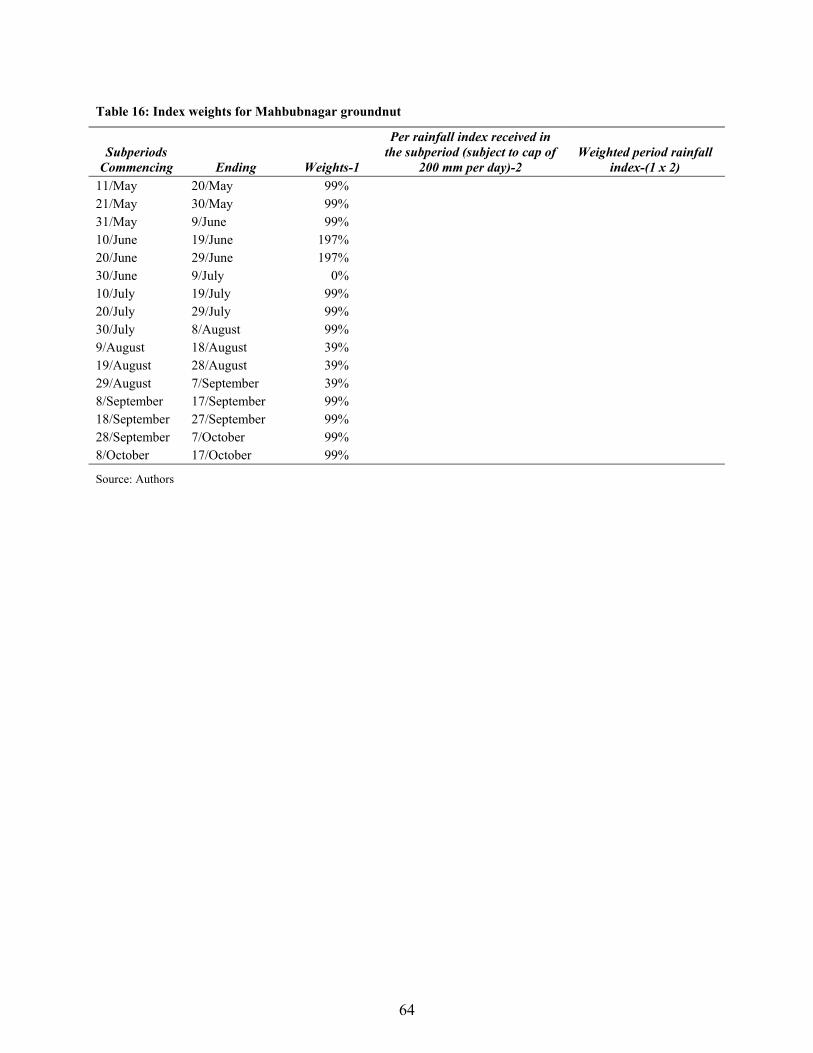
64
Table 16: Index weights for Mahbubnagar groundnut
Subperiods Commencing Ending Weights-1
Per rainfall index received in the subperiod (subject to cap of
200 mm per day)-2 Weighted period rainfall
index-(1 x 2) 11/May 20/May 99% 21/May 30/May 99% 31/May 9/June 99% 10/June 19/June 197% 20/June 29/June 197% 30/June 9/July 0% 10/July 19/July 99% 20/July 29/July 99% 30/July 8/August 99% 9/August 18/August 39% 19/August 28/August 39% 29/August 7/September 39% 8/September 17/September 99% 18/September 27/September 99% 28/September 7/October 99% 8/October 17/October 99%
Source: Authors
NORTHERN
C E N T R A L
S O U T H E R N
ChilekaChileka
ChitedzeChitedze
SapitwaSapitwa(3,002 m)(3,002 m)
NykiaNykia(2,606 m)(2,606 m)
VViipp
hhyyaa
MMttnn
ss..
RUMPHIRUMPHI
SALIMASALIMAMCHINJIMCHINJI
L ILONGWELILONGWE DEDZADEDZA
MWMWANZAANZA
MULANJEMULANJE
MACHINGAMACHINGA
DOWDOWAA
BLANTYREBLANTYRE
ZOMBAZOMBA
M A N G O C H IM A N G O C H I
THYOLOTHYOLO
NTCHISINTCHISI
K A S U N G UK A S U N G U
MZIMBAMZIMBA
CHIRADZULUCHIRADZULU
CHITIPCHITIPAAKARONGAKARONGA
NKHANKHATTAABABAYY
NKHOTNKHOTAKOTAKOTAA
NTCHEUNTCHEU
CHIKWCHIKWAAWWAA
NSANJENSANJE
ChitipaChitipa
RumphiRumphi
MchinjiMchinjiSalimaSalima
DedzaDedza
NtcheuNtcheu
MangochiMangochi
MachingaMachinga
ZombaZomba
ChikwawaChikwawa
ThyoloThyoloMulanjeMulanje
MwanzaMwanza
DowaDowa
KasunguKasungu
MzimbaMzimba
ChiradzuluChiradzulu
NtchisiNtchisi
LirangweLirangwe
NN’’gabugabu
BalakaBalaka
NkhungaNkhunga
LuwawaLuwawa
ChintecheChinteche
ChisengaChisenga
KatumbeKatumbe
ChelindaChelinda
KafukuleKafukule
EuthiniEuthini
KalulumaKaluluma
NamiteteNamitete
BlantyreBlantyre
MzuzuMzuzu
LILONGWELILONGWE
BBuuaa
SShhiirree
PHALOMBEPHALOMBE
PhalombePhalombe
KarongaKaronga
NkhataNkhataBayBay
NkhotakotaNkhotakota
LilongweLilongweIntl AirportIntl Airport
Z A M B I A
M O Z A M B I Q U E
M O Z A M B I Q U E
TANZANIA
Nsanje
RUMPHI
SALIMAMCHINJI
L ILONGWE DEDZA
MWANZA
MULANJE
PHALOMBE
MACHINGA
DOWA
BLANTYRE
ZOMBA
M A N G O C H I
THYOLO
NTCHISI
K A S U N G U
MZIMBA
CHIRADZULU
CHITIPAKARONGA
NKHATABAY
NKHOTAKOTA
NTCHEU
CHIKWAWA
NSANJE
Rumphi
Mchinji
Ntcheu
Machinga
Zomba
Chikwawa
Nsanje
Mulanje
PhalombeMwanza
Dowa
Kasungu
Chiradzulu
Ntchisi
Lirangwe
N’gabu
Balaka
MonkeyBay
Makanjila
Nkhunga
Luwawa
Chinteche
Chilumba
Chisenga
Ruarwe
Mkondowe
LivingstoniaKatumbe
Chelinda
Kafukule
Euthini
Kaluluma
Namitete
Blantyre
LILONGWE
Z A M B I A
M O Z A M B I Q U E
(MALAWI)
M O Z A M B I Q U E
TANZANIA
Bua
Shire
Songwe
LakeChilwa
LakeM
alawi
To Muyombe
To Muyombe
To Lundazi
To Chipata
To Furancungo
To Ulongwe
To Tete
To Morire
To Liciro
To Vila de Sena
To Cuamba
To Cuamba
To Mbeya
To Tunduma
Vip
hya
Mtn
s.
Sapitwa(3,002 m)
Nykia(2,606 m)
36°E
34°E 36°E
32°E
32°E
10°S
12°S
14°S
12°S
14°S
16°S 16°S
10°S
Chileka
Chitedze
Chitipa
Karonga
Salima
DedzaMangochi
Thyolo
NkhataBay
Nkhotakota
Mzimba
Mzuzu
LilongweIntl Airport
MALAWI
This map was produced by the Map Design Unit of The World Bank. The boundaries, colors, denominations and any other informationshown on this map do not imply, on the part of The World BankGroup, any judgment on the legal status of any territory, or anyendorsement or acceptance of such boundaries.
0 20 6040 80
0 20 40 60 Miles
100 Kilometers
IBRD 33866
MARCH 2005
MALAWIMETEORLOGICAL OFFICE WEATHER
STATIONS
METEOROLOGICAL OFFICEWEATHER STATION
SELECTED CITIES AND TOWNS
DISTRICT CAPITALS
REGION CAPITALS
NATIONAL CAPITAL
RIVERS
MAIN ROADS
RAILROADS
DISTRICT BOUNDARIES
REGION BOUNDARIES
INTERNATIONALBOUNDARIES

66
REFERENCES AMAP MicroFinance Chemonics Consortium, USAID contracted. 2004. Microfinance Assessment in the Republic
of Malawi.
Benson, C.; Ed Clay. 2004. Understanding the economic and financial impacts of natural disasters. The World Bank, Disaster Risk Management Series. Washington, D.C.
Christiansen R.E., Kydd J.G. 1985, 1986. The political economy of agricultural policy formulation in Malawi, 1960-1984.: The World Bank, Washington D.C..
Clay E., Bohn L., Blanco de Armas E., Kabambe S., and Tchale H. March 2003. Malawi and Southern Africa: Climate Variability and Economic Performance. World Bank Disaster Risk Management Working Paper Series No. 7, Paper No. 25902. Washingto, D.C.
Dercon S. “Insurance against poverty: an end to risk-induced poverty traps in Ethiopia?”Presentation at the launch o f the book “Insurance against Poverty,” Research funded by World Institute of Development Economics Research. Study forthcoming Oxford University Press, Spring 2004.
Dercon S., Krishnan P. 2003. “Food aid and informal insurance”, WIDER Discussion Paper No.2003/09.
Deutscher Wetterdienst. [no date]. “Global Precipitation Climatology Centre” on the The Climate Information System of the DWD (KLIS) Web site (http://www.dwd.de/en), last accessed on April 26, 2005.
Devereux S. 2002. “The Malawi Famine of 2002, causes, consequences & policy lessons.”
FAO. 2004. “Establishment of Regional Food Security Reserve Systems in Africa.”
Hayes, M.J. “Drought Indices.” National Drought Mitigation Center Web site. http://www.drought.unl.edu/whatis/indices.htm
Henderson R. 2002.“Pricing Weather Risk.” In E Banks, ed., Weather Risk Management.
Hess U. 2004. “Innovative financial services for India, monsoon indexed lending and insurance for Smallholders.” ARD Working Paper 9. World Bank, Agrigulture and Rural Development Department, Washington, D.C.
Hess, U., Richter, K., Stoppa, A. “Weather Risk Management for Agriculture and Agribusiness in developing countries.” In Robert S. Dischel, ed., Climate Risk and the Weather Market, Financial Risk Management with Weather Hedges.
International Food Policy Research Institute. Kherallah M. et al. 2002. “Reforming agricultural markets in Africa.” John Hopkins University Press. Washington D.C.
International Food Policy Research Institute. October 2000. “The Road half-traveled: agricultural market reform in Sub-Saharan Africa”. Washington D.C.:
Jackson, P., Maude, D. J. and Perraudin W. “Bank Capital and Vale at Risk.” Journal of Derivatives 4, 3 (Spring 1997).
Lele U., Christiansen R.E. 1989. “Markets, marketing boards, and cooperatives in Africa: issues in adjustment policy”. World Bank,Washington D.C.
Lele U., Christiansen R. E., Kadiresan K. 1989. “Fertilizer policy in Africa: lessons from development programs and adjustment lending, 1970-1987”. World Bank,Washington D.C.
Malawi Emergency Food Security Assessment Report, February 2003.
Malawi National Vulnerability Assessment Committee in collaboration with the SADC FANR
67
Vulnerability Assessment Committee. 2003. Malawi Emergency Food Security Assessment Report.
Malawi National Vulnerability Assessment Committee in collaboration with the SADC FANR Vulnerability Assessment Committee. 2002. Study on Insurance against covariate shocks: role of food aid & social protection in Africa. Malawi Emergency Food Security Assessment Report.
Nash, John. “Food security and agricultural trade policy reform”, presentation at SATRN researchers workshop, April 19, 2004.
Ogallo, L. A., 1994. “Validity of the ENSO-Related Impacts in Eastern and Southern Africa” In M.Glantz, ed., Usable Science: Food Security, Early Warning, and El Niño. Proceedings of the Workshop on ENSO/FEWS, Budapest, Hungary, October 1993. UNEP, Nairobi; and NCAR, Boulder, Colorado.
Paternostro, S., Razafindravonona, J., and Stifel, D. 2001 “Changes in poverty in Madagascar: 1993 -1999” Africa Region Working Paper Series no. 19. World Bank,Africa Region Department,Washington D.C.
Ropelewski, C. F. and M.S. Halpert. 1987. “Global and regional scale precipitation patterns associated with the El Niño–Southern Oscillation.” Monthly Weather Review 115:1606–1626.
Shepard, D. “A two dimensional interpolation function for regularly spaced data” National Conference of the Association for Computing Machinery held in Princeton, N.J., 1968.
Skees, J. “Risk management challenges in rural financial markets: blending risk management innovations with rural insurance”, prepared for presentation at: Paving the way forward for rural finance: an international conference on best practices June 2-4, 2003, World Bank,Washington D.C.
Skees J., Hazell P., Miranda M. Forthcoming 2005. New Approaches to Public/Private Crop YieldInsurance study. Washington D.C.: World Bank
Smith J. W., Subbarao K. January 16, 2003. “What role for safety net transfers in very low income countries?” Social Protection Discussion Paper Series no. 0301. World Bank, WashingtonD.C.
van Oldenborgh, Geert Jan. “KNMI Climate Explorer.” http://climexp.knmi.nl/
von Storch H., Zwiers F.W. 1999. Statistical analysis in climate research. UK.: CambridgeUniversity Press. CambridgeK.
Valdes, Foster. 2004. “Agriculture and the WTO: creating a trading system for development” Eds., Ingco M.D., Nash J.D. Copublication of World Bank and Oxford University Press,
World Bank – World Food Programme. 2004. “Famine Risk Insurance.” Draft Concept Paper,World Bank, Washington, D.C.
World Bank. 2004. “Exogenous shocks in low income countries: policy issues and the role of the World Bank.” Technical Briefing to the Board, World Bank, Washington, DC.
Xie P., Rudolf B., Schneider U and Arkin P.A. 1996. “Gauge-based monthly analysis of global land precipitation from 1971-1994” 1996. Journal of Geophysical Research, 101(D14), 19023-19034.

Related Documents