Policy Research Working Paper 6214 Weather and Child Health in Rural Nigeria Mariano Rabassa Emmanuel Skoufias Hanan G. Jacoby e World Bank Poverty Reduction and Economic Management Network Poverty Reduction and Equity Unit October 2012 WPS6214 Public Disclosure Authorized Public Disclosure Authorized Public Disclosure Authorized Public Disclosure Authorized

Welcome message from author
This document is posted to help you gain knowledge. Please leave a comment to let me know what you think about it! Share it to your friends and learn new things together.
Transcript

Policy Research Working Paper 6214
Weather and Child Health in Rural NigeriaMariano Rabassa
Emmanuel SkoufiasHanan G. Jacoby
The World BankPoverty Reduction and Economic Management NetworkPoverty Reduction and Equity UnitOctober 2012
WPS6214P
ublic
Dis
clos
ure
Aut
horiz
edP
ublic
Dis
clos
ure
Aut
horiz
edP
ublic
Dis
clos
ure
Aut
horiz
edP
ublic
Dis
clos
ure
Aut
horiz
ed
Produced by the Research Support Team
Abstract
The Policy Research Working Paper Series disseminates the findings of work in progress to encourage the exchange of ideas about development issues. An objective of the series is to get the findings out quickly, even if the presentations are less than fully polished. The papers carry the names of the authors and should be cited accordingly. The findings, interpretations, and conclusions expressed in this paper are entirely those of the authors. They do not necessarily represent the views of the International Bank for Reconstruction and Development/World Bank and its affiliated organizations, or those of the Executive Directors of the World Bank or the governments they represent.
Policy Research Working Paper 6214
The effect of weather shocks on children’s anthropometrics is investigated using the two most recent rounds of the Nigeria Demographic and Health Survey. For this purpose, climate data for each survey cluster are interpolated using daily weather-station records from the national network. The findings reveal that rainfall shocks have a statistically significant and robust impact on child health in the short run for both weight-for-height and height-for-age, and the incidence of diarrhea. The impacts of weather shocks on health are of considerable
This paper is a product of the Poverty Reduction and Equity Unit, Poverty Reduction and Economic Management Network. It is part of a larger effort by the World Bank to provide open access to its research and make a contribution to development policy discussions around the world. Policy Research Working Papers are also posted on the Web at http://econ.worldbank.org. The author may be contacted at [email protected].
magnitude; however, children seem to catch up with their cohort rapidly after experiencing a shock. The paper does not find any evidence of nonlinear impacts of weather variability on children’s health, suggesting that a moderate increase in future rainfall variability is not likely to bring additional health costs. Finally, it appears that the impact of these shocks is the same for young boys and girls, which suggests that there is no gender-based discrimination in the allocation of resources within households.

Weather and Child Health in Rural Nigeria
Mariano Rabassa, Pontificia Universidad Catolica Argentina
Emmanuel Skoufias, The World Bank Hanan G. Jacoby, The World Bank
Corresponding author: Emmanuel Skoufias, The World Bank (Mail Stop: MC4-415), 1818 H Street NW, Washington DC 20433-USA. tel: (202)458-7539. fax: (202) 522-3134. e-mail: [email protected]. Acknowledgements: The authors are grateful to Andrew Dabalen and Patrick Hoang-Vu Eozenou for useful comments and to NIMET for making available the historic rainfall station data used in this study. The findings, interpretations, and conclusions in this paper are entirely those of the authors and they do not necessarily reflect the view of the World Bank.
2
1. Introduction
In rural areas dependent on agricultural production the level of rainfall and its variability are
critical for subsistence. This is especially true in West Africa where agriculture is mainly rain-fed. A
number of papers have already suggested the influence that geography and climate have on economic
development (Bloom and Sachs, 1998; Masters and Sachs, 2001). Besides the common argument of
inadequate institutional development as an explanation for the poor performance of Africa relative to
other developing regions, there is a growing agreement among scholars that other aspects of tropical
geography have strong influences on the continent’s economic performance. For instance, long-term
rainfall fluctuations correlate well with the economic cycles of many Sub-Saharan countries; and it has
been shown that the economic slowdown that started in the late 1970s -and lasted for more than two
decades- is partially explained by the rainfall deficiencies that the continent experienced relative to
other parts of the globe (Barrios et al., 2010).
The effect that climate has on macroeconomic performance has its roots in the impact that
climate and weather exert at the micro-level. For this reason, and in order to better understand the
pathways by which climate affects well-being, it seems appropriate to look for the impacts of climate
change at the finer possible resolution, i.e. the household. In this regard, there exists a vast literature on
how income shocks affect household consumption, as well as on the risk-coping strategies employed by
households as a means for smoothing consumption over time. A relatively small fraction of this
literature looks at rainfall -mainly as an instrument for an income shock- to assess the effect that shocks
have on household consumption, labor outcomes, and children’s health and education (see Kochar,
1995, and Jacoby and Skoufias, 1997).
There are many reasons why the relationship between weather and health in developing
economies is of special interest. First, in tropical countries there is a much higher prevalence of
malnutrition and infectious diseases, caused in part by weather variability and extreme weather events.
Second, as described by Strauss and Thomas (1998), there is a close relationship between health and
labor outcomes. Theoretical models hypothesize that relative to poorly nourished workers those who
consume more calories are more productive, and that at very low levels of intake, better nutrition is
associated with increasingly higher productivity. In addition, the structure of employment in lower
income economies is such that work often relies more heavily on strength and endurance and,
therefore, on good health.

3
In this study we focus on the effects that rainfall variability and weather shocks have on young
children’s health, and more importantly on shedding light on the channels through which climate affects
health. We focus on health outcomes, and particularly on children’s health status, due to data
constraints. An alternative approach would consist in using income or consumption data. Unfortunately,
there is no nationally representative survey in Nigeria with such data that could be linked to climate
data at a fine geographical scale.1 To carry out such analysis one would be forced to rely on the rather
restrictive assumption that the same weather shock affects all households living in the same state. In
contrast to the NLSS, the Demographic and Health Surveys (DHS) provide information on infant and child
health status accompanied by geographic coordinates of the cluster in which they reside.
The link between weather shocks and child health has received little attention in the empirical
literature, although in recent years there have been substantial advances in our understanding of the
complex interrelationships involved. Most of the existing literature for developing countries has focused
on a rather extreme health outcome, child mortality (for example Rose, 1999; Wang, Kanji and
Bandyopadhyay, 2009; Pitt and Sigle, 1997; Burgess, Deschenes, Donaldson and Greenstone, 2010;
Baird, Friedman and Smitz, 2010; Bhalotra, 2010; and Kudamatsu, Persson and Stromberg, 2011).
However, little is known about the effect that weather variability has on those children that have
survived; which are the majority. Fewer papers have analyzed the impact of weather variability on child
morbidity (Wang, Kanji and Bandyopadhyay, 2009), or have used anthropometric measures as a proxy
for children’s health status (Hoddinott and Kinsey, 2001; Wang, Kanji and Bandyopadhyay 2009;
Bengtsson 2010; Portner 2010; and Skoufias and Vinha, 2012). We follow this last set of papers by using
two rounds of the Nigeria DHS to assess the effect of rainfall shocks on child anthropometrics.
Weather and Child Health in Africa
Not surprisingly, the existing literature suggests that weather variability has an impact on child
health. Three recent papers have used the Demographic and Health Surveys to analyze the effect of
weather fluctuations on child mortality rates in Africa. Wang et al. (2009) show that excess rainfall and
extreme temperature increase under-five child mortality rates in 19 Sub-Saharan countries, although the
magnitude of the reported impacts are rather small. Baird et al. (2010) find that excessive heat around
the month of birth is predictive of an increased likelihood of death, particularly for newborns. However,
the effect of rainfall is undetermined. While rainfall during the third trimester of pregnancy increases
1 The 2003 Nigeria Living Standard Survey (NLSS) -the last available consumption survey- does not provide the
precise location of the sampled households, or even the Local Government Area (district) in which they reside.
4
the likelihood of death for newborns, excess rainfall can also be protective in certain circumstances as a
result of positive income shocks. Finally, Kudamatsu et al. (2011), using data from 28 African countries,
show that infants who in utero experience worse malaria conditions than the site-specific seasonal
means (based on a weather-prone-to-malaria index) face a higher risk of death. In addition, infants born
in arid-climate regions of Africa who in utero experience droughts face a much higher risk of death than
other babies. The reported results are quantitatively important. For example, a six-month malaria
epidemic in a place with little average exposure to malaria can raise infant mortality by more than 3.5
points. Interestingly, they report that rainfall during the growing season before birth has a protective
effect on child health. They interpret this finding as the result of a positive income shock due to higher
agricultural production.
Rainfall and temperature also affect child morbidity. Hoddinott and Kinsey (2001) use panel data
for rural Zimbabwe to examine growth rates of young children after a major drought. They find that
children aged 12-24 months lose 1.5 to 2 centimeters of growth in the aftermath of a drought. Wang et
al. (2009) find that extreme precipitation and temperatures have significant impacts on the incidence of
diarrhea and weight-for-height malnutrition among children under the age of three. The reported
impacts are of considerable magnitude. They estimate the health costs of more frequent events by 2020
to be in the order of 0.2 to 0.5 percent of Sub-Saharan GDP.
Do Weather Shocks Have Long-run Impacts on Child Health?
Weather shocks in early life may also have long-term implications. For example, a shock during
infancy may affect a child’s health so severely as to have an impact on their long-run health status.
Alternatively, a weather shock which occurs in early childhood may also affect well-being during
adulthood, not directly through health, but indirectly through other outcomes that are related to health
status at any particular point in time; such as educational attainment.
In a recent paper, Maccini and Yang (2009) find that higher than normal precipitation during the
first year of life leads to improved health, schooling, and socio-economic status of Indonesian women.
Specifically, the authors claim that women that experienced above normal rains in their year and
location of birth are less likely to self-report a poor health status; they also attain greater height, have
more completed grades of schooling, and accumulate more wealth. The results reported by Maccini and
Yang suggest that neither the environmental conditions while in utero nor those after the first year of
age significantly affect long-term well-being; only those in the early stages of life seem to be critical in
the long-run.

5
Long-term consequences of shocks at early childhood have also been reported by van den Berg
et al. (2007). They show that children that were exposed to the Dutch potato famine of 1846 at the time
of birth had lower life expectancy at age 50 relative to similar children that were not affected by the
famine. In a similar approach, Dercon and Porter (2010) report that when compared to older cohorts,
children who were under 36 months of age by the time of the infamous 1984 Ethiopian famine, were
significantly shorter at adulthood, had lower educational achievement, and poorer health.
This literature relates to the existing epidemiologic literature on potential catch-up in child
growth for stunted children. It is well known that there exist biological potential for catch-up in response
to clinical interventions. However, the degree to which catch-up occurs in the absence of medical or
nutritional interventions is less well documented. For example, Adair (1999) finds that Filipino children 2
to 12 years-old that were stunted in early childhood exhibited substantial catch-up. In contrast, other
papers report limited potential for catch-up (Cameron et al., 2005; Martorell et al., 1994, Hoddinott and
Kinsey, 2001).
Are Girls Less Protected from the Effects of Weather Shocks?
In this study we also analyze the issue of gender bias. There exists a vast literature on gender
imbalances in developing countries which examines the differential allocation of resources that
households make between girls and boys, especially in times of economic hardship. The evidence is far
from conclusive, but it suggests that girls are disproportionately affected by income shocks relative to
boys. Part of this evidence is presented in Berhman (1988), Dreze and Sen (1989), and Berhman and
Deolalikar (1990), which document studies in developing countries pointing out that girls usually receive
less in terms of nutrients and medical care during lean times. The discrimination against girls not only
leads to a poorer health status but it may lead to larger mortality rates for girls relative to boys (Das
Gupta 1987; Rose 1999).
Taking into account the fact that infant boys in developed countries have greater mortality rates
and are also more susceptible to diseases than girls, the evidence that girls in developing countries have
lower health status suggests a strong link between household income and the allocation of resources
between girls and boys. In a recent paper Friedman and Schady (2009) provide further evidence on the
importance of the income channel by analyzing infant survival rates in Sub-Saharan countries. They find
that in times of economic distress the female infant mortality rate rises disproportionally more than that
for boys.

6
Not all the papers analyze the short-term effects of shocks on gender imbalances. As mentioned
above, Maccini and Yang (2009) find a strong relationship between rainfall at birth and adults’ health
and socio-economic outcomes for women but not for men. They relate this finding with the parents’
ability to provide nutrition, medical inputs, and generally more nurturing environment for infant girls in
times of distress. This finding is of particular relevance because it suggests that the impact of gender
bias in early life has a very long temporal reach, and continues to be felt decades later.
The Importance of Future Weather Variability
Climate change adds another dimension to the already complex relationship between weather
and health. Projected scenarios for future climate all agree that high rainfall and extreme drought will be
both more frequent. While such extreme events are expected to affect child health little is known about
the magnitude of their impact.
“Increase in rainfall variability leads to an increase in income variability. Rainfall deserves particular attention because it affects a whole community, decreasing the ability to use informal risk-sharing networks. With rainfall also affecting the disease environment, all the effects of weather shocks on health are likely to be harder felt in developing countries, where health endowment and infrastructure are low to begin with. Because of their physiology and because their immune systems are not yet fully developed, children are to be among the most affected by climate change (IPCC, 2007).”
The World Health Organization (2008) has identified four major health consequences of climate
change in rural settings of developing countries. First, the agricultural sector is extremely sensitive to
climate variability. Rising temperatures and more frequent droughts and floods can compromise food
security. Therefore, increases in malnutrition are expected to be especially severe in countries where
large populations depend on rain-fed subsistence farming. Second, more frequent extreme weather
events mean more potential deaths and injuries caused by storms and floods. In addition, flooding can
be followed by outbreaks of diseases, such as cholera, especially when water and sanitation services are
damaged or destroyed. Third, both scarcities of water and excess water due to more frequent and
torrential rainfall will increase the burden of diarrheal disease, which is spread through contaminated
food and water. Finally, changing temperatures and patterns of rainfall are expected to alter the
geographical distribution of insect vectors that spread infectious diseases.
Still, despite the growing interest in the health impacts of climate change, studies of the impact of
current rainfall variability and weather shocks on health are rare. One way in which our study
contributes to the debate is by first looking at how past rainfall variability has affected children’s health.
We then discuss a way in which future weather variability may be introduced in our analytical
framework, and later test it in the empirical implementation.

7
With these considerations in mind, in this study we analyze the effect of weather shocks on
children’s anthropometrics using the two most recent rounds of the Nigeria Demographic and Health
Survey (DHS). For this purpose we interpolate climate data for each DHS cluster using daily weather-
station records from the national network of about 30 stations. Specifically, we analyze the impact of
rainfall shocks on two anthropometric measures which capture two different dimensions of health
status. We first look at weight-for-height, which is a good metric for acute malnutrition and is
considered a proxy for short-run nutritional deficiency. In addition, we use height-for-age which better
captures chronic malnutrition. In the case of short-run impacts we also analyze the effect that
precipitation has on the incidence of child diarrhea. Diarrhea is a particularly important disease to study
in this context because of its sensitivity to climatic conditions. As in previous papers, we focus on shocks
that occur at the very beginning of life. We do not look at health status or any other outcome at
adulthood since our data covers only infants and young children.
One of the main objectives of the study is to assess empirically the channels through which
precipitation affects child nutritional status: the disease environment and the income effect. The
relative importance these two effects is useful for the design of future policy interventions. We also
analyze whether rainfall shocks have medium-run impacts on child health or whether they are short-
lived. We do this by looking at the effect of shocks during the last three completed rainy seasons
experienced since a child’s birth. We also test whether having easy access to health facilities helps
reduce (magnify) the negative (positive) impacts that weather shocks may exert on children health
outcomes. Regarding the gender bias discussion, we analyze the differential effect of shocks on girls and
boys. Finally, we try to quantify the influence that increased weather variability –a predicted
consequence of climate change- might have on child health.
The paper is structured as follows. In the next section we outline the conceptual framework that
will guide the econometric models. In section 3 we describe the data. We then explain the reduced-form
equations for weight-for-height and height-for-age in section 4, and present the results in section 5. The
last section summarizes the main findings and discusses their policy implications.

8
2. Conceptual Framework: Health Production Function and Climate
Variability
A Health Production Function Approach
Following the common practice in the literature we analyze children health status using the
“health production function” framework introduced in the economic literature by Grossman (1972). In
general terms, a health production function treats social, economic, and environmental factors as inputs
of a production system. The vector of inputs usually includes nutrient intake, household income,
consumption of public goods, education, and time devoted to health related procedures, the initial
individual endowments like genetic makeup, and community endowments such as the ambient
environment and sanitation systems.
In this study, we consider the health status of a child in a particular time period (Hit) to be a
function of the health endowment at the beginning of the period (Hit-1), the investment in child-care
inputs (Iit), and the exposure to the disease environment (Et).2 That is,
Note that the health status at any point in time is a stock variable that captures the whole
child’s health history through the lagged term Ht-1. In other words, the health endowment at the
beginning of the period (Ht-1) is determined by genetic characteristics (Hi0), and the ambient
environmental conditions in early life (i.e. the lagged Es). In this simple framework parents can affect
their children’s health only through investments.3
The investment in child health (Iit) depends on nutritional intakes which in turns depend on
household consumption (Cit), the time devoted to child care (Tit), community sanitation and other
relevant infrastructure (Ft), and also on the disease environment (Et) since the investment in health may
2 For the estimation of a health production function it is critical to have a measure of health status that captures
those aspects of health that are meaningful, and that can be measured with accuracy , i.e. those that are quantifiable. As we explain below, children anthropometric measures such as height-for-age or weight-for-length are good proxies for children’s health status. 3 Note that parents can also reduce the effect that the disease environment (E) has on their children by migrating
to more favorable areas, or areas with better infrastructure (F). This type of migration is, however, limited in the context of this study.

9
have to increase in response to adverse environmental conditions: for instance, the use of oral
rehydration therapy after diarrhea.
Understanding the Links between Weather Shocks and Child Health
Even though it has been well established that weather shocks have an important causal effect
on child health outcomes, the channels though which they operate are not well understood. We now
turn to a discussion of the interrelationship between weather variability and the arguments of the
health production function.
Exposure to disease
To begin with, one can argue with confidence that weather affects the disease environment (Et)
since many diseases are influenced by weather conditions or display strong seasonality. For instance,
excessive rainfall and flooding in developing countries are usually linked to higher incidence of water-
borne diseases such, typhoid fever, leptospirosis, and cholera (Confalonieri et al., 2007; WHO, 2002).4
Also, excess rainfall may indirectly lead to an increase in vector-borne diseases like malaria, dengue and
dengue hemorrhagic fever, yellow fever, onchocerciasis, and West Nile fever through the expansion in
the number and range of vector habitats.
For example, onchocerciasis –also known as river blindness- which is common along the main
Nigerian river valleys, affects millions of people causing chronic eye and skin disorders. This disease has
an enormous socioeconomic impact on rural communities (Wagbatsoma and Okojie, 2004). The vectors
have a strong seasonal component. They breed during the wet season and the peak biting density
occurs at the height of the rainy season, with more infective “parasites” at the beginning and end of
rains (Nwoke, Onwuliri and Ufomadu, 1992). Meningococcal meningitis, also one major disease in the
semi-arid sub-Saharan Africa, appears to be strongly linked to climatic and environmental factors,
particularly drought (Confalonieri et al., 2007). Changes in climate are thus likely to lengthen the
transmission seasons and to alter the geographic range of diseases.
4 Extreme precipitation has significant impact on child health in developed countries as well. For example, Rose et
al. (2000) report that in the United States, 20 to 40% of water-borne disease outbreaks can be related to extreme precipitation events.
10
Higher temperatures have also been linked to the expansion of vector-borne diseases. For
example, Oluleye and Akinbobola (2010) provide evidence that malaria incidence correlates with
periods of unusual high temperatures in southern Nigeria.5
Income effects
In developing countries credit constraints and other market imperfections prevent households
from smoothing their consumption over time, potentially making health more vulnerable to economic
downturns (Behrman and Deolalikar, 1988 and 1990). Investments in child care are a function of income
which, in rural settings with agricultural production, is affected by the realizations of weather shocks.
Caloric intake and dietary quality may deteriorate as a consequence, and the use of important health
services may fall (Miller and Urdinola, 2010). Young children are the ones that suffer disproportionately
from these shocks.
Given the seasonal nature of agricultural production, the effect from income to consumption is
likely to take place with some delay: higher rainfall during the current cropping season can increase
consumption only after harvesting. Nonetheless, higher than normal precipitation may also have a
contemporaneous positive effect on household consumption if more agricultural labor is demanded
during the cropping season, but this effect should be small in a country where rural wage labor markets
are not the norm.6
Is it possible to isolate the income effect of weather shocks from their effect through the disease
environment? In principle this is very difficult to do. However, we are able to make some useful
inferences about the relative strength of these two effects based on the timing of the rainfall shock in
relation to the agricultural cycle (rainy season) and the time the household was interviewed.
5 Also, sustained daily low minimum temperatures have been associated with high prevalence of respiratory tract
infections among young children in developing countries. However, given the nature of climate in Nigeria it is very unlikely that abnormal low temperatures could produce widespread respiratory problems. High temperatures also raise the levels of ozone and other pollutants in the air that exacerbate cardiovascular and respiratory disease among infants and young children, but it is usually less a concern in rural areas. 6 Rainfall variability might also affect child health by changing the opportunity cost of time for parents. Recent
research in developing countries documents that the opportunity cost of parental time might play an important role in the initial formation of child health. For example, Miller and Urdinola (2010) found that parents in rural Colombia cut back time-related health inputs when the cost of time is high, leading to higher infant and child mortality. In a recent study for West Africa, Yeon Soo Kim (2010) shows that positive rainfall shocks have a negative impact on child mortality. The explanation is also related to the opportunity cost of parental time: higher than normal rains increase the opportunity cost of time for agricultural labor, particularly for females who have a prominent role in subsistence agriculture. In turn, mothers respond by reducing the time they spend breastfeeding.

11
Consider, for example, a child observed (measured) during the current rainy season. Excess
rainfall during the current rainy season (contemporaneous rainfall shock) is likely to capture the disease
environment effect, Et., which, according to the above discussion, is likely to be negative. In this case,
the positive income effects of the contemporaneous rainfall shocks are not at work, because they can be
realized only later after the harvesting which has yet to take place.
In contrast, excess rainfall during the last rainy season is likely to capture the net effect of
rainfall on household income and the disease environment. Excess rainfall in the last rainy season may
have a negative impact on previous health through Et-1, which is then carried through to the current
period by Ht-1. Moreover, higher than normal rainfall during the last agricultural season may also have
resulted in a better harvest, increasing both current consumption (either by selling the produce or by
directly consuming it) and the current investment in child health, Iit.7 At the empirical level, the impact
of the excess rainfall in the last rainy season is the net effect of two opposite effects: the disease
environment effect (a negative effect) effect and the income effect (a positive effect).8 One might
expect, however, the income effect to dominate since any negative effect of rains on health during the
last agricultural season should -to some extent- weaken with the passage of time.
Thinking about Climate Change
Determining how weather variability in rural settings contributes to a child’s health status would
greatly contribute not only to a better understanding of the causes of child malnutrition, but to the
ongoing debate about the potential impacts of climate change.
Higher temperatures, changes in precipitation, and climate variability would alter the
geographical range and seasonality of transmission of many vector-borne diseases. Most likely, the
range and seasonality would be extended. According to the IPCC’s Fourth Assessment Report, climate
change induced alterations in precipitation will significantly affect the burden of water-borne diseases.9
7 Note that it is not necessary to be a food producer in order to rip the benefits of higher yields. Inasmuch as higher
yields translate into lower prices everyone, and not only households that cultivate land, should benefit from a better harvest. 8 In contrast, higher than normal temperature should always have a negative impact on child health through both a
disadvantage disease environment and a lower agricultural output, especially in the case of extreme heat (see Lobell et al. 2011). 9 In particular, the Report states with “high confidence” that climate change will: increase malnutrition and
consequent disorders, including those relating to child growth and development; increase the number of children suffering from death, disease and injury from heat waves, floods, storms, and droughts; change the range of some infectious disease vectors; and increase the burden of diarrhea disease. The Report also identifies children, traditional societies, and subsistence farmers among the most vulnerable groups (Confalonieri et al., 2007).

12
Figure 1
Figure 1 above shows how rainfall variability can be introduced into the framework outlined in
this section. The figure displays the relationship between a health outcome (H), say weight-for-height,
and the level of rainfall (R). Abstracting from risk aversion, the shape of this relationship describes how a
change in rainfall variability, holding the average rainfall constant, impacts on child health status.
Suppose that we start from a situation under which the current weather variability is given by and
with mean R. Given this variability the expected health outcome will be H0. Then, suppose that weather
variability increases, i.e. rainfall patterns become more erratic, while the average precipitation level
does not change. The concavity of the curve summarizing the relationship between weight-for-height
and the level of rainfall implies that the increased variability given by the extremes and
corresponds to a lower health outcome H1, on average.
Therefore, the concavity of the health outcome-rainfall relationship allows us to infer the
magnitude of the change in a health outcome due to a change in rainfall variability. Note that with a
linear relationship, a higher variance in weather will have no impact on the expected health outcome of
children. This simple approach to measuring the potential impact of future climate variability can be
incorporated into the empirical estimation simply by allowing quadratic effects of rainfall on child
health.10
10
Note that we are only referring to an increase in rainfall variability and not to more extreme changes in weather patterns such as those that would arise from nonlinear effects from crossing climatic thresholds. On other words, we are thinking of relatively small changes in weather patterns within a stable band of rainfall values.

13
3. Data and Descriptive Statistics
Demographic and Health Survey
The data on child health come from two rounds of the Demographic and Health Survey (DHS)
conducted in 2003 and 2008.11 The DHS are nationally representative household surveys with a large
sample size that contain detailed information on demographic characteristics, fertility, contraceptive
use, infant and child mortality, immunization levels, use of family planning, maternal and child health,
breastfeeding practices, and nutritional status of mother and young children.12
Nutritional status, especially in children, has been widely and successfully assessed by
anthropometric measures in both developing and developed countries (Mei and Grummer-Strawn,
2007). Thus, following the norm in the literature we proxy the health status of children with their
anthropometric measures and information on recent symptoms of illness, specifically diarrhea.13
Children height and weight are converted into standardized Z-scores (height-for-age and weight-for-
height), using the WHO Anthro program (WHO, 2006). For each child, depending on their sex and age,
the Z-score system expresses anthropometric values in terms of standard deviations below or above the
median of an international reference group.14 Height-for-age Z-score (HAZ) indicates chronic
malnutrition and is considered a good measure of long-term health. In contrast, weight varies in the
short run due to acute starvation or severe disease. Therefore, the weight-for-height Z-score (WHZ)
provides a more current indicator of health status.
The Nigeria DHS samples were selected using a stratified two-stage cluster design. The 2003 DHS
consist of 7,864 households in 365 clusters or villages -with 54% of them being rural villages. In contrast,
the 2008 DHS had a much larger sample size consisting of 36,800 household in 886 clusters (69% in rural
areas).15 We restrict the sample to those born outside of urban areas because our causal factor of
11
There have been some concerns about the quality of household surveys in Nigeria. However, we expect that a standardized survey like the DHS, which has been used in many countries (including two previous rounds in Nigeria), would have reasonable quality controls. 12
The DHS has been widely used to perform indirect estimation of population dynamics, such as fertility and mortality, in those places where there is no reliable census data. 13
According to the protocols used by the DHS, for children younger than 60 months of age, height is measures to the nearest 0.1 centimeter. While the standing height is measured for children 24 month or older, a measuring board is used to measure child’s length when children are younger than 24 month of age. Weight is measured to the nearest 0.1 kilogram. 14
An international reference is useful since growth in height and weight of well fed, healthy children under 5 years of age from different ethnic backgrounds and different continents is reasonably similar (WHO Multicentre Growth Reference Study Group, 2006). 15
The 2003 DHS used the 1991census frame while the 2008 DHS used the 2006 census frame. There is no available information regarding the definition of a rural area in the 2006 census frame. Some observers have suggested that

14
interest, rainfall, should mainly have an effect in agricultural areas. The locations of rural clusters from
each round are displayed in Figure 2. The surveys are based on interviews of women of childbearing age,
i.e. between 15 and 49 years old, who were either permanent residents of the household or visitors
present in the household on the night before the survey took place. We pool the two waves together to
create a sample of about 11,500 child-level records that includes birth dates, and detailed child health
characteristics.
Figure 2
We have decided to focus on the younger children (i.e. those between 0 to 35 months of age)
for several reasons. Firstly, young children are believed to be especially vulnerable to shocks that lead to
growth faltering. Secondly, body size at adulthood is strongly correlated with stature at age three, and
that after this age children from even very poor localities will grow as quickly as children in developed
economies. In turn, adult height is correlated with earnings and productivity, poorer cognitive
outcomes, and premature mortality due to increased risk of cardiovascular and obstructive lung disease
(Hoddinott and Kinsey, 2001). In addition, children experiencing slow height growth usually perform less
well in school, score poorly on test of cognitive function, have lower activity levels, and fail to acquire
skills at normal rates. Finally, the evidence suggests that the period since birth to age three is the most
critical period for the development of the immune system.
We removed biologically implausible values (most likely as the result of errors in measurement
or data entry) using the cut-offs recommended by the WHO. Thus, data were excluded if a child’s HAZ
was below -6 or above +6 (1,569 observations), or WHZ was below -5 or above +5 standard deviations
(1,321 observations). Our final sample has about 10,000 children age 0 to 35 months living in rural areas.
The summary statistics can be compared with the international reference group, which has an
expected mean Z-score of 0 for all normalized growth indices. In general, Z-scores 2 standard deviations
below the reference are associated with severe growth retardation in the case of HAZ, and acute
malnutrition for WHZ. The distributions of HAZ and WHZ for children below 36 months of age of both
rounds of the Nigeria DHS are displayed in Figure 3. The distribution of height-for-age Z-scores is highly
skewed to the left implying that growth retardation is very prevalent among young children of rural
areas. The average child is 1.5 standard deviations shorter than the international reference mean, with
the two frames might have used a different classification of EAs as rural or urban. However, our results are not qualitatively different if we only use the (larger) 2008 DHS.

15
almost 45% of children being stunted, i.e. their HAZ scores are under 2 standard deviations from the
WHO median.16 Boys are more likely to suffer from growth retardation than girls. Regional differences
are also significant. While more than half of the children in the northern part of the country are stunted;
only 34% of children suffer from acute growth retardation in the southern regions (see Table 2 for more
details).
Figure 3
Children also score below the international mean for WHZ, although the mode of the
distribution is closer to the international standard. Acute malnutrition affects 17% of children, with no
discernible difference between boys and girls. Differences in weight-for-height z-scores are also
observed between the northern, central, and southern regions of Nigeria (see left panel of Table 1).
While 11% of children are wasted in the relatively rich southern region, almost a quarter of them suffer
acute malnutrition in the north.
Tables 1 & 2
Climate and Weather Data
In the most recent DHS surveys the location of sampled communities is geo-referenced using
GPS technology.17 These data allows us to construct a precise history of climate for each DHS cluster. For
this purpose, we combine the geographic location of clusters with detailed weather data from a large
weather station network spanning from the mid-1980s to 2008, the year of the last DHS. The location of
the weather station network is displayed in Figure 4. The geographic coverage of the network is fairly
good except for the central east and western part of the country.
Figure 4
16
To have a sense of the magnitude of these figures, for a three years old child a 1 standard deviation would be equal to approximately 3.75 centimeters difference in height. 17
In order to maintain confidentiality of respondents, the DHS randomly displaces the GPS coordinates of each cluster. Rural clusters contain a minimum of 0 and a maximum of 5 kilometers of positional error (ICF Macro, 2011). Thus, even if the same clusters are sampled in two different rounds it would be impossible to identify them because they would have different geo-coordinates.

16
Rainfall is the most important dimension of weather variation in Nigeria. Because of its tropical
location, temperature shows very little variation in Nigeria, either within years or across them. As noted
by Nieuwolt (cited in Odekunle, 2004) temperatures are not a critical factor in tropical agriculture.
Therefore, in this study we concentrate on the effects of precipitation shocks.
Perhaps one of the key aspects of this study is to give proper weight to spatial considerations.
Although many studies have linked health outcomes with climate, the use of insufficiently matched
climate and disease data can lead to biased results. Thus, we carefully interpolate climate and weather
data from the network of stations to the precise location of each DHS clusters. Relatively few studies
have matched climate variables to outcomes at fine resolution. The usual practice in the economic
literature is to match each locality –a cluster or the geographic center of an administrative unit– to the
geographically closest weather station (for example Yang and Choi 2007, Maccini and Yang 2009). While
simple, this interpolation method may yield poor results if missing records are prevalent in the weather
data, stations have been affected by site relocation, or considerable differences exist in terms of
topographic characteristics –for example altitude- between the location of the cluster and the location
of the closest station. The replacement of missing data with data from the second closest weather
station will introduce artificial variation in weather, whereas the differences in topography will
introduce a bias for the interpolated values.
Another alternative is to predict climate using statistical methods, similar to those used in
climate modeling (for an application in the economic literature see Nordhaus et al, 1994). This approach
requires estimating climate (or weather) based on a station’s observable characteristics –latitude,
longitude, altitude, distance to the sea, etc.– and then using the regression coefficients to predict the
corresponding values to each DHS clusters. We have opted for this approach because it better fits the
observed climate at the weather station site.18 The construction of the relevant weather variables is
described in the Appendix.
In order to assess the effect of rainfall shocks on children’s health we examine the deviations
with respect to the normal rainfall during the growing season. The growing season is usually defined as
the period of the year during which rainfall distribution characteristics are suitable for crop germination,
establishment, and full development. Such period would not exhibit significant variation from year to
18
Alternatively, one might use climate and weather data from General Circulation Models (GCM). These global climate models use much more complex methods to interpolate observed climate at weather stations into spatial grids, which in turn can be used to interpolate climate at the sampled cluster. While CGM might capture better complex atmospherically process their primarily objective is not to represent weather conditions at a fine spatial resolution. Therefore, the coarse spatial nature of these models would generate much less spatial variability in our main variables of interest.
17
year. However, the empirical identification of the length of the growing season is in itself challenging
because rainfall in Nigeria has considerable spatial variability; from a tropical climate in the south to a
semi-arid climate of the Sahel.
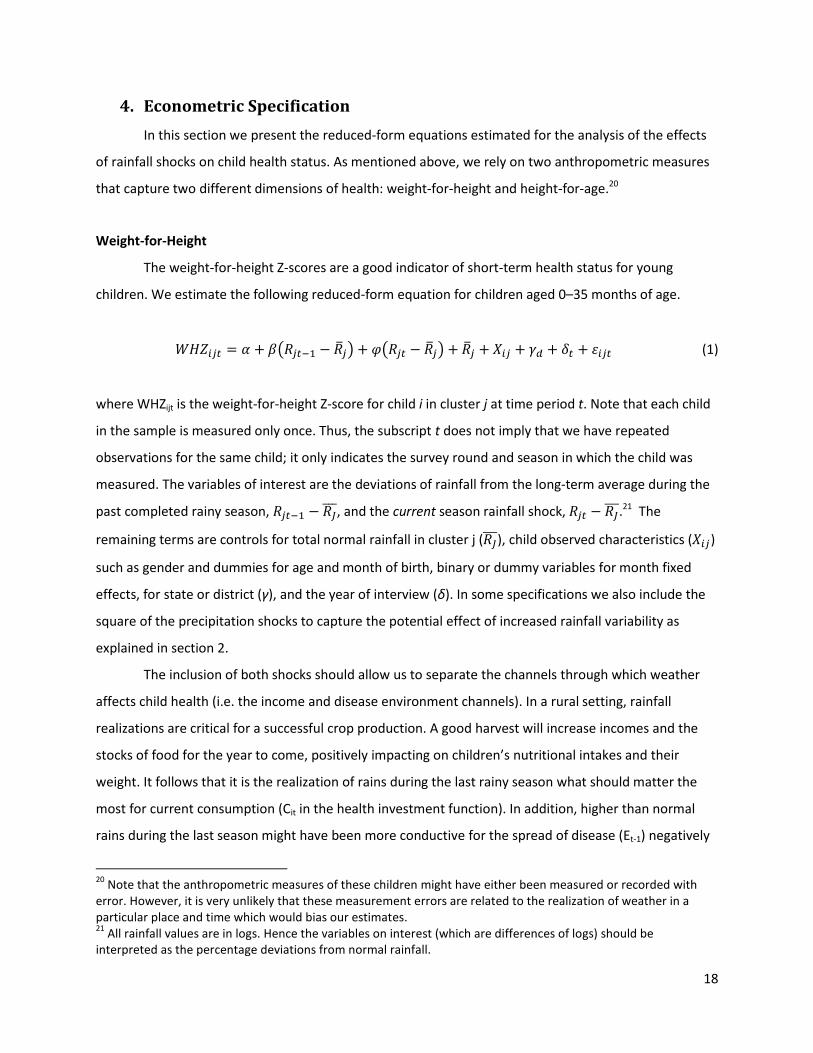
This fact is explicit in Figures 5, which shows the seasonal distribution of rainfall for three
weather stations located at different latitudes: Maiduguri (north), Abuja (central), and Port-Harcourt
(south). Annual precipitation in Nigeria is highest in the coastal areas and decrease inland towards the
north. The graph in panel (a) also reflects the typical double maxima and the little dry season (popularly
known as August break) of the coastal part of the country, as well as the single maximum rainfall regime
of northern Nigeria. It also confirms that the length of the growing season varies enormously at different
parts of the country. Therefore, to account for this variability we divide the country in three distinct
zones using the estimates of the length of the growing season presented in Odekunle (2004).19 The
resulting mean lengths are approximately 6 months in the south (from early May to the end of October),
4 months in the central part of the country (from June to September), and only 2 months in the north
(from July to August). The spatial distribution of DHS clusters into these regions is depicted in Figure 6
along with the interpolated normal level of rainfall during the growing season for each DHS cluster.
Figure 5
As opposed to rainfall patterns, normal temperatures are relatively uniform and the seasonal
variation is small, thereby allowing a wide range of suitable crops in relation to temperature conditions.
This happens especially in the central-south part of the country where the mean monthly long-term
temperature fluctuates between 25 to 30 degrees Celsius. The period between February and April is the
hottest during the year (this period corresponds to the dry season). Northern Nigeria presents more
variability in terms of temperature that ranges between 22 and 33 degrees.
Figure 6
19
Specifically, Odekunle (2004) used 40 years of daily rainfall data from five weather stations (Ikeja, Kaduna, Illorin, Ondo, and Kano) representing different climates, to predict the date of onset and cessation of rains. The point of onset corresponds to the time when cumulative rainfall reaches 7-8% of the annual total rainfall, whereas that of rainfall cessation corresponds to 90%.
18
4. Econometric Specification
In this section we present the reduced-form equations estimated for the analysis of the effects
of rainfall shocks on child health status. As mentioned above, we rely on two anthropometric measures
that capture two different dimensions of health: weight-for-height and height-for-age.20
Weight-for-Height
The weight-for-height Z-scores are a good indicator of short-term health status for young
children. We estimate the following reduced-form equation for children aged 0–35 months of age.
(1)
where WHZijt is the weight-for-height Z-score for child i in cluster j at time period t. Note that each child
in the sample is measured only once. Thus, the subscript t does not imply that we have repeated
observations for the same child; it only indicates the survey round and season in which the child was
measured. The variables of interest are the deviations of rainfall from the long-term average during the
past completed rainy season, , and the current season rainfall shock,
.21 The
remaining terms are controls for total normal rainfall in cluster j ( ), child observed characteristics ( )
such as gender and dummies for age and month of birth, binary or dummy variables for month fixed
effects, for state or district (γ), and the year of interview (δ). In some specifications we also include the
square of the precipitation shocks to capture the potential effect of increased rainfall variability as
explained in section 2.
The inclusion of both shocks should allow us to separate the channels through which weather
affects child health (i.e. the income and disease environment channels). In a rural setting, rainfall
realizations are critical for a successful crop production. A good harvest will increase incomes and the
stocks of food for the year to come, positively impacting on children’s nutritional intakes and their
weight. It follows that it is the realization of rains during the last rainy season what should matter the
most for current consumption (Cit in the health investment function). In addition, higher than normal
rains during the last season might have been more conductive for the spread of disease (Et-1) negatively
20
Note that the anthropometric measures of these children might have either been measured or recorded with error. However, it is very unlikely that these measurement errors are related to the realization of weather in a particular place and time which would bias our estimates. 21
All rainfall values are in logs. Hence the variables on interest (which are differences of logs) should be interpreted as the percentage deviations from normal rainfall.

19
affecting the child’s current health status via Ht-1. Therefore, the coefficient cannot be signed a priori
since it reflects the net effect of two opposite effects: the income and the disease environment effects.
To the extent that the positive income effects are greater than the short-lived negative effects of the
disease environment, it is expected that In addition, we include the square of past rainfall
deviation to examine how rainfall variability may affect weight-for-height. While higher rainfall should
have a positive effect on income, we expect that excessive rainfall may both be harmful to crops and
increase diseases.
For children surveyed during the rainy season, we also examine the impact of the current rainfall
deviation on weight-for-height Z-scores, summarized by the coefficient . It is expected that
since higher than normal rainfall is likely to increase the incidence of water-borne diseases and
the benefit from the current higher rainfall on crop yields and income has yet to be realized.
Figure 7
Figure 7 illustrates the way in which rainfall shocks are constructed. For the past season we
compute the deviation of total rainfall from the normal. A contemporaneous shock is constructed based
on the cumulative rainfall from the beginning of the growing season up to the month of interview (for
both the realization in that particular year and the normal). However, for children interviewed during
the dry season we set the normal rainfall and its deviation to 0. Recall from the previous section that the
length of the growing season varies geographically, with a gradually shorter season in the more northern
areas of the country. Depending of the date a household was surveyed, this also affects which calendar
year we used to compute the past and current shocks. Figure 8 shows the distribution of rainfall shocks
as percentage deviations from normal for the last completed rainy season and the current season shock
(in this last case only for those children born during the rainy season).
Figure 8
Height-for-Age
We also use the pooled child-level DHS sample to examine the effect of weather shocks on
height-for-age; an indicator of long-term health status. In contrast to weight-for-height, there are two
differences in the relationship between rainfall shocks and height-for-age. First, there is no point to
correlating contemporaneous rainfall shocks with current height for age, as child height-for age is only

20
likely to respond with a lag. For this reason, one can only correlate the rainfall shocks experienced in the
last or earlier completed rainfall seasons. Second, older children have experienced more than one
completed rainfall season, which implies that one needs to take into account all of the rainfall shocks
that a child has experienced throughout his/her life depending on his/her age. For these two primary
reasons we restrict our analysis to children between 0–35 months of age, and group children into three
categories depending on their age (in years) and thus the number of rainy seasons experienced until the
time of the survey. The first group (or age cohort) is composed of children younger than 12 months of
age which have experienced only one completed rainy season since birth. Children in the second and
third cohorts have experienced two or at most three rainy seasons by the time they were interviewed.
The censoring in the relevant variables generated by this approach is accounted for by interacting the
weather shock variables with the dummies for each cohort.
Specifically, the reduced form equation estimated is,
(2)
where HAZijt is the height-for-age Z-score for child i in cluster j measured at time period t, Y23 is a binary
variable identifying children who have experienced 2 or 3 rainy seasons (i.e., Y23=1 for 2 and 3 year olds,
=0 otherwise) and Y3 is a binary variable identifying children who have experienced 3 rainy seasons (i.e.
Y3=1 for 3 year olds, =0 otherwise).22 As before, the subscript t only indicates the survey round in which
the child was measured, i.e. either 2003 or 2008. As in the case of WHZ, the variables represent
the percentage deviation of rainfall with respect to the long-term average for cluster j taking into
account the length of the respective growing season (which as before varies according to the geographic
location of the cluster). However, in this case the variables refer to the entire history of completed rainy
seasons experienced by a child since birth. Specifically, represents total rainfall during the most
recently completed rainy season, represents the total rainfall two rainy seasons ago (experienced
only by both two and three year old children) and represents the total rainfall three rainy seasons
ago experienced only by three year old children. The additional variables included as controls in the
regression include: total normal rainfall ( ) in log, dummies for month and year of interview (δ), fixed
22
Rainfall shocks experienced while a child is in the uterus are not considered in the analysis.

21
effect by state or district (γ), and children characteristics (η). Some specifications also include the square
of the rainfall shocks to test for nonlinearities.
Figure 9
Figure 9 presents an illustration of how the cohorts were constructed and the corresponding
weather shocks. A couple of points are worth mentioning. First, two children born in the same day but in
different parts of the country might belong to a different cohort because the length of the growing
season differs across space. For example, a child born on September 15, 2006 in the central or south
regions will have experienced one less completed rainy season than a child born in the same day in
northern Nigeria (assuming both children were interviewed in the same day). Second, each measure of
rainfall shock ( is actually composed of weather realizations in different calendar years. For
example, in any given cluster will be formed by deviations of rainfall from normals for the years
2000, 2001, 2002, 2005, 2006, and 2007. The empty cells indicate the censoring.
As mentioned earlier, in the case of height-for-age the sign of the coefficients on the past
weather shocks ( cannot be determined a priori because the impact of past shocks on either
consumption or health take time to materialize, making it impossible to isolate each channel. However,
the effects should operate in opposite directions. Thus, a positive coefficient would be indicative of an
income effect stronger than the disease environment effect and vice versa.
An implicit assumption in the specification of equation (2) discussed above is that rainfall shocks
have the same impact for each cohort, i.e. βs are the same across cohort. By allowing the impacts of
rainfall shocks to vary by cohort we can also determine whether the impacts of shocks are transitory.
Therefore, we also estimate the following equation:
(3)
One advantage of this specification is that it allows us to test whether rainfall shocks are short-
lived or if they have long-lasting effects on child health. A shock may be considered as “transitory” if the
current HAZ score is significantly correlated with the rainfall shock that took place during the most
22
recent rainy season (i.e. for cohort 1,
for cohort 2, or for cohort 3). On the contrary, a
rainfall shock may be considered as having a “longer-lasting” impact if rainfall shocks that occurred two
or three rainy seasons ago are significantly correlated with the current HAZ of a child (i.e., any of the
coefficients ,
, and is significantly different from zero).
5. Results
Weight-for-Height
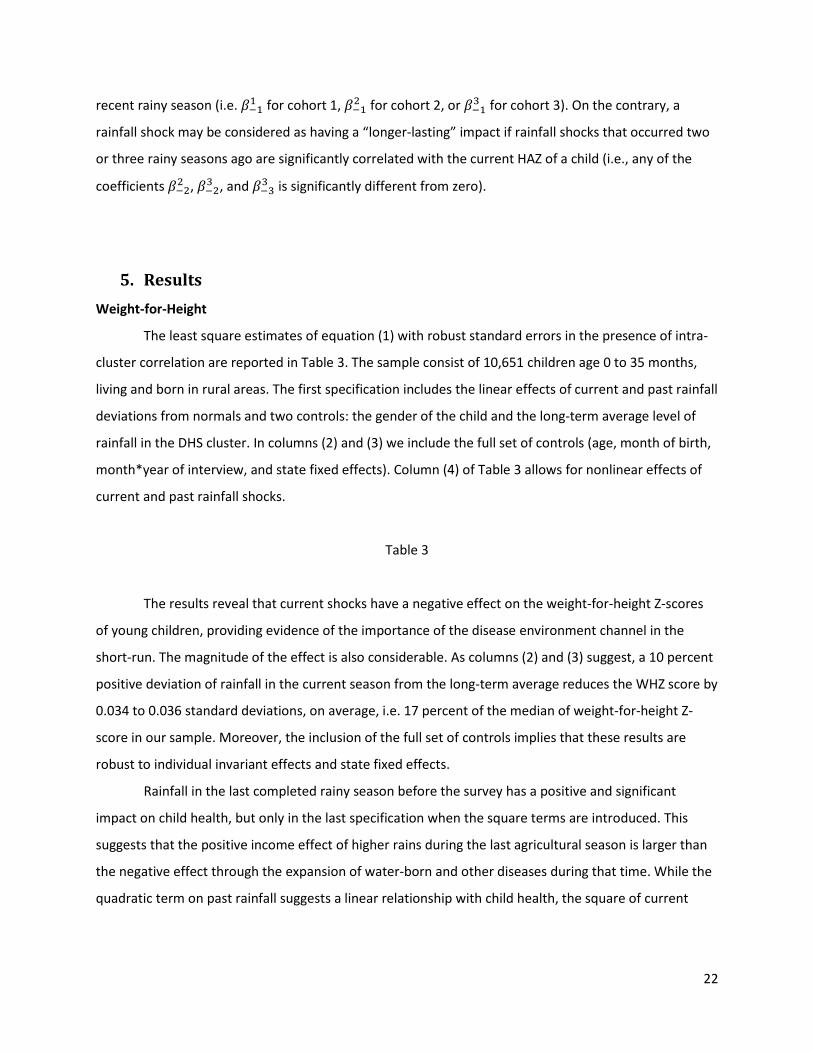
The least square estimates of equation (1) with robust standard errors in the presence of intra-
cluster correlation are reported in Table 3. The sample consist of 10,651 children age 0 to 35 months,
living and born in rural areas. The first specification includes the linear effects of current and past rainfall
deviations from normals and two controls: the gender of the child and the long-term average level of
rainfall in the DHS cluster. In columns (2) and (3) we include the full set of controls (age, month of birth,
month*year of interview, and state fixed effects). Column (4) of Table 3 allows for nonlinear effects of
current and past rainfall shocks.
Table 3
The results reveal that current shocks have a negative effect on the weight-for-height Z-scores
of young children, providing evidence of the importance of the disease environment channel in the
short-run. The magnitude of the effect is also considerable. As columns (2) and (3) suggest, a 10 percent
positive deviation of rainfall in the current season from the long-term average reduces the WHZ score by
0.034 to 0.036 standard deviations, on average, i.e. 17 percent of the median of weight-for-height Z-
score in our sample. Moreover, the inclusion of the full set of controls implies that these results are
robust to individual invariant effects and state fixed effects.
Rainfall in the last completed rainy season before the survey has a positive and significant
impact on child health, but only in the last specification when the square terms are introduced. This
suggests that the positive income effect of higher rains during the last agricultural season is larger than
the negative effect through the expansion of water-born and other diseases during that time. While the
quadratic term on past rainfall suggests a linear relationship with child health, the square of current
23
rainfall indicates the presence of nonlinearities. However, the magnitude of the coefficient is too small
for it to have a noticeable impact.
The last column in Table 3 includes the interaction of the weather shock with a households’
access to health facilities. For this purpose, we construct a dummy variable that captures how easy is for
a woman to access to a health clinic in the case of need for medical treatment.23 The results show that,
as expected, having relatively easy access to a medical facility significantly increases children weight-for-
height Z-scores. The positive coefficient of the interaction of the current shock with clinic implies that
the presence of the clinic helps reduce the impact of the shock on the WHZ. In addition, the positive
coefficient of the interaction with the last rainy season shock implies that the presence of the clinic
reinforces the net effect of the income and disease environment effect, probably due to the reduction
of the environment disease subcomponent. Although the coefficients on the interactions have
meaningful interpretations their signs are not statistically significant.
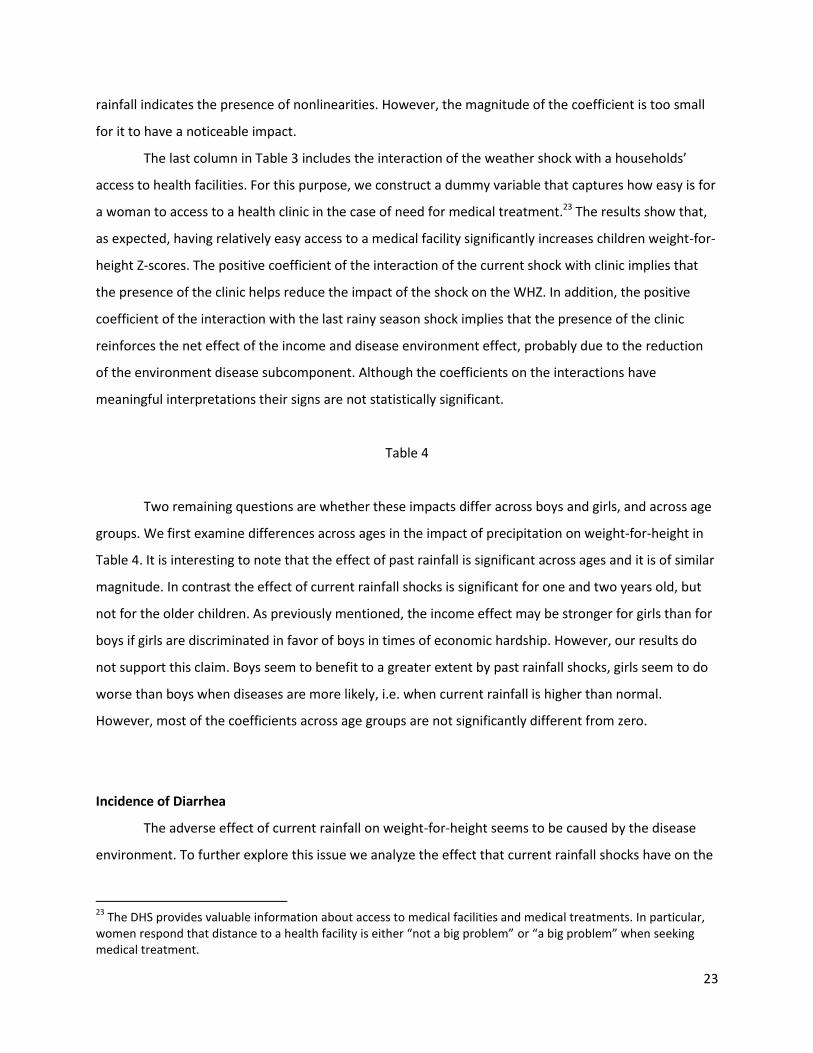
Table 4
Two remaining questions are whether these impacts differ across boys and girls, and across age
groups. We first examine differences across ages in the impact of precipitation on weight-for-height in
Table 4. It is interesting to note that the effect of past rainfall is significant across ages and it is of similar
magnitude. In contrast the effect of current rainfall shocks is significant for one and two years old, but
not for the older children. As previously mentioned, the income effect may be stronger for girls than for
boys if girls are discriminated in favor of boys in times of economic hardship. However, our results do
not support this claim. Boys seem to benefit to a greater extent by past rainfall shocks, girls seem to do
worse than boys when diseases are more likely, i.e. when current rainfall is higher than normal.
However, most of the coefficients across age groups are not significantly different from zero.
Incidence of Diarrhea
The adverse effect of current rainfall on weight-for-height seems to be caused by the disease
environment. To further explore this issue we analyze the effect that current rainfall shocks have on the
23
The DHS provides valuable information about access to medical facilities and medical treatments. In particular, women respond that distance to a health facility is either “not a big problem” or “a big problem” when seeking medical treatment.
24
likelihood of reporting diarrhea in the last two weeks prior to the interview.24 Diarrhea is a particularly
important disease to study in this context because of its sensitivity to climatic conditions. As can be seen
in Table 5, higher-than-normal rains significantly affect the incidence of diarrhea. The magnitude of the
effect is larger for two and three years-old, but the coefficient is significant only for the former (see
column 2). This result is in line with Keusch et al. (2006) reporting that the prevalence of diarrhea peaks
among infants and young children (those between 6-12 months of age).
Table 5
We were expecting potentially larger effect on weight-for-height through the disease
environment for children above 12 months of age since breastfeeding declines as children grow up,
increasing the exposure to disease contracted through food intakes. However, our findings indicate that
higher incidence of diarrhea only affects the middle cohorts, but it does not explain why the younger
children, i.e. those between 0-12 months old, are also significantly affected by these shocks (from
column 1 in Table 5). In other words, the disease environment affects infants but not through a higher
incidence of diarrhea. Lastly, we also find, as expected, the coefficient of last season rainfall does not
affect the incidence of diarrhea at the time of the survey.
As in the case of weight-for-height, in the last column we include the interaction of the rainfall
shock with having access to a health clinic. The positive coefficients provide further (albeit not strong)
evidence of the importance that easy access to a health clinic may have on children’s health, especially
after experiencing a rainfall shock.
Height-for-Age
The significant impact that rainfall during the last season has on weight-for-height indicates that
shocks might have a medium-run effect on child health. For further evidence we now turn our attention
to the effect that rainfall shocks during previous seasons have on the height-for-age Z-scores, which as
opposed to weight-for-height should better capture chronic nutritional status.
Table 6
24
The incidence of diarrhea for children surveyed during the rainy season 11% for the two rounds combined. However, diarrhea was more likely (about 15%) among children surveyed in the (smaller) 2003 round.

25
Table 6 presents the results for different specifications of Equation 2 on a sample of 10,728
children in rural areas. As mentioned in the previous section, we focus on completed rainy seasons since
a child was born. For instance, ΔR1 is the deviation of rainfall during the first completed growing season
experienced by a child, and ΔR2 and ΔR3 are the second and third seasons, respectively. In the first four
columns we include the deviation from normal rainfall, each with a different set of controls.25 In general,
the estimated regressions show that rainfall shocks at early life have a significant effect on the HAZ
scores. Moreover, the positive coefficients suggest that the benefits to child health through the income
channel more than compensate any negative impact that higher rainfall may have on child health due to
the expansion of water-borne and other diseases.
As opposed to the weight-for-height case we are now able to control for the corresponding
temperature shocks.26 Note that while rainfall shocks have an ambiguous effect on child health
(depending on the relative strength of the income and disease environment channels), temperature
shocks always have a negative impact on child health, especially in certain temperate locations. Higher
temperatures increase the incidence of diseases and also reduce agricultural yields, lowering the
subsequent nutritional intakes. We present the results in column (5). In line with our reasoning we find
that temperature shocks at early life have a negative impact on height-for-age Z-scores. In addition, the
coefficients on rainfall deviations are still negative and significant, and the inclusion of temperature
shocks has not affected their magnitudes.
Lastly, we test for nonlinearities by including the square of weather shocks. As we already
mentioned, if rainfall shocks affect child health linearly, then any increase in the variance of rainfall (for
example, induced by climate change) might not have any additional impact on the expected health
outcome. In contrast, if a quadratic relationship exists between shocks and health then, any change in
its variance will also affect the mean health outcome. Results presented in column (6) show that all the
square coefficients are not statistically significant implying that rainfall affects health linearly. Further,
their inclusion does not change the significance and magnitude of either the rainfall or the temperature
shocks.
So far we have shown that past weather shocks impact child health, but we have not been able
to say anything about whether these shocks have a permanent effect or not. In other words, saying that
25
Controls include fixed effects by age, month of birth, month*year of interview, season*year of interview, and state. 26
Unfortunately, the quality of the temperature records for 2008, the year of the last and larger DHS survey, are not reliable enough, and hence we decided to exclude temperature in the weight-for-height regressions. In the case of height-for-age, the last completed growing season for the vast majority of the sample is 2007.
26
shocks in the first and second seasons of life have an impact on child health is not enough to say that
they have a long-lasting effect, because they might affect the younger children but not the oldest.
Table 7
To analyze this issue we group children into cohorts according to the number of completed rainy
season that they have experienced since birth, and then interact each cohort with rainfall deviations in
different time periods as explained in Equation 3. Examining exogenous shocks in several periods at
early life for each cohort, allow us to identify the most critical periods, and ultimately to understand the
persistency of their impacts. Results presented in columns 1 and 2 of Table 7 suggest that weather
shocks (both rainfall and temperature) are transitory, since it is only the last season shock that matters
for HAZ scores (ΔR1 and ΔT1 for the first cohort and ΔR2 and ΔT2 for the second cohort). In the last two
columns we split the sample between boys and girls to see if there is any difference across gender
groups. Again, results are indicative of similar (in magnitude) transitory impacts of weather shocks for
both groups.
The short-lived nature of past weather shocks seem to indicate that children who have
experienced a shock can rapidly catch-up with their cohort. Our findings are in line with some results
reported in the epidemiologic literature, but seem to contradict Maccini and Young (2009) who report
that shocks during the first 12 months since birth have an effect on socioeconomic outcomes of women
as adults.
6. Conclusions
In this study, we investigate the extent to which rainfall shocks affect the welfare of children in
rural Nigeria. Understanding the socio-economic consequences of rainfall variability is a prerequisite for
the integration of adaptation activities into poverty reduction efforts in Nigeria. This is especially
relevant in the context of global climate change and the projected increase of weather variability.
We used data from the 2003 and 2008 rounds of the Demographic and Health Survey that
contain measures on two key dimensions of child welfare such as child weight-for-height and height-for-
age, commonly used by nutritionists as indicators of short-run and long-run nutritional status.
Among the key findings of this study is that rainfall shocks have a significant impact on child
health irrespective of the dimension of child welfare examined in rural Nigeria. In addition, it appears
27
that the impact of these shocks is the same for young boys and girls which suggests that there is no
discrimination in the allocation of household resources towards girls. The negative impact of
contemporaneous rainfall shocks on child weight-for-height reveals the importance of the disease
environment in determining health status in the short-run. This finding is reinforced by the positive and
significant effect that rainfall shocks have on the incidence of diarrhea among children. Taking into
consideration the fact that diarrhea is the leading cause of child malnutrition, and the second leading
cause of death for young children, 27 our findings suggest that there is ample room for policy
intervention in this area. Low cost public health interventions –like oral rehydration therapy- will
certainly reduce the negative impacts that weather shocks have on short-term child malnutrition. In this
sense, one of the contributions of this study was to show that having easy access to a health clinic
significantly improves children’s weight-for-height. We also find some evidence, albeit weak, on the
important mitigating effect that health interventions may have on child health after experiencing a
weather shock.
It is also the case that above normal precipitation during the last completed rainy season has a
positive impact on child weight-for-height which suggests that the income effect associated with a
higher than normal rainfall during the previous agricultural cycle is stronger than the negative effect of
the disease environment. The importance of the income effect –taking place mainly through the positive
effects of higher than normal rainfall on agricultural production- suggests that advances in weather
prediction and monitoring techniques can be employed to develop early warning systems to alert rural
communities as a means of reducing the risks of crop failure. In this sense, the work that the Nigerian
Meteorological Agency has been doing in providing reliable planting dates forecast seems to be a step in
the right direction (Nnoli et al. 2006).
Rainfall shocks also appear to have an effect on the longer-run measure of child nutritional
status such as height-for-age. As is the case for weight-for-height, rainfall shocks during the most recent
rainy season have a positive effect on the height-for-age Z-score suggesting an income effect stronger
than the disease environment effect. However, the fact that it is only the shock from the last completed
rainfall season (and not the shocks from earlier seasons) that has a significant effect across different
ages, suggests that children are able to catch-up with their cohorts soon after the shock.
The analysis also reveals that the relationship between the contemporaneous rainfall deviations
and weight-for-height is almost linear which suggests that any future moderate increase in rainfall 27
According to the World Health Organization (2002), in developing countries children under three years old experience on average three episodes of diarrhea every year, with each episode depriving children of the nutrition necessary for growth.

28
variability is not likely to result in any additional decrease in the health status of children than the one
that has been observed historically. This conclusion is reinforced by the linear relationship between
rainfall shocks and height-for-age. It should be kept in mind, however, that this result does not imply
that climate change will not have any effect on child health. Our analysis has focused on the effect of
weather variability, i.e. deviations from normal, and not on the effect of changes in the climate (the
long-term averages of weather realizations). Climate change may also result in higher mean
temperatures, and may increase or decrease the level of total rainfall affecting children’s health status,
with little changes in the variance of rainfall or temperature. It is also possible that rainfall shocks and
variability impact on health in a manner different from that analyzed in this study. In our analysis we
have defined rainfall shock in terms of the deviation of the cumulative rainfall during the growing season
from the normal amount of rainfall during the season. It is conceivable that climate change results in
changes in the timing of rainfall during the growing season thus affecting plant growth while leaving
total rainfall during the season unchanged. Future research is warranted to determine how alternative
definitions of weather shocks and higher order effects may affect the welfare of households and the
health of young children.

29
References
Adair, Linda (1999). “Filipino Children Exhibit Catch-up Growth from Age 2 to 12 Years.” Journal of
Nutrition, 129: 1140-1148. Akpodiogagaand, P. and O. Odjugo (2010). “General Overview of Climate Change Impacts in Nigeria.”
Journal of Human Ecology, 29(1): 47-55. Baird, S., J. Friedman and M. Smitz (2010). “Climate variability and infant mortality in Africa.”
Unpublished manuscript. The World Bank, Washington DC. Bandyopadhyay S., S. Kanji, and, L. Wang (2011). “The Impact of Rainfall and Temperature Variation on
Diarrheal Prevalencein Sub-Saharan Africa.” Applied Geography, forthcoming. Barrios S., L. Bertinelli, and E. Strobl (2010). “Trends in Rainfall and Economic Growth in Africa: A
Neglected Cause of the African Growth Tragedy.” Review of Economics and Statistics, 92(2): 350–366.
Behrman, J., and A. Deolalikar (1988). “Health and Nutrition.” Handbook of Development Economics, edited by H. Chenery and T. N. Srinivasan. Amsterdam: Elsevier.
Behrman, J. and A. Deolalikar (1990). “The Intrahousehold Demand for Nutrients in Rural South India: Individual Estimates, Fixed Effects, and Permanent Income.” Journal of Human Resources, 25(4): 665-96.
Bengtsson N. (2010). “How Responsive is Body Weight to Transitory Income Changes? Evidence from Rural Tanzania.” Journal of Development Economics, 92: 53–61.
Bhalotra, S. (2010). “Fatal Fluctuations? Cyclicality in Infant Mortality in India.” Journal of Development Economics, 9: 7-19.
Bloom D. and J. Sachs (1998). “Geography, Demography, and Economic Growth in Africa.” Brookings Papers on Economic Activity, 2: 207-295.
Bunyavanich S., C. Landrigan, A. McMichael, and P. Epstein (2003) “The Impact of Climate Change on Child Health.” Ambulatory Pediatrics, 3(1): 44-52.
Cameron N., M. Preece, and T. Cole (2005). “Catch-up Growth or Regression to the Mean? Recovery from Stunting Revisited.” American Journal of Human Biology, 17: 412-417.
Confalonieri, U., B. Menne, R. Akhtar, K.L. Ebi, M. Hauengue, R.S. Kovats, B. Revich and A. Woodward (2007). Human health. Climate Change 2007: Impacts, Adaptation and Vulnerability. Contribution of Working Group II to the Fourth Assessment Report of the Intergovernmental Panel on Climate Change, M.L. Parry, O.F. Canziani, J.P. Palutikof, P.J. van der Linden and C.E. Hanson, Eds., Cambridge University Press, Cambridge, UK, 391-431.
Das Gupta, M. (1987). “Selective Discrimination against Female Children in Rural Punjab, India.” Population and Development Review, 13(1): 77-100.
Dercon, S. and C. Porter (2010). “Live Aid Revisited: Long-term Impacts of the 1984 Ethiopian Famine on Children.” Unpublished manuscript, Centre for the Study of African Economies WPS/2010-39.
Deschenes, O. , M. Greenstone and J. Guryan (2009). “Climate Change and Birth Weight.” American Economic Review, 99(2): 211-17.
Deschenes, O. and E. Moretti (2009). “Extreme Weather Events, Mortality, and Migration.” Review of Economics and Statistics, 91(4): 659-681.
Dechenes, O., M. Greenstone, and J. Guryan (2009). “Climate Change and Birth Weight.” American Economic Review, 99(2): 211-217.
Friedman, J. and N. Schady (2009). “How Many More Infants are Likely to Die in Africa as a Result of the Global Financial Crisis ?” World Bank Policy Research Working Paper 5023. The World Bank, Washington DC.
30
Grossman, M. (1972). “On the Concept of Health Capital and the Demand for Health.” Journal of Political Economy, 80(2): 223-55.
Hoddinott, J. and B. Kinsey (2001). “Child Growth in the Time of Drought.” Oxford Bulletin of Economics and Statistics, 63(4): 409-436.
ICF Macro (2011). Incorporating Geographic Information into Demographic and Health Surveys: A Field Guide to GPS Data Collection. Maryland, USA: ICF Macro
Jacoby, H. and E. Skoufias (1997). "Risk, Financial Markets, and Human Capital in a Developing Country," Review of Economic Studies, 64(3): 311-35.
Jensen R. (2000). “Agricultural Volatility and Investment in Children.” American Economic Review, 90(2): 399-404.
Keusch, G. T., O. Fontaine, A. Bhargava, C. Boschi-Pinto, Z. Bhutta, and E. Gotuzzo (2006). Diarrheal diseases. In Jamison., et al. (Eds.), Disease Control Priorities in Developing Countries (2nd ed.) New York: Oxford University Press.
Kim, Y. S. and J. Lafortune (2010). “The Impact of Rainfall on Early Child Health." Unpublished manuscript, University of Maryland, Maryland, USA.
Kochar, A. (1995). “Explaining Household Vulnerability to Idiosyncratic Income Shocks.” American Economic Review, 85(2): 159-164.
Kundzewicz, Z.W., L. J. Mata, N. W. Arnell, P. Döll, P. Kabat, B. Jiménez, K. A. Miller, T. Oki, Z. Sen and I. A. Shiklomanov, 2007: Freshwater Resources and Their Management. Climate Change 2007: Impacts, Adaptation and Vulnerability. Contribution of Working Group II to the Fourth Assessment Report of the Intergovernmental Panel on Climate Change, M.L. Parry, O.F. Canziani, J.P. Palutikof, P.J. van der Linden and C.E. Hanson, Eds., Cambridge University Press, Cambridge, UK, 173-210.
Kudamatsu, M., T. Persson, and D. Strömberg (2011). “Weather and Infant Mortality in Africa.” Unpublished manuscript, Stockholm University, Sweden.
Lobell, D., M. Bänziger, C. Magorokosho and B. Vivek (2011). “Nonlinear Heat Effects on African Maize as Evidenced by Historical Yield Trials.” Nature Climate Change, 1: 42-45.
Maccini, S. and D. Yang (2009). “Under the Weather: Health, Schooling, and Economic Consequences of Early-life Rainfall.” American Economic Review, 99(3): 1006-1026.
Martorell, R., L. Kettel Khan and D. Schroeder (1994). “Reversibility of Stunting: Epidemiological Findings in Children from Developing Countries." European Journal of Clinical Nutrition, 48: 45- 57.
Masters W. and J. Sachs (2001). “Climate and Development.” Unpublished manuscript. Mei Z. and L. M. Grummer-Strawn (2007). “Standard Deviation of Anthropometric Z-scores as a Data
Quality Assessment Tool Using the 2006 WHO Growth Standards: A Cross Country Analysis.” Bulletin of the World Health Organization, 85(6): 441–448.
Miller, G. and B. P. Urdinola, (2010). “Cyclicality, Mortality, and the Value of Time: The Case of Coffee Price Fluctuations and Child Survival in Colombia.” The Journal of Political Economy, 118(1): 113-155.
Nordhaus, W., R. Mendelsohn and D. Shaw (1994). “The Impact of Global Warming on Agriculture: A Ricardian Approach.” American Economic Review, 84(4): 753-771.
Nnoli NO, Jagtap SS, Oluwasemire KO, Sanni SA, Ibrahim SA, Jibrin JM, Adebola, S., Ekeke AO, Yakubu AI, Miko S, Ajaezi GO, Omotosho JB, Akwarandu, B, Muyiolu SK, Kemakolam, JU, Ogunwale MA, Adejokun VF (2006). Strengthening the Capacity to Provide Reliable Planting Date Forecast in Nigeria, (Ed) S. S. Jagtap. Report Submitted to the International START secretariat for the grant US NSF (GEO-0203288, Washington, DC.
Nwoke, B.E., C.O. Onwuliri and G.O. Ufomadu (1992). “Onchocerciasis in Plateau State Nigeria: Ecological Background, Local Disease Perception and Treatment; and

31
Vector/Parasite Dynamics.” Journal of Hygiene, Epidemiology, Microbiology, and Immunology, 36 (2): 153–160.
Odekunle, T.O. (2004). “Rainfall and the Length of the Growing Season in Nigeria.” International Journal of Climatology, 24: 467-479.
Oluleye, A. and A. Akinbobola (2010). “Malaria and Pneumonia Occurrence in Lagos, Nigeria: Role of Temperature and Rainfal.l” African Journal of Environmental Science and Technology, 4(8): 510-516.
Portner, Claus (2010). “Natural Hazards and Child Health.” Unpublished manuscript, University of Washington.
Rose, E. (1999). “Consumption Smoothing and Excess Female Mortality in Rural India.” The Review of Economics and Statistics, 81(1): 41-49.
Rose, J., S. Daeschner, D. Easterling, E. Curriero, L. Lele and J. Patz (2000). “Climate and Waterborne Outbreaks.” Journal of the American Water Works Association, 92: 87-97.
Skoufias, E. and K. Vinha (2012) “Climate variability and child height in rural Mexico” Economics & Human Biology, Vol. 10, No. 1 (January), pp. 54-73.
Strauss, J. and D. Thomas (1998). “Health, Nutrition, and Economic Development.” Journal of Economic Literature, 36(2): 766-817.
van den Berg, G., M. Lindeboom, and F. Portrait (2007). “Long-run Longevity Effects of a Nutritional Shock Early in Life: The Dutch Potato Famine of 1984-1847.” Unpublished manuscript, IZA Discussion Paper 3123.
Wagbatsoma, V.A. and O.H. Okojie (2004). “Psychosocial Effects of River Blindness in a Rural Community in Nigeria.” Perspectives in Public Health, 124(3): 134-136.
Wang, L., S. Kanji and S. Bandyopadhyay (2009). “The health impact of extreme weather events in Sub-Saharan Africa.” World Bank Policy Research Working 4979. The World Bank, Washington DC.
World Health Organization (1995). Physical status: The Use and Interpretation of Anthropometry. Technical Report Series. WHO, Geneva.
World Health Organization (2002). “Health and Environment in Sustainable Development." WHO, Geneva.
World Health Organization (2008). “Protecting Health from Climate Change. World Health Day 2008." WHO, Geneva.
World Health Organization Multicentre Growth Reference Study Group (2006). WHO Child Growth Standards: Length/height-for-age, weight-for-age, weight-for-length, weight-for-height and body mass index-for-age: Methods and development. Geneva: World Health Organization; pp 312. (available on the web site: http://www.who.int/childgrowth/publications/en/)
Yang, D. and H. Choi (2007). “Are Remittances Insurance? Evidence from Rainfall Shocks in the Philippines.” World Bank Economic Review, 21(2): 219-248.
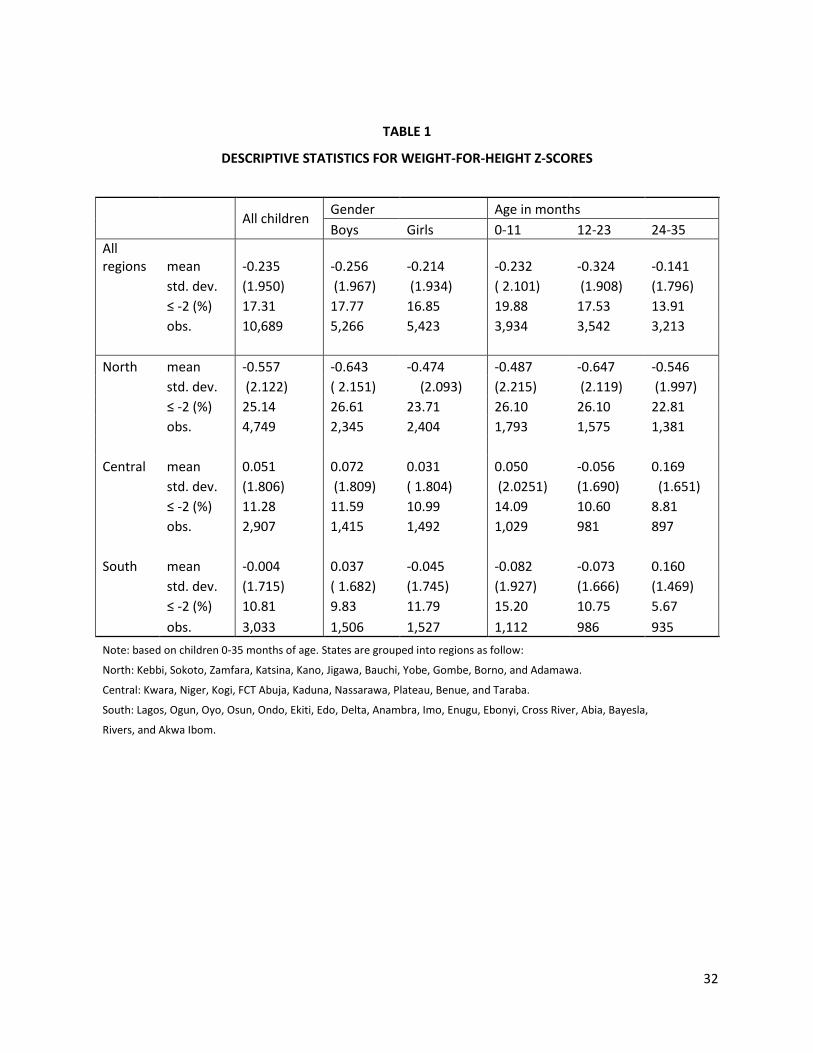
32
TABLE 1
DESCRIPTIVE STATISTICS FOR WEIGHT-FOR-HEIGHT Z-SCORES
All children Gender Age in months
Boys Girls 0-11 12-23 24-35
All regions mean -0.235 -0.256 -0.214 -0.232 -0.324 -0.141
std. dev. (1.950) (1.967) (1.934) ( 2.101) (1.908) (1.796)
≤ -2 (%) 17.31 17.77 16.85 19.88 17.53 13.91
obs. 10,689 5,266 5,423 3,934 3,542 3,213
North mean -0.557 -0.643 -0.474 -0.487 -0.647 -0.546
std. dev. (2.122) ( 2.151) (2.093) (2.215) (2.119) (1.997)
≤ -2 (%) 25.14 26.61 23.71 26.10 26.10 22.81
obs. 4,749 2,345 2,404 1,793 1,575 1,381
Central mean 0.051 0.072 0.031 0.050 -0.056 0.169
std. dev. (1.806) (1.809) ( 1.804) (2.0251) (1.690) (1.651)
≤ -2 (%) 11.28 11.59 10.99 14.09 10.60 8.81
obs. 2,907 1,415 1,492 1,029 981 897
South mean -0.004 0.037 -0.045 -0.082 -0.073 0.160
std. dev. (1.715) ( 1.682) (1.745) (1.927) (1.666) (1.469)
≤ -2 (%) 10.81 9.83 11.79 15.20 10.75 5.67
obs. 3,033 1,506 1,527 1,112 986 935
Note: based on children 0-35 months of age. States are grouped into regions as follow:
North: Kebbi, Sokoto, Zamfara, Katsina, Kano, Jigawa, Bauchi, Yobe, Gombe, Borno, and Adamawa.
Central: Kwara, Niger, Kogi, FCT Abuja, Kaduna, Nassarawa, Plateau, Benue, and Taraba.
South: Lagos, Ogun, Oyo, Osun, Ondo, Ekiti, Edo, Delta, Anambra, Imo, Enugu, Ebonyi, Cross River, Abia, Bayesla,
Rivers, and Akwa Ibom.
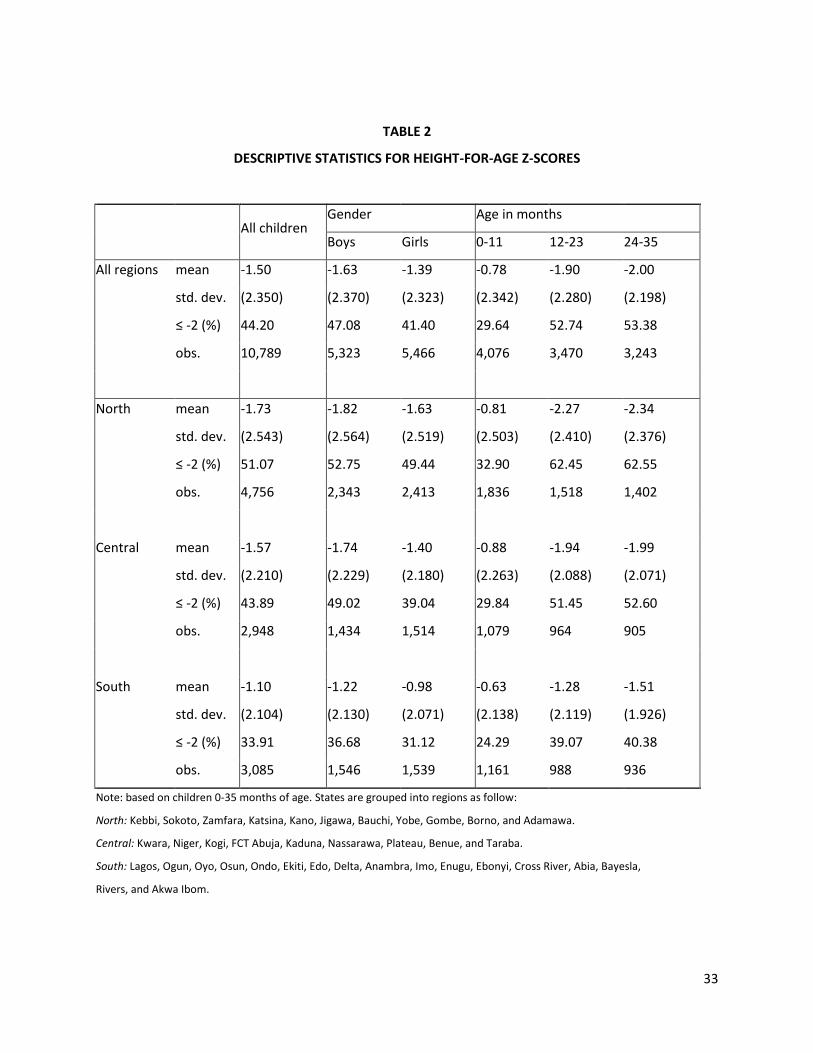
33
TABLE 2
DESCRIPTIVE STATISTICS FOR HEIGHT-FOR-AGE Z-SCORES
All children
Gender Age in months
Boys Girls 0-11 12-23 24-35
All regions mean -1.50 -1.63 -1.39 -0.78 -1.90 -2.00
std. dev. (2.350) (2.370) (2.323) (2.342) (2.280) (2.198)
≤ -2 (%) 44.20 47.08 41.40 29.64 52.74 53.38
obs. 10,789 5,323 5,466 4,076 3,470 3,243
North mean -1.73 -1.82 -1.63 -0.81 -2.27 -2.34
std. dev. (2.543) (2.564) (2.519) (2.503) (2.410) (2.376)
≤ -2 (%) 51.07 52.75 49.44 32.90 62.45 62.55
obs. 4,756 2,343 2,413 1,836 1,518 1,402
Central mean -1.57 -1.74 -1.40 -0.88 -1.94 -1.99
std. dev. (2.210) (2.229) (2.180) (2.263) (2.088) (2.071)
≤ -2 (%) 43.89 49.02 39.04 29.84 51.45 52.60
obs. 2,948 1,434 1,514 1,079 964 905
South mean -1.10 -1.22 -0.98 -0.63 -1.28 -1.51
std. dev. (2.104) (2.130) (2.071) (2.138) (2.119) (1.926)
≤ -2 (%) 33.91 36.68 31.12 24.29 39.07 40.38
obs. 3,085 1,546 1,539 1,161 988 936
Note: based on children 0-35 months of age. States are grouped into regions as follow:
North: Kebbi, Sokoto, Zamfara, Katsina, Kano, Jigawa, Bauchi, Yobe, Gombe, Borno, and Adamawa.
Central: Kwara, Niger, Kogi, FCT Abuja, Kaduna, Nassarawa, Plateau, Benue, and Taraba.
South: Lagos, Ogun, Oyo, Osun, Ondo, Ekiti, Edo, Delta, Anambra, Imo, Enugu, Ebonyi, Cross River, Abia, Bayesla,
Rivers, and Akwa Ibom.

34
TABLE 3
IMPACT OF RAINFALL SHOCKS ON WEIGHT-FOR-HEIGHT
(1) (2) (3) (4) (5)
ΔRt-1 0.00159 0.00259 0.00457 0.00873*** 0.00865***
(0.00227) (0.00261) (0.00291) (0.00283) (0.00311)
ΔRt -0.00489*** -0.00360** -0.00339** -0.00256** -0.00339***
(0.00155) (0.00142) (0.00148) (0.00123) (0.00127)
(ΔRt-1)2
9.96e-05 0.000123**
(6.07e-05) (0.0001)
(ΔRt)2
8.84e-05*** 9.36e-05***
(2.04e-05) (0.00002)
health center
0.0945**
(0.0461)
health center*ΔRt-1
0.00151
(0.00328)
health center*ΔRt
0.00228
(0.0021)
0.440*** 0.508 0.622* 0.686** 0.734***
(0.0542) (0.325) (0.327) (0.286) -0.27
female 0.0402 0.0361 0.0351 0.0390 0.0386
(0.0382) (0.0374) (0.0374) (0.0372) -0.0371
R-squared 0.021 0.076 0.072 0.079 0.08
Age FE NO YES YES YES YES
Month of birth FE NO YES YES YES YES
Interview Month*Year FE NO YES NO YES YES
Season Interview*Year FE NO NO YES NO NO
State FE NO YES YES YES YES
Note: the dependent variable is the weight-for-height Z-score.
The sample has 9,931 children aged 0-35 months in rural areas. Health center (=1 if close to household)
Standard errors clustered by village.
*** p<0.01, ** p<0.05, * p<0.1
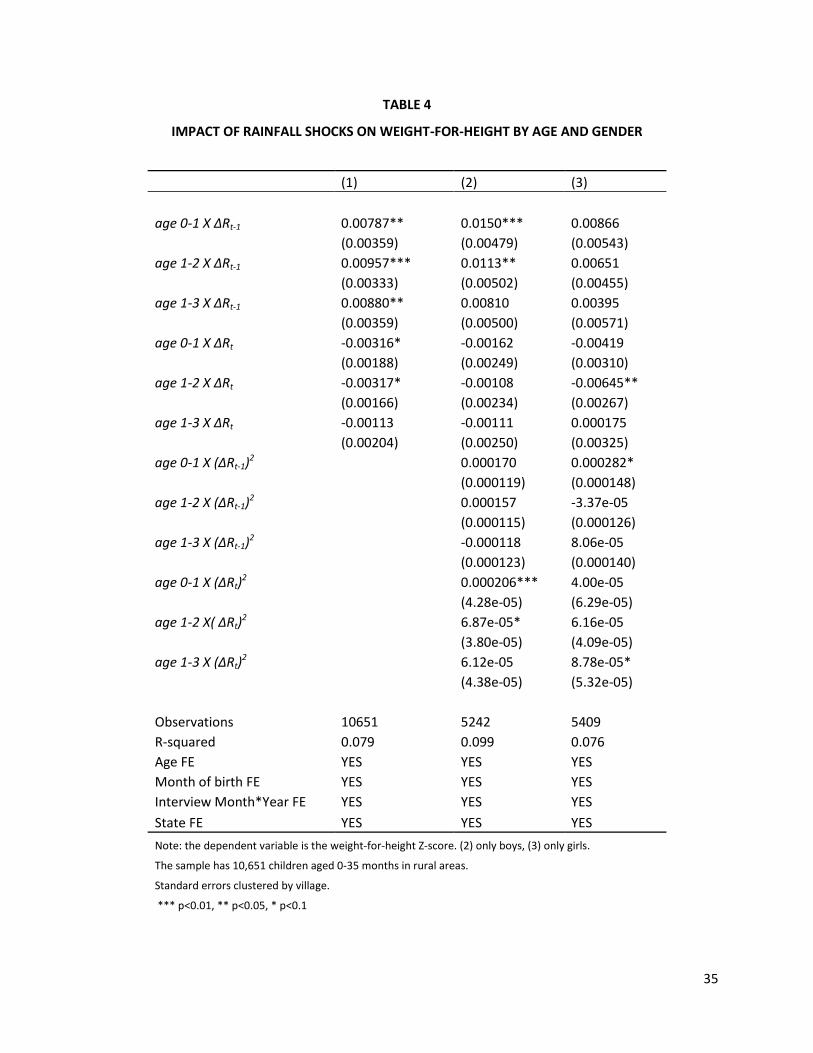
35
TABLE 4
IMPACT OF RAINFALL SHOCKS ON WEIGHT-FOR-HEIGHT BY AGE AND GENDER
(1) (2) (3)
age 0-1 X ΔRt-1 0.00787** 0.0150*** 0.00866
(0.00359) (0.00479) (0.00543)
age 1-2 X ΔRt-1 0.00957*** 0.0113** 0.00651
(0.00333) (0.00502) (0.00455)
age 1-3 X ΔRt-1 0.00880** 0.00810 0.00395
(0.00359) (0.00500) (0.00571)
age 0-1 X ΔRt -0.00316* -0.00162 -0.00419
(0.00188) (0.00249) (0.00310)
age 1-2 X ΔRt -0.00317* -0.00108 -0.00645**
(0.00166) (0.00234) (0.00267)
age 1-3 X ΔRt -0.00113 -0.00111 0.000175
(0.00204) (0.00250) (0.00325)
age 0-1 X (ΔRt-1)2
0.000170 0.000282*
(0.000119) (0.000148)
age 1-2 X (ΔRt-1)2
0.000157 -3.37e-05
(0.000115) (0.000126)
age 1-3 X (ΔRt-1)2
-0.000118 8.06e-05
(0.000123) (0.000140)
age 0-1 X (ΔRt)2
0.000206*** 4.00e-05
(4.28e-05) (6.29e-05)
age 1-2 X( ΔRt)2
6.87e-05* 6.16e-05
(3.80e-05) (4.09e-05)
age 1-3 X (ΔRt)2
6.12e-05 8.78e-05*
(4.38e-05) (5.32e-05)
Observations 10651 5242 5409
R-squared 0.079 0.099 0.076
Age FE YES YES YES
Month of birth FE YES YES YES
Interview Month*Year FE YES YES YES
State FE YES YES YES
Note: the dependent variable is the weight-for-height Z-score. (2) only boys, (3) only girls.
The sample has 10,651 children aged 0-35 months in rural areas.
Standard errors clustered by village.
*** p<0.01, ** p<0.05, * p<0.1
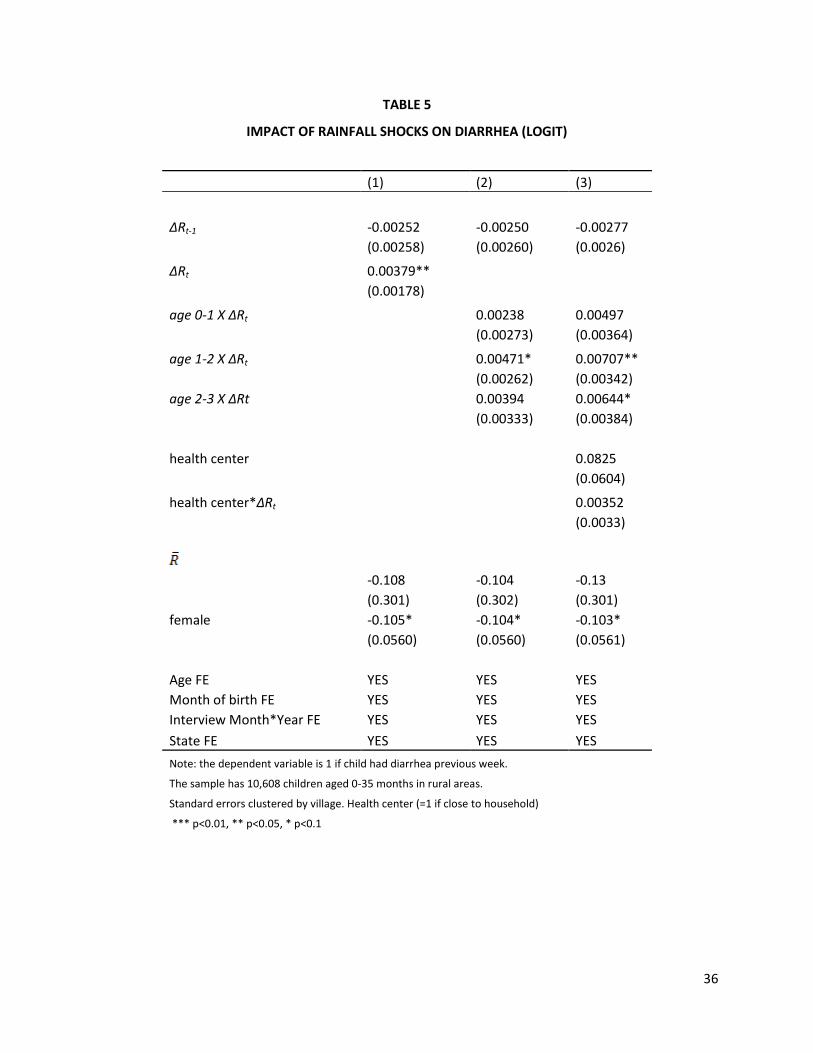
36
TABLE 5
IMPACT OF RAINFALL SHOCKS ON DIARRHEA (LOGIT)
(1) (2) (3)
ΔRt-1 -0.00252 -0.00250 -0.00277
(0.00258) (0.00260) (0.0026)
ΔRt 0.00379**
(0.00178)
age 0-1 X ΔRt
0.00238 0.00497
(0.00273) (0.00364)
age 1-2 X ΔRt
0.00471* 0.00707**
(0.00262) (0.00342)
age 2-3 X ΔRt
0.00394 0.00644*
(0.00333) (0.00384)
health center
0.0825
(0.0604)
health center*ΔRt
0.00352
(0.0033)
-0.108 -0.104 -0.13
(0.301) (0.302) (0.301)
female -0.105* -0.104* -0.103*
(0.0560) (0.0560) (0.0561)
Age FE YES YES YES
Month of birth FE YES YES YES
Interview Month*Year FE YES YES YES
State FE YES YES YES
Note: the dependent variable is 1 if child had diarrhea previous week.
The sample has 10,608 children aged 0-35 months in rural areas.
Standard errors clustered by village. Health center (=1 if close to household)
*** p<0.01, ** p<0.05, * p<0.1

37
TABLE 6
IMPACT OF RAINFALL SHOCKS ON HEIGHT-FOR-AGE
(1) (2) (3) (4) (5) (6)
ΔR1 0.00403 0.00330 0.00560** 0.00601** 0.00672** 0.00707**
(0.00306) (0.00300) (0.00277) (0.00279) (0.00305) (0.00301)
ΔR2 0.0114*** 0.0119*** 0.0119*** 0.0122*** 0.0126*** 0.0123***
(0.00401) (0.00402) (0.00395) (0.00398) (0.00433) (0.00440)
ΔR3 -0.00727 0.00329 0.00500 0.00541 0.00528 0.00362
(0.0126) (0.0131) (0.0134) (0.0133) (0.0149) (0.0148)
(ΔR1)2
-2.24e-05
(0.000184)
(ΔR2)2
-0.000105
(0.000235)
(ΔR3)2
0.000454
(0.000773)
ΔT1
-0.0663** -0.0675**
(0.0308) (0.0308)
ΔT2
-0.0829* -0.0816*
(0.0453) (0.0481)
ΔT3
-0.111 -0.0908
(0.132) (0.142)
0.525*** 0.471*** -0.457 -0.526 -0.637 -0.665
(0.0612) (0.0607) (0.415) (0.408) (0.416) (0.414)
female 0.245*** 0.252*** 0.264*** 0.264*** 0.267*** 0.267***
(0.0428) (0.0428) (0.0425) (0.0425) (0.0425) (0.0424)
R-squared 0.07 0.09 0.11 0.11 0.11 0.11
Age FE NO YES YES YES YES YES
Month of birth FE NO YES YES YES YES YES
Interview Month*Year FE NO YES YES NO YES YES
Season Interview*Year FE NO NO NO YES NO NO
State FE NO NO YES YES YES YES
Note: the dependent variable is the height-for-age Z-score.
The sample has 10,728 children aged 0-35 months in rural areas.
Standard errors clustered by village.
*** p<0.01, ** p<0.05, * p<0.1

38
TABLE 7
IMPACT OF RAINFALL SHOCKS ON HEIGHT-FOR-AGE BY COHORT
(1) (2) (3) (4)
1 past season X ΔR1 0.0157*** 0.0198*** 0.0208*** 0.0187***
(0.00385) (0.00467) (0.00552) (0.00655)
2 past seasons X ΔR1 -0.00490 -0.00222 -0.00333 -0.00122
(0.00443) (0.00452) (0.00601) (0.00584)
2 past seasons X ΔR2 0.0163*** 0.0221*** 0.0189** 0.0254***
(0.00459) (0.00529) (0.00742) (0.00680)
3 past seasons X ΔR1 -0.0176 -0.0108 -0.0166 -0.0113
(0.0123) (0.0142) (0.0166) (0.0226)
3 past seasons X ΔR2 0.00582 0.0138 -0.00117 0.0242
(0.00810) (0.00979) (0.0118) (0.0151)
3 past seasons X ΔR3 0.00774 0.00662 0.0400 -0.0197
(0.0139) (0.0181) (0.0250) (0.0264)
1 past season X ΔT1
-0.208*** -0.192*** -0.231***
(0.0459) (0.0610) (0.0632)
2 past seasons X ΔT1
0.0168 0.0297 0.0111
(0.0409) (0.0570) (0.0540)
2 past seasons X ΔT2
-0.148*** -0.147** -0.159**
(0.0512) (0.0681) (0.0692)
3 past seasons X ΔT1
0.393 0.0163 0.674
(0.410) (0.504) (0.683)
3 past seasons X ΔT2
0.0719 0.177 0.0500
(0.123) (0.155) (0.217)
3 past seasons X ΔT3
0.0484 -0.220 0.310
(0.204) (0.259) (0.329)
-0.392 -0.676 -0.961** -0.374
(0.410) (0.418) (0.486) (0.491)
female 0.263*** 0.265***
(0.0424) (0.0426)
R-squared 0.112 0.113 0.125 0.108
Age FE YES YES YES YES
Month of birth FE YES YES YES YES
Interview Month*Year FE YES YES YES YES
State FE YES YES YES YES
Note: the dependent variable is the height-for-age Z-score. (3) only boys, and (4) only girls.
The sample has 10,728 children aged 0-35 months in rural areas.
Standard errors clustered by village. *** p<0.01, ** p<0.05, * p<0.1

39
FIGURE 1
NONLINEARITIES AND CLIMATE VARIABILITY
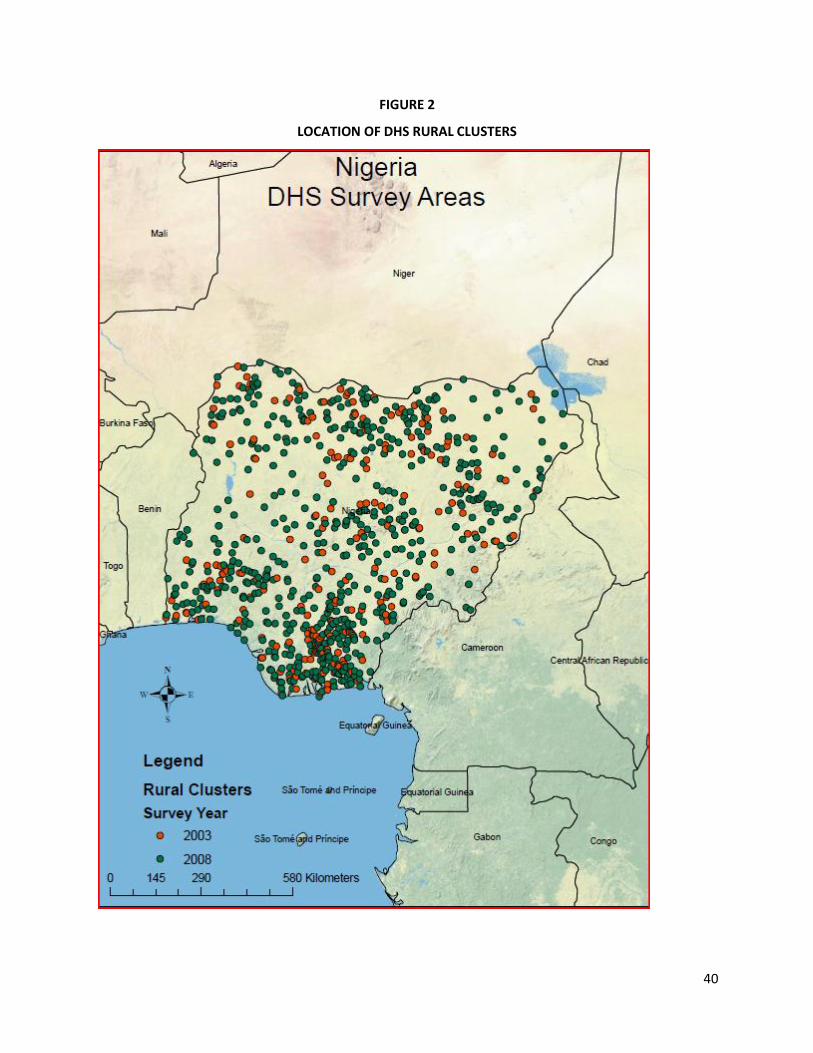
40
FIGURE 2
LOCATION OF DHS RURAL CLUSTERS

41
FIGURE 3
Z-SCORES (RURAL AREAS)
(a) height-for-age
(b) weight-for-height
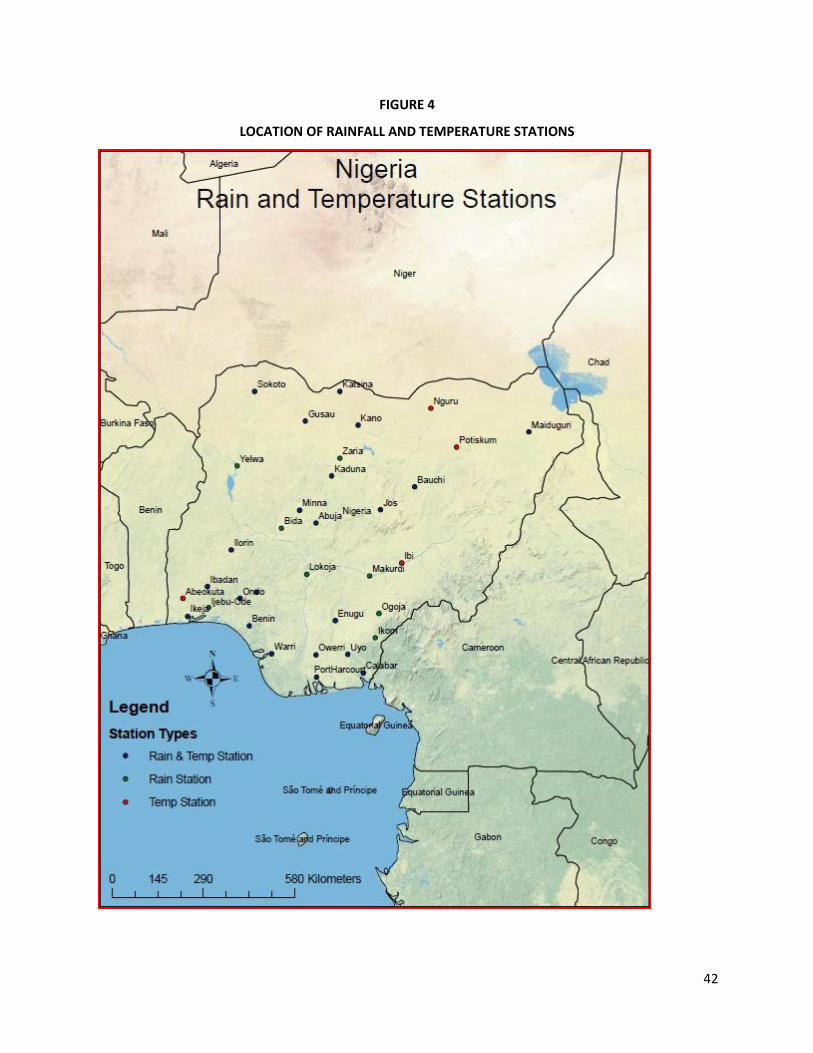
42
FIGURE 4
LOCATION OF RAINFALL AND TEMPERATURE STATIONS
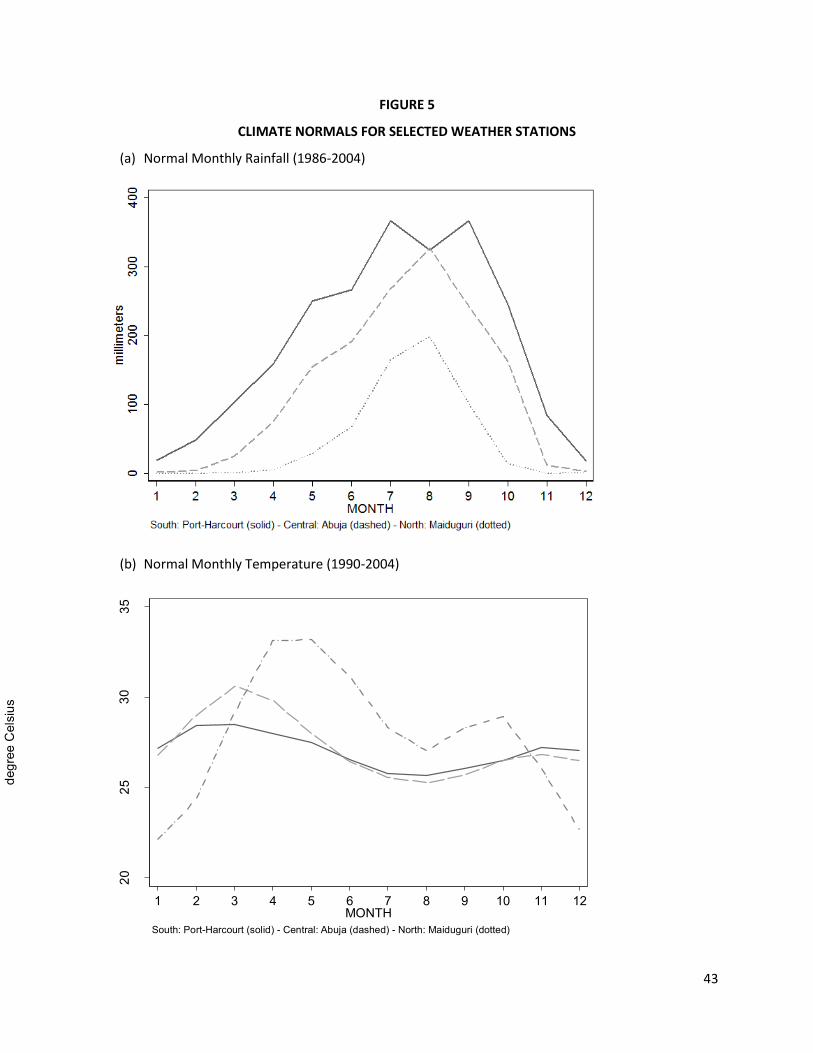
43
FIGURE 5
CLIMATE NORMALS FOR SELECTED WEATHER STATIONS
(a) Normal Monthly Rainfall (1986-2004)
(b) Normal Monthly Temperature (1990-2004)
2025
3035
degr
ee C
elsi
us
1 2 3 4 5 6 7 8 9 10 11 12MONTH
South: Port-Harcourt (solid) - Central: Abuja (dashed) - North: Maiduguri (dotted)
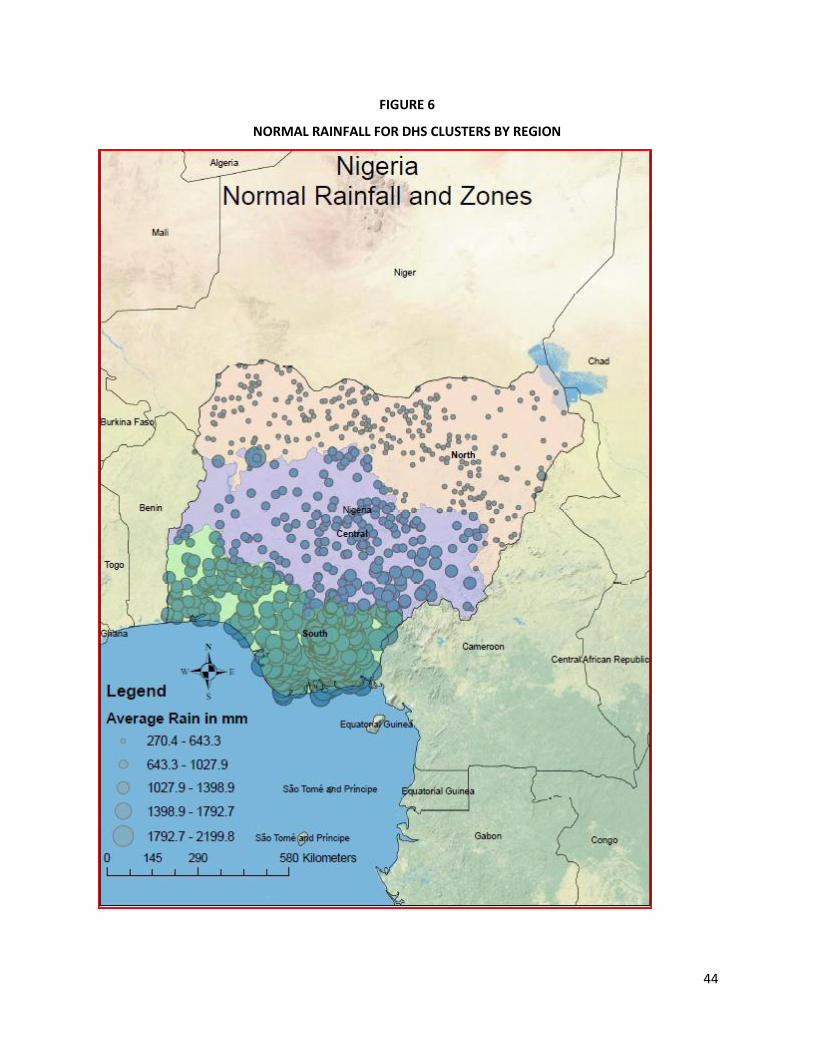
44
FIGURE 6
NORMAL RAINFALL FOR DHS CLUSTERS BY REGION
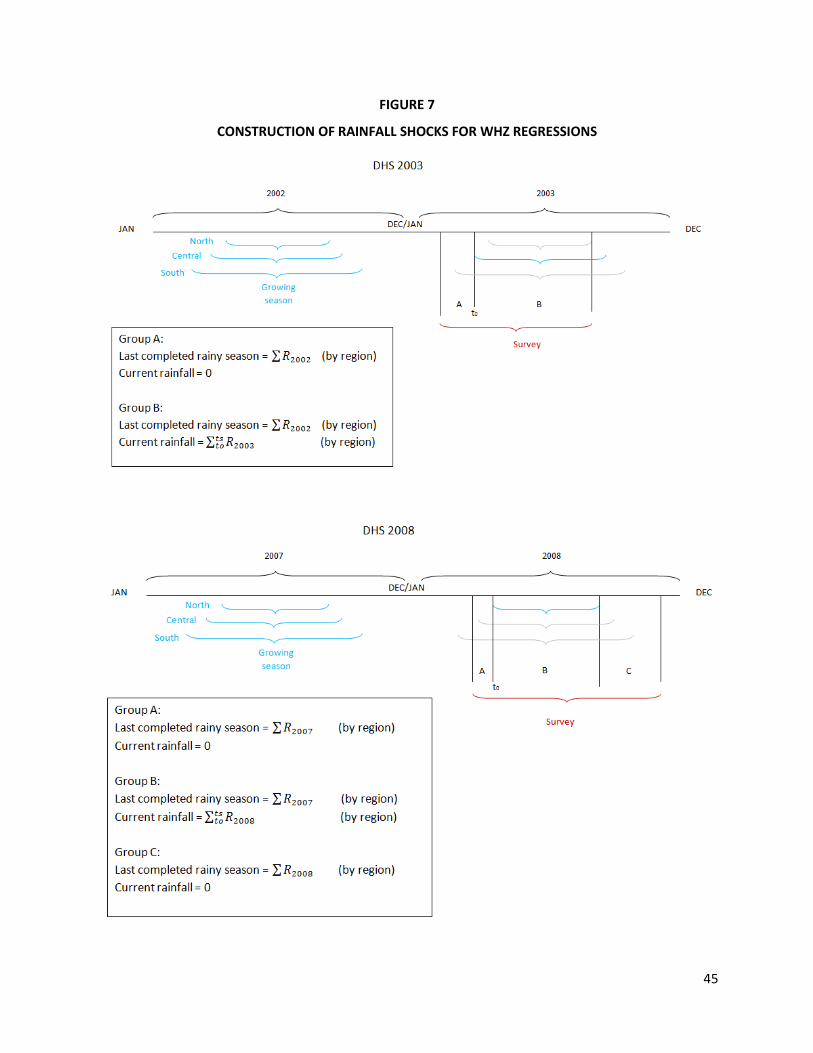
45
FIGURE 7
CONSTRUCTION OF RAINFALL SHOCKS FOR WHZ REGRESSIONS

46
FIGURE 8
WEATHER SCHOKS FOR WEIGHT-FOR-HEIGHT ANALYSIS
(a) Last completed season
(b) Current season (only for those children born during rainy season)
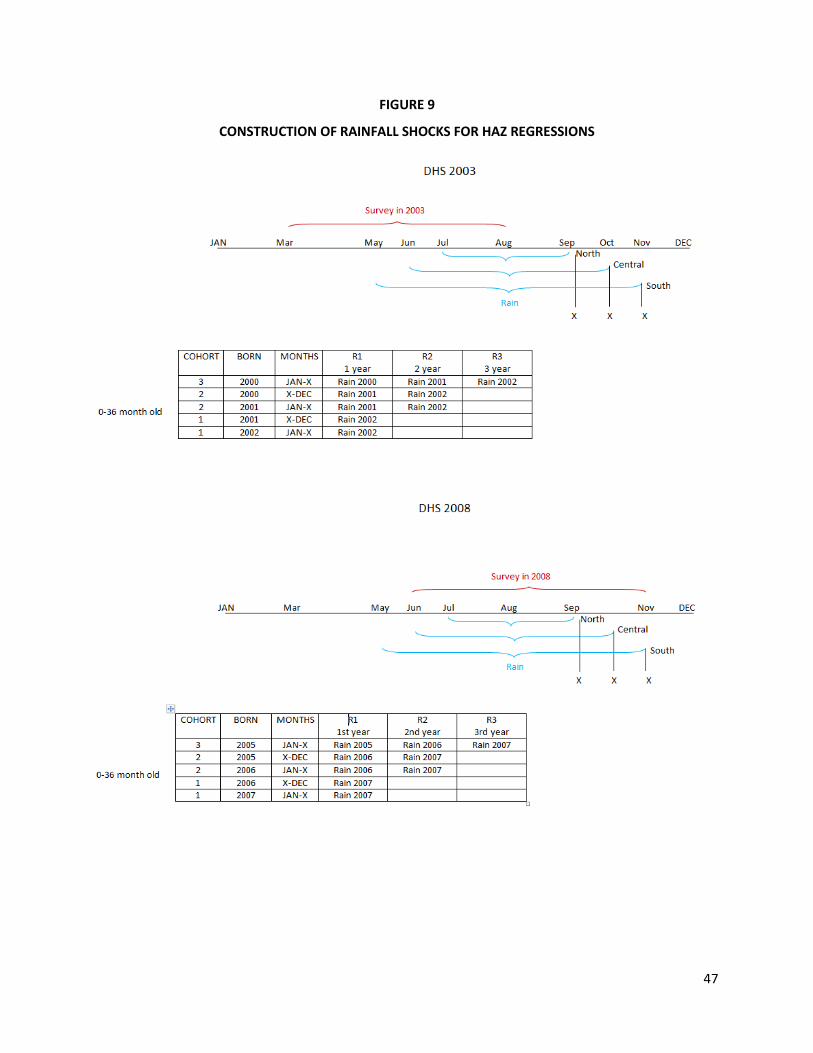
47
FIGURE 9
CONSTRUCTION OF RAINFALL SHOCKS FOR HAZ REGRESSIONS
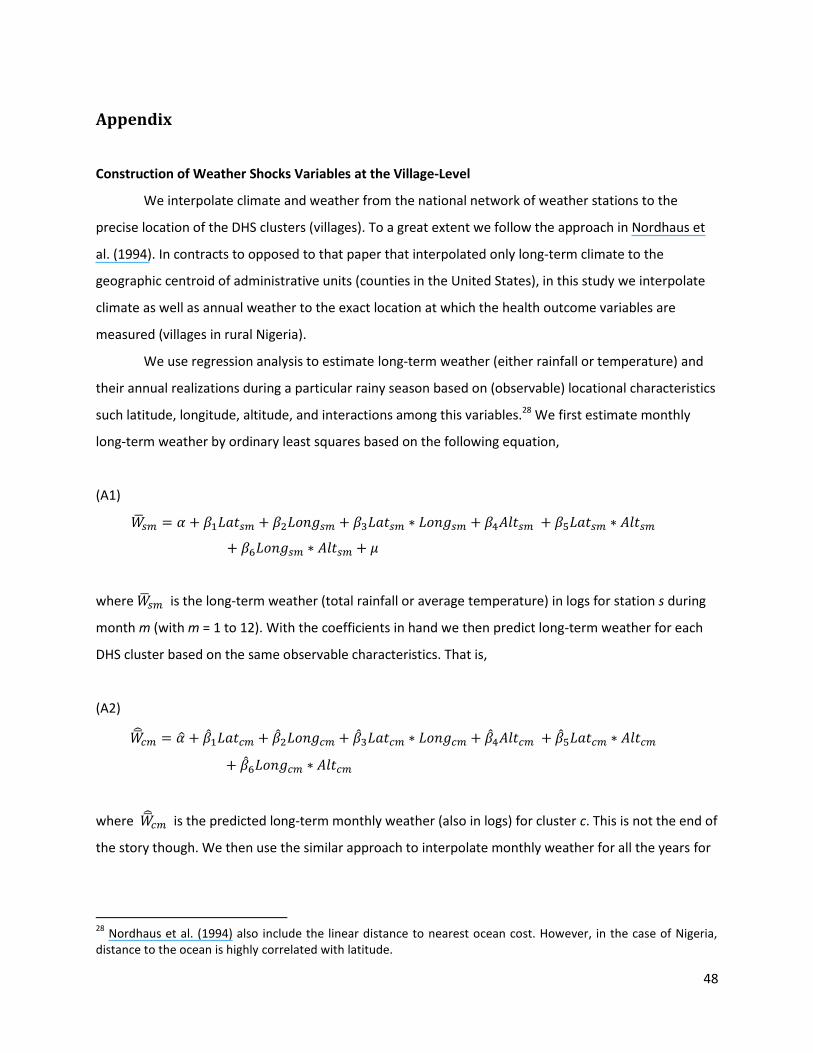
48
Appendix
Construction of Weather Shocks Variables at the Village-Level
We interpolate climate and weather from the national network of weather stations to the
precise location of the DHS clusters (villages). To a great extent we follow the approach in Nordhaus et
al. (1994). In contracts to opposed to that paper that interpolated only long-term climate to the
geographic centroid of administrative units (counties in the United States), in this study we interpolate
climate as well as annual weather to the exact location at which the health outcome variables are
measured (villages in rural Nigeria).
We use regression analysis to estimate long-term weather (either rainfall or temperature) and
their annual realizations during a particular rainy season based on (observable) locational characteristics
such latitude, longitude, altitude, and interactions among this variables.28 We first estimate monthly
long-term weather by ordinary least squares based on the following equation,
(A1)
where is the long-term weather (total rainfall or average temperature) in logs for station s during
month m (with m = 1 to 12). With the coefficients in hand we then predict long-term weather for each
DHS cluster based on the same observable characteristics. That is,
(A2)
where is the predicted long-term monthly weather (also in logs) for cluster c. This is not the end of
the story though. We then use the similar approach to interpolate monthly weather for all the years for
28
Nordhaus et al. (1994) also include the linear distance to nearest ocean cost. However, in the case of Nigeria, distance to the ocean is highly correlated with latitude.

49
which we need to calculate rainfall deviations (see Figures 7 and 8). For that we estimate the following
regressions,
(A3)
where is the monthly weather (total rainfall or average temperature) in logs for station s during
month m in year t (with t = 2000, 2001, 2002, 2005, 2006, 2007, and 2008). We then predict monthly
weather for each DHS cluster.
(A4)
where is the predicted monthly weather (total rainfall or average temperature) in logs for cluster c
during month m in year t.
Finally, we calculate the rainfall deviation from the long-term rainfall
considering the lengths of the rainy season for each one of the three regions in which we have divided
the country. That is, for the north we sum total precipitation during July and August (m = 7, 8), for the
central region we took June to September (m = 6, 7, 8, and 9), and lastly, for the southern part of the
country we consider the growing season to last from May until the end of October (m = 5, 6, 7, 8, 9, and
10). For the case of temperature shocks, we follow a similar procedure but we took the average
temperature during the relevant periods.
Related Documents