ATMOSPHERE The atmosphere is the layer of gases that surrounds the Earth and makes life possible on the planet. It extends for thousands of kilometres. Its composition is mainly nitrogen and oxygen, but also argon, carbon dioxide and other gases (hydrogen, ozone, methane and water vapour). The atmosphere is divided into layers. These layers include the troposphere, stratosphere, mesosphere, thermosphere and exosphere. The temperature, thickness and composition of each layer is different.

Welcome message from author
This document is posted to help you gain knowledge. Please leave a comment to let me know what you think about it! Share it to your friends and learn new things together.
Transcript

ATMOSPHERE
The atmosphere is the layer of gases that surrounds the Earth
and makes life possible on the planet. It extends for thousands
of kilometres. Its composition is mainly nitrogen and oxygen,
but also argon, carbon dioxide and other gases (hydrogen,
ozone, methane and water vapour).
The atmosphere is divided into layers. These layers include the
troposphere, stratosphere, mesosphere, thermosphere and
exosphere. The temperature, thickness and composition of
each layer is different.

https://es.tiching.com/link/15864?v=1
Animation
LAYERS OF THE ATMOSPHERE

Weather describes the condition of the atmosphere. It might be sunny, hot,
windy or cloudy, raining or snowing.
Climate means the average weather conditions in a particular location
based on the average weather experienced there over 30 years or more.
The weather takes into account the temperature, precipitation, atmospheric
pressure and wind of the part of atmosphere (air) closest to the surface of the
earth.

TEMPERATURE
THERMOMETER
Fuente: Banco de imágenes del
CNICE
• It is the amount of heat in the atmosphere
• We measure it with the thermometer.
• It is expressed in degrees centigrade.


Factors affecting temperature are:
Latitude or distance from the equator
Latitude is the main factor affecting global
climate - the further you go from the equator,
the cooler it gets. This is because the earth in
curved which means that the sun's energy is
more concentrated at the equator. This, and
the thinner atmosphere at the equator, means
that the earth gets hotter here.
Altitude or height above sea level
Temperatures decrease by 0,6 degrees
celsius for every 100 metres increase in
altitude. Mountainous areas are therefore
cooler.

Distance from the sea
Oceans heat up and cool down much more slowly
than land. This means that coastal locations tend
to be cooler in summer and warmer in winter than
places inland at the same latitude and altitude.
Glasgow, for example, is at a similar latitude to
Moscow, but is much milder in winter because it is
nearer to the coast than Moscow.
Prevailing winds and ocean currents
The prevailing wind is the most frequent
wind direction a location experiences.
Winds take on the characteristics of their
source region.
Ocean currents can be warm or cold, and
they affect the temperature of coastal
areas.

Air Masseshttp://www.metoffice.gov.uk/education/secondary/students/airmasses.html


DISTRIBUTION IN THE EARTH
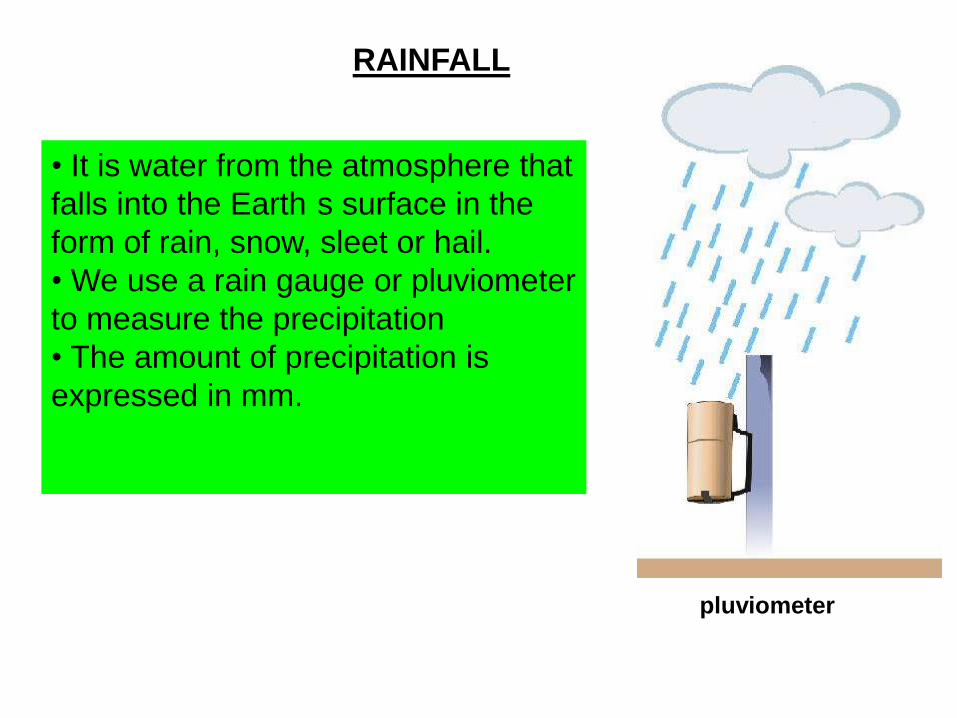
RAINFALL
pluviometer
• It is water from the atmosphere that
falls into the Earth s surface in the
form of rain, snow, sleet or hail.
• We use a rain gauge or pluviometer
to measure the precipitation
• The amount of precipitation is
expressed in mm.

The atmosphere contains water vapour. The amount
of water vapour in the air is called the humidity. Low
humidity means that the air is dry and high humidity
means that the air is moist.
When humid air rises, it cools and it produces
condensation, forming small droplets of water, which
form clouds. For precipitation to occur, the droplets
must become bigger and heavier. When this happens,
thet fall (precipitation) onto the Earth s surface.

http://www.curriculumbits.com/prodimages/details/geography/types-of-rainfall.html
Cloud (liquid water)
Water vapour
Condensation level
Altitude at which temperatures reach
dew point and therefore air starts to
condensate
Warm, moist air rises and it cools. As cool air can't hold as
much water vapour as warm air, the water vapour condenses
and turns into water droplets.
We get rain because of rising air.

The amount of precipitation varies from one zone to another,
depending on factors as latitude, altitude, and proximity to
the sea.


Relief Rainfall
With relief rainfall, it is the presence of hills or mountains that leads to the warm aid
rising.
The winds pick up moisture from the sea as they pass over it, and this makes the air
moist. As the air rises to pass over the higher land, it cools and the water vapour
condenses, forming clouds. The droplets then fall as rain, sleet, hail, or snow,
depending on the atmospheric conditions.
On the leeward side of the mountain (the side not facing the wind), it is much drier. This
area is said to be in the 'rainshadow'. There is little rain here as the air is descending
and warming up.
http://www.youtube.com/watch?v=BVykQf
RC_aI&feature=player_embedded


Convectional Rainfall
This is very common in areas where ground is heated by the hot sun, such as the
Tropics.
The sun heats up the ground, which heats the air above it. This then rises and cools,
and the water vapour condenses into water droplets, forming clouds. The droplets
falls as rain under the influence of gravity.
http://www.youtube.com/watch?v=RkgThul2El8&feature=player_embedded


Frontal Rainfall
Frontal rainfall is associated with depressions. It happens when two air masses (a warm
one and a cold one) meet. The warm air is pushed upwards over the cold air, and, as it
rises, it cools down. The water vapour condenses to form clouds, which give rain.
http://www.youtube.com/watch?v=D88dYNFyBq8&feature=
player_embedded


•Air pressure is the force exerted by air particles. The air around us
pushes on us and every other thing (but our bodies and objects push
back with equal force so we don't notice it).
•We measure pressure with a barometer
•Pressure is expressed in milibars (mbar). Normal pressure at sea level
is 1013 mbar.
AIR PRESSURE

A low pressure system,
or "low," is an area where
the atmospheric pressure
is lower than that of the
area surrounding it.
A high pressure system, or
"high," is an area where the
atmospheric pressure is greater
than that of the surrounding
area.
Cold front
represented
with blue
triangles
(cold sector) Warm front
represented
with red
semicricles
(waarm sector)

L H
Lows are usually associated with high
winds, warm air, and air rising. Because
of this, lows normally produce clouds,
precipitation, and other bad weather
such as tropical storms and cyclones.
They are associated with dry, bright
and settled weather.
http://www.juicygeography.co.uk/downloads/flash/lowpressure.swf
http://www.juicygeography.co.uk/downloads/flash/highpressure.swf


Areas of equal pressure are connected using isobars. They
never cross.

Lows: inspiraling, upspiraling,counter-
clockwise in north, clockwise in south; stormy
weather
Highs: outspiraling, downspiraling,
clockwise in north, counter-clockwise in
south; fair weather
Isobars also show us the direction of the air.


H
H
L
Air moves from a high pressure area toward a low pressure area.


Closely-spaced isobars =
strong winds
Widely spaced isobars =
light winds

Pressure-Gradient Force

How depressions form?
•Depression is a low-pressure system.
•A depression forms when cold polar air meets warm tropical air at a front. The
less dense warm air starts to rise over the colder air, and this starts to lower the air
pressure.
The boundary between the two masses is called a front. There are 2 fronts in a
typical depression:
1. the warm front - this passes first, and has the warm air behind it (i.e. it is
the front of the warm air). It is where the advancing warm air is forced to rise
over the cold air
2. the cold front - this follows, and has the cold air behind it (i.e. it is the front
of the cold air). This is where the advancing cold air undercuts the warm air in
front of it. http://www.phschool.com/atschool/phsciexp/active_art/weather_fronts/

•Describe the weather through a depression
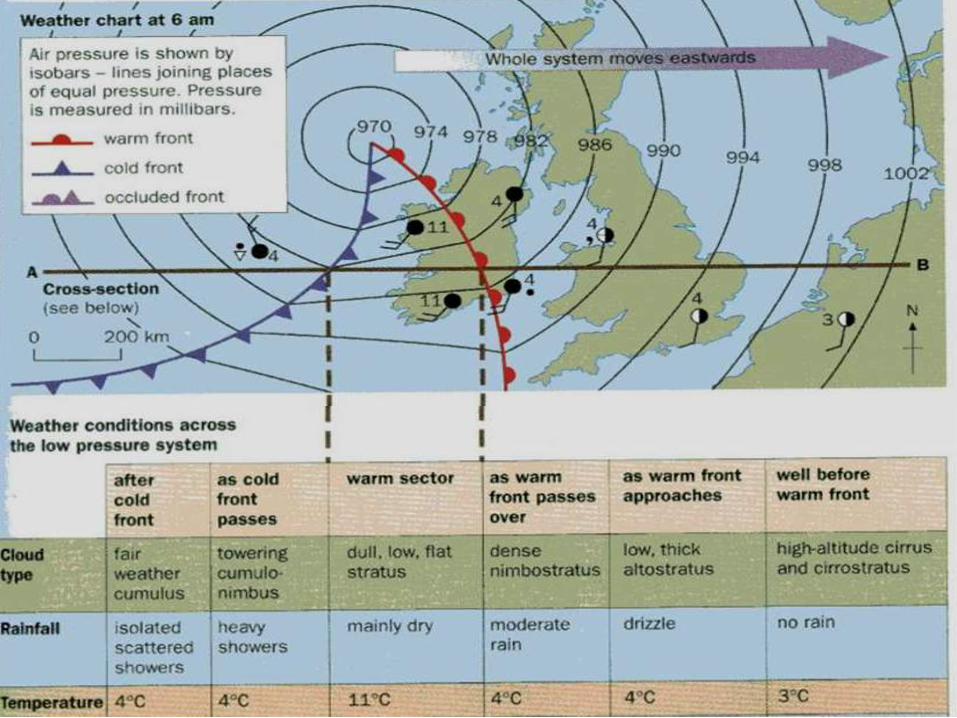

On a weather map, the warm front is shown as red semi-circles and the cold
front as blue triangles.

How anticyclones form?
•Anticyclones are areas of high pressure caused by air sinking towards the ground.
• Once anticyclones develop, they tend to remain for several days, bringing dry,
bright and settled weather.
This image shows an anticyclone over Spain on 31st January 1999.

Summer Anticyclones
Summer anticyclones bring hot and sunny
weather due to clear skies (because of the
descending air). The days are long and the
sun high in the sky, which gives plenty of
opportunity for the land to be heated up.
These conditions could therefore lead to
convectional rainfall occurring.
Winter Anticyclones
Winter anticyclones bring clear days too. However
the sun is low in the sky and the days are short,
meaning you get cool days. Clear skies on a
winter’s night will allow frost to form. The land
quickly loses heat during the night, as there is no
cloud cover to act as insulation. The rapidly cooling
ground cools and condenses any moisture in the air
above it, forming droplets of ice when the
temperature falls below freezing. This is frost.
Fogs are also caused by clear winter nights. The
ground loses heat. This cools the air above it
causing moisture to condensate around dust
particles in the layer of air closest to the ground
surface. This is fog.
Winter Summer
Pressure High High
Temperature Very cold Very warm
Clouds/Rainfall No No
Wind Calm Calm
Other weather
conditions
Frost/fog Heat waves/drought

•Two different views of a depression NW of UK with an anticyclone to the SE


https://www.youtube.com/watch?v=bd7DcVnrSL8
ISOBAR
WARM FRONTS
OCCLUDED FRONT
L L
L
L
H
L
L
C
WC
C
WW
COLD FRONTS


Heavy
rainrain Heavy
rain
rain
Heavy
rain rain
rain

WIND
• It is the movement of air from areas of
high pressure to areas of low pressure.
• We measure wind with the wind gauge
(anemometer) in metres per second m/s
or km/hour. A weather vane shows the
direction of the wind.
a) Anemometre
b)- Weather vane

Most common types of winds
PREVAILING WINDS
Prevailing winds always blow in the
same direction. For exmple, trade winds
always blow from the tropics toward the
equator.
http://cienciasnaturales.es/CIRCULACIONATMOSFERICA.swf
Trade winds
Westerlies
East winds

PERIODIC WINDS, such as the monsoons in south and south-east Asia.
Monsoons change direction seasonally. In
summer, they blow from the Indian Ocean towards
the continent and bring abundant rain. In winter,
monsoons blow from the continent towards the sea
and bring dry stable weather.

SYNOPTIC WINDS, change daily, such as sea breezes
Sea breezes blow from the sea
towards the land by day. At
noght, they blow from the land
towards the sea.
BREEZE
BREEZE
COOLER
WARM
WARM
COOLER

How do weather and climate affect peoples' lives?
Weather and climate can have a major
effect on people's lives, for example:
Farming –
there is a direct link between the type of agriculture
and climate. For example, inland Spain has a drier
climate than coastal, with more contrasted
temperatures between winter and summer.
Northern Spain has a much wetter climate. Arable
crops tend to be rain-fed in centered areas, and
pastoral farming dominates in the north. Irrigated
crops grow in the east.
Housing –
in particularly hot climates, buildings may be painted
white to reflect the heat. Houses in cold climates are
often built on stilts to insulate them from the freezing
ground.
Sources of energy –
particularly windy areas have plenty of potential for wind farms.
Sport and leisure opportunities –
The Jamaican bobsled team of the film Cool
Runnings weren't too successful!
Why might this be?
http://www.youtube.com/watch?v=aaov7DNICPg&fe
ature=player_embedded
Water supply – for example, most of the UK s
population live in the south and east, which is
relatively dry. Water has to be transferred from
reservoirs in the wetter west.
Snow and Ice - in areas where snow and ice are
rare, even a small snowfall can lead to chaos on the roads. Schools may even be closed for the day!

How do weather and climate affect peoples' lives?
Tourism
Holidays in the Mediterranean
The graph shows the percentage of outbound
visitors to visit the top 10 destinations in 2003.
This graph shows the average temperatures in the UK and
Costa Blanca, and the average number of hours of sunshine.
To what extent do you think UK travel agents are justified in
using the slogan 'Come to Benidorm for your winter
break!'.
How does the Mediterranean climate differ from the UK
climate?


Unit of measurement is Celsius
Temperatures are represented with the red line and can be read in this axis
Precipitation in August is 5 mm. We can say the climate in this place is very dry.
Rainfall is represented with blue columns and can be read in this axis
Where do we find temperatures? Where do we find rainfall?
Example to read the rainfall in August.
Example to read the temperatures in August.
dryness
Temperature in August is 27ºC. This month is the hottests month of the year.
When the line of temperature is above the columns of rainfall, it marks a period of dryness, as it is shown in this graph.

Climate graphs are a combination of a bar graph and a line graph. Temperature is shown on a line graph,
with the figures being shown on the right side of the graph. Rainfall is shown by a bar graph, with the figures
being shown down the left side of the graph.
The climate graph below shows average annual rainfall and temperature throughout the year for a particular
area.
Climate Graphs
Interpreting climate graphs
Temperature data
Is the temperature the same all year round? If it is different, how
many seasons does the location experience?
Which season is the warmest? Is it warm (10 to 20 C), hot (20 to
30 C) or very hot (above 30 C)?
Which season is the coolest? Is it mild (0 to 10 C), cold (-10 to 0 C)
or very cold (below -10 C)?
What is the range of temperature? (Subtract the minimum
temperature from the maximum temperature).
Rainfall data
Does the rainfall occur all year round?
What is the pattern of the rainfall? Check which season(s) is/are drier
or wetter than others.
What is the total annual rainfall? Add each month's total together to
get the annual total.
Then put the rainfall and temperature information together - what
does it tell you about this area?
Describe the patterns in temperature and rainfall, including how they relate
to each other. You now have a description of the climate.
http://www4.uwsp.edu/geO/faculty/ritter/interactive_climat
e_map/climate_map.html

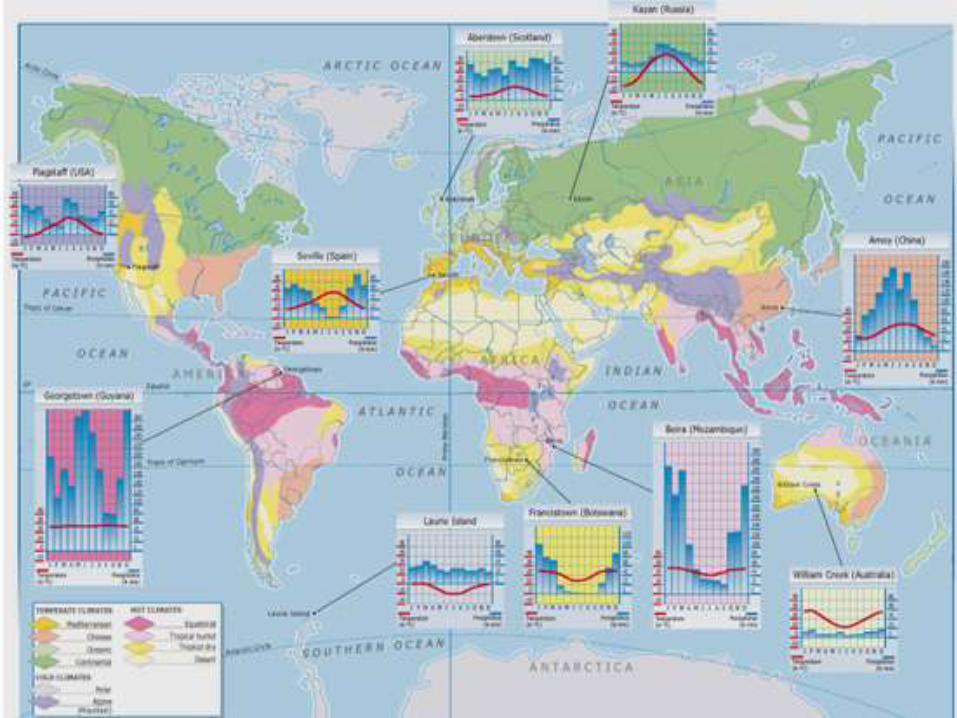
TYPE OF
CLIMATE TEMPERATURES PRECIPITATIONS VEGETATION
EQUATORIALTemperatures are high
throughout the year
(around 26 C in January
and 24 C in July)
Low temperature range
from 3 to 5 ºC
Abundant throughout
the year, + 1.500 mm
annually. There is no
dry season.
Rainforest. Dense forest
of evergreen trees
TROPICAL
Average temperatures +
18ºC
Low temperature range
from 5 to 10 ºC
There are two seasons
humid/dry
(750-1.500 mm
annually)
Savannah. Very tall grass
in the rainy season,
which dries up in the dry
season.
Steppes (short thinly
scattered grass) in the
areas where the dry
season lasts longer.
DESSERT Temperature range + 10
ºC
Temperatures very high
(+25ºC)
Precipitation is very
rare. (less than 250
mm annually)
Short, widely spaced
grass, thorny shrubs,
cactus. In the oases there
are palm trees.

TYPE OF
CLIMATETEMPERATURES PRECIPITATIONS VEGETATION
MARITIME Moderate throughout the
year, mild in winter, cool in
summer.
Temparature range 10ºC
Abundant thoughout
the year.
(+ 1.000 mm
annually)
Deciduous forest
(beeches, oaks, lime
trees, etc) that lose their
leaves in autumn and
winter. Moors in non-
forested areas and
grasslands.
CONTINENT
AL
Very contrasting
temperatures (cold winters,
and hot summers )
Temperature range + 20ºC
Between 300-1000
mm annually, mainly
in summer
Coniferous forest (taiga)
with trees like pines and
firs, grasslands and
steppes.
MEDITERRA
NEAN
Temperatures are mild in
winter and hot in summer.
Summers are very
dry. Precipitation
more abundant in
spring and fall
(300-1.000 mm)
Maditerranean forest
(holm oaks and cork
oaks) and scrubland. Also
pines.

TYPE OF
CLIMATETEMPERATURES
PRECIPITATION
SVEGETATION
POLAR Very cold thorughout the
year
(not exceeding 0ºC)
Precipitation is very
rare (less than 250
mm a year)
Tundra, moss, lichen and
dwarf shrubs
ALPINE Temperature falls with
altitude. Winters cold,
summers cool
Precipitation
increases with
altitude
(+ 1000 mm
annually)
Varies with altitude

HOT CLIMATES

TEMPERATE CLIMATES

COLD CLIMATES
• POLAR • ALPINE

Low-latitude Landscapes:
RAINFOREST SAVANNAH DESERT
Mid-latitude Landscapes :
High-latitude Landscapes :
TAIGA TUNDRA ALPINE
MEDITERRANEAN STEPPEDEIDUOUSFOREST
Related Documents