Wealth Management An Unbiased Approach to Managing Your Investments Designed for the Affluent Investor

Welcome message from author
This document is posted to help you gain knowledge. Please leave a comment to let me know what you think about it! Share it to your friends and learn new things together.
Transcript

Wealth ManagementAn Unbiased Approach to Managing Your Investments Designed for the Affluent Investor

Basics of InvestingFundamental Principle of Investing
RISK
EXPE
CTED
RET
URN
LOW HIGH
CASH
BONDS
STOCKS
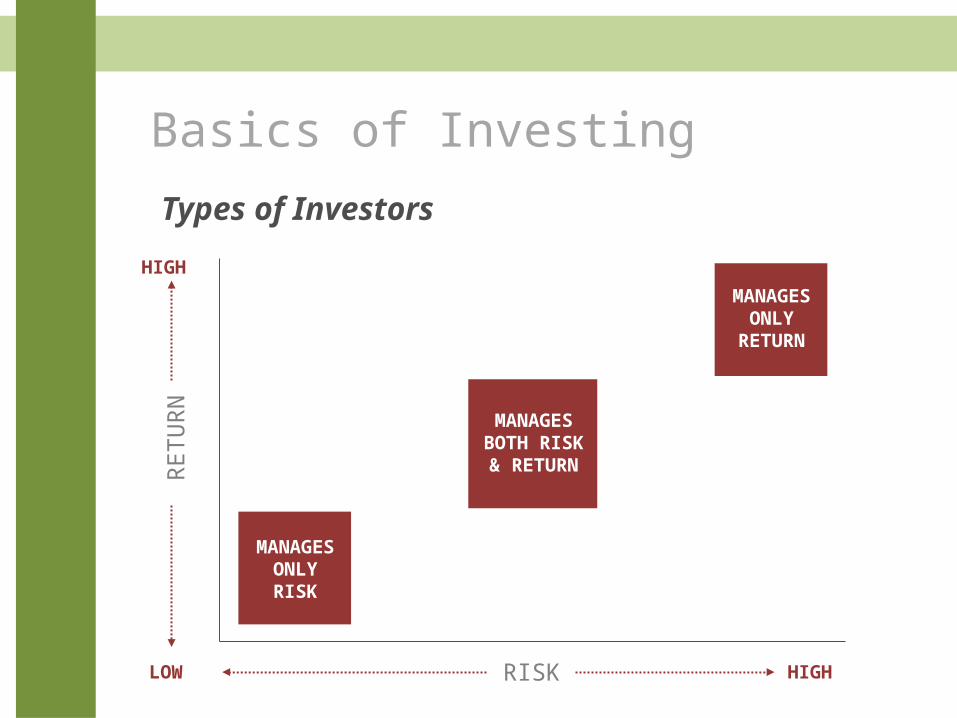
Basics of Investing
Types of Investors
RISK
RETU
RN
LOW HIGH
HIGH
MANAGESONLYRISK
MANAGESBOTH RISK& RETURN
MANAGESONLY
RETURN

Something to Consider:
“Stocks have outperformed fixed income securities over time.
Why not always invest in stocks for future funding?”
Answer: Time Horizon and Risk Tolerance evolve with age

The impact
of risk on retirement
income
© American Funds Distributors, Inc.

The impact of risk on retirement income
The primary concern for most investors is the possibility of permanently losing their money. Such a loss can prevent them from reaching their financial goals..
Whether investing to meet a long-term objective or taking retirement income from their investments, it’s critical that investors recognize the risks they face and try to manage them with the help of their financial adviser.
During retirement, if market volatility becomes magnified and time to recover losses becomes compressed, the margin for error narrows. That’s why it’s important for investors at this stage to seek retirement-income strategies that can be resilient when markets decline and can generate consistent streams of income.
© American Funds Distributors, Inc.

Some Assumptions Do Not Apply
Before RetirementCash flow not an issue
Known time horizon
Risk = standard deviation
Cash flow is critical
Unknown time horizon
Risk = loss of capital
During Retirement

Why Do We Invest? To satisfy a current goal
To satisfy a future goal
Goals Drive Investments,
Investments DO NOT Drive Goals
Basics of Investing

Asset Allocation OverviewWhat type of investor are you?Influencing Factors:
Age, Retirement Goals and Horizon, Investment Experience, Personality
Source: Investopedia.com
Fixed Income
Equities
Cash Equivalents
Fixed IncomeEquities
Cash EquivalentsFixed
Income
Equities
Cash EquivalentsFixed Income
Equities
Cash Equivalents
Less Risk More Risk
Conservative Moderate Aggressive Very Aggressive

The Common Approach:
Aggressive
I don’t want to lose any money, but if I can still
make a little money, that’s great!
I want to make money and I don’t mind taking a few risks to make it happen. I want to make the most
money possible! I am willing to take whatever risks
needed to make it happen!
Conservative
Moderate
Determining Your Risk Tolerance

Determining Your Risk ToleranceThe Expanded Approach:
Risk Questionnaires
Your Age and Time Horizon
Your Assets and Savings Potential
Your Level of Comfort
Your Spending Level
Risk is approached from two different directions
1. How much risk do I need to take?
2. How much risk do I want to take?
I need to consider several factors to determine my true
risk tolerance…

Objective – Buy a New Home
DougAccumulation period: One yearDistribution period: One-time distribution
Sample Portfolio – Accumulation Phase
This sample portfolio is for illustrative purposes only. Please consider individual objectives, risk tolerance and time horizon.
© American Funds Distributors, Inc.AI-30038
Bonds
Growth-and-Income
Equity-Income/ Balanced

Objective: Save for Child’s College Education
JanetAccumulation period: 15 yearsDistribution period: 4 years
Equity-income/balanced
Bonds
Growth-and-income
Growth
This sample portfolio is for illustrative purposes only. Please consider individual objectives, risk tolerance and time horizon.
© American Funds Distributors, Inc.AI-30038
Sample Portfolio – Accumulation Phase

Objective: Invest for Retirement
RicardoAccumulation period: 20 yearsDistribution period: 20+ years
Growth-and-income Growth
Equity-income/balanced
This sample portfolio is for illustrative purposes only. Please consider individual objectives, risk tolerance and time horizon.
© American Funds Distributors, Inc.AI-30038
Sample Portfolio – Accumulation Phase
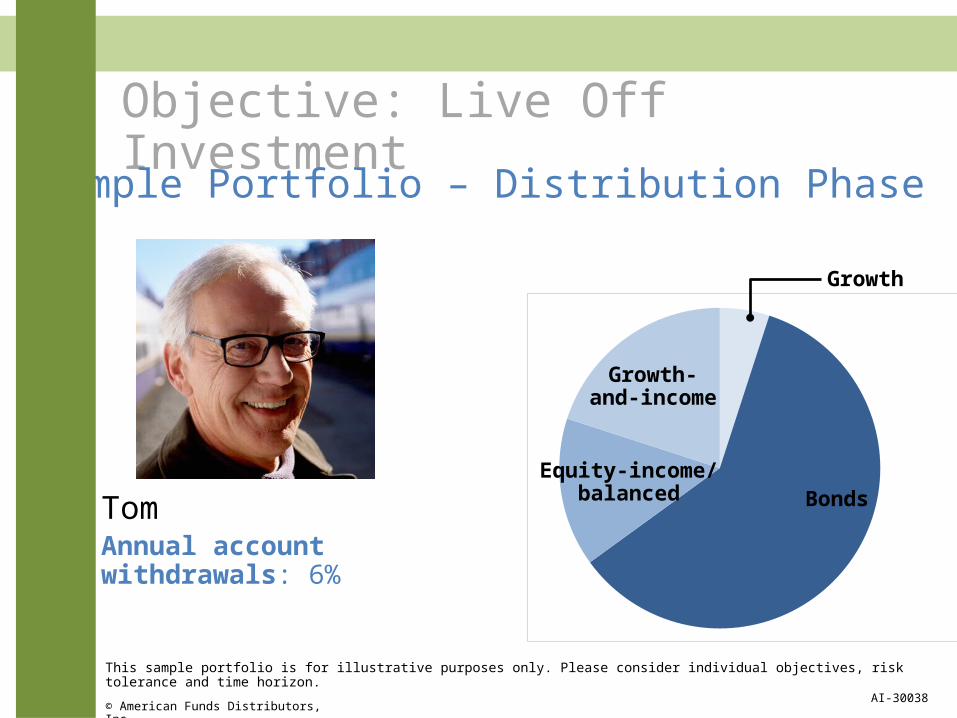
Objective: Live Off Investment
TomAnnual account withdrawals: 6%
Equity-income/balanced Bonds
Growth-and-income
Growth
Sample Portfolio – Distribution Phase
This sample portfolio is for illustrative purposes only. Please consider individual objectives, risk tolerance and time horizon.
© American Funds Distributors, Inc.AI-30038

Objective: Supplement Existing Income
LoriAnnual account withdrawal: 3%
Bonds
Growth-and-income
Equity-income/balanced
Growth
This sample portfolio is for illustrative purposes only. Please consider individual objectives, risk tolerance and time horizon.
© American Funds Distributors, Inc.AI-30038
Sample Portfolio – Distribution Phase

Basics of InvestingEffect of Variability
PORTFOLIO A PORTFOLIO B
First Year Return Gain 30% Gain 10%Value After First Year $1,300,000 $1,100,000Second Year Return Loss 10% Gain 10%Value After Second Year $1,170,000 $1,210,000
Average return for each portfolio was 10% per year. Portfolio B with a stable return had a real dollar return which was $40,000 greater than Portfolio A
RULE: Given 2 portfolios with the same arithmetic return the portfolio with the lowest volatility will always have the highest real dollar return.
For illustrative purposes only. This chart does not reflect the performance of any specific investment.
Original Value $1,000,000 $1,000,000

Not in Hard Copies: Variance Drain• Here’s an example:
– Using coin-flipping– 50% chance of coming up heads or tails– In the experiment, heads doubles your money and tails loses half your money
Head 100%Tails -50%Heads 100%Heads 100%Tails -50%Heads 100%Tails -50%Tails -50%Heads 100%Tails -50%
Average 25%
Seems highly profitable right?

Variance drain: Average Return• Let’s put some money to the numbers and see
– For the experiment, we will start with $2000
Head 100% $4000Tails -50% $2000Heads 100% $4000Heads 100% $8000Tails -50% $4000Heads 100% $8000Tails -50% $4000Tails -50% $2000Heads 100% $4000Tails -50% $2000
Return 0%
You started with $1000 and ended with $1000• How is that possible?• Your average return was 25%,
but your compounded return is 0

Variance drain: Compounded Return– Volatility is reduced by lowering the risk you take– In this experiment, you will only commit half of your
capital, thereby halving your risk
Investment: $1000
Half BalanceReturn
Head 50% $1500Tails -25% $1125Heads 50% $1688Heads 50% $2531Tails -25% $1898Heads 50% $2848Tails -25% $2136Tails -25% $1602Heads 50% $2403Tails -25% $1802
Total Return 80%
After 10 flips, you had a total return of 80%, or 6.1% compounded per flip• You netted a profit of
$800 on this investment so far

The Impact of Volatility
Impact on a Hypothetical $100,000 PortfolioYear 1
ReturnYear 2
ReturnAverage
ReturnCompound
ReturnValue at End
of Year 2
Portfolio #1 50% -50% 0% -13.4% $75,000
Portfolio #2 10% -10% 0% -0.5% $99,000
For illustrative purposes only.
Image Source: http://www.saturdayeveningpost.com/2010/07/26/in-the-magazine/finance/investing-america.html

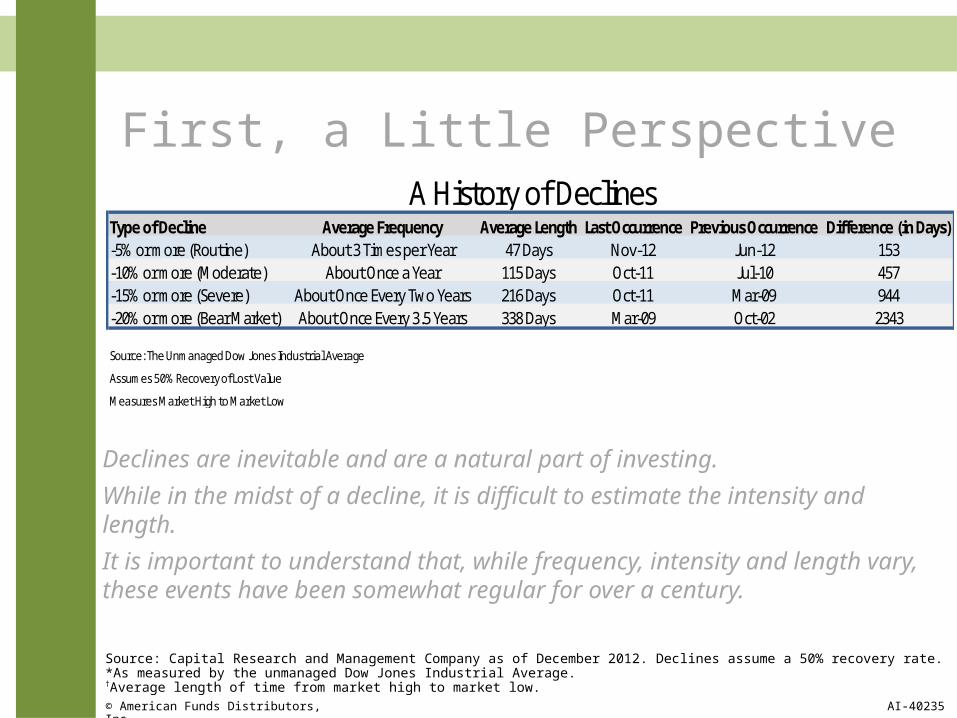
First, a Little Perspective
Source: Capital Research and Management Company as of December 2012. Declines assume a 50% recovery rate.*As measured by the unmanaged Dow Jones Industrial Average. †Average length of time from market high to market low.© American Funds Distributors, Inc. AI-40235
Type of Decline Average Frequency Average Length Last Occurrence Previous Occurrence Difference (in Days)-5% or more (Routine) About 3 Times per Year 47 Days Nov-12 Jun-12 153-10% or more (Moderate) About Once a Year 115 Days Oct-11 Jul-10 457-15% or more (Severe) About Once Every Two Years 216 Days Oct-11 Mar-09 944-20% or more (Bear Market) About Once Every 3.5 Years 338 Days Mar-09 Oct-02 2343
Source: The Unmanaged Dow Jones Industrial Average
Assumes 50% Recovery of Lost Value
Measures Market High to Market Low
A History of Declines
Declines are inevitable and are a natural part of investing.
While in the midst of a decline, it is difficult to estimate the intensity and length.
It is important to understand that, while frequency, intensity and length vary, these events have been somewhat regular for over a century.

Market Declines are Inevitable
From October 2007 to March 2009, the S&P 500 fell over 56%. As of February 2010, it has since rallied back 40%.

MSCI Index Affiliation
Developed Markets Frontier Markets
Emerging Markets
SCALE Ten BillionOne Trillion

StocksHistorical Return from 1926 to 2011:
0%
2%
6%
8%
% R
ETU
RN
12%
4%
10%
ASSET CLASSES
CASH (T-Bill)
FIXED INCOME/BONDS
(LT Gov Bonds)
STOCKS
(LC Stocks)
14%
Ibbotson Associates U.S. Return & Risk Data: 1926-2009
Source: Stocks, Bonds, Bills and Inflation 2009 Yearbook. 2009 Ibbotson Associates, Inc. Based on copyrighted works by Ibbotson and Sinquefield. All right reserved. Used with permission.
Past performance does not guarantee future results.
5.72%
3.59%
9.77%
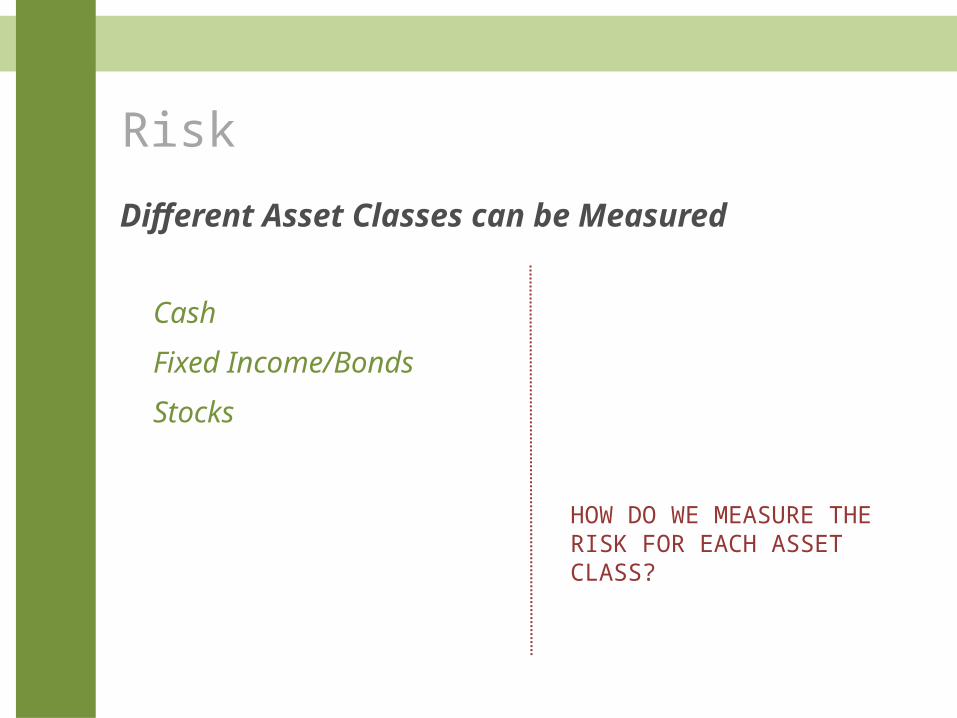
Risk
Different Asset Classes can be Measured
Cash
Fixed Income/Bonds
Stocks
HOW DO WE MEASURE THE RISK FOR EACH ASSET CLASS?

Measuring Risk
Consider the weather in San Francisco and Kansas City

Measuring Risk
Defines risk in terms of variability or volatility of return
Measures total volatility -- both downside and upside dispersion of a portfolio’s return -- to the average return
It shows how much variation there is from the average. 95% of ALL observations fall with +/- 2 standard deviations
MEAN RETURN-1 SD-2 SD +1 SD +2 SD
Standard Deviation
= 95%

Measuring Risk
US T-Bills have a historical mean return of 2.96% and a standard deviation of 0.57% We would expect 95% of all returns to fall within a range of 1.85% to 4.1%.
MEAN RETURN-1 SD-2 SD +1 SD +2 SD
Range of 2.25%
1.85% 2.42% 3.53% 4.10%
2.96%
1989-2012Std Dev = 0.57%
Data Source: Morningstar, Barclays US Treasury Bill TR
US T-Bills

Measuring RiskS&P 500 Large Cap Stocks
The S&P 500 has a historical mean return of 9.62% and a standard deviation of 18.11% We would expect 95% of all returns to fall within a range of -26.6% to 45.8%.
MEAN RETURN-1 SD-2 SD +1 SD +2 SD
Range of 72.44%
-26.60% -8.49% 27.73% 45.84%
9.62%
Std Dev = 18.11%Data Source: www.russell.com 1973-2011

Measuring Risk
Small Cap Stocks have a historical mean return of 11.47% with a standard deviation of 22.23%. We would expect 95% of all returns to fall within a range of -32.9% to 55.9%
MEAN RETURN-1 SD-2 SD +1 SD +2 SD
Range of 88.92%
-32.99% -10.76% 33.7% 55.93%
11.47%
Std Dev of 22.23%
Small Cap Stocks
Data Source: www.russell.com, Ibbotson & Associates, 1973-1978, Russell 2000, 1979-2011

Measuring Risk
International Stocks have a historical mean return of 8.97% with a standard deviation of 22.58%. We would expect 95% of all returns to fall within a range of -36.1% to 54.1%
MEAN RETURN-1 SD-2 SD +1 SD +2 SD
Range of 90.32%
-36.19% -13.61% 31.55% 54.13%
8.97%
Std Dev of 22.58%
International Stocks
Data Source: www.russell.com, MSCI EAFE

Measuring Risk
Real Estate has a historical mean return of 10.35% with a standard deviation of 14.79%. We would expect 95% of all returns to fall within a range of -19.23% to 39.93%
MEAN RETURN-1 SD-2 SD +1 SD +2 SD
Range of 56.16%
-19.23% -4.44% 25.14% 39.93%
10.35%
Std Dev of 14.79%
Real Estate
Data Source: www.russell.com, NAREIT Equity REIT Index

Summary As of 12/31/2012
3 Yr Historical
IWB Large Cap
IWN Small Cap
DODFX Intl. Fund
VWO Emrg.
Markets
FGOVX Intermd
Govt
DODIX Corp/ Mrtg
VUSTXLT Gov
GSHIX High Yield
Ave. Return 5.06% 6.49% 0.65% 0.23% 4.83% 6.85% 8.34% 9.62%
Std. Dev. 19.20% 24.62% 26.72% 29.60% 3.67% 4.76% 13.65% 13.06%
Equity Funds Bond/ Fixed Income Funds
Increasing Standard Deviation & Returns
Fund Names are not investment recommendations. Data Source: Asset Allocation, Roger Gibson, 2008

Measuring Risk
Standard Deviation of Asset Classes
-30% -10% 30% 50%
3%
CASH
9%
BONDS
10%
LARGE STOCKS
11.5%
SMALL STOCKS
1972-2008 Data Source: Asset Allocation, Roger Gibson, 2008

Measuring Risk
2006
Histogram of Stocks’ Performance Based on the S&P 500 (given in percent)
2004 20092000 2007 1998 2003 19971990 2005 1986 1999 19951981 1994 1979 1998 1991
1977 1993 1972 1996 19891969 1992 1971 1983 19851962 1987 1968 1982 19801953 1984 1965 1976 19751946 1978 1964 1967 1955
2001 1940 1970 1959 1963 1950 1973 1939 1960 1952 1961 1945
2002 19661934 1956 1949 1951 1938 1958 1974 19571932 1948 1944 1943 1936 1935 1954
1931 1937 19301941 1929 1947 1926 1942 1927 1928 1933
LARGE COMPANY
STOCKS
-40 -30 -20 -10 0 10 20 30 40 50 60
Source: Stocks, Bonds, Bills and Inflation 2009 Yearbook. 2009 Ibbotson Associates, Inc. Based on copyrighted works by Ibbotson and Sinquefield. All right reserved. Used with permission.
Past performance does not guarantee future results.
2008
2010 20122011

Mixing Assets Together
Equity Assets
Fixed Assets
Real estate
Hedge funds
Annuities
Insurance
Private Equity
Venture Capital
Assets choices
How do I mix them together?

Modern Portfolio Theory (MPT)Diversification
Every investment decision should have as its objective the enhancement of the portfolio’s return, the reduction of risk, or both.
The purpose of diversification is not merely to increase returns, but rather to achieve a desired level of return with a minimum level of risk.
To protect a portfolio from being vulnerable to just one asset class, it is important to develop policies that will lead to diversified portfolios.

Modern Portfolio Theory (MPT)Perfect Positive Correlation of Returns
TIME
$

Modern Portfolio Theory (MPT)Perfect Negative Correlation of Returns
TIME
$

Modern Portfolio Theory (MPT)No Correlation of Returns
TIME
$

Modern Portfolio Theory (MPT)Real World Example
TIME
Past performance is not indicative of future results.
$

In US dollars. Indices are not available for direct investment. Their performance does not reflect the expenses associated with the management of an actual portfolio. Past performance is not a guarantee of future results. US value and growth index data (ex utilities) provided by Fama/French. The S&P data are provided by Standard & Poor’s Index Services Group. CRSP data provided by the Center for Research in Security Prices, University of Chicago. International Value data provided by Fama/French from Bloomberg and MSCI securities data. International Small data compiled by Dimensional from Bloomberg, StyleResearch, London Business School, and Nomura Securities data. MSCI EAFE Index is net of foreign withholding taxes on dividends; copyright MSCI 2010, all rights reserved. Emerging markets index data simulated by Fama/French from countries in the IFC Investable Universe; simulations are free-float weighted both within each country and across all countries.

The Risk Dimensions Delivered
Periods based on rolling annualized returns. 121 total 25-year periods. 181 total 20-year periods. 241 total 15-year periods. 301 total 10-year periods. 361 total 5-year periods.International Value and Growth data provided by Fama/French from Bloomberg and MSCI securities data. International Small data compiled by Dimensional from Bloomberg, StyleResearch, London Business School, and Nomura Securities data. International Large is MSCI EAFE Index net of foreign withholding taxes on dividends; copyright MSCI 2010, all rights reserved. Foreign securities prices may decline or fluctuate because of: (a) economic or political actions of foreign governments, and/or (b) less regulated or liquid securities markets. Investors holding these securities are also exposed to foreign currency risk (the possibility that foreign currency will fluctuate in value against the US dollar). Securities of small companies are often less liquid than those of large companies. As a result, small company stocks may fluctuate relatively more in price. Mutual funds distributed by DFA Securities LLC.
Value beat growth 100% of the time.
Value beat growth 100% of the time.
Value beat growth 100% of the time.
Value beat growth 100% of the time.
Value beat growth 98% of the time.
Small beat large 100% of the time.
Small beat large 100% of the time.
Small beat large 84% of the time.
Small beat large 76% of the time.
Small beat large 75% of the time.
International Value vs. International Growth International Small vs. International Large
January 1975 – December 2011
In 5-Year Periods
In 10-Year Periods
In 15-Year Periods
In 20-Year Periods
In 25-Year Periods Value beat growth 100% of the time.
Value beat growth 100% of the time.
Value beat growth 100% of the time.
Value beat growth 100% of the time.
Value beat growth 98% of the time.

The Risk Dimensions Delivered
Periods based on rolling annualized returns. 703 total 25-year periods. 763 total 20-year periods. 823 total 15-year periods. 883 total 10-year periods. 943 total 5-year periods.Performance based on Fama/French Research Factors. Securities of small companies are often less liquid than those of large companies. As a result, small company stocks may fluctuate relatively more in price. Mutual funds distributed by DFA Securities LLC.
Value beat growth 100% of the time.
Value beat growth 100% of the time.
Value beat growth 99% of the time.
Value beat growth 96% of the time.
Value beat growth 86% of the time.
Small beat large 96% of the time.
Small beat large 83% of the time.
Small beat large 78% of the time.
Small beat large 68% of the time.
Small beat large 60% of the time.
US Value vs. US Growth US Small vs. US Large
July 1926 – December 2011

Asset AllocationWhat is Asset Allocation?
CASH STOCKS
BONDS

Asset AllocationIs Asset Allocation Important?
ASSET ALLOCATION POLICY: 91.5%
MARKET TIMING: 1.8%
SECURITY SELECTION: 4.6%
OTHER FACTORS: 2.1%
Source: Asset Allocation by Roger Gibson
Asset Allocation cannot eliminate the risk of fluctuating prices or uncertain returns.
In other words it cannot eliminate Market Risk

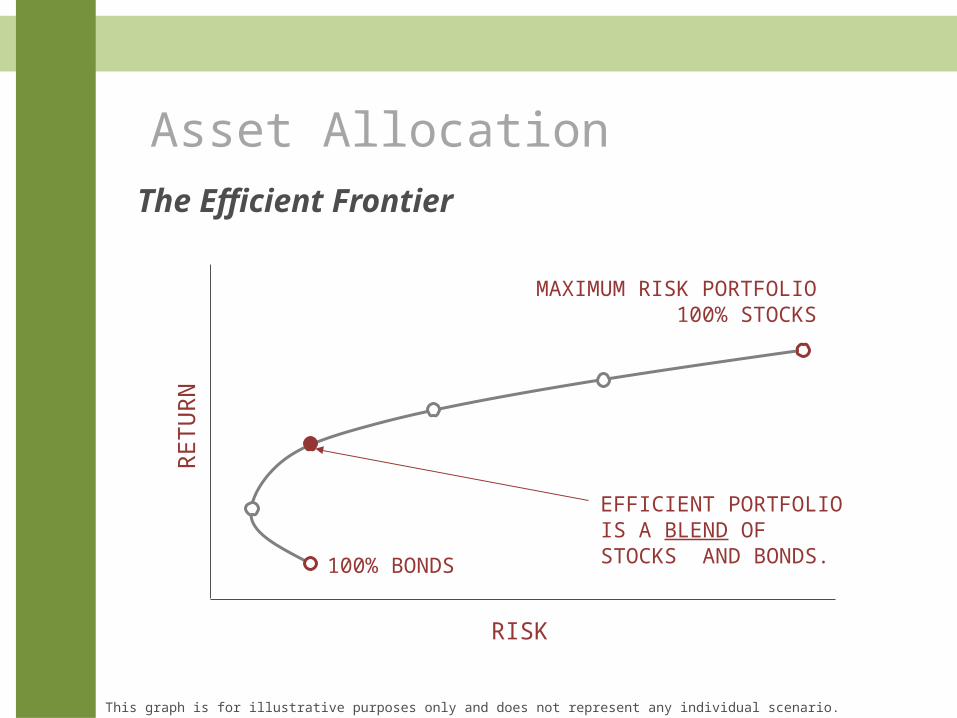
Asset AllocationThe Efficient Frontier
RETU
RN
RISK
100% BONDS
MAXIMUM RISK PORTFOLIO100% STOCKS
This graph is for illustrative purposes only and does not represent any individual scenario.
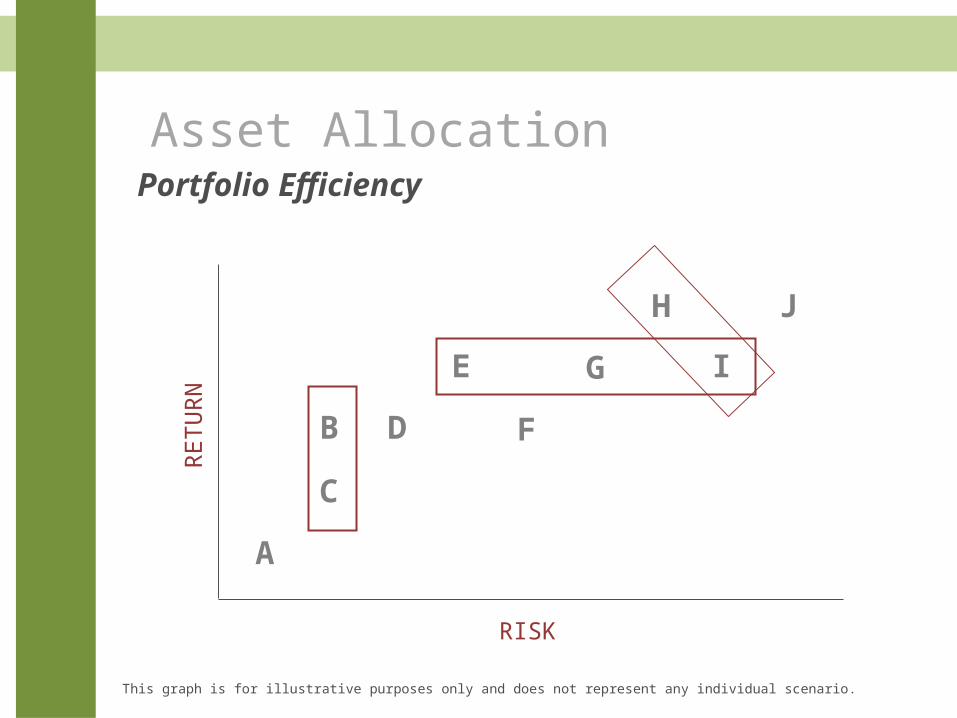
Asset AllocationPortfolio Efficiency
RETU
RN
A
B
C
D
E
F
G
H
I
J
RISK
This graph is for illustrative purposes only and does not represent any individual scenario.
Asset AllocationThe Efficient Frontier
RETU
RN
RISK
100% BONDS
MAXIMUM RISK PORTFOLIO100% STOCKS
This graph is for illustrative purposes only and does not represent any individual scenario.
EFFICIENT PORTFOLIOIS A BLEND OF STOCKS AND BONDS.

The Basic Institutional Portfolio
Barclays Capital data, formerly Lehman Brothers, provided by Barclays Bank PLC. The S&P data are provided by Standard & Poor’s Index Services Group. Indexes are not available for direct investment. Their performance does not reflect the expenses associated with the management of an actual portfolio.Past performance is not a guarantee of future results. Not to be construed as investment advice. Returns of model portfolios are based on back-tested model allocation mixes designed with the benefit of hindsight and do not represent actual investment performance. See cover page for additional information.
S&P 500 Index
Barclays US Government/Credit Bond IndexAnnualizedCompound
Return
Annualized Standard
Deviation
Model Portfolio 1 9.41% 11.18%
Barclays US Govt./Credit
Bond Index S&P 500 Index
Model Portfolio 1 40% 60%

Substituting Short-Term for Long-Term Fixed Income
Annualized Compound
Return
Annualized Standard
Deviation
Model Portfolio 1 9.41% 11.18%
Model Portfolio 2 8.82% 10.18%
Barclays US Govt./Credit
Bond IndexS&P 500
Index
Merrill Lynch One-Year US
Treasury Note Index
Model Portfolio 1 40% 60%
Model Portfolio 2 60% 40%
S&P 500 Index
One-Year US Treasury Note Index
Barclays Capital data, formerly Lehman Brothers, provided by Barclays Bank PLC. The S&P data are provided by Standard & Poor’s Index Services Group. The Merrill Lynch Indices are used with permission; copyright 2010 Merrill Lynch, Pierce, Fenner & Smith Incorporated; all rights reserved. Indexes are not available for direct investment. Their performance does not reflect the expenses associated with the management of an actual portfolio.Past performance is not a guarantee of future results. Not to be construed as investment advice. Returns of model portfolios are based on back-tested model allocation mixes designed with the benefit of hindsight and so not represent actual investment performance. See cover page for additional information.

Diversifying a Portfolio Into US Small Cap StocksAnnualizedCompound
Return
Annualized Standard
Deviation
Model Portfolio 1 9.41% 11.18%
Model Portfolio 2 8.82% 10.18%
Model Portfolio 3 9.63% 11.86%
Barclays US Govt./Credit
Bond IndexS&P 500
Index
Merrill Lynch One-Year US
Treasury Note Index
US Small Cap
Index
Model Portfolio 1 40% 60%
Model Portfolio 2 60% 40%
Model Portfolio 3 30% 40% 30%
One-Year US Treasury Note IndexS&P 500 IndexUS Small Cap Index
Barclays Capital data, formerly Lehman Brothers, provided by Barclays Bank PLC. The S&P data are provided by Standard & Poor’s Index Services Group. The Merrill Lynch Indices are used with permission; copyright 2010 Merrill Lynch, Pierce, Fenner & Smith Incorporated; all rights reserved. Dimensional Index data compiled by Dimensional. Indexes are not available for direct investment. Their performance does not reflect the expenses associated with the management of an actual portfolio. Past performance is not a guarantee of future results. Not to be construed as investment advice. Returns of model portfolios are based on back-tested model allocation mixes designed with the benefit of hindsight and do not represent actual investment performance. See cover page for additional information.

Diversifying a Portfolio Into US Value Stocks
Barclays Capital data, formerly Lehman Brothers, provided by Barclays Bank PLC. The S&P data are provided by Standard & Poor’s Index Services Group. The Merrill Lynch Indices are used with permission; copyright 2010 Merrill Lynch, Pierce, Fenner & Smith Incorporated; all rights reserved. Dimensional Index data compiled by Dimensional. Indexes are not available for direct investment. Their performance does not reflect the expenses associated with the management of an actual portfolio.Past performance is not a guarantee of future results. Not to be construed as investment advice. Returns of model portfolios are based on back-tested model allocation mixes designed with the benefit of hindsight and do not represent actual investment performance. See cover page for additional information.
AnnualizedCompound
Return
Annualized Standard
Deviation
Model Portfolio 1 9.41% 11.18%
Model Portfolio 2 8.82% 10.18%
Model Portfolio 3 9.63% 11.86%
Model Portfolio 4 10.60% 11.78%
Barclays US Govt./Credit
Bond Index
S&P 500 Index
Merrill Lynch One-Year US
Treasury Note Index
US Small Cap
Index
US Large Value Index
Targeted Value Index
Model Portfolio 1 40% 60%
Model Portfolio 2 60% 40%
Model Portfolio 3 30% 40% 30%
Model Portfolio 4 15% 40% 15% 15% 15%
One-Year US Treasury Note Index
S&P 500 Index
US Small Cap Index
US Large Value Index
Targeted Value Index

A Fully Diversified Portfolio
Rebalanced annually. Barclays Capital data, formerly Lehman Brothers, provided by Barclays Bank PLC. The S&P data are provided by Standard & Poor’s Index Services Group. The Merrill Lynch Indices are used with permission; copyright 2010 Merrill Lynch, Pierce, Fenner & Smith Incorporated; all rights reserved. Dimensional Index data compiled by Dimensional. Emerging Markets Blended Index consists of 50% Fama/French Emerging Markets Index, 25% Fama/French Emerging Markets Small Cap Index, and 25% Fama/French Emerging Markets Value Index. Fama/French Emerging Markets, Fama/French Emerging Markets Value and Fama/French Emerging Markets Small Cap Index weightings allocated evenly between Dimensional International Small Cap Index and Fama/French International Value Index prior to January 1989 data inception. Dimensional International Small Cap Value Index weighting allocated to International Small Cap Index prior to July 1981 data inception. International Value weighting allocated evenly between International Small Cap and MSCI World ex USA Index prior to January 1975 data inception. Indexes are not available for direct investment. Their performance does not reflect the expenses associated with the management of an actual portfolio. Past performance is not a guarantee of future results. Not to be construed as investment advice. Returns of model portfolios are based on back-tested model allocation mixes designed with the benefit of hindsight and do not represent actual investment performance. See cover page for additional information.
AnnualizedCompound
Return
Annualized Standard
Deviation
Model Portfolio 1 9.41% 11.18%
Model Portfolio 2 8.82% 10.18%
Model Portfolio 3 9.63% 11.86%
Model Portfolio 4 10.60% 11.78%
Model Portfolio 5 11.64% 11.24%
Barclays US
Govt./CreditBond
Index
S&P 500
Index
Merrill Lynch One-Year US
Treasury Note Index
US Small
Cap Index
US Large Value Index
Targeted Value Index
Intl. LargeIndex
Intl.SmallIndex
Intl. Large ValueIndex
Intl.Small ValueIndex
Emerging Markets Blended
Index
Model Portfolio 1 40% 60%
Model Portfolio 2 60% 40%
Model Portfolio 3 30% 40% 30%
Model Portfolio 4 15% 40% 15% 15% 15%
Model Portfolio 5 7.5% 40% 7.5% 7.5% 7.5% 6% 6% 6% 6% 6%
One-Year US Treasury Note Index
S&P 500 Index
US Small Cap Index
US Large Value Index
Targeted Value Index
International Large Index
International Small Index
International Large Value Index
International Small Value Index
Emerging Markets Blended Index
Quarterly: 1973-2013

The Importance of Long-Term Discipline
The S&P data are provided by Standard & Poor’s Index Services Group. One-Month US Treasury Bills data © Stocks, Bonds, Bills, and Inflation Yearbook™, Ibbotson Associates, Chicago (annually updated work by Roger G. Ibbotson and Rex A. Sinquefield).For illustrative purposes only. Indexes are not available for direct investment. Their performance does not reflect the expenses associated with the management of an actual portfolio. Past performance is not a guarantee of future results. Values change frequently and past performance may not be repeated. There is always the risk that an investor may lose money.
Annualized Compound Returns (%) 1926-2011 1965-1981 1982-2011
S&P 500 Index 9.81 6.33 11.17
One-Month US Treasury Bills 3.66 6.66 4.98

Asset Allocation
Importance of a Rebalancing Strategy
TIME
100%
75%
50%
25%TARG
ET A
LLO
CATI
ON
REBALANCING REQUIRED
REBALANCING REQUIRED
REBALANCING REQUIRED
TARGET RANGE
Source: Sungard® Expert Solutions

Scenario Average Annual Return Standard Deviation End Value
Scenario One: Buy & Hold 11.53% 13.57% $8,874,742
Scenario Two: Periodic Rebalancing – Rebalance at the end of each quarter
11.85% 10.87% $9,391,171
Scenario Three: Threshold Rebalancing – Rebalance when the allocation deviates beyond +/- 20% of target
11.98% 12.14% $9,606,430
Source: Financial Planning Magazine, Dec 2005
Assume a hypothetical $1,000,000 Portfolio over 20 years,Allocated as shown
Russell 1000 Growth
25%
Russell 1000 Value25%
Russell 200010%
MSCI EAFE10%
Barclays Municipal30%
Why Rebalance?


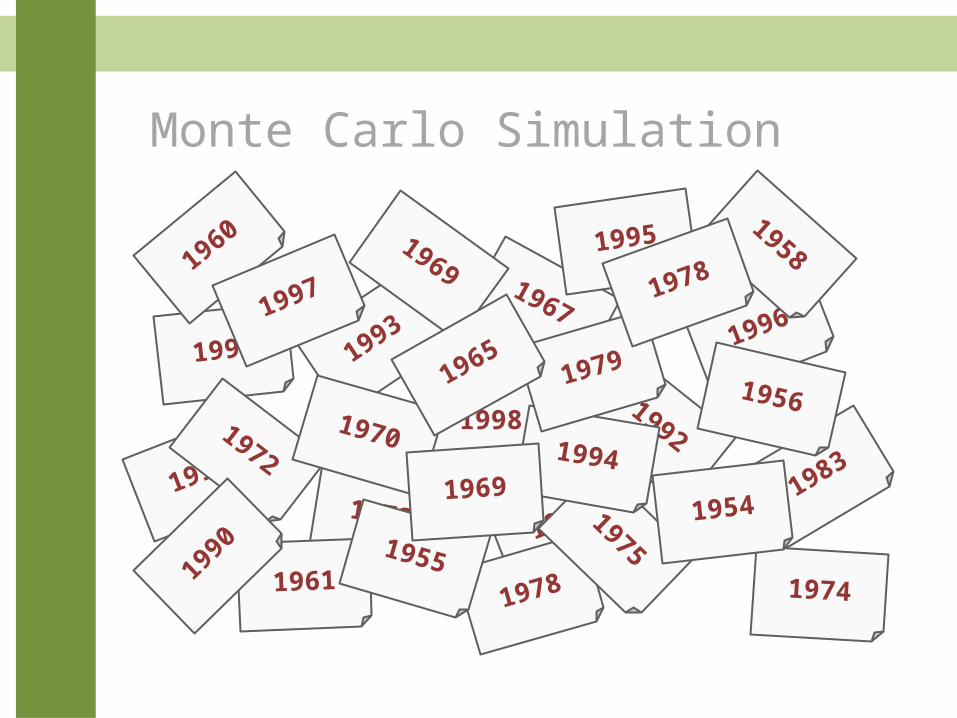
Monte Carlo Simulation
A large number of random trials are run.
Patterns in the trial’s outcomes show the most likely range and concentration of results.
Please Note:
The following examples are for illustrative purposes only. The results shown do not represent the returns of any particular investment.
Monte Carlo Simulation
1973
1992
1993
1961
1998
1967
1978
1975
1983
19961991
1960
1961
1997
1974
195819951969
19941972
1955
1979
1990
19561970
1965
1954
19781997
1969

Monte Carlo Simulation
1998 1965 1953 1957 1991 1971
1955 1979 1978 1993 1969 1992
1974 1961 1990 1996 1962 1956
1983 1951 1958 1967 1973 1997
1950 1956 1976 1994 1995 1948

Monte Carlo Simulation
Example:If you could choose from any of the following three investments, which would you select?
#1 11.6 $299
#2 11.6 $299
#3 11.6 $299
INVESTMENT CHOICE
TEN YEARRETURN
GROWTHOF $100

Monte Carlo SimulationYou would think that they would all be the same…but…
0 1 2 3 4 5 6 7 8 9 10
$400
$350
$300
$250
$200
$150
$100
$50
YEAR
GROWTH OF $100
#1#2#3
BULL
MARKET
BEAR MARKET
BULL
MARKET
BEAR MARKET
You may want to understand the path you took to achieve the ending goal

Monte Carlo Simulation
Instead of a single $100 investment, test the same choices for different investors…
What if I were saving $10,000 a year?
Would they produce the same results?

Monte Carlo SimulationOne choice may produce over TWICE the amount of money
0 1 2 3 4 5 6 7 8 9 10
$300,000
$250,000
$200,000
$150,000
$100,000
$50,000
$0
GROWTH OF $10,000 INVESTED EACH YEAR
#1#2#3
BULL
MARKET
BEAR
MARKET
BULL
M
ARKE
T
BEAR MARKET
Same returns…BIG difference in ending results… #2 Wins!
YEAR

Monte Carlo Simulation
What about a different investor?
If I had $100,000 and I needed $15,000 per year, would it last 10 years?

Monte Carlo SimulationYou would run out of money with #2!
0 1 2 3 4 5 6 7 8 9 10
$250,000
$200,000
$150,000
$100,000
$50,000
$0
-$50,000
-$100,000
VALUE OF $100,000 WITHDRAWING $15,000 ANNUALLY
#1#2#3
BULL
MARKETBEAR MARKET
BULL MARKET
BEAR MARKET
Same returns… big difference in ending results… #1 Wins!
YEAR

Monte Carlo SimulationThe ending results of our three choices depend on YOUR plan…
They all produced an average of 11.6 % over the 10 year period!
INVESTMENT 1INVESTOR INVESTMENT 2 INVESTMENT 3
Invest $100
Save $10K/year
Invest $100K Withdraw $15K/year
$299 $299 $299
$119,117 $256,038 $171,909
$120,285 -$55,722 $41,097

Declines Can Erode Retirement Income
© American Funds Distributors, Inc. AI-33386
2000 2001 2002
100,000
80,000
60,000
40,000
20,000
0
S&P 500 Index, $100,000 initial investment, monthly withdrawals totaling 5% annually, increasing 4% each year, 3/24/00 – 10/9/02
Results reflect reinvestment of all distributions.
9
6
3
0
15%
12
12.3%withdrawal rate
5%withdrawal rate
$43,961
Monte Carlo Simulation
WHEN you receive a return can be far more important than your average return
Monte Carlo Simulation
Most plans assume you will achieve the average return each year and ignore bull and bear markets.
Understand your Odds
With probability analysis, you project many results; including both bull and bear markets

Future Markets
— Warren BuffettBerkshire Hathaway shareholder letter, 1988
© American Funds Distributors, Inc. AI-90863
“We do not have, never have had, and never will have an opinion about where the stock market, interest rates, or business activity will be a year from now.”

Investing in an Uncertain MarketSet realistic expectations
Stick to sound investment strategies
Customize your portfolio to suit your investment objective
Invest for the long term and stay the course
© American Funds Distributors, Inc. AI-30043
Related Documents