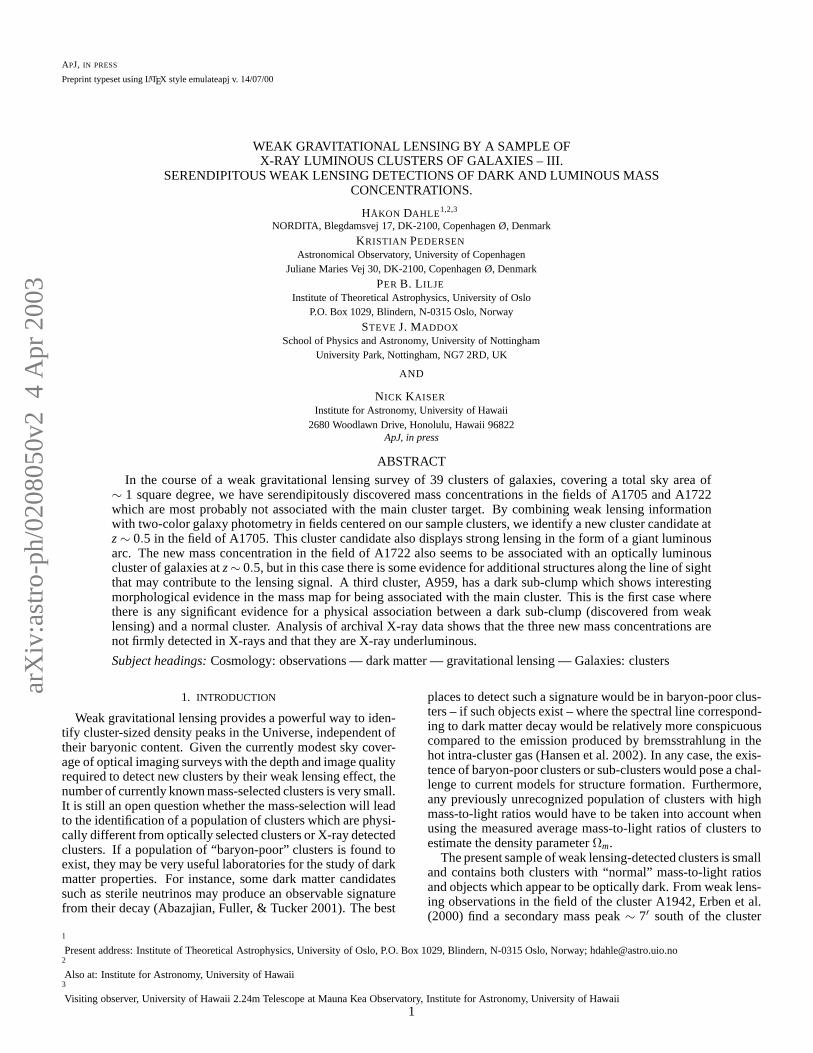
arXiv:astro-ph/0208050v2 4 Apr 2003 APJ, IN PRESS Preprint typeset using L A T E X style emulateapj v. 14/07/00 WEAK GRAVITATIONALLENSING BY A SAMPLE OF X-RAY LUMINOUS CLUSTERS OF GALAXIES – III. SERENDIPITOUS WEAK LENSING DETECTIONS OF DARK AND LUMINOUS MASS CONCENTRATIONS. HÅKON DAHLE 1,2,3 NORDITA, Blegdamsvej 17, DK-2100, Copenhagen Ø, Denmark KRISTIAN PEDERSEN Astronomical Observatory, University of Copenhagen Juliane Maries Vej 30, DK-2100, Copenhagen Ø, Denmark PER B. LILJE Institute of Theoretical Astrophysics, University of Oslo P.O. Box 1029, Blindern, N-0315 Oslo, Norway STEVE J. MADDOX School of Physics and Astronomy, University of Nottingham University Park, Nottingham, NG7 2RD, UK AND NICK KAISER Institute for Astronomy, University of Hawaii 2680 Woodlawn Drive, Honolulu, Hawaii 96822 ApJ, in press ABSTRACT In the course of a weak gravitational lensing survey of 39 clusters of galaxies, covering a total sky area of ∼ 1 square degree, we have serendipitously discovered mass concentrations in the fields of A1705 and A1722 which are most probably not associated with the main cluster target. By combining weak lensing information with two-color galaxy photometry in fields centered on our sample clusters, we identify a new cluster candidate at z ∼ 0.5 in the field of A1705. This cluster candidate also displays strong lensing in the form of a giant luminous arc. The new mass concentration in the field of A1722 also seems to be associated with an optically luminous cluster of galaxies at z ∼ 0.5, but in this case there is some evidence for additional structures along the line of sight that may contribute to the lensing signal. A third cluster, A959, has a dark sub-clump which shows interesting morphological evidence in the mass map for being associated with the main cluster. This is the first case where there is any significant evidence for a physical association between a dark sub-clump (discovered from weak lensing) and a normal cluster. Analysis of archival X-ray data shows that the three new mass concentrations are not firmly detected in X-rays and that they are X-ray underluminous. Subject headings: Cosmology: observations — dark matter — gravitational lensing — Galaxies: clusters 1. INTRODUCTION Weak gravitational lensing provides a powerful way to iden- tify cluster-sized density peaks in the Universe, independent of their baryonic content. Given the currently modest sky cover- age of optical imaging surveys with the depth and image quality required to detect new clusters by their weak lensing effect, the number of currently known mass-selected clusters is very small. It is still an open question whether the mass-selection will lead to the identification of a population of clusters which are physi- cally different from optically selected clusters or X-ray detected clusters. If a population of “baryon-poor” clusters is found to exist, they may be very useful laboratories for the study of dark matter properties. For instance, some dark matter candidates such as sterile neutrinos may produce an observable signature from their decay (Abazajian, Fuller, & Tucker 2001). The best places to detect such a signature would be in baryon-poor clus- ters – if such objects exist – where the spectral line correspond- ing to dark matter decay would be relatively more conspicuous compared to the emission produced by bremsstrahlung in the hot intra-cluster gas (Hansen et al. 2002). In any case, the exis- tence of baryon-poor clusters or sub-clusters would pose a chal- lenge to current models for structure formation. Furthermore, any previously unrecognized population of clusters with high mass-to-light ratios would have to be taken into account when using the measured average mass-to-light ratios of clusters to estimate the density parameter Ω m . The present sample of weak lensing-detected clusters is small and contains both clusters with “normal” mass-to-light ratios and objects which appear to be optically dark. From weak lens- ing observations in the field of the cluster A1942, Erben et al. (2000) find a secondary mass peak ∼ 7 ′ south of the cluster 1 Present address: Institute of Theoretical Astrophysics, University of Oslo, P.O. Box 1029, Blindern, N-0315 Oslo, Norway; [email protected] 2 Also at: Institute for Astronomy, University of Hawaii 3 Visiting observer, University of Hawaii 2.24m Telescope at Mauna Kea Observatory, Institute for Astronomy, University of Hawaii 1

Welcome message from author
This document is posted to help you gain knowledge. Please leave a comment to let me know what you think about it! Share it to your friends and learn new things together.
Transcript
arX
iv:a
stro
-ph/
0208
050v
2 4
Apr
200
3APJ, IN PRESS
Preprint typeset using LATEX style emulateapj v. 14/07/00
WEAK GRAVITATIONAL LENSING BY A SAMPLE OFX-RAY LUMINOUS CLUSTERS OF GALAXIES – III.
SERENDIPITOUS WEAK LENSING DETECTIONS OF DARK AND LUMINOUSMASSCONCENTRATIONS.
HÅKON DAHLE1,2,3
NORDITA, Blegdamsvej 17, DK-2100, Copenhagen Ø, Denmark
KRISTIAN PEDERSEN
Astronomical Observatory, University of CopenhagenJuliane Maries Vej 30, DK-2100, Copenhagen Ø, Denmark
PER B. L ILJE
Institute of Theoretical Astrophysics, University of OsloP.O. Box 1029, Blindern, N-0315 Oslo, Norway
STEVE J. MADDOX
School of Physics and Astronomy, University of NottinghamUniversity Park, Nottingham, NG7 2RD, UK
AND
NICK KAISER
Institute for Astronomy, University of Hawaii2680 Woodlawn Drive, Honolulu, Hawaii 96822
ApJ, in press
ABSTRACT
In the course of a weak gravitational lensing survey of 39 clusters of galaxies, covering a total sky area of∼ 1 square degree, we have serendipitously discovered mass concentrations in the fields of A1705 and A1722which are most probably not associated with the main clustertarget. By combining weak lensing informationwith two-color galaxy photometry in fields centered on our sample clusters, we identify a new cluster candidate atz ∼ 0.5 in the field of A1705. This cluster candidate also displays strong lensing in the form of a giant luminousarc. The new mass concentration in the field of A1722 also seems to be associated with an optically luminouscluster of galaxies atz ∼ 0.5, but in this case there is some evidence for additional structures along the line of sightthat may contribute to the lensing signal. A third cluster, A959, has a dark sub-clump which shows interestingmorphological evidence in the mass map for being associatedwith the main cluster. This is the first case wherethere is any significant evidence for a physical associationbetween a dark sub-clump (discovered from weaklensing) and a normal cluster. Analysis of archival X-ray data shows that the three new mass concentrations arenot firmly detected in X-rays and that they are X-ray underluminous.
Subject headings: Cosmology: observations — dark matter — gravitational lensing — Galaxies: clusters
1. INTRODUCTION
Weak gravitational lensing provides a powerful way to iden-tify cluster-sized density peaks in the Universe, independent oftheir baryonic content. Given the currently modest sky cover-age of optical imaging surveys with the depth and image qualityrequired to detect new clusters by their weak lensing effect, thenumber of currently known mass-selected clusters is very small.It is still an open question whether the mass-selection willleadto the identification of a population of clusters which are physi-cally different from optically selected clusters or X-ray detectedclusters. If a population of “baryon-poor” clusters is found toexist, they may be very useful laboratories for the study of darkmatter properties. For instance, some dark matter candidatessuch as sterile neutrinos may produce an observable signaturefrom their decay (Abazajian, Fuller, & Tucker 2001). The best
places to detect such a signature would be in baryon-poor clus-ters – if such objects exist – where the spectral line correspond-ing to dark matter decay would be relatively more conspicuouscompared to the emission produced by bremsstrahlung in thehot intra-cluster gas (Hansen et al. 2002). In any case, the exis-tence of baryon-poor clusters or sub-clusters would pose a chal-lenge to current models for structure formation. Furthermore,any previously unrecognized population of clusters with highmass-to-light ratios would have to be taken into account whenusing the measured average mass-to-light ratios of clusters toestimate the density parameterΩm.
The present sample of weak lensing-detected clusters is smalland contains both clusters with “normal” mass-to-light ratiosand objects which appear to be optically dark. From weak lens-ing observations in the field of the cluster A1942, Erben et al.(2000) find a secondary mass peak∼ 7′ south of the cluster
1
Present address: Institute of Theoretical Astrophysics, University of Oslo, P.O. Box 1029, Blindern, N-0315 Oslo, Norway; [email protected]
Also at: Institute for Astronomy, University of Hawaii3
Visiting observer, University of Hawaii 2.24m Telescope atMauna Kea Observatory, Institute for Astronomy, University of Hawaii1
2 Dahle et al.
center which does not correspond to any strong concentrationof bright galaxies. From deepH-band imaging of this region,Gray et al. (2001) constrain the bolometric mass-to-light ratioto be M/LBol > 1000h in solar units for any reasonable lensredshift. Umetsu & Futamase (2000) find a dark mass con-centration 1.′7 south of the high-redshift cluster CL1604+4304(z = 0.90) with an estimated mass of 1.2× 10¹⁴h−1M⊙ andM/LB ≥ 1000h in solar units, if it is located at the redshiftof CL1604+4304. At present, it is not clear whether the darkclumps found by Erben et al. and Umetsu & Futamase are phys-ically associated with the nearby clusters, or whether theyrep-resent chance alignments on the sky of objects at different red-shifts. Most recently, Miralles et al. (2002) have reportedevi-dence for another dark cluster from a conspicuous alignmentoffaint galaxies in a parallel STIS pointing adjacent to the localSeyfert galaxy NGC 625.
Wittman et al. (2001) report the discovery of a more “nor-mal” cluster in a “blank sky” field through a combination ofweak gravitational lensing and photometric data. TheirBVRIphotometry shows a concentration of elliptical galaxies closeto the lensing-derived mass peak corresponding to the clus-ter, and spectroscopic follow-up of candidate cluster mem-bers reveals a cluster with modest galaxy velocity dispersion(σv = 615± 150 km s−1) at z = 0.28. The mass-to-light ratioof this cluster isM/LR = 560±200h, which is somewhat highcompared to average values ofM/LB ≈ 300h obtained fromboth virial and weak lensing analyses of X-ray selected clus-ters (e.g., Carlberg et al. 1997; Hoekstra et al. 2002; Dahleetal. 2003, in prep.), but there are some X-ray selected clusterswith similar lensing-derivedM/L, such as MS 1224.7+2007 atM/LR = 640± 150 (Fahlman et al. 1994; Fischer 1999), andA68 and A697 atM/LR = 680±230h andM/LR = 450±115h,respectively (Dahle et al. 2003, in prep).
In Paper I in this series (Dahle et al. 2002) we presented weaklensing measurements of a sample of 39 X-ray selected clus-ters. The results were presented in the form of maps of thereconstructed projected matter density (κ = Σ/Σcrit, whereΣcritis the critical surface mass density for lensing) and in the formof radial mass profiles around each (lensing-determined) clustercenter. Several mass maps show evidence for sub-peaks in themass distribution which are not associated with obvious sub-clumping of optically luminous galaxies inside the cluster. Inthis paper, we investigate the properties of the most significantof these sub-peaks. We attempt to constrain the redshift andmass-to-light ratio of these systems and discuss whether theyare likely to be physically associated with their apparent “hostclusters”.
In §2 we describe the selection criteria for cluster candidates,which we describe individually in §3. In §4 we compare ournew (sub-)cluster candidates to those found by other groups,and compare the observed abundances and physical propertiesof such objects to recent theoretical predictions.
The numbers in this paper are given for an Einstein-de Sitter(Ωm = 1,ΩΛ = 0) cosmology. The Hubble parameter is given byH0 = 100hkms−1Mpc−1, and all celestial coordinates are givenin J2000.0.
2. IDENTIFICATION OF NEW CLUSTER CANDIDATES
In Paper I we described a data set of weak lensing measure-ments of 39 clusters in the redshift range 0.15< z < 0.35, withselection based on very high X-ray luminosity (Lx,0.1−2.4keV ≥1045 erg s−1). Most of the sky coverage of this survey comes
from imaging of fourteen clusters with the UH8K mosaic CCDcamera at the 2.24m University of Hawaii Telescope at MaunaKea Observatory, which gives a 19′ field when mounted at thef/10 Cassegrain focus (see Paper I for a complete list of the ob-servations). The imaging data were reduced according to the“pipeline” reduction procedure for mosaic CCD data describedby Kaiser et al. (1999), and the weak gravitational lensingwas measured using the shear estimator introduced by Kaiser(2000). The reduction and analysis procedures used are de-scribed in detail in Paper I.
In some of the reconstructed mass maps of the fields ob-served with the UH8K camera, there are secondary mass peakswhich appear significant when compared to peaks in random-ized shear maps (see Figure 48 of paper I), or peaks seen inmass reconstructions of blank fields (see Wilson, Kaiser & Lup-pino 2001), but do not correspond to concentrations of early-type galaxies at the cluster redshift. These may be mass concen-trations corresponding to high-redshift clusters that only con-tribute weakly to the light distribution in the field, compared tothe more nearby target clusters. At redshifts> 0.4, the early-type galaxies at a given redshift will be significantly bluerthanpredicted from the approximate linearV − I color-redshift rela-tion used in Paper I. Thus, their contribution to the predictionfor the dimensionless surface density given for each cluster inPaper I will be increasingly underestimated with increasing red-shift.
An even more interesting possibility is that these are opti-cally and/or X-ray dark clusters at intermediate redshifts(ordark sub-clumps physically associated with their apparenthostclusters), i.e., mass concentrations that have much higherM/Lvalues than normal clusters.
2.1. Lensing Cluster Search
As noted in Paper I, the 1σ level of noise in the random massmaps is in the range 0.035< κ < 0.05, mostly depending onseeing. Given the large number of fields covered by our sur-vey, we may expect to see maybe one or two 3σ peaks that aregenerated by random noise due to the intrinsic galaxy shapes.However, the reality of a mass peak at this level will becomesignificantly more certain if it can be shown to be strongly cor-related with clustering in the visible galaxy distribution, or witha peak in the X-ray luminous gas.
From the reconstructions of the dimensionless projectedmass surface densityκ presented in Paper I, we select candi-dates for additional mass concentrations using the followingcriteria:
• The dimensionless projected surface densityκ shouldbe> 0.15 (corresponding to a> 3σ detection of masseven in the fields with the highest noise) at the positionof the peak. This selection criterion was applied to massmaps derived separately fromV - andI-band imagingdata, and to mass maps derived from a combination ofthe two, as detailed in Paper I. We found a total of threemass peaks which are above theκ threshold in at leastone of the different mass maps and which also satisfythe other three selection criteria below.
• The mass peak should be clearly separated (with offset> 1′) from the mass peak that corresponds to the lightpeak/optical cluster center (or any other significantpeak in the light distribution of galaxies belonging to
Weak Lensing by X-ray Luminous Clusters – III. 3
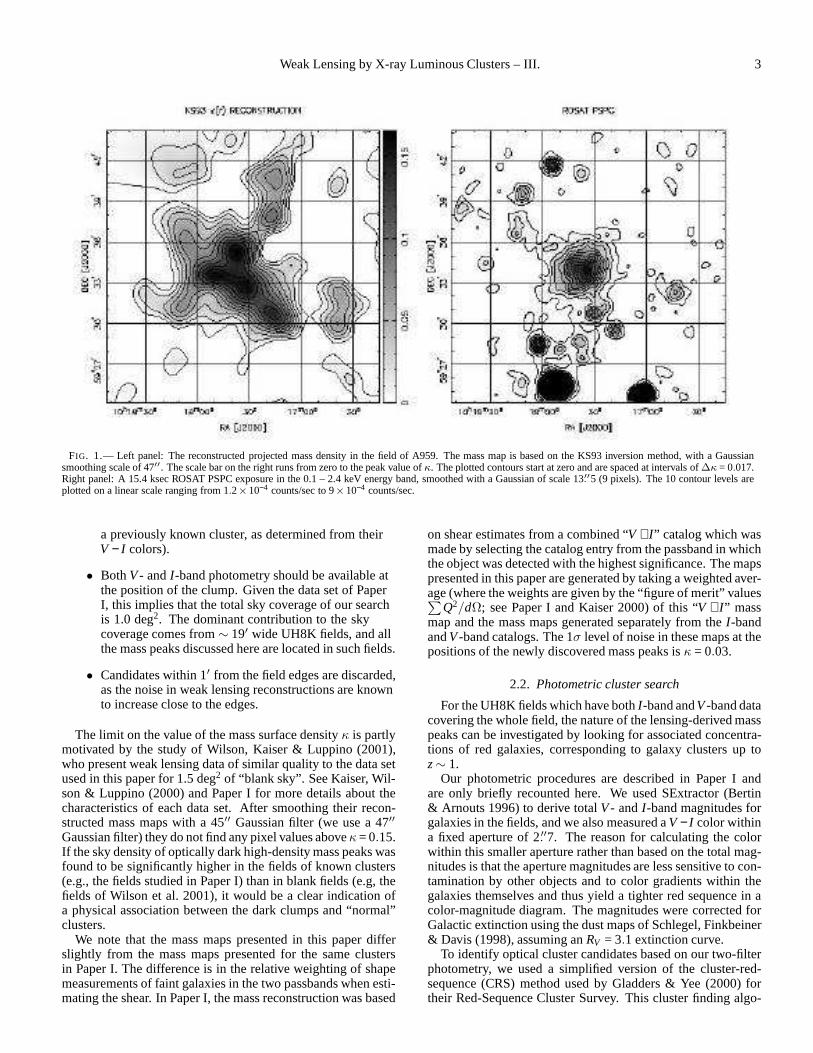
FIG. 1.— Left panel: The reconstructed projected mass density in the field of A959. The mass map is based on the KS93 inversion method, with a Gaussiansmoothing scale of 47′′. The scale bar on the right runs from zero to the peak value ofκ. The plotted contours start at zero and are spaced at intervals of ∆κ = 0.017.Right panel: A 15.4 ksec ROSAT PSPC exposure in the 0.1 – 2.4 keV energy band, smoothed with a Gaussian of scale 13.′′5 (9 pixels). The 10 contour levels areplotted on a linear scale ranging from 1.2×10⁻⁴ counts/sec to 9×10⁻⁴ counts/sec.
a previously known cluster, as determined from theirV − I colors).
• BothV - andI-band photometry should be available atthe position of the clump. Given the data set of PaperI, this implies that the total sky coverage of our searchis 1.0 deg2. The dominant contribution to the skycoverage comes from∼ 19′ wide UH8K fields, and allthe mass peaks discussed here are located in such fields.
• Candidates within 1′ from the field edges are discarded,as the noise in weak lensing reconstructions are knownto increase close to the edges.
The limit on the value of the mass surface densityκ is partlymotivated by the study of Wilson, Kaiser & Luppino (2001),who present weak lensing data of similar quality to the data setused in this paper for 1.5 deg2 of “blank sky”. See Kaiser, Wil-son & Luppino (2000) and Paper I for more details about thecharacteristics of each data set. After smoothing their recon-structed mass maps with a 45′′ Gaussian filter (we use a 47′′
Gaussian filter) they do not find any pixel values aboveκ = 0.15.If the sky density of optically dark high-density mass peakswasfound to be significantly higher in the fields of known clusters(e.g., the fields studied in Paper I) than in blank fields (e.g,thefields of Wilson et al. 2001), it would be a clear indication ofa physical association between the dark clumps and “normal”clusters.
We note that the mass maps presented in this paper differslightly from the mass maps presented for the same clustersin Paper I. The difference is in the relative weighting of shapemeasurements of faint galaxies in the two passbands when esti-mating the shear. In Paper I, the mass reconstruction was based
on shear estimates from a combined “V + I” catalog which wasmade by selecting the catalog entry from the passband in whichthe object was detected with the highest significance. The mapspresented in this paper are generated by taking a weighted aver-age (where the weights are given by the “figure of merit” values∑
Q2/dΩ; see Paper I and Kaiser 2000) of this “V + I” massmap and the mass maps generated separately from theI-bandandV -band catalogs. The 1σ level of noise in these maps at thepositions of the newly discovered mass peaks isκ = 0.03.
2.2. Photometric cluster search
For the UH8K fields which have bothI-band andV -band datacovering the whole field, the nature of the lensing-derived masspeaks can be investigated by looking for associated concentra-tions of red galaxies, corresponding to galaxy clusters up toz ∼ 1.
Our photometric procedures are described in Paper I andare only briefly recounted here. We used SExtractor (Bertin& Arnouts 1996) to derive totalV - andI-band magnitudes forgalaxies in the fields, and we also measured aV − I color withina fixed aperture of 2.′′7. The reason for calculating the colorwithin this smaller aperture rather than based on the total mag-nitudes is that the aperture magnitudes are less sensitive to con-tamination by other objects and to color gradients within thegalaxies themselves and thus yield a tighter red sequence inacolor-magnitude diagram. The magnitudes were corrected forGalactic extinction using the dust maps of Schlegel, Finkbeiner& Davis (1998), assuming anRV = 3.1 extinction curve.
To identify optical cluster candidates based on our two-filterphotometry, we used a simplified version of the cluster-red-sequence (CRS) method used by Gladders & Yee (2000) fortheir Red-Sequence Cluster Survey. This cluster finding algo-
4 Dahle et al.
rithm takes advantage of the fact that early-type galaxies indense cluster environments form a remarkably tight, almosthorizontal sequence in their color-magnitude diagrams, andthese sequences are strongly homogeneous at a given redshift(e.g., Smail et al. 1998; Gladders & Yee 2000 and referencestherein). Also, at redshiftsz . 1 the early-type galaxies thatform the red cluster sequence will have a redderV − I colorthan any other normal galaxies at redshifts equal to, or lowerthan, the redshift of the cluster.
The basic idea behind the CRS method is to create a series ofsmoothed maps of the galaxy density in the field by selectinggalaxies in a series of partially overlapping slices in the color-magnitude diagram. Gladders & Yee (2000) used color slicesdefined by theoretical predictions of the red sequence, but wechoose here to neglect the slope of the red sequence and use aseries of horizontal slices evenly spaced inV − I. Both theoreti-cal predictions from population synthesis models and empiricalresults based on our data set show the absolute value of thered-sequence slope to be less than 0.1 perI-magnitude. Giventhe relatively narrow magnitude range (particularly at high red-shifts) of cluster galaxies contributing to a given slice, and thefact that our color slices are approximately twice as wide asthose used by Gladders & Yee (2000), the effect of the slopewill not significantly influence our ability to detect cluster can-didates with this algorithm. However, it would probably biasredshift estimates of cluster candidates, but only at levels com-parable to the systematic uncertainty introduced by the pho-tometric calibration of the UH8K mosaic camera (we note thatthe photometric stability of the CCD chips in the UH8K is ques-tionable at the. 0.1 magnitude level).
For each slice, we include all galaxies atI < 23 that havea probability higher than 10% of really belonging to that slicewhen taking the photometric uncertainties into account. Thewidth of the slices was∆(V − I) = 0.3 at bright magnitudes andslightly larger at faint magnitudes due to the increasing photo-metric uncertainties. This is about twice the measured intrinsicwidth of the red sequence (Stanford, Eisenhardt, & Dickinson1998).
Rather than using a more elaborate galaxy weighting schemesuch as the one outlined by Gladders & Yee (2000), we chose asimple faint galaxy cutoff atI = 23. Also, to generate smoothedgalaxy number density plots comparable to the weak lensing-derived mass maps, we employed a Gaussian smoothing kernelof fixed scale 47′′ rather than a kernel tailored to fit the ex-pected cluster density profile at a given redshift. The primarypurpose of generating these plots is to search for galaxy den-sity enhancements at the position of the lensing-detected clustercandidates.
2.3. Lensing masses and mass-to-light ratios
For each (sub-)cluster candidate, the (minimum) mass andthe mass-to-light ratio were estimated within an aperture cen-tered on the corresponding peak found in theκ map (see Ta-ble 1). A lower limit on the aperture mass was found using theaperture densitometry statisticζ of Kaiser et al. (1994):
ζ(R1,R2) = κ(R1) − κ(R1,R2) =2
1− R21/R2
2
∫ R2
R1
〈γT 〉d lnr, (1)
which measures the average surface mass density within anaperture radiusRap = R1 minus the average surface mass den-sity in a surrounding annulusR1 < R < R2 (here,γT is the tan-gential component of the shear). Hence, a lower limit on the
aperture mass can be simply calculated asMap = πr2ζΣcrit. WechoseR2 = 2R1, and our estimate ofMap will in this case e.g.,underestimate the true aperture mass by 33% for an isothermalsphere (Σ ∝ R−1) mass distribution.
In order to minimize the bias caused by the presence of amore massive cluster in each field we chose to use an outer ra-diusR2 much smaller than theR2 values used for the aperturemass measurements presented in Paper I. For this reason,R2was chosen to be less than half the angular separation betweenthe new cluster candidate and the Abell cluster. For this ge-ometry, we find from simple simulations that the aperture massmeasurement is affected by< 1% , provided that the mass ofthe Abell cluster is not more than twice that of the new clustercandidate. In the case of the A959 and A1705 fields, we useda control annulus withR2 = 2′ and inner radiusR1 = 1′. Thecluster candidate in the A1722 field had a somewhat larger sep-aration from its host cluster, and it was therefore possibleto usea larger aperture withR2 = 4′ andR1 = 2′. By defining an aper-ture measurement of the surface light densityζL in a mannersimilar to equation (1) (i.e., generating an aperture luminosityestimate by subtracting the average galaxy luminosity densityin the annulusR1 < R < R2 from the average galaxy luminos-ity density atR < R1), the mass-to-light ratio of the mass peakcan be estimated. Thus, in contrast toMap, this ratio will not besystematically underestimated.
2.4. Hot gas content
In X-ray luminous clusters of galaxies, such as those in thecluster sample of Paper I, most of the baryonic mass is in theform of hot, X-ray emitting gas (e.g., Ettori & Fabian 1999).Inorder to constrain the hot gas content of the (sub-)cluster candi-dates we analyzed the best quality archive X-ray data (standardscreened EINSTEIN IPC, ROSAT PSPC and ASCA SIS data,respectively) for these candidates. No obvious X-ray emissionis associated with any of the (sub-)cluster candidates so wede-termine upper limits for their X-ray luminosity as described be-low.
An upper limit for the (sub-)cluster X-ray count rate is ex-tracted within two apertures: The aperture as determined fromthe weak lensing maps (Rap) and the radius within which theaverage (sub-)cluster mass density is 500 times the critical den-sity of the Universe (r500). Special care is taken in estimatingthe background.
For EINSTEIN IPC data (A1705) and ROSAT PSPC data(A959) the background is estimated from the data set includingthe new mass concentration itself. The background is calculatedas the average of three source-free regions of the same size asthe (sub-)cluster region, and at the same optical axis distance.
For ASCA SIS data (A1722) the background count rate isevaluated from the publically available “blank sky” data inatwo stage process: A first background estimate is obtained us-ing exactly the same region on the SIS chip as the (sub-)clusterregion. Then, the general background level in the “blank sky”data is compared to the general background level in the (sub-)cluster data by calculating the average count rate within threeregions of the same size as the region of interest, at the sameoptical axis distance and devoid of obvious X-ray sources. Theinital background estimate is then corrected for the average dif-ference in background level between the “blank sky” data andthe (sub-)cluster data. Finally, data from the SIS0 detector andthe SIS1 detector are merged into one common SIS data set.
For each (sub-)cluster, we derive net count rates (corrected
Weak Lensing by X-ray Luminous Clusters – III. 5
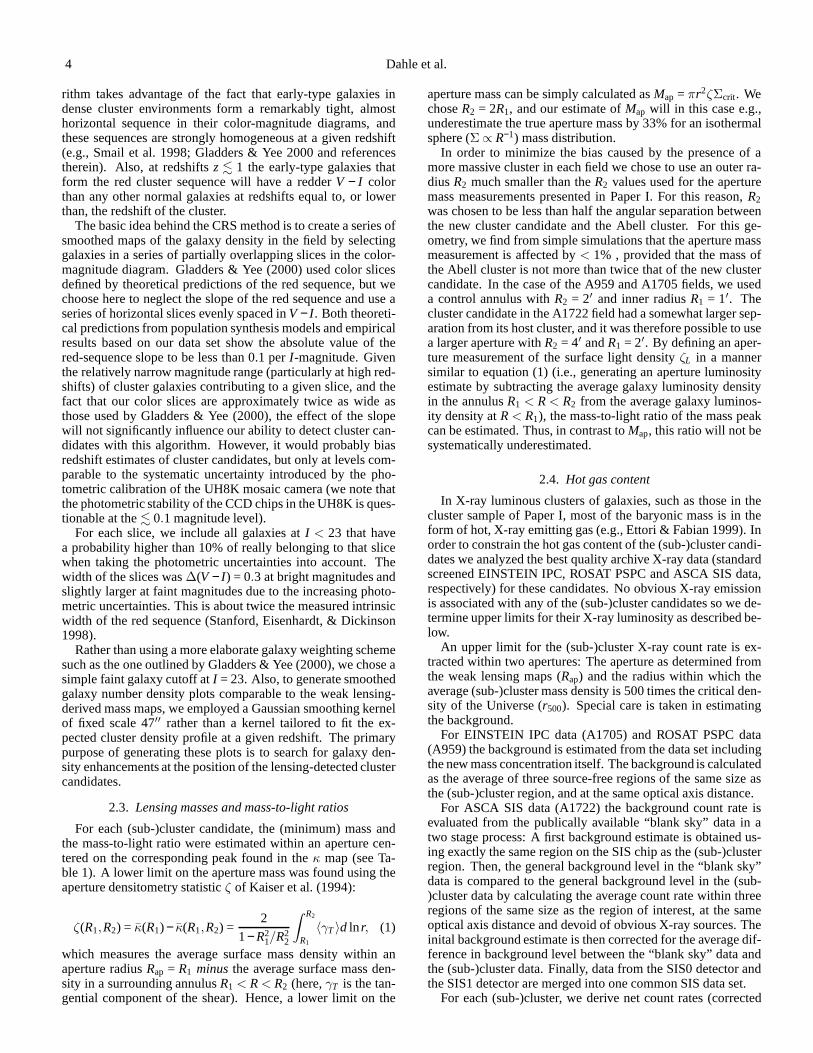
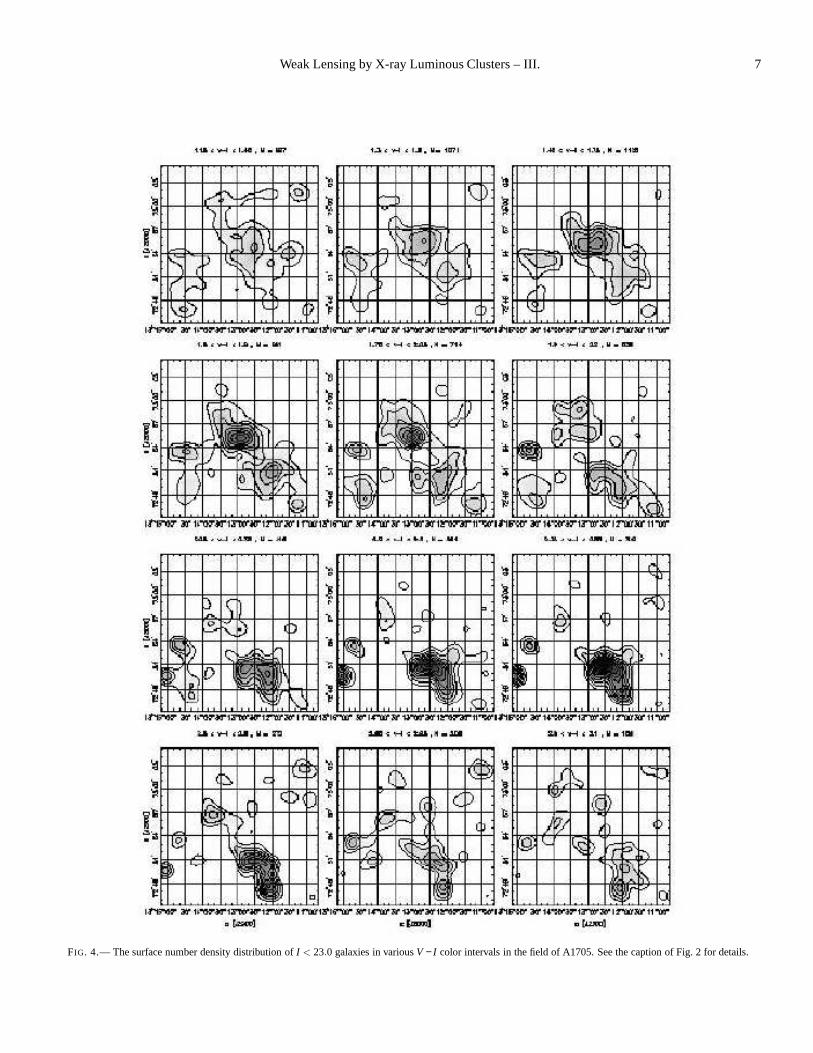
FIG. 2.— The surface number density distribution ofI < 23.0 galaxies in variousV − I color intervals in the field of A959. Shown above each plot is the colorinterval and the number of galaxies in that interval. The plots have been smoothed with a Gaussian of scale 47′′ to yield a resolution similar to the mass map. Theaverage level has been set to zero, and the contour levels areplotted at 1,2,3,... times the rms fluctuation in field galaxydensity in the given color interval. The lackof galaxies in the upper left (northeastern) part of the fieldis an effect of the missing data from chip 4 in the UH8K mosaic.
6 Dahle et al.
for point source contributions) within the two apertures andconvert these to 0.1 – 2.4 keV fluxes using PIMMS and an ab-sorbed Raymond-Smith spectral model with the following pa-rameters: Abundance isZ = 0.25Z⊙, absorption by neutral hy-drogen is fixed at the Galactic value (from Dickey and Lockman1990), and for each (sub-)cluster the temperature is fixed atthevalue derived from the weak lensing mass withinr500 using themass-temperature relation of Finoguenov et al. (2001).
Assuming the redshift of the (sub-)cluster given in Table 1based on optical data, the flux is converted to a luminosity forthe desired cosmology. In order to determine the X-ray lumi-nosity of the (sub-)clusters relative to a sample of nearby “stan-dard” clusters, the upper limit on the 0.1 – 2.4 keV luminositywithin r500 was compared to the expected value based on thelensing mass withinr500 and the mass-luminosity relation ofReiprich & Böhringer (2002) (best bisector fit).
3. CANDIDATE MASS CONCENTRATIONS
The selection criteria outlined in § 2.1 produced three newcluster candidates, in the fields of A959, A1705 and A1722. Tomake the following discussion clearer and more concise, we in-troduce the naming convention “WL HHMM.M(+/-)DDMM”for these objects, where “WL” denotes a weak lensing-detectedmass concentration and is followed by numbers that are basedon the celestial coordinates of the objects (for epoch J2000.0),where the right ascension is given in units of hours and min-utes (with one decimal) and the declination is given in unitsof degrees and arcminutes. For each candidate, we analyze itsoptical and lensing properties based on the data presented inPaper I along with X-ray data to search for emission from anyassociated hot gas. Table 1 summarizes the most important pa-rameters for each cluster candidate.
3.1. The A959 Field
From spectroscopic observations at the WHT, we have deter-mined a redshiftz = 0.286 for this cluster (Irgens et al. 2002),significantly lower than the value usually quoted in the litera-ture (z = 0.353). After properly revising its X-ray luminosityand temperature, it is found to haveLx,0.1−2.4keV = 1.43× 1045
erg s−1 (Böhringer et al. 2000) andT = 6.6 keV (Mushotzsky &Scharf 1997). A singular isothermal sphere (SIS)-model fit tothe tangential shear measured out to a radius of∼ 1.5h−1Mpcshows that the cluster has a mass corresponding to a velocitydispersionσ = 990+100
−110km s−1. The fit to a SIS-model is how-ever not very good, and weak lensing mass measurements atlarge radii indicate that this cluster is very massive, witha pro-jected 2D aperture massMap(< 1.5h−1Mpc)∼ 2×10¹⁵M⊙ (seePaper I).
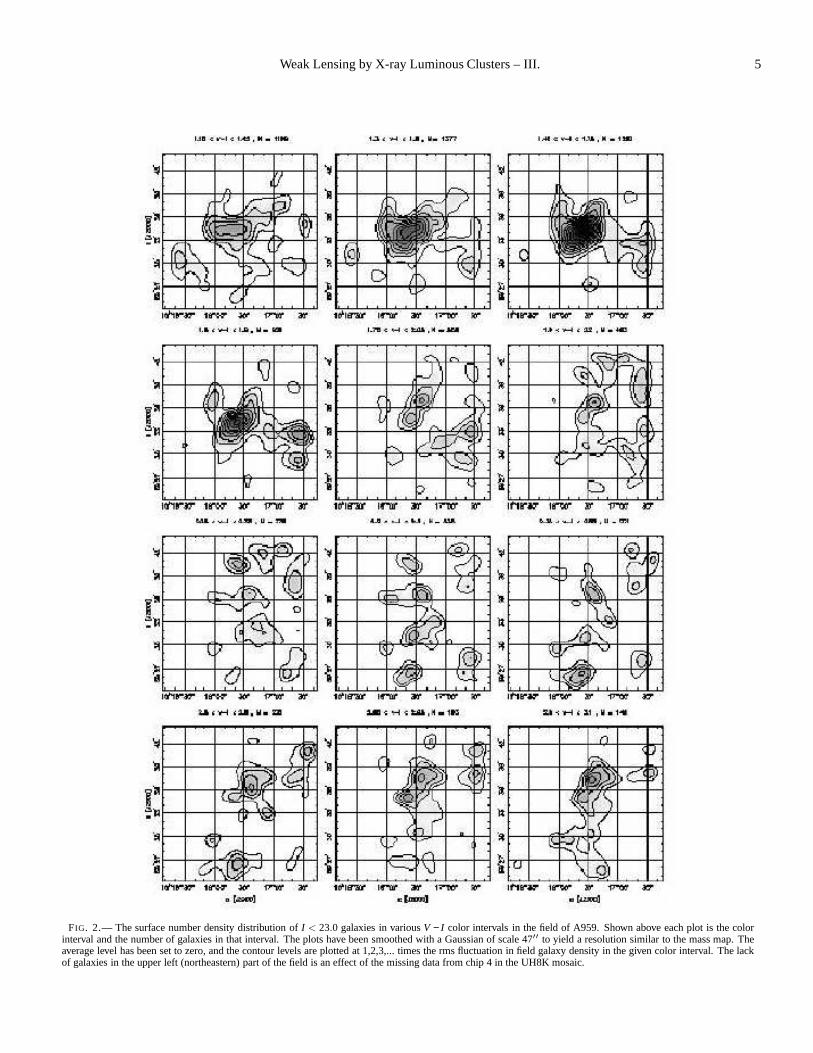
FIG. 3.— The reconstructed projected mass density in the field ofA1705.The mass map is based on the KS93 inversion method, with a Gaussiansmoothing scale of 47′′. The scale bar on the right runs from zero to thepeak value ofκ. The plotted contours start at zero and are spaced at intervalsof ∆κ = 0.020.
Optically, the cluster center is not dominated by any singlegalaxy, but it has a core region consisting of many early-typegalaxies of similar brightnesses. A highly significant masspeak(with some evidence for substructure) is seen in the weak lens-ing mass map (see Figure 1), and the dark matter distributionappears to resemble the cluster light distribution, as apparentin the first four panels of Figure 2. However, there is a darkmatter concentration, hereafter denoted as WL 1017.3+5931,∼ 6′ southwest of the cluster center which does not correspondto any peak in the luminosity distribution. Its peak value4 isκ = 0.143.
Due to the very low background, the ROSAT PSPC 15.4 ksecexposure yields the tightest current constraints on diffuse X-ray emission from WL 1017.3+5931. In Figure 1, a couple ofX-ray sources are seen close to WL 1017.3+5931. ArchivalROSAT HRI images show that sources “C” and “D” are ex-tended sources while source “A” is a point source and source“B” consists of two point sources on top of some extendedemission. This extended X-ray emission is possibly linkingWL1017.3+5931 to the main cluster of A959. The mass morphol-ogy of WL 1017.3+5931 provides clearer evidence for this link,since there appears to be a bridge of matter extending from theA959 cluster center toward WL 1017.3+5931, and the peak it-self appears highly elongated in the direction toward the cen-ter of A959. Even at the lowest “saddle point” in the apparentmass bridge between A959 and WL 1017.3+5931, the projectedmass density is still as high asκ = 0.122, which is 85% of thepeak value at the location of WL 1017.3+5931. Simulationsof the region between two cluster mass peaks with a Gaussiansmoothing scale equal to that of the real mass map and with
4
As noted in § 2.1, the mass maps used for the selection of mass peaks were different from those displayed in this paper. The reason for not using the new mapspresented here (and lowering the selection threshold fromκ = 0.15 to 0.14, which would have selected exactly the same three objects!) is that the noise is more clearlydefined in the old maps. While the new maps have lower noise, this is not achieved by increasing the available sample of background galaxies, but instead by in effecttaking a weighted average of the shape measurements of thesegalaxies in the two passbands. Hence, the photon counting noise for the shape measurements of faintgalaxies is somewhat reduced, while the noise due to the finite number density of background galaxies does not change.
Weak Lensing by X-ray Luminous Clusters – III. 7
FIG. 4.— The surface number density distribution ofI < 23.0 galaxies in variousV − I color intervals in the field of A1705. See the caption of Fig. 2for details.

8 Dahle et al.
TABLE 1
PROPERTIES OF THE WEAK LENSING-DETECTED MASS CONCENTRATIONS
Name α δ Redshift Rap Map M/LB σDM LX,ap
(J2000.0) (J2000.0) zest (h−1 kpc) (1014h−1M⊙) (h[M/LB]⊙) (km s−1) (h−2 1044erg s−1)WL 1017.3+5931 10 17 15 59 30 46 0.286? 161 1.1±0.3 > 500 780+120
−160 < 0.008±0.006WL 1312.5+7252 13 12 31 72 51 32 0.55 222 2.7±0.8 173±54 1150+160
−190 < 0.09±0.03WL 1320.4+6959 13 20 22 69 58 43 0.45 409 4.8±1.9 296±118 940+160
−210 < 0.20±0.1
Note. — Units of right ascension are hours, minutes and seconds, and units of declination are degrees, arcminutes, and arcseconds. The X-ray luminosity is givenin the 0.1-2.4 keV band, and the uncertainty arises from poisson noise as well as point source subtraction. The values aregiven for an Einstein-de Sitter Universe. Thesource redshifts adopted for theMap estimates are based on photometric redshift data from the Hubble Deep Field (see Eq. 17 of Paper I), and correspond to having asingle-screen source population at an effective redshift of zs = 0.7, zs = 0.9, andzs = 0.8 for WL 1017.3+5931, WL 1312.5+7252, and WL 1320.4+6959, respectively
random realizations of realistic noise indicate that this featureis (marginally) significant, at almost the 2σ level. Although thereality of this feature is currently debatable, the apparent massbridge and the ellipticity of WL 1017.3+5931 probably con-stitute the only significant evidence so far for a physical linkbetween a dark sub-clump found by weak lensing in a clusterfield and its apparent host cluster.
No strong galaxy overdensities are seen at the position ofWL 1017.3+5931 for any of the color slices plotted in Figure 2.The lower limit value forM/LB in Table 1 is based on an aper-ture light estimate using galaxies in the 2.0 < V − I < 4.0 colorrange. These are all redder than the A959 cluster galaxies (thered cluster sequence hasV − I ≃ 1.7). If we instead considergalaxies in the color range of the red cluster sequence of A959,we find that the luminosity density in the control annulus at1′ < R < 2′ is higher than the luminosity density within 1′,implying that there is no overdensity of light associated withA959 cluster galaxies at the location of WL 1017.3+5931. Twoof the brightest galaxies in the field (I ≃ 16.5) are visible 2′
from the center of WL 1017.3+5931, but these are likely to beforeground ellipticals (V − I ≃ 1.3), and no significant galaxyclustering is seen around these two galaxies. The estimatedve-locity dispersion of WL 1017.3+5931 listed in Table 1 comesfrom a SIS-model fit to the tangential weak shear averaged inradial bins centered on the dark clump. If WL 1017.3+5931is at the A959 main cluster redshift, within a radius ofr500 itis a factor three X-ray under-luminous relative to the expecta-tion from the mass-X-ray luminosity relation of Reiprich andBöhringer (2002). However, given the scatter in the mass-luminosity relation of an order of magnitude, even though WL1017.3+5931 is relatively X-ray dark it is still consistentwiththe relation. Chandra or XMM-Newton observations are re-quired to pin down the X-ray emission of WL 1017.3+5931and accurately constrain the hot gas content, ie. if it is reallyX-ray dark.
In general, there is very good morphological agreement be-tween the mass map and hot gas as mapped by ROSAT PSPC:The mass extension towards the northeast has a clear X-raycounterpart, and at the position of the extended X-ray source“D” a mass concentration is seen. This feature also corre-sponds to an overdensity of galaxies (most prominent in the1.6 < V − I < 1.9 color slice in Figure 2) with colors similarto, or slightly redder than, the early-type galaxies in the core ofA959. The general southeast-northwest elongation of the A959
cluster galaxy distribution is matched in X-rays.We also note that there are several concentrations of red
(2.0 < V − I < 3.0) galaxies in the field, most clearly visiblein the lower three panels of Figure 2. One of these is only∼ 1′
north of the A959 cluster center (see the 2.65< V − I < 2.95color slice in Figure 2) and may contribute to the substructureseen in the mass peak of A959.
3.2. The A1705 Field
Optical images show that the cluster center of A1705 is dom-inated by a single cD galaxy. Theκ reconstruction of this field(see Figure 3) shows a number of secondary peaks in additionto the most significant mass peak, which is associated with thecenter of A1705. The position given for A1705 by Abell (1958)is 5′ off from what we take to be the cluster center, based on thepeaks in the mass, light and galaxy number density distribu-tions, while the Zwicky cluster Zw 1312.1+7311 is more con-sistent with the position we determine for the A1705 clustercenter (atα = 13h13m.0,δ = 7255′). The color slicing in Fig-ure 4 shows several interesting effects: Firstly, the morphology-density relation manifests itself in the effect that the densitypeak associated with A1705 appears more concentrated as onemoves to progressively redder color intervals (which containthe most evolved early-type cluster galaxies). This effectis alsoapparent in the similar plots for A959 and A1722. Secondly, thedensity peak of A1705 in Figure 4 shows a significant shift inthe centroid position as a function of color. The galaxy numberdensity peak is seen to move closer to the position of the masspeak for redder color intervals, and this again demonstrates thatthe galaxies with the most evolved stellar populations are con-centrated in the densest environments. The centroid shift mayindicate that A1705 is dynamically young. A secondary masspeak situated about 4′ toward the northeast from the main peakappears to be associated with galaxies at the cluster redshift (thefirst five panels of Figure 4 appear to show an extension towardnortheast from the main galaxy overdensity peak associatedwith A1705). Close to this secondary mass peak, and possiblycontributing to it, is thez = 0.112 IRAS galaxy F13121+7315(atα = 13h13m32.0s,δ = 7259′11′′), associated with the AGNX-ray source RX J1313.5+7259.

Weak Lensing by X-ray Luminous Clusters – III. 9
FIG. 5.— The reddest galaxies (V − I > 2.2) in the field of Abell 1705. Thearea of the circles is proportional to theI-band flux. The legend in the upperleft corner indicates the flux and color (assuming no evolution of the SED)of an L∗ E0 galaxy at a given redshift. The apparent lack of galaxies aroundα = 13h13m30s,δ = 7248′ is an artifact caused by aV = 7 star at this position.The square region denoted by the dotted lines indicates the region shown inFig. 6.
The two lowest rows of the galaxy number density plots inFigure 4 shows a strong peak southwest of the location of themain cluster center. This is a galaxy concentration at a redshiftwell beyond A1705. Figure 5 also shows this strong overden-sity in the distribution of the reddest (V − I > 2.2) galaxies inthe field. A strong concentration of galaxies with similar col-ors is centered on what appears to be a distant giant ellipticalgalaxy located atα = 13h12m31.1s,δ = 7250′54′′. A peak inthe mass distribution, which we have named WL 1312.5+7252,is situated less than 1′ away from this galaxy. Its peak value isκ = 0.143. A rough cluster redshift estimate can be derived forthis peak from the median color (V − I = 2.45) of the early-typecluster galaxy sequence seen in a color-magnitude diagram.Us-ing our empirically calibrated color-redshift relation for early-type cluster galaxies (see Figure 47 of Paper I), we estimatethe redshift of the cluster associated with WL 1312.5+7252 tobe z = 0.55± 0.05. This may be a slight underestimate of thetrue redshift, since cluster ellipticals atz & 0.5 are less evolvedand intrinsically slightly bluer than their counterparts at lowerredshifts (Lubin 1996).
A curved blue object, apparently a gravitationally lensed arc,is situated atα = 13h12m32.6s,δ = 7250′55′′, 7′′ east of thedistant giant elliptical galaxy (see Figure 6). This arc is quitebright (atI = 20.90,V = 21.39), and it is worth noting that the
comparatively bright arc magnitude places WL 1312.5+7252among the very small number of clusters atz > 0.5 that areknown to produce strongly lensed arcs that are sufficientlybright for spectroscopic studies. The only other such examplesknown to us are CL2236-04 (Melnick et al. 1993) and RCS0224-0002 (Gladders, Yee, & Ellingson 2002).
If this arc is indeed a strongly lensed galaxy, the separationbetween the arc and the giant elliptical galaxy can be used tomake a rough estimate of the mass of WL 1312.5+7252.
FIG. 6.— A blue arc curving around the central galaxy of thez = 0.55 clustercandidate WL 1312.5+7252 in the field of Abell 1705. North is up; east to theleft and the FOV is 2′×2′. This area is marked by the dotted lines in Fig. 5.
Assuming a SIS-type mass distribution centered on a gi-ant elliptical galaxy at redshiftzl = 0.6, and assuming that thelensed arc is situated at the Einstein radiusθE , we estimate avelocity dispersionσarc = c
√
(θEws)/(4πwls) ≃ 900km s−1 forzs = 1 andσarc ≃ 700km s−1 for zs = 2. The numbers above arecalculated for the case of an Einstein - de Sitter Universe, wherew = 1− (1+z)−1/2. The estimated velocity dispersion of 1150kms−1 for WL 1312.5+7252 (see Table 1) comes from a SIS-modelfit to the tangential weak shear averaged in radial bins centeredon the mass peak. This high value and the high aperture massvalueMap provides evidence for a relatively low arc redshift.The mass-to-light ratio listed in Table 1 is measured withinRapand is based on galaxies in the color range 2.0 < V − I < 2.8.The lower limit of this color interval was chosen to avoid fore-ground galaxies associated with A1705, and the upper limitwas chosen to avoid background galaxies that are significantlyredder than the red sequence of WL 1312.5+7252. TheM/LB
value is consistent with a normal luminous cluster, and assum-ing a redshift-dependenceLB ∝ (z+1) for the luminosity evolu-tion, the present-day value would beM/LB = (268±84)h.
The only pointed X-ray observation of WL 1312.5+7252 isa 3.8 ksec EINSTEIN IPC exposure. In the IPC image there isdiffuse emission from the main A1705 cluster extending in thedirection of WL 1312.5+7252. Also, there is a hint of diffuseemission extending towards the mass structure southeast ofthe
10 Dahle et al.
main cluster. The bright X-ray point source, RX J1313.5+7259,located northeast of the main cluster masks any signs of diffuseemission that might be associated with the feature in the massmap in this direction.
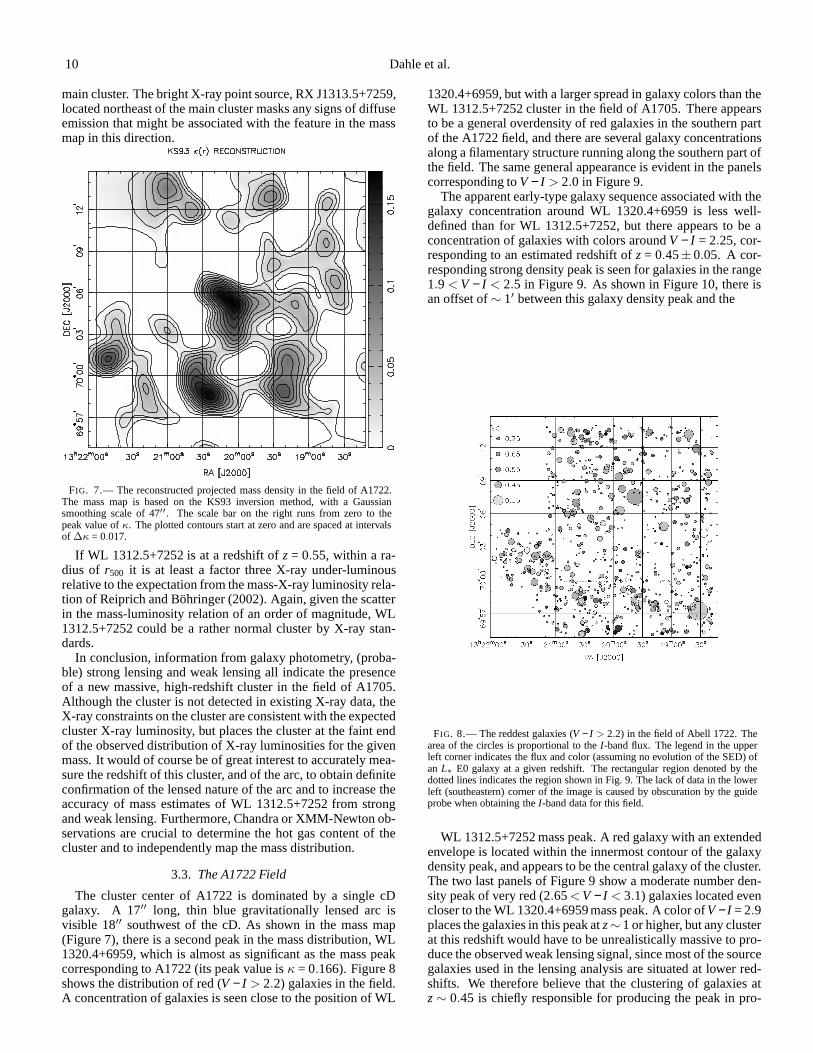
FIG. 7.— The reconstructed projected mass density in the field ofA1722.The mass map is based on the KS93 inversion method, with a Gaussiansmoothing scale of 47′′. The scale bar on the right runs from zero to thepeak value ofκ. The plotted contours start at zero and are spaced at intervalsof ∆κ = 0.017.
If WL 1312.5+7252 is at a redshift ofz = 0.55, within a ra-dius of r500 it is at least a factor three X-ray under-luminousrelative to the expectation from the mass-X-ray luminosityrela-tion of Reiprich and Böhringer (2002). Again, given the scatterin the mass-luminosity relation of an order of magnitude, WL1312.5+7252 could be a rather normal cluster by X-ray stan-dards.
In conclusion, information from galaxy photometry, (proba-ble) strong lensing and weak lensing all indicate the presenceof a new massive, high-redshift cluster in the field of A1705.Although the cluster is not detected in existing X-ray data,theX-ray constraints on the cluster are consistent with the expectedcluster X-ray luminosity, but places the cluster at the faint endof the observed distribution of X-ray luminosities for the givenmass. It would of course be of great interest to accurately mea-sure the redshift of this cluster, and of the arc, to obtain definiteconfirmation of the lensed nature of the arc and to increase theaccuracy of mass estimates of WL 1312.5+7252 from strongand weak lensing. Furthermore, Chandra or XMM-Newton ob-servations are crucial to determine the hot gas content of thecluster and to independently map the mass distribution.
3.3. The A1722 Field
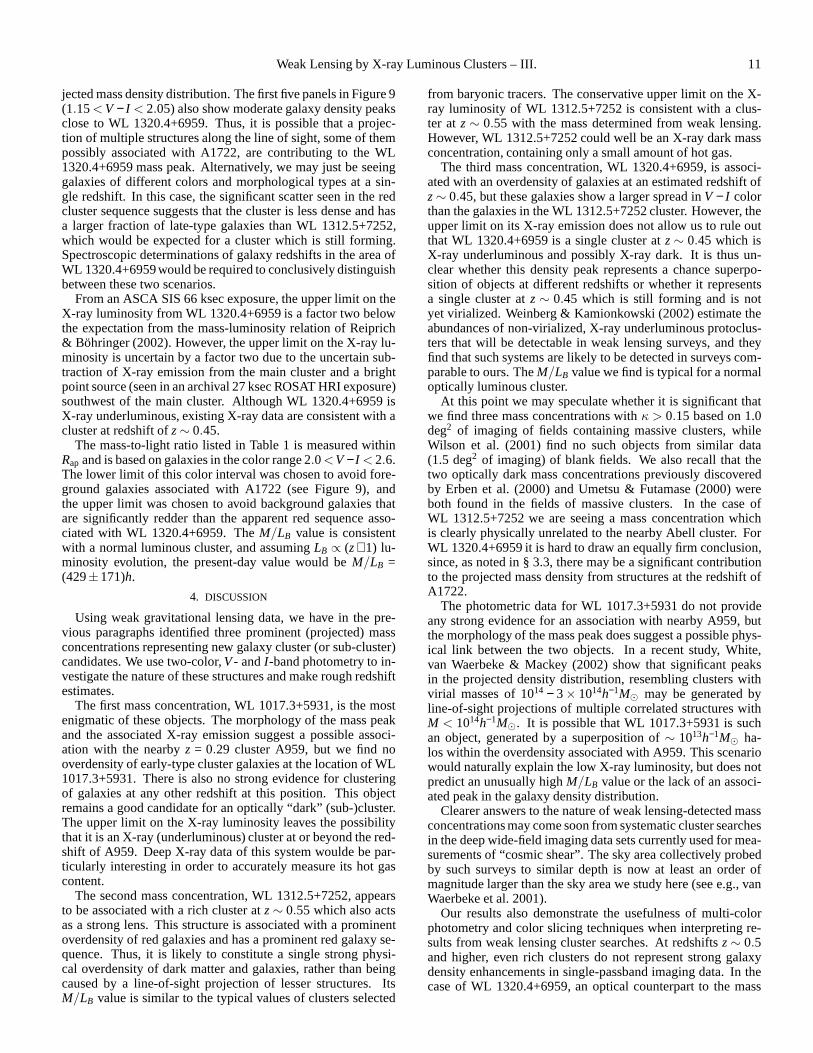
The cluster center of A1722 is dominated by a single cDgalaxy. A 17′′ long, thin blue gravitationally lensed arc isvisible 18′′ southwest of the cD. As shown in the mass map(Figure 7), there is a second peak in the mass distribution, WL1320.4+6959, which is almost as significant as the mass peakcorresponding to A1722 (its peak value isκ = 0.166). Figure 8shows the distribution of red (V − I > 2.2) galaxies in the field.A concentration of galaxies is seen close to the position of WL
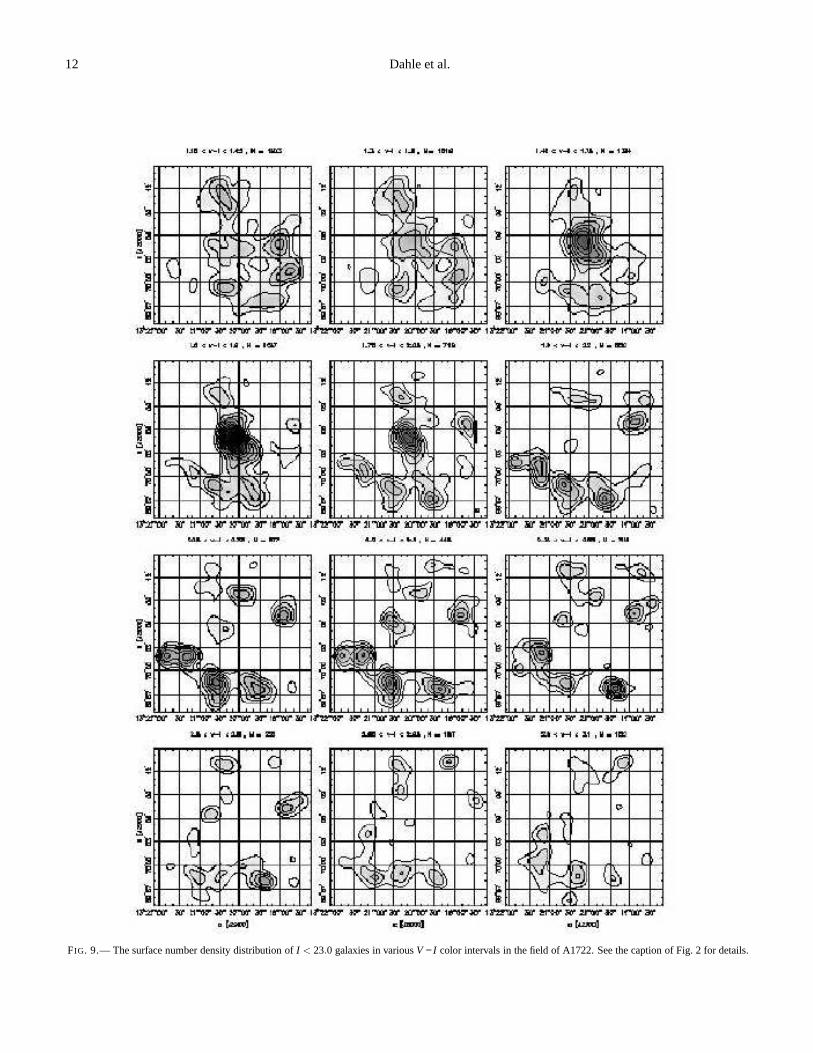
1320.4+6959, but with a larger spread in galaxy colors than theWL 1312.5+7252 cluster in the field of A1705. There appearsto be a general overdensity of red galaxies in the southern partof the A1722 field, and there are several galaxy concentrationsalong a filamentary structure running along the southern part ofthe field. The same general appearance is evident in the panelscorresponding toV − I > 2.0 in Figure 9.
The apparent early-type galaxy sequence associated with thegalaxy concentration around WL 1320.4+6959 is less well-defined than for WL 1312.5+7252, but there appears to be aconcentration of galaxies with colors aroundV − I = 2.25, cor-responding to an estimated redshift ofz = 0.45±0.05. A cor-responding strong density peak is seen for galaxies in the range1.9 < V − I < 2.5 in Figure 9. As shown in Figure 10, there isan offset of∼ 1′ between this galaxy density peak and the
FIG. 8.— The reddest galaxies (V − I > 2.2) in the field of Abell 1722. Thearea of the circles is proportional to theI-band flux. The legend in the upperleft corner indicates the flux and color (assuming no evolution of the SED) ofan L∗ E0 galaxy at a given redshift. The rectangular region denoted by thedotted lines indicates the region shown in Fig. 9. The lack ofdata in the lowerleft (southeastern) corner of the image is caused by obscuration by the guideprobe when obtaining theI-band data for this field.
WL 1312.5+7252 mass peak. A red galaxy with an extendedenvelope is located within the innermost contour of the galaxydensity peak, and appears to be the central galaxy of the cluster.The two last panels of Figure 9 show a moderate number den-sity peak of very red (2.65< V − I < 3.1) galaxies located evencloser to the WL 1320.4+6959 mass peak. A color ofV − I = 2.9places the galaxies in this peak atz∼ 1 or higher, but any clusterat this redshift would have to be unrealistically massive topro-duce the observed weak lensing signal, since most of the sourcegalaxies used in the lensing analysis are situated at lower red-shifts. We therefore believe that the clustering of galaxies atz ∼ 0.45 is chiefly responsible for producing the peak in pro-
Weak Lensing by X-ray Luminous Clusters – III. 11
jected mass density distribution. The first five panels in Figure 9(1.15< V − I < 2.05) also show moderate galaxy density peaksclose to WL 1320.4+6959. Thus, it is possible that a projec-tion of multiple structures along the line of sight, some of thempossibly associated with A1722, are contributing to the WL1320.4+6959 mass peak. Alternatively, we may just be seeinggalaxies of different colors and morphological types at a sin-gle redshift. In this case, the significant scatter seen in the redcluster sequence suggests that the cluster is less dense andhasa larger fraction of late-type galaxies than WL 1312.5+7252,which would be expected for a cluster which is still forming.Spectroscopic determinations of galaxy redshifts in the area ofWL 1320.4+6959would be required to conclusively distinguishbetween these two scenarios.
From an ASCA SIS 66 ksec exposure, the upper limit on theX-ray luminosity from WL 1320.4+6959 is a factor two belowthe expectation from the mass-luminosity relation of Reiprich& Böhringer (2002). However, the upper limit on the X-ray lu-minosity is uncertain by a factor two due to the uncertain sub-traction of X-ray emission from the main cluster and a brightpoint source (seen in an archival 27 ksec ROSAT HRI exposure)southwest of the main cluster. Although WL 1320.4+6959 isX-ray underluminous, existing X-ray data are consistent with acluster at redshift ofz ∼ 0.45.
The mass-to-light ratio listed in Table 1 is measured withinRap and is based on galaxies in the color range 2.0<V − I < 2.6.The lower limit of this color interval was chosen to avoid fore-ground galaxies associated with A1722 (see Figure 9), andthe upper limit was chosen to avoid background galaxies thatare significantly redder than the apparent red sequence asso-ciated with WL 1320.4+6959. TheM/LB value is consistentwith a normal luminous cluster, and assumingLB ∝ (z + 1) lu-minosity evolution, the present-day value would beM/LB =(429±171)h.
4. DISCUSSION
Using weak gravitational lensing data, we have in the pre-vious paragraphs identified three prominent (projected) massconcentrations representing new galaxy cluster (or sub-cluster)candidates. We use two-color,V - andI-band photometry to in-vestigate the nature of these structures and make rough redshiftestimates.
The first mass concentration, WL 1017.3+5931, is the mostenigmatic of these objects. The morphology of the mass peakand the associated X-ray emission suggest a possible associ-ation with the nearbyz = 0.29 cluster A959, but we find nooverdensity of early-type cluster galaxies at the locationof WL1017.3+5931. There is also no strong evidence for clusteringof galaxies at any other redshift at this position. This objectremains a good candidate for an optically “dark” (sub-)cluster.The upper limit on the X-ray luminosity leaves the possibilitythat it is an X-ray (underluminous) cluster at or beyond the red-shift of A959. Deep X-ray data of this system woulde be par-ticularly interesting in order to accurately measure its hot gascontent.
The second mass concentration, WL 1312.5+7252, appearsto be associated with a rich cluster atz ∼ 0.55 which also actsas a strong lens. This structure is associated with a prominentoverdensity of red galaxies and has a prominent red galaxy se-quence. Thus, it is likely to constitute a single strong physi-cal overdensity of dark matter and galaxies, rather than beingcaused by a line-of-sight projection of lesser structures.ItsM/LB value is similar to the typical values of clusters selected
from baryonic tracers. The conservative upper limit on the X-ray luminosity of WL 1312.5+7252 is consistent with a clus-ter at z ∼ 0.55 with the mass determined from weak lensing.However, WL 1312.5+7252 could well be an X-ray dark massconcentration, containing only a small amount of hot gas.
The third mass concentration, WL 1320.4+6959, is associ-ated with an overdensity of galaxies at an estimated redshift ofz ∼ 0.45, but these galaxies show a larger spread inV − I colorthan the galaxies in the WL 1312.5+7252 cluster. However, theupper limit on its X-ray emission does not allow us to rule outthat WL 1320.4+6959 is a single cluster atz ∼ 0.45 which isX-ray underluminous and possibly X-ray dark. It is thus un-clear whether this density peak represents a chance superpo-sition of objects at different redshifts or whether it representsa single cluster atz ∼ 0.45 which is still forming and is notyet virialized. Weinberg & Kamionkowski (2002) estimate theabundances of non-virialized, X-ray underluminous protoclus-ters that will be detectable in weak lensing surveys, and theyfind that such systems are likely to be detected in surveys com-parable to ours. TheM/LB value we find is typical for a normaloptically luminous cluster.
At this point we may speculate whether it is significant thatwe find three mass concentrations withκ > 0.15 based on 1.0deg2 of imaging of fields containing massive clusters, whileWilson et al. (2001) find no such objects from similar data(1.5 deg2 of imaging) of blank fields. We also recall that thetwo optically dark mass concentrations previously discoveredby Erben et al. (2000) and Umetsu & Futamase (2000) wereboth found in the fields of massive clusters. In the case ofWL 1312.5+7252 we are seeing a mass concentration whichis clearly physically unrelated to the nearby Abell cluster. ForWL 1320.4+6959 it is hard to draw an equally firm conclusion,since, as noted in § 3.3, there may be a significant contributionto the projected mass density from structures at the redshift ofA1722.
The photometric data for WL 1017.3+5931 do not provideany strong evidence for an association with nearby A959, butthe morphology of the mass peak does suggest a possible phys-ical link between the two objects. In a recent study, White,van Waerbeke & Mackey (2002) show that significant peaksin the projected density distribution, resembling clusters withvirial masses of 1014 − 3× 10¹⁴h−1M⊙ may be generated byline-of-sight projections of multiple correlated structures withM < 1014h−1M⊙. It is possible that WL 1017.3+5931 is suchan object, generated by a superposition of∼ 1013h−1M⊙ ha-los within the overdensity associated with A959. This scenariowould naturally explain the low X-ray luminosity, but does notpredict an unusually highM/LB value or the lack of an associ-ated peak in the galaxy density distribution.
Clearer answers to the nature of weak lensing-detected massconcentrations may come soon from systematic cluster searchesin the deep wide-field imaging data sets currently used for mea-surements of “cosmic shear”. The sky area collectively probedby such surveys to similar depth is now at least an order ofmagnitude larger than the sky area we study here (see e.g., vanWaerbeke et al. 2001).
Our results also demonstrate the usefulness of multi-colorphotometry and color slicing techniques when interpretingre-sults from weak lensing cluster searches. At redshiftsz ∼ 0.5and higher, even rich clusters do not represent strong galaxydensity enhancements in single-passband imaging data. In thecase of WL 1320.4+6959, an optical counterpart to the mass
12 Dahle et al.
FIG. 9.— The surface number density distribution ofI < 23.0 galaxies in variousV − I color intervals in the field of A1722. See the caption of Fig. 2for details.

Weak Lensing by X-ray Luminous Clusters – III. 13
FIG. 10.— The plots show a 225′′ × 150′′ region around the WL 1320.4+6959 mass peak in the field of A1722. Top: “True color” image based on 4.5h ofintegration in theV -band and 4h of integration in theI-band. Bottom: Solid lines show contours of the projected mass densityκ indicating the WL 1320.4+6959mass peak. Contour levels start atκ = 0.1 and are plotted at intervals of 0.02 in κ. The dashed lines are contours of the smoothed galaxy density distribution in the2.2 < V − I < 2.5 subpanel in Figure 9.

14 Dahle et al.
concentration could not be identified before data in a secondpassband had been obtained. It is also clear that X-ray datafrom either Chandra or XMM-Newton are required in order todetect or tightly constrain the hot gas content of the detected(sub-)clusters.
The methodology for cluster searches may be further refinedin the future by developing a more objective and quantitativesearch algorithm that combines weak gravitational lensingin-formation with e.g, the cluster-red-sequence method of Glad-ders & Yee and/or X-ray data. The X-ray data would be partic-ularly useful for separating line-of-sight superpositions of lessmassive objects (which would be a significant source of noiseand bias for both optical and weak lensing data; see e.g., Hoek-stra 2001; White et al. 2002) from genuine deep potential wells.This would greatly improve the power of such surveys to con-strain cosmological models.
We thank the anonymous referee for suggestions that have
improved our work and its presentation. We also thank Har-ald Ebeling, Jens Hjorth, Henk Hoekstra, Gerry Luppino, So-mak Raychaudhury, and Gillian Wilson for useful commentsand discussions. We thank the staff of the University of Hawaii2.24m telescope and the Nordic Optical Telescope for supportduring our observing runs. HD gratefully acknowledges sup-port from a doctoral research fellowship awarded by the Re-search Council of Norway. HD and PBL thank the ResearchCouncil of Norway for travel support. KP acknowledges sup-port from the Danish National Research Council. This researchhas made use of the NASA/IPAC Extragalactic Database (NED)which is operated by the Jet Propulsion Laboratory, CaliforniaInstitute of Technology, under contract with the National Aero-nautics and Space Administration. This research has made useof data obtained from the High Energy Astrophysics ScienceArchive Research Center (HEASARC), provided by NASA’sGoddard Space Flight Center.
REFERENCES
Abazajian, K., Fuller, G. M., & Tucker, W. H. 2001, ApJ, 562, 593.Abell, G. O. 1958, ApJS, 3, 211Bertin, E., & Arnouts, S. 1996, A&AS, 117, 393Briel, U., & Henry, J. P. 1993, A&A, 278, 379Böhringer, H. et al. 2000, ApJS, 129, 435Carlberg, R. G., Yee, H. K. C., & Ellingson, E. 1997, ApJ, 478,462Dahle, H., Kaiser, N., Irgens, R. J., Lilje, P. B., & Maddox, S. J. 2002, ApJS,
139, 313 (Paper I)Dickey, J.M. & Lockman, F.J.,1990, Ann.R.A& A., 28, 215Erben, T., van Waerbeke, L., Mellier, Y., Schneider, P., Cuillandre, J.-C.,
Castander, F. J., & Dantel-Fort, M. 2000, A&A, 355, 23Ettori, S. & Fabian, A. C. 1999, MNRAS, 305, 834Fahlman, G., Kaiser, N., Squires, G., & Woods, D. 1994, ApJ, 437, 56Finoguenov, A.; Reiprich, T. H.; Böhringer, H. 2001, A&A, 368, 749Fischer, P. 1999, AJ, 117, 2024Gladders, M. D. & Yee, H. K. C. 2000, AJ, 120, 2148Gray, M. E., Ellis, R. S., Lewis, J. R., McMahon, R. G., & Firth, A. E. 2001,
MNRAS, 325, 111Hansen, S. H., Lesgourgues, J., Pastor, S., & Silk, J. 2002, MNRAS, 333, 544Hoekstra, H. 2001, A&A, 370, 743Hoekstra, H., Franx, M., Kuijken, K., & van Dokkum, P. G. 2002, MNRAS,
333, 911
Irgens, R. J., Lilje, P. B., Dahle, H., & Maddox, S. J. 2002, ApJ, 579, 227(Paper II)
Kaiser, N. 2000, ApJ, 537, 555Kaiser, N. & Squires,G. 1993, ApJ, 404, 441, KS93Kaiser, N., Squires, G., Fahlman, G., & Woods, D. 1994, in “Clusters of
Galaxies”, XXIXth Rencontres de Moriond, ed. F. Durret, A. Mazure, and J.Tran Thanh Van (Gif-sur-Yvette: Edition Frontières)
Kaiser, N., Wilson, G., Luppino, G., & Dahle, H. 1999, preprint(astro-ph/9907229)
Lubin, L. M. 1996, AJ, 112, 23Miralles, J.-M. et al. 2002, A&A, 388, 68Mushotzky, R. F. & Scharf, C. A. 1997, ApJ, 482, L13Reiprich, T. H. & Böhringer, H. 2002, ApJ, 567, 716Smail, I., Edge, A. C., Ellis, R. S., & Blandford, R. D. 1998, MNRAS, 293,
124Stanford, S. A., Eisenhardt, P. R., & Dickinson, M. 1998, ApJ, 492, 461Umetsu, K. & Futamase, T. 2000, ApJ, 539, L5Van Waerbeke, L. et al. 2001, A&A, 374, 757.Weinberg, N. N. & Kamionkowski, M. 2002, MNRAS, 337, 1269White, M., van Waerbeke, L., & Mackey, J. 2002, ApJ, 575, 640Wilson, G., Kaiser, N., & Luppino, G. A. 2001, ApJ, 556, 601Wittman, D., Tyson, J. A., Margoniner, V. E., Cohen, J. G., & Dell’Antonio,
I. P. 2001, ApJ, 557, L89
Related Documents