“We have the duty of formulating, of summarising and of communicating our conclusions, in intelligence form, in recognition of the right of ‘other’ free minds to utilize them in making ‘their own decisions’.” -R.A.Fisher (Father of Statistics) “It is easy to lie with statistics. It is hard to tell the truth without statistics”. -Andrejs Dunkels

Welcome message from author
This document is posted to help you gain knowledge. Please leave a comment to let me know what you think about it! Share it to your friends and learn new things together.
Transcript
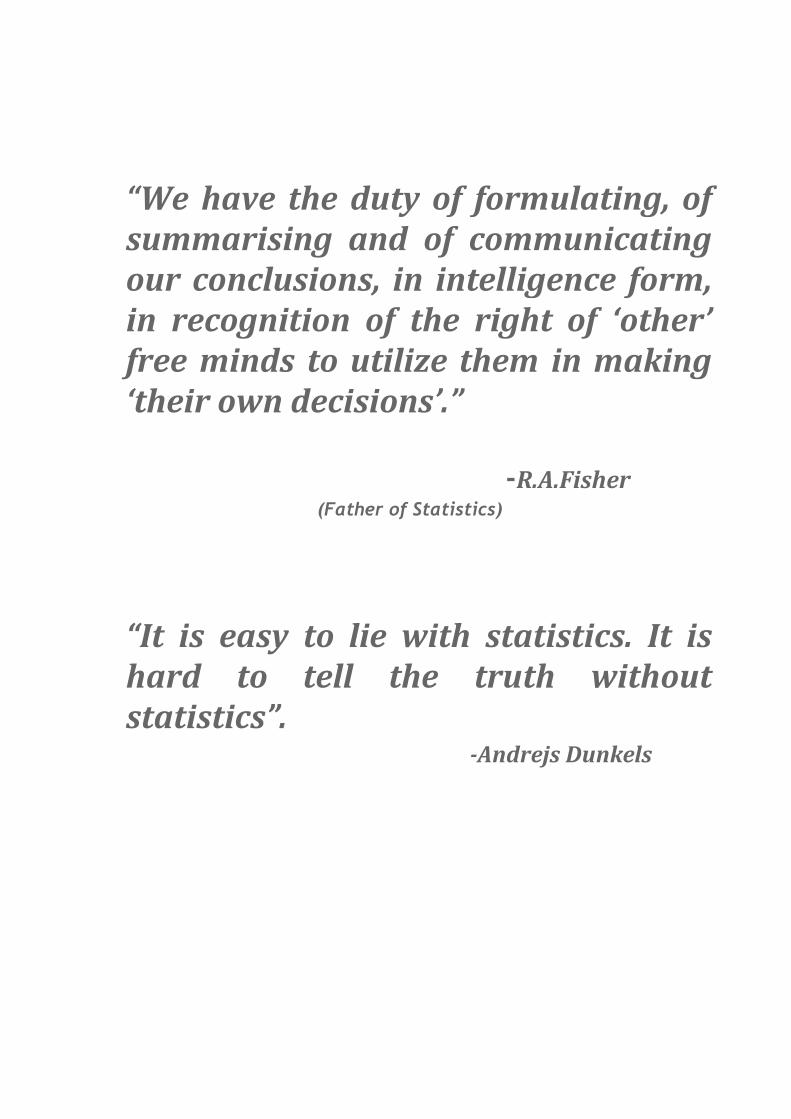
“We have the duty of formulating, of summarising and of communicating our conclusions, in intelligence form, in recognition of the right of ‘other’ free minds to utilize them in making ‘their own decisions’.”
-R.A.Fisher
(Father of Statistics)
“It is easy to lie with statistics. It is hard to tell the truth without statistics”.
-Andrejs Dunkels
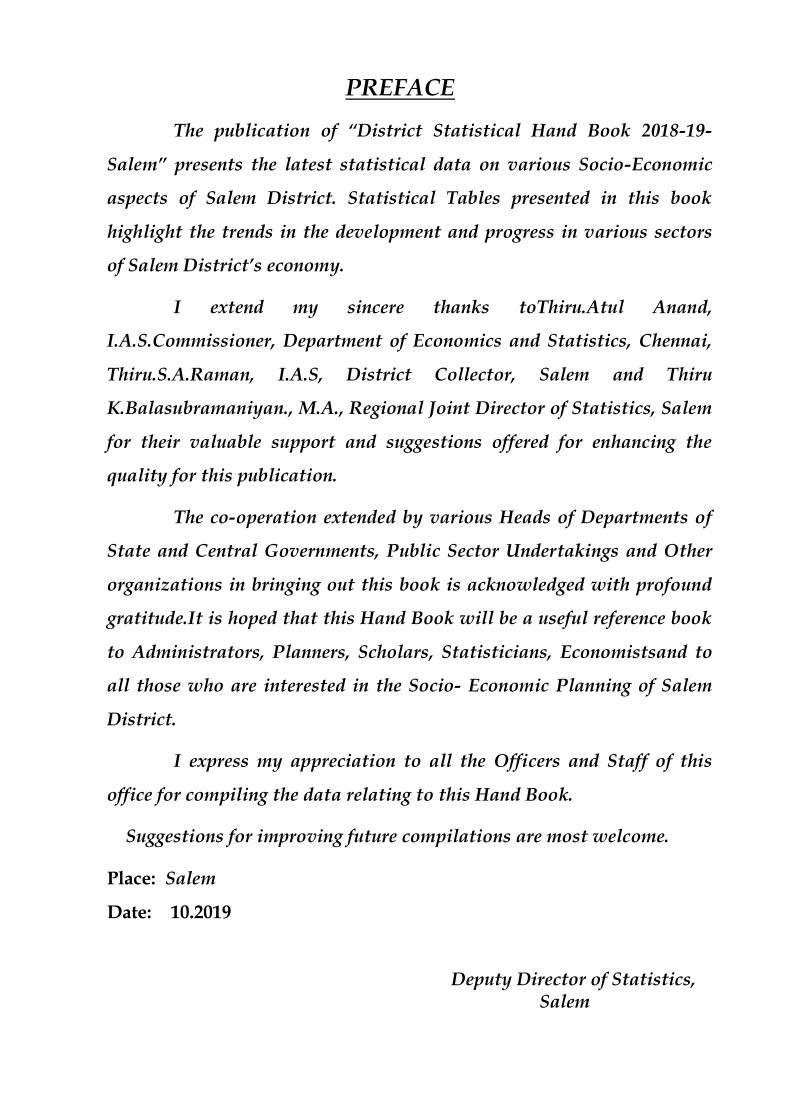
PREFACE
The publication of “District Statistical Hand Book 2018-19-
Salem” presents the latest statistical data on various Socio-Economic
aspects of Salem District. Statistical Tables presented in this book
highlight the trends in the development and progress in various sectors
of Salem District’s economy.
I extend my sincere thanks toThiru.Atul Anand,
I.A.S.Commissioner, Department of Economics and Statistics, Chennai,
Thiru.S.A.Raman, I.A.S, District Collector, Salem and Thiru
K.Balasubramaniyan., M.A., Regional Joint Director of Statistics, Salem
for their valuable support and suggestions offered for enhancing the
quality for this publication.
The co-operation extended by various Heads of Departments of
State and Central Governments, Public Sector Undertakings and Other
organizations in bringing out this book is acknowledged with profound
gratitude.It is hoped that this Hand Book will be a useful reference book
to Administrators, Planners, Scholars, Statisticians, Economistsand to
all those who are interested in the Socio- Economic Planning of Salem
District.
I express my appreciation to all the Officers and Staff of this
office for compiling the data relating to this Hand Book.
Suggestions for improving future compilations are most welcome.
Place: Salem
Date: 10.2019
Deputy Director of Statistics, Salem
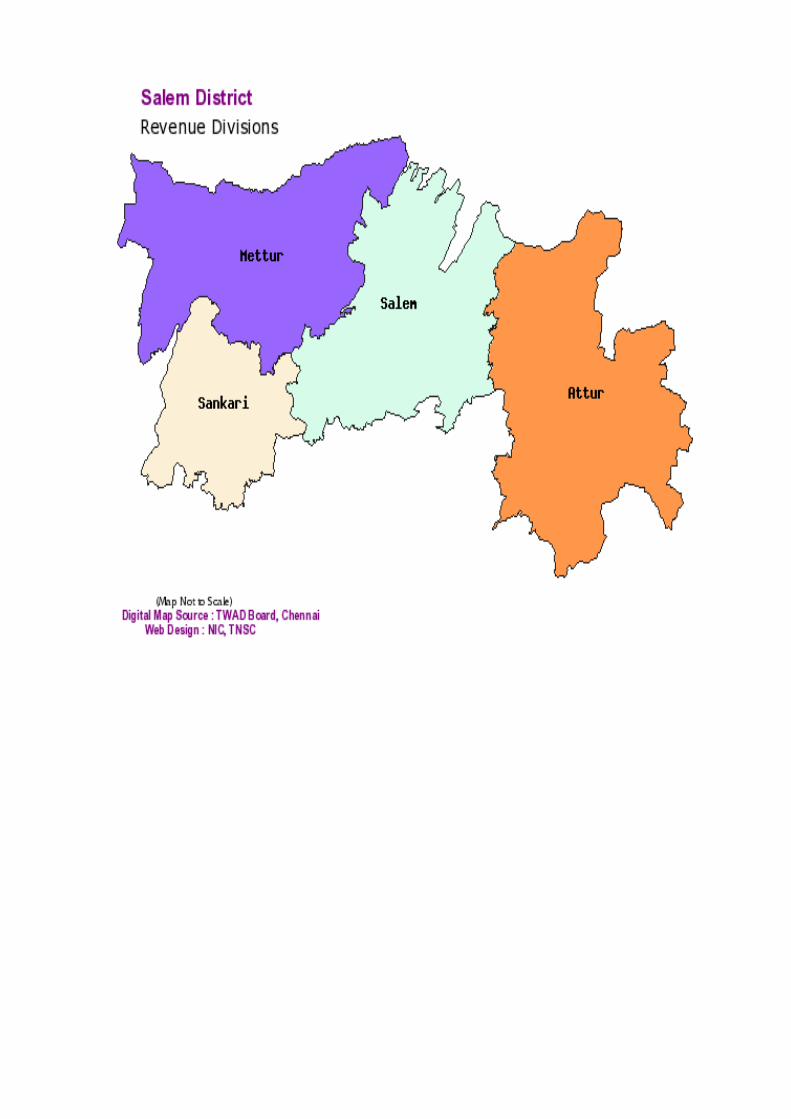
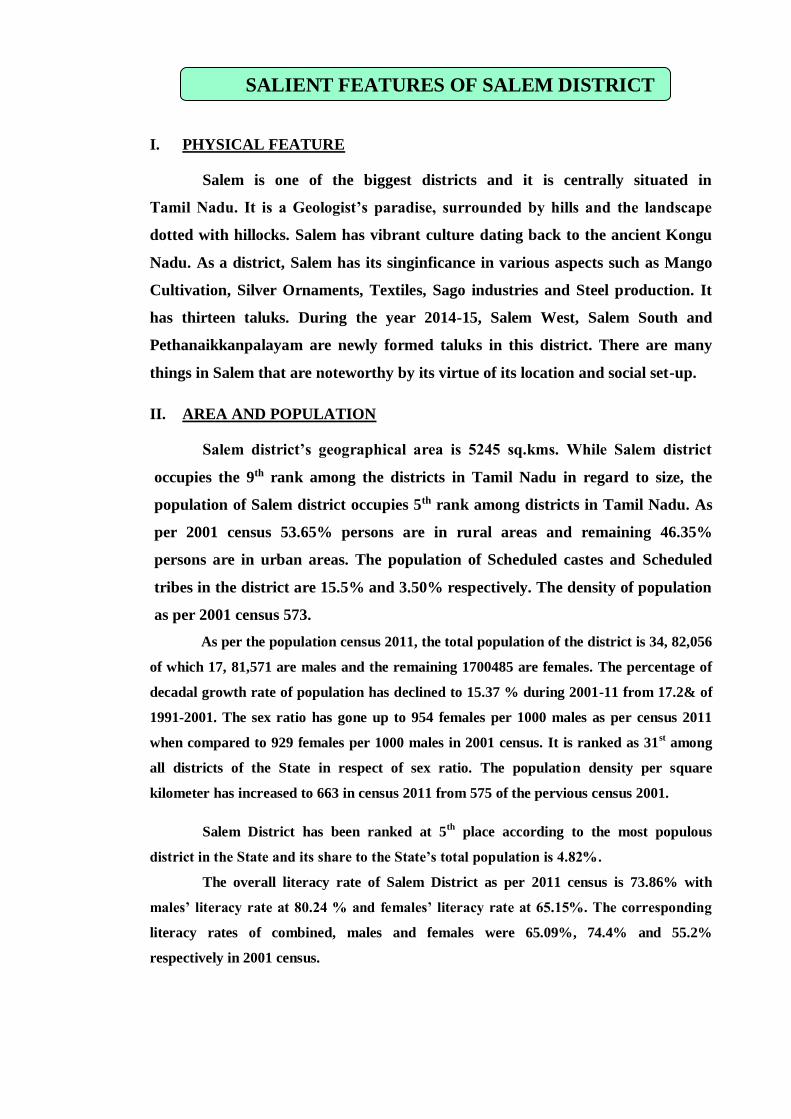
SALIENT FEATURES OF SALEM DISTRICT
I. PHYSICAL FEATURE
Salem is one of the biggest districts and it is centrally situated in
Tamil Nadu. It is a Geologist’s paradise, surrounded by hills and the landscape
dotted with hillocks. Salem has vibrant culture dating back to the ancient Kongu
Nadu. As a district, Salem has its singinficance in various aspects such as Mango
Cultivation, Silver Ornaments, Textiles, Sago industries and Steel production. It
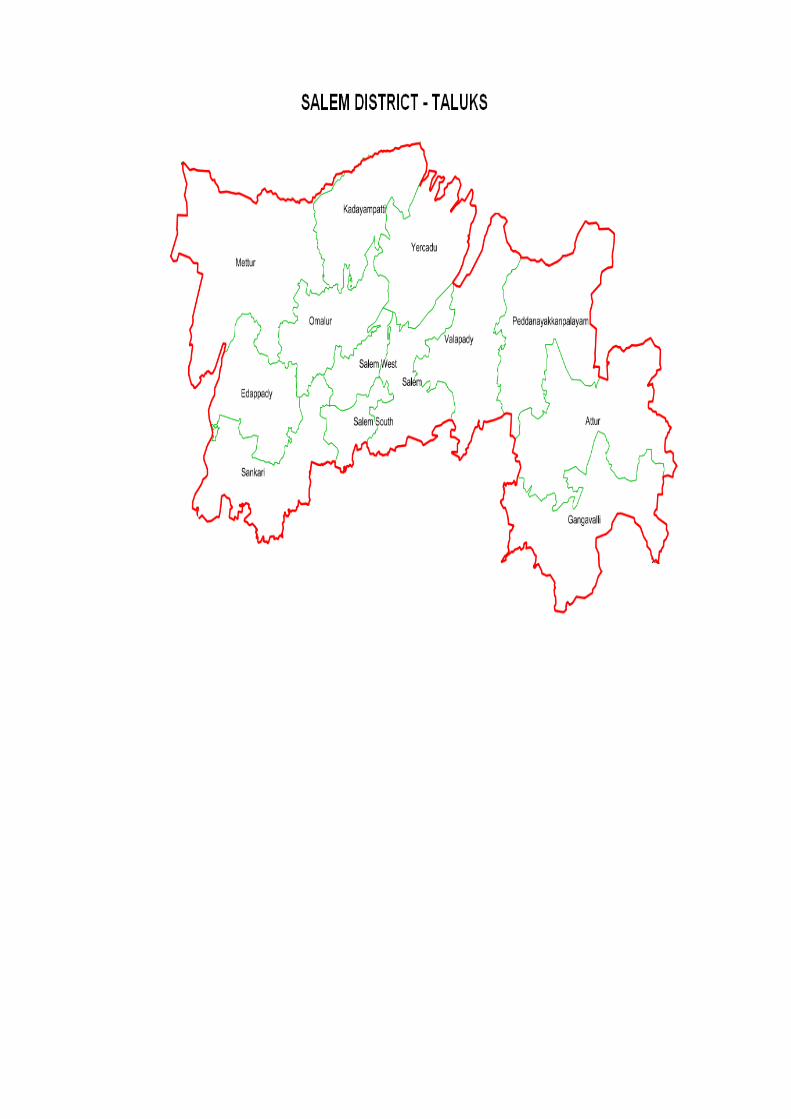
has thirteen taluks. During the year 2014-15, Salem West, Salem South and
Pethanaikkanpalayam are newly formed taluks in this district. There are many
things in Salem that are noteworthy by its virtue of its location and social set-up.
II. AREA AND POPULATION
Salem district’s geographical area is 5245 sq.kms. While Salem district
occupies the 9th rank among the districts in Tamil Nadu in regard to size, the
population of Salem district occupies 5th rank among districts in Tamil Nadu. As
per 2001 census 53.65% persons are in rural areas and remaining 46.35%
persons are in urban areas. The population of Scheduled castes and Scheduled
tribes in the district are 15.5% and 3.50% respectively. The density of population
as per 2001 census 573.
As per the population census 2011, the total population of the district is 34, 82,056
of which 17, 81,571 are males and the remaining 1700485 are females. The percentage of
decadal growth rate of population has declined to 15.37 % during 2001-11 from 17.2& of
1991-2001. The sex ratio has gone up to 954 females per 1000 males as per census 2011
when compared to 929 females per 1000 males in 2001 census. It is ranked as 31st among
all districts of the State in respect of sex ratio. The population density per square
kilometer has increased to 663 in census 2011 from 575 of the pervious census 2001.
Salem District has been ranked at 5th
place according to the most populous
district in the State and its share to the State’s total population is 4.82%.
The overall literacy rate of Salem District as per 2011 census is 73.86% with
males’ literacy rate at 80.24 % and females’ literacy rate at 65.15%. The corresponding
literacy rates of combined, males and females were 65.09%, 74.4% and 55.2%
respectively in 2001 census.
III. CLIMATE AND RAINFALL
Rainfall is a single most important factor for
success of crops in the farming areas.The district
receives the rain under the influence of both
southwest and northest monsoons. Thenortheast
monsoon chiefly contributes to the rainfall in the
district.
Rainfall intensity is classified according to the
rate of precipitation: Light rain — when the
precipitation rate is < 2.5 mm (0.098 in) per hour.
Moderate rain — when the precipitation rate is
between 2.5 mm (0.098 in) - 7.6 mm (0.30 in) or
10 mm (0.39 in) per hour.
Salem district received actual rainfall of 638.6 mm in the year 2018-19, when
compared with the normal rainfall of 997.9 mm. i.e. 38% of rainfall decreased when
compared with previous year.
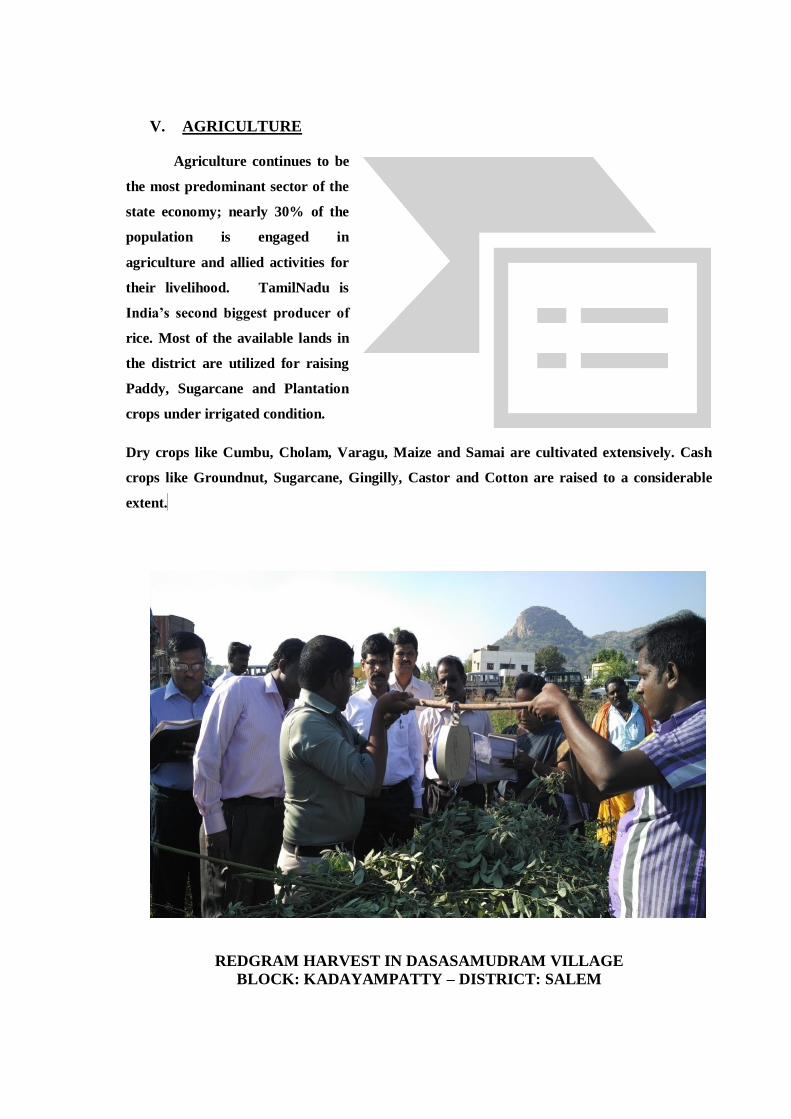
IV. THE STANLEY RESERVOIR
Stanley Reservoir is one of the largest
fishing reservoirs in South India. Its main source
of water is the river Cauvery. Three main
tributaries such as Palar, Chennar and Thoppar
enter into the Cauvery on its course above Stanley
Reservoir. An architectural marvel and important
land mark in the Mettur Division of Salem, it is the
heart that pumps the life giving water to the
farmers of the Cauvery basin who suffer the
vagaries of Indian monsoons.
The Sixteen Gates is an Engineering master-piece and regulates the flow of water
released from Mettur Dam to the lower reaches covering the paddy fields in the
eight districts of Salem, Erode, Namakkal, Karur, Tiruchirapalli, Thanjavur, Thiruvarur
and Nagapattinam. The total length of the dam is 1700 meters. The Mettur Hydro Electrical
Power Project is also quite large. Dam, park, major hydroelectric power stations and hills on
all sides make Mettur a good tourist attraction.
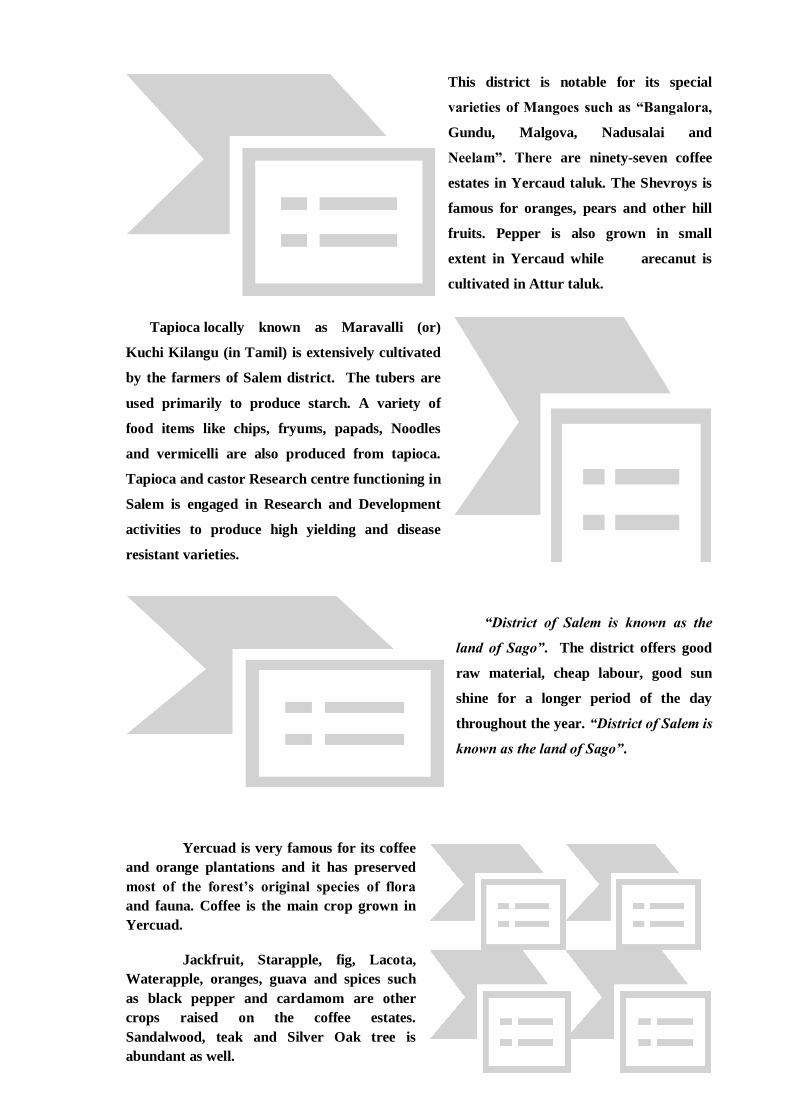
V. AGRICULTURE
Agriculture continues to be
the most predominant sector of the
state economy; nearly 30% of the
population is engaged in
agriculture and allied activities for
their livelihood. TamilNadu is
India’s second biggest producer of
rice. Most of the available lands in
the district are utilized for raising
Paddy, Sugarcane and Plantation
crops under irrigated condition.
Dry crops like Cumbu, Cholam, Varagu, Maize and Samai are cultivated extensively. Cash
crops like Groundnut, Sugarcane, Gingilly, Castor and Cotton are raised to a considerable
extent. 0
REDGRAM HARVEST IN DASASAMUDRAM VILLAGE
BLOCK: KADAYAMPATTY – DISTRICT: SALEM
This district is notable for its special
varieties of Mangoes such as “Bangalora,
Gundu, Malgova, Nadusalai and
Neelam”. There are ninety-seven coffee
estates in Yercaud taluk. The Shevroys is
famous for oranges, pears and other hill
fruits. Pepper is also grown in small
extent in Yercaud while arecanut is
cultivated in Attur taluk.
Tapioca locally known as Maravalli (or)
Kuchi Kilangu (in Tamil) is extensively cultivated
by the farmers of Salem district. The tubers are
used primarily to produce starch. A variety of
food items like chips, fryums, papads, Noodles
and vermicelli are also produced from tapioca.
Tapioca and castor Research centre functioning in
Salem is engaged in Research and Development
activities to produce high yielding and disease
resistant varieties.
“District of Salem is known as the
land of Sago”. The district offers good
raw material, cheap labour, good sun
shine for a longer period of the day
throughout the year. “District of Salem is
known as the land of Sago”.
Yercuad is very famous for its coffee
and orange plantations and it has preserved
most of the forest’s original species of flora
and fauna. Coffee is the main crop grown in
Yercuad.
Jackfruit, Starapple, fig, Lacota,
Waterapple, oranges, guava and spices such
as black pepper and cardamom are other
crops raised on the coffee estates.
Sandalwood, teak and Silver Oak tree is
abundant as well.
IV .INDUSTRY
Salem is a major textile centre in
TamilNadu, with more than 125 spinning
mills, weaving mills and garment units.
The handloom industry is one of the most
ancient cottages in Salem district of
TamilNadu. Saree, Dhoti and
Angavasthram are made out of silk yarn
and Cotton yarn. The weavers engaged
under Handloom are concentrated
mainly in Salem, Sankagiri, Edapady
and Omalur Taluks. Kondalampatti is a
small census town in the district and it is
famous for its silk handloom products.
Kondalampatti handlooms are well
known for the durability of the colours
used in the yarn.
The other thriving Industries are sago manufacturing and power loom cloth
production. Mettur has become a powerful industrial center due to the availability of power
and water. In Salem taluk there are four major mining engaged in mining of Magnetite.
The Salem Steel Plant is a special
steels unit of Steel Authority of India
Ltd., pioneered the supply of wider
width stainless steel sheets / coils in
India. The plant can produce
austenitic, ferritic, martenstic and
low-nickel stainless steel in the form
of coils and sheets with an installed
capacity of 70,000 tonnes / year in
Cold Rolling Mill and 1, 86,000
tonnes / year in Hot Rolling
Mill. In addition, the plant has
country's first top-of-the-line stainless steel blanking facility with a capacity of 3,600 tonnes of
coin blanks and utility blanks / circles.
India’s largest producer of special
steel in the long products category,
JSW Steels Salem plant mainly caters
to the automotive sector. It is
environment friendly, zero effluent
plant. The Salem plant manufactures
various grades of special steel in the
long products category, ranging from
5.5 mm to 200 mm. It is the Asian
leader for the manufacture of special
grade steel used in gears, crank shafts
and bearings. It is also manufactures
ultra low-sulphur steel for sourgas
pipelines and alloy steel for boilers
The Chemplast Sanmar Ltd is
also a big industry in Mettur
providing lot of employment
opportunities to the people and
plays a vital role to the economic
development of the district.
Chemplast Sanmar owns five plants
in Mettur, a small town located
around the dam which controls the
entry of the River Cauvery into
Tamil Nadu.
Sanmar has set up zero effluents discharge mechanism in its Mettur plant to curb
pollution. For this effort, the company won the CII Water Award for Excellence in Water
management organized by the Confederation of Indian Industry (CII) in Hyderabad.
VI. RURAL AND COTTAGE INDUSTRIES
Concentration of Rural
Industries like coir making, silver
ornaments and pottery works etc.,
play a vital role in earning livelihood
to many in Salem taluk. Handloom
weaving is made in Salem, Edapady
and Tharamangalam. Sago industries
are in Attur and Salem.
Bee keeping in Yercaud has made a
perceptible dent in industrialization of the
district. Production of unbleached sugar-vellam
or Nattu Sarkarai – is a major cottage industry
among the sugarcane cultivators of Salem.
Rope making is another major cottage
industryRopes are made by people out of the
fibers of coconut, Aloe Vera, Cotton and Jute.
Salem has a sizeable weaver population and
weaving is an important house hold industry
here. Both silk and cotton fabrics woven in
Salem find popular market throughout the
State. The Ammapet weaver’s co-operative
society has a turnover of 2.40 Crores and its
main products are cotton sarees, bed sheets,
towels, silk sarees and dhotis. Making of Silver ornaments and artifacts by hand work is an
important cottage industry in Salem. Silver anklets made in Salem are popular throughout
the country.
VII. MINERAL DEPOSITS
The district is rich with minerals like Magnesite, Bauxite, Granite,Limestone, quartz
and Iron ore. Allied industries like Magnesite mining, Cement Manufacture, refractory
bricks manufacture, Aluminum melting etc., thrive well.
VIII. SANDAL WOOD
Santalum album species of Sandal wood grows in the forests of Salem. They fetch high
prices as their heart woods yield high oil content of about 6% (average). The Mysore Sandal
soap company is a noted buyer of Sandal woods from Salem.
IX. ANIMAL HUSBANDRY
The Sheep Research station located at Mecheri in Mettur, developed and introduced
the popular Mecheri Breed. The breed is popular among the farmers and is reared mainly for
meat purposes.
X. DAIRY
Salem Dairy has an impressive milk production and the district stands first in milk
production. A variety of milk products have been introduced by the Dairy recently and are
effectively marketed.
XI. CINEMA THEATRES
Salem was once a popular Tinsel town where the earlier Tamil movies were created in the
Modern Theatres. The people of Salem are great movie viewers and the popularity of cinema
is evident from the fact that there are nearly a hundred and odd Theatres in the district-
perhaps the largest in any district. Nevertheless these industries are reduced due to
developing of modern Technologies nowadays.
XII. TEMPLES
Many temples with intricate sculptures and
imposing towers are found in the district of
Salem, built by indigenous rulers’ centuries
before the British era. Some of the popular
temples are the Taramangalam Shivan
Temple in Omalur and the Sukavaneswarar
temple, Kottai Mariamman temple,
Parsanna Venkatesha Perumal temple in
Salem.
XIII. FORT
Forts had existed in Salem town and
Omalur said to have been visited by
Tipu Sultan. Uncared for not even the
ruins of these monuments remain to
be seen today. However at Sankagiri
an impressive fort is seen on a hillock,
with its elaborate and massive
ramparts running all the way up the
hill. This fort is said to have been the
holding of “Theeran Chinnamalai” –
an indigenous warrior who fought
against British oppression.
XIV. TOURISM
Yercuad is a hill station and popular
summer resort in Salem. It is located
in the Shevaroys range of hills in the
Eastern Ghats, the yercuad hill area
is called the “Shevoray Hills” and it
is also called as “Jewel of the South”.
The Shervarayan temple deep inside
a narrow cavern with a rivulet
rippling behind the idols is one of
the main spots of tourist attraction.
‘Kurunji’ once in twelve years also attracts tourists. Coffee, spices like cardomom, pepper,
fruits like "Kamala" Orange, butter fruit, Jack fruit are grown in Yercaud and find good
market. Yercaud houses many colonial buildings and churches. The prestigious residential
school “The Montfort School” is at Yercaud. Yercaud is populary known as poorer Ooty.
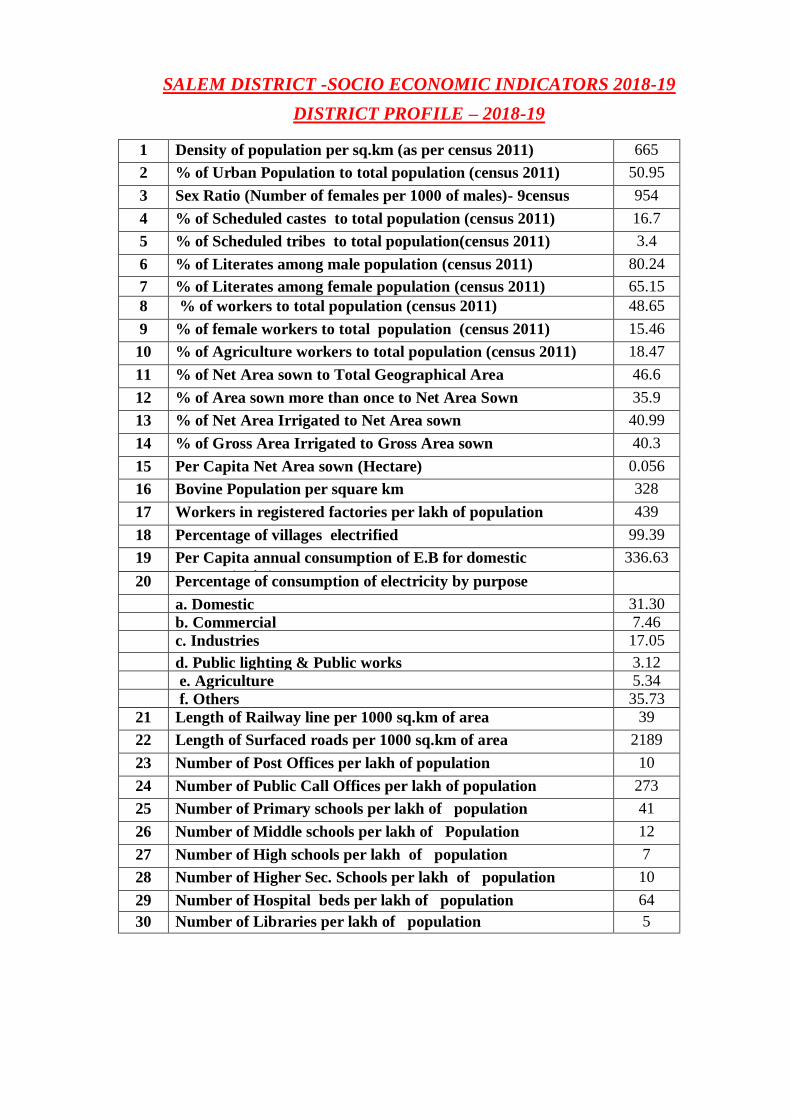
SALEM DISTRICT -SOCIO ECONOMIC INDICATORS 2018-19
DISTRICT PROFILE – 2018-19
1 Density of population per sq.km (as per census 2011) 665
2 % of Urban Population to total population (census 2011) 50.95
3 Sex Ratio (Number of females per 1000 of males)- 9census
2011)
954
4 % of Scheduled castes to total population (census 2011) 16.7
5 % of Scheduled tribes to total population(census 2011) 3.4
6 % of Literates among male population (census 2011) 80.24
7 % of Literates among female population (census 2011) 65.15
8 % of workers to total population (census 2011) 48.65
9 % of female workers to total population (census 2011) 15.46
10 % of Agriculture workers to total population (census 2011) 18.47
11 % of Net Area sown to Total Geographical Area 46.6
12 % of Area sown more than once to Net Area Sown 35.9
13 % of Net Area Irrigated to Net Area sown 40.99
14 % of Gross Area Irrigated to Gross Area sown 40.3
15 Per Capita Net Area sown (Hectare) 0.056
16 Bovine Population per square km 328
17 Workers in registered factories per lakh of population 439
18 Percentage of villages electrified 99.39
19 Per Capita annual consumption of E.B for domestic
purpose(units)
336.63
20 Percentage of consumption of electricity by purpose
a. Domestic 31.30
b. Commercial 7.46
c. Industries 17.05
d. Public lighting & Public works 3.12
e. Agriculture
5.34
f. Others 35.73
21 Length of Railway line per 1000 sq.km of area 39
22 Length of Surfaced roads per 1000 sq.km of area 2189
23 Number of Post Offices per lakh of population 10
24 Number of Public Call Offices per lakh of population 273
25 Number of Primary schools per lakh of population 41
26 Number of Middle schools per lakh of Population 12
27 Number of High schools per lakh of population 7
28 Number of Higher Sec. Schools per lakh of population 10
29 Number of Hospital beds per lakh of population 64
30 Number of Libraries per lakh of population
5
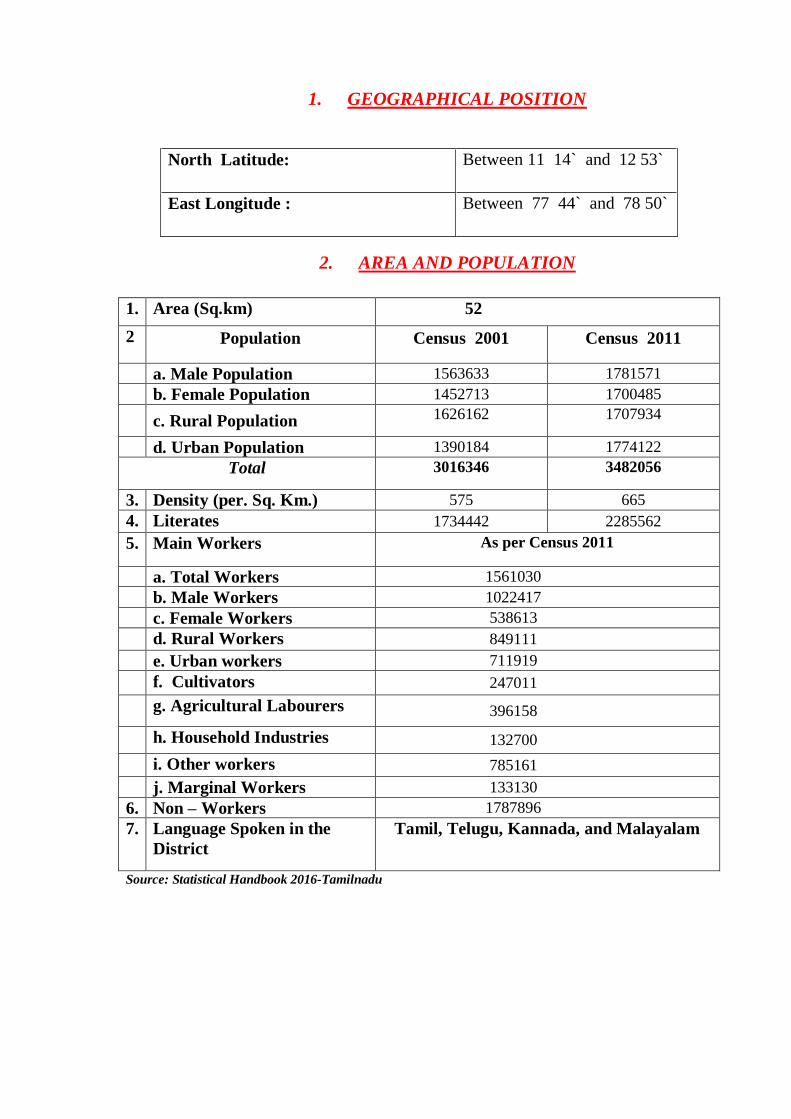
1. GEOGRAPHICAL POSITION
North Latitude: Between 11 14` and 12 53`
East Longitude : Between 77 44` and 78 50`
2. AREA AND POPULATION
1. Area (Sq.km) 52
2 Population Census 2001 Census 2011
a. Male Population 1563633 1781571
b. Female Population 1452713 1700485
c. Rural Population 1626162 1707934
d. Urban Population 1390184 1774122
Total 3016346 3482056
3. Density (per. Sq. Km.) 575 665
4. Literates 1734442 2285562
5. Main Workers As per Census 2011
a. Total Workers 1561030
b. Male Workers 1022417
c. Female Workers 538613
d. Rural Workers 849111
e. Urban workers 711919
f. Cultivators 247011
g. Agricultural Labourers 396158
h. Household Industries 132700
i. Other workers 785161
j. Marginal Workers 133130
6. Non – Workers 1787896
7. Language Spoken in the
District
Tamil, Telugu, Kannada, and Malayalam
Source: Statistical Handbook 2016-Tamilnadu
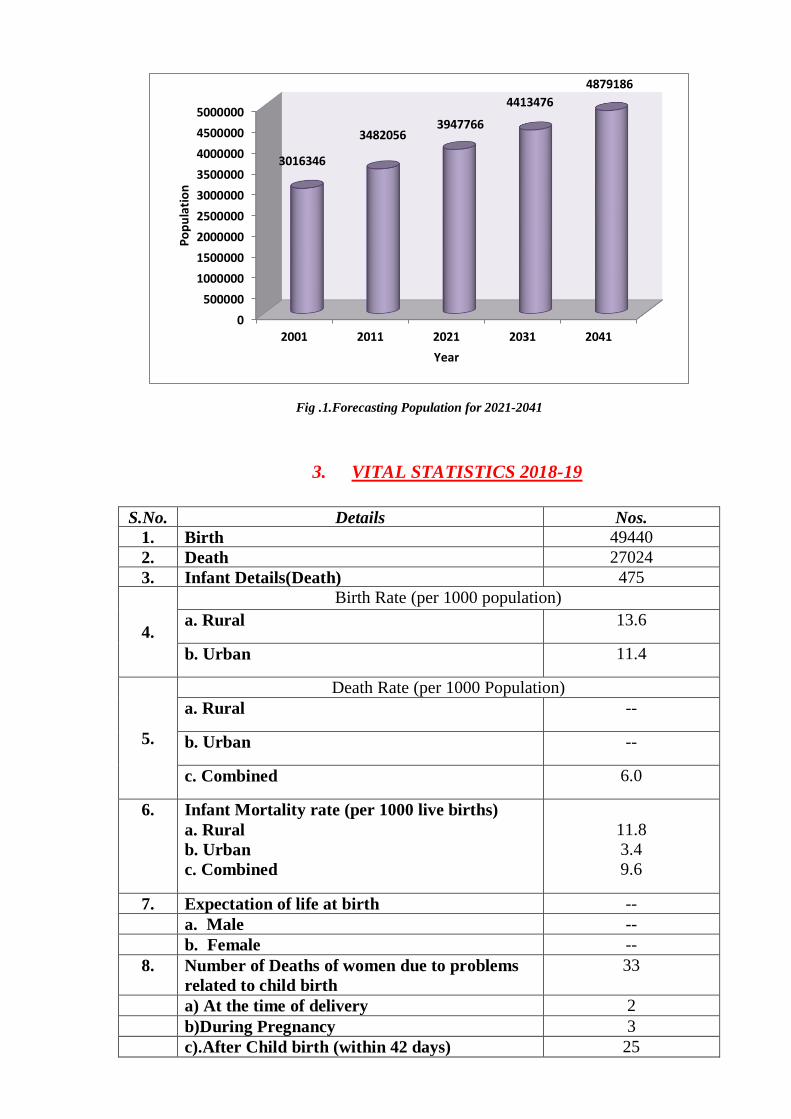
Fig .1.Forecasting Population for 2021-2041
3. VITAL STATISTICS 2018-19
S.No. Details Nos.
1. Birth 49440
2. Death 27024
3. Infant Details(Death) 475
4.
Birth Rate (per 1000 population)
a. Rural 13.6
b. Urban 11.4
5.
Death Rate (per 1000 Population)
a. Rural --
b. Urban --
c. Combined 6.0
6. Infant Mortality rate (per 1000 live births)
a. Rural
b. Urban
c. Combined
11.8
3.4
9.6
7. Expectation of life at birth --
a. Male --
b. Female --
8. Number of Deaths of women due to problems
related to child birth
33
a) At the time of delivery 2
b)During Pregnancy 3
c).After Child birth (within 42 days) 25
0
500000
1000000
1500000
2000000
2500000
3000000
3500000
4000000
4500000
5000000
2001 2011 2021 2031 2041
3016346
34820563947766
4413476
4879186
Po
pu
lati
on
Year
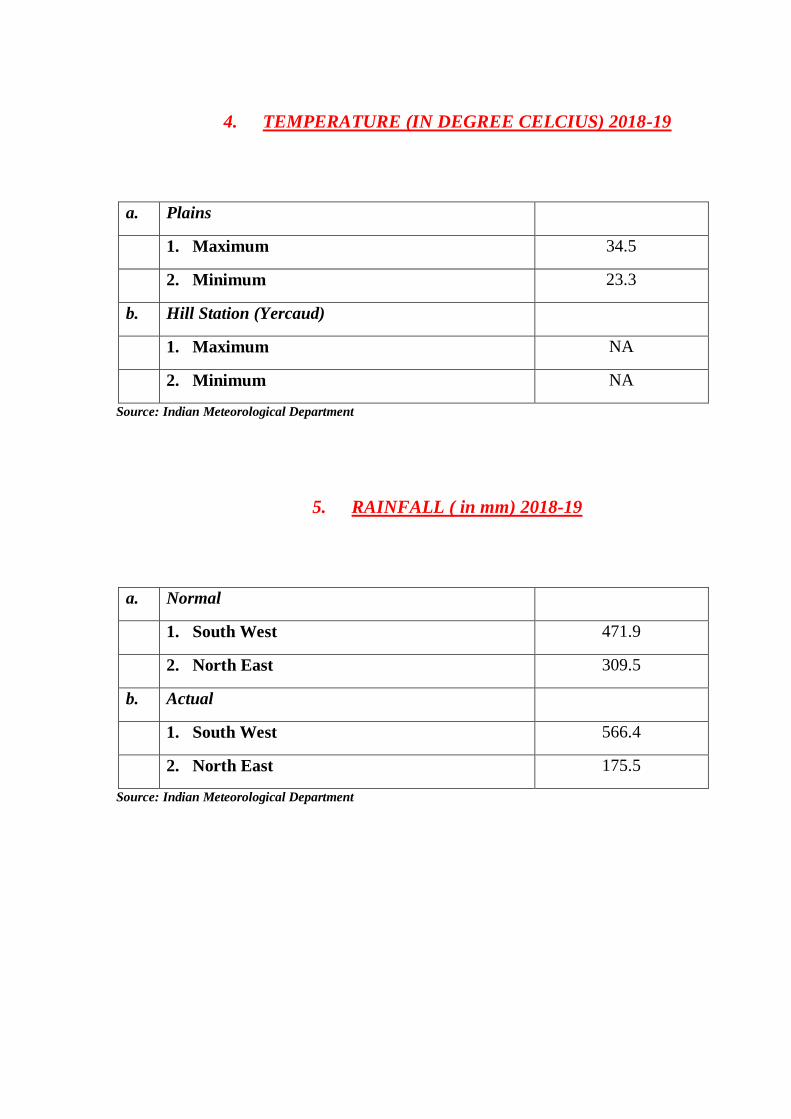
4. TEMPERATURE (IN DEGREE CELCIUS) 2018-19
a. Plains
1. Maximum 34.5
2. Minimum 23.3
b. Hill Station (Yercaud)
1. Maximum NA
2. Minimum NA
Source: Indian Meteorological Department
5. RAINFALL ( in mm) 2018-19
a. Normal
1. South West 471.9
2. North East 309.5
b. Actual
1. South West 566.4
2. North East 175.5
Source: Indian Meteorological Department
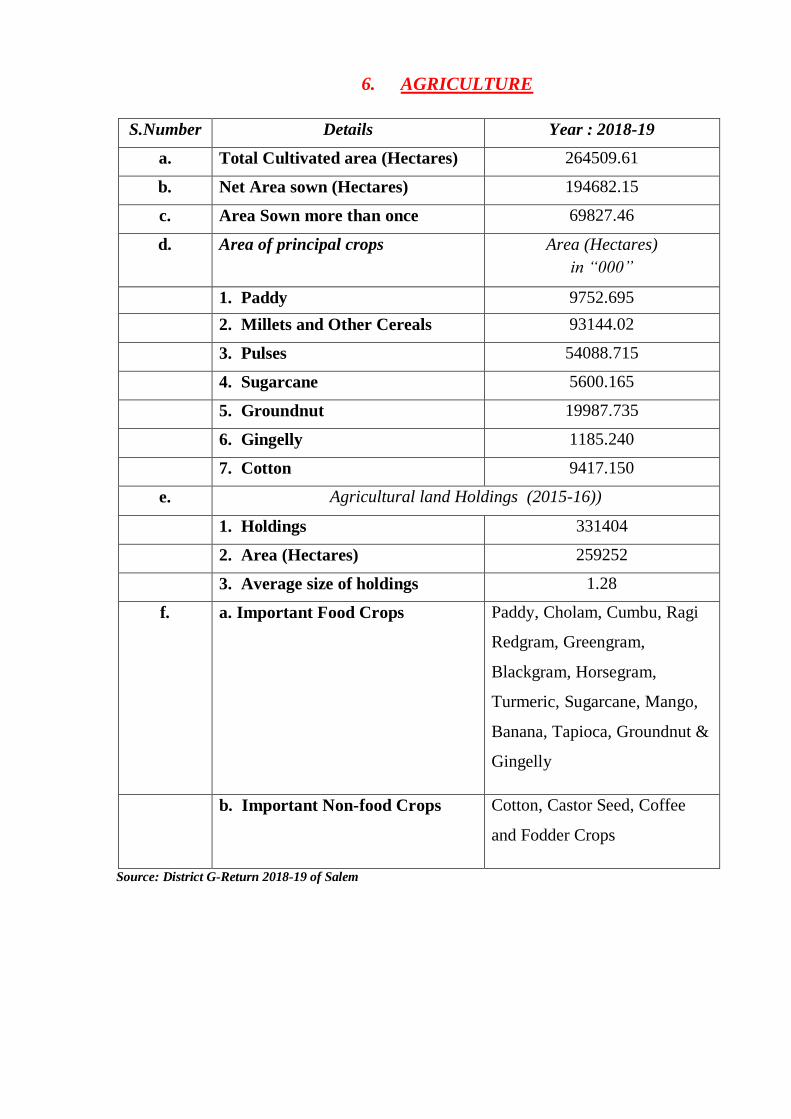
6. AGRICULTURE
S.Number Details Year : 2018-19
a. Total Cultivated area (Hectares) 264509.61
b. Net Area sown (Hectares) 194682.15
c. Area Sown more than once
(Hectares)
69827.46
d. Area of principal crops Area (Hectares)
in “000”
1. Paddy 9752.695
2. Millets and Other Cereals 93144.02
3. Pulses 54088.715
4. Sugarcane 5600.165
5. Groundnut 19987.735
6. Gingelly 1185.240
7. Cotton 9417.150
e. Agricultural land Holdings (2015-16))
1. Holdings 331404
2. Area (Hectares) 259252
3. Average size of holdings
(Hectares)
1.28
f. a. Important Food Crops Paddy, Cholam, Cumbu, Ragi
Redgram, Greengram,
Blackgram, Horsegram,
Turmeric, Sugarcane, Mango,
Banana, Tapioca, Groundnut &
Gingelly
b. Important Non-food Crops Cotton, Castor Seed, Coffee
and Fodder Crops
Source: District G-Return 2018-19 of Salem
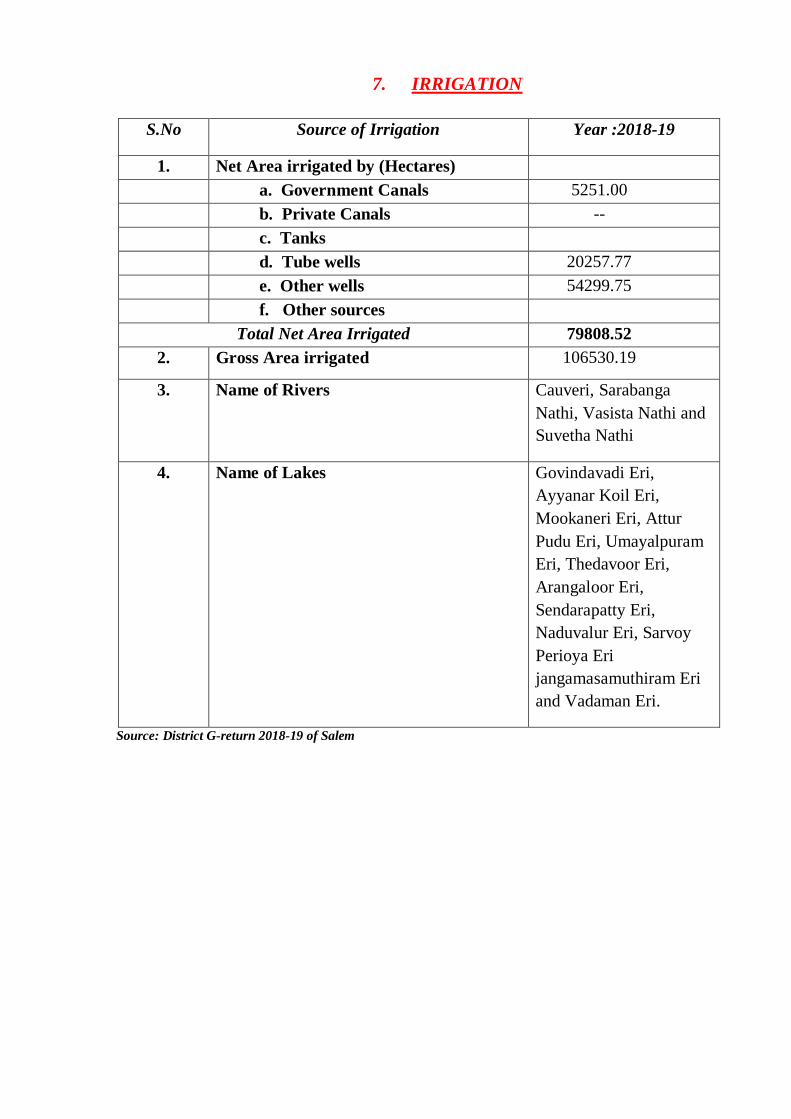
7. IRRIGATION
S.No Source of Irrigation Year :2018-19
1. Net Area irrigated by (Hectares)
a. Government Canals 5251.00
b. Private Canals --
c. Tanks
d. Tube wells 20257.77
e. Other wells 54299.75
f. Other sources
Total Net Area Irrigated 79808.52
2.
Gross Area irrigated
106530.19
3. Name of Rivers Cauveri, Sarabanga
Nathi, Vasista Nathi and
Suvetha Nathi
4. Name of Lakes Govindavadi Eri,
Ayyanar Koil Eri,
Mookaneri Eri, Attur
Pudu Eri, Umayalpuram
Eri, Thedavoor Eri,
Arangaloor Eri,
Sendarapatty Eri,
Naduvalur Eri, Sarvoy
Perioya Eri
jangamasamuthiram Eri
and Vadaman Eri.
Source: District G-return 2018-19 of Salem
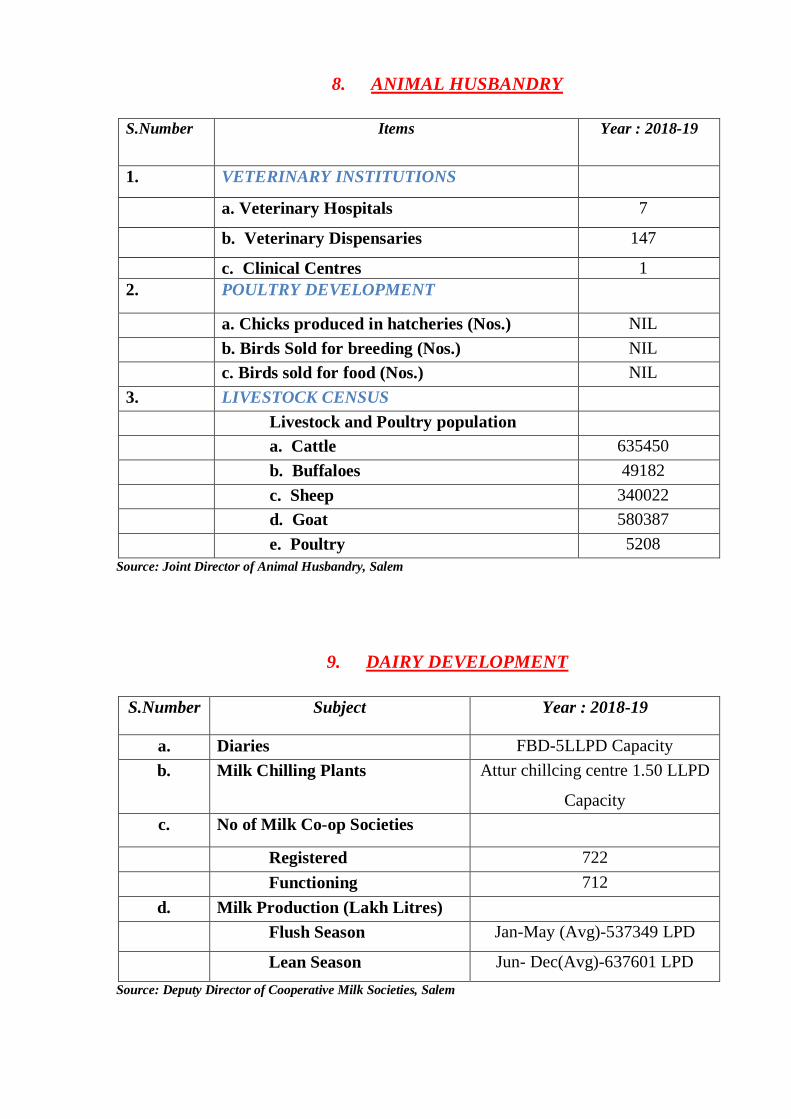
8. ANIMAL HUSBANDRY
S.Number Items Year : 2018-19
1. VETERINARY INSTITUTIONS
a. Veterinary Hospitals 7
b. Veterinary Dispensaries 147
c. Clinical Centres
d. Sub Centres
1
2. POULTRY DEVELOPMENT
a. Chicks produced in hatcheries (Nos.) NIL
b. Birds Sold for breeding (Nos.) NIL
c. Birds sold for food (Nos.) NIL
3. LIVESTOCK CENSUS
Livestock and Poultry population
a. Cattle 635450
b. Buffaloes 49182
c. Sheep 340022
d. Goat 580387
e. Poultry 5208
Source: Joint Director of Animal Husbandry, Salem
9. DAIRY DEVELOPMENT
S.Number Subject Year : 2018-19
a. Diaries FBD-5LLPD Capacity
b. Milk Chilling Plants Attur chillcing centre 1.50 LLPD
Capacity
c. No of Milk Co-op Societies
Registered 722
Functioning 712
d. Milk Production (Lakh Litres)
Flush Season Jan-May (Avg)-537349 LPD
Lean Season Jun- Dec(Avg)-637601 LPD
Source: Deputy Director of Cooperative Milk Societies, Salem
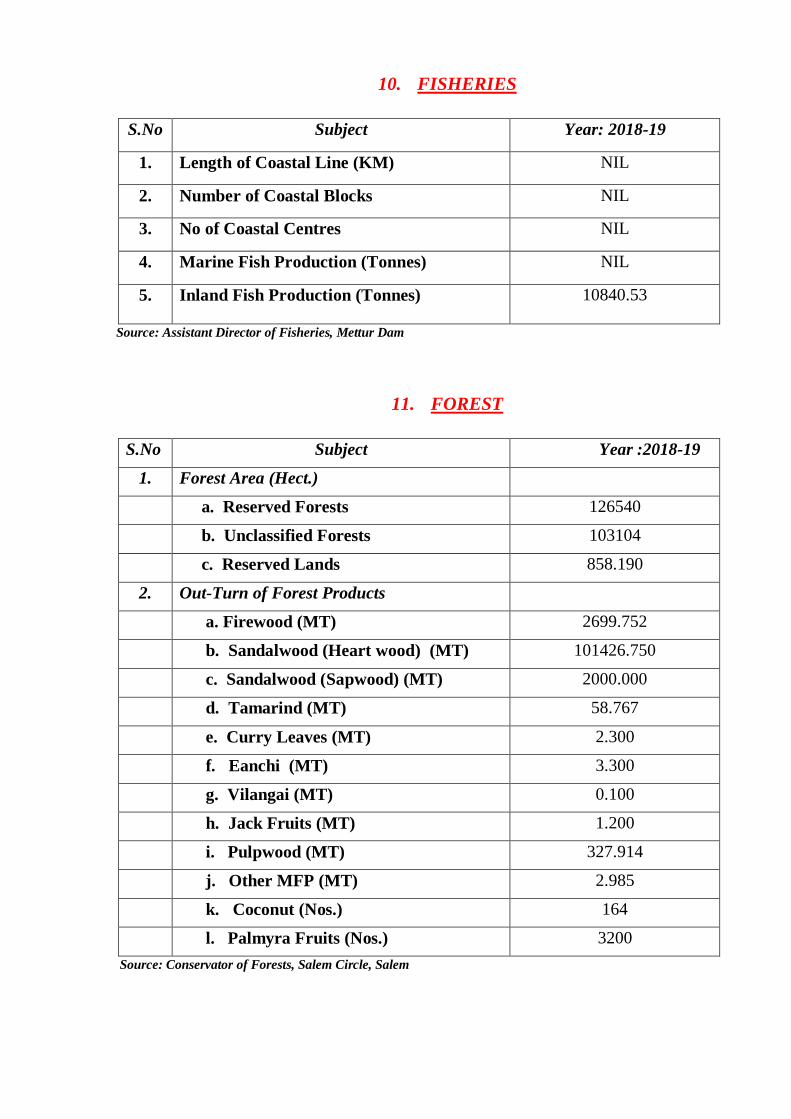
10. FISHERIES
S.No Subject Year: 2018-19
1. Length of Coastal Line (KM) NIL
2. Number of Coastal Blocks NIL
3. No of Coastal Centres NIL
4. Marine Fish Production (Tonnes) NIL
5. Inland Fish Production (Tonnes) 10840.53
Source: Assistant Director of Fisheries, Mettur Dam
11. FOREST
S.No Subject Year :2018-19
1. Forest Area (Hect.)
a. Reserved Forests 126540
b. Unclassified Forests 103104
c. Reserved Lands 858.190
2. Out-Turn of Forest Products
a. Firewood (MT) 2699.752
b. Sandalwood (Heart wood) (MT) 101426.750
c. Sandalwood (Sapwood) (MT) 2000.000
d. Tamarind (MT) 58.767
e. Curry Leaves (MT) 2.300
f. Eanchi (MT) 3.300
g. Vilangai (MT) 0.100
h. Jack Fruits (MT) 1.200
i. Pulpwood (MT) 327.914
j. Other MFP (MT) 2.985
k. Coconut (Nos.) 164
l. Palmyra Fruits (Nos.) 3200
Source: Conservator of Forests, Salem Circle, Salem
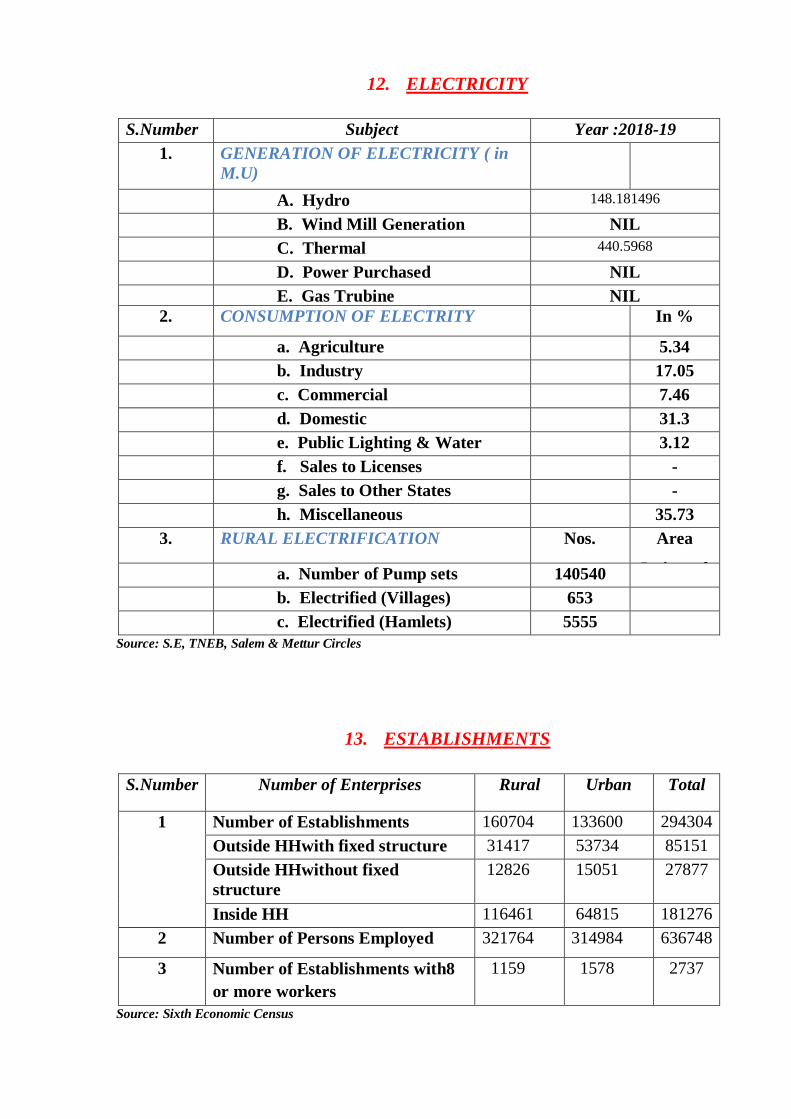
12. ELECTRICITY
S.Number Subject Year :2018-19
1. GENERATION OF ELECTRICITY ( in
M.U)
A. Hydro 148.181496
B. Wind Mill Generation NIL
C. Thermal 440.5968
D. Power Purchased NIL
E. Gas Trubine NIL
2. CONSUMPTION OF ELECTRITY In %
a. Agriculture 5.34
b. Industry 17.05
c. Commercial 7.46
d. Domestic 31.3
e. Public Lighting & Water
works
3.12
f. Sales to Licenses -
g. Sales to Other States -
h. Miscellaneous 35.73
3. RURAL ELECTRIFICATION Nos. Area
Irrigated a. Number of Pump sets
Energized
140540
b. Electrified (Villages) 653
c. Electrified (Hamlets) 5555
Source: S.E, TNEB, Salem & Mettur Circles
13. ESTABLISHMENTS
S.Number Number of Enterprises Rural Urban Total
1 Number of Establishments 160704 133600 294304
Outside HHwith fixed structure 31417 53734 85151
Outside HHwithout fixed
structure
12826 15051 27877
Inside HH
iInside hh
116461 64815 181276
2 Number of Persons Employed 321764 314984 636748
3 Number of Establishments with8
or more workers
1159 1578 2737
Source: Sixth Economic Census
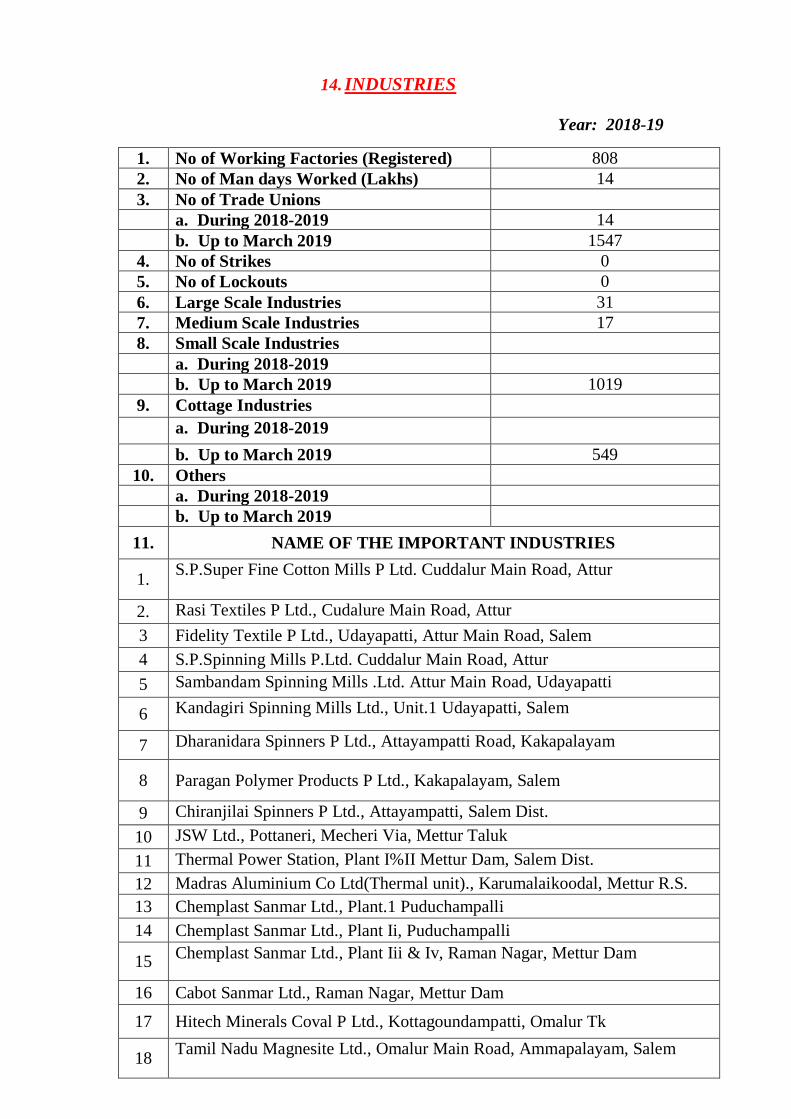
14. INDUSTRIES
Year: 2018-19
1. No of Working Factories (Registered) 808
2. No of Man days Worked (Lakhs) 14
3. No of Trade Unions
a. During 2018-2019 14
b. Up to March 2019 1547
4. No of Strikes 0
5. No of Lockouts 0
6. Large Scale Industries 31
7. Medium Scale Industries 17
8. Small Scale Industries
a. During 2018-2019
b. Up to March 2019 1019
9. Cottage Industries
a. During 2018-2019
b. Up to March 2019 549
10. Others
a. During 2018-2019
b. Up to March 2019
11. NAME OF THE IMPORTANT INDUSTRIES
1. S.P.Super Fine Cotton Mills P Ltd. Cuddalur Main Road, Attur
2. Rasi Textiles P Ltd., Cudalure Main Road, Attur
3 Fidelity Textile P Ltd., Udayapatti, Attur Main Road, Salem
4 S.P.Spinning Mills P.Ltd. Cuddalur Main Road, Attur
5 Sambandam Spinning Mills .Ltd. Attur Main Road, Udayapatti
6 Kandagiri Spinning Mills Ltd., Unit.1 Udayapatti, Salem
7 Dharanidara Spinners P Ltd., Attayampatti Road, Kakapalayam
8 Paragan Polymer Products P Ltd., Kakapalayam, Salem
9 Chiranjilai Spinners P Ltd., Attayampatti, Salem Dist.
10 JSW Ltd., Pottaneri, Mecheri Via, Mettur Taluk
11 Thermal Power Station, Plant I%II Mettur Dam, Salem Dist.
12 Madras Aluminium Co Ltd(Thermal unit)., Karumalaikoodal, Mettur R.S.
13 Chemplast Sanmar Ltd., Plant.1 Puduchampalli
14 Chemplast Sanmar Ltd., Plant Ii, Puduchampalli
15 Chemplast Sanmar Ltd., Plant Iii & Iv, Raman Nagar, Mettur Dam
16 Cabot Sanmar Ltd., Raman Nagar, Mettur Dam
17 Hitech Minerals Coval P Ltd., Kottagoundampatti, Omalur Tk
18 Tamil Nadu Magnesite Ltd., Omalur Main Road, Ammapalayam, Salem
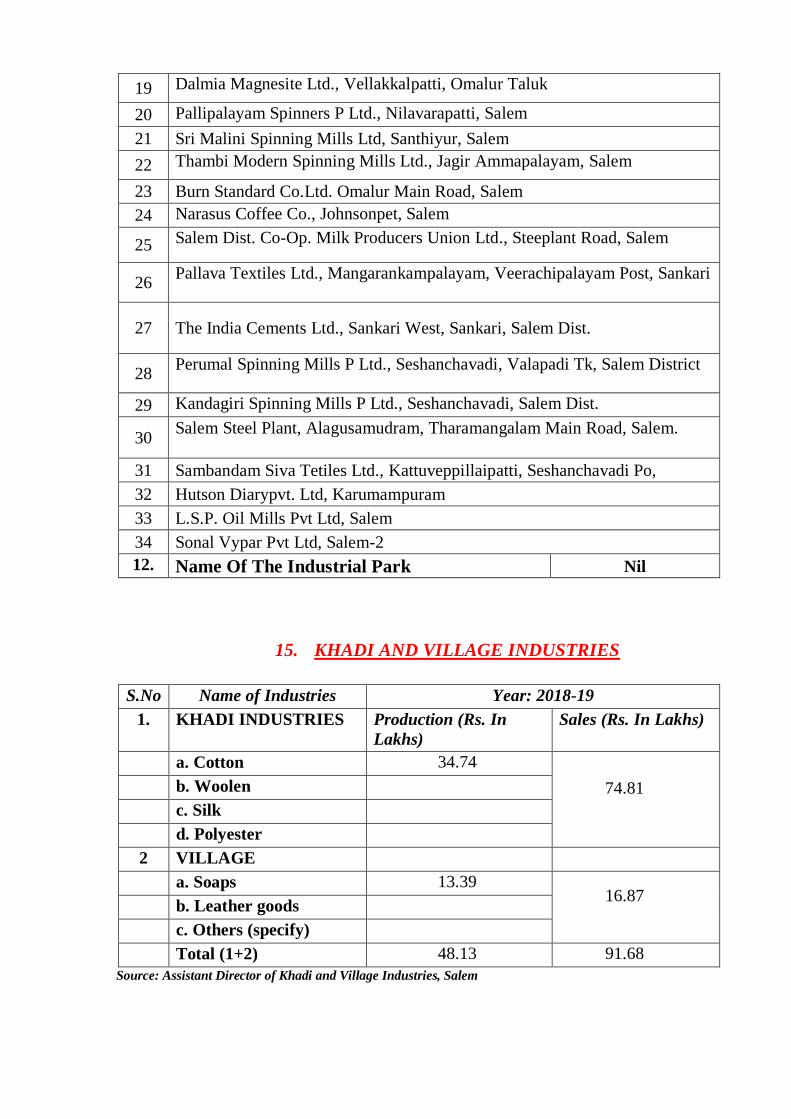
19 Dalmia Magnesite Ltd., Vellakkalpatti, Omalur Taluk
20 Pallipalayam Spinners P Ltd., Nilavarapatti, Salem
21 Sri Malini Spinning Mills Ltd, Santhiyur, Salem
22 Thambi Modern Spinning Mills Ltd., Jagir Ammapalayam, Salem
23 Burn Standard Co.Ltd. Omalur Main Road, Salem
24 Narasus Coffee Co., Johnsonpet, Salem
25 Salem Dist. Co-Op. Milk Producers Union Ltd., Steeplant Road, Salem
26 Pallava Textiles Ltd., Mangarankampalayam, Veerachipalayam Post, Sankari
27 The India Cements Ltd., Sankari West, Sankari, Salem Dist.
28 Perumal Spinning Mills P Ltd., Seshanchavadi, Valapadi Tk, Salem District
29 Kandagiri Spinning Mills P Ltd., Seshanchavadi, Salem Dist.
30
Salem Steel Plant, Alagusamudram, Tharamangalam Main Road, Salem.
31 Sambandam Siva Tetiles Ltd., Kattuveppillaipatti, Seshanchavadi Po,
32 Hutson Diarypvt. Ltd, Karumampuram
33 L.S.P. Oil Mills Pvt Ltd, Salem
34 Sonal Vypar Pvt Ltd, Salem-2
12. Name Of The Industrial Park Nil
15. KHADI AND VILLAGE INDUSTRIES
S.No Name of Industries Year: 2018-19
1. KHADI INDUSTRIES Production (Rs. In
Lakhs)
Sales (Rs. In Lakhs)
a. Cotton 34.74
74.81 b. Woolen
c. Silk
d. Polyester
2 VILLAGE
INDUSTRIES
a. Soaps 13.39 16.87
b. Leather goods
c. Others (specify)
Total (1+2) 48.13 91.68
Source: Assistant Director of Khadi and Village Industries, Salem
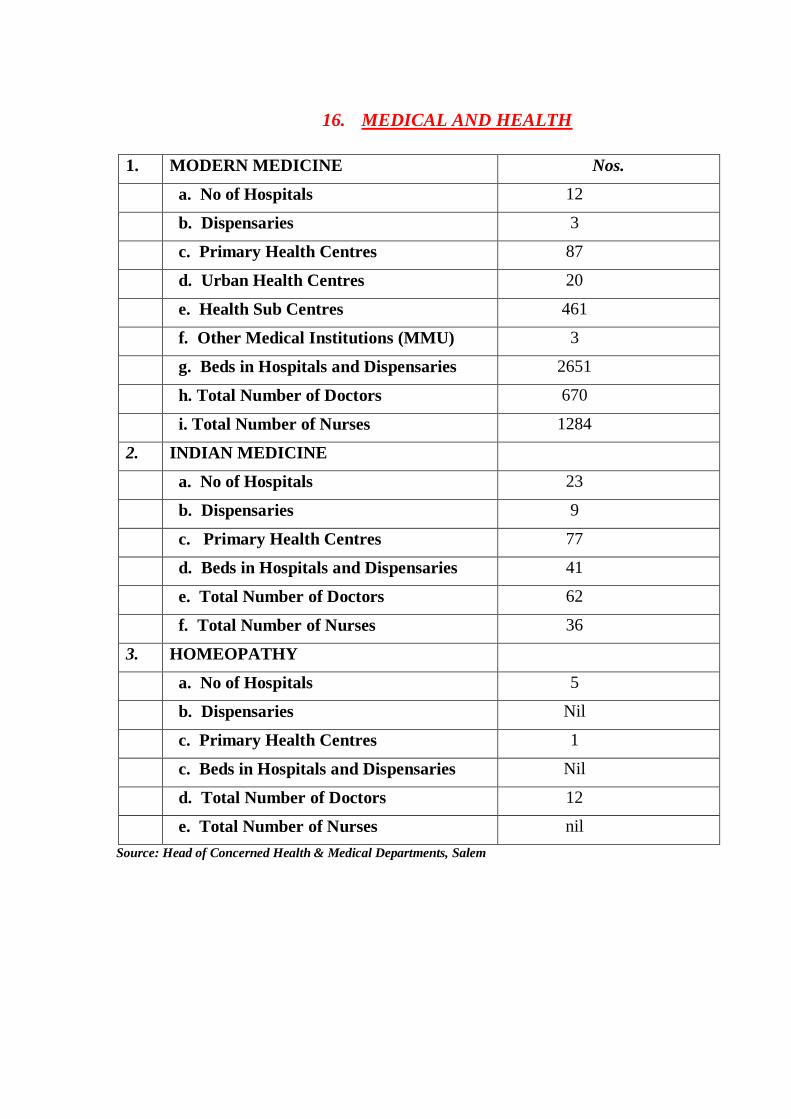
16. MEDICAL AND HEALTH
1. MODERN MEDICINE Nos.
a. No of Hospitals 12
b. Dispensaries 3
c. Primary Health Centres 87
d. Urban Health Centres 20
e. Health Sub Centres 461
f. Other Medical Institutions (MMU) 3
g. Beds in Hospitals and Dispensaries 2651
h. Total Number of Doctors 670
i. Total Number of Nurses 1284
2. INDIAN MEDICINE
a. No of Hospitals 23
b. Dispensaries 9
c. Primary Health Centres 77
d. Beds in Hospitals and Dispensaries 41
e. Total Number of Doctors 62
f. Total Number of Nurses 36
3. HOMEOPATHY
a. No of Hospitals 5
b. Dispensaries Nil
c. Primary Health Centres 1
c. Beds in Hospitals and Dispensaries Nil
d. Total Number of Doctors 12
e. Total Number of Nurses nil
Source: Head of Concerned Health & Medical Departments, Salem
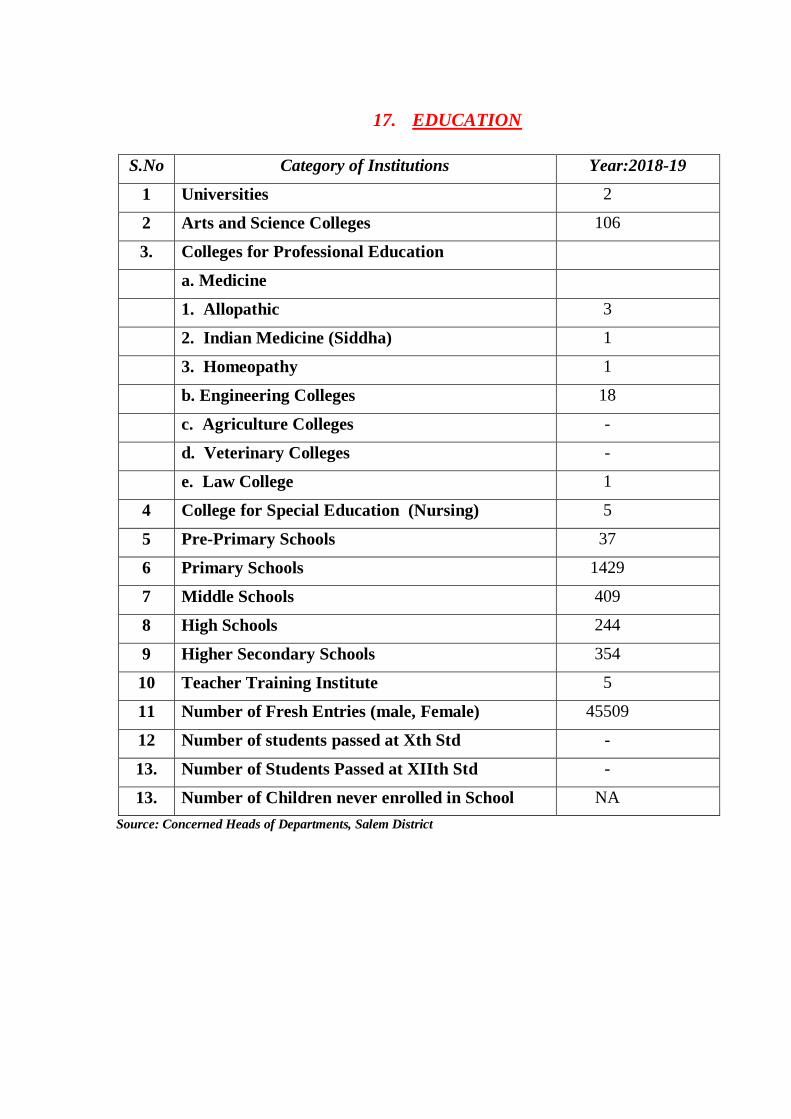
17. EDUCATION
S.No Category of Institutions Year:2018-19
1 Universities 2
2 Arts and Science Colleges 106
3. Colleges for Professional Education
a. Medicine
1. Allopathic 3
2. Indian Medicine (Siddha) 1
3. Homeopathy 1
b. Engineering Colleges 18
c. Agriculture Colleges -
d. Veterinary Colleges -
e. Law College 1
4 College for Special Education (Nursing) 5
5 Pre-Primary Schools 37
6 Primary Schools 1429
7 Middle Schools 409
8 High Schools 244
9 Higher Secondary Schools 354
10 Teacher Training Institute 5
11 Number of Fresh Entries (male, Female) 45509
12 Number of students passed at Xth Std -
13. Number of Students Passed at XIIth Std -
13. Number of Children never enrolled in School NA
Source: Concerned Heads of Departments, Salem District
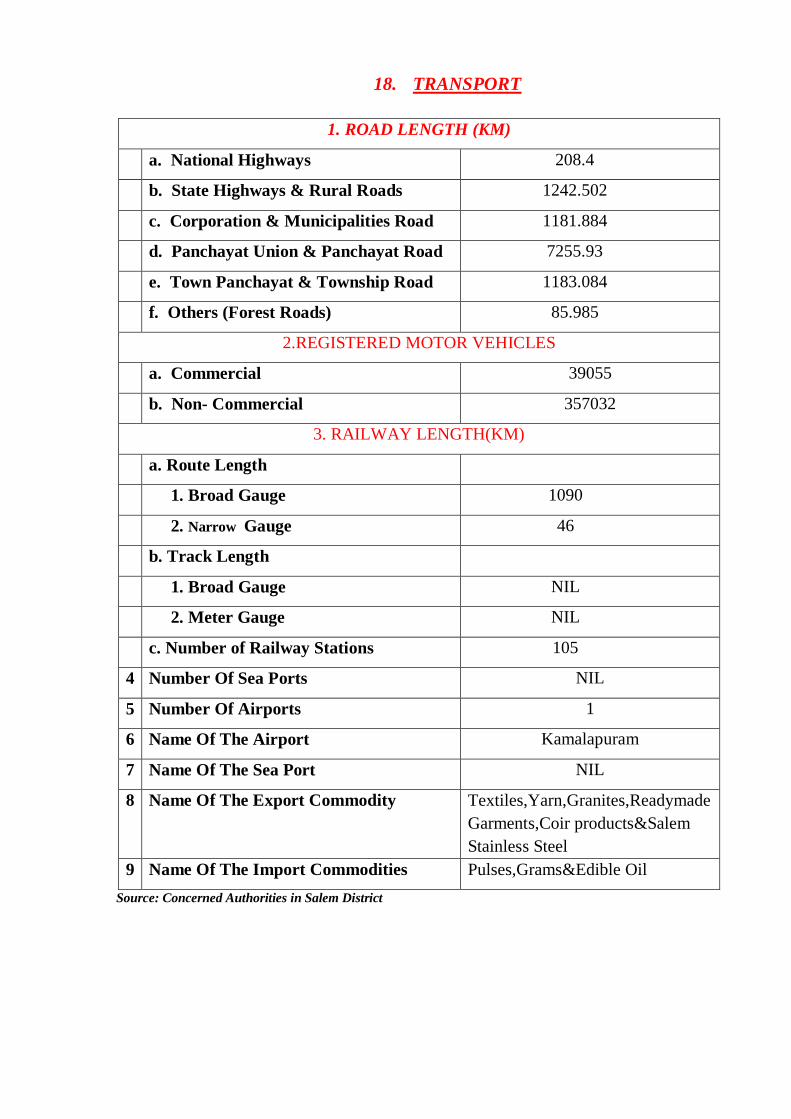
18. TRANSPORT
1. ROAD LENGTH (KM)
a. National Highways 208.4
b. State Highways & Rural Roads 1242.502
c. Corporation & Municipalities Road 1181.884
d. Panchayat Union & Panchayat Road 7255.93
e. Town Panchayat & Township Road 1183.084
f. Others (Forest Roads) 85.985
2.REGISTERED MOTOR VEHICLES
a. Commercial 39055
b. Non- Commercial 357032
3. RAILWAY LENGTH(KM)
a. Route Length
1. Broad Gauge 1090
2. Narrow Gauge 46
b. Track Length
1. Broad Gauge NIL
2. Meter Gauge NIL
c. Number of Railway Stations 105
4 Number Of Sea Ports NIL
5 Number Of Airports 1
6 Name Of The Airport Kamalapuram
7 Name Of The Sea Port NIL
8 Name Of The Export Commodity Textiles,Yarn,Granites,Readymade
Garments,Coir products&Salem
Stainless Steel
9 Name Of The Import Commodities Pulses,Grams&Edible Oil
Source: Concerned Authorities in Salem District
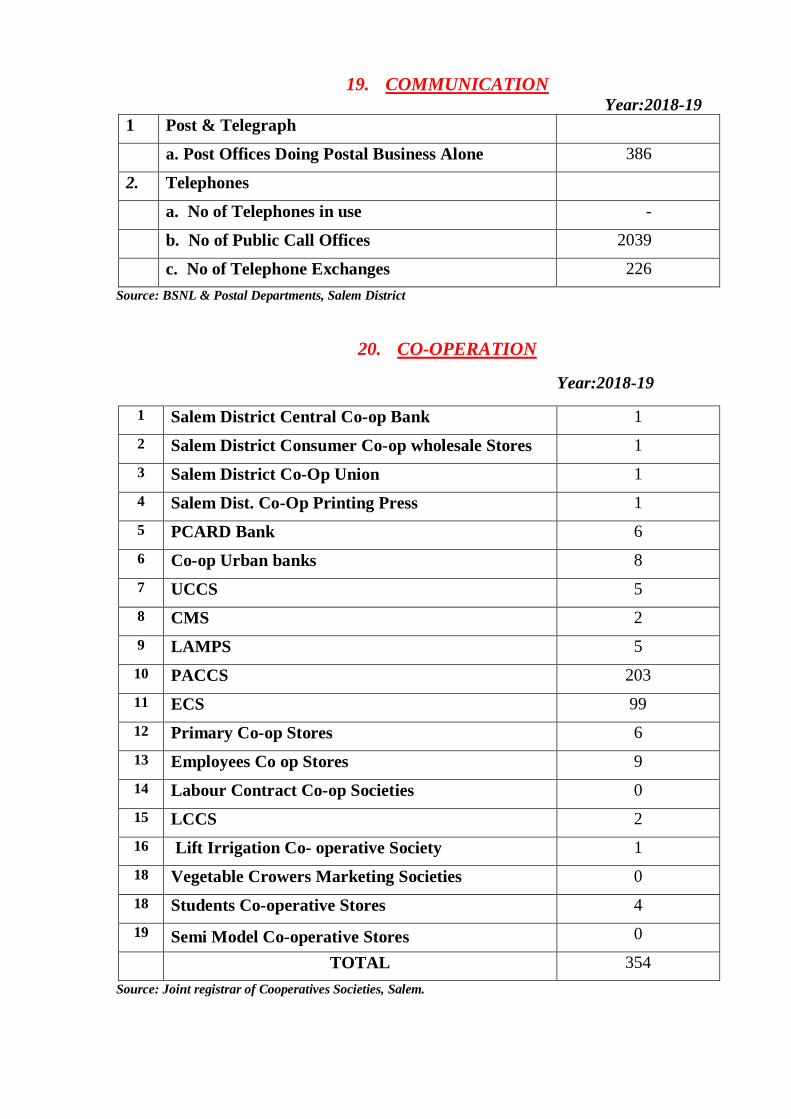
19. COMMUNICATION Year:2018-19
1 Post & Telegraph
a. Post Offices Doing Postal Business Alone 386
2. Telephones
a. No of Telephones in use -
b. No of Public Call Offices 2039
c. No of Telephone Exchanges 226
Source: BSNL & Postal Departments, Salem District
20. CO-OPERATION
Year:2018-19
1 Salem District Central Co-op Bank 1
2 Salem District Consumer Co-op wholesale Stores 1
3 Salem District Co-Op Union 1
4 Salem Dist. Co-Op Printing Press 1
5 PCARD Bank 6
6 Co-op Urban banks 8
7 UCCS 5
8 CMS 2
9 LAMPS 5
10 PACCS 203
11 ECS 99
12 Primary Co-op Stores 6
13 Employees Co op Stores 9
14 Labour Contract Co-op Societies 0
15 LCCS 2
16 Lift Irrigation Co- operative Society 1
18 Vegetable Crowers Marketing Societies 0
18 Students Co-operative Stores 4
19 Semi Model Co-operative Stores 0
TOTAL 354
Source: Joint registrar of Cooperatives Societies, Salem.
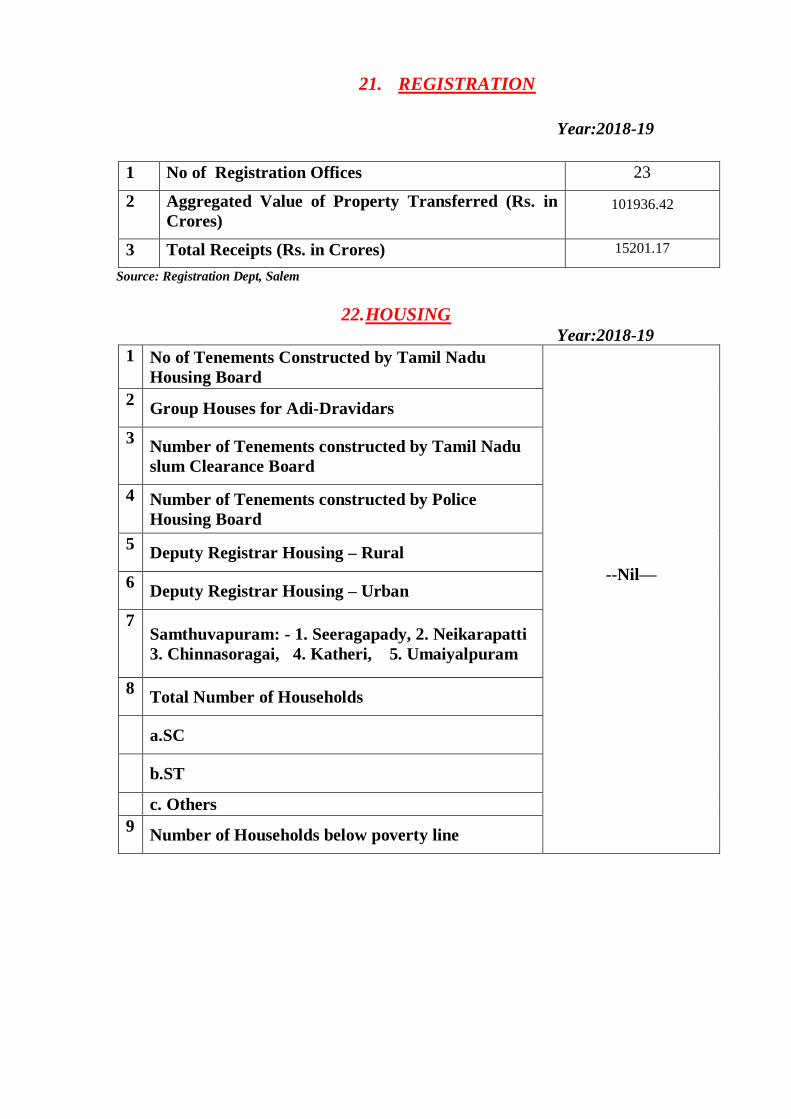
21. REGISTRATION
Year:2018-19
1 No of Registration Offices 23
2 Aggregated Value of Property Transferred (Rs. in
Crores) 101936.42
3 Total Receipts (Rs. in Crores) 15201.17
Source: Registration Dept, Salem
22. HOUSING Year:2018-19
1 No of Tenements Constructed by Tamil Nadu
Housing Board
--Nil—
2 Group Houses for Adi-Dravidars
3 Number of Tenements constructed by Tamil Nadu
slum Clearance Board
4 Number of Tenements constructed by Police
Housing Board
5 Deputy Registrar Housing – Rural
6 Deputy Registrar Housing – Urban
7 Samthuvapuram: - 1. Seeragapady, 2. Neikarapatti
3. Chinnasoragai, 4. Katheri, 5. Umaiyalpuram
8 Total Number of Households
a.SC
b.ST
c. Others
9 Number of Households below poverty line
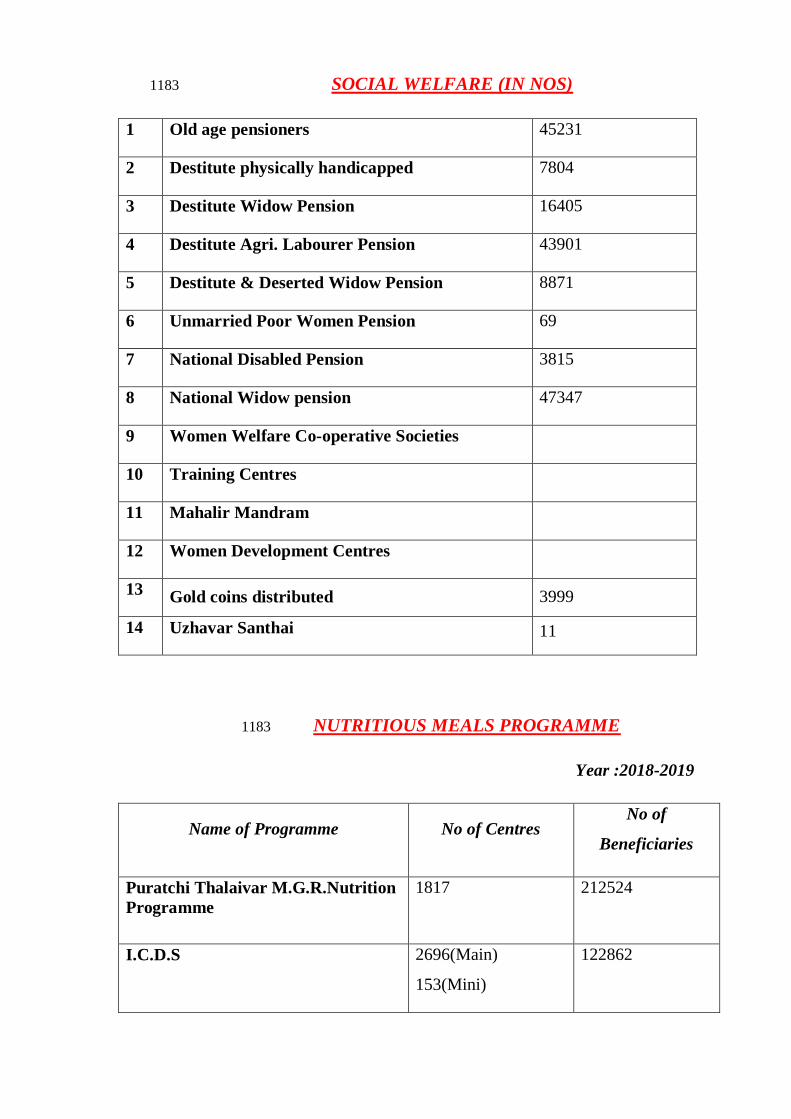
1183 SOCIAL WELFARE (IN NOS)
1 Old age pensioners 45231
2 Destitute physically handicapped 7804
3 Destitute Widow Pension 16405
4 Destitute Agri. Labourer Pension 43901
5 Destitute & Deserted Widow Pension 8871
6 Unmarried Poor Women Pension 69
7 National Disabled Pension 3815
8 National Widow pension 47347
9 Women Welfare Co-operative Societies
10 Training Centres
11 Mahalir Mandram
12 Women Development Centres
i) Group
ii) Member
13 Gold coins distributed 3999
14 Uzhavar Santhai
11
1183 NUTRITIOUS MEALS PROGRAMME
Year :2018-2019
Name of Programme No of Centres No of
Beneficiaries
Puratchi Thalaivar M.G.R.Nutrition
Programme
1817 212524
I.C.D.S 2696(Main)
153(Mini)
122862
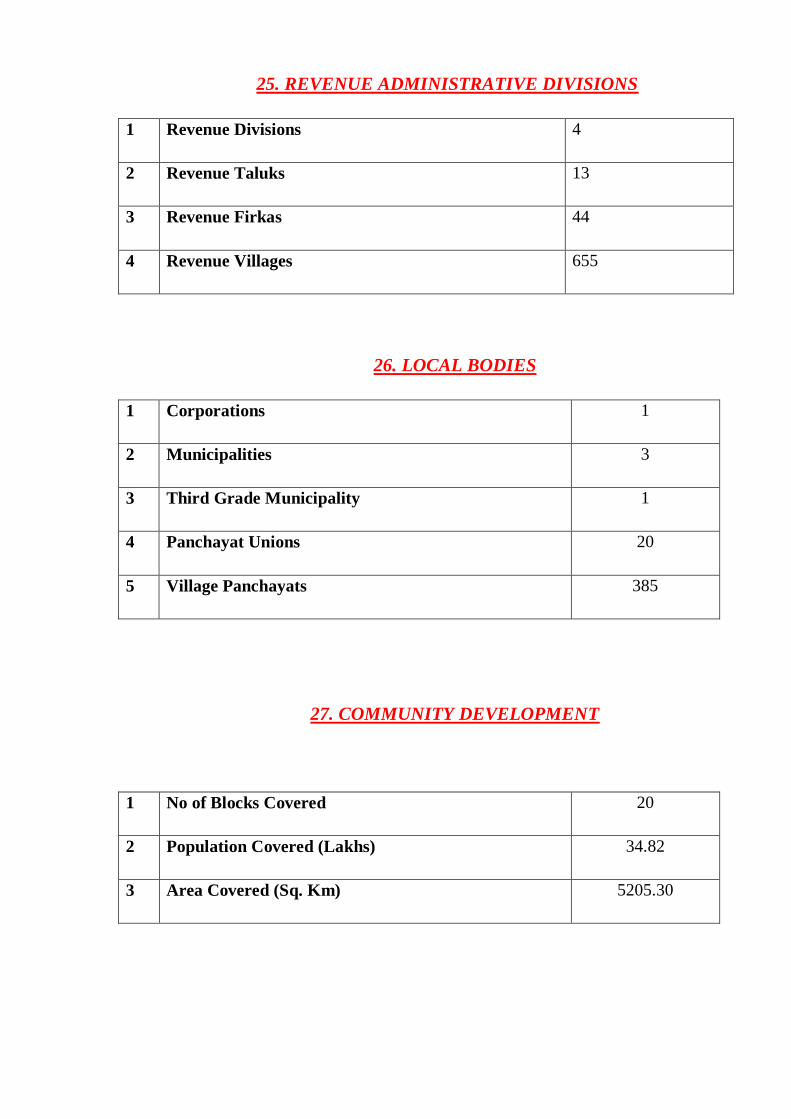
25. REVENUE ADMINISTRATIVE DIVISIONS
1 Revenue Divisions 4
2 Revenue Taluks 13
3 Revenue Firkas 44
4 Revenue Villages 655
26. LOCAL BODIES
1 Corporations 1
2 Municipalities 3
3 Third Grade Municipality 1
4 Panchayat Unions 20
5 Village Panchayats 385
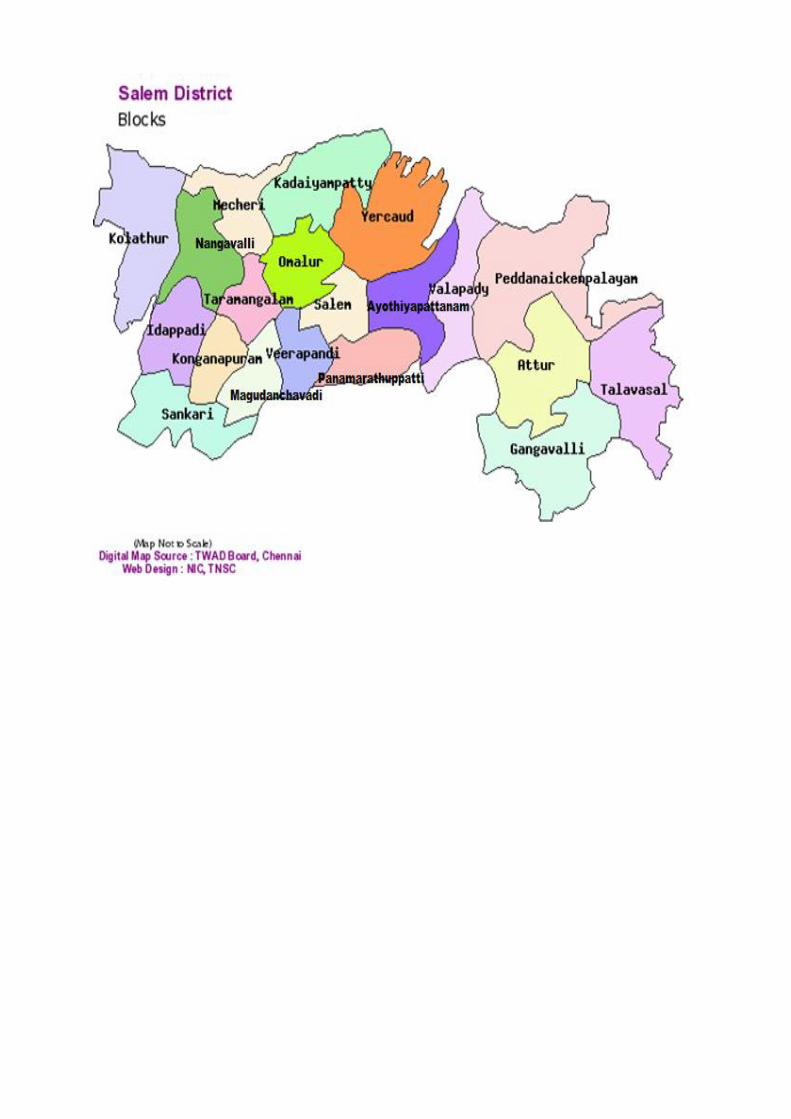
27. COMMUNITY DEVELOPMENT
1 No of Blocks Covered 20
2 Population Covered (Lakhs) 34.82
3 Area Covered (Sq. Km) 5205.30
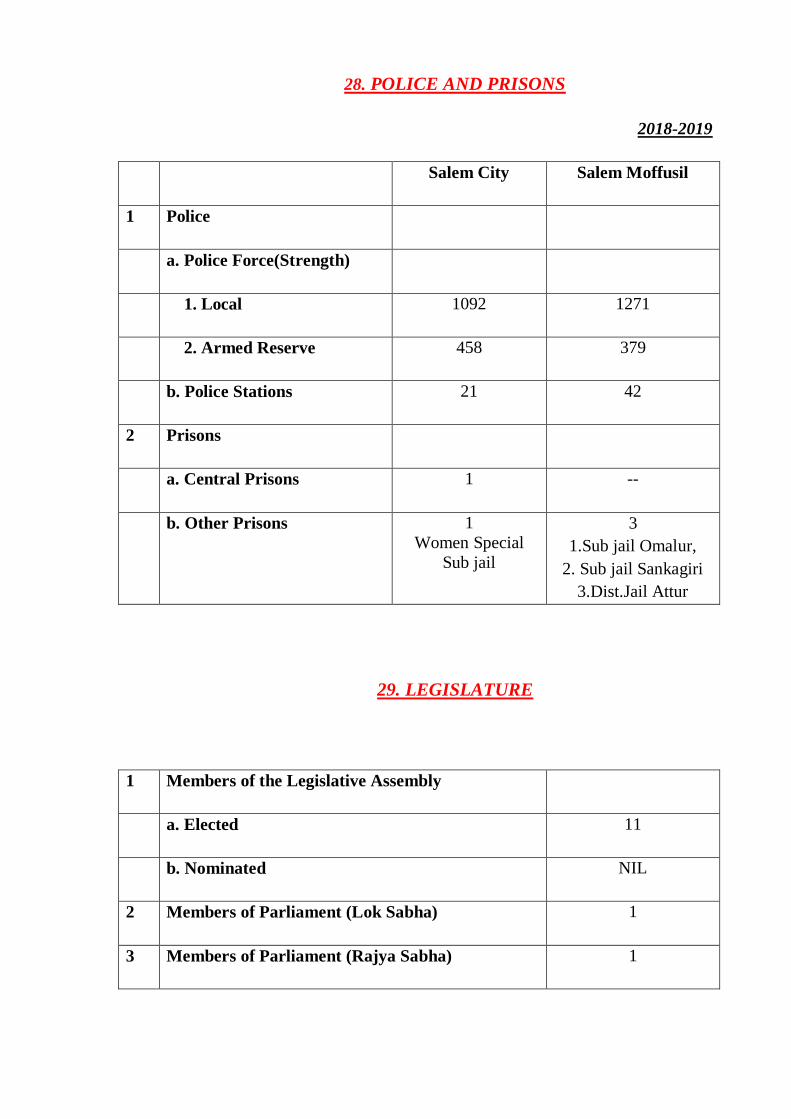
28. POLICE AND PRISONS
2018-2019
Salem City Salem Moffusil
1 Police
a. Police Force(Strength)
1. Local 1092 1271
2. Armed Reserve 458 379
b. Police Stations 21 42
2 Prisons
a. Central Prisons 1 --
b. Other Prisons 1
Women Special
Sub jail
3
1.Sub jail Omalur,
2. Sub jail Sankagiri
3.Dist.Jail Attur
29. LEGISLATURE
1 Members of the Legislative Assembly
a. Elected 11
b. Nominated NIL
2 Members of Parliament (Lok Sabha) 1
3 Members of Parliament (Rajya Sabha) 1
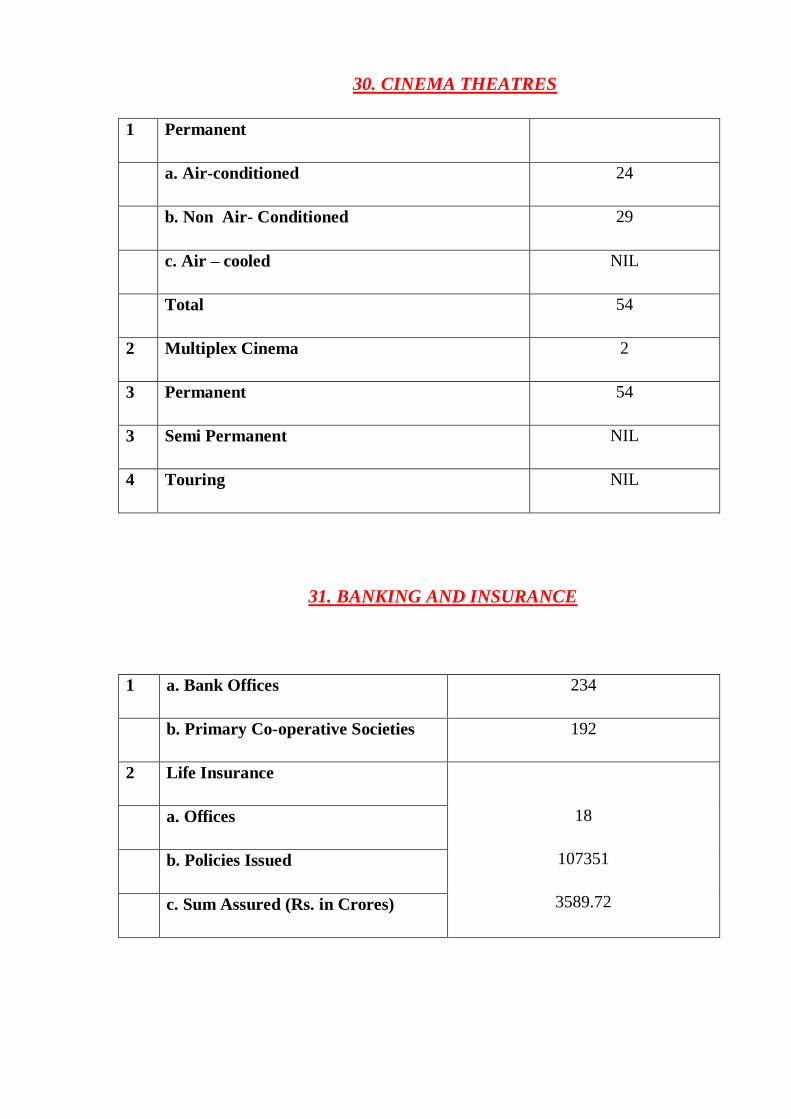
30. CINEMA THEATRES
1 Permanent
a. Air-conditioned 24
b. Non Air- Conditioned 29
c. Air – cooled NIL
Total 54
2 Multiplex Cinema 2
3 Permanent 54
3 Semi Permanent NIL
4 Touring NIL
31. BANKING AND INSURANCE
1 a. Bank Offices 234
b. Primary Co-operative Societies 192
2 Life Insurance
18
107351
3589.72
a. Offices
b. Policies Issued
c. Sum Assured (Rs. in Crores)
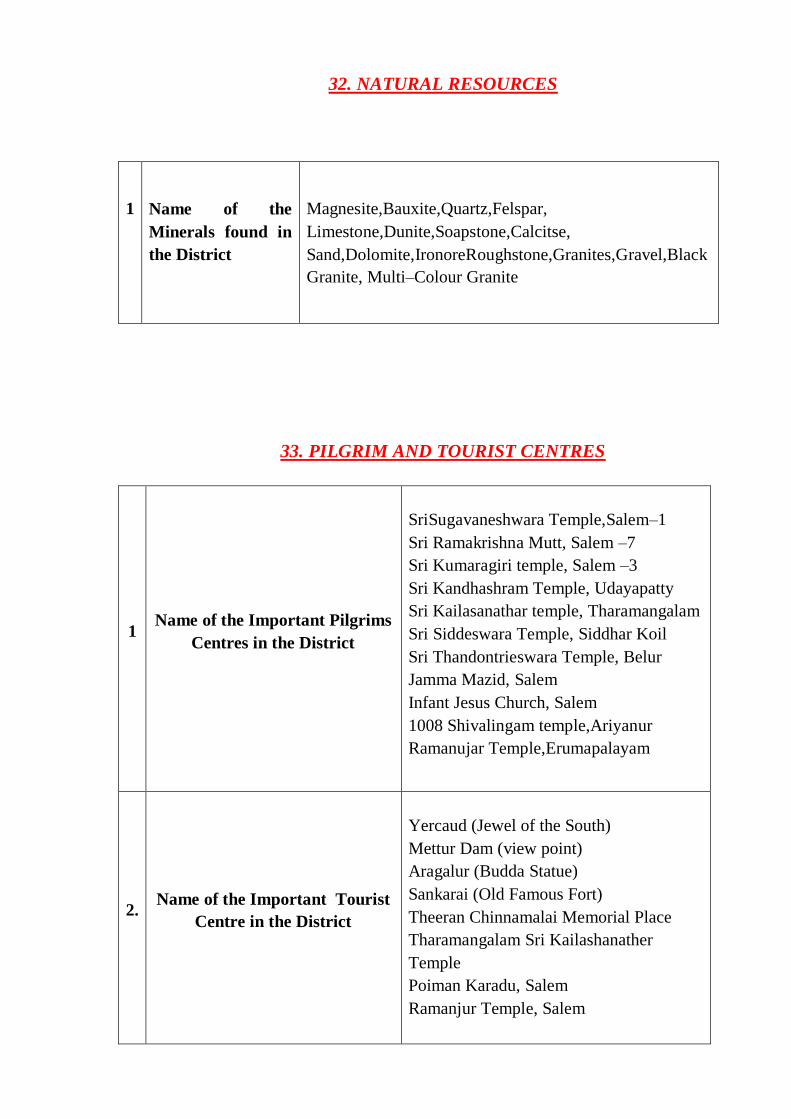
32. NATURAL RESOURCES
1
Name of the
Minerals found in
the District
Magnesite,Bauxite,Quartz,Felspar,
Limestone,Dunite,Soapstone,Calcitse,
Sand,Dolomite,IronoreRoughstone,Granites,Gravel,Black
Granite, Multi–Colour Granite
33. PILGRIM AND TOURIST CENTRES
1 Name of the Important Pilgrims
Centres in the District
SriSugavaneshwara Temple,Salem–1
Sri Ramakrishna Mutt, Salem –7
Sri Kumaragiri temple, Salem –3
Sri Kandhashram Temple, Udayapatty
Sri Kailasanathar temple, Tharamangalam
Sri Siddeswara Temple, Siddhar Koil
Sri Thandontrieswara Temple, Belur
Jamma Mazid, Salem
Infant Jesus Church, Salem
1008 Shivalingam temple,Ariyanur
Ramanujar Temple,Erumapalayam
2. Name of the Important Tourist
Centre in the District
Yercaud (Jewel of the South)
Mettur Dam (view point)
Aragalur (Budda Statue)
Sankarai (Old Famous Fort)
Theeran Chinnamalai Memorial Place
Tharamangalam Sri Kailashanather
Temple
Poiman Karadu, Salem
Ramanjur Temple, Salem
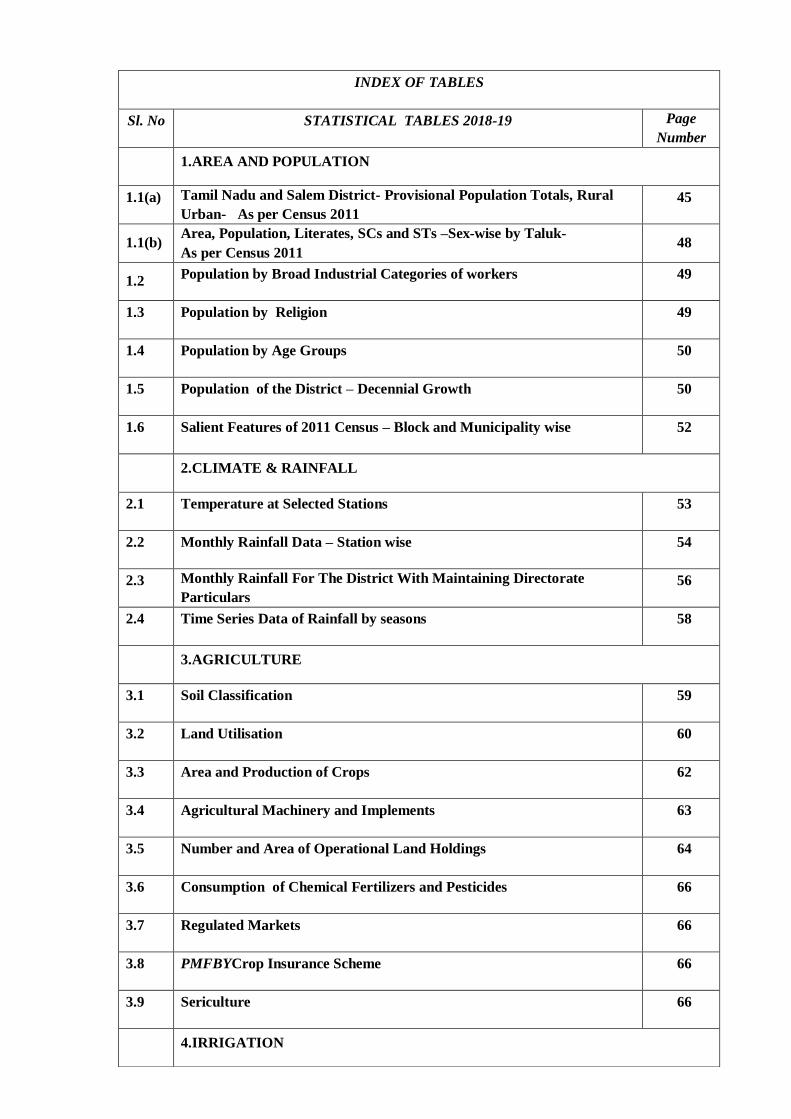
INDEX OF TABLES
Sl. No STATISTICAL TABLES 2018-19 Page
Number
1.AREA AND POPULATION
1.1(a) Tamil Nadu and Salem District- Provisional Population Totals, Rural
Urban- As per Census 2011
45
1.1(b) Area, Population, Literates, SCs and STs –Sex-wise by Taluk-
As per Census 2011 48
1.2 Population by Broad Industrial Categories of workers 49
1.3 Population by Religion 49
1.4 Population by Age Groups 50
1.5 Population of the District – Decennial Growth 50
1.6 Salient Features of 2011 Census – Block and Municipality wise 52
2.CLIMATE & RAINFALL
2.1 Temperature at Selected Stations 53
2.2 Monthly Rainfall Data – Station wise 54
2.3 Monthly Rainfall For The District With Maintaining Directorate
Particulars
WITH MAINTAINING DIRECTORATE PARTICULARS
56
2.4 Time Series Data of Rainfall by seasons 58
3.AGRICULTURE
3.1 Soil Classification 59
3.2 Land Utilisation 60
3.3 Area and Production of Crops 62
3.4 Agricultural Machinery and Implements 63
3.5 Number and Area of Operational Land Holdings 64
3.6 Consumption of Chemical Fertilizers and Pesticides 66
3.7 Regulated Markets 66
3.8 PMFBYCrop Insurance Scheme 66
3.9 Sericulture 66
4.IRRIGATION
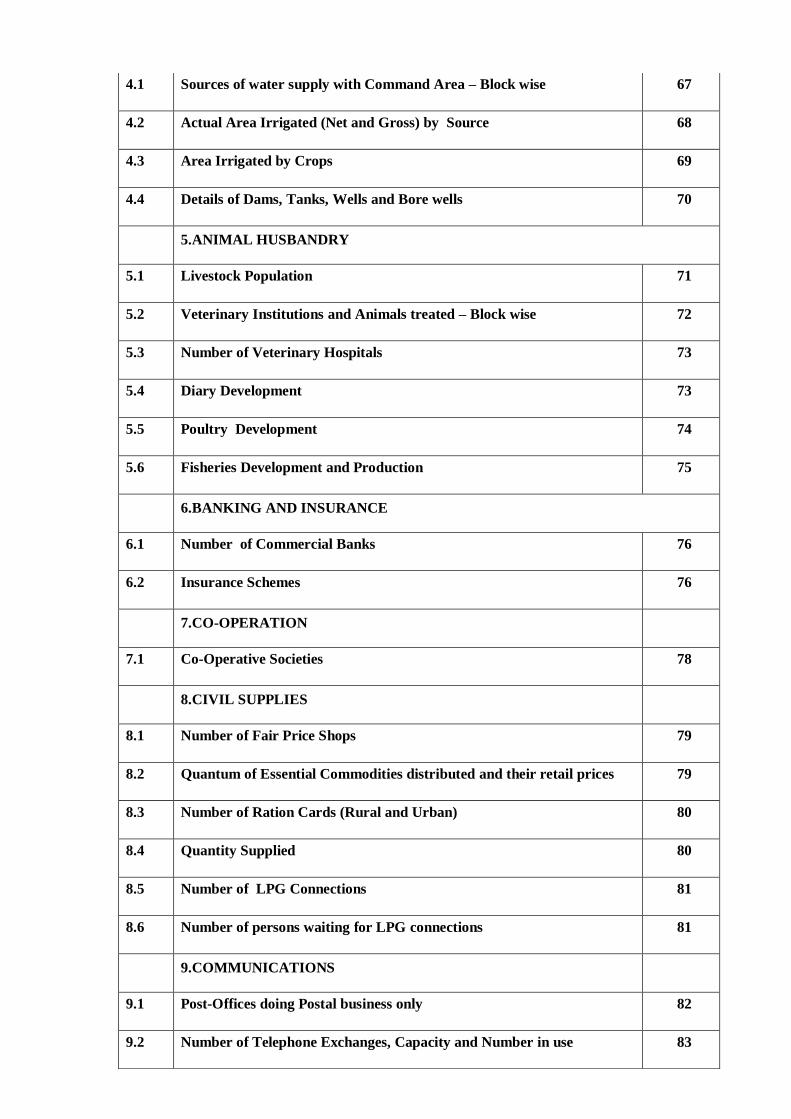
4.1 Sources of water supply with Command Area – Block wise 67
4.2 Actual Area Irrigated (Net and Gross) by Source 68
4.3 Area Irrigated by Crops 69
4.4 Details of Dams, Tanks, Wells and Bore wells 70
5.ANIMAL HUSBANDRY
5.1 Livestock Population 71
5.2 Veterinary Institutions and Animals treated – Block wise 72
5.3 Number of Veterinary Hospitals 73
5.4 Diary Development 73
5.5 Poultry Development 74
5.6 Fisheries Development and Production 75
6.BANKING AND INSURANCE
6.1 Number of Commercial Banks 76
6.2 Insurance Schemes 76
7.CO-OPERATION
7.1 Co-Operative Societies 78
8.CIVIL SUPPLIES
8.1 Number of Fair Price Shops 79
8.2 Quantum of Essential Commodities distributed and their retail prices 79
8.3 Number of Ration Cards (Rural and Urban) 80
8.4 Quantity Supplied 80
8.5 Number of LPG Connections 81
8.6 Number of persons waiting for LPG connections 81
9.COMMUNICATIONS
9.1 Post-Offices doing Postal business only 82
9.2 Number of Telephone Exchanges, Capacity and Number in use 83
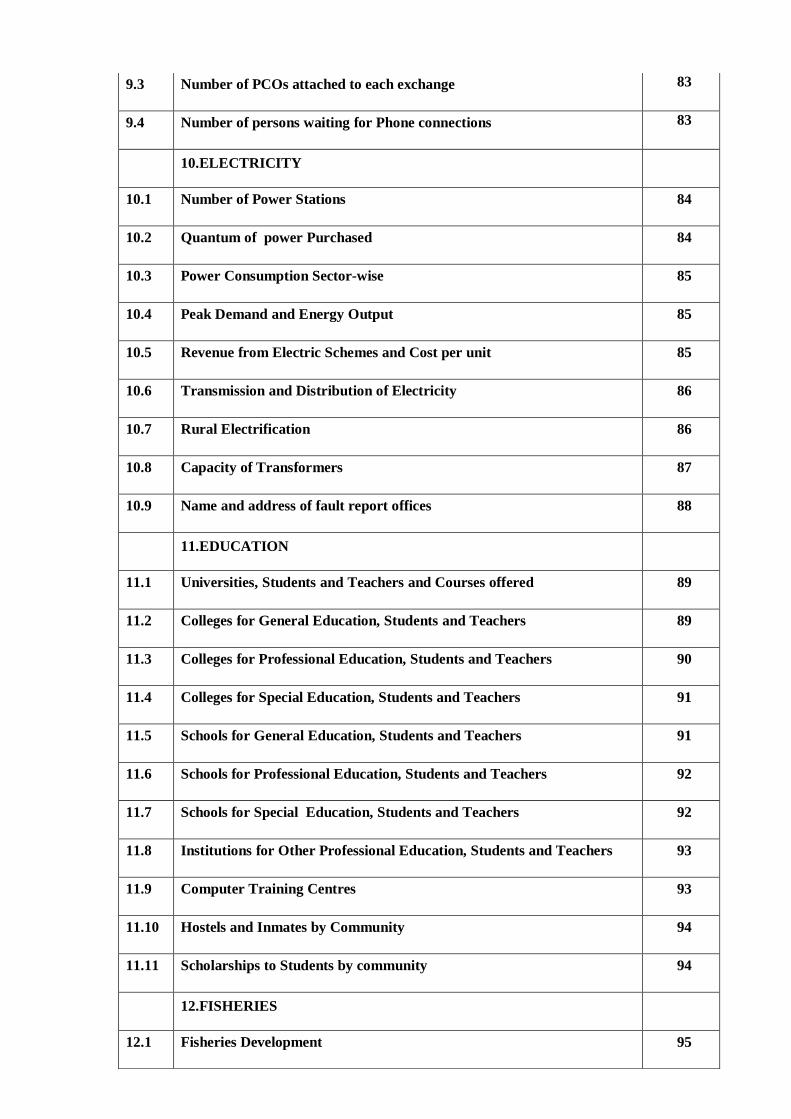
9.3 Number of PCOs attached to each exchange 83
9.4 Number of persons waiting for Phone connections 83
10.ELECTRICITY
10.1 Number of Power Stations 84
10.2 Quantum of power Purchased 84
10.3 Power Consumption Sector-wise 85
10.4 Peak Demand and Energy Output 85
10.5 Revenue from Electric Schemes and Cost per unit 85
10.6 Transmission and Distribution of Electricity 86
10.7 Rural Electrification 86
10.8 Capacity of Transformers 87
10.9 Name and address of fault report offices 88
11.EDUCATION
11.1 Universities, Students and Teachers and Courses offered 89
11.2 Colleges for General Education, Students and Teachers 89
11.3 Colleges for Professional Education, Students and Teachers 90
11.4 Colleges for Special Education, Students and Teachers 91
11.5 Schools for General Education, Students and Teachers 91
11.6 Schools for Professional Education, Students and Teachers 92
11.7 Schools for Special Education, Students and Teachers 92
11.8 Institutions for Other Professional Education, Students and Teachers 93
11.9 Computer Training Centres 93
11.10 Hostels and Inmates by Community 94
11.11 Scholarships to Students by community 94
12.FISHERIES
12.1 Fisheries Development 95
12.2 Estimated MF Production / Inland Production 95
12.3 Number of Families engaged in Fishing
96
13.HANDLOOM
13.1 Number of Focal Centres with Location details 96
13.2 Number of Societies and Variety-wise Production 98
13.3 Number of Power Looms and Number of Employees working 98
13.4 Number of Families engaged 99
14.HANDICRAFTS
14.1 Name and Addresses of Handicrafts 100
14.2 Articles available in the Handicrafts 101
14.3 Value of Articles produced and Value of Articles Sold 101
14.4 Number of Families engaged in Handicrafts 102
15.HEALTH & FAMILY WELFARE
15.1 Hospitals, Dispensaries, Bed Strength, Doctors and Nurses 103
15.2 Number of allied Pathological Units available 103
15.3 Disease-wise Patients treated 104
15.4 Distribution of Medical Personnel 105
15.5 Progress of Family Welfare Programmes 105
16. HOUSING
16.1 Plans sanctioned, Building completed under Private Sector 106
16.2 Plans sanctioned, Building completed under Public Sector 106
16.3 Amount invested in Housing and Building activity under Public Sector 106
16.4 Construction Activity of Tamil Nadu Housing Board 107
16.5 Construction Activity of Tamil Nadu Slum Clearance Board 107
16.6 Index Number of Building Construction Cost in Urban Centres 108
16.7 Labour Charges of Construction Workers 108
17.INDUSTRIES
17.1 Results of ASI 109
17.2 Estimates of Value of Output and Value Added by Manufacturing by
Industries based on ASI
109
17.3 Industrial production 110
17.4 Production and Value of Major Minerals in the District 110
17.5 Production of Handloom Cloth 111
17.6 Small Scale Industries 112
17.7 Khadi and Village Industries 113
17.8 Number of Printing presses 113
17.9 Number of photocopy (Xerox) centres 114
18.FACTORIES
18.1 Registered and Working Factories 115
18.2 Employment in Working Factories 115
18.3 Trade Unions, Industrial Disputes by Strikes, Lockouts and Gheraos 116
19.LOCAL BODIES
19.1 Municipal Bodies Area and Population by Grades 116
19.2 Municipal Bodies by Taluks 117
19.3 Panchayat Union, Villages / Town Panchayats 117
19.4 Revenue Divisions, Taluks, Firkas and Revenue villages 117
19.5 Tax Collected by Corporation / Municipality / Panchayat Union/ Town
Panchayat/ Village Panchayat
118
19.6 Rural Development Activities 118
20.LABOUR AND EMPLOYMENT
20.1 Number of Persons registered during the year and Total Number of
Persons waiting up to the end of the year as per Live Register
119
20.2 Number of Placement during and up to the end of the year 119
21.LEGAL SERVICE
21.1 Judicial Division and Original Jurisdiction 120
21.2 Results of orginal suits for the year 2018-19 126
21.3 Nature of free Legal Services available and Number of Beneficiaries,
Number of cases disposed of in Lok Adalath during the year
127
21.4 Number of Advocates practicing in Courts 127
22.LIBRARIES
22.1 List of Head and Branch Libraries in the District with details of
members, books available and readers
128
22.2 Number of Libraries houses in Government Building / Rental Building 131
22.3 Number of Reading Rooms — Part time Libraries 132
23.MINING & QUARRYING
23.1 Number of Mining and Quarrying units in the District 133
23.2 Classification –wise production during the year 133
24. MANUFACTURING SECTOR
24.1 Number of Food and allied manufacturing units in the district 134
24.2 Number of Non-Food manufacturing units in the district 134
25.MEDICAL SERVICES
25.1 Number of Medical Colleges in the district with Students and Teachers 135
25.2 Number of College of Pharmacy with Students and Teachers 135
25.3 Number of Medical Stores in the District – Category wise 136
25.4 Number of Veterinary Colleges with Students and Teachers 136
26.MOTOR VEHICLES
26.1 Number of Motor Vehicles (Category-wise) Registered during the year
and up to the end of the year
137
26.2 Number of Motor Vehicles (Category-wise) available for hire purpose
during the year and up to the end of the year
139
26.3 Number of Persons issued with Driving Licenses 139
27.NON- CONVENTIONAL ENERGY GENERATON
27.1 Number of Solar Energy generating units in the district with
Production Area
140
27.2 Number of Wind Mills, Generating units with production data 140
28.POLICE AND PRISIONS
28.1 Police Force 140
28.2 Cognizable Offences under Indian Penal Code 141
28.3 Prisons and Convicts 142
28.4 Number of Cases Registers under PCR./ SC & ST Act 143
28.5 Number of Cases Registered against Woman Harassment and Dowry 143
29.PUBLIC HEALTH
29.1 Public Health and Medical Services rendered by Organisations and
individual
143
29.2 Number of Primary Health Centres with Sub-Centre 144
30.PRINTING AND PUBLICATION
30.1 Number of News papers, Weekly/ Monthly Magazines etc., Published 145
30.2 Number of Publishers in the district other than Newspapers and
Magazines
145
30.3 Number of Printing Presses in the district 145
31.PRICE INDICES
31.1 Index Numbers of Wholesale Prices of Tamil Nadu 2018-19 146
31.2 Annual Average Wholesale Price Index Numbers For Tamilnadu 147
31.3 Consumer Price Index Numbers for Industrial Workers 2018-19 147
31.4 All India &Tamilnadu Consumer Price Index Numbers For Industrial
Workers 2018-19 Base Year: 2001=100
148
31.5 Time Series Data Of Consumer Price Index Number For Industrial
Workers-Central Series
149
31.6 Annual Average Of Consumer Price Index Numbers For Industrial
Workers-Central Series
149
31.7 Consumer Price Index Numbers for selected essential items in Rural
Tamil Nadu 2018-19
150
31.8 Annual Average Of Consumer Price Index Numbers For Rural-
Tamilnadu
150
31.9 Consumer Price Index Numbers for selected essential items in Urban
Tamil Nadu 2018-19
151
31.10 Annual Average Of Consumer Price Index Numbers For Urban-
Tamilnadu
151
31.11 Consumer Price Index Numbers 2018-19(Numbers for Rural, Urban
and Combined)
152
31.12 Annual Average Of Consumer Price Index Numbers For Rural & Urban
Combined- Tamilnadu
152
32.QUALITY CONTROL
32.1 List of Industrial / Establishment Units having Quality Control Facilities
and the products subjected to Quality Control
153
33.REGISTRATION
33.1 Number of Registration Offices in the district 153
33.2 Registration and Aggregate Value of properties transferred during the
year
154
34.REPAIR AND SERVICE
34.1 Authorised Automobile Repair and Service Stations 154
34.2 Authorised Electrical and Electronic goods Repair and Services Units 155
35. RESTAURANTS AND HOTELS
35.1 Restaurants, Cafes and Other Eating and Drinking Places 155
35.2 Details of Hotels 156
36.RECREATION AND CULTURAL SERVICES
36.1 List of Cinema Theatres and their Capacities 158
36.2 List of Clubs and Associations 160
36.3 List of Motion Picture Distributors and Projection 161
37.SOCIAL WELFARE
37.1 Puratchi Thalaivar MGR Nutritious Meals Programme Centres 166
37.2 Number of Beneficiaries under Puratchi Thalaivar MGR Nutritious
Meals Programme
166
37.3 Number of Beneficiaries under free supply of Text Books and uniforms 167
37.4 Number of Beneficiaries under Old Age Pension Scheme 168
37.5 Free Houses Sites distributed to Communities 169
38.SANITARY SERVICES
38.1 Number of Sanitary Workers engaged in Sanitation, Garbage, And
Sewage disposal and other particulars
169
38.2 Number of Vehicles engaged in the Sanitary services 170
39.SCIENTIFIC AND RESEARCH SERVICES
39.1 Institutions and Laboratories engaged in Research Work 170
40.STORAGE FACILITIES
40.1 Number of Agricultural and Non-Agricultural Storage Godowns 171
40.2 List of Cold Storage God owns 173
41.TEXTILES
41.1 Number of Ginning, Spinning and Weaving Mills in the District 175
41.2 Quantum of Production during the year
175
42.TRADE AND COMMERCE
42.1 Number of Major/ Minor Trade and Commercial Estate in the district 176
43.TRANSPORT
43.1 Length of Roads 176
43.2 Road Accidents 177
43.3 Registered Motor Vehicles 177
43.4 Transport Corporation 178
43.5 Select Indicators of overall performances of State Transport
Corporation
178
43.6 Railway Lines and Stations 179
43.7 Port Development 179
43.8 Airports 180
43.9 Private Transport 180
44.TOURISM
44.1 Places of Tourist Attraction 186
44.2 List of Places of Worship 187
44.3 List of Hotels and Restaurants 187
44.4 List of Travel Agents
45. VITAL STATISTICS
45.1 Births and Deaths registered in the District 188
45.2 Birth, Death and Mortality rates in the District 188
45.3 Death by Causes 188
46.VOLUNTARY SERVICES
46.1 List of Voluntary Services available in the district for the development
of Rural and Urban Population
189
47.WATER WORK AND SUPPLY
47.1 Number of Schemes Operated in the District 194
47.2 Number of Workers engaged in the Water Works and Supply 195
47.3 Number of House connections, fountains 196
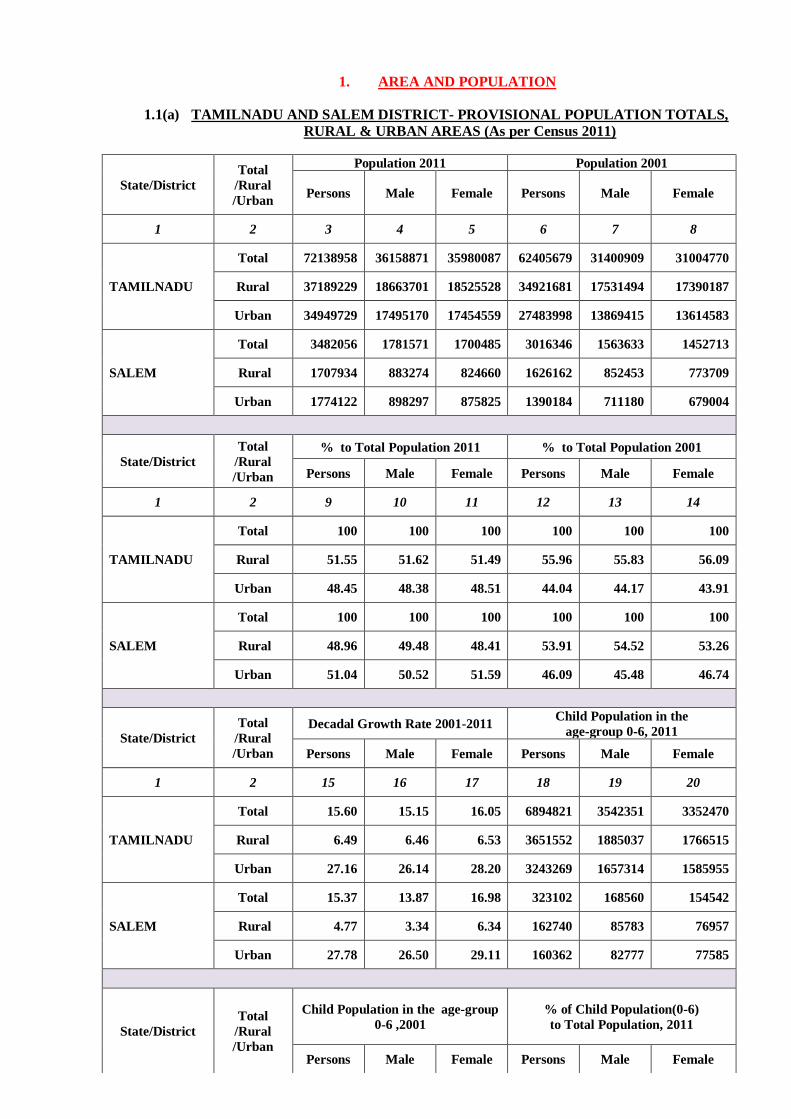
1. AREA AND POPULATION
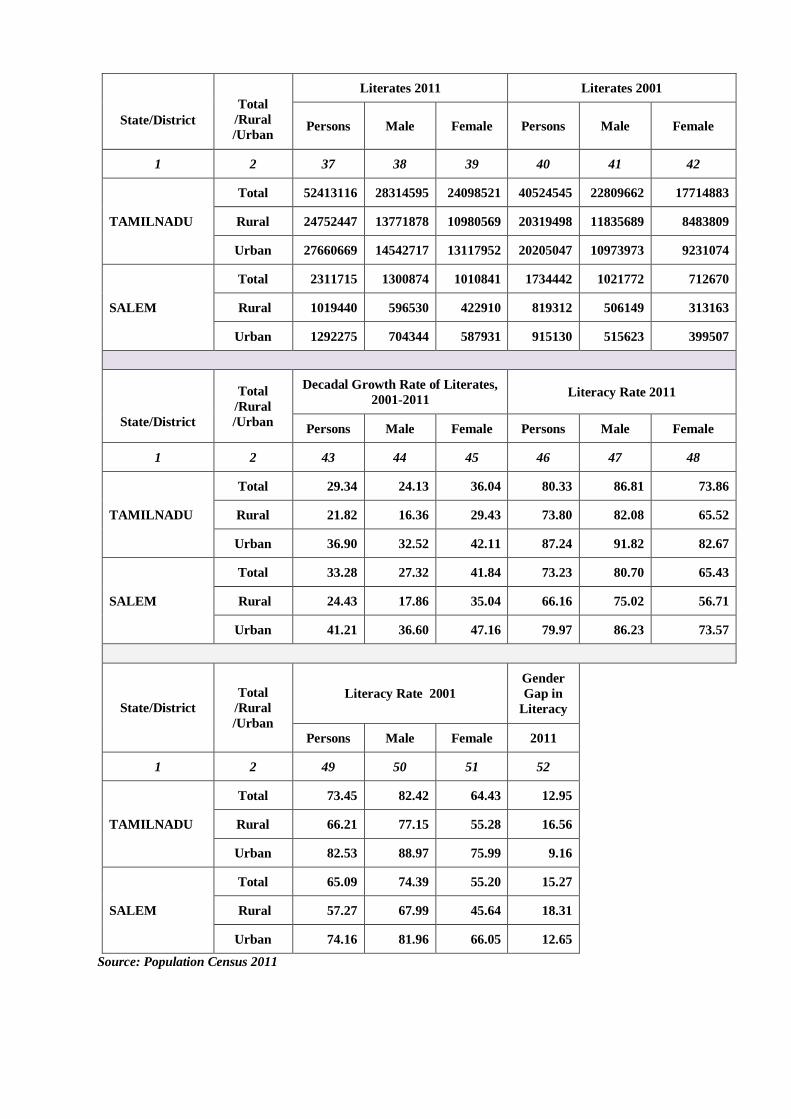
1.1(a) TAMILNADU AND SALEM DISTRICT- PROVISIONAL POPULATION TOTALS,
RURAL & URBAN AREAS (As per Census 2011)
State/District
Total
/Rural
/Urban
Population 2011 Population 2001
Persons Male Female Persons Male Female
1 2 3 4 5 6 7 8
TAMILNADU
Total 72138958 36158871 35980087 62405679 31400909 31004770
Rural 37189229 18663701 18525528 34921681 17531494 17390187
Urban 34949729 17495170 17454559 27483998 13869415 13614583
SALEM
Total 3482056 1781571 1700485 3016346 1563633 1452713
Rural 1707934 883274 824660 1626162 852453 773709
Urban 1774122 898297 875825 1390184 711180 679004
State/District
Total
/Rural
/Urban
% to Total Population 2011 % to Total Population 2001
Persons Male Female Persons Male Female
1 2 9 10 11 12 13 14
TAMILNADU
Total 100 100 100 100 100 100
Rural 51.55 51.62 51.49 55.96 55.83 56.09
Urban 48.45 48.38 48.51 44.04 44.17 43.91
SALEM
Total 100 100 100 100 100 100
Rural 48.96 49.48 48.41 53.91 54.52 53.26
Urban 51.04 50.52 51.59 46.09 45.48 46.74
State/District
Total
/Rural
/Urban
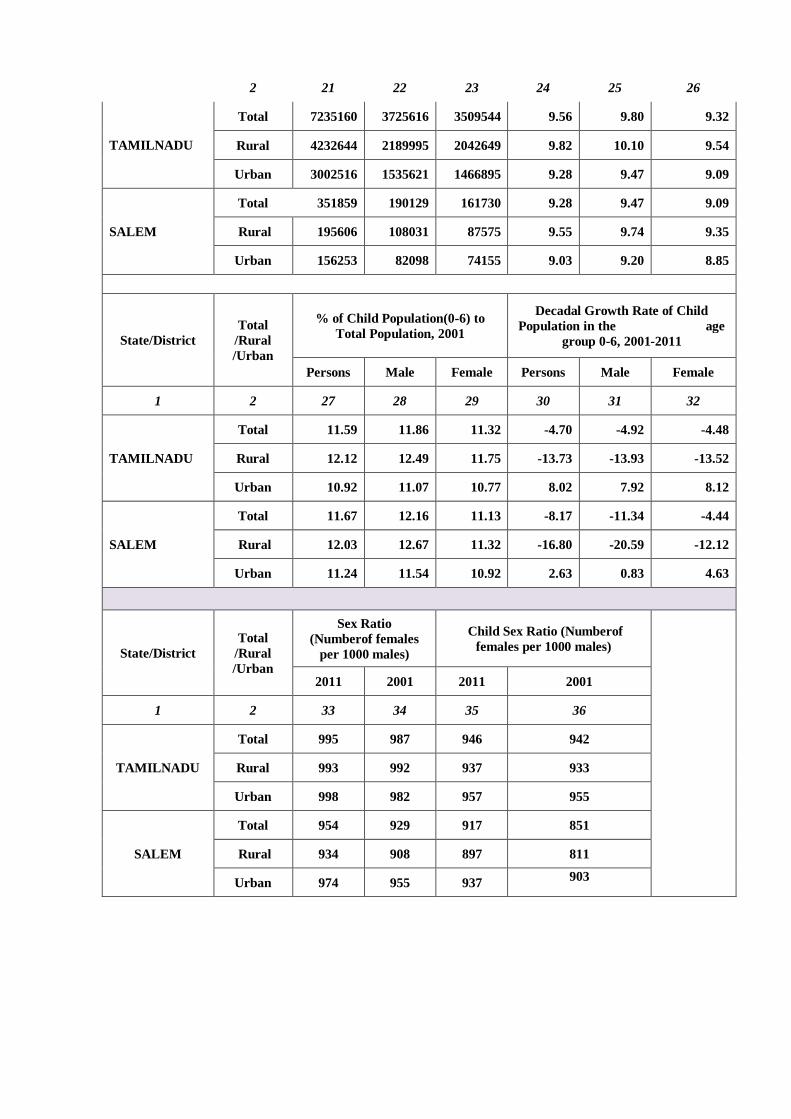
Decadal Growth Rate 2001-2011 Child Population in the
age-group 0-6, 2011
Persons Male Female Persons Male Female
1 2 15 16 17 18 19 20
TAMILNADU
Total 15.60 15.15 16.05 6894821 3542351 3352470
Rural 6.49 6.46 6.53 3651552 1885037 1766515
Urban 27.16 26.14 28.20 3243269 1657314 1585955
SALEM
Total 15.37 13.87 16.98 323102 168560 154542
Rural 4.77 3.34 6.34 162740 85783 76957
Urban 27.78 26.50 29.11 160362 82777 77585
State/District
Total
/Rural
/Urban
Child Population in the age-group
0-6 ,2001
% of Child Population(0-6)
to Total Population, 2011
Persons Male Female Persons Male Female
2 21 22 23 24 25 26
TAMILNADU
Total 7235160 3725616 3509544 9.56 9.80 9.32
Rural 4232644 2189995 2042649 9.82 10.10 9.54
Urban 3002516 1535621 1466895 9.28 9.47 9.09
SALEM
Total 351859 190129 161730 9.28 9.47 9.09
Rural 195606 108031 87575 9.55 9.74 9.35
Urban 156253 82098 74155 9.03 9.20 8.85
State/District
Total
/Rural
/Urban
% of Child Population(0-6) to
Total Population, 2001
Decadal Growth Rate of Child
Population in the age
group 0-6, 2001-2011
Persons Male Female Persons Male Female
1 2 27 28 29 30 31 32
TAMILNADU
Total 11.59 11.86 11.32 -4.70 -4.92 -4.48
Rural 12.12 12.49 11.75 -13.73 -13.93 -13.52
Urban 10.92 11.07 10.77 8.02 7.92 8.12
SALEM
Total 11.67 12.16 11.13 -8.17 -11.34 -4.44
Rural 12.03 12.67 11.32 -16.80 -20.59 -12.12
Urban 11.24 11.54 10.92 2.63 0.83 4.63
State/District
Total
/Rural
/Urban
Sex Ratio
(Numberof females
per 1000 males)
Child Sex Ratio (Numberof
females per 1000 males)
2011 2001 2011 2001
1 2 33 34 35 36
TAMILNADU
Total 995 987 946 942
Rural 993 992 937 933
Urban 998 982 957 955
SALEM
Total 954 929 917 851
Rural 934 908 897 811
Urban 974 955 937 903
State/District
Total
/Rural
/Urban
Literates 2011 Literates 2001
Persons Male Female Persons Male Female
1 2 37 38 39 40 41 42
TAMILNADU
Total 52413116 28314595 24098521 40524545 22809662 17714883
Rural 24752447 13771878 10980569 20319498 11835689 8483809
Urban 27660669 14542717 13117952 20205047 10973973 9231074
SALEM
Total 2311715 1300874 1010841 1734442 1021772 712670
Rural 1019440 596530 422910 819312 506149 313163
Urban 1292275 704344 587931 915130 515623 399507
State/District
Total
/Rural
/Urban
Decadal Growth Rate of Literates,
2001-2011 Literacy Rate 2011
Persons Male Female Persons Male Female
1 2 43 44 45 46 47 48
TAMILNADU
Total 29.34 24.13 36.04 80.33 86.81 73.86
Rural 21.82 16.36 29.43 73.80 82.08 65.52
Urban 36.90 32.52 42.11 87.24 91.82 82.67
SALEM
Total 33.28 27.32 41.84 73.23 80.70 65.43
Rural 24.43 17.86 35.04 66.16 75.02 56.71
Urban 41.21 36.60 47.16 79.97 86.23 73.57
State/District
Total
/Rural
/Urban
Literacy Rate 2001
Gender
Gap in
Literacy
Persons Male Female 2011
1 2 49 50 51 52
TAMILNADU
Total 73.45 82.42 64.43 12.95
Rural 66.21 77.15 55.28 16.56
Urban 82.53 88.97 75.99 9.16
SALEM
Total 65.09 74.39 55.20 15.27
Rural 57.27 67.99 45.64 18.31
Urban 74.16 81.96 66.05 12.65
Source: Population Census 2011
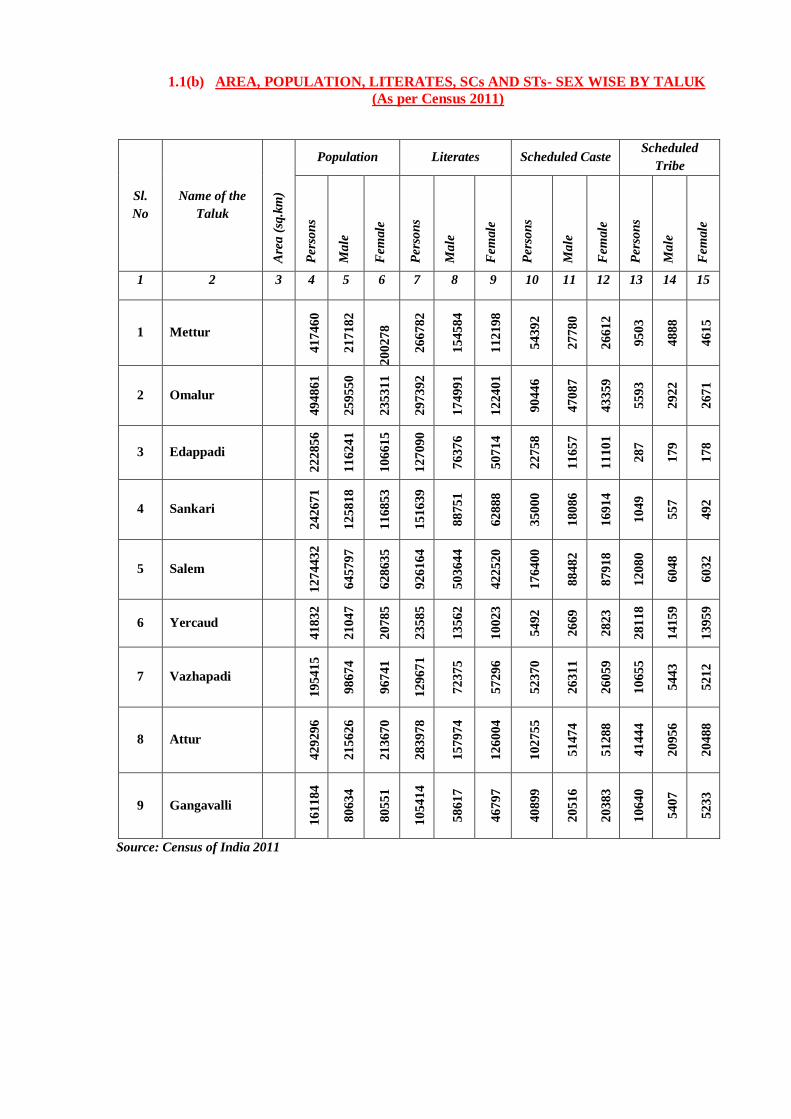
1.1(b) AREA, POPULATION, LITERATES, SCs AND STs- SEX WISE BY TALUK
(As per Census 2011)
Sl.
No
Name of the
Taluk
Are
a (
sq.k
m)
Population Literates Scheduled Caste Scheduled
Tribe
Pers
on
s
Male
Fem
ale
Pers
on
s
Male
Fem
ale
Pers
on
s
Male
Fem
ale
Pers
on
s
Male
Fem
ale
1 2 3 4 5 6 7 8 9 10 11 12 13 14 15
1 Mettur
417460
217182
200278
266782
154584
112198
54392
27780
26612
9503
4888
4615
2 Omalur
494861
259550
235311
297392
174991
122401
90446
47087
43359
5593
2922
2671
3 Edappadi
22
28
56
11
62
41
10
66
15
12
70
90
76
37
6
50
71
4
22
75
8
11
65
7
11
10
1
28
7
17
9
17
8
4 Sankari
24
26
71
12
58
18
11
68
53
15
16
39
88
75
1
62
88
8
35
00
0
18
08
6
16
91
4
10
49
55
7
49
2
5 Salem
12
74
43
2
64
57
97
62
86
35
92
61
64
50
36
44
42
25
20
17
64
00
88
48
2
87
91
8
12
08
0
60
48
60
32
6 Yercaud
41
83
2
21
04
7
20
78
5
23
58
5
13
56
2
10
02
3
54
92
26
69
28
23
28
11
8
14
15
9
13
95
9
7 Vazhapadi
19
54
15
98
67
4
96
74
1
12
96
71
72
37
5
57
29
6
52
37
0
26
31
1
26
05
9
10
65
5
54
43
52
12
8 Attur
42
92
96
21
56
26
21
36
70
28
39
78
15
79
74
12
60
04
10
27
55
51
47
4
51
28
8
41
44
4
20
95
6
20
48
8
9 Gangavalli
161184
80634
80551
105414
58617
46797
40899
20516
20383
10640
5407
5233
Source: Census of India 2011
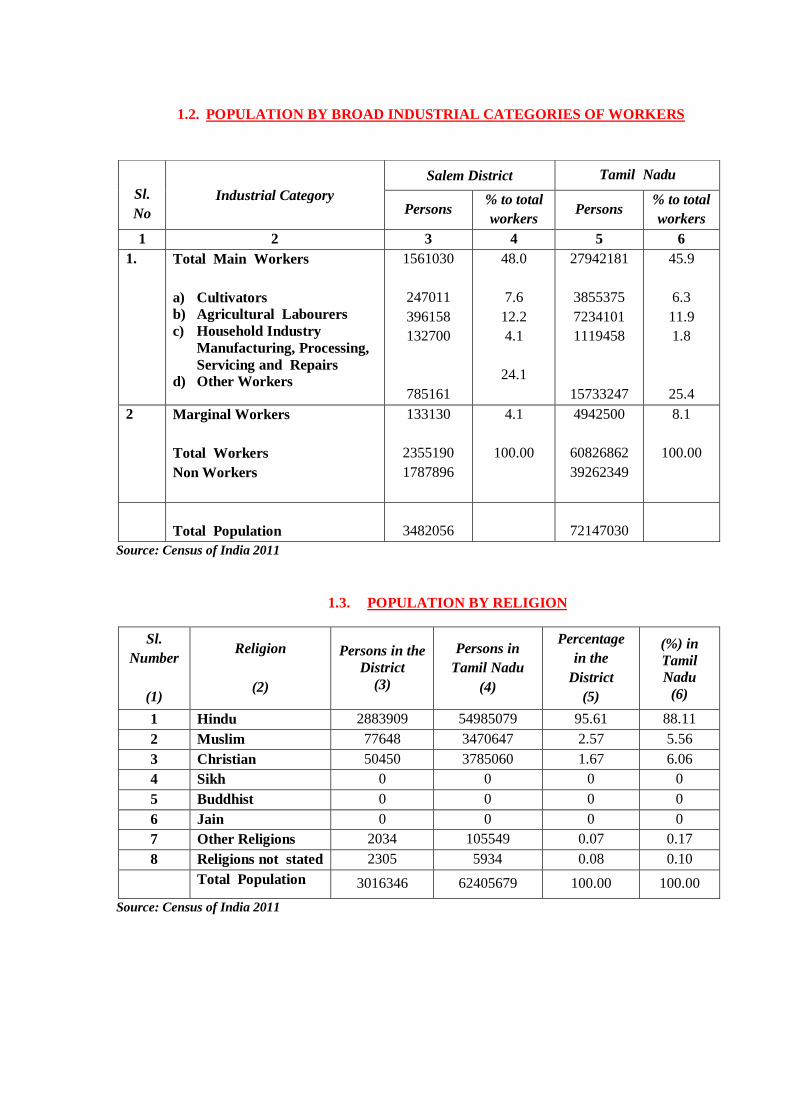
1.2. POPULATION BY BROAD INDUSTRIAL CATEGORIES OF WORKERS
Source: Census of India 2011
1.3. POPULATION BY RELIGION
Sl.
Number
(1)
Religion
(2)
Persons in the
District
(3)
Persons in
Tamil Nadu
(4)
Percentage
in the
District
(5)
(%) in
Tamil
Nadu
(6)
1 Hindu 2883909 54985079 95.61 88.11
2 Muslim 77648 3470647 2.57 5.56
3 Christian 50450 3785060 1.67 6.06
4 Sikh 0 0 0 0
5 Buddhist 0 0 0 0
6 Jain 0 0 0 0
7 Other Religions 2034 105549 0.07 0.17
8 Religions not stated 2305 5934 0.08 0.10
Total Population 3016346 62405679 100.00 100.00
Source: Census of India 2011
Sl.
No
Industrial Category
Salem District Tamil Nadu
Persons % to total
workers Persons
% to total
workers
1 2 3 4 5 6
1. Total Main Workers
a) Cultivators
b) Agricultural Labourers
c) Household Industry
Manufacturing, Processing,
Servicing and Repairs
d) Other Workers
1561030
247011
396158
132700
785161
48.0
7.6
12.2
4.1
24.1
27942181
3855375
7234101
1119458
15733247
45.9
6.3
11.9
1.8
25.4
2 Marginal Workers
Total Workers
Non Workers
133130
2355190
1787896
4.1
100.00
4942500
60826862
39262349
8.1
100.00
Total Population
3482056
72147030
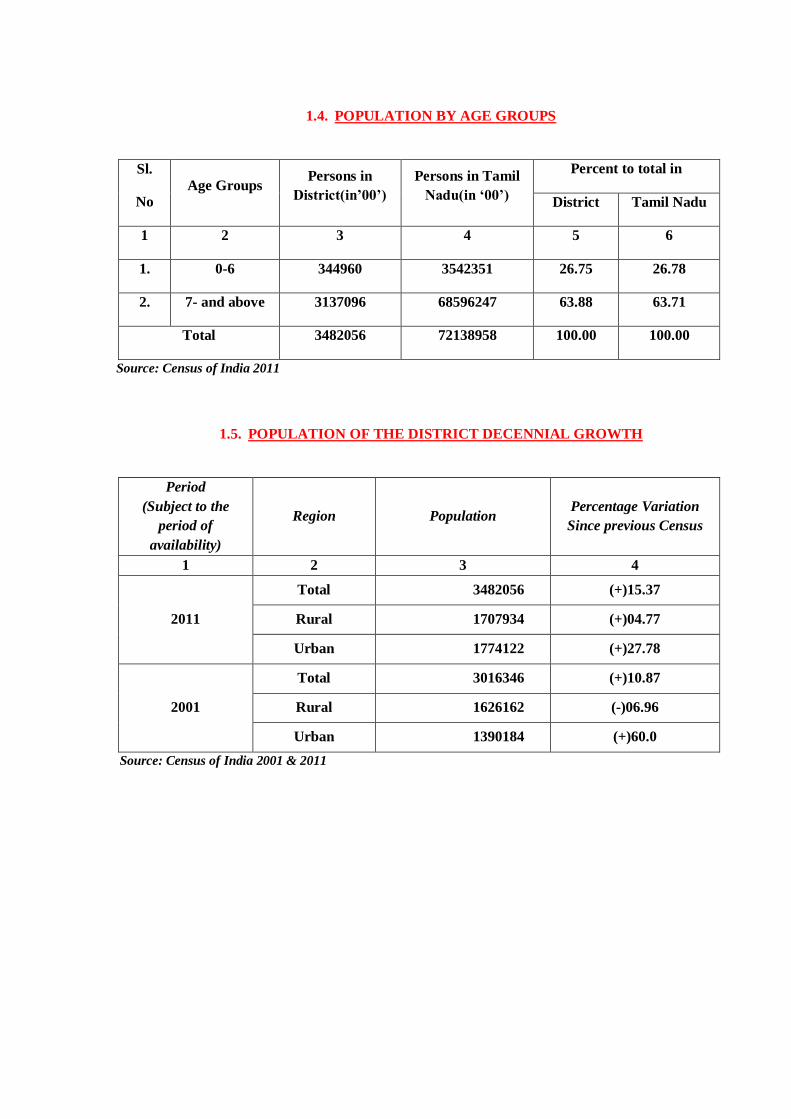
1.4. POPULATION BY AGE GROUPS
Sl.
No Age Groups
Persons in
District(in’00’)
Persons in Tamil
Nadu(in ‘00’)
Percent to total in
District Tamil Nadu
1 2 3 4 5 6
1. 0-6 344960 3542351 26.75 26.78
2. 7- and above 3137096 68596247 63.88 63.71
Total 3482056 72138958 100.00 100.00
Source: Census of India 2011
1.5. POPULATION OF THE DISTRICT DECENNIAL GROWTH
Period
(Subject to the
period of
availability)
Region Population Percentage Variation
Since previous Census
1 2 3 4
2011
Total 3482056 (+)15.37
Rural 1707934 (+)04.77
Urban 1774122 (+)27.78
2001
Total 3016346 (+)10.87
Rural 1626162 (-)06.96
Urban 1390184 (+)60.0
Source: Census of India 2001 & 2011
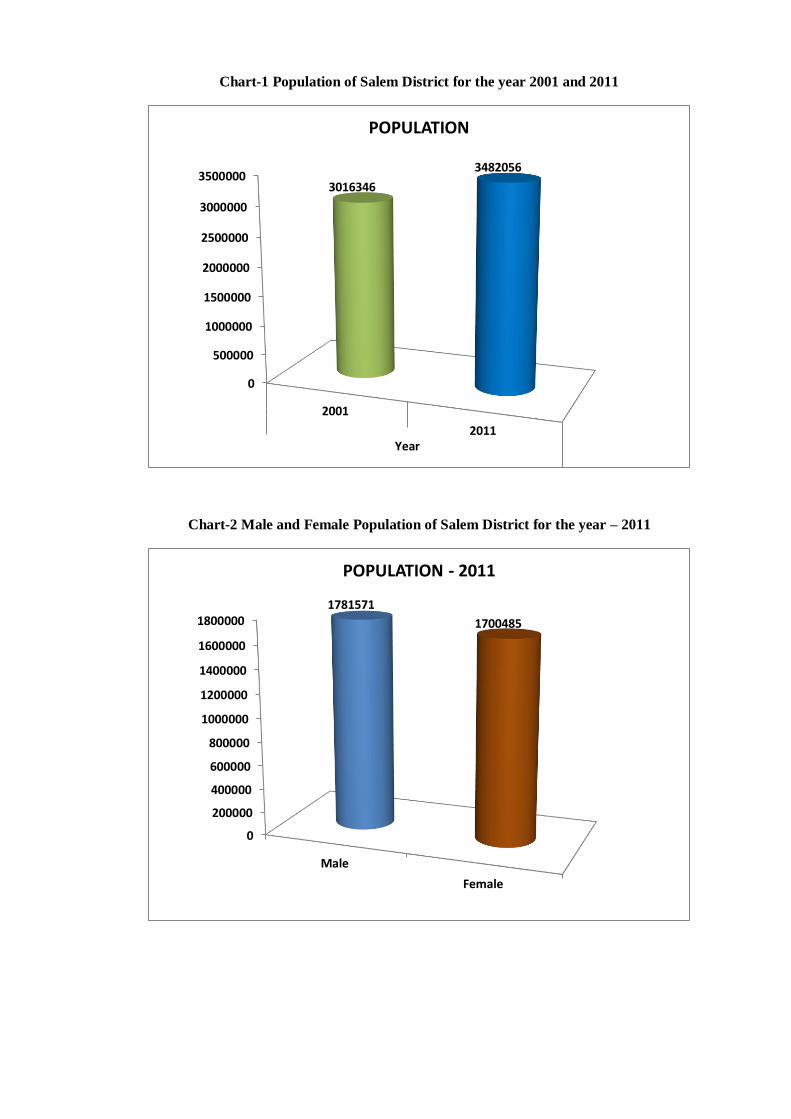
Chart-1 Population of Salem District for the year 2001 and 2011
Chart-2 Male and Female Population of Salem District for the year – 2011
0
500000
1000000
1500000
2000000
2500000
3000000
3500000
2001
2011Year
3016346
3482056
POPULATION
0
200000
400000
600000
800000
1000000
1200000
1400000
1600000
1800000
Male
Female
1781571
1700485
POPULATION - 2011
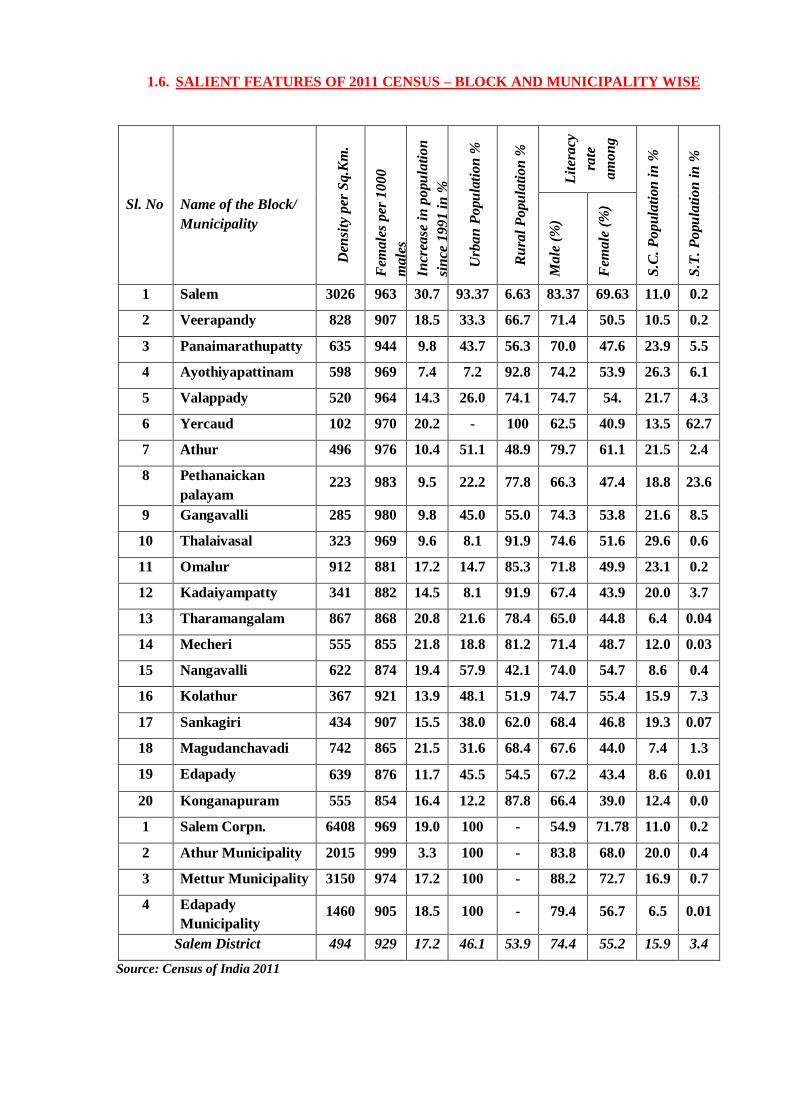
1.6. SALIENT FEATURES OF 2011 CENSUS – BLOCK AND MUNICIPALITY WISE
Sl. No
Name of the Block/
Municipality
Den
sity
per
Sq.K
m.
Fem
ale
s p
er 1
00
0
ma
les
Incr
ease
in
po
pu
lati
on
sin
ce 1
99
1 i
n %
Urb
an
Po
pu
lati
on
%
Ru
ral
Po
pu
lati
on
%
Lit
era
cy
rate
am
on
g
S.C
. P
op
ula
tion
in
%
S.T
. P
opu
lati
on
in
%
Ma
le (
%)
Fem
ale
(%
)
1 Salem 3026 963 30.7 93.37 6.63 83.37 69.63 11.0 0.2
2 Veerapandy 828 907 18.5 33.3 66.7 71.4 50.5 10.5 0.2
3 Panaimarathupatty 635 944 9.8 43.7 56.3 70.0 47.6 23.9 5.5
4 Ayothiyapattinam 598 969 7.4 7.2 92.8 74.2 53.9 26.3 6.1
5 Valappady 520 964 14.3 26.0 74.1 74.7 54. 21.7 4.3
6 Yercaud 102 970 20.2 - 100 62.5 40.9 13.5 62.7
7 Athur 496 976 10.4 51.1 48.9 79.7 61.1 21.5 2.4
8 Pethanaickan
palayam 223 983 9.5 22.2 77.8 66.3 47.4 18.8 23.6
9 Gangavalli 285 980 9.8 45.0 55.0 74.3 53.8 21.6 8.5
10 Thalaivasal 323 969 9.6 8.1 91.9 74.6 51.6 29.6 0.6
11 Omalur 912 881 17.2 14.7 85.3 71.8 49.9 23.1 0.2
12 Kadaiyampatty 341 882 14.5 8.1 91.9 67.4 43.9 20.0 3.7
13 Tharamangalam 867 868 20.8 21.6 78.4 65.0 44.8 6.4 0.04
14 Mecheri 555 855 21.8 18.8 81.2 71.4 48.7 12.0 0.03
15 Nangavalli 622 874 19.4 57.9 42.1 74.0 54.7 8.6 0.4
16 Kolathur 367 921 13.9 48.1 51.9 74.7 55.4 15.9 7.3
17 Sankagiri 434 907 15.5 38.0 62.0 68.4 46.8 19.3 0.07
18 Magudanchavadi 742 865 21.5 31.6 68.4 67.6 44.0 7.4 1.3
19 Edapady 639 876 11.7 45.5 54.5 67.2 43.4 8.6 0.01
20 Konganapuram 555 854 16.4 12.2 87.8 66.4 39.0 12.4 0.0
1 Salem Corpn. 6408 969 19.0 100 - 54.9 71.78 11.0 0.2
2 Athur Municipality 2015 999 3.3 100 - 83.8 68.0 20.0 0.4
3 Mettur Municipality 3150 974 17.2 100 - 88.2 72.7 16.9 0.7
4 Edapady
Municipality 1460 905 18.5 100 - 79.4 56.7 6.5 0.01
Salem District 494 929 17.2 46.1 53.9 74.4 55.2 15.9 3.4
Source: Census of India 2011
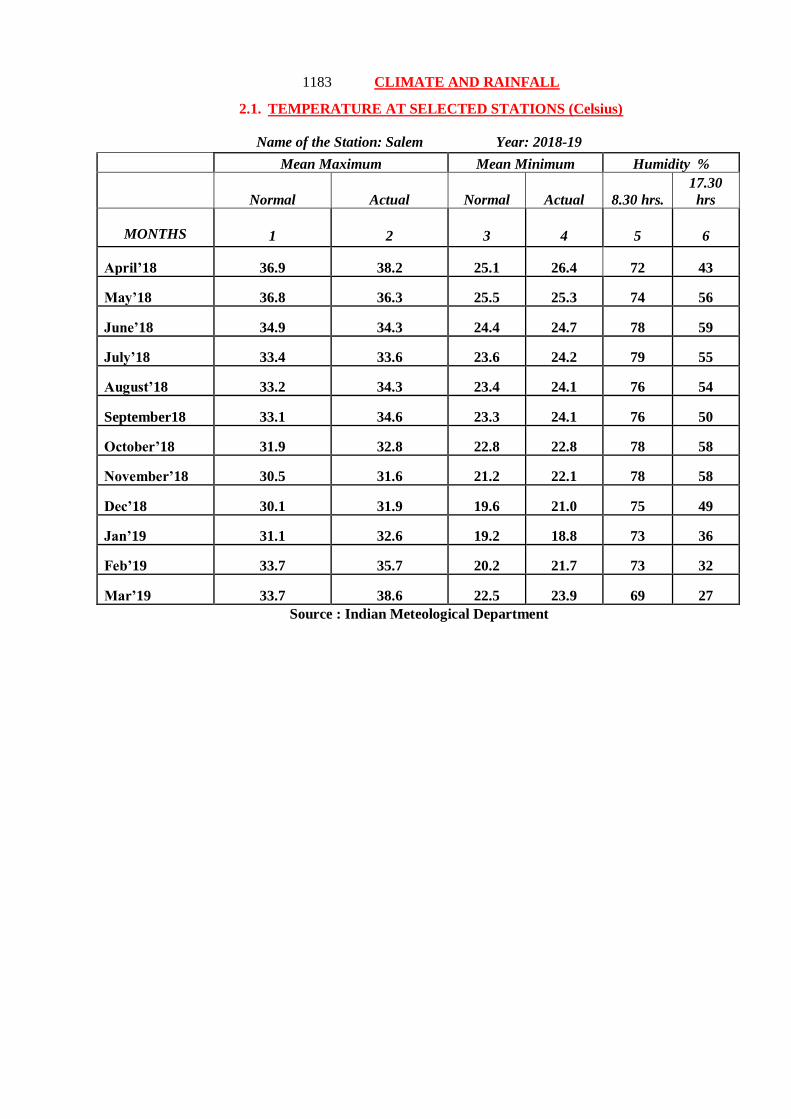
1183 CLIMATE AND RAINFALL
2.1. TEMPERATURE AT SELECTED STATIONS (Celsius)
Name of the Station: Salem Year: 2018-19
Mean Maximum Mean Minimum Humidity %
Normal Actual Normal Actual 8.30 hrs.
17.30
hrs
MONTHS
Months
1
2
3
4
5
6
April’18 36.9 38.2 25.1 26.4 72 43
May’18 36.8 36.3 25.5 25.3 74 56
June’18 34.9 34.3 24.4 24.7 78 59
July’18 33.4 33.6 23.6 24.2 79 55
August’18 33.2 34.3 23.4 24.1 76 54
September18 33.1 34.6 23.3 24.1 76 50
October’18 31.9 32.8 22.8 22.8 78 58
November’18 30.5 31.6 21.2 22.1 78 58
Dec’18 30.1 31.9 19.6 21.0 75 49
Jan’19 31.1 32.6 19.2 18.8 73 36
Feb’19 33.7 35.7 20.2 21.7 73 32
Mar’19 33.7 38.6 22.5 23.9 69 27
Source : Indian Meteological Department
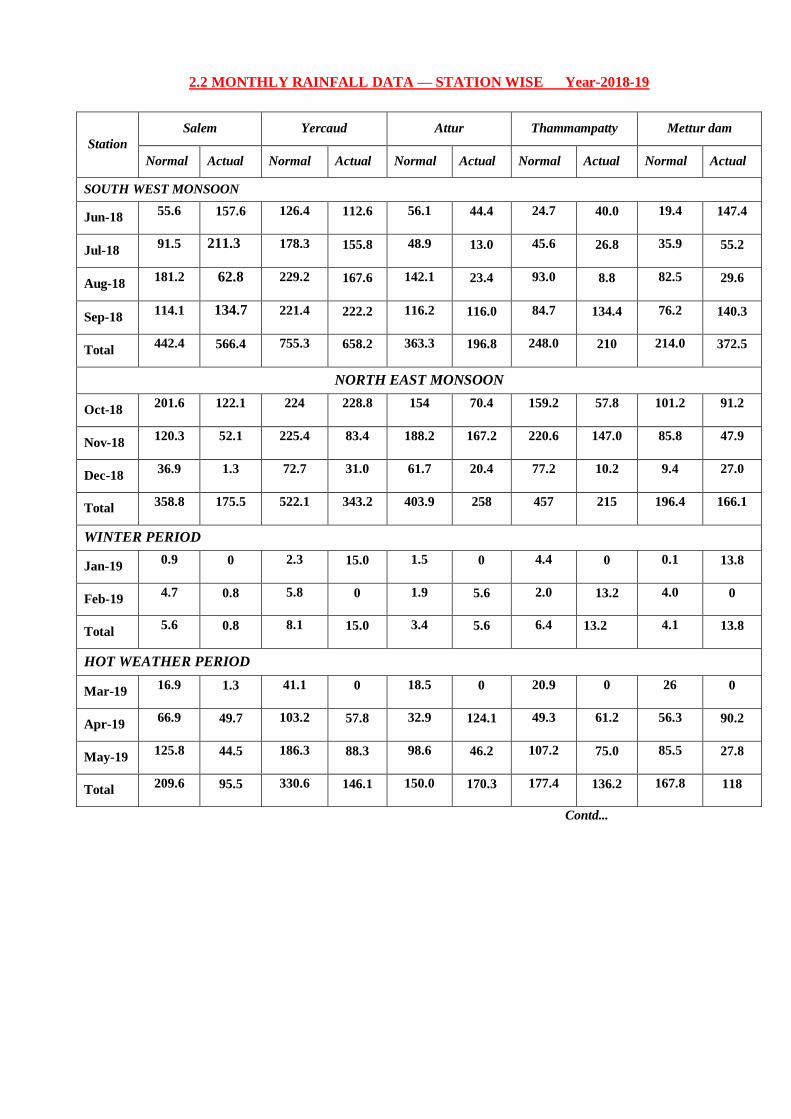
2.2 MONTHLY RAINFALL DATA — STATION WISE Year-2018-19
Station
Salem Yercaud Attur Thammampatty Mettur dam
Normal Actual Normal Actual Normal Actual Normal Actual Normal Actual
SOUTH WEST MONSOON
Jun-18 55.6 157.6 126.4 112.6 56.1 44.4 24.7 40.0 19.4 147.4
Jul-18 91.5 211.3 178.3 155.8 48.9 13.0 45.6 26.8 35.9 55.2
Aug-18 181.2 62.8 229.2 167.6 142.1 23.4 93.0 8.8 82.5 29.6
Sep-18 114.1 134.7 221.4 222.2 116.2 116.0 84.7 134.4 76.2 140.3
Total 442.4 566.4 755.3 658.2 363.3 196.8 248.0 210 214.0 372.5
NORTH EAST MONSOON
Oct-18 201.6 122.1 224 228.8 154 70.4 159.2 57.8 101.2 91.2
Nov-18 120.3 52.1 225.4 83.4 188.2 167.2 220.6 147.0 85.8 47.9
Dec-18 36.9 1.3 72.7 31.0 61.7 20.4 77.2 10.2 9.4 27.0
Total 358.8 175.5 522.1 343.2 403.9 258 457 215 196.4 166.1
WINTER PERIOD
Jan-19 0.9 0 2.3 15.0 1.5 0 4.4 0 0.1 13.8
Feb-19 4.7 0.8 5.8 0 1.9 5.6 2.0 13.2 4.0 0
Total 5.6 0.8 8.1 15.0 3.4 5.6 6.4 13.2 4.1 13.8
HOT WEATHER PERIOD
Mar-19 16.9 1.3 41.1 0 18.5 0 20.9 0 26 0
Apr-19 66.9 49.7 103.2 57.8 32.9 124.1 49.3 61.2 56.3 90.2
May-19 125.8 44.5 186.3 88.3 98.6 46.2 107.2 75.0 85.5 27.8
Total 209.6 95.5 330.6 146.1 150.0 170.3 177.4 136.2 167.8 118
Contd...
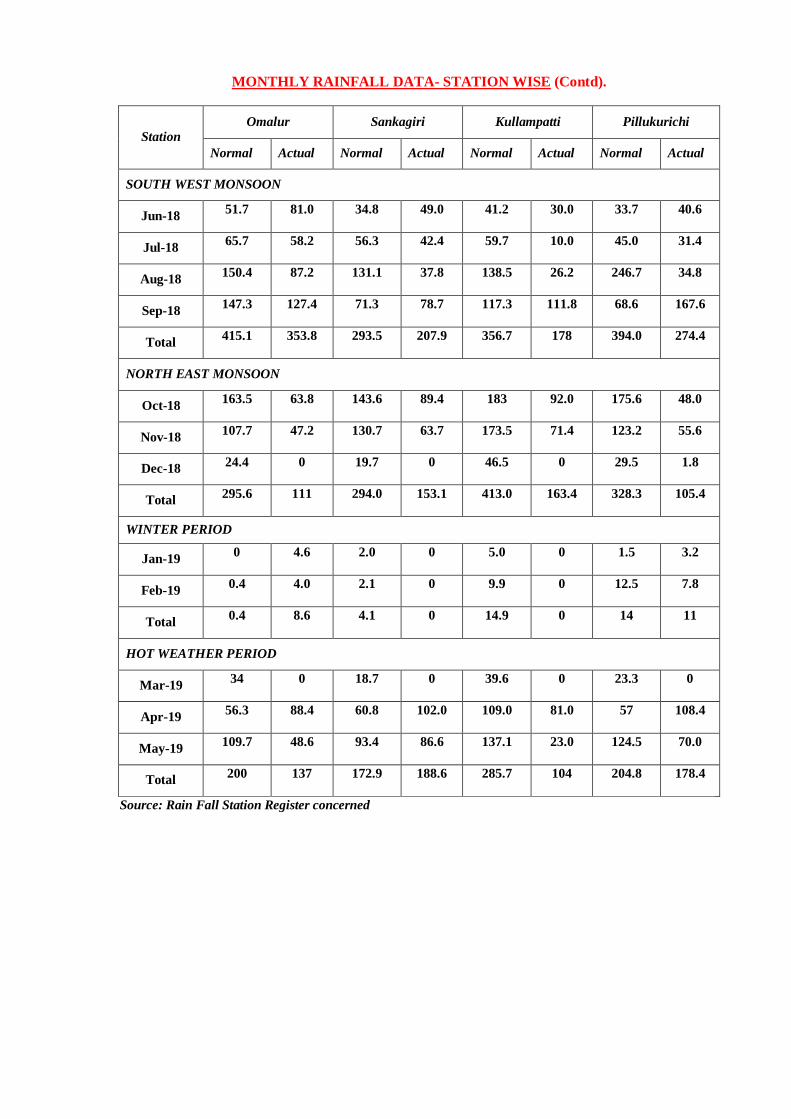
MONTHLY RAINFALL DATA- STATION WISE (Contd).
Station
Omalur Sankagiri Kullampatti Pillukurichi
Normal Actual Normal Actual Normal Actual Normal Actual
SOUTH WEST MONSOON
Jun-18 51.7 81.0 34.8 49.0 41.2 30.0 33.7 40.6
Jul-18 65.7 58.2 56.3 42.4 59.7 10.0 45.0 31.4
Aug-18 150.4 87.2 131.1 37.8 138.5 26.2 246.7 34.8
Sep-18 147.3 127.4 71.3 78.7 117.3 111.8 68.6 167.6
Total 415.1 353.8 293.5 207.9 356.7 178 394.0 274.4
NORTH EAST MONSOON
Oct-18 163.5 63.8 143.6 89.4 183 92.0 175.6 48.0
Nov-18 107.7 47.2 130.7 63.7 173.5 71.4 123.2 55.6
Dec-18 24.4 0 19.7 0 46.5 0 29.5 1.8
Total 295.6 111 294.0 153.1 413.0 163.4 328.3 105.4
WINTER PERIOD
Jan-19 0 4.6 2.0 0 5.0 0 1.5 3.2
Feb-19 0.4 4.0 2.1 0 9.9 0 12.5 7.8
Total 0.4 8.6 4.1 0 14.9 0 14 11
HOT WEATHER PERIOD
Mar-19 34 0 18.7 0 39.6 0 23.3 0
Apr-19 56.3 88.4 60.8 102.0 109.0 81.0 57 108.4
May-19 109.7 48.6 93.4 86.6 137.1 23.0 124.5 70.0
Total 200 137 172.9 188.6 285.7 104 204.8 178.4
Source: Rain Fall Station Register concerned
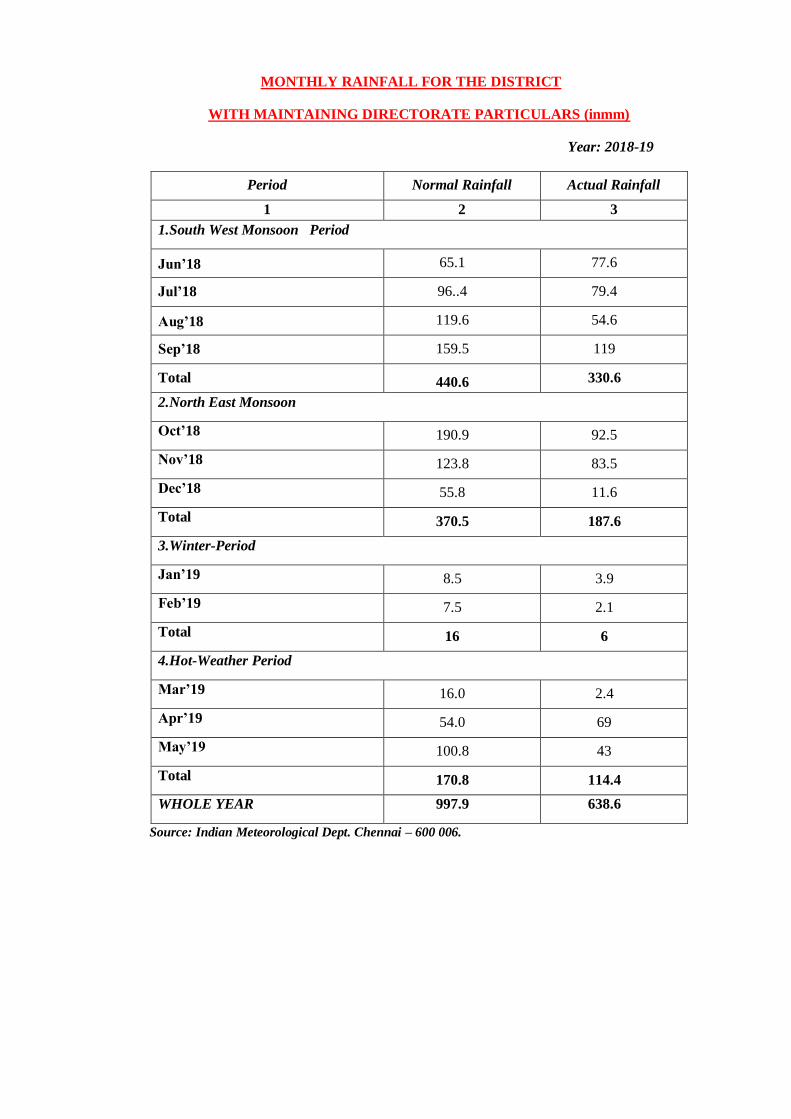
2.222222. 22KL MONTHLY RAINFALL FOR THE DISTRICT
WITH MAINTAINING DIRECTORATE PARTICULARS (inmm)
Year: 2018-19
Period Normal Rainfall Actual Rainfall
1 2 3
1.South West Monsoon Period
Jun’18 65.1 77.6
Jul’18 96..4 79.4
Aug’18 119.6 54.6
Sep’18 159.5 119
Total 440.6 330.6
2.North East Monsoon
Oct’18 190.9 92.5
Nov’18 123.8 83.5
Dec’18 55.8 11.6
Total 370.5 187.6
3.Winter-Period
Jan’19 8.5 3.9
Feb’19 7.5 2.1
Total 16 6
4.Hot-Weather Period
Mar’19 16.0 2.4
Apr’19 54.0 69
May’19 100.8 43
Total 170.8 114.4
WHOLE YEAR 997.9 638.6
Source: Indian Meteorological Dept. Chennai – 600 006.
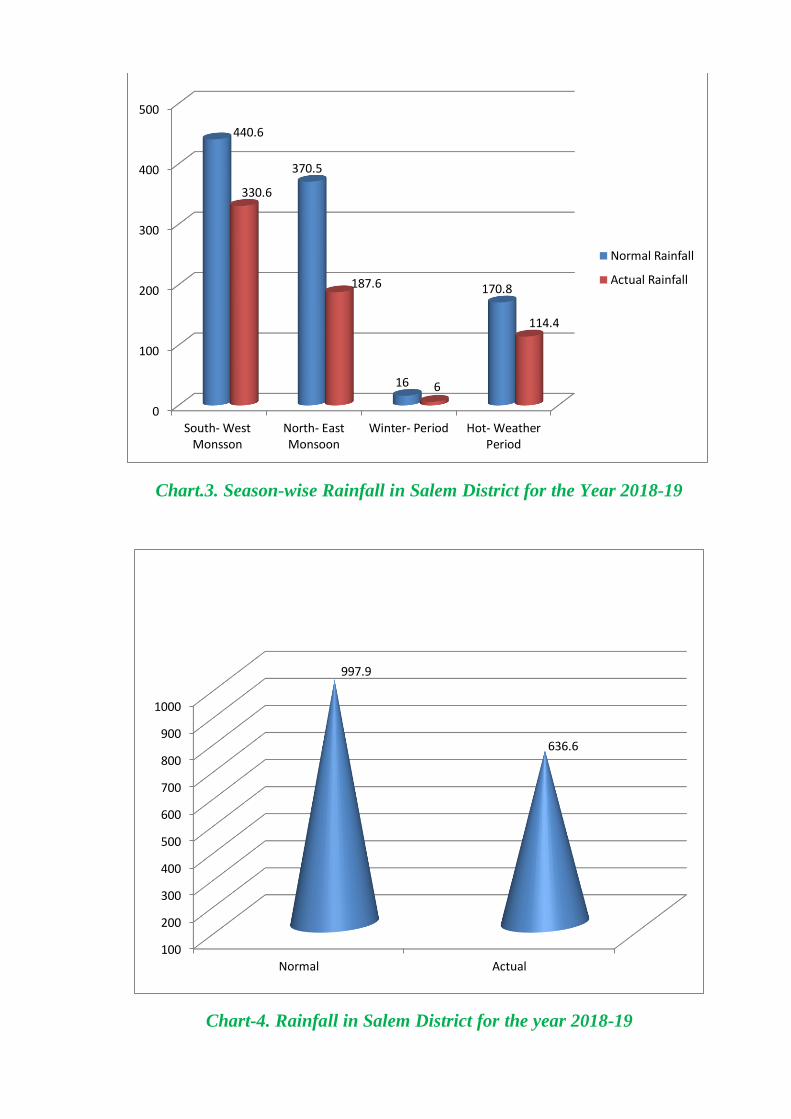
Chart.3. Season-wise Rainfall in Salem District for the Year 2018-19
Chart-4. Rainfall in Salem District for the year 2018-19
0
100
200
300
400
500
South- WestMonsson
North- EastMonsoon
Winter- Period Hot- WeatherPeriod
440.6
370.5
16
170.8
330.6
187.6
6
114.4
Normal Rainfall
Actual Rainfall
100
200
300
400
500
600
700
800
900
1000
Normal Actual
997.9
636.6
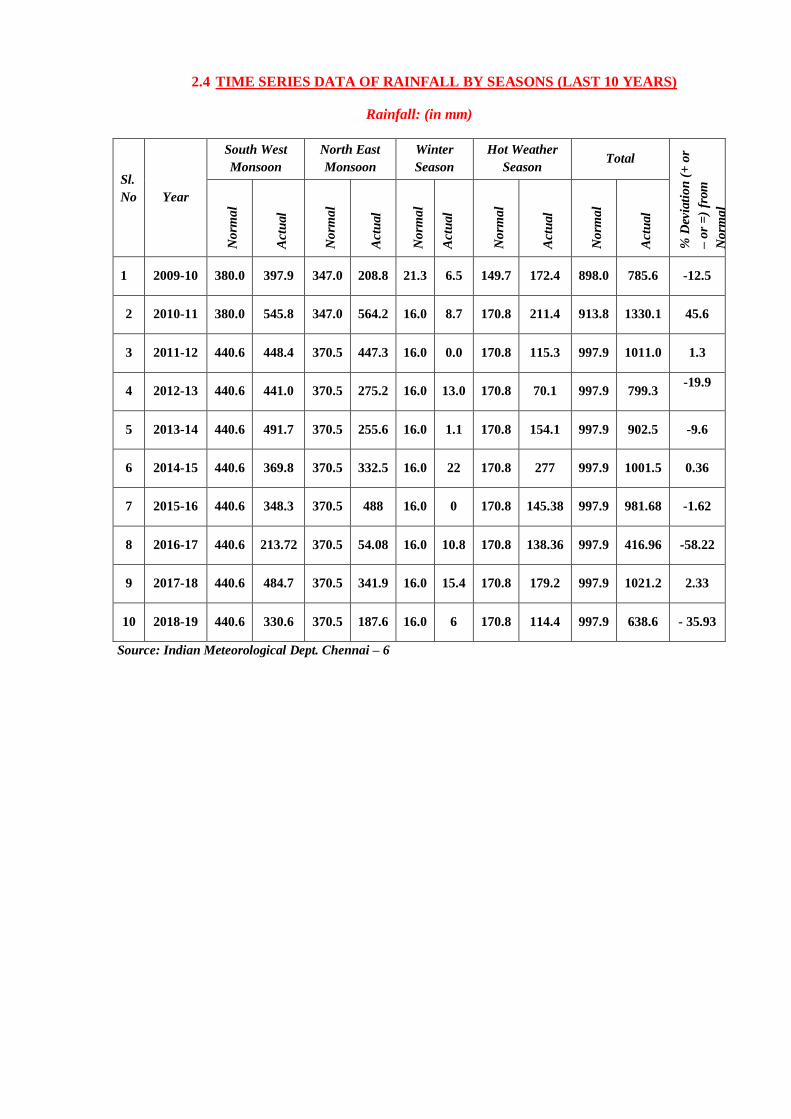
2.4 TIME SERIES DATA OF RAINFALL BY SEASONS (LAST 10 YEARS)
Rainfall: (in mm)
Sl.
No
Year
South West
Monsoon
North East
Monsoon
Winter
Season
Hot Weather
Season Total
% D
evia
tion
(+
or
– o
r =
) fr
om
Norm
al
Norm
al
Actu
al
Norm
al
Actu
al
Norm
al
Actu
al
Norm
al
Actu
al
Norm
al
Actu
al
1 2009-10 380.0 397.9 347.0 208.8 21.3 6.5 149.7 172.4 898.0 785.6 -12.5
2 2010-11 380.0 545.8 347.0 564.2 16.0 8.7 170.8 211.4 913.8 1330.1 45.6
3 2011-12 440.6 448.4 370.5 447.3 16.0 0.0 170.8 115.3 997.9 1011.0 1.3
4 2012-13 440.6 441.0 370.5 275.2 16.0 13.0 170.8 70.1 997.9 799.3 -19.9
5 2013-14 440.6 491.7 370.5 255.6 16.0 1.1 170.8 154.1 997.9 902.5 -9.6
6 2014-15 440.6 369.8 370.5 332.5 16.0 22 170.8 277 997.9 1001.5 0.36
7 2015-16 440.6 348.3 370.5 488 16.0 0 170.8 145.38 997.9 981.68 -1.62
8 2016-17 440.6 213.72 370.5 54.08 16.0 10.8 170.8 138.36 997.9 416.96 -58.22
9 2017-18 440.6 484.7 370.5 341.9 16.0 15.4 170.8 179.2 997.9 1021.2 2.33
10 2018-19 440.6 330.6 370.5 187.6 16.0 6 170.8 114.4 997.9 638.6 - 35.93
Source: Indian Meteorological Dept. Chennai – 6
3. AGRICULTURE
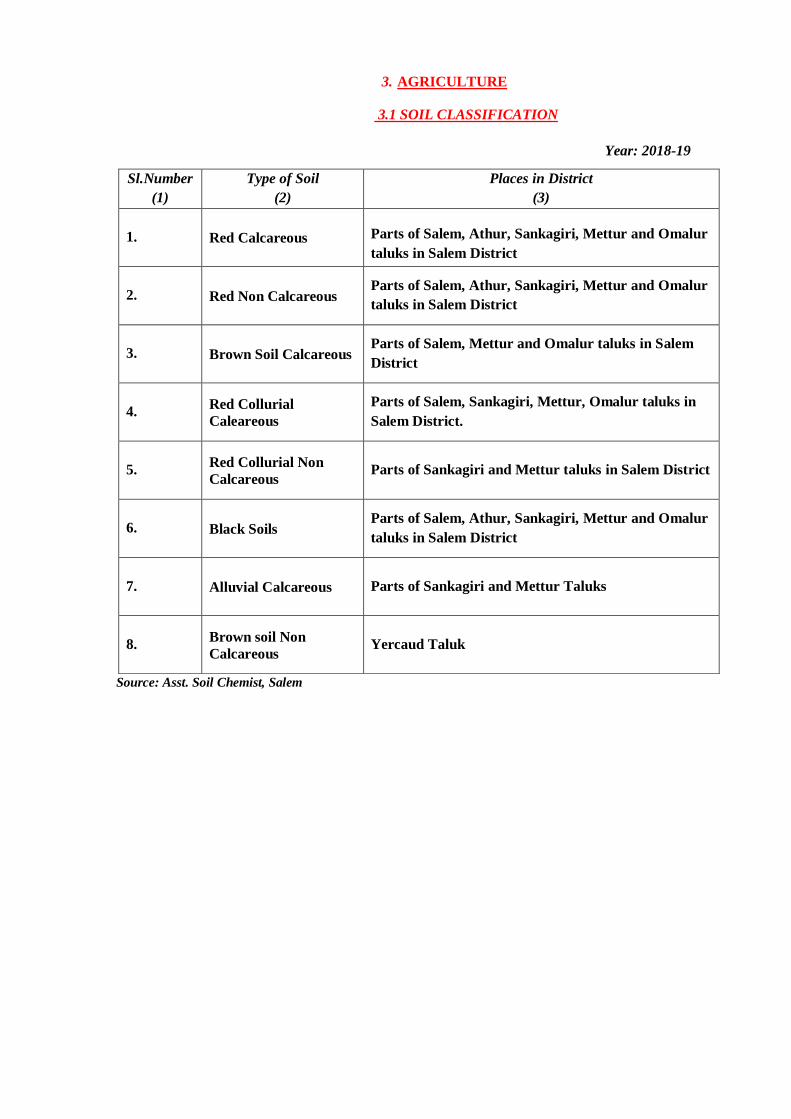
3.1 SOIL CLASSIFICATION
Year: 2018-19
Source: Asst. Soil Chemist, Salem
Sl.Number
(1)
Type of Soil
(2)
Places in District
(3)
1. Red Calcareous Parts of Salem, Athur, Sankagiri, Mettur and Omalur
taluks in Salem District
2. Red Non Calcareous Parts of Salem, Athur, Sankagiri, Mettur and Omalur
taluks in Salem District
3. Brown Soil Calcareous Parts of Salem, Mettur and Omalur taluks in Salem
District
4. Red Collurial
Caleareous
Parts of Salem, Sankagiri, Mettur, Omalur taluks in
Salem District.
5. Red Collurial Non
Calcareous Parts of Sankagiri and Mettur taluks in Salem District
6. Black Soils Parts of Salem, Athur, Sankagiri, Mettur and Omalur
taluks in Salem District
7. Alluvial Calcareous Parts of Sankagiri and Mettur Taluks
8. Brown soil Non
Calcareous Yercaud Taluk
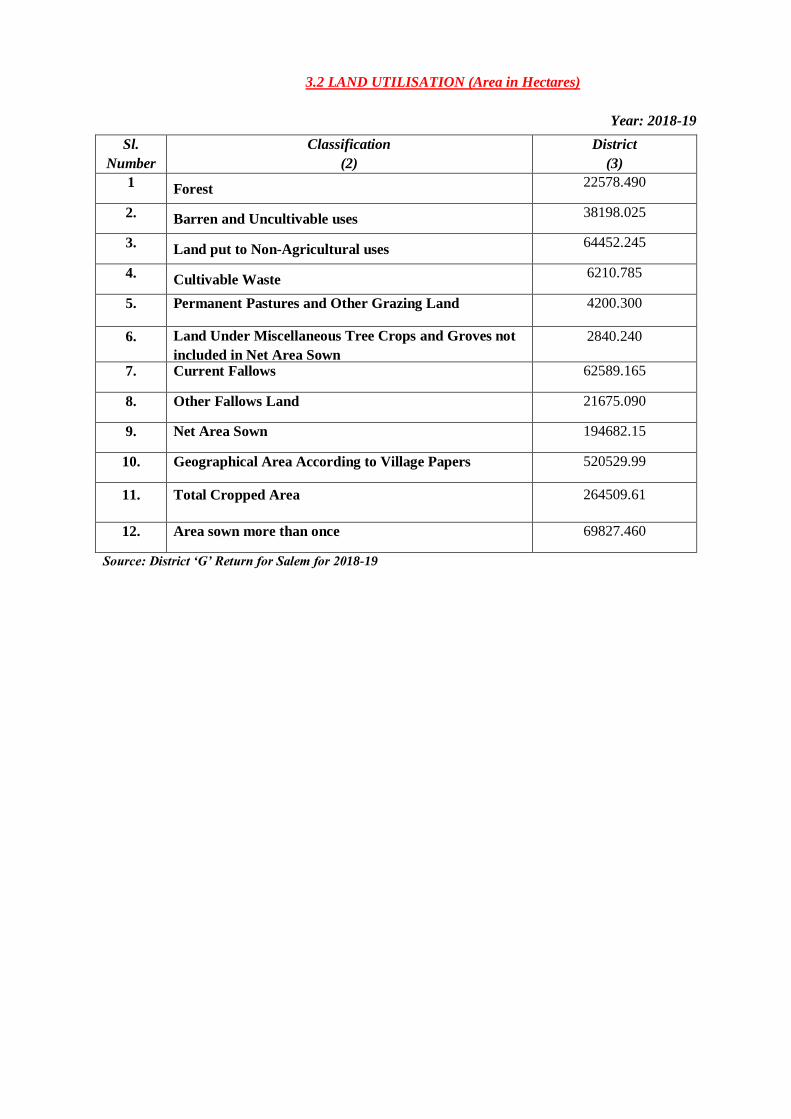
3.2 LAND UTILISATION (Area in Hectares)
Year: 2018-19
Sl.
Number
(1)
Classification
(2)
District
(3)
1 Forest
22578.490
2. Barren and Uncultivable uses 38198.025
3. Land put to Non-Agricultural uses
64452.245
4. Cultivable Waste
6210.785
5. Permanent Pastures and Other Grazing Land 4200.300
6. Land Under Miscellaneous Tree Crops and Groves not
included in Net Area Sown
2840.240
7. Current Fallows 62589.165
8. Other Fallows Land 21675.090
9. Net Area Sown 194682.15
10. Geographical Area According to Village Papers 520529.99
11. Total Cropped Area 264509.61
12. Area sown more than once 69827.460
Source: District ‘G’ Return for Salem for 2018-19
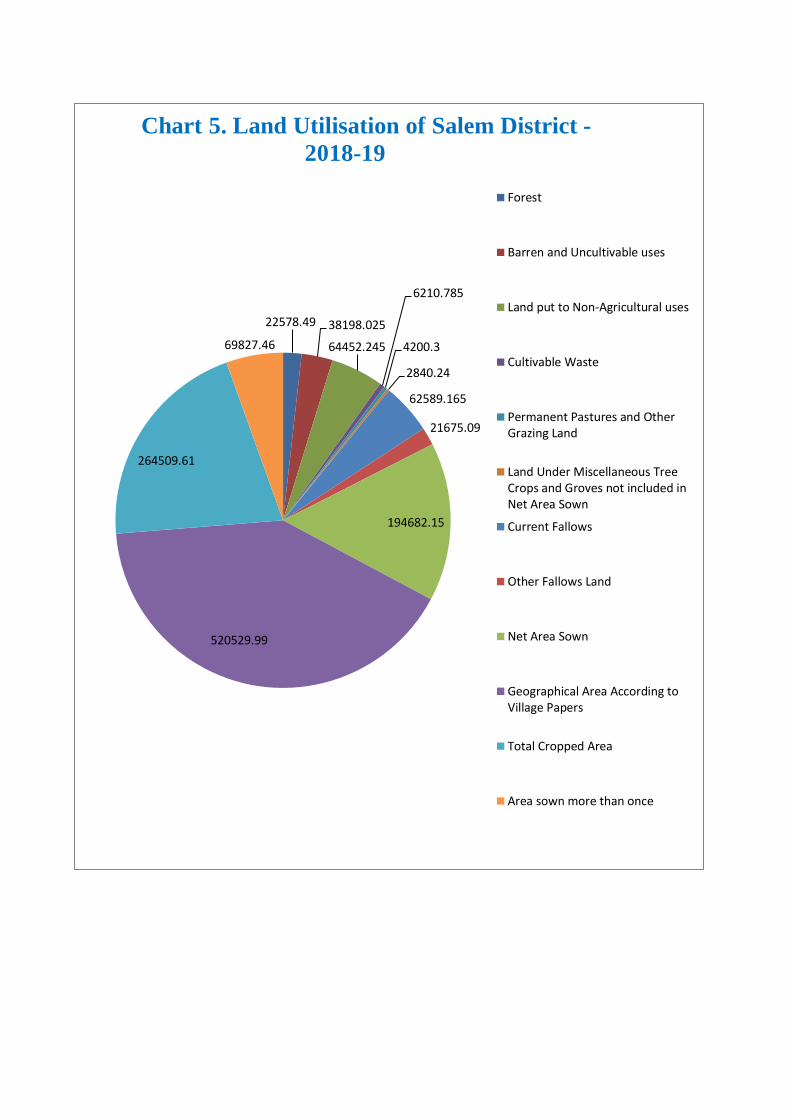
22578.49 38198.025
64452.245
6210.785
4200.3
2840.24
62589.165
21675.09
194682.15
520529.99
264509.61
69827.46
Chart 5. Land Utilisation of Salem District -
2018-19
Forest
Barren and Uncultivable uses
Land put to Non-Agricultural uses
Cultivable Waste
Permanent Pastures and OtherGrazing Land
Land Under Miscellaneous TreeCrops and Groves not included inNet Area Sown
Current Fallows
Other Fallows Land
Net Area Sown
Geographical Area According toVillage Papers
Total Cropped Area
Area sown more than once
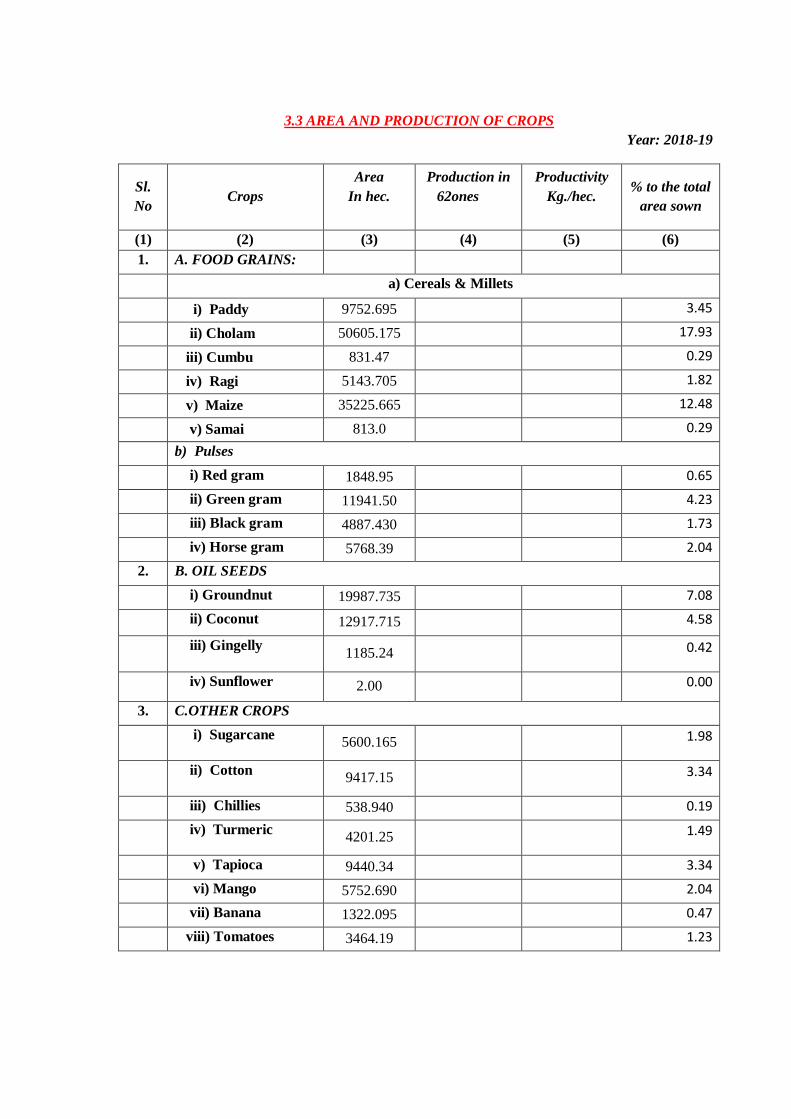
3.3 AREA AND PRODUCTION OF CROPS
Year: 2018-19
Sl.
No
Crops
Area
In hec.
Production in
62ones
Productivity
Kg./hec.
% to the total
area sown
(1) (2) (3) (4) (5) (6)
1. A. FOOD GRAINS:
a) Cereals & Millets
i) Paddy 9752.695 3.45
ii) Cholam 50605.175 17.93
iii) Cumbu 831.47 0.29
iv) Ragi 5143.705 1.82
v) Maize 35225.665 12.48
v) Samai 813.0 0.29
b) Pulses
0.00 i) Red gram 1848.95 0.65
ii) Green gram 11941.50 4.23
iii) Black gram 4887.430 1.73
iv) Horse gram 5768.39 2.04
2. B. OIL SEEDS
0.00 i) Groundnut 19987.735 7.08
ii) Coconut 12917.715 4.58
iii) Gingelly 1185.24 0.42
iv) Sunflower 2.00 0.00
3. C.OTHER CROPS
0.00 i) Sugarcane 5600.165 1.98
ii) Cotton 9417.15 3.34
iii) Chillies 538.940 0.19
iv) Turmeric 4201.25
1.49
v) Tapioca 9440.34 3.34
vi) Mango 5752.690 2.04
vii) Banana 1322.095 0.47
viii) Tomatoes 3464.19 1.23
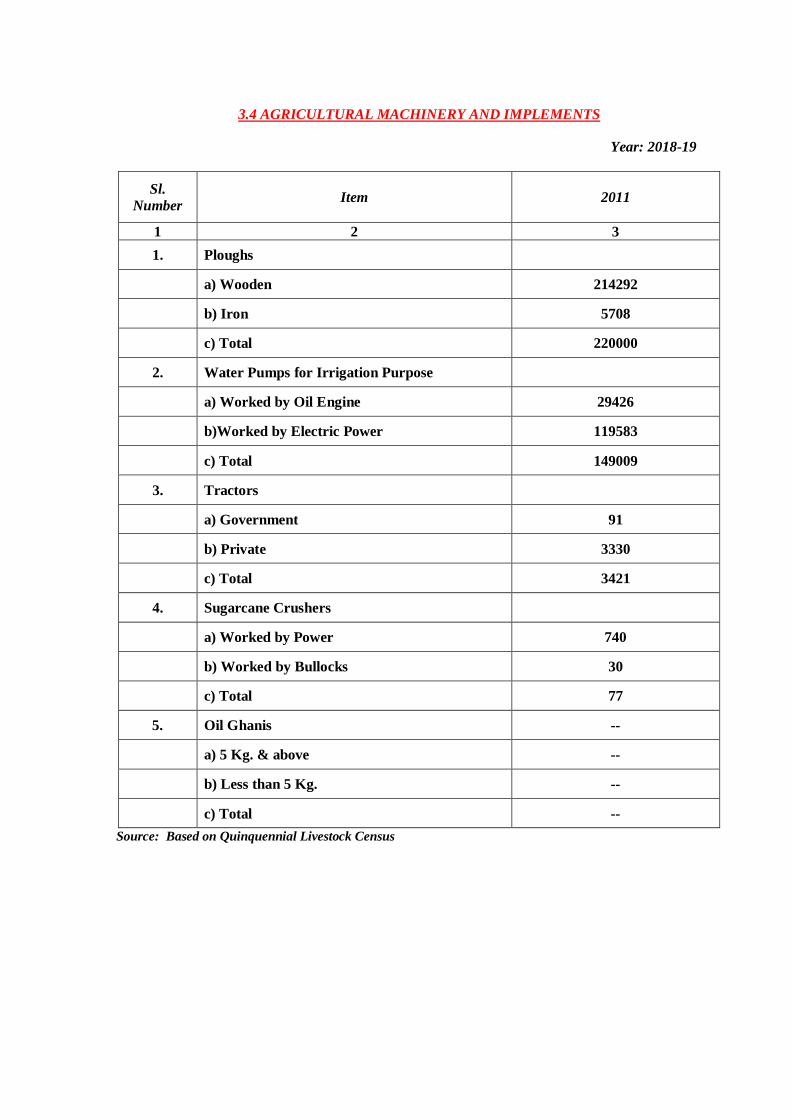
3.4 AGRICULTURAL MACHINERY AND IMPLEMENTS
Year: 2018-19
Sl.
Number
Item
2011
1 2 3
1. Ploughs
a) Wooden 214292
b) Iron 5708
c) Total 220000
2. Water Pumps for Irrigation Purpose
a) Worked by Oil Engine 29426
b)Worked by Electric Power 119583
c) Total 149009
3. Tractors
a) Government 91
b) Private 3330
c) Total 3421
4. Sugarcane Crushers
a) Worked by Power 740
b) Worked by Bullocks 30
c) Total 77
5. Oil Ghanis --
a) 5 Kg. & above --
b) Less than 5 Kg. --
c) Total --
Source: Based on Quinquennial Livestock Census
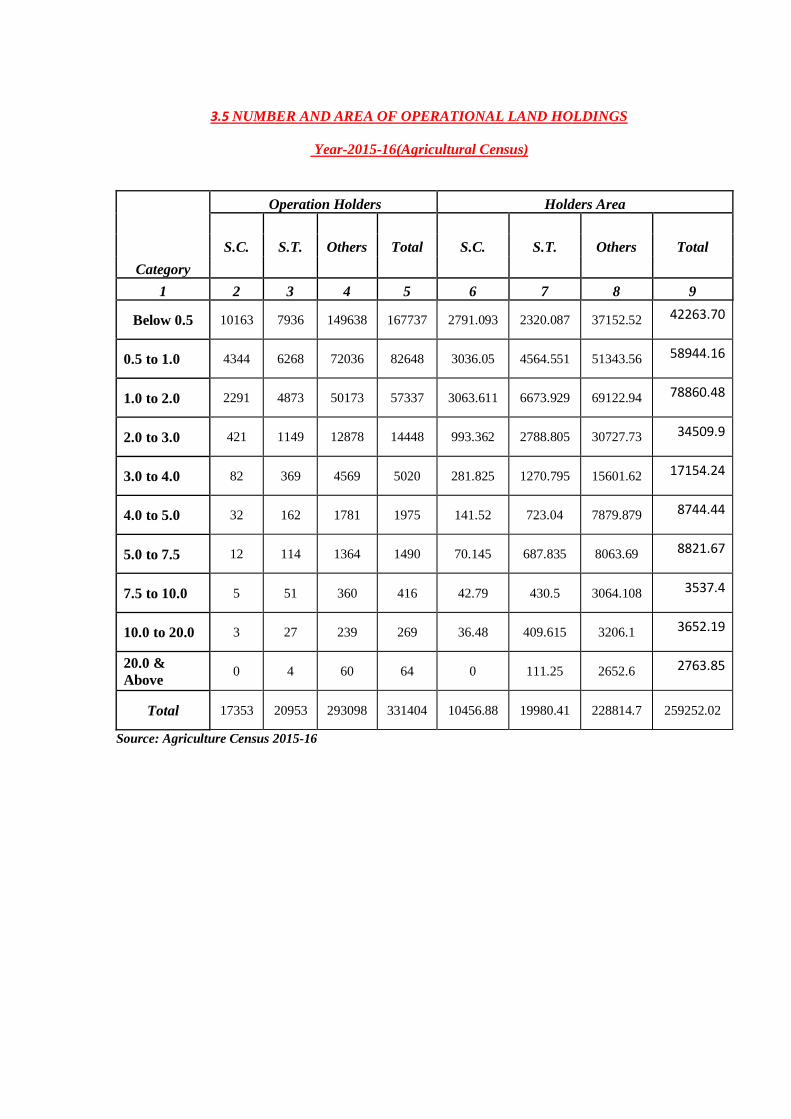
3.5 NUMBER AND AREA OF OPERATIONAL LAND HOLDINGS
Year-2015-16(Agricultural Census)
Category
Operation Holders Holders Area
S.C. S.T. Others Total S.C. S.T. Others Total
1 2 3 4 5 6 7 8 9
Below 0.5 10163 7936 149638 167737 2791.093 2320.087 37152.52 42263.70
0.5 to 1.0 4344 6268 72036 82648 3036.05 4564.551 51343.56 58944.16
1.0 to 2.0 2291 4873 50173 57337 3063.611 6673.929 69122.94 78860.48
2.0 to 3.0 421 1149 12878 14448 993.362 2788.805 30727.73 34509.9
3.0 to 4.0 82 369 4569 5020 281.825 1270.795 15601.62 17154.24
4.0 to 5.0 32 162 1781 1975 141.52 723.04 7879.879 8744.44
5.0 to 7.5 12 114 1364 1490 70.145 687.835 8063.69 8821.67
7.5 to 10.0 5 51 360 416 42.79 430.5 3064.108 3537.4
10.0 to 20.0 3 27 239 269 36.48 409.615 3206.1 3652.19
20.0 &
Above 0 4 60 64 0 111.25 2652.6 2763.85
Total 17353 20953 293098 331404 10456.88 19980.41 228814.7 259252.02
Source: Agriculture Census 2015-16
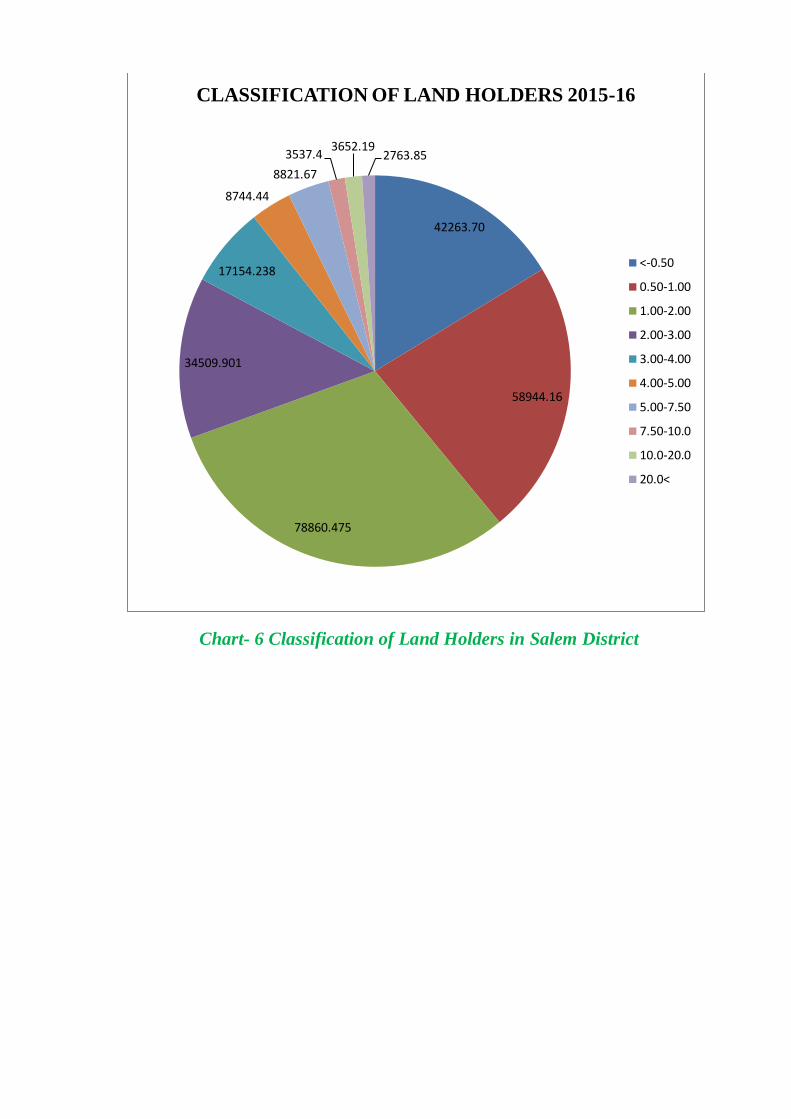
Chart- 6 Classification of Land Holders in Salem District
42263.70
58944.16
78860.475
34509.901
17154.238
8744.44
8821.67
3537.43652.19
2763.85
CLASSIFICATION OF LAND HOLDERS 2015-16
<-0.50
0.50-1.00
1.00-2.00
2.00-3.00
3.00-4.00
4.00-5.00
5.00-7.50
7.50-10.0
10.0-20.0
20.0<
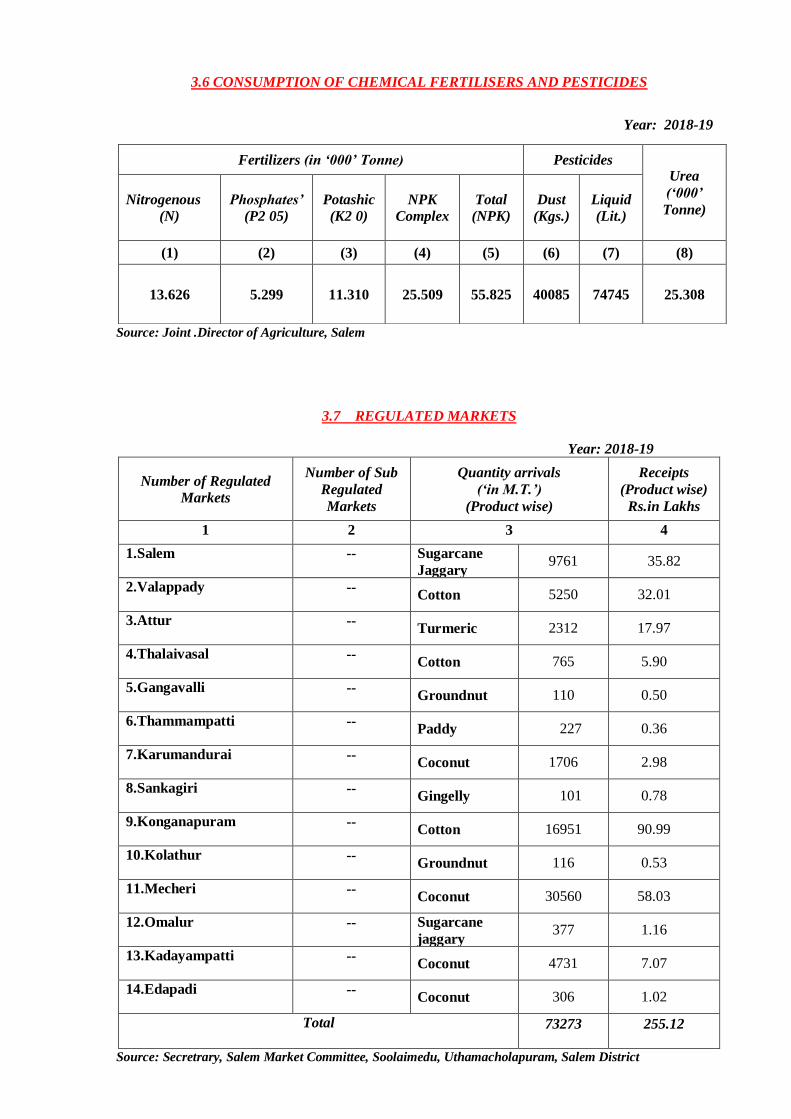
3.6 CONSUMPTION OF CHEMICAL FERTILISERS AND PESTICIDES
Year: 2018-19
Source: Joint .Director of Agriculture, Salem
3.7 REGULATED MARKETS
Year: 2018-19
Number of Regulated
Markets
Number of Sub
Regulated
Markets
Quantity arrivals
(‘in M.T.’)
(Product wise)
Receipts
(Product wise)
Rs.in Lakhs
1 2 3 4
1.Salem -- Sugarcane
Jaggary 9761 35.82
2.Valappady -- Cotton 5250 32.01
3.Attur -- Turmeric 2312 17.97
4.Thalaivasal -- Cotton 765 5.90
5.Gangavalli -- Groundnut 110 0.50
6.Thammampatti -- Paddy 227 0.36
7.Karumandurai -- Coconut 1706 2.98
8.Sankagiri -- Gingelly 101 0.78
9.Konganapuram -- Cotton 16951 90.99
10.Kolathur -- Groundnut 116 0.53
11.Mecheri -- Coconut 30560 58.03
12.Omalur -- Sugarcane
jaggary 377 1.16
13.Kadayampatti -- Coconut 4731 7.07
14.Edapadi -- Coconut 306 1.02
Total 73273 255.12
Source: Secretrary, Salem Market Committee, Soolaimedu, Uthamacholapuram, Salem District
Fertilizers (in ‘000’ Tonne) Pesticides Urea
(‘000’
Tonne) Nitrogenous
(N)
Phosphates’
(P2 05)
Potashic
(K2 0)
NPK
Complex
Total
(NPK)
Dust
(Kgs.)
Liquid
(Lit.)
(1) (2) (3) (4) (5) (6) (7) (8)
13.626 5.299 11.310 25.509 55.825 40085 74745 25.308
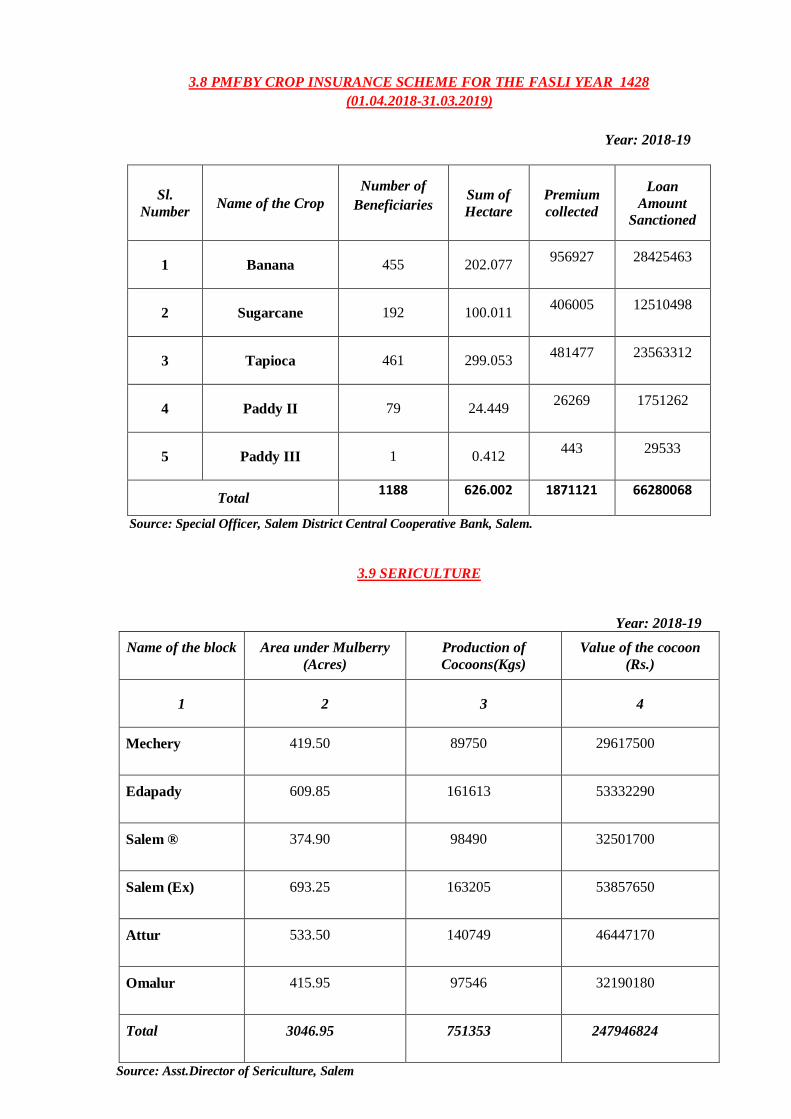
3.8 PMFBY CROP INSURANCE SCHEME FOR THE FASLI YEAR 1428
(01.04.2018-31.03.2019)
Year: 2018-19
Sl.
Number Name of the Crop
Number of
Beneficiaries Sum of
Hectare
Premium
collected
Loan
Amount
Sanctioned
1 Banana 455 202.077 956927 28425463
2 Sugarcane 192 100.011 406005 12510498
3 Tapioca 461 299.053 481477 23563312
4 Paddy II 79 24.449 26269 1751262
5 Paddy III 1 0.412 443 29533
Total 1188
626.002
1871121
66280068
Source: Special Officer, Salem District Central Cooperative Bank, Salem.
3.9 SERICULTURE
Year: 2018-19
Name of the block
Area under Mulberry
(Acres)
Production of
Cocoons(Kgs)
Value of the cocoon
(Rs.)
1 2 3 4
Mechery 419.50 89750 29617500
Edapady 609.85 161613 53332290
Salem ® 374.90 98490 32501700
Salem (Ex) 693.25 163205 53857650
Attur 533.50 140749 46447170
Omalur 415.95 97546 32190180
Total 3046.95 751353 247946824
Source: Asst.Director of Sericulture, Salem
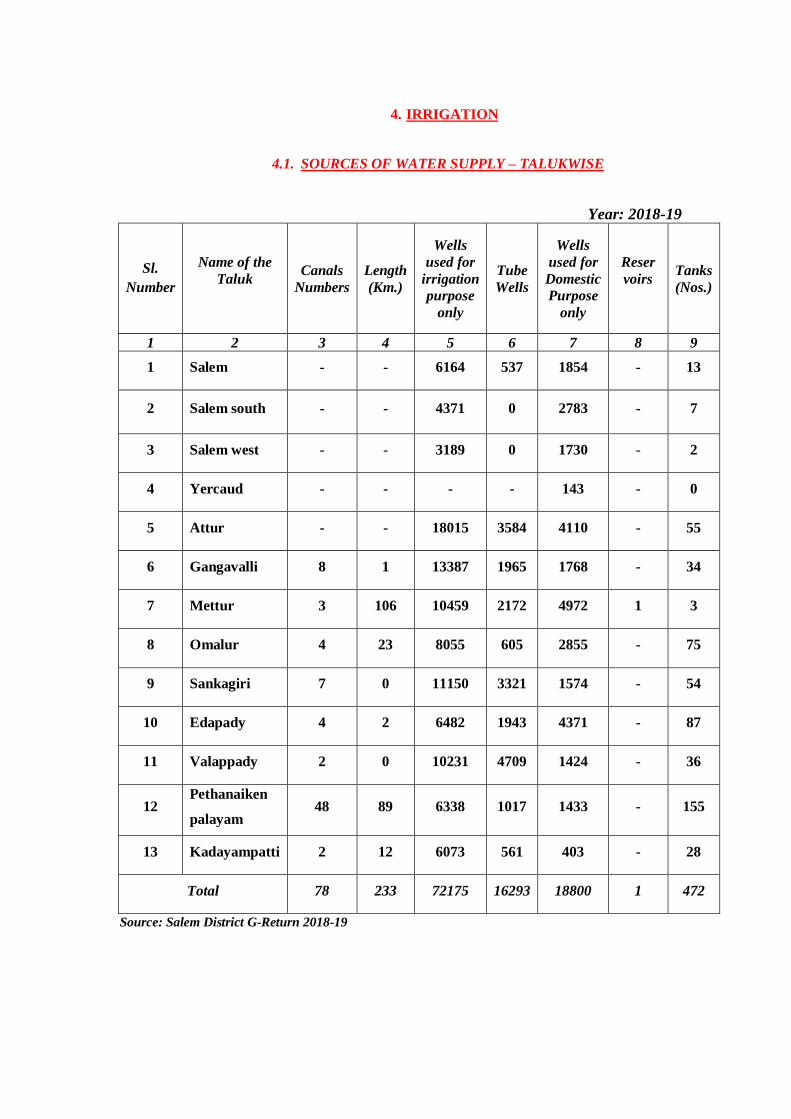
4. IRRIGATION
4.1. SOURCES OF WATER SUPPLY – TALUKWISE
Year: 2018-19
Sl.
Number
Name of the
Taluk
Canals
Numbers
Length
(Km.)
Wells
used for
irrigation
purpose
only
Tube
Wells
Wells
used for
Domestic
Purpose
only
Reser
voirs
Tanks
(Nos.)
1 2 3 4 5 6 7 8 9
1 Salem - - 6164 537 1854 - 13
2 Salem south - - 4371 0 2783 - 7
3 Salem west - - 3189 0 1730 - 2
4 Yercaud - - - - 143 - 0
5 Attur - - 18015 3584 4110 - 55
6 Gangavalli 8 1 13387 1965 1768 - 34
7 Mettur 3 106 10459 2172 4972 1 3
8 Omalur 4 23 8055 605 2855 - 75
9 Sankagiri 7 0 11150 3321 1574 - 54
10 Edapady 4 2 6482 1943 4371 - 87
11 Valappady 2 0 10231 4709 1424 - 36
12 Pethanaiken
palayam 48 89 6338 1017 1433 - 155
13 Kadayampatti 2 12 6073 561 403 - 28
Total 78 233 72175 16293 18800 1 472
Source: Salem District G-Return 2018-19
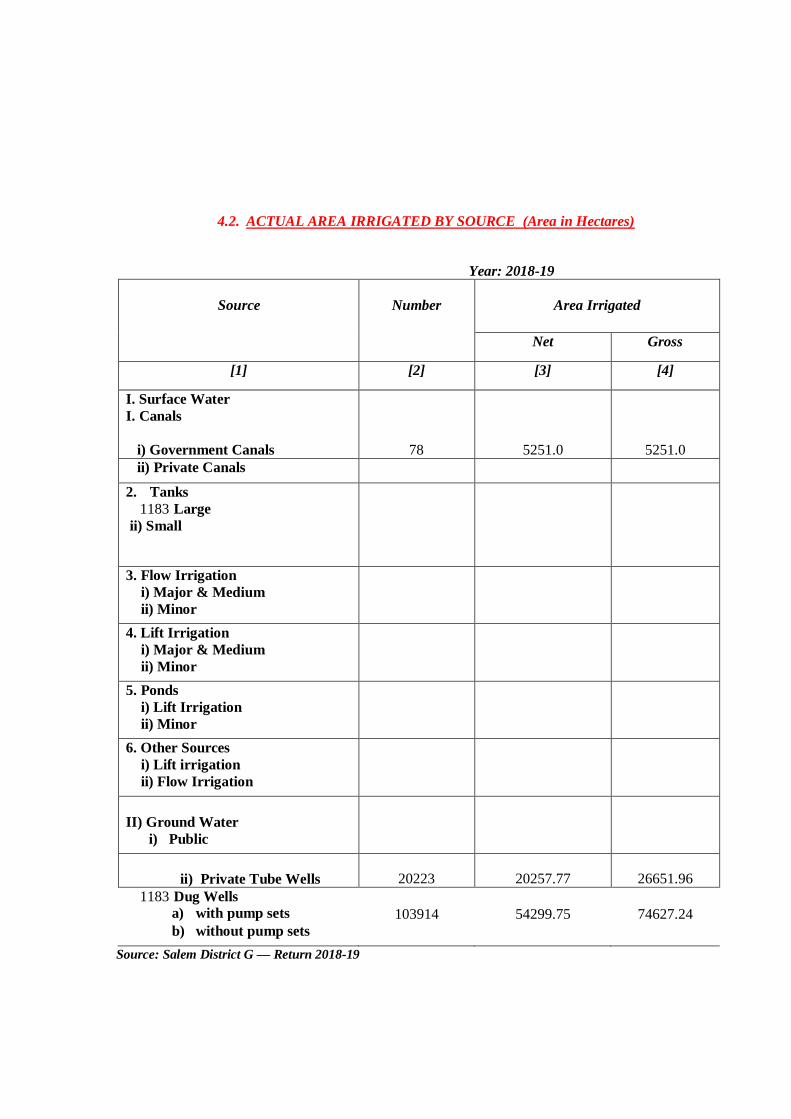
4.2. ACTUAL AREA IRRIGATED BY SOURCE (Area in Hectares)
Year: 2018-19
Source
Number
Area Irrigated
Net Gross
[1] [2] [3] [4]
I. Surface Water
I. Canals
i) Government Canals 78 5251.0 5251.0
ii) Private Canals
2. Tanks
1183 Large
ii) Small
3. Flow Irrigation
i) Major & Medium
ii) Minor
4. Lift Irrigation
i) Major & Medium
ii) Minor
5. Ponds
i) Lift Irrigation
ii) Minor
6. Other Sources
i) Lift irrigation
ii) Flow Irrigation
II) Ground Water
i) Public
ii) Private Tube Wells 20223 20257.77 26651.96
1183 Dug Wells
a) with pump sets
103914
54299.75
74627.24
b) without pump sets
Source: Salem District G — Return 2018-19
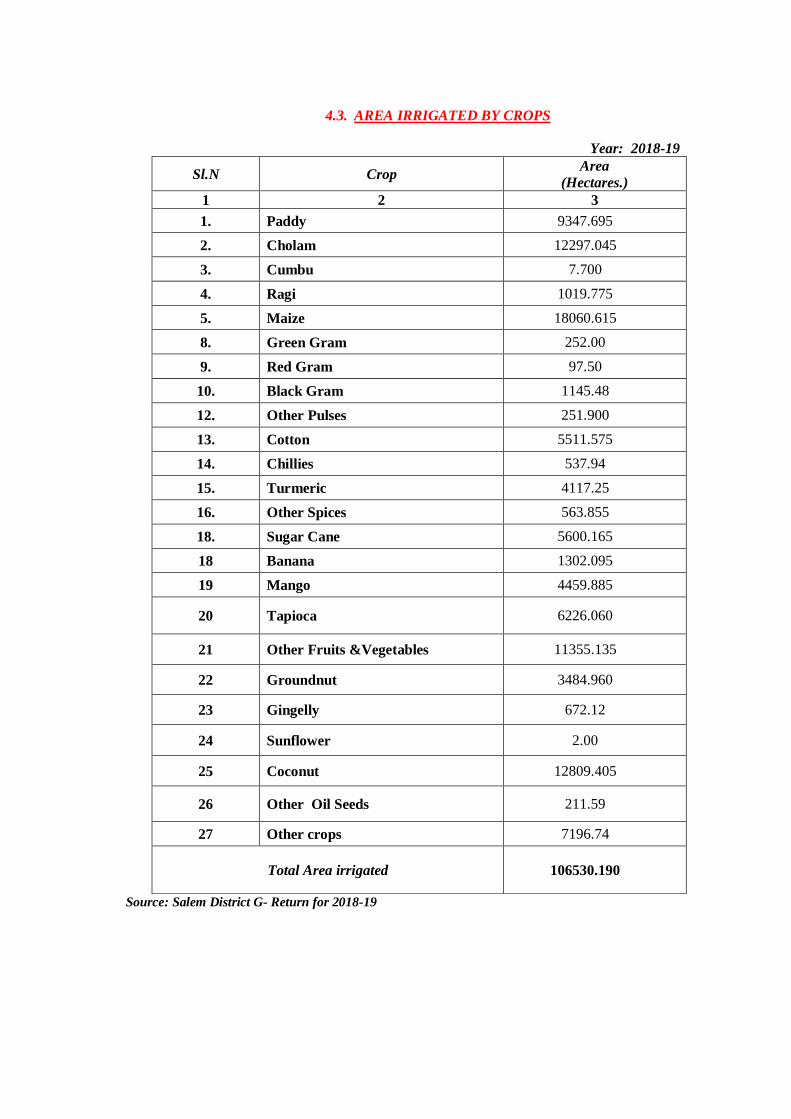
4.3. AREA IRRIGATED BY CROPS
Year: 2018-19
Source: Salem District G- Return for 2018-19
Sl.N Crop Area
(Hectares.)
1 2 3
1. Paddy 9347.695
2. Cholam 12297.045
3. Cumbu 7.700
4. Ragi 1019.775
5. Maize 18060.615
8. Green Gram 252.00
9. Red Gram 97.50
10. Black Gram 1145.48
12. Other Pulses 251.900
13. Cotton 5511.575
14. Chillies 537.94
15. Turmeric 4117.25
16. Other Spices 563.855
18. Sugar Cane 5600.165
18 Banana 1302.095
19 Mango 4459.885
20 Tapioca 6226.060
21 Other Fruits &Vegetables 11355.135
22 Groundnut 3484.960
23 Gingelly 672.12
24 Sunflower 2.00
25 Coconut 12809.405
26 Other Oil Seeds 211.59
27 Other crops 7196.74
Total Area irrigated 106530.190
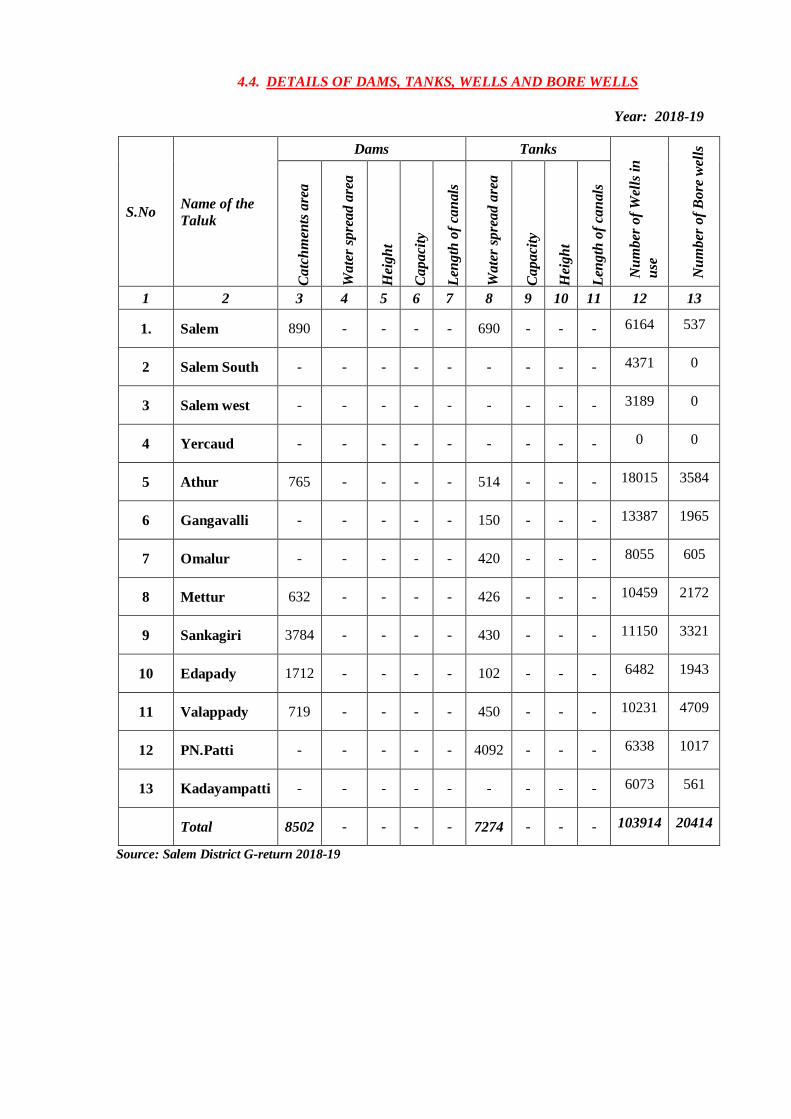
4.4. DETAILS OF DAMS, TANKS, WELLS AND BORE WELLS
Year: 2018-19
Source: Salem District G-return 2018-19
S.No Name of the
Taluk
Dams Tanks
Nu
mb
er o
f W
ells
in
use
Nu
mb
er o
f B
ore
wel
ls
Ca
tch
men
ts a
rea
Wa
ter
spre
ad a
rea
Hei
gh
t
Ca
pa
city
Len
gth
of
can
als
Wa
ter
spre
ad a
rea
Ca
pa
city
Hei
gh
t
Len
gth
of
can
als
1 2 3 4 5 6 7 8 9 10 11 12 13
1. Salem 890 - - - - 690 - - - 6164 537
2 Salem South - - - - - - - - - 4371 0
3 Salem west - - - - - - - - - 3189 0
4 Yercaud - - - - - - - - - 0 0
5 Athur 765 - - - - 514 - - - 18015 3584
6 Gangavalli - - - - - 150 - - - 13387 1965
7 Omalur - - - - - 420 - - - 8055 605
8 Mettur 632 - - - - 426 - - - 10459 2172
9 Sankagiri 3784 - - - - 430 - - - 11150 3321
10 Edapady 1712 - - - - 102 - - - 6482 1943
11 Valappady 719 - - - - 450 - - - 10231 4709
12 PN.Patti - - - - - 4092 - - - 6338 1017
13 Kadayampatti - - - - - - - - - 6073 561
Total 8502 - - - - 7274 - - - 103914 20414
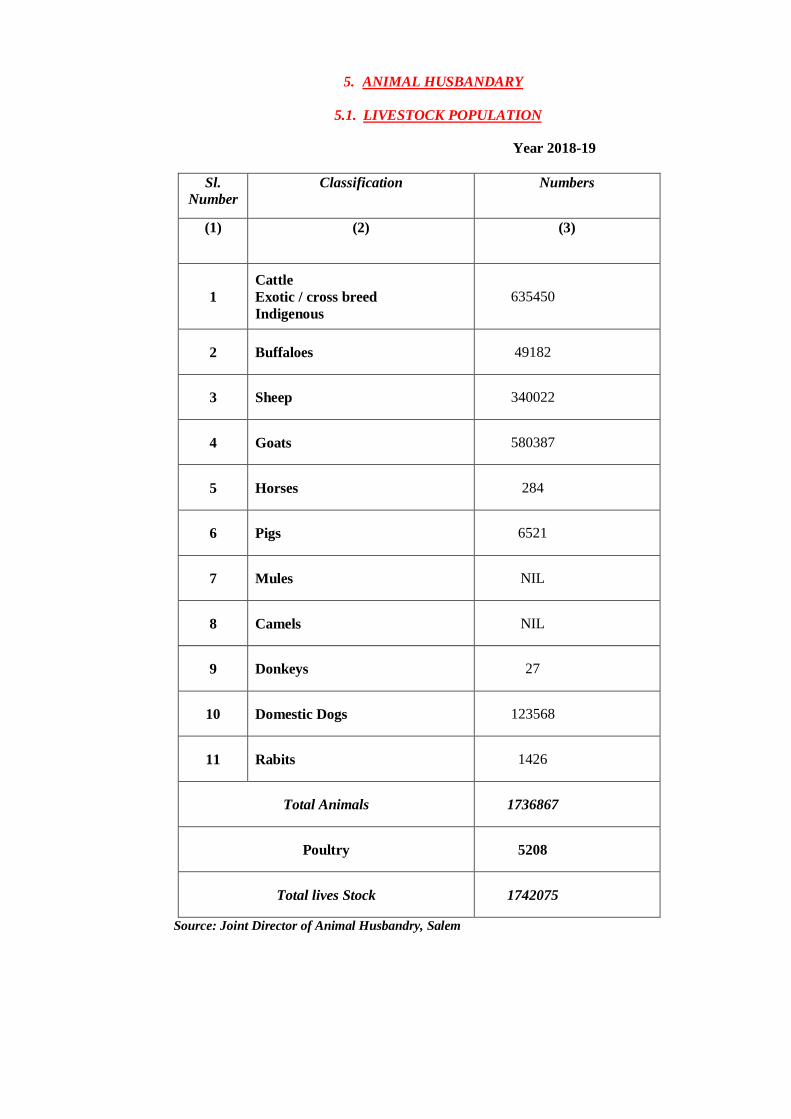
5. ANIMAL HUSBANDARY
5.1. LIVESTOCK POPULATION
Year 2018-19
Sl.
Number
Classification Numbers
(1) (2) (3)
1
Cattle
Exotic / cross breed
Indigenous
635450
2 Buffaloes 49182
3 Sheep 340022
4 Goats 580387
5 Horses 284
6 Pigs 6521
7 Mules NIL
8 Camels NIL
9 Donkeys 27
10 Domestic Dogs 123568
11 Rabits 1426
Total Animals 1736867
Poultry 5208
Total lives Stock 1742075
Source: Joint Director of Animal Husbandry, Salem
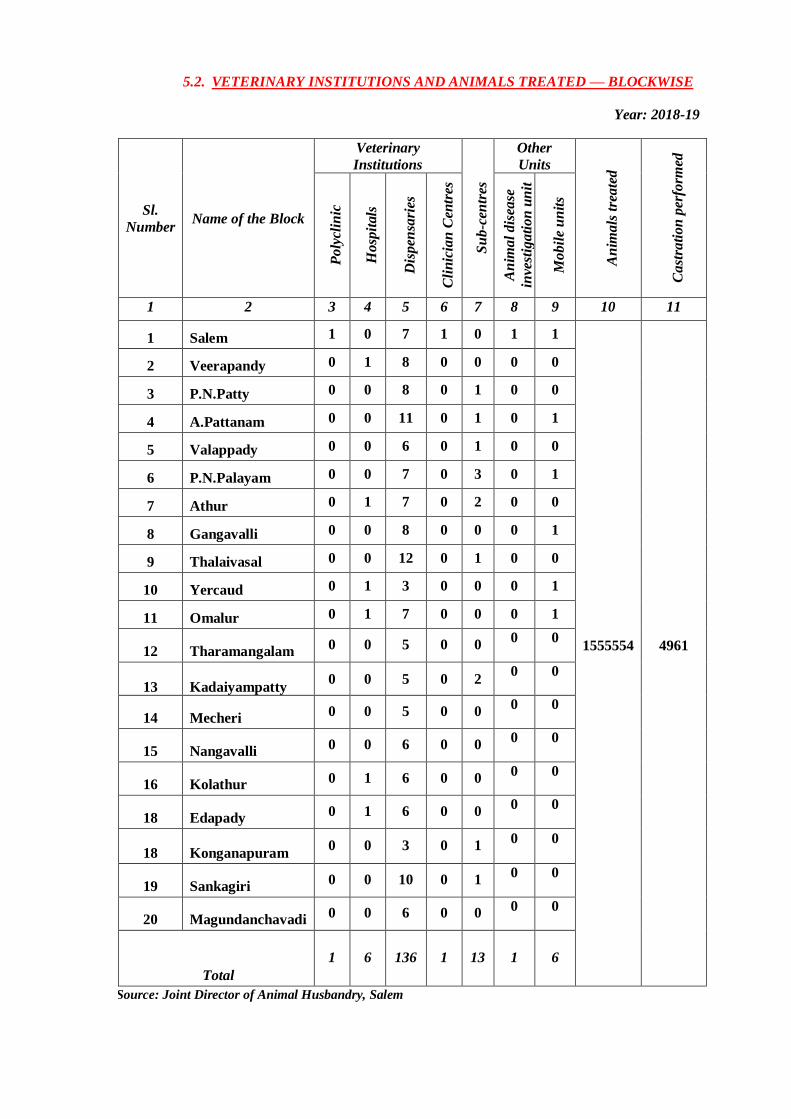
5.2. VETERINARY INSTITUTIONS AND ANIMALS TREATED — BLOCKWISE
Year: 2018-19
Sl.
Number Name of the Block
Veterinary
Institutions
Su
b-c
entr
es
Other
Units
An
ima
ls t
rea
ted
Ca
stra
tio
n p
erfo
rmed
Po
lycl
inic
Ho
spit
als
Dis
pen
sari
es
Cli
nic
ian
Cen
tres
An
ima
l d
isea
se
inve
stig
ati
on
un
it
Mo
bil
e u
nit
s
1 2 3 4 5 6 7 8 9 10 11
1 Salem 1 0 7 1 0 1 1
1555554 4961
2 Veerapandy 0 1 8 0 0 0 0
3 P.N.Patty 0 0 8 0 1 0 0
4 A.Pattanam 0 0 11 0 1 0 1
5 Valappady 0 0 6 0 1 0 0
6 P.N.Palayam 0 0 7 0 3 0 1
7 Athur 0 1 7 0 2 0 0
8 Gangavalli 0 0 8 0 0 0 1
9 Thalaivasal 0 0 12 0 1 0 0
10 Yercaud 0 1 3 0 0 0 1
11 Omalur 0 1 7 0 0 0 1
12 Tharamangalam 0 0 5 0 0
0 0
13 Kadaiyampatty 0 0 5 0 2
0 0
14 Mecheri 0 0 5 0 0
0 0
15 Nangavalli 0 0 6 0 0
0 0
16 Kolathur 0 1 6 0 0 0 0
18 Edapady 0 1 6 0 0
0 0
18 Konganapuram 0 0 3 0 1
0 0
19 Sankagiri 0 0 10 0 1
0 0
20 Magundanchavadi 0 0 6 0 0
0 0
Total
1 6 136 1 13 1 6
Source: Joint Director of Animal Husbandry, Salem
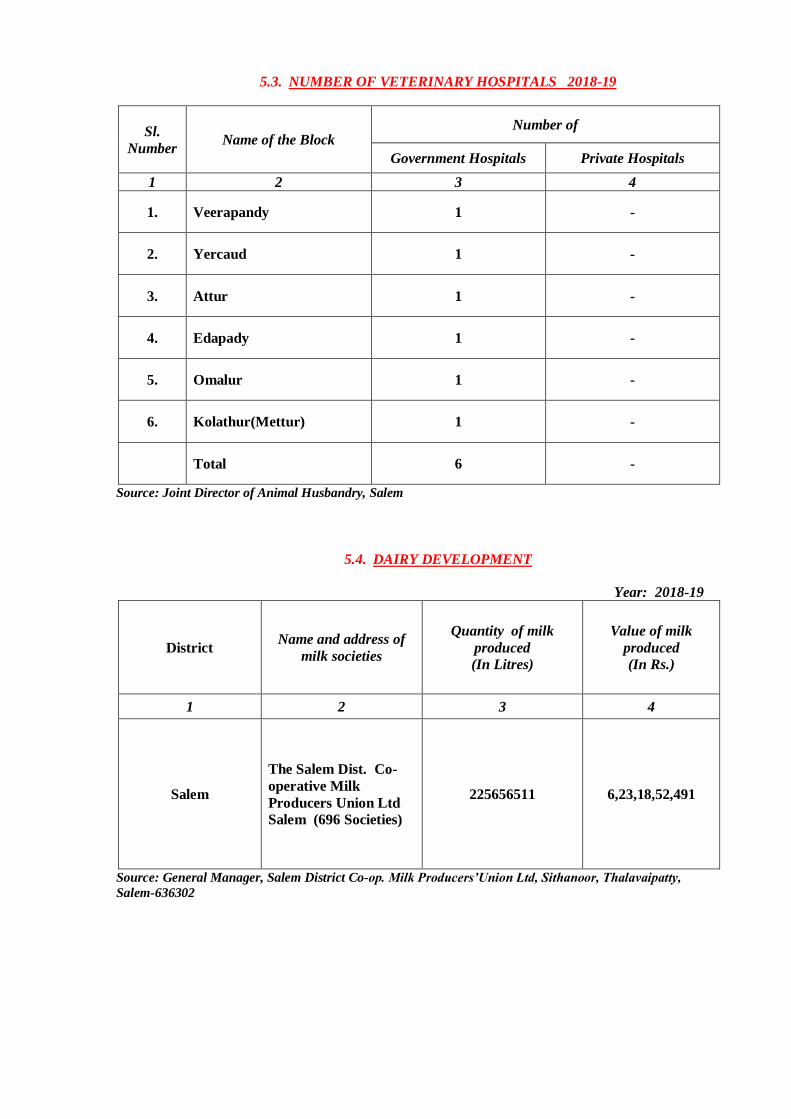
5.3. NUMBER OF VETERINARY HOSPITALS 2018-19
Sl.
Number Name of the Block
Number of
Government Hospitals Private Hospitals
1 2 3 4
1. Veerapandy 1 -
2. Yercaud 1 -
3. Attur 1 -
4. Edapady 1 -
5. Omalur 1 -
6. Kolathur(Mettur) 1 -
Total 6 -
Source: Joint Director of Animal Husbandry, Salem
5.4. DAIRY DEVELOPMENT
Year: 2018-19
District Name and address of
milk societies
Quantity of milk
produced
(In Litres)
Value of milk
produced
(In Rs.)
1 2 3 4
Salem
The Salem Dist. Co-
operative Milk
Producers Union Ltd
Salem (696 Societies)
225656511 6,23,18,52,491
Source: General Manager, Salem District Co-op. Milk Producers’Union Ltd, Sithanoor, Thalavaipatty,
Salem-636302
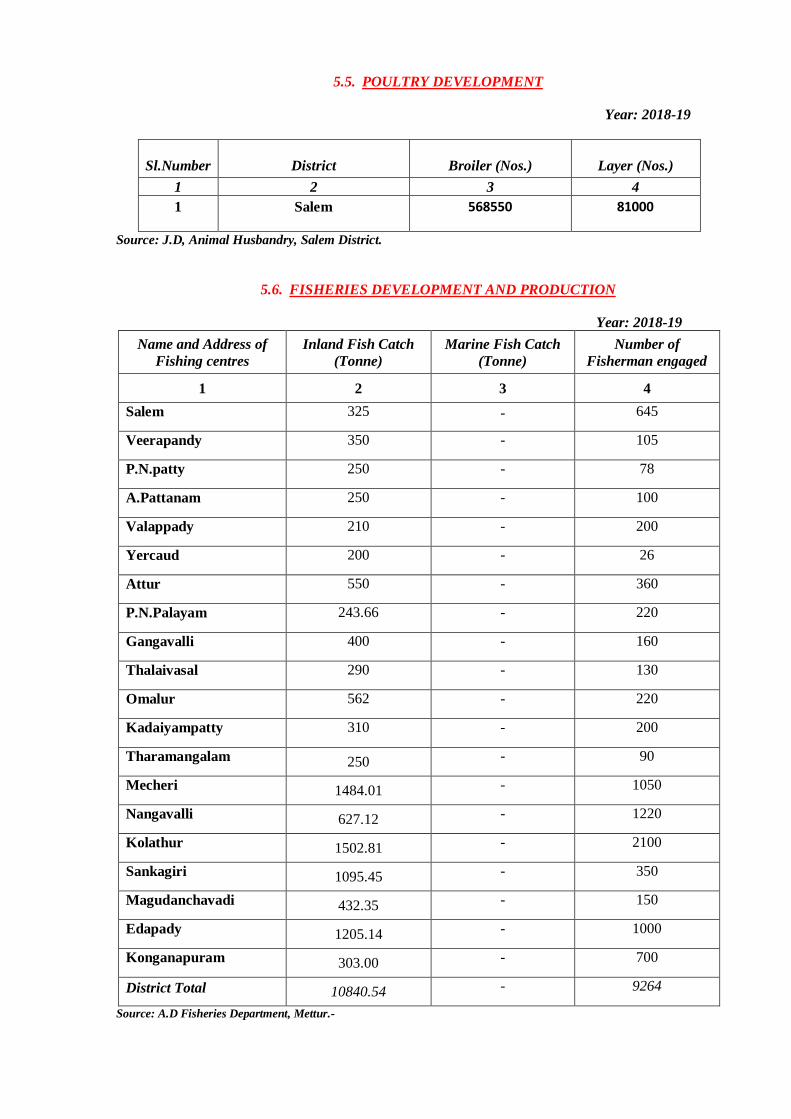
5.5. POULTRY DEVELOPMENT
Year: 2018-19
Sl.Number
District
Broiler (Nos.)
Layer (Nos.)
1 2 3 4
1 Salem 568550 81000
Source: J.D, Animal Husbandry, Salem District.
5.6. FISHERIES DEVELOPMENT AND PRODUCTION
Year: 2018-19
Name and Address of
Fishing centres
Inland Fish Catch
(Tonne)
Marine Fish Catch
(Tonne)
Number of
Fisherman engaged
1 2 3 4
Salem 325 - 645
Veerapandy 350 - 105
P.N.patty 250 - 78
A.Pattanam 250 - 100
Valappady 210 - 200
Yercaud 200 - 26
Attur 550 - 360
P.N.Palayam 243.66 - 220
Gangavalli 400 - 160
Thalaivasal 290 - 130
Omalur 562 - 220
Kadaiyampatty 310 - 200
Tharamangalam 250 - 90
Mecheri 1484.01 - 1050
Nangavalli 627.12 - 1220
Kolathur 1502.81 - 2100
Sankagiri 1095.45 - 350
Magudanchavadi 432.35 - 150
Edapady 1205.14 - 1000
Konganapuram 303.00 - 700
District Total 10840.54 - 9264
Source: A.D Fisheries Department, Mettur.-
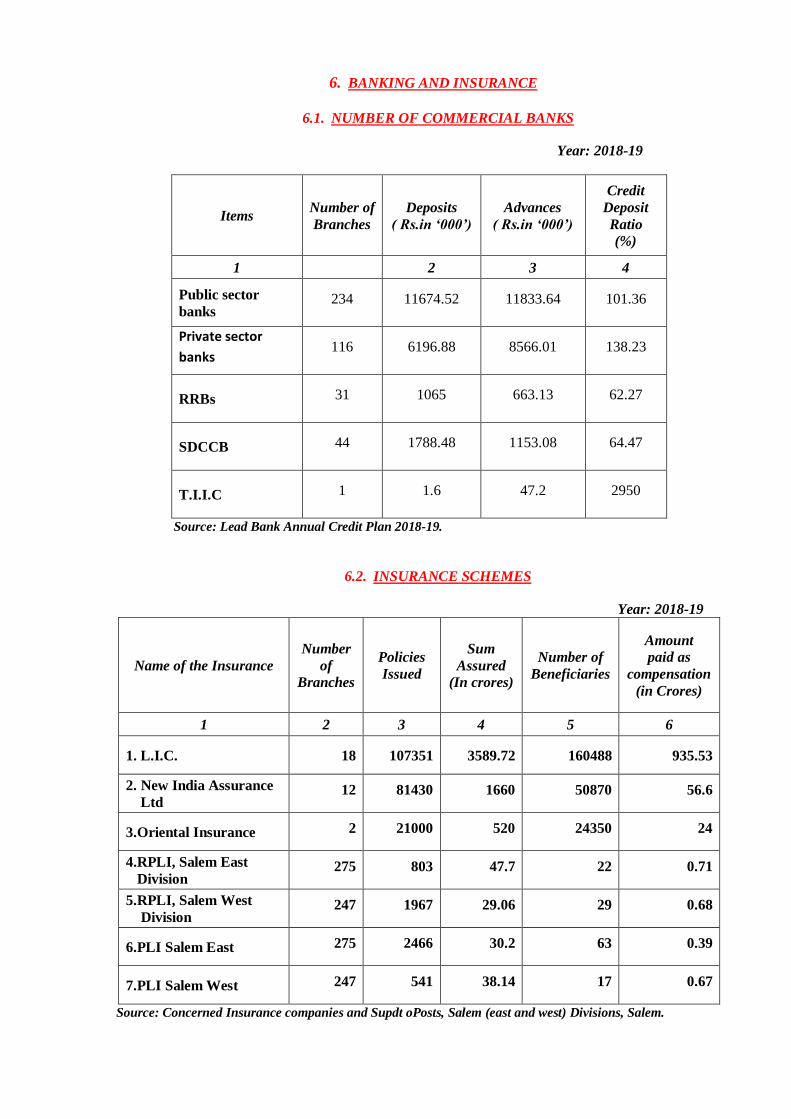
6. BANKING AND INSURANCE
6.1. NUMBER OF COMMERCIAL BANKS
Year: 2018-19
Items Number of
Branches
Deposits
( Rs.in ‘000’)
Advances
( Rs.in ‘000’)
Credit
Deposit
Ratio
(%)
1 2 3 4
Public sector
banks 234 11674.52 11833.64 101.36
Private sector
banks 116 6196.88 8566.01 138.23
RRBs 31 1065 663.13 62.27
SDCCB 44 1788.48 1153.08 64.47
T.I.I.C 1 1.6 47.2 2950
Source: Lead Bank Annual Credit Plan 2018-19.
6.2. INSURANCE SCHEMES
Year: 2018-19
Name of the Insurance
Number
of
Branches
Policies
Issued
Sum
Assured
(In crores)
Number of
Beneficiaries
Amount
paid as
compensation
(in Crores)
1 2 3 4 5 6
1. L.I.C. 18 107351 3589.72 160488 935.53
2. New India Assurance
Ltd 12 81430 1660 50870 56.6
3.Oriental Insurance 2 21000 520 24350 24
4.RPLI, Salem East
Division 275 803 47.7 22 0.71
5.RPLI, Salem West
Division 247 1967 29.06 29 0.68
6.PLI Salem East 275 2466 30.2 63 0.39
7.PLI Salem West 247 541 38.14 17 0.67
Source: Concerned Insurance companies and Supdt oPosts, Salem (east and west) Divisions, Salem.
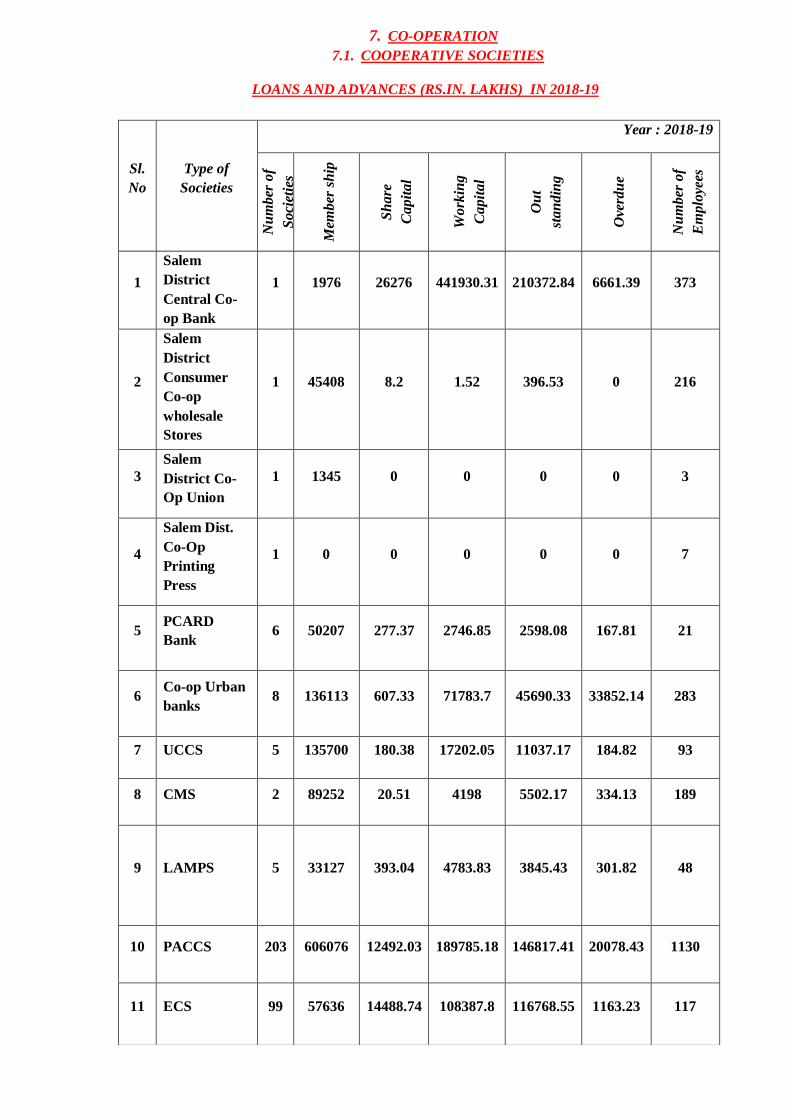
7. CO-OPERATION
7.1. COOPERATIVE SOCIETIES
LOANS AND ADVANCES (RS.IN. LAKHS) IN 2018-19
Sl.
No
Type of
Societies
Year : 2018-19
Nu
mb
er o
f
So
ciet
ies
Mem
ber
sh
ip
Sh
are
Ca
pit
al
Wo
rkin
g
Ca
pit
al
Ou
t
sta
nd
ing
Ove
rdu
e
Nu
mb
er o
f
Em
plo
yees
1
Salem
District
Central Co-
op Bank
1 1976 26276 441930.31 210372.84 6661.39 373
2
Salem
District
Consumer
Co-op
wholesale
Stores
1 45408 8.2 1.52 396.53 0 216
3
Salem
District Co-
Op Union
1 1345 0 0 0 0 3
4
Salem Dist.
Co-Op
Printing
Press
1 0 0 0 0 0 7
5 PCARD
Bank 6 50207 277.37 2746.85 2598.08 167.81 21
6 Co-op Urban
banks 8 136113 607.33 71783.7 45690.33 33852.14 283
7 UCCS 5 135700 180.38 17202.05 11037.17 184.82 93
8 CMS 2 89252 20.51 4198 5502.17 334.13 189
9 LAMPS 5 33127 393.04 4783.83 3845.43 301.82 48
10 PACCS 203 606076 12492.03 189785.18 146817.41 20078.43 1130
11 ECS 99 57636 14488.74 108387.8 116768.55 1163.23 117
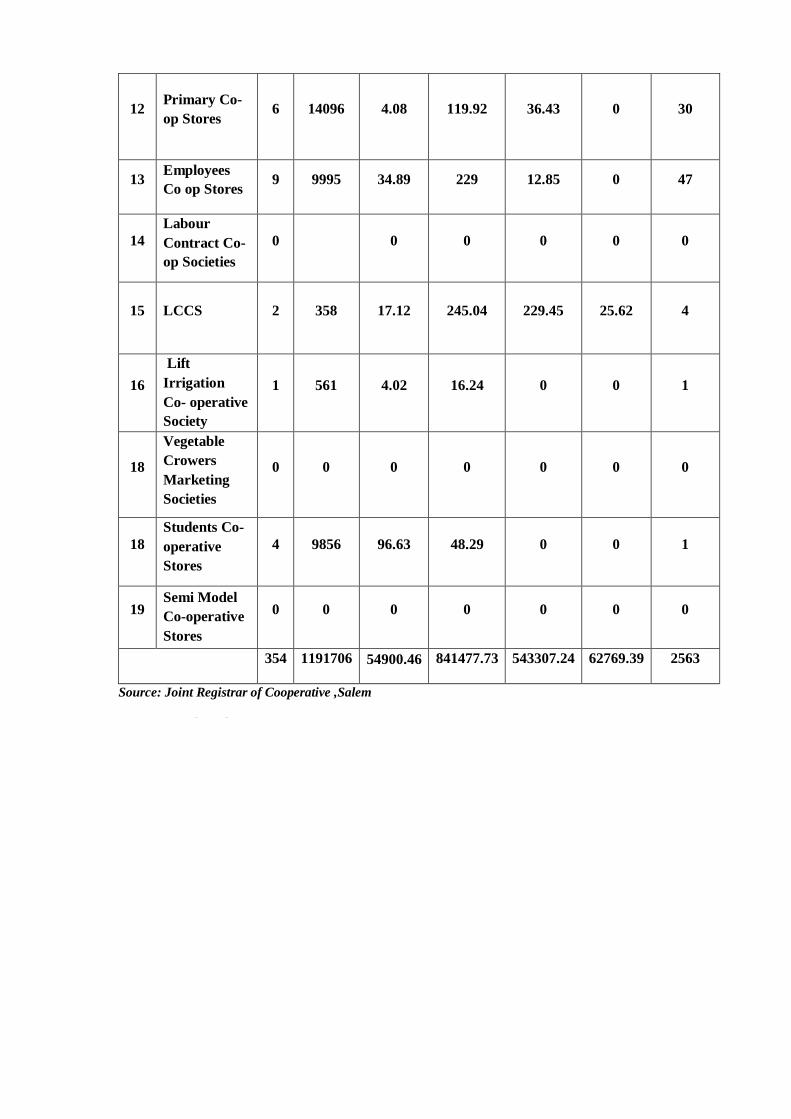
12 Primary Co-
op Stores 6 14096 4.08 119.92 36.43 0 30
13 Employees
Co op Stores 9 9995 34.89 229 12.85 0 47
14
Labour
Contract Co-
op Societies
0 0 0 0 0 0
15 LCCS 2 358 17.12 245.04 229.45 25.62 4
16
Lift
Irrigation
Co- operative
Society
1 561 4.02 16.24 0 0 1
18
Vegetable
Crowers
Marketing
Societies
0 0 0 0 0 0 0
18
Students Co-
operative
Stores
4 9856 96.63 48.29 0 0 1
19 Semi Model
Co-operative
Stores
0 0 0 0 0 0 0
354 1191706 54900.46 841477.73 543307.24 62769.39 2563
Source: Joint Registrar of Cooperative ,Salem
Societies, Salem district.
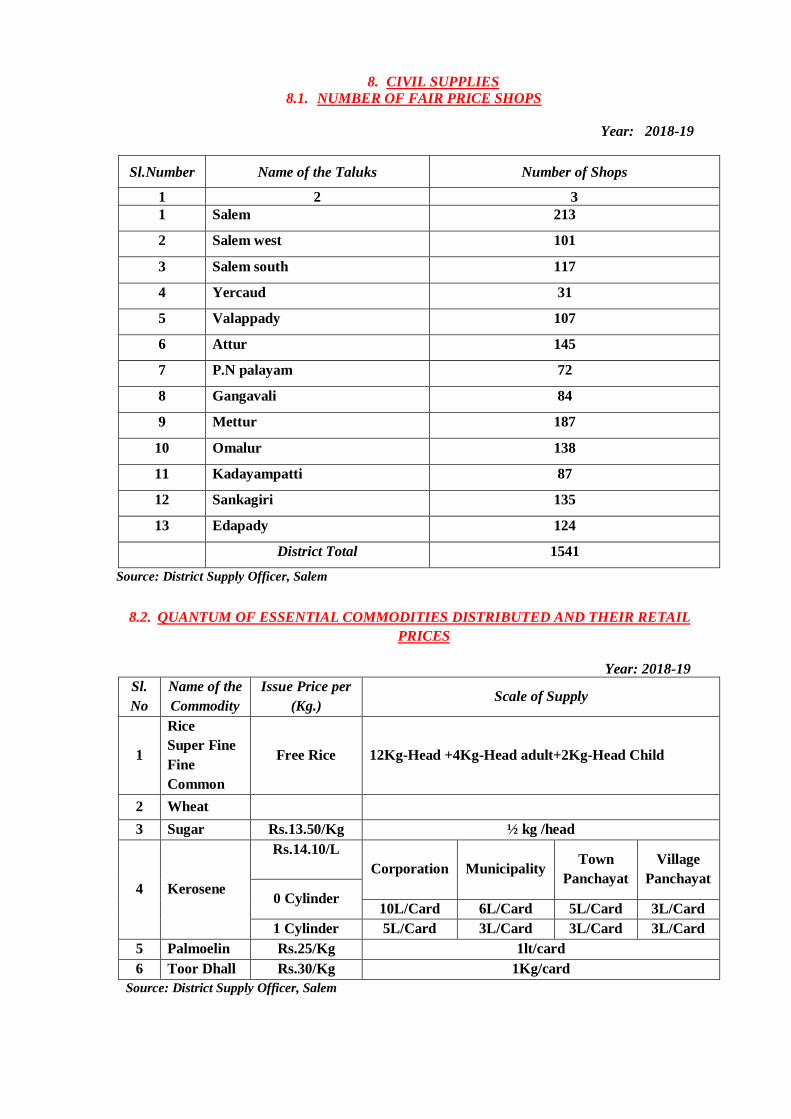
8. CIVIL SUPPLIES
8.1. NUMBER OF FAIR PRICE SHOPS
Year: 2018-19
Sl.Number Name of the Taluks Number of Shops
1 2 3
1 Salem 213
2 Salem west 101
3 Salem south 117
4 Yercaud 31
5 Valappady 107
6 Attur 145
7 P.N palayam 72
8 Gangavali 84
9 Mettur 187
10 Omalur 138
11 Kadayampatti 87
12 Sankagiri 135
13 Edapady 124
District Total 1541
Source: District Supply Officer, Salem
8.2. QUANTUM OF ESSENTIAL COMMODITIES DISTRIBUTED AND THEIR RETAIL
PRICES
Year: 2018-19
Sl.
No
Name of the
Commodity
Issue Price per
(Kg.) Scale of Supply
1
Rice
Super Fine
Fine
Common
Free Rice 12Kg-Head +4Kg-Head adult+2Kg-Head Child
2 Wheat
3 Sugar Rs.13.50/Kg ½ kg /head
4 Kerosene
Rs.14.10/L
Corporation Municipality Town
Panchayat
Village
Panchayat
0 Cylinder 10L/Card 6L/Card 5L/Card 3L/Card
1 Cylinder 5L/Card 3L/Card 3L/Card 3L/Card
5 Palmoelin Rs.25/Kg 1lt/card
6 Toor Dhall Rs.30/Kg 1Kg/card
Source: District Supply Officer, Salem
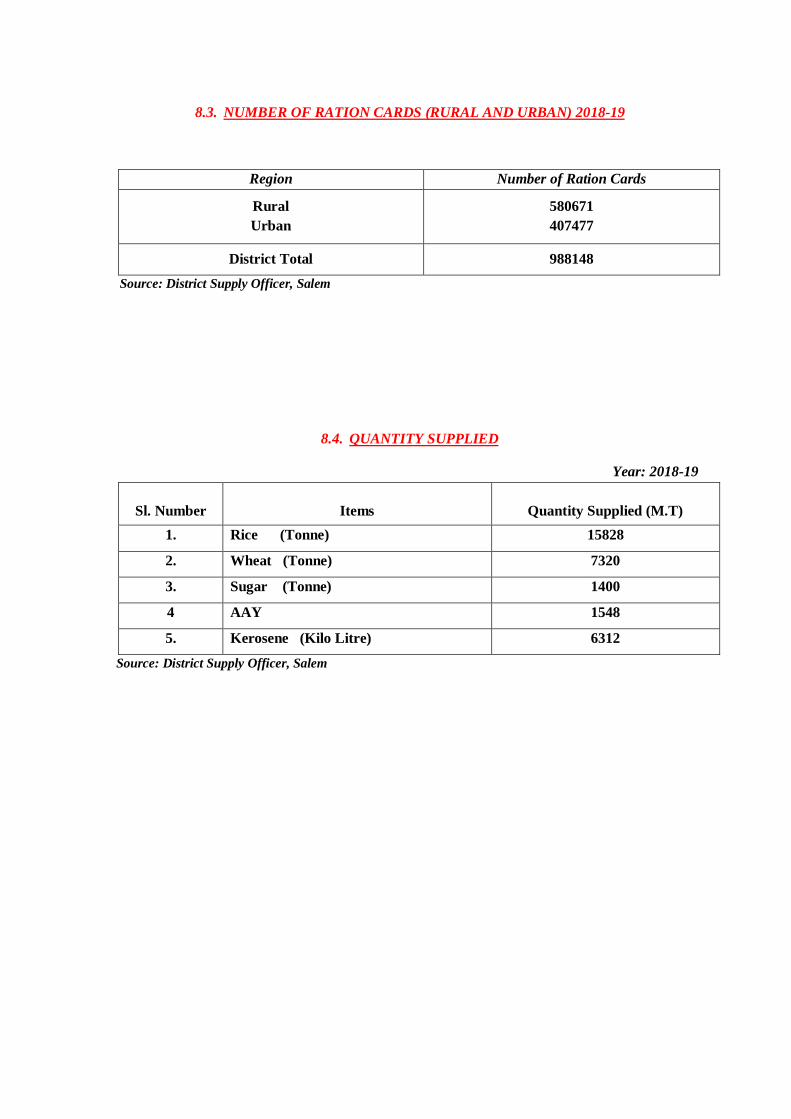
8.3. NUMBER OF RATION CARDS (RURAL AND URBAN) 2018-19
Region Number of Ration Cards
Rural
Urban
580671
407477
District Total 988148
Source: District Supply Officer, Salem
8.4. QUANTITY SUPPLIED
Year: 2018-19
Sl. Number
Items
Quantity Supplied (M.T)
1. Rice (Tonne) 15828
2. Wheat (Tonne) 7320
3. Sugar (Tonne) 1400
4 AAY 1548
5. Kerosene (Kilo Litre) 6312
Source: District Supply Officer, Salem
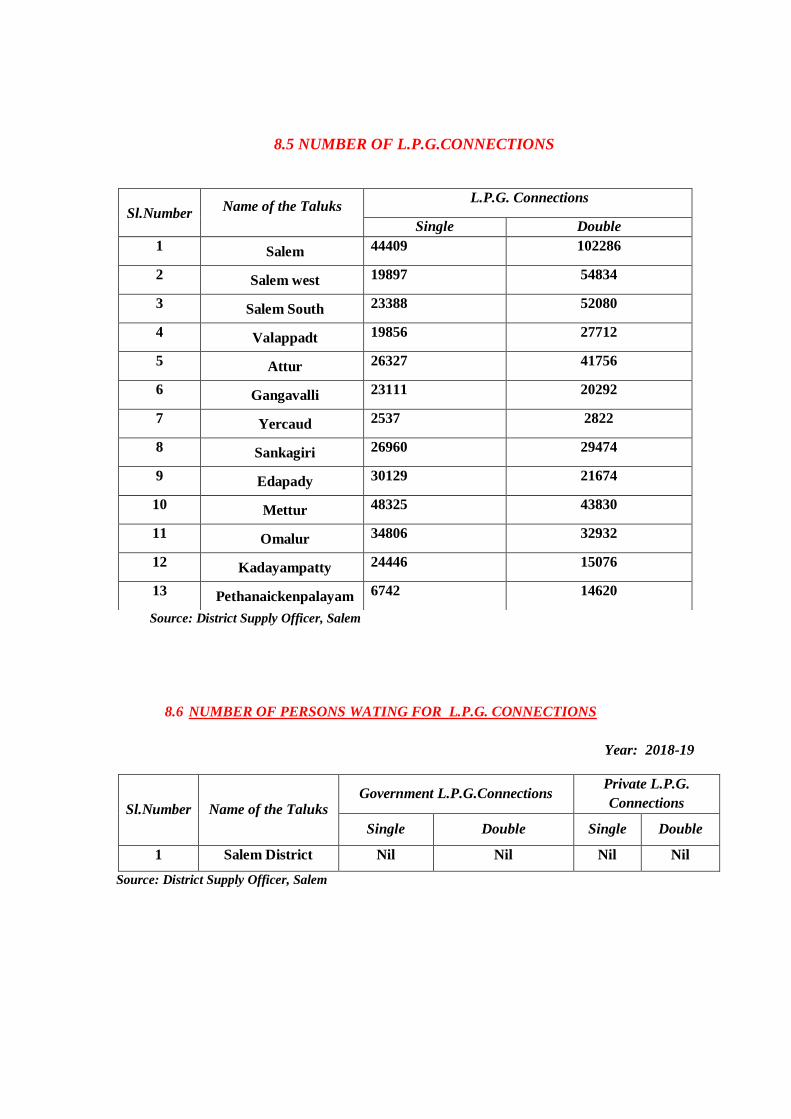
8.5 NUMBER OF L.P.G.CONNECTIONS
Source: District Supply Officer, Salem
8.6 NUMBER OF PERSONS WATING FOR L.P.G. CONNECTIONS
Year: 2018-19
Sl.Number Name of the Taluks Government L.P.G.Connections
Private L.P.G.
Connections
Single Double Single Double
1 Salem District Nil Nil Nil Nil
Source: District Supply Officer, Salem
Sl.Number Name of the Taluks
L.P.G. Connections
Single Double
1 Salem 44409 102286
2 Salem west 19897 54834
3 Salem South 23388 52080
4 Valappadt 19856 27712
5 Attur 26327 41756
6 Gangavalli 23111 20292
7 Yercaud 2537 2822
8 Sankagiri 26960 29474
9 Edapady 30129 21674
10 Mettur 48325 43830
11 Omalur 34806 32932
12 Kadayampatty 24446 15076
13 Pethanaickenpalayam 6742 14620
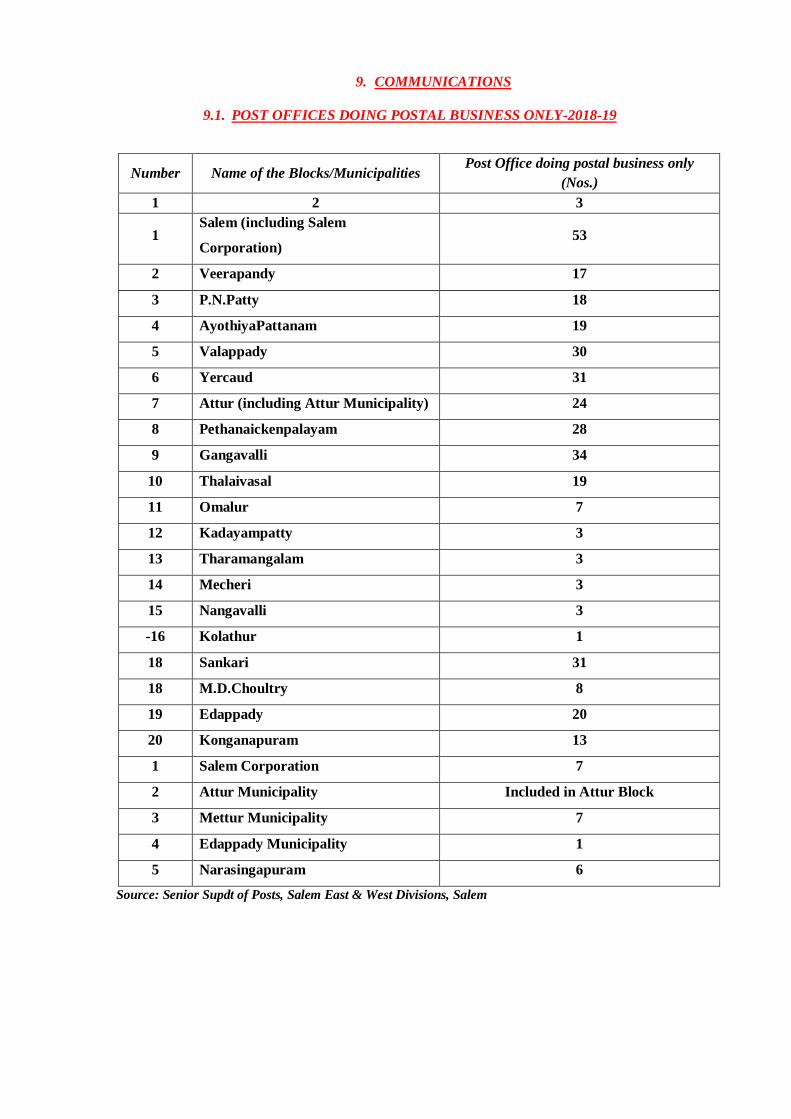
9. COMMUNICATIONS
9.1. POST OFFICES DOING POSTAL BUSINESS ONLY-2018-19
Number Name of the Blocks/Municipalities Post Office doing postal business only
(Nos.)
1 2 3
1 Salem (including Salem
Corporation) 53
2 Veerapandy 17
3 P.N.Patty 18
4 AyothiyaPattanam 19
5 Valappady 30
6 Yercaud 31
7 Attur (including Attur Municipality) 24
8 Pethanaickenpalayam 28
9 Gangavalli 34
10 Thalaivasal 19
11 Omalur 7
12 Kadayampatty 3
13 Tharamangalam 3
14 Mecheri 3
15 Nangavalli 3
-16 Kolathur 1
18 Sankari 31
18 M.D.Choultry 8
19 Edappady 20
20 Konganapuram 13
1 Salem Corporation 7
2 Attur Municipality Included in Attur Block
3 Mettur Municipality 7
4 Edappady Municipality 1
5 Narasingapuram 6
Source: Senior Supdt of Posts, Salem East & West Divisions, Salem
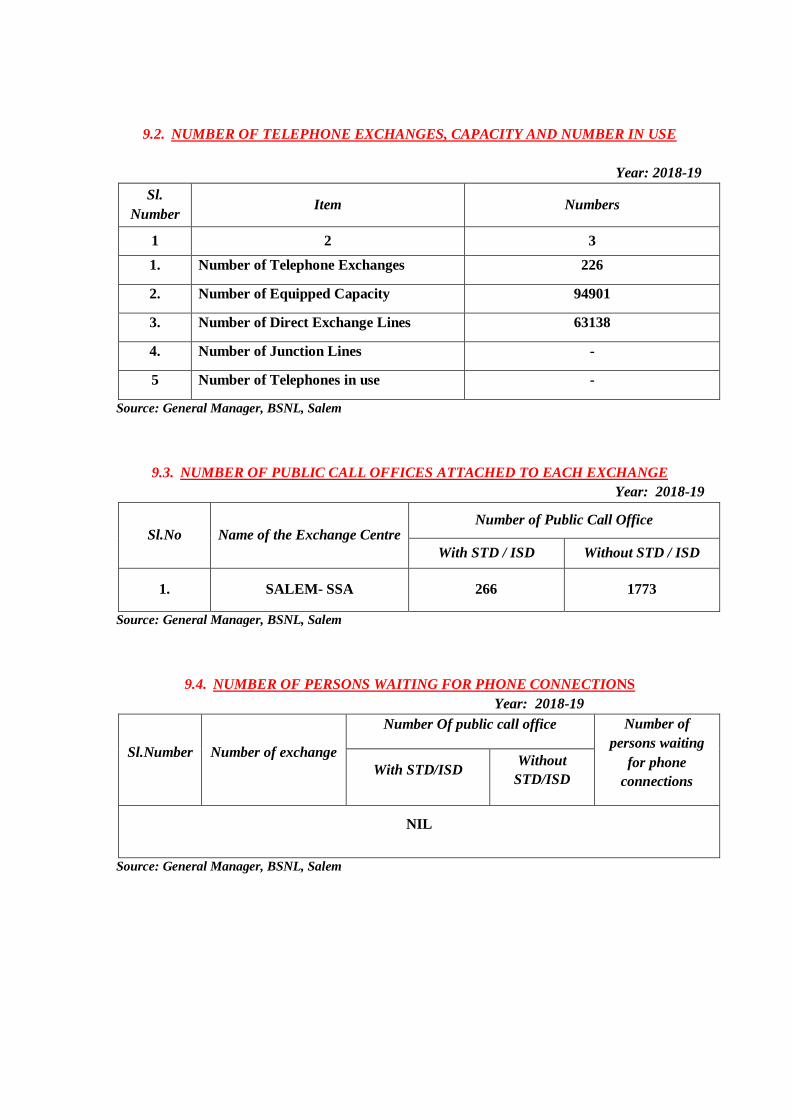
9.2. NUMBER OF TELEPHONE EXCHANGES, CAPACITY AND NUMBER IN USE
Year: 2018-19
Sl.
Number Item Numbers
1 2 3
1. Number of Telephone Exchanges 226
2. Number of Equipped Capacity 94901
3. Number of Direct Exchange Lines 63138
4.
Number of Junction Lines -
5 Number of Telephones in use -
Source: General Manager, BSNL, Salem
9.3. NUMBER OF PUBLIC CALL OFFICES ATTACHED TO EACH EXCHANGE
Year: 2018-19
Sl.No Name of the Exchange Centre Number of Public Call Office
With STD / ISD Without STD / ISD
1. SALEM- SSA 266 1773
Source: General Manager, BSNL, Salem
9.4. NUMBER OF PERSONS WAITING FOR PHONE CONNECTIONS
Year: 2018-19
Sl.Number Number of exchange
Number Of public call office Number of
persons waiting
for phone
connections With STD/ISD
Without
STD/ISD
NIL
Source: General Manager, BSNL, Salem
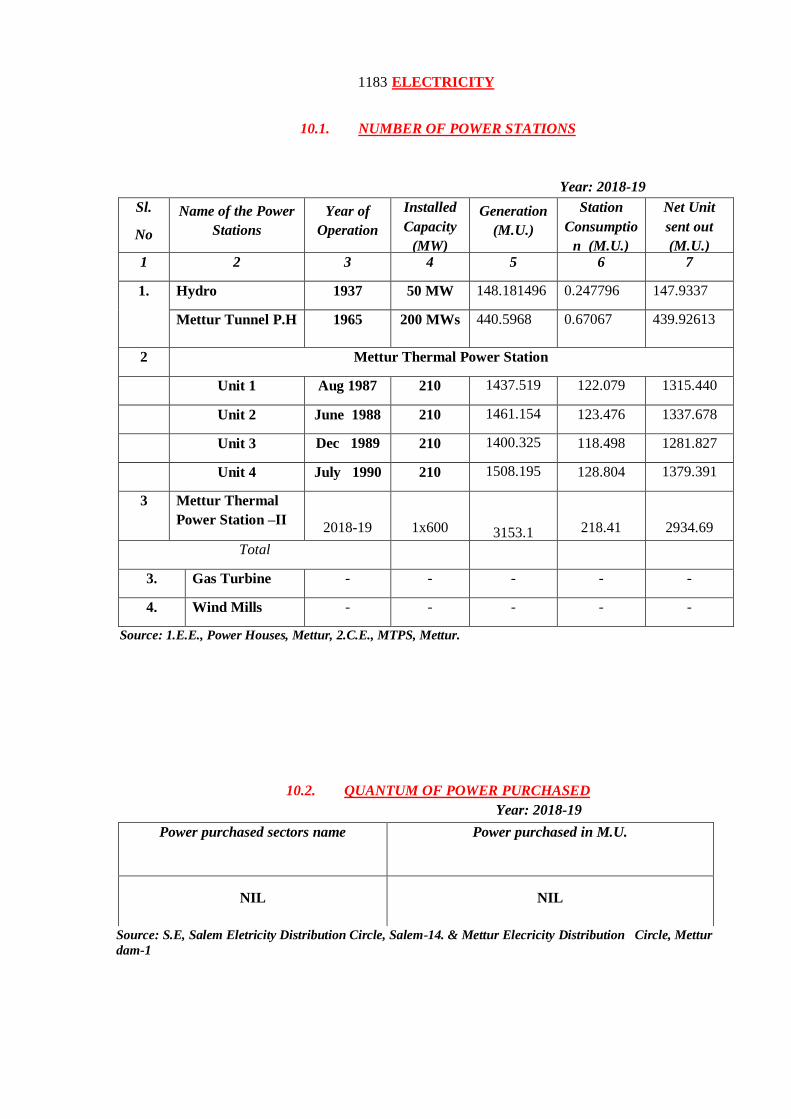
1183 ELECTRICITY
10.1. NUMBER OF POWER STATIONS
Year: 2018-19
Source: 1.E.E., Power Houses, Mettur, 2.C.E., MTPS, Mettur.
10.2. QUANTUM OF POWER PURCHASED
Year: 2018-19
Source: S.E, Salem Eletricity Distribution Circle, Salem-14. & Mettur Elecricity Distribution Circle, Mettur
dam-1
Sl.
No
Name of the Power
Stations
Year of
Operation
Installed
Capacity
(MW)
Generation
(M.U.)
Station
Consumptio
n (M.U.)
Net Unit
sent out
(M.U.) 1 2 3 4 5 6 7
1. Hydro
Mettur Dam P.H
1937
1937
50 MW
4x12.5
148.181496
148.181496
0.247796
0.247796
147.9337
147.9337 Mettur Tunnel P.H 1965 200 MWs 440.5968 0.67067 439.92613
2 Mettur Thermal Power Station
Unit 1
Unit 1
Aug 1987
Aug 1987
210
210
1437.519
1437.519
122.079
122.079
1315.440
1315.440 Unit 2 June 1988 210 1461.154 123.476 1337.678
Unit 3 Dec 1989
210 1400.325 118.498 1281.827
Unit 4 July 1990 210 1508.195 128.804 1379.391
3 Mettur Thermal
Power Station –II
Unit —II
2018-19
1x600
MW
3153.1
218.41
2934.69
Total
3. Gas Turbine - - - - -
4. Wind Mills - - - - -
Power purchased sectors name Power purchased in M.U.
NIL NIL
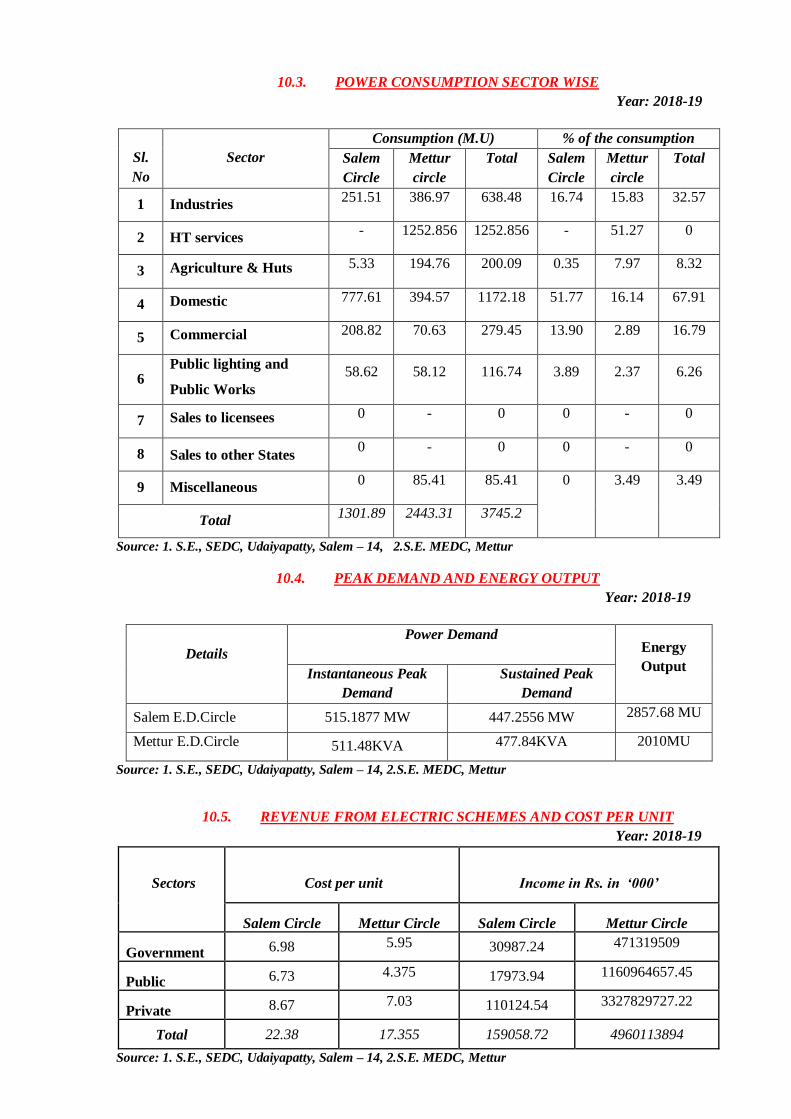
10.3. POWER CONSUMPTION SECTOR WISE
Year: 2018-19
Sl.
No
Sector
Consumption (M.U) % of the consumption
Salem
Circle
Mettur
circle
Total Salem
Circle
Mettur
circle
Total
1 Industries 251.51 386.97 638.48 16.74 15.83 32.57
2 HT services - 1252.856 1252.856 - 51.27 0
3 Agriculture & Huts 5.33 194.76 200.09 0.35 7.97 8.32
4 Domestic 777.61 394.57 1172.18 51.77 16.14 67.91
5 Commercial 208.82 70.63 279.45 13.90 2.89 16.79
6 Public lighting and
Public Works
58.62 58.12 116.74 3.89 2.37 6.26
7 Sales to licensees 0 - 0 0 - 0
8 Sales to other States 0 - 0 0 - 0
9 Miscellaneous 0 85.41 85.41 0 3.49 3.49
Total 1301.89 2443.31 3745.2
Source: 1. S.E., SEDC, Udaiyapatty, Salem – 14, 2.S.E. MEDC, Mettur
10.4. PEAK DEMAND AND ENERGY OUTPUT
Year: 2018-19
Details
Power Demand
Energy
Output Instantaneous Peak
Demand
Sustained Peak
Demand
Salem E.D.Circle 515.1877 MW 447.2556 MW 2857.68 MU
Mettur E.D.Circle 511.48KVA 477.84KVA
2010MU
Source: 1. S.E., SEDC, Udaiyapatty, Salem – 14, 2.S.E. MEDC, Mettur
10.5. REVENUE FROM ELECTRIC SCHEMES AND COST PER UNIT
Year: 2018-19
Sectors Cost per unit Income in Rs. in ‘000’
Salem Circle Mettur Circle Salem Circle Mettur Circle
Government 6.98 5.95 30987.24 471319509
Public 6.73 4.375 17973.94 1160964657.45
Private 8.67 7.03 110124.54 3327829727.22
Total 22.38 17.355 159058.72 4960113894
Source: 1. S.E., SEDC, Udaiyapatty, Salem – 14, 2.S.E. MEDC, Mettur
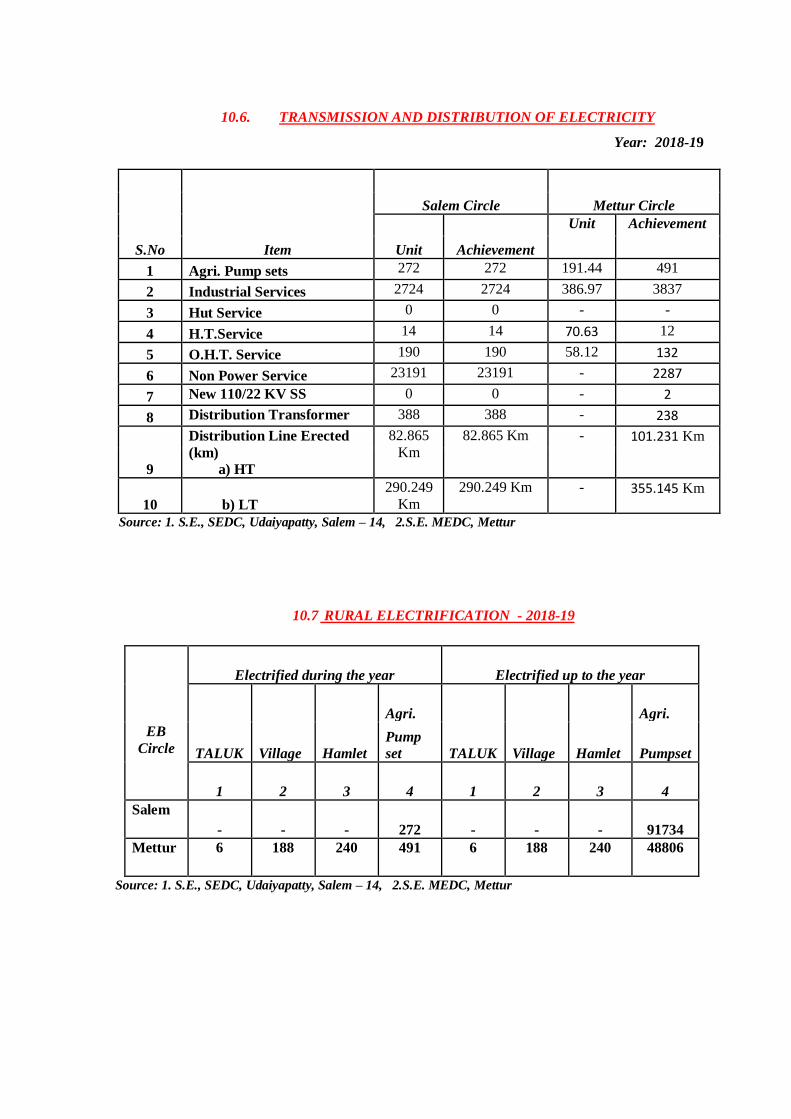
10.6. TRANSMISSION AND DISTRIBUTION OF ELECTRICITY
Year: 2018-19
S.No Item
Salem Circle Mettur Circle
Unit Achievement
Unit Achievement
1 Agri. Pump sets 272 272 191.44 491
2 Industrial Services 2724 2724 386.97 3837
3 Hut Service 0 0 - -
4 H.T.Service 14 14 70.63 12
5 O.H.T. Service 190 190 58.12 132
6 Non Power Service 23191 23191 - 2287
7 New 110/22 KV SS
Committee
0 0 - 2
8 Distribution Transformer
Erected
388 388 - 238
Distribution Line Erected
(km)
a) HT
82.865
Km
82.865 Km - 101.231 Km
9
10 b) LT
290.249
Km
290.249 Km - 355.145 Km
Source: 1. S.E., SEDC, Udaiyapatty, Salem – 14, 2.S.E. MEDC, Mettur
10.7 RURAL ELECTRIFICATION - 2018-19
Electrified during the year Electrified up to the year
TALUK Village Hamlet
Agri.
TALUK Village Hamlet
Agri.
EB
Circle Pump
set Pumpset
1 2 3 4 1 2 3 4
Salem
- - - 272 - - - 91734
Mettur 6 188 240 491 6 188 240 48806
Source: 1. S.E., SEDC, Udaiyapatty, Salem – 14, 2.S.E. MEDC, Mettur
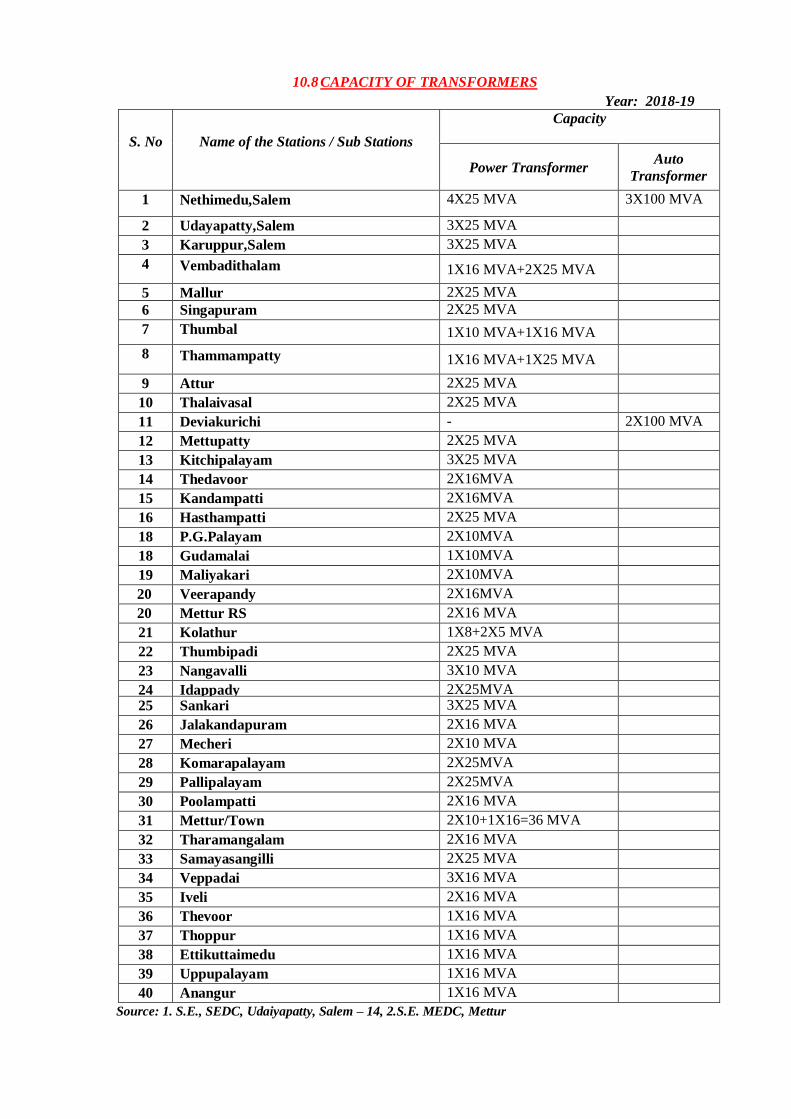
10.8 CAPACITY OF TRANSFORMERS
Year: 2018-19
S. No Name of the Stations / Sub Stations
Capacity
Power Transformer Auto
Transformer
1 Nethimedu,Salem 4X25 MVA
3X100 MVA
2 Udayapatty,Salem 3X25 MVA
3 Karuppur,Salem 3X25 MVA
4 Vembadithalam 1X16 MVA+2X25 MVA
5 Mallur 2X25 MVA
6 Singapuram 2X25 MVA
7 Thumbal 1X10 MVA+1X16 MVA
8 Thammampatty 1X16 MVA+1X25 MVA
9 Attur 2X25 MVA
10 Thalaivasal 2X25 MVA
11 Deviakurichi - 2X100 MVA
12 Mettupatty 2X25 MVA
13 Kitchipalayam 3X25 MVA
14 Thedavoor 2X16MVA
15 Kandampatti 2X16MVA
16 Hasthampatti 2X25 MVA
18 P.G.Palayam 2X10MVA
18 Gudamalai 1X10MVA
19 Maliyakari 2X10MVA
20 Veerapandy 2X16MVA
20 Mettur RS 2X16 MVA
21 Kolathur 1X8+2X5 MVA
22 Thumbipadi 2X25 MVA
23 Nangavalli 3X10 MVA
24 Idappady 2X25MVA 25 Sankari 3X25 MVA
26 Jalakandapuram 2X16 MVA
27 Mecheri 2X10 MVA
28 Komarapalayam 2X25MVA
29 Pallipalayam 2X25MVA
30 Poolampatti 2X16 MVA
31 Mettur/Town 2X10+1X16=36 MVA
32 Tharamangalam 2X16 MVA
33 Samayasangilli 2X25 MVA
34 Veppadai 3X16 MVA
35 Iveli 2X16 MVA
36 Thevoor 1X16 MVA
37 Thoppur 1X16 MVA
38 Ettikuttaimedu 1X16 MVA
39
40
Uppupalayam 1X16 MVA
40 Anangur 1X16 MVA
Source: 1. S.E., SEDC, Udaiyapatty, Salem – 14, 2.S.E. MEDC, Mettur
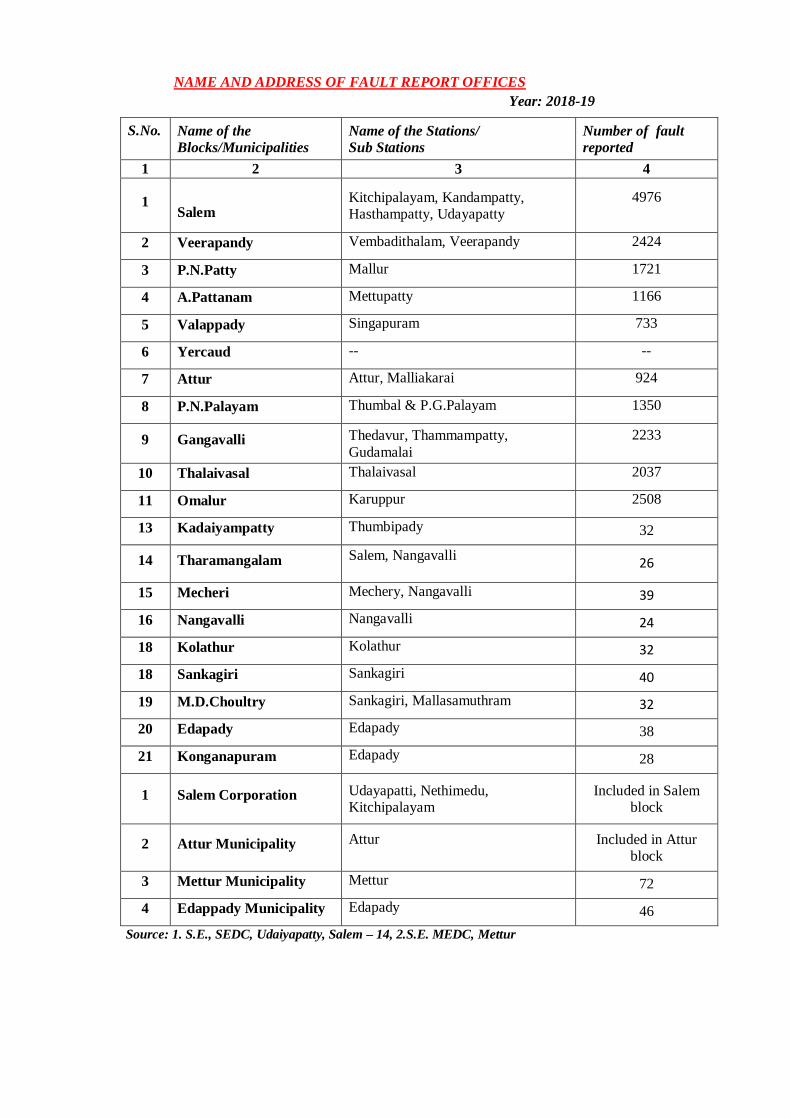
NAME AND ADDRESS OF FAULT REPORT OFFICES
Year: 2018-19
S.No. Name of the
Blocks/Municipalities
Name of the Stations/
Sub Stations
Number of fault
reported
1 2 3 4
1 Salem
Kitchipalayam, Kandampatty, Hasthampatty, Udayapatty
4976
2 Veerapandy Vembadithalam, Veerapandy 2424
3 P.N.Patty Mallur 1721
4 A.Pattanam Mettupatty 1166
5 Valappady Singapuram 733
6 Yercaud -- --
7 Attur Attur, Malliakarai 924
8 P.N.Palayam Thumbal & P.G.Palayam 1350
9 Gangavalli Thedavur, Thammampatty,
Gudamalai
2233
10 Thalaivasal Thalaivasal 2037
11 Omalur Karuppur 2508
13 Kadaiyampatty Thumbipady 32
14 Tharamangalam Salem, Nangavalli 26
15 Mecheri Mechery, Nangavalli 39
16 Nangavalli Nangavalli 24
18 Kolathur Kolathur 32
18 Sankagiri Sankagiri 40
19 M.D.Choultry Sankagiri, Mallasamuthram 32
20 Edapady Edapady 38
21 Konganapuram Edapady 28
1 Salem Corporation Udayapatti, Nethimedu, Kitchipalayam
Included in Salem block
2 Attur Municipality Attur Included in Attur block
3 Mettur Municipality Mettur 72
4 Edappady Municipality Edapady 46
Source: 1. S.E., SEDC, Udaiyapatty, Salem – 14, 2.S.E. MEDC, Mettur
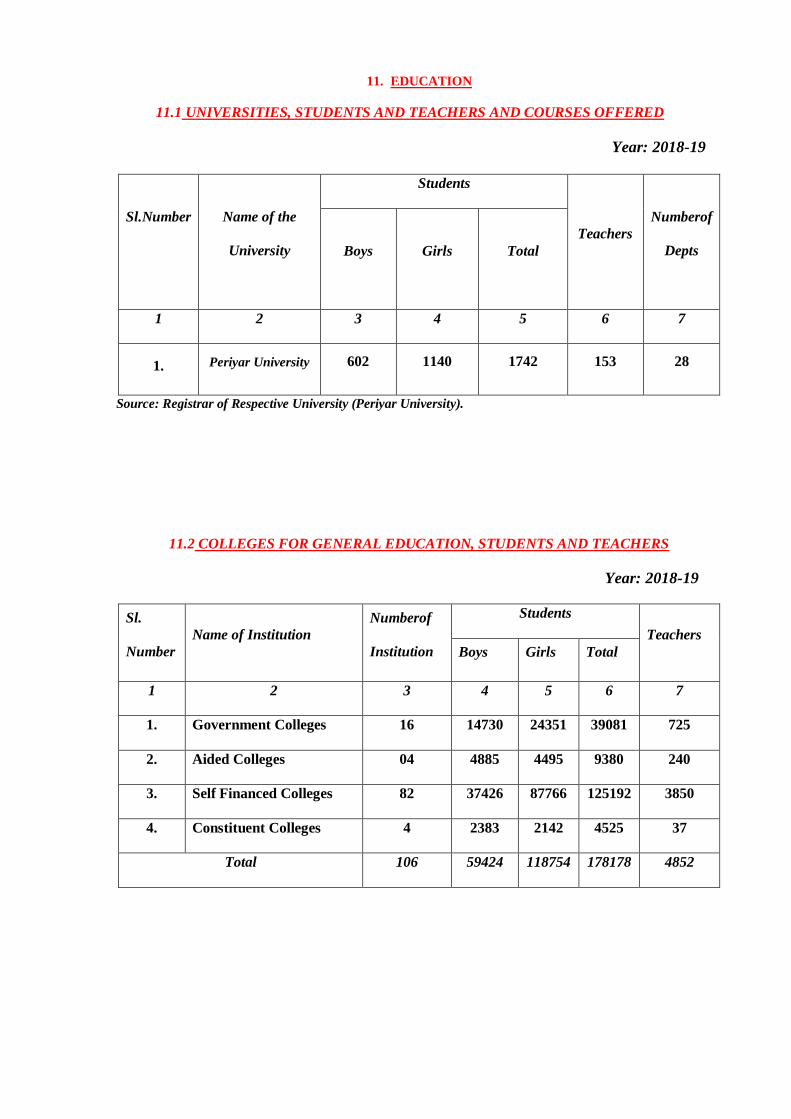
11. EDUCATION
11.1 UNIVERSITIES, STUDENTS AND TEACHERS AND COURSES OFFERED
Year: 2018-19
Sl.Number
Name of the
University
Students
Teachers
Numberof
Depts Boys Girls Total
1 2 3 4 5 6 7
1. Periyar University 602 1140 1742 153 28
Source: Registrar of Respective University (Periyar University).
11.2 COLLEGES FOR GENERAL EDUCATION, STUDENTS AND TEACHERS
Year: 2018-19
Sl.
Number
Name of Institution
Numberof
Institution
Students
Teachers
Boys Girls Total
1 2 3 4 5 6 7
1. Government Colleges 16 14730 24351 39081 725
2. Aided Colleges 04 4885 4495 9380 240
3. Self Financed Colleges 82 37426 87766 125192 3850
4. Constituent Colleges 4 2383 2142 4525 37
Total 106 59424 118754 178178 4852
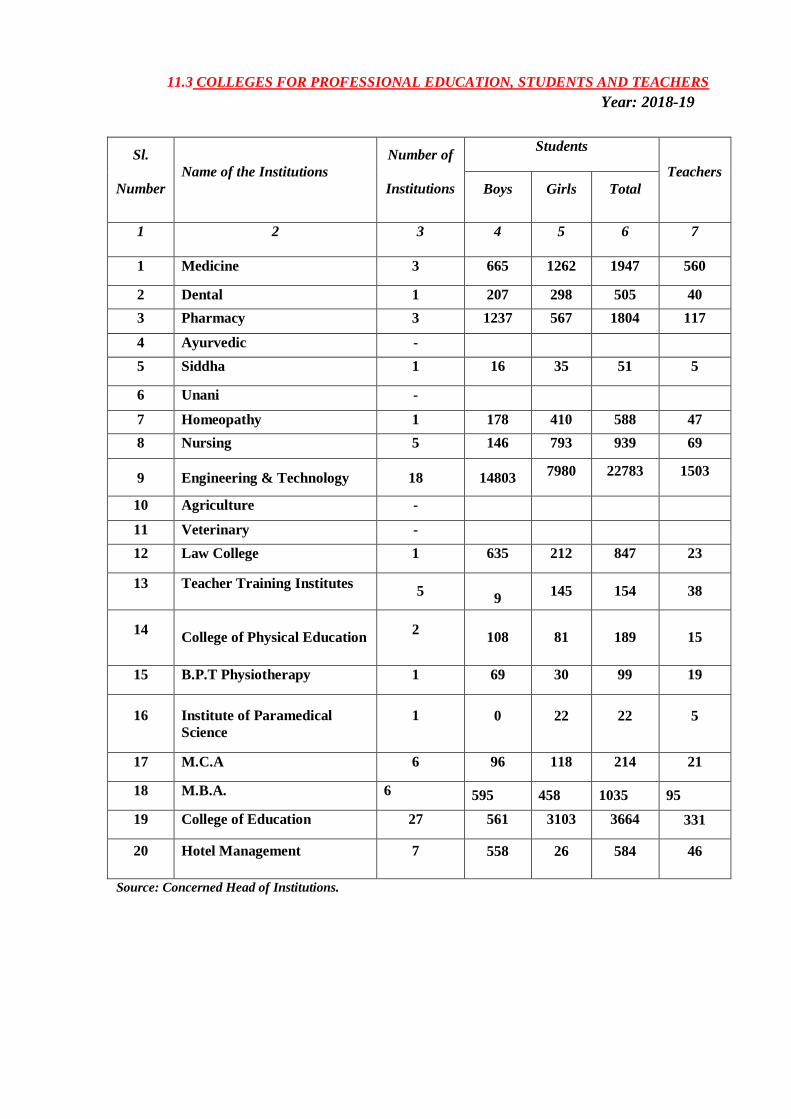
11.3 COLLEGES FOR PROFESSIONAL EDUCATION, STUDENTS AND TEACHERS
Year: 2018-19
Sl.
Number
Name of the Institutions
Number of
Institutions
Students
Teachers
Boys Girls Total
1 2 3 4 5 6 7
1 Medicine 3 665 1262 1947 560
2 Dental 1 207 298 505 40
3 Pharmacy 3 1237 567 1804 117
4 Ayurvedic -
5 Siddha 1 16 35 51 5
6 Unani -
7 Homeopathy 1 178 410 588 47
8 Nursing 5 146 793 939 69
9 Engineering & Technology 18 14803 7980 22783 1503
10 Agriculture -
11 Veterinary -
12
Law College 1 635 212 847 23
13 Teacher Training Institutes 5
9
145 154 38
14 College of Physical Education
2 108 81 189 15
15 B.P.T Physiotherapy 1 69 30 99 19
16 Institute of Paramedical
Science
1 0 22 22 5
17 M.C.A 6 96 118 214 21
18 M.B.A. 6 595 458 1035 95
19 College of Education 27 561 3103 3664 331
20 Hotel Management 7 558 26 584 46
Source: Concerned Head of Institutions.
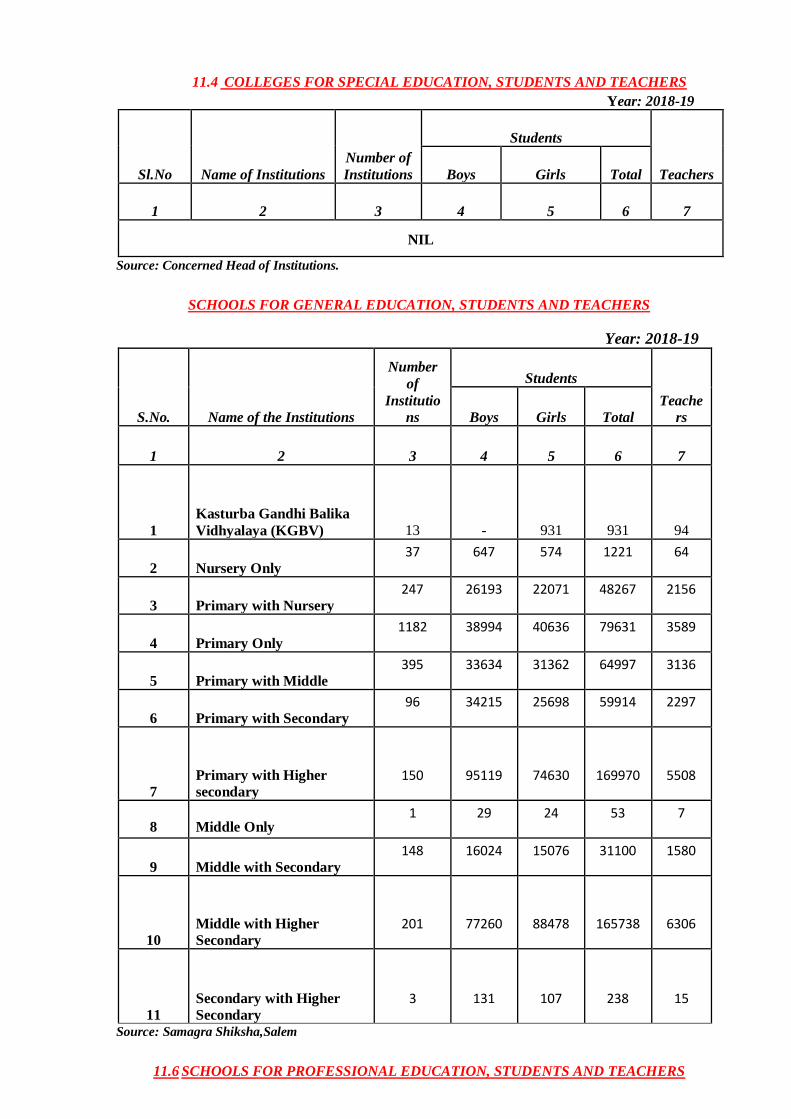
11.4 COLLEGES FOR SPECIAL EDUCATION, STUDENTS AND TEACHERS
Year: 2018-19
Sl.No Name of Institutions
Number of
Institutions
Students
Teachers Boys Girls Total
1 2 3 4 5 6 7
NIL
Source: Concerned Head of Institutions.
SCHOOLS FOR GENERAL EDUCATION, STUDENTS AND TEACHERS
Year: 2018-19
S.No. Name of the Institutions
Number
of
Institutio
ns
Students
Teache
rs Boys Girls Total
1 2 3 4 5 6 7
1
Kasturba Gandhi Balika
Vidhyalaya (KGBV) 13 - 931 931 94
2 Nursery Only
37 647 574 1221 64
3 Primary with Nursery
247 26193 22071 48267 2156
4 Primary Only
1182 38994 40636 79631 3589
5 Primary with Middle
395 33634 31362 64997 3136
6 Primary with Secondary
96 34215 25698 59914 2297
7
Primary with Higher
secondary
150 95119 74630 169970 5508
8 Middle Only 1 29 24 53 7
9 Middle with Secondary
148 16024 15076 31100 1580
10
Middle with Higher
Secondary
201 77260 88478 165738 6306
11
Secondary with Higher
Secondary
3 131 107 238 15
Source: Samagra Shiksha,Salem
11.6 SCHOOLS FOR PROFESSIONAL EDUCATION, STUDENTS AND TEACHERS
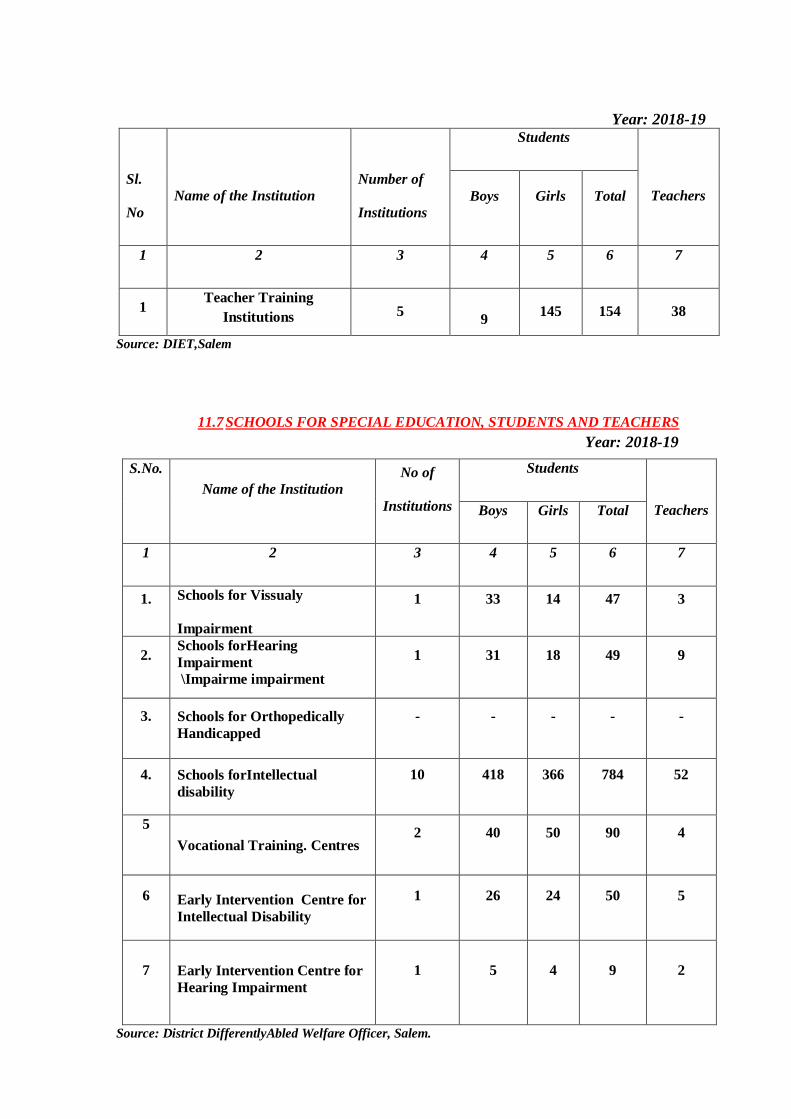
Year: 2018-19
Sl.
No
Name of the Institution
Number of
Institutions
Students
Teachers Boys Girls Total
1 2 3 4 5 6 7
1 Teacher Training
Institutions 5 9
145 154 38
Source: DIET,Salem
11.7 SCHOOLS FOR SPECIAL EDUCATION, STUDENTS AND TEACHERS
Year: 2018-19
S.No.
Name of the Institution
No of
Institutions
Students
Teachers Boys Girls Total
1 2 3 4 5 6 7
1. Schools for Vissualy
Impairment
Impairment
1 33 14 47 3
2. Schools forHearing
Impairment
\Impairme impairment
1 31 18 49 9
3. Schools for Orthopedically
Handicapped
- - - - -
4. Schools forIntellectual
disability
10 418 366 784 52
5
Vocational Training. Centres 2 40 50 90 4
6 Early Intervention Centre for
Intellectual Disability
1 26 24 50 5
7 Early Intervention Centre for
Hearing Impairment
1 5 4 9 2
Source: District DifferentlyAbled Welfare Officer, Salem.
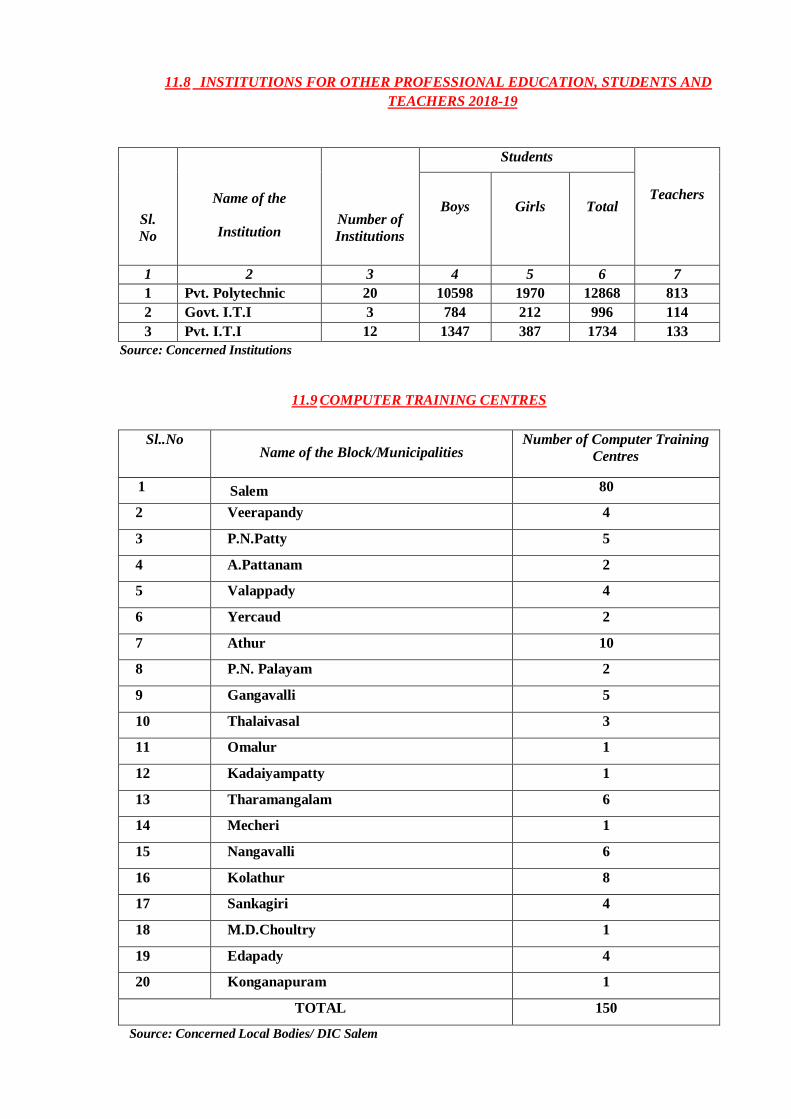
11.8 INSTITUTIONS FOR OTHER PROFESSIONAL EDUCATION, STUDENTS AND
TEACHERS 2018-19
Source: Concerned Institutions
11.9 COMPUTER TRAINING CENTRES
Sl..No Name of the Block/Municipalities
Number of Computer Training
Centres
1 Salem 80
2 Veerapandy 4
3 P.N.Patty 5
4 A.Pattanam 2
5 Valappady 4
6 Yercaud 2
7 Athur 10
8 P.N. Palayam 2
9 Gangavalli 5
10 Thalaivasal 3
11 Omalur 1
12 Kadaiyampatty 1
13 Tharamangalam 6
14 Mecheri 1
15 Nangavalli 6
16 Kolathur 8
17 Sankagiri 4
18 M.D.Choultry 1
19 Edapady 4
20 Konganapuram 1
TOTAL 150
Source: Concerned Local Bodies/ DIC Salem
Sl.
No
Name of the
Institution
Number of
Institutions
Students
Teachers Boys Girls Total
1 2 3 4 5 6 7
1 Pvt. Polytechnic 20 10598 1970 12868 813
2 Govt. I.T.I 3 784 212 996 114
3 Pvt. I.T.I 12 1347 387 1734 133
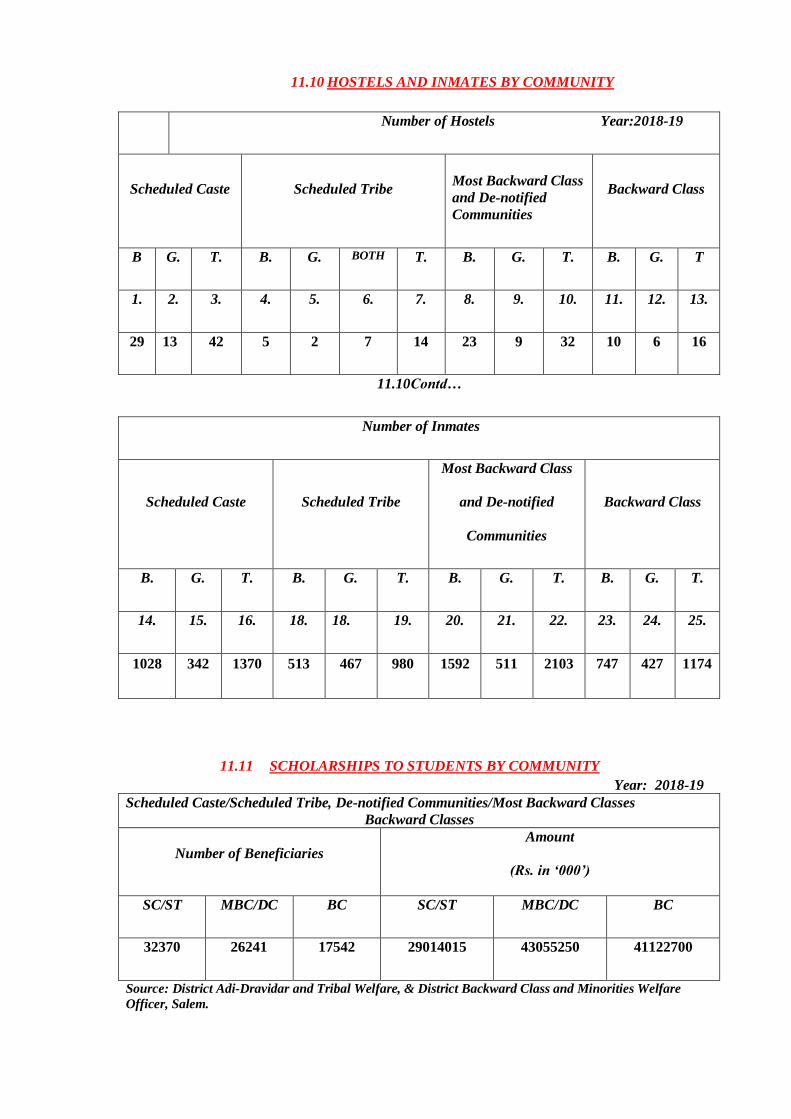
11.10 HOSTELS AND INMATES BY COMMUNITY
Number of Hostels Year:2018-19
Scheduled Caste Scheduled Tribe Most Backward Class
and De-notified
Communities
Backward Class
B G. T. B. G. BOTH T. B. G. T. B. G. T
1. 2. 3. 4. 5. 6. 7. 8. 9. 10. 11. 12. 13.
29 13 42 5 2 7 14 23 9 32 10 6 16
11.10Contd…
Number of Inmates
Scheduled Caste Scheduled Tribe
Most Backward Class
and De-notified
Communities
Backward Class
B. G. T. B. G. T. B. G. T. B. G. T.
14. 15. 16. 18. 18. 19. 20. 21. 22. 23. 24. 25.
1028 342 1370 513 467 980 1592 511 2103 747 427 1174
11.11 SCHOLARSHIPS TO STUDENTS BY COMMUNITY
Year: 2018-19
Scheduled Caste/Scheduled Tribe, De-notified Communities/Most Backward Classes
Backward Classes
Number of Beneficiaries
Amount
(Rs. in ‘000’)
SC/ST MBC/DC BC SC/ST MBC/DC BC
32370 26241 17542 29014015 43055250 41122700
Source: District Adi-Dravidar and Tribal Welfare, & District Backward Class and Minorities Welfare
Officer, Salem.
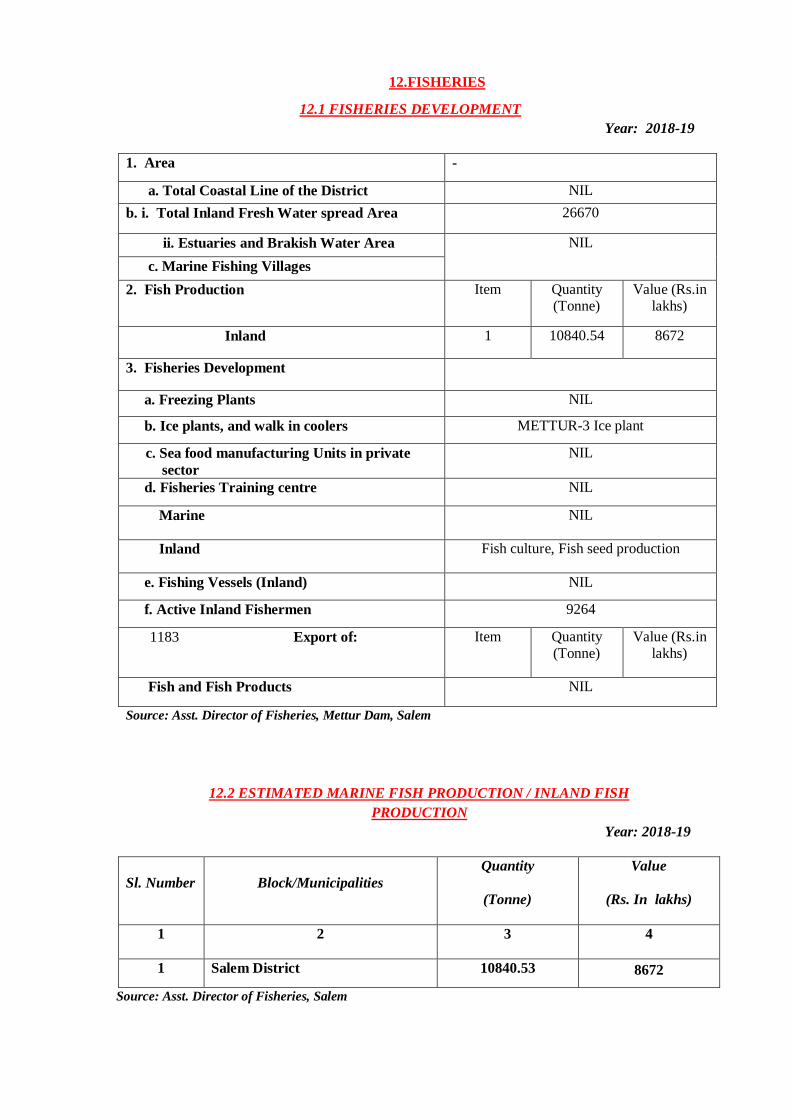
12.FISHERIES
12.1 FISHERIES DEVELOPMENT
Year: 2018-19
1. Area -
a. Total Coastal Line of the District NIL
b. i. Total Inland Fresh Water spread Area 26670
ii. Estuaries and Brakish Water Area NIL
c. Marine Fishing Villages
2. Fish Production Item Quantity (Tonne)
Value (Rs.in lakhs)
Inland 1 10840.54 8672
3. Fisheries Development
a. Freezing Plants NIL
b. Ice plants, and walk in coolers METTUR-3 Ice plant
c. Sea food manufacturing Units in private
sector
NIL
d. Fisheries Training centre NIL
Marine NIL
Inland Fish culture, Fish seed production
e. Fishing Vessels (Inland) NIL
f. Active Inland Fishermen 9264
1183 Export of:
Item Quantity (Tonne)
Value (Rs.in lakhs)
Fish and Fish Products NIL
Source: Asst. Director of Fisheries, Mettur Dam, Salem
12.2 ESTIMATED MARINE FISH PRODUCTION / INLAND FISH
PRODUCTION
Year: 2018-19
Sl. Number Block/Municipalities
Quantity
(Tonne)
Value
(Rs. In lakhs)
1 2 3 4
1 Salem District 10840.53 8672
Source: Asst. Director of Fisheries, Salem
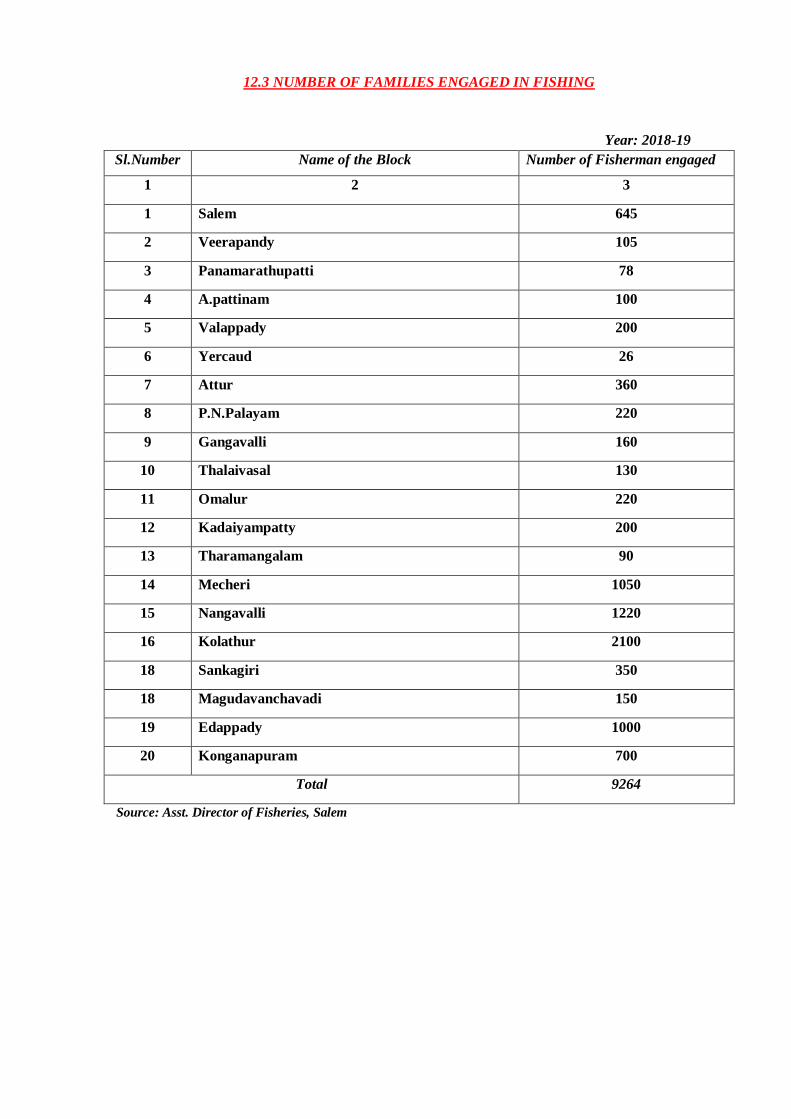
12.3 NUMBER OF FAMILIES ENGAGED IN FISHING
Year: 2018-19
Sl.Number Name of the Block Number of Fisherman engaged
1 2 3
1 Salem 645
2 Veerapandy 105
3 Panamarathupatti 78
4 A.pattinam 100
5 Valappady 200
6 Yercaud 26
7 Attur 360
8 P.N.Palayam 220
9 Gangavalli 160
10 Thalaivasal 130
11 Omalur 220
12 Kadaiyampatty 200
13 Tharamangalam 90
14 Mecheri 1050
15 Nangavalli 1220
16 Kolathur 2100
18 Sankagiri 350
18 Magudavanchavadi 150
19 Edappady 1000
20 Konganapuram 700
Total 9264
Source: Asst. Director of Fisheries, Salem
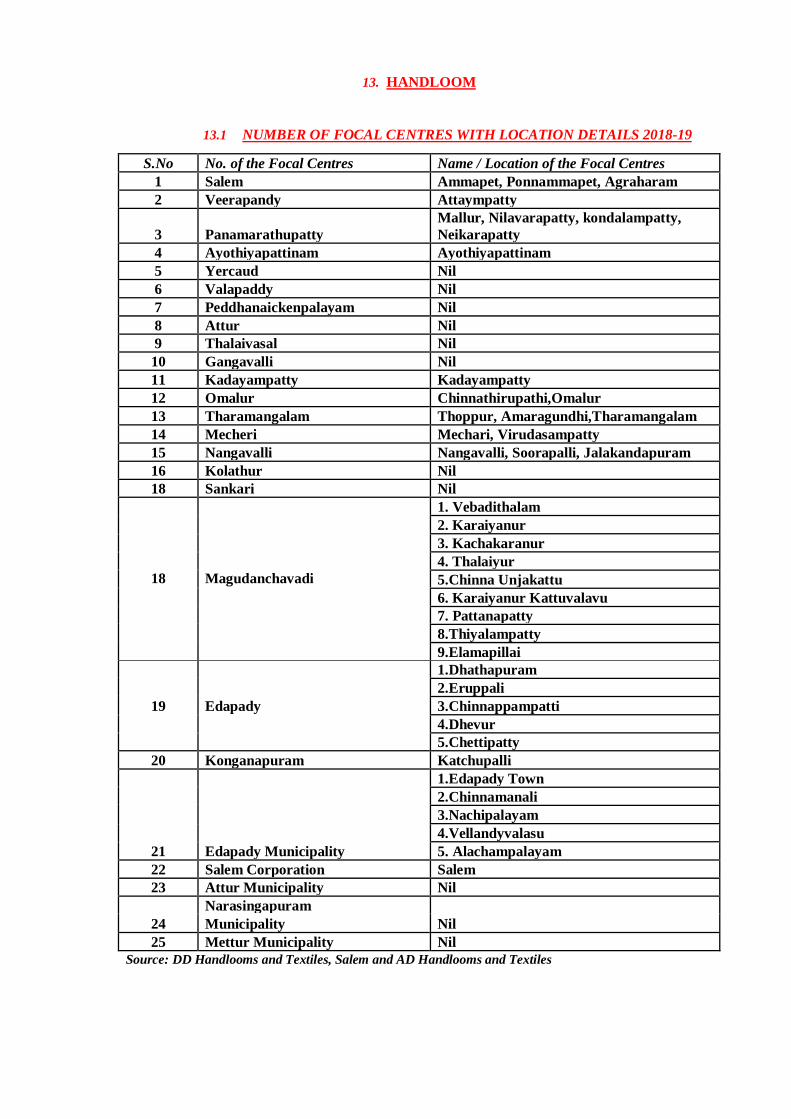
13. HANDLOOM
13.1 NUMBER OF FOCAL CENTRES WITH LOCATION DETAILS 2018-19
S.No No. of the Focal Centres Name / Location of the Focal Centres
1 Salem Ammapet, Ponnammapet, Agraharam
2 Veerapandy Attaympatty
3 Panamarathupatty
Mallur, Nilavarapatty, kondalampatty,
Neikarapatty
4 Ayothiyapattinam Ayothiyapattinam
5 Yercaud Nil
6 Valapaddy Nil
7 Peddhanaickenpalayam Nil
8 Attur Nil
9 Thalaivasal Nil
10 Gangavalli Nil
11 Kadayampatty Kadayampatty
12 Omalur Chinnathirupathi,Omalur
13 Tharamangalam Thoppur, Amaragundhi,Tharamangalam
14 Mecheri Mechari, Virudasampatty
15 Nangavalli Nangavalli, Soorapalli, Jalakandapuram
16 Kolathur Nil
18 Sankari Nil
18 Magudanchavadi
1. Vebadithalam
2. Karaiyanur
3. Kachakaranur
4. Thalaiyur
5.Chinna Unjakattu
6. Karaiyanur Kattuvalavu
7. Pattanapatty
8.Thiyalampatty
9.Elamapillai
19 Edapady
1.Dhathapuram
2.Eruppali
3.Chinnappampatti
4.Dhevur
5.Chettipatty
20 Konganapuram Katchupalli
21 Edapady Municipality
1.Edapady Town
2.Chinnamanali
3.Nachipalayam
4.Vellandyvalasu
5. Alachampalayam
22 Salem Corporation Salem
23 Attur Municipality Nil
24
Narasingapuram
Nil Municipality
25 Mettur Municipality Nil
Source: DD Handlooms and Textiles, Salem and AD Handlooms and Textiles
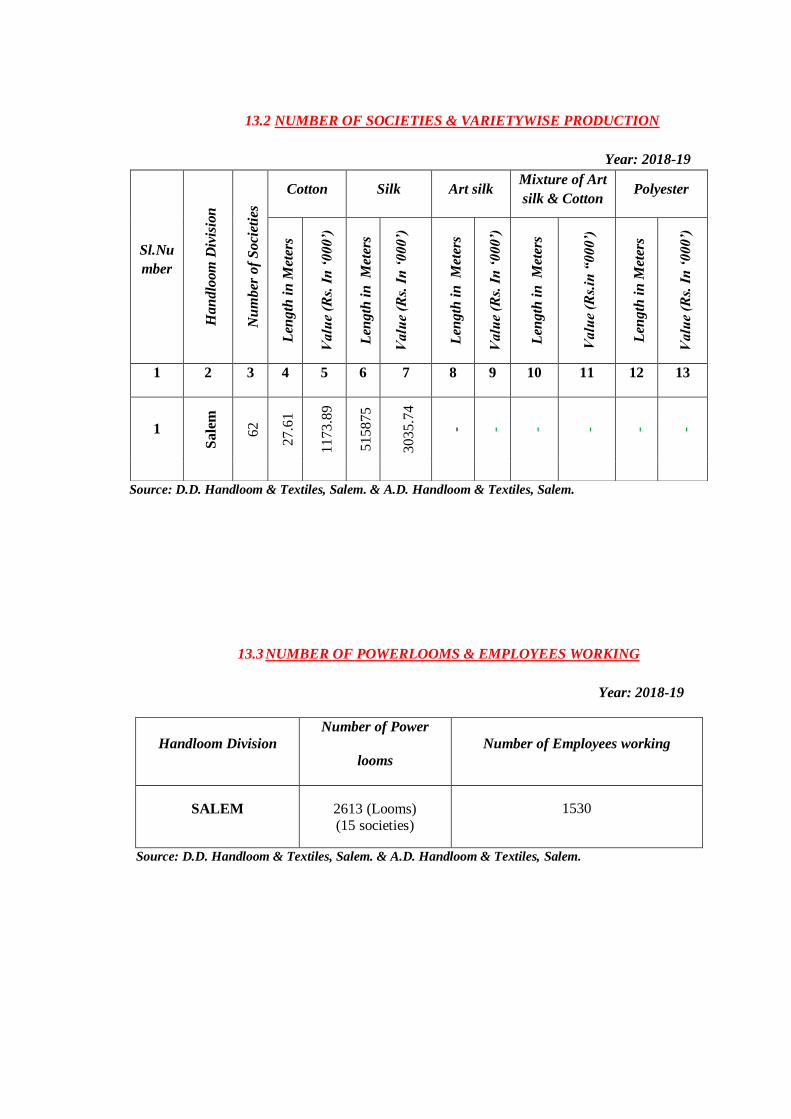
13.2 NUMBER OF SOCIETIES & VARIETYWISE PRODUCTION
Year: 2018-19
Source: D.D. Handloom & Textiles, Salem. & A.D. Handloom & Textiles, Salem.
13.3 NUMBER OF POWERLOOMS & EMPLOYEES WORKING
Year: 2018-19
Handloom Division
Number of Power
looms
Number of Employees working
SALEM 2613 (Looms) (15 societies)
1530
Source: D.D. Handloom & Textiles, Salem. & A.D. Handloom & Textiles, Salem.
Sl.Nu
mber
Ha
nd
loom
Div
isio
n
Nu
mb
er o
f S
oci
etie
s
Cotton Silk Art silk Mixture of Art
silk & Cotton Polyester
Len
gth
in
Met
ers
Va
lue
(Rs.
In
‘0
00
’)
Len
gth
in
M
eter
s
Va
lue
(Rs.
In
‘0
00
’)
Len
gth
in
M
eter
s
Va
lue
(Rs.
In
‘0
00
’)
Len
gth
in
M
eter
s
Va
lue
(Rs.
in “
00
0’)
Len
gth
in
Met
ers
Va
lue
(Rs.
In
‘0
00
’)
1 2 3 4 5 6 7 8 9 10 11 12 13
1
Sa
lem
62
27
.61
117
3.8
9
515
87
5
303
5.7
4
- - - - - -
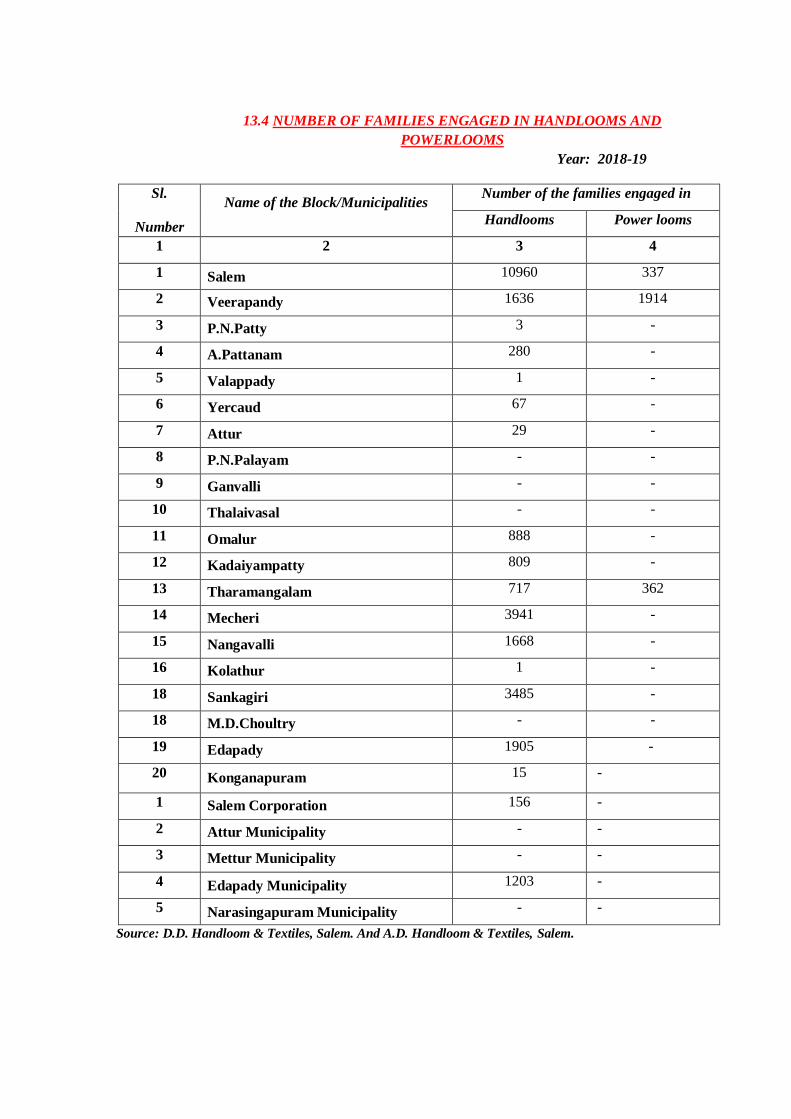
13.4 NUMBER OF FAMILIES ENGAGED IN HANDLOOMS AND
POWERLOOMS
Year: 2018-19
Sl.
Number
Name of the Block/Municipalities Number of the families engaged in
Handlooms Power looms
1 2 3 4
1 Salem 10960 337
2 Veerapandy 1636 1914
3 P.N.Patty 3 -
4 A.Pattanam 280 -
5 Valappady 1 -
6 Yercaud 67 -
7 Attur 29 -
8 P.N.Palayam - -
9 Ganvalli - -
10 Thalaivasal - -
11 Omalur 888 -
12 Kadaiyampatty 809 -
13 Tharamangalam 717 362
14 Mecheri 3941 -
15 Nangavalli 1668 -
16 Kolathur 1 -
18 Sankagiri 3485 -
18 M.D.Choultry - -
19 Edapady 1905 -
20 Konganapuram 15 -
1 Salem Corporation 156 -
2 Attur Municipality - -
3 Mettur Municipality - -
4 Edapady Municipality 1203 -
5 Narasingapuram Municipality - -
Source: D.D. Handloom & Textiles, Salem. And A.D. Handloom & Textiles, Salem.
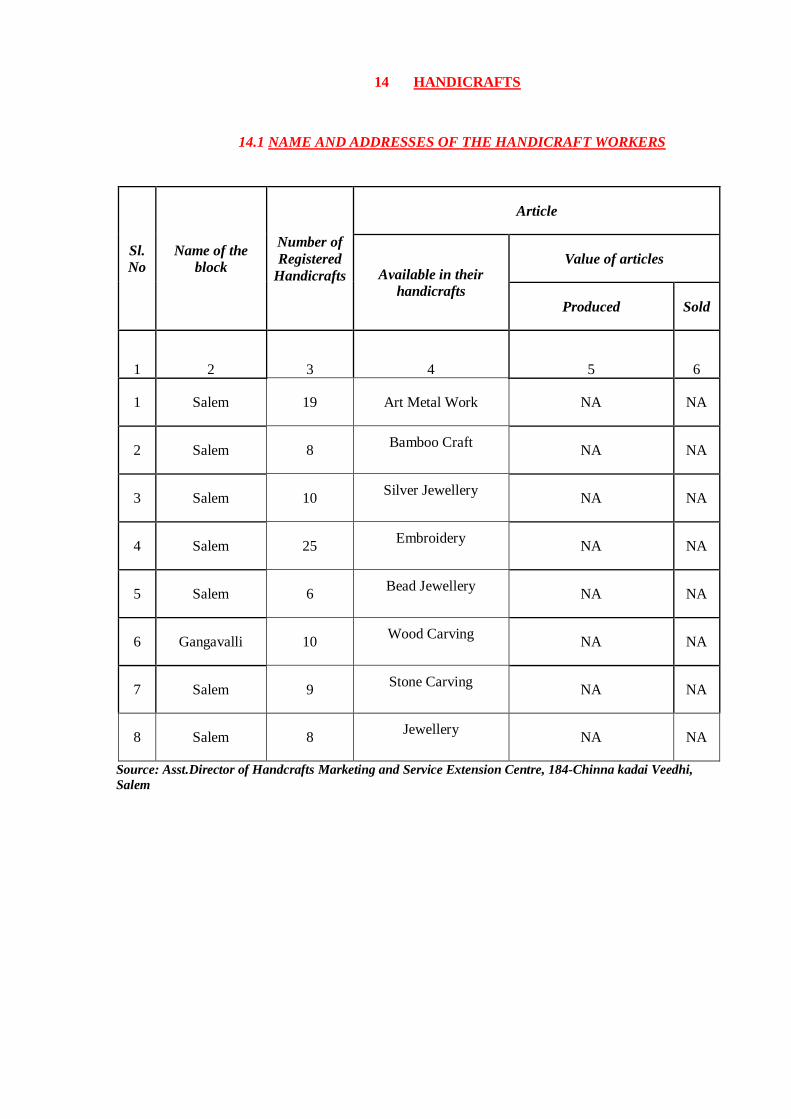
14 HANDICRAFTS
14.1 NAME AND ADDRESSES OF THE HANDICRAFT WORKERS
Sl.
No
Name of the
block
Number of
Registered
Handicrafts
Article
Available in their
handicrafts
Value of articles
Produced Sold
1 2 3 4 5 6
1 Salem 19 Art Metal Work NA NA
2 Salem 8 Bamboo Craft
NA NA
3 Salem 10 Silver Jewellery
NA NA
4 Salem 25 Embroidery
NA NA
5 Salem 6 Bead Jewellery
NA NA
6 Gangavalli 10 Wood Carving
NA NA
7 Salem 9 Stone Carving
NA NA
8 Salem 8 Jewellery
NA NA
Source: Asst.Director of Handcrafts Marketing and Service Extension Centre, 184-Chinna kadai Veedhi,
Salem
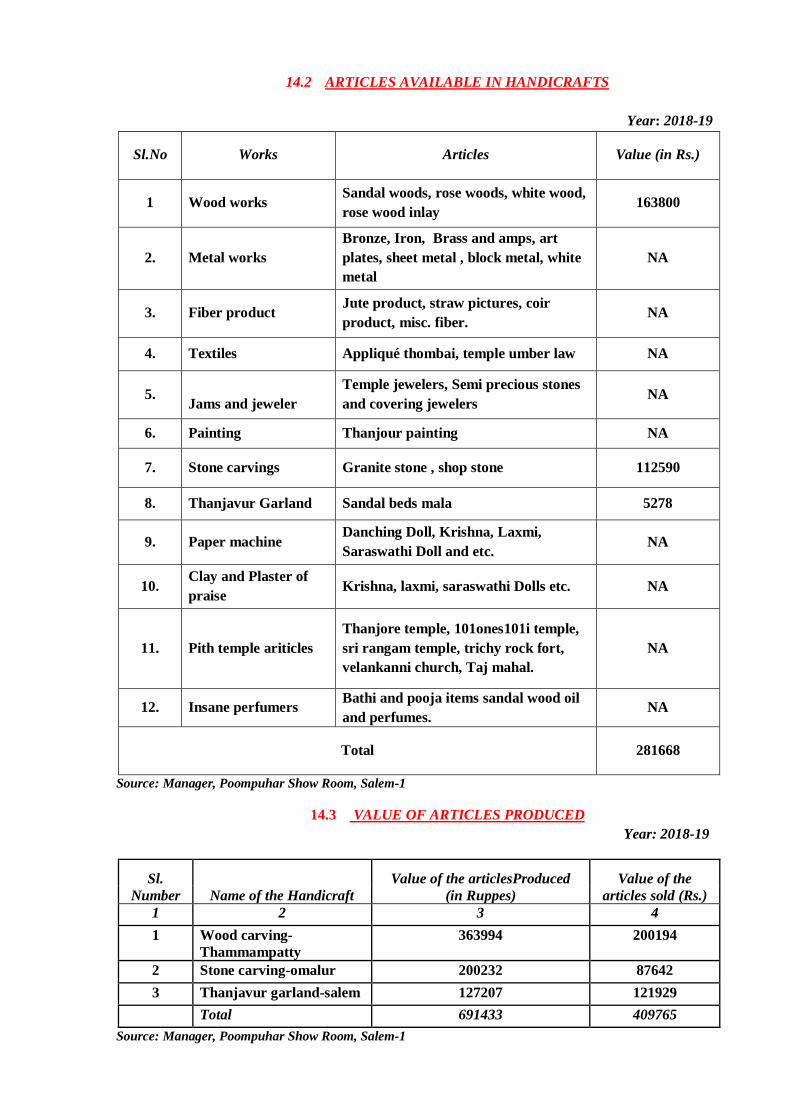
14.2 ARTICLES AVAILABLE IN HANDICRAFTS
Year: 2018-19
Sl.No Works Articles Value (in Rs.)
1 Wood works Sandal woods, rose woods, white wood,
rose wood inlay 163800
2. Metal works
Bronze, Iron, Brass and amps, art
plates, sheet metal , block metal, white
metal
NA
3. Fiber product Jute product, straw pictures, coir
product, misc. fiber. NA
4. Textiles Appliqué thombai, temple umber law NA
5.
Jams and jeweler
Temple jewelers, Semi precious stones
and covering jewelers NA
6. Painting Thanjour painting NA
7. Stone carvings Granite stone , shop stone 112590
8. Thanjavur Garland Sandal beds mala 5278
9. Paper machine Danching Doll, Krishna, Laxmi,
Saraswathi Doll and etc. NA
10. Clay and Plaster of
praise Krishna, laxmi, saraswathi Dolls etc. NA
11. Pith temple ariticles
Thanjore temple, 101ones101i temple,
sri rangam temple, trichy rock fort,
velankanni church, Taj mahal.
NA
12. Insane perfumers Bathi and pooja items sandal wood oil
and perfumes. NA
Total 281668
Source: Manager, Poompuhar Show Room, Salem-1
14.3 VALUE OF ARTICLES PRODUCED
Year: 2018-19
Sl.
Number Name of the Handicraft
Value of the articlesProduced
(in Ruppes)
Value of the
articles sold (Rs.)
1 2 3 4
1 Wood carving-
Thammampatty
363994 200194
2 Stone carving-omalur 200232 87642
3 Thanjavur garland-salem 127207 121929
Total 691433 409765
Source: Manager, Poompuhar Show Room, Salem-1
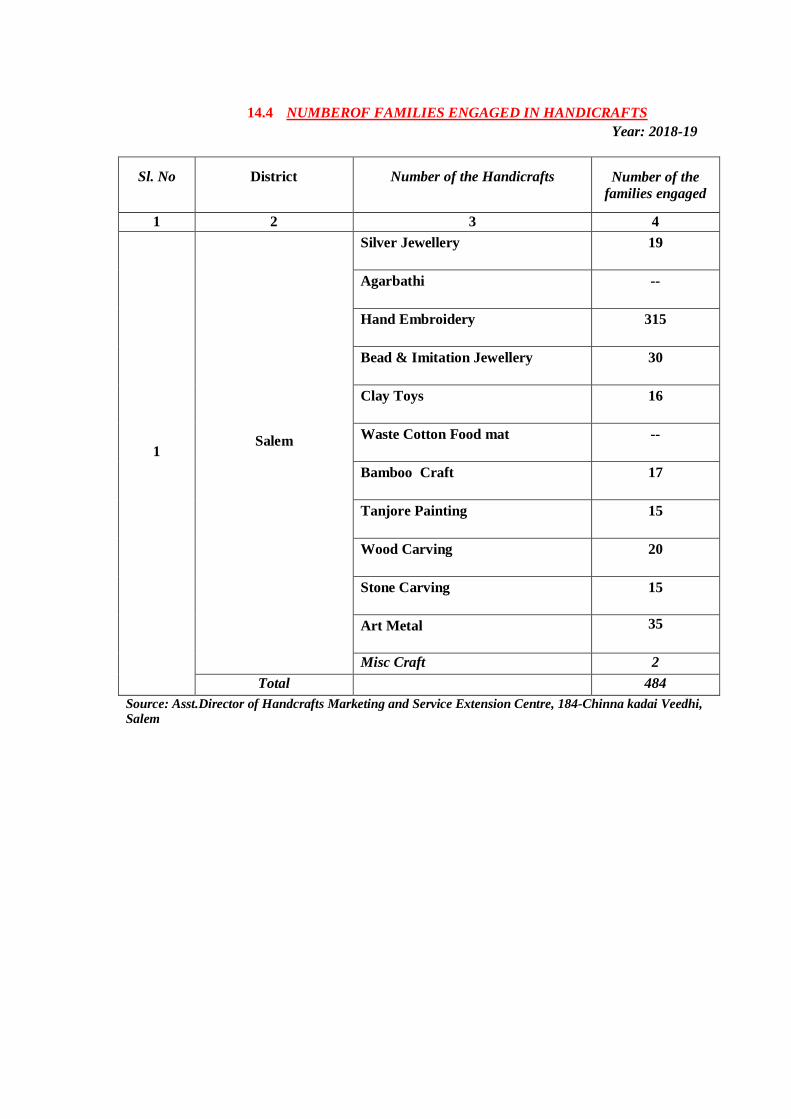
14.4 NUMBEROF FAMILIES ENGAGED IN HANDICRAFTS
Year: 2018-19
Sl. No District Number of the Handicrafts Number of the
families engaged
1 2 3 4
1 Salem
Silver Jewellery 19
Agarbathi --
Hand Embroidery 315
Bead & Imitation Jewellery 30
Clay Toys 16
Waste Cotton Food mat --
Bamboo Craft 17
Tanjore Painting 15
Wood Carving 20
Stone Carving 15
Art Metal 35
Misc Craft 2
Total 484
Source: Asst.Director of Handcrafts Marketing and Service Extension Centre, 184-Chinna kadai Veedhi,
Salem
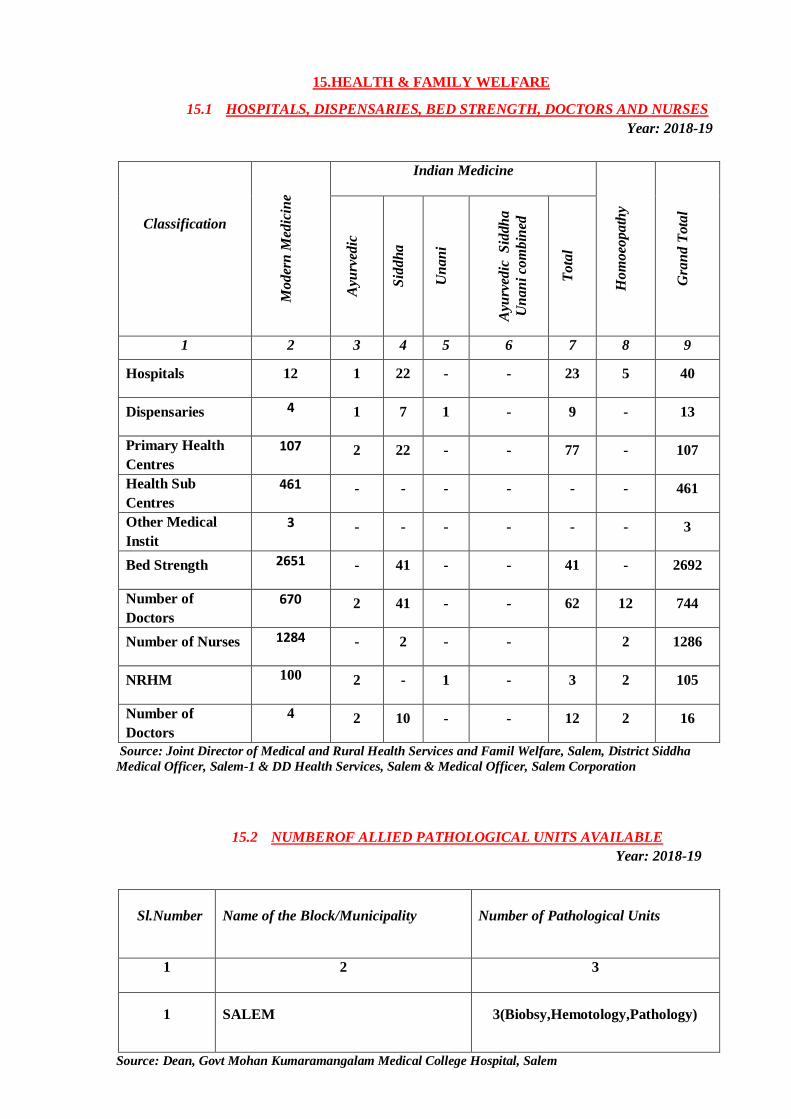
15.HEALTH & FAMILY WELFARE
15.1 HOSPITALS, DISPENSARIES, BED STRENGTH, DOCTORS AND NURSES
Year: 2018-19
Classification
Mo
der
n M
edic
ine
Indian Medicine
Ho
mo
eop
ath
y
Gra
nd
Tota
l
Ayu
rved
ic
Sid
dh
a
Un
an
i
Ayu
rved
ic S
iddh
a
Un
an
i co
mb
ined
To
tal
1 2 3 4 5 6 7 8 9
Hospitals 12 1 22 - - 23 5 40
Dispensaries 4 1 7 1 - 9 - 13
Primary Health
Centres
107 2 22 - - 77 - 107
Health Sub
Centres
461 - - - - - - 461
Other Medical
Instit
utions(MMU)
3 - - - - - - 3
Bed Strength 2651 - 41 - - 41 - 2692
Number of
Doctors
670 2 41 - - 62 12 744
Number of Nurses 1284 - 2 - - 2 1286
NRHM 100 2 - 1 - 3 2 105
Number of
Doctors
4 2 10 - - 12 2 16
Source: Joint Director of Medical and Rural Health Services and Famil Welfare, Salem, District Siddha
Medical Officer, Salem-1 & DD Health Services, Salem & Medical Officer, Salem Corporation
15.2 NUMBEROF ALLIED PATHOLOGICAL UNITS AVAILABLE
Year: 2018-19
Sl.Number Name of the Block/Municipality Number of Pathological Units
1 2 3
1 SALEM 3(Biobsy,Hemotology,Pathology)
Source: Dean, Govt Mohan Kumaramangalam Medical College Hospital, Salem
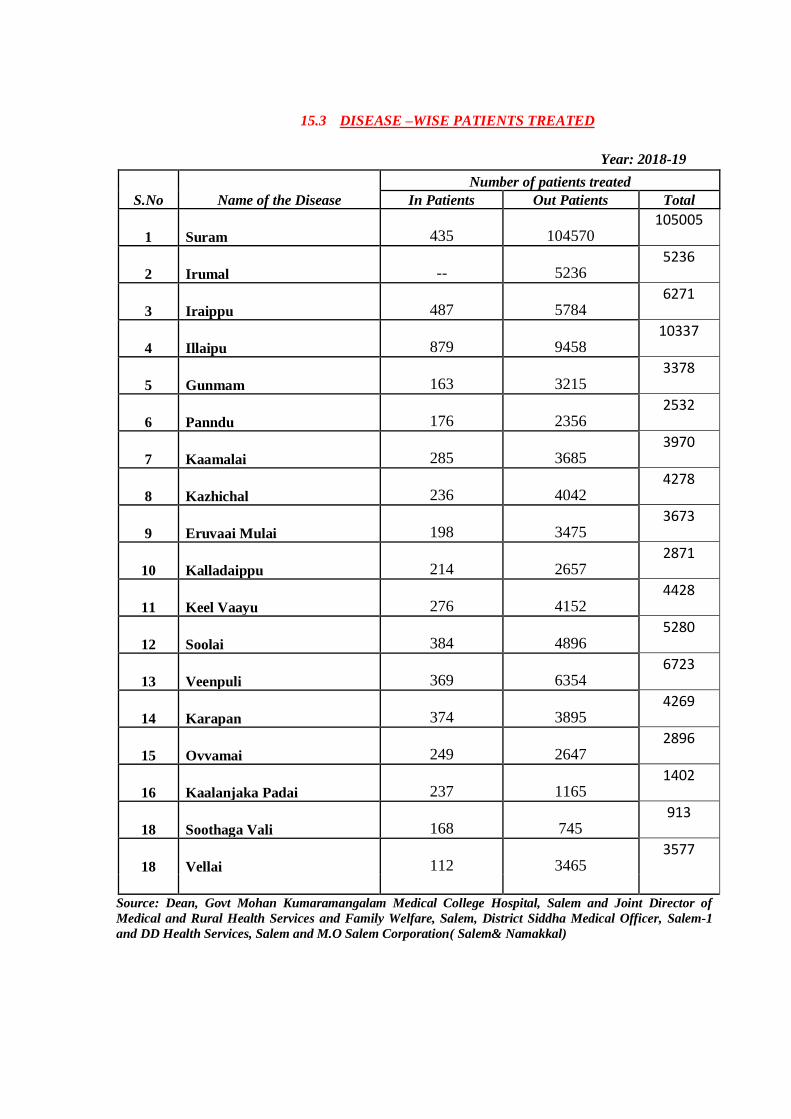
15.3 DISEASE –WISE PATIENTS TREATED
Year: 2018-19
S.No Name of the Disease
Number of patients treated
In Patients Out Patients Total
1 Suram 435 104570 105005
2 Irumal -- 5236 5236
3 Iraippu 487 5784 6271
4 Illaipu 879 9458 10337
5 Gunmam 163 3215 3378
6 Panndu 176 2356 2532
7 Kaamalai 285 3685 3970
8 Kazhichal 236 4042 4278
9 Eruvaai Mulai 198 3475 3673
10 Kalladaippu 214 2657 2871
11 Keel Vaayu 276 4152 4428
12 Soolai 384 4896 5280
13 Veenpuli 369 6354 6723
14 Karapan 374 3895 4269
15 Ovvamai 249 2647 2896
16 Kaalanjaka Padai 237 1165 1402
18 Soothaga Vali 168 745 913
18 Vellai 112 3465 3577
Source: Dean, Govt Mohan Kumaramangalam Medical College Hospital, Salem and Joint Director of
Medical and Rural Health Services and Family Welfare, Salem, District Siddha Medical Officer, Salem-1
and DD Health Services, Salem and M.O Salem Corporation( Salem& Namakkal)
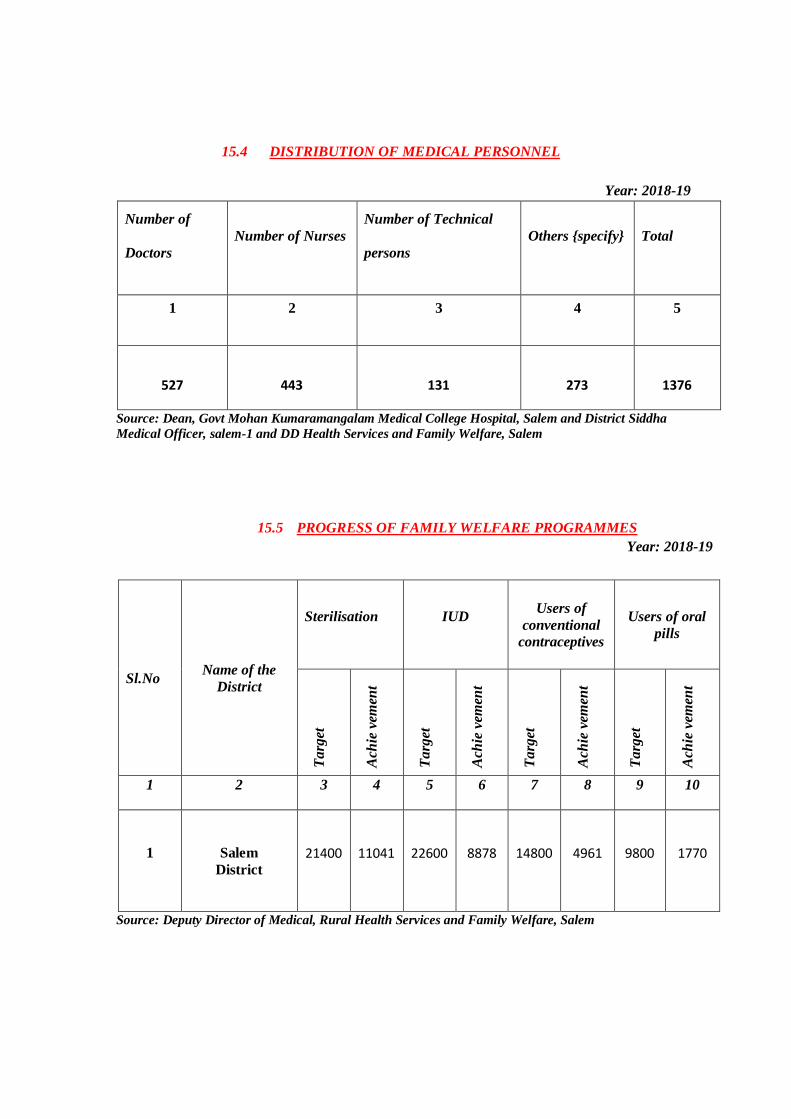
15.4 DISTRIBUTION OF MEDICAL PERSONNEL
Year: 2018-19
Number of
Doctors
Number of Nurses
Number of Technical
persons
Others {specify} Total
1 2 3 4 5
527 443 131 273 1376
Source: Dean, Govt Mohan Kumaramangalam Medical College Hospital, Salem and District Siddha
Medical Officer, salem-1 and DD Health Services and Family Welfare, Salem
15.5 PROGRESS OF FAMILY WELFARE PROGRAMMES
Year: 2018-19
Sl.No Name of the
District
Sterilisation IUD Users of
conventional
contraceptives
Users of oral
pills
Targ
et
Ach
ie v
emen
t
Targ
et
Ach
ie v
emen
t
Targ
et
Ach
ie v
emen
t
Targ
et
Ach
ie v
emen
t
1 2 3 4 5 6 7 8 9 10
1
Salem
District
21400 11041 22600 8878 14800 4961 9800 1770
Source: Deputy Director of Medical, Rural Health Services and Family Welfare, Salem
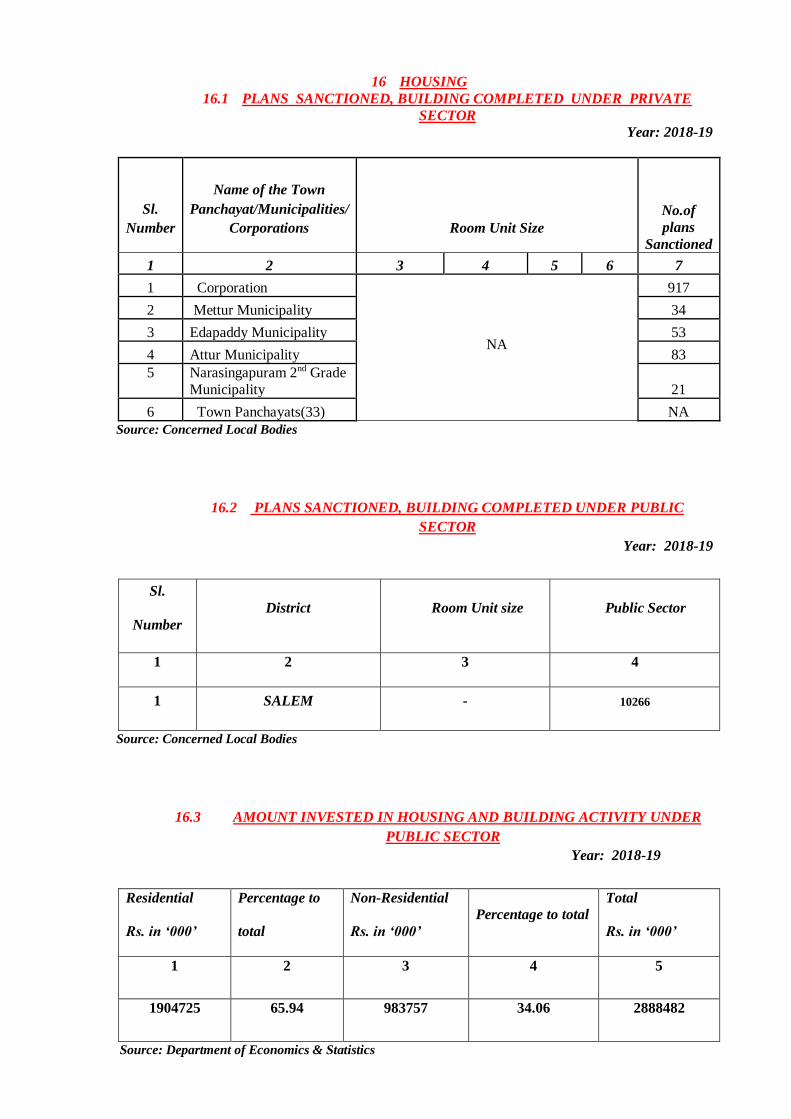
16 HOUSING
16.1 PLANS SANCTIONED, BUILDING COMPLETED UNDER PRIVATE
SECTOR
Year: 2018-19
Sl.
Number
Name of the Town
Panchayat/Municipalities/
Corporations
Room Unit Size
No.of
plans
Sanctioned
1 2 3 4 5 6 7
1 Corporation
NA
917
2 Mettur Municipality 34
3 Edapaddy Municipality 53
4 Attur Municipality 83
5 Narasingapuram 2nd Grade
Municipality 21
6 Town Panchayats(33) NA
Source: Concerned Local Bodies
16.2 PLANS SANCTIONED, BUILDING COMPLETED UNDER PUBLIC
SECTOR
Year: 2018-19
Sl.
Number
District Room Unit size Public Sector
1 2 3 4
1 SALEM - 10266
Source: Concerned Local Bodies
16.3 AMOUNT INVESTED IN HOUSING AND BUILDING ACTIVITY UNDER
PUBLIC SECTOR
Year: 2018-19
Residential
Rs. in ‘000’
Percentage to
total
Non-Residential
Rs. in ‘000’
Percentage to total
Total
Rs. in ‘000’
1 2 3 4 5
1904725 65.94 983757 34.06 2888482
Source: Department of Economics & Statistics
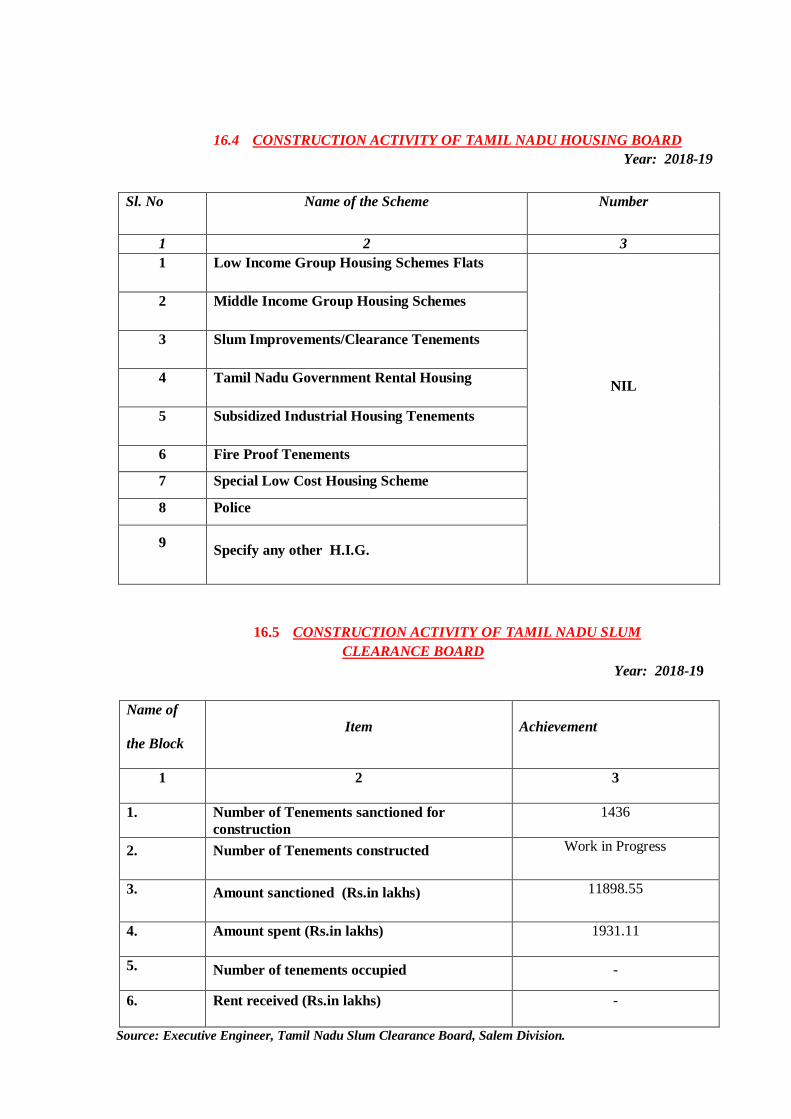
16.4 CONSTRUCTION ACTIVITY OF TAMIL NADU HOUSING BOARD
Year: 2018-19
Sl. No Name of the Scheme Number
1 2 3
1 Low Income Group Housing Schemes Flats
NIL
2 Middle Income Group Housing Schemes
3 Slum Improvements/Clearance Tenements
4 Tamil Nadu Government Rental Housing
5 Subsidized Industrial Housing Tenements
6 Fire Proof Tenements
7 Special Low Cost Housing Scheme
8 Police
9 Specify any other H.I.G.
16.5 CONSTRUCTION ACTIVITY OF TAMIL NADU SLUM
CLEARANCE BOARD
Year: 2018-19
Name of
the Block
Item Achievement
1 2 3
1. Number of Tenements sanctioned for
construction
1436
2. Number of Tenements constructed Work in Progress
3. Amount sanctioned (Rs.in lakhs) 11898.55
4. Amount spent (Rs.in lakhs) 1931.11
5. Number of tenements occupied -
6. Rent received (Rs.in lakhs) -
Source: Executive Engineer, Tamil Nadu Slum Clearance Board, Salem Division.
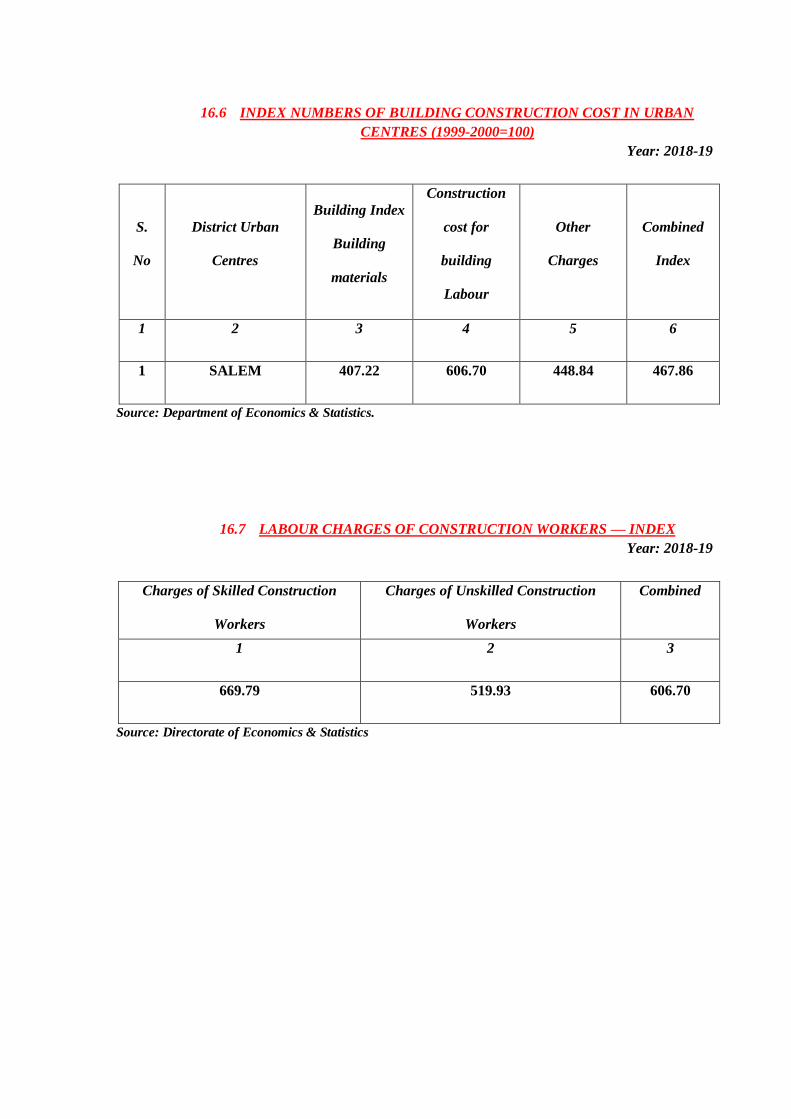
16.6 INDEX NUMBERS OF BUILDING CONSTRUCTION COST IN URBAN
CENTRES (1999-2000=100)
Year: 2018-19
S.
No
District Urban
Centres
Building Index
Building
materials
Construction
cost for
building
Labour
Other
Charges
Combined
Index
1 2 3 4 5 6
1 SALEM 407.22 606.70 448.84 467.86
Source: Department of Economics & Statistics.
16.7 LABOUR CHARGES OF CONSTRUCTION WORKERS — INDEX
Year: 2018-19
Charges of Skilled Construction
Workers
Charges of Unskilled Construction
Workers
Combined
1 2 3
669.79 519.93 606.70
Source: Directorate of Economics & Statistics
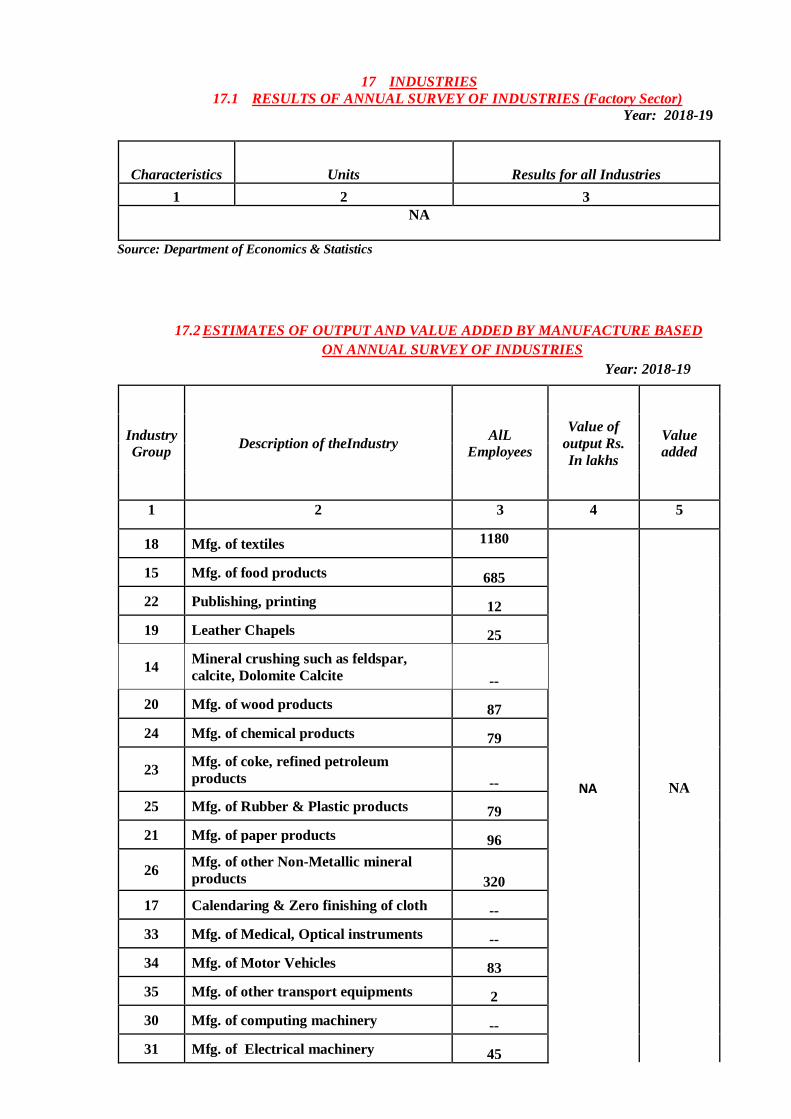
17 INDUSTRIES
17.1 RESULTS OF ANNUAL SURVEY OF INDUSTRIES (Factory Sector)
Year: 2018-19
Characteristics Units Results for all Industries
1 2 3
NA
Source: Department of Economics & Statistics
17.2 ESTIMATES OF OUTPUT AND VALUE ADDED BY MANUFACTURE BASED
ON ANNUAL SURVEY OF INDUSTRIES
Year: 2018-19
Industry
Group Description of theIndustry
AlL
Employees
Value of
output Rs.
In lakhs
Value
added
1 2 3 4 5
18 Mfg. of textiles 1180
NA NA
15 Mfg. of food products 685
22 Publishing, printing 12
19 Leather Chapels 25
14 Mineral crushing such as feldspar,
calcite, Dolomite Calcite --
20 Mfg. of wood products 87
24 Mfg. of chemical products 79
23 Mfg. of coke, refined petroleum
products --
25 Mfg. of Rubber & Plastic products 79
21 Mfg. of paper products 96
26 Mfg. of other Non-Metallic mineral
products 320
17 Calendaring & Zero finishing of cloth --
33 Mfg. of Medical, Optical instruments --
34 Mfg. of Motor Vehicles 83
35 Mfg. of other transport equipments 2
30 Mfg. of computing machinery --
31 Mfg. of Electrical machinery 45
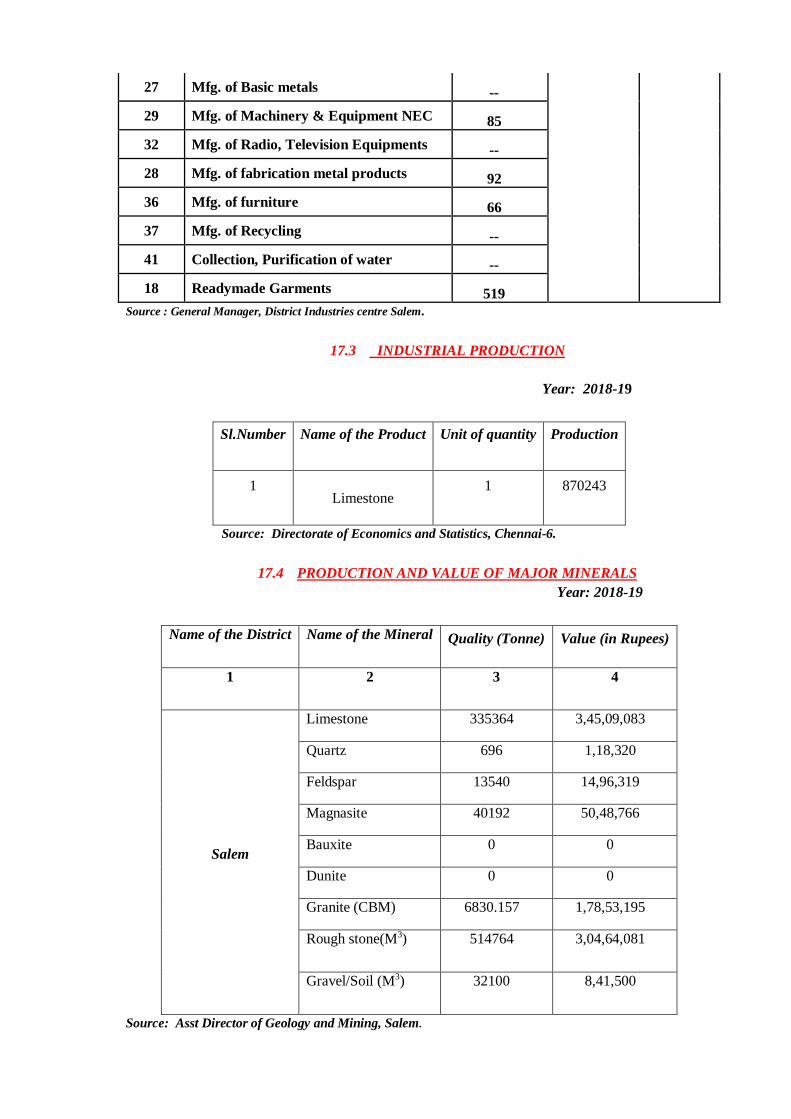
27 Mfg. of Basic metals --
29 Mfg. of Machinery & Equipment NEC 85
32 Mfg. of Radio, Television Equipments --
28 Mfg. of fabrication metal products 92
36 Mfg. of furniture 66
37 Mfg. of Recycling --
41 Collection, Purification of water --
18 Readymade Garments 519
Source : General Manager, District Industries centre Salem.
17.3 INDUSTRIAL PRODUCTION
Year: 2018-19
Sl.Number Name of the Product Unit of quantity Production
1 Limestone
1 870243
Source: Directorate of Economics and Statistics, Chennai-6.
17.4 PRODUCTION AND VALUE OF MAJOR MINERALS
Year: 2018-19
Name of the District Name of the Mineral Quality (Tonne) Value (in Rupees)
1 2 3 4
Salem
Limestone 335364 3,45,09,083
Quartz 696 1,18,320
Feldspar 13540 14,96,319
Magnasite 40192 50,48,766
Bauxite 0 0
Dunite 0 0
Granite (CBM) 6830.157 1,78,53,195
Rough stone(M3) 514764 3,04,64,081
Gravel/Soil (M3) 32100 8,41,500
Source: Asst Director of Geology and Mining, Salem.
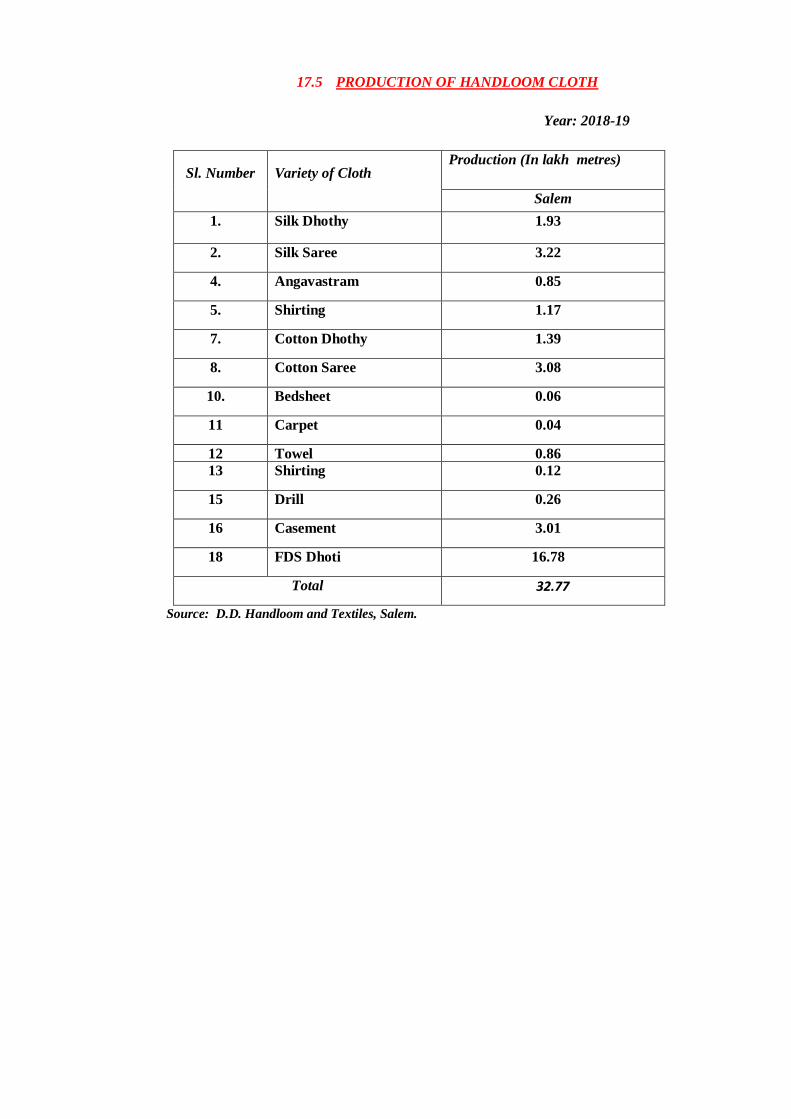
17.5 PRODUCTION OF HANDLOOM CLOTH
Year: 2018-19
Sl. Number Variety of Cloth Production (In lakh metres)
Salem
1. Silk Dhothy 1.93
2. Silk Saree 3.22
4. Angavastram 0.85
5. Shirting 1.17
7. Cotton Dhothy 1.39
8. Cotton Saree 3.08
10. Bedsheet 0.06
11 Carpet 0.04
12 Towel 0.86
13 Shirting 0.12
15 Drill 0.26
16 Casement 3.01
18 FDS Dhoti 16.78
Total 32.77
Source: D.D. Handloom and Textiles, Salem.
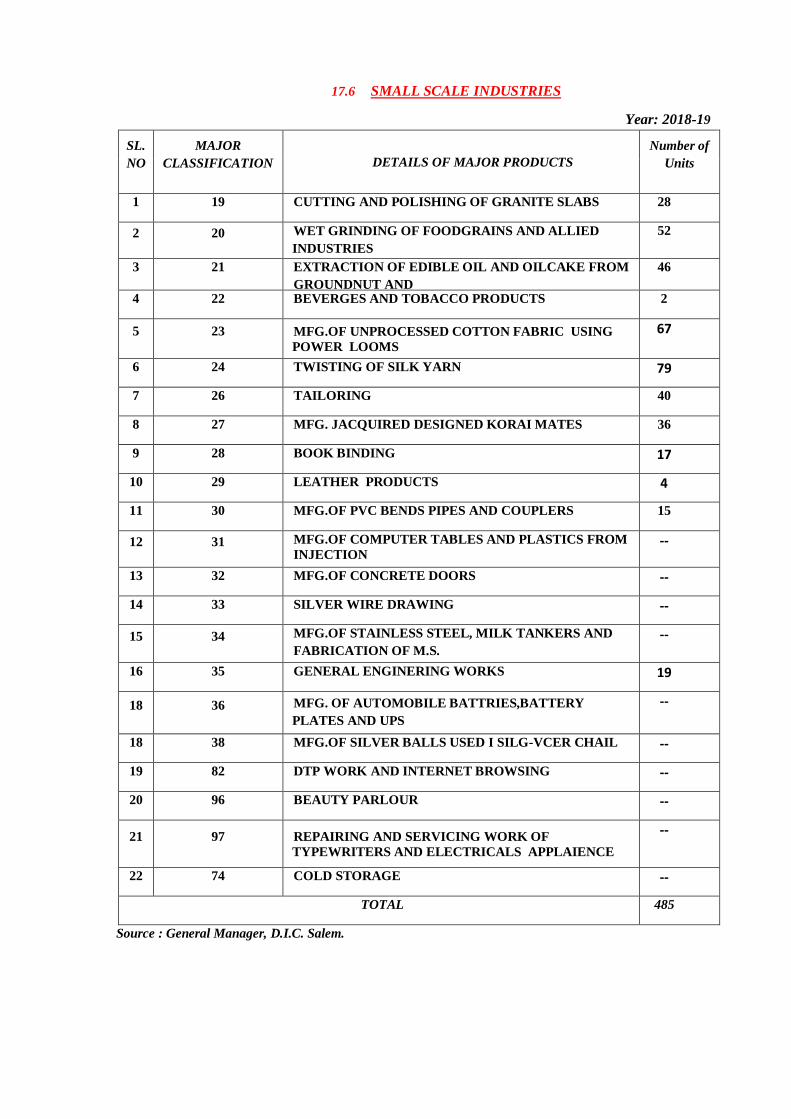
17.6 SMALL SCALE INDUSTRIES
Year: 2018-19
SL.
NO
MAJOR
CLASSIFICATION DETAILS OF MAJOR PRODUCTS
Number of
Units
1 19 CUTTING AND POLISHING OF GRANITE SLABS 28
2 20 WET GRINDING OF FOODGRAINS AND ALLIED
INDUSTRIES
52
3 21 EXTRACTION OF EDIBLE OIL AND OILCAKE FROM
GROUNDNUT AND
MFG.OF TAPIOCA STARCH
46
4 22 BEVERGES AND TOBACCO PRODUCTS 2
5 23 MFG.OF UNPROCESSED COTTON FABRIC USING
POWER LOOMS
67
6 24 TWISTING OF SILK YARN 79
7 26 TAILORING 40
8 27 MFG. JACQUIRED DESIGNED KORAI MATES 36
9 28 BOOK BINDING 17
10 29 LEATHER PRODUCTS 4
11 30 MFG.OF PVC BENDS PIPES AND COUPLERS 15
12 31 MFG.OF COMPUTER TABLES AND PLASTICS FROM
INJECTION
MOULDING
--
13 32 MFG.OF CONCRETE DOORS --
14 33 SILVER WIRE DRAWING --
15 34 MFG.OF STAINLESS STEEL, MILK TANKERS AND
FABRICATION OF M.S.
GATES AND GRILS
--
16 35 GENERAL ENGINERING WORKS 19
18 36 MFG. OF AUTOMOBILE BATTRIES,BATTERY
PLATES AND UPS
--
18 38 MFG.OF SILVER BALLS USED I SILG-VCER CHAIL --
19 82 DTP WORK AND INTERNET BROWSING --
20 96 BEAUTY PARLOUR --
21 97 REPAIRING AND SERVICING WORK OF
TYPEWRITERS AND ELECTRICALS APPLAIENCE
--
22 74 COLD STORAGE --
TOTAL 485
Source : General Manager, D.I.C. Salem.
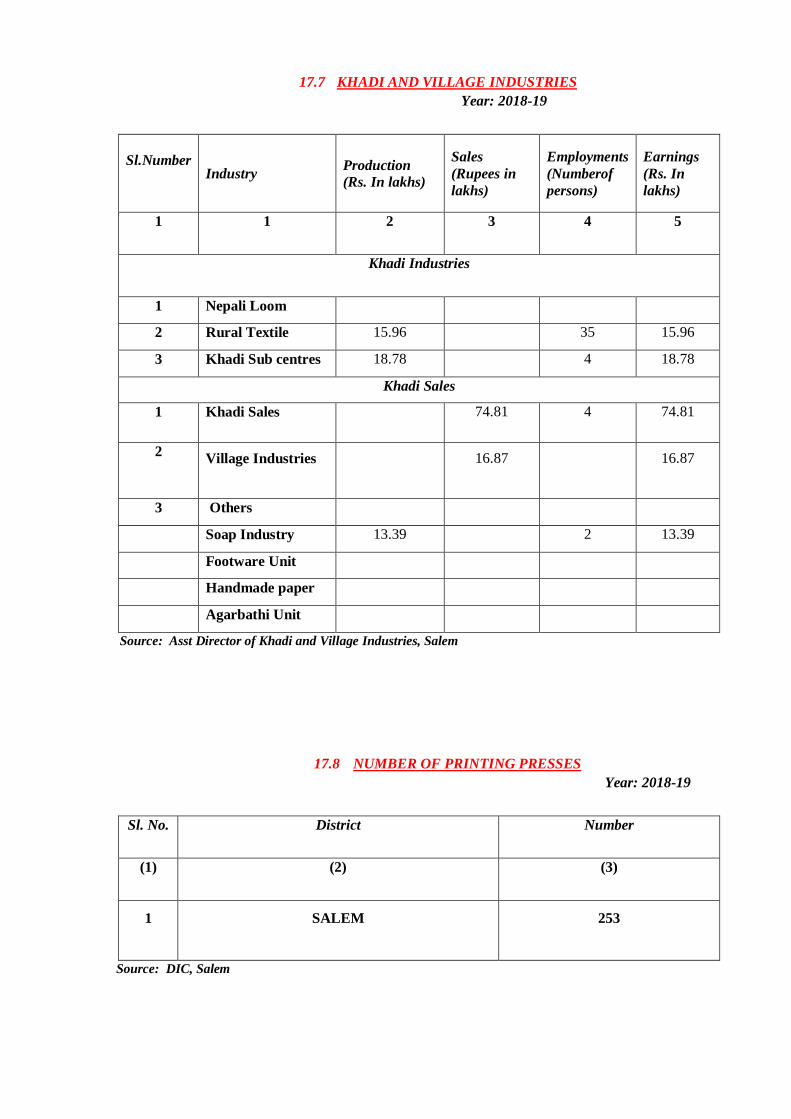
17.7 KHADI AND VILLAGE INDUSTRIES
Year: 2018-19
Sl.Number
Industry
Production
(Rs. In lakhs)
Sales
(Rupees in
lakhs)
Employments
(Numberof
persons)
Earnings
(Rs. In
lakhs)
1 1 2 3 4 5
Khadi Industries
1 Nepali Loom
2 Rural Textile 15.96 35 15.96
3 Khadi Sub centres 18.78 4 18.78
Khadi Sales
1 Khadi Sales 74.81 4 74.81
2 Village Industries 16.87 16.87
3 Others
Soap Industry 13.39 2 13.39
Footware Unit
Handmade paper
unit
Agarbathi Unit
Source: Asst Director of Khadi and Village Industries, Salem
17.8 NUMBER OF PRINTING PRESSES
Year: 2018-19
Sl. No. District Number
(1) (2) (3)
1 SALEM 253
Source: DIC, Salem
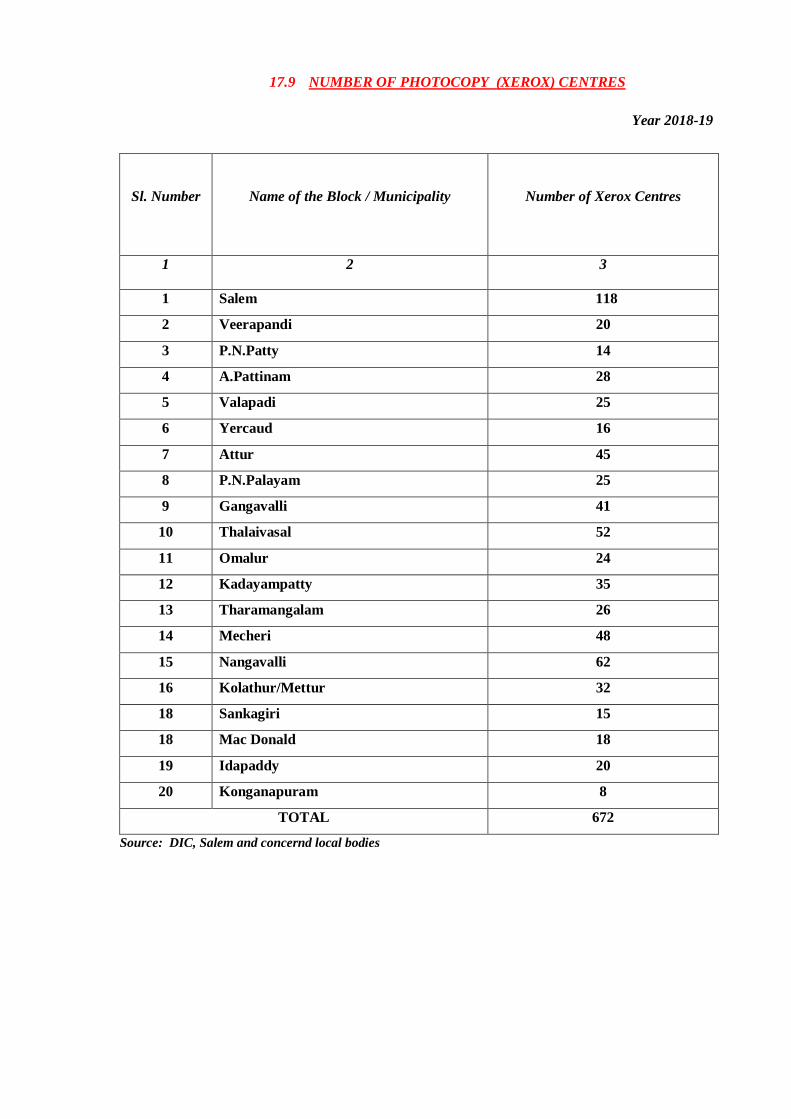
17.9 NUMBER OF PHOTOCOPY (XEROX) CENTRES
Year 2018-19
Sl. Number
Name of the Block / Municipality
Number of Xerox Centres
1 2 3
1 Salem 118
2 Veerapandi 20
3 P.N.Patty 14
4 A.Pattinam 28
5 Valapadi 25
6 Yercaud 16
7 Attur 45
8 P.N.Palayam 25
9 Gangavalli
41
10 Thalaivasal 52
11 Omalur 24
12 Kadayampatty 35
13 Tharamangalam 26
14 Mecheri 48
15 Nangavalli 62
16 Kolathur/Mettur 32
18 Sankagiri 15
18 Mac Donald 18
19 Idapaddy 20
20 Konganapuram 8
TOTAL 672
Source: DIC, Salem and concernd local bodies
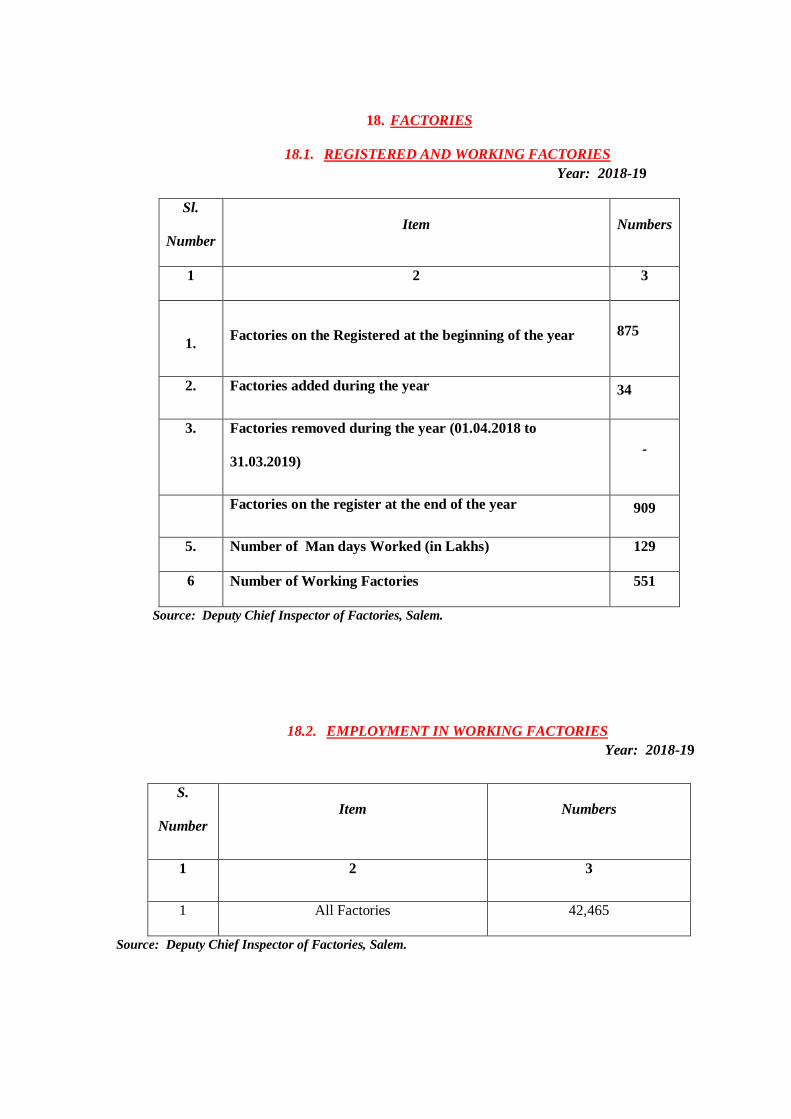
18. FACTORIES
18.1. REGISTERED AND WORKING FACTORIES
Year: 2018-19
Sl.
Number
Item Numbers
1 2 3
1. Factories on the Registered at the beginning of the year 875
2. Factories added during the year 34
3. Factories removed during the year (01.04.2018 to
31.03.2019) -
Factories on the register at the end of the year 909
5. Number of Man days Worked (in Lakhs) 129
6 Number of Working Factories 551
Source: Deputy Chief Inspector of Factories, Salem.
18.2. EMPLOYMENT IN WORKING FACTORIES
Year: 2018-19
S.
Number
Item Numbers
1 2 3
1 All Factories 42,465
Source: Deputy Chief Inspector of Factories, Salem.
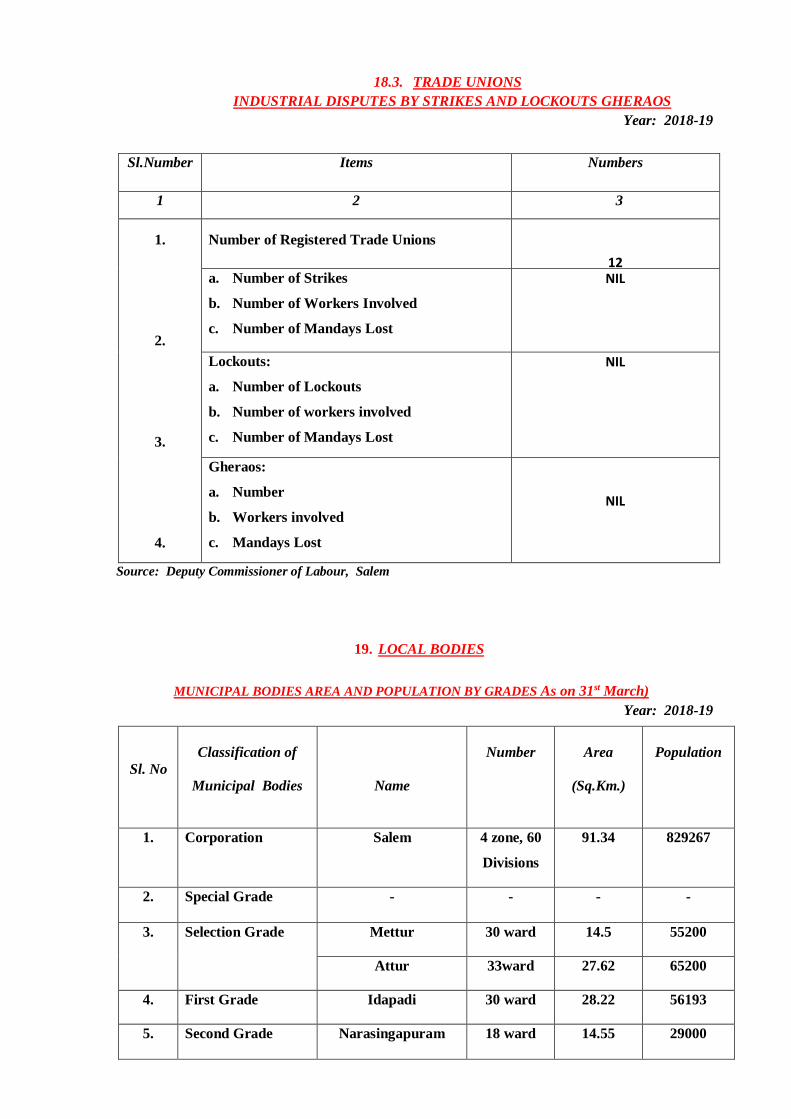
18.3. TRADE UNIONS
INDUSTRIAL DISPUTES BY STRIKES AND LOCKOUTS GHERAOS
Year: 2018-19
Sl.Number
Items
Numbers
1 2 3
1.
2.
3.
4.
Number of Registered Trade Unions
12 a. Number of Strikes
b. Number of Workers Involved
c. Number of Mandays Lost
NIL
Lockouts:
a. Number of Lockouts
b. Number of workers involved
c. Number of Mandays Lost
NIL
Gheraos:
a. Number
b. Workers involved
c. Mandays Lost
NIL
Source: Deputy Commissioner of Labour, Salem
19. LOCAL BODIES
MUNICIPAL BODIES AREA AND POPULATION BY GRADES As on 31st March)
Year: 2018-19
Sl. No
Classification of
Municipal Bodies
Name
Number
Area
(Sq.Km.)
Population
1. Corporation Salem 4 zone, 60
Divisions
91.34 829267
2. Special Grade - - - -
3. Selection Grade Mettur 30 ward 14.5 55200
Attur 33ward 27.62 65200
4. First Grade Idapadi 30 ward 28.22 56193
5. Second Grade Narasingapuram 18 ward 14.55 29000
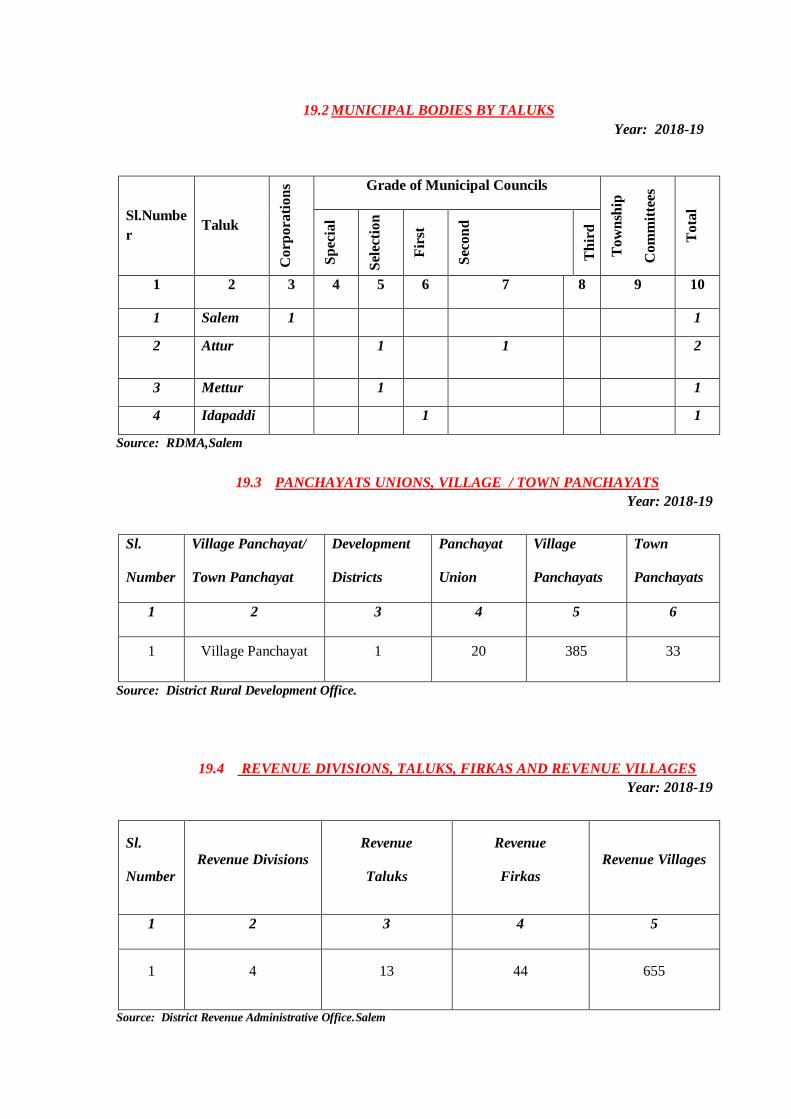
19.2 MUNICIPAL BODIES BY TALUKS
Year: 2018-19
Sl.Numbe
r Taluk
Co
rpo
rati
on
s Grade of Municipal Councils
To
wn
ship
Co
mm
itte
es
To
tal
Sp
ecia
l
Sel
ecti
on
Fir
st
Sec
on
d
Th
ird
1 2 3 4 5 6 7 8 9 10
1 Salem 1 1
2 Attur 1 1 2
3 Mettur 1 1
4 Idapaddi 1 1
Source: RDMA,Salem
19.3 PANCHAYATS UNIONS, VILLAGE / TOWN PANCHAYATS
Year: 2018-19
Sl.
Number
Village Panchayat/
Town Panchayat
Development
Districts
Panchayat
Union
Village
Panchayats
Town
Panchayats
1 2 3 4 5 6
1 Village Panchayat 1 20 385 33
Source: District Rural Development Office.
19.4 REVENUE DIVISIONS, TALUKS, FIRKAS AND REVENUE VILLAGES
Year: 2018-19
Sl.
Number
Revenue Divisions
Revenue
Taluks
Revenue
Firkas
Revenue Villages
1 2 3 4 5
1 4 13 44 655
Source: District Revenue Administrative Office.Salem
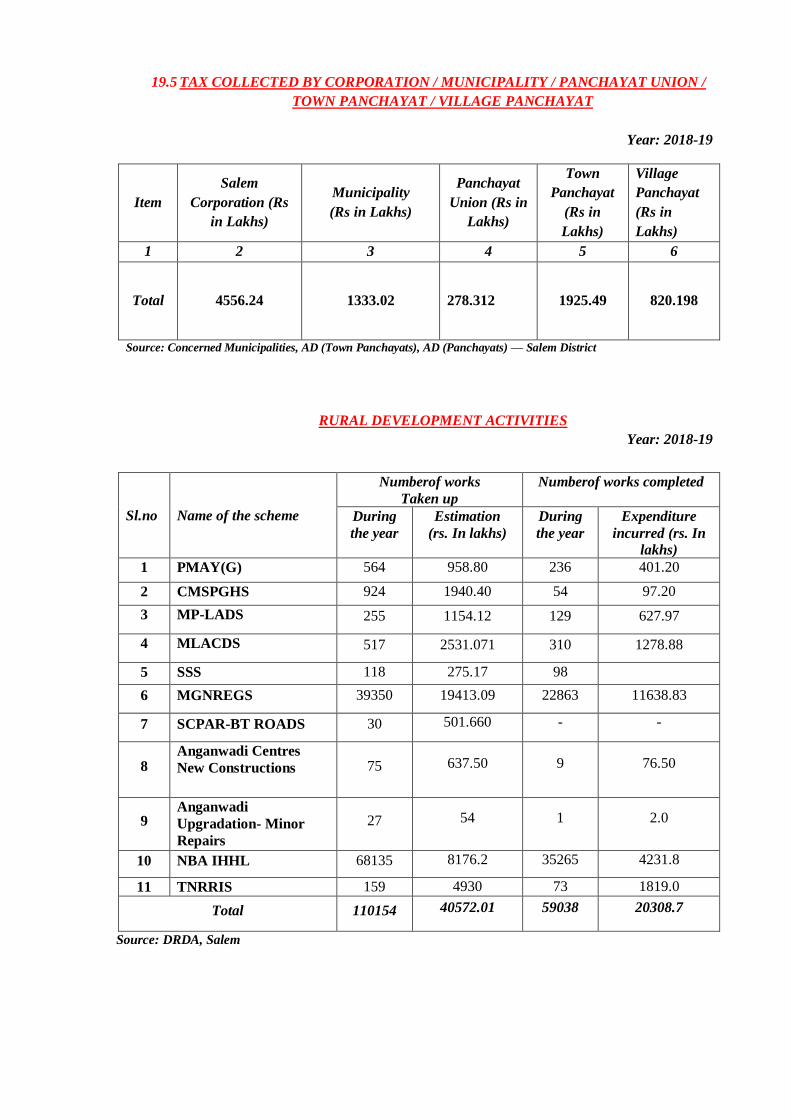
19.5 TAX COLLECTED BY CORPORATION / MUNICIPALITY / PANCHAYAT UNION /
TOWN PANCHAYAT / VILLAGE PANCHAYAT
Year: 2018-19
Item
Salem
Corporation (Rs
in Lakhs)
Municipality
(Rs in Lakhs)
Panchayat
Union (Rs in
Lakhs)
Town
Panchayat
(Rs in
Lakhs)
Village
Panchayat
(Rs in
Lakhs)
1 2 3 4 5 6
Total 4556.24 1333.02 278.312 1925.49 820.198
Source: Concerned Municipalities, AD (Town Panchayats), AD (Panchayats) — Salem District
RURAL DEVELOPMENT ACTIVITIES
Year: 2018-19
Sl.no
Name of the scheme
Numberof works
Taken up
Numberof works completed
During
the year
Estimation
(rs. In lakhs)
During
the year
Expenditure
incurred (rs. In
lakhs)
1 PMAY(G) 564 958.80 236 401.20
2 CMSPGHS 924 1940.40 54 97.20
3 MP-LADS 255 1154.12 129 627.97
4 MLACDS 517 2531.071 310 1278.88
5 SSS 118 275.17 98
6 MGNREGS 39350 19413.09 22863 11638.83
7 SCPAR-BT ROADS 30 501.660 - -
8 Anganwadi Centres
New Constructions
75 637.50 9 76.50
9 Anganwadi
Upgradation- Minor
Repairs
27 54 1 2.0
10 NBA IHHL 68135 8176.2 35265 4231.8
11 TNRRIS 159 4930 73 1819.0
Total 110154 40572.01 59038 20308.7
Source: DRDA, Salem
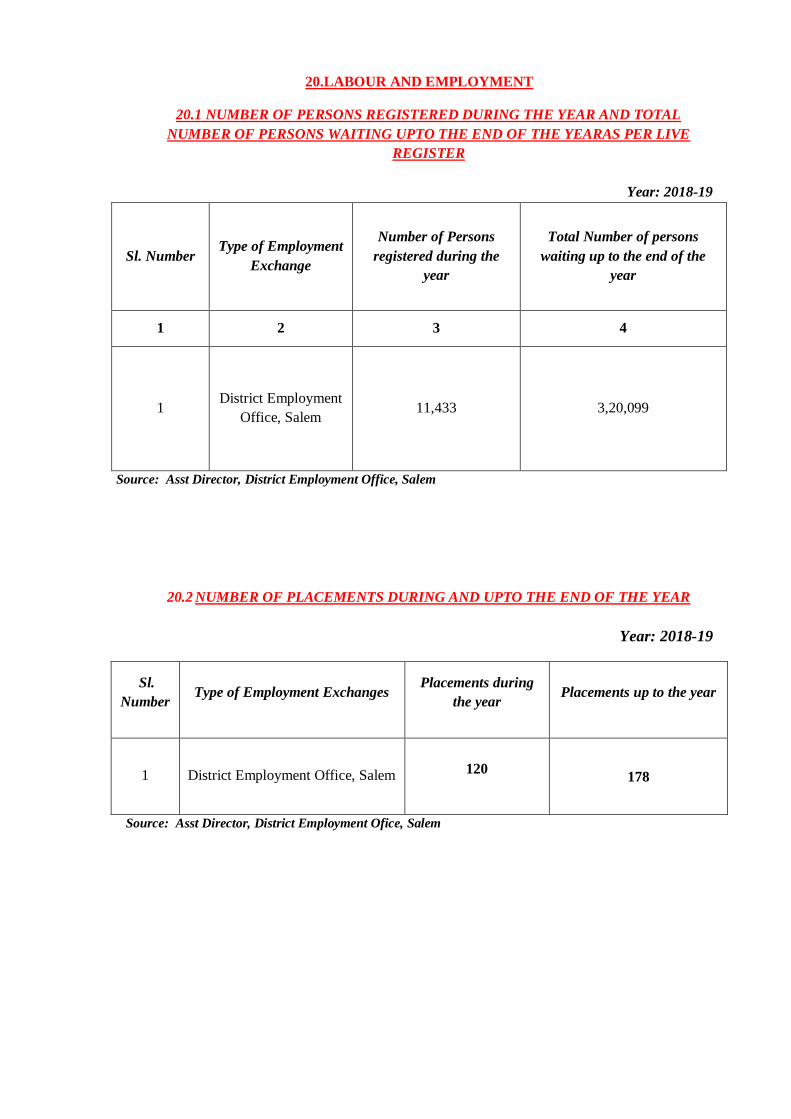
20.LABOUR AND EMPLOYMENT
20.1 NUMBER OF PERSONS REGISTERED DURING THE YEAR AND TOTAL
NUMBER OF PERSONS WAITING UPTO THE END OF THE YEARAS PER LIVE
REGISTER
Year: 2018-19
Sl. Number Type of Employment
Exchange
Number of Persons
registered during the
year
Total Number of persons
waiting up to the end of the
year
1 2 3 4
1 District Employment
Office, Salem 11,433 3,20,099
Source: Asst Director, District Employment Office, Salem
20.2 NUMBER OF PLACEMENTS DURING AND UPTO THE END OF THE YEAR
Year: 2018-19
Sl.
Number Type of Employment Exchanges
Placements during
the year Placements up to the year
1 District Employment Office, Salem 120 178
Source: Asst Director, District Employment Ofice, Salem
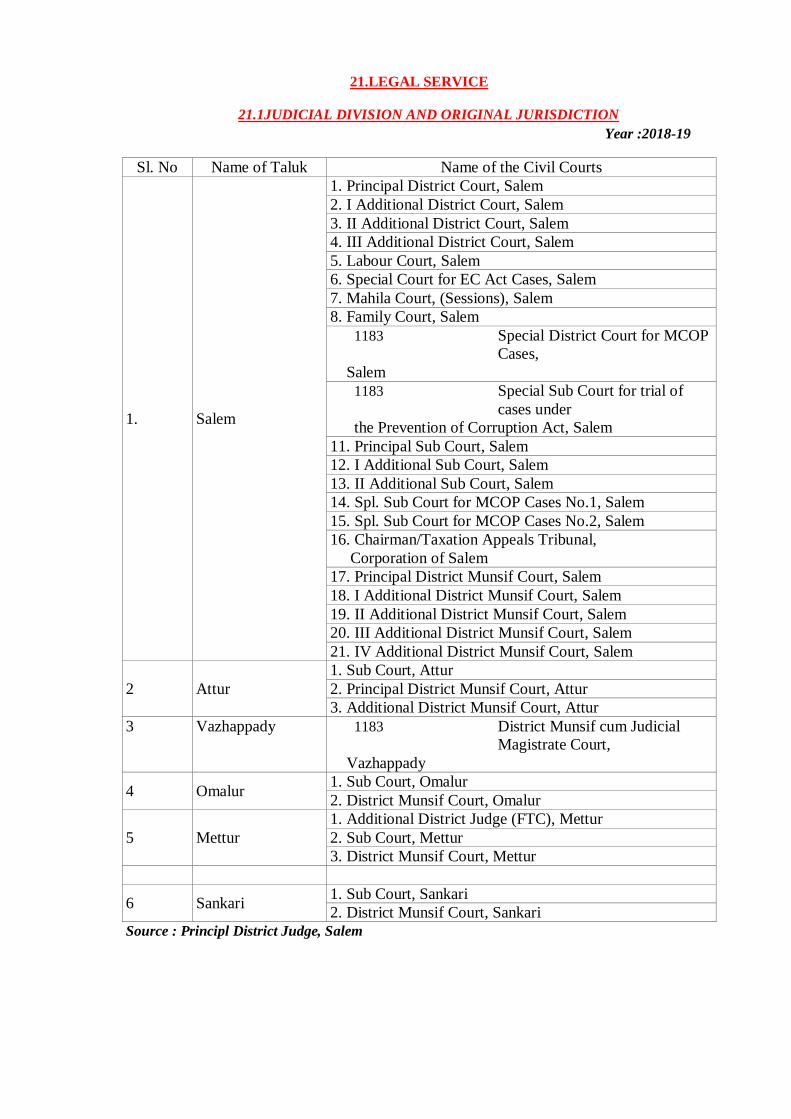
21.LEGAL SERVICE
21.1JUDICIAL DIVISION AND ORIGINAL JURISDICTION
Year :2018-19
Sl. No Name of Taluk Name of the Civil Courts
1. Salem
1. Principal District Court, Salem
2. I Additional District Court, Salem
3. II Additional District Court, Salem
4. III Additional District Court, Salem
5. Labour Court, Salem
6. Special Court for EC Act Cases, Salem
7. Mahila Court, (Sessions), Salem
8. Family Court, Salem
1183 Special District Court for MCOP
Cases,
Salem
1183 Special Sub Court for trial of
cases under
the Prevention of Corruption Act, Salem
11. Principal Sub Court, Salem
12. I Additional Sub Court, Salem
13. II Additional Sub Court, Salem
14. Spl. Sub Court for MCOP Cases No.1, Salem
15. Spl. Sub Court for MCOP Cases No.2, Salem
16. Chairman/Taxation Appeals Tribunal,
Corporation of Salem
17. Principal District Munsif Court, Salem
18. I Additional District Munsif Court, Salem
19. II Additional District Munsif Court, Salem
20. III Additional District Munsif Court, Salem
21. IV Additional District Munsif Court, Salem
2 Attur
1. Sub Court, Attur
2. Principal District Munsif Court, Attur
3. Additional District Munsif Court, Attur
3 Vazhappady 1183 District Munsif cum Judicial
Magistrate Court,
Vazhappady
4 Omalur 1. Sub Court, Omalur
2. District Munsif Court, Omalur
5 Mettur
1. Additional District Judge (FTC), Mettur
2. Sub Court, Mettur
3. District Munsif Court, Mettur
6 Sankari 1. Sub Court, Sankari
2. District Munsif Court, Sankari
Source : Principl District Judge, Salem
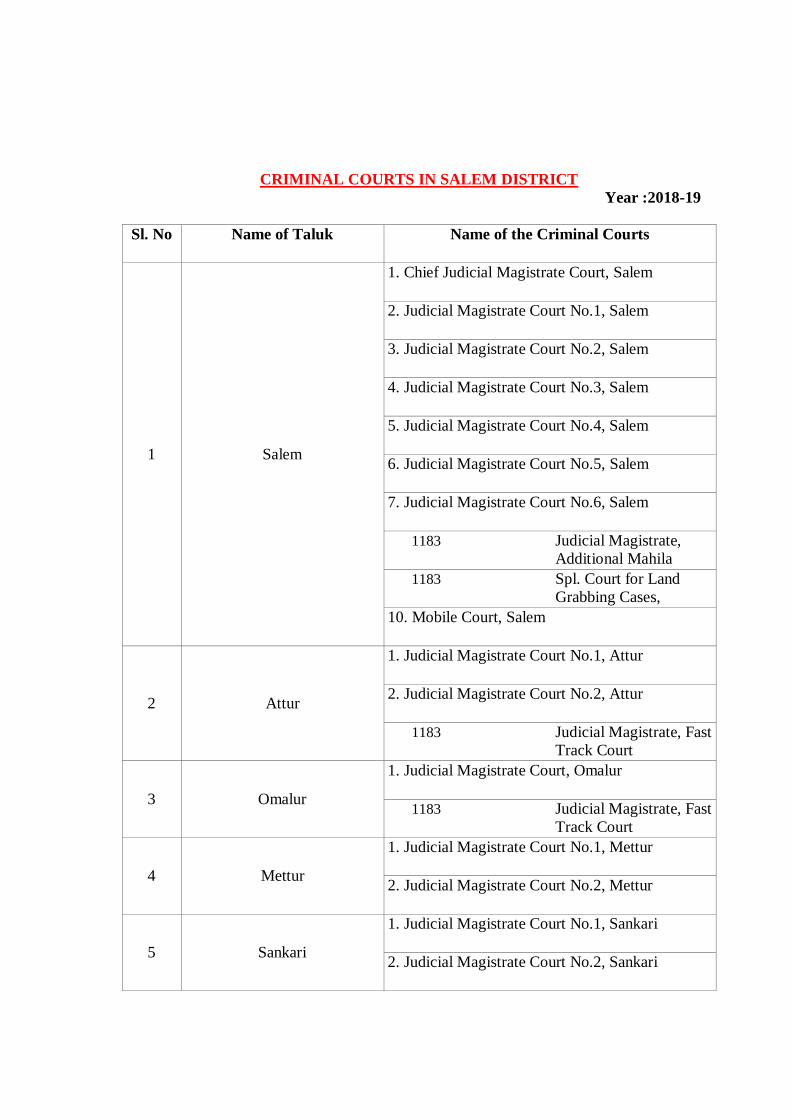
CRIMINAL COURTS IN SALEM DISTRICT
Year :2018-19
Sl. No Name of Taluk Name of the Criminal Courts
1 Salem
1. Chief Judicial Magistrate Court, Salem
2. Judicial Magistrate Court No.1, Salem
3. Judicial Magistrate Court No.2, Salem
4. Judicial Magistrate Court No.3, Salem
5. Judicial Magistrate Court No.4, Salem
6. Judicial Magistrate Court No.5, Salem
7. Judicial Magistrate Court No.6, Salem
1183 Judicial Magistrate,
Additional Mahila
Court,
Salem 1183 Spl. Court for Land
Grabbing Cases,
Magisterial Level, Salem 10. Mobile Court, Salem
2 Attur
1. Judicial Magistrate Court No.1, Attur
2. Judicial Magistrate Court No.2, Attur
1183 Judicial Magistrate, Fast
Track Court
(Magisterial Level), Attur.
3 Omalur
1. Judicial Magistrate Court, Omalur
1183 Judicial Magistrate, Fast
Track Court
(Magisterial Level), Omalur
4 Mettur
1. Judicial Magistrate Court No.1, Mettur
2. Judicial Magistrate Court No.2, Mettur
5 Sankari
1. Judicial Magistrate Court No.1, Sankari
2. Judicial Magistrate Court No.2, Sankari
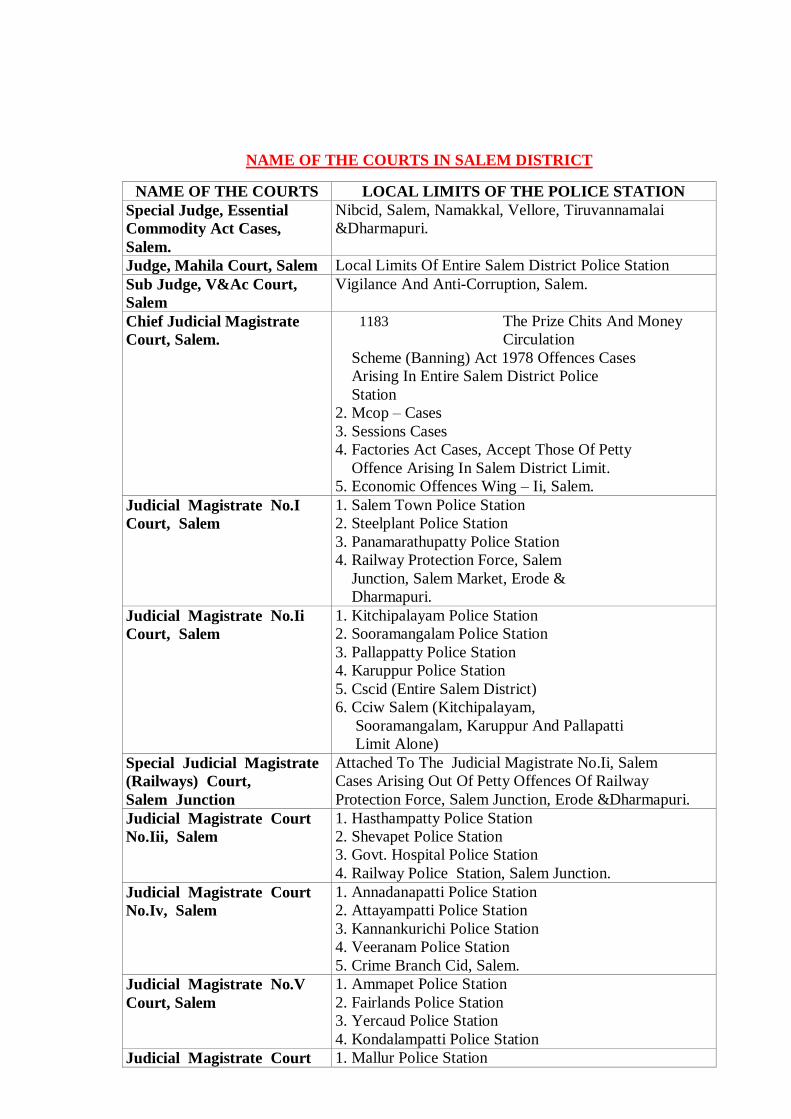
NAME OF THE COURTS IN SALEM DISTRICT
NAME OF THE COURTS LOCAL LIMITS OF THE POLICE STATION
Special Judge, Essential
Commodity Act Cases,
Salem.
Nibcid, Salem, Namakkal, Vellore, Tiruvannamalai
&Dharmapuri.
Judge, Mahila Court, Salem Local Limits Of Entire Salem District Police Station
Sub Judge, V&Ac Court,
Salem
Vigilance And Anti-Corruption, Salem.
Chief Judicial Magistrate
Court, Salem.
1183 The Prize Chits And Money
Circulation
Scheme (Banning) Act 1978 Offences Cases
Arising In Entire Salem District Police
Station
2. Mcop – Cases
3. Sessions Cases
4. Factories Act Cases, Accept Those Of Petty
Offence Arising In Salem District Limit.
5. Economic Offences Wing – Ii, Salem.
Judicial Magistrate No.I
Court, Salem
1. Salem Town Police Station
2. Steelplant Police Station
3. Panamarathupatty Police Station
4. Railway Protection Force, Salem
Junction, Salem Market, Erode &
Dharmapuri.
Judicial Magistrate No.Ii
Court, Salem
1. Kitchipalayam Police Station
2. Sooramangalam Police Station
3. Pallappatty Police Station
4. Karuppur Police Station
5. Cscid (Entire Salem District)
6. Cciw Salem (Kitchipalayam,
Sooramangalam, Karuppur And Pallapatti
Limit Alone)
Special Judicial Magistrate
(Railways) Court,
Salem Junction
Attached To The Judicial Magistrate No.Ii, Salem
Cases Arising Out Of Petty Offences Of Railway
Protection Force, Salem Junction, Erode &Dharmapuri.
Judicial Magistrate Court
No.Iii, Salem
1. Hasthampatty Police Station
2. Shevapet Police Station
3. Govt. Hospital Police Station
4. Railway Police Station, Salem Junction.
Judicial Magistrate Court
No.Iv, Salem
1. Annadanapatti Police Station
2. Attayampatti Police Station
3. Kannankurichi Police Station
4. Veeranam Police Station
5. Crime Branch Cid, Salem.
Judicial Magistrate No.V
Court, Salem
1. Ammapet Police Station
2. Fairlands Police Station
3. Yercaud Police Station
4. Kondalampatti Police Station
Judicial Magistrate Court 1. Mallur Police Station
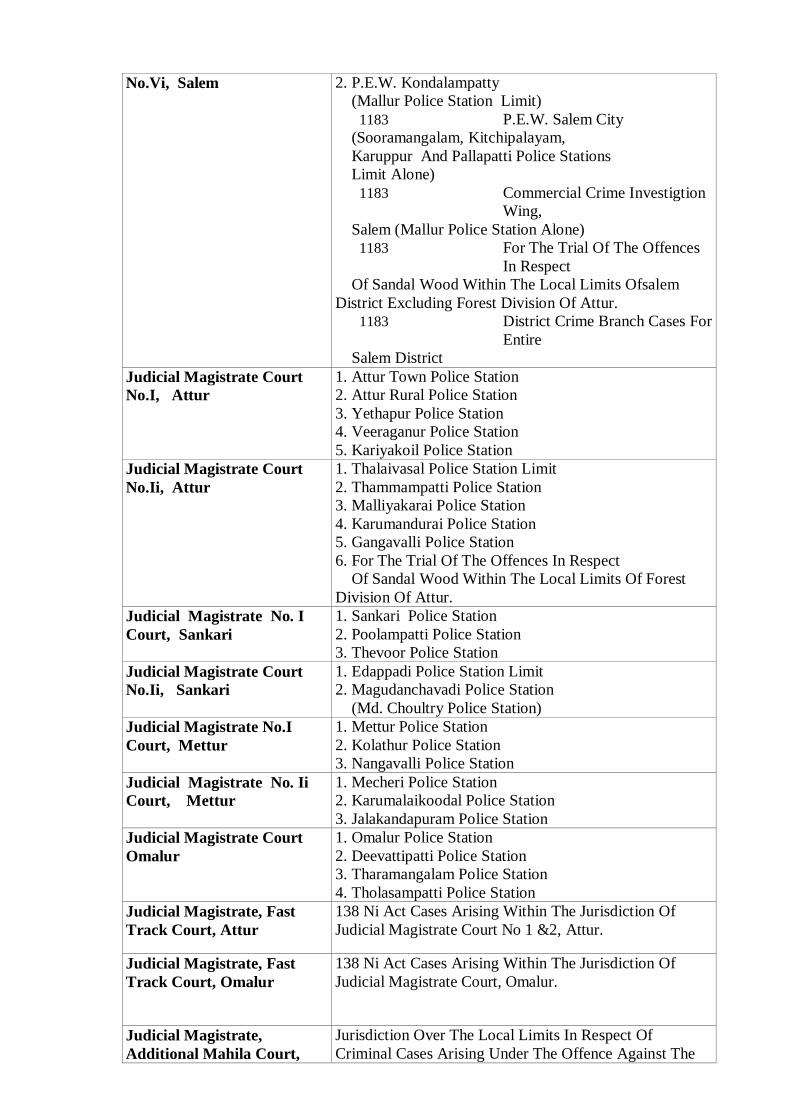
No.Vi, Salem 2. P.E.W. Kondalampatty
(Mallur Police Station Limit)
1183 P.E.W. Salem City
(Sooramangalam, Kitchipalayam,
Karuppur And Pallapatti Police Stations
Limit Alone)
1183 Commercial Crime Investigtion
Wing,
Salem (Mallur Police Station Alone)
1183 For The Trial Of The Offences
In Respect
Of Sandal Wood Within The Local Limits Ofsalem
District Excluding Forest Division Of Attur.
1183 District Crime Branch Cases For
Entire
Salem District
Judicial Magistrate Court
No.I, Attur
1. Attur Town Police Station
2. Attur Rural Police Station
3. Yethapur Police Station
4. Veeraganur Police Station
5. Kariyakoil Police Station
Judicial Magistrate Court
No.Ii, Attur
1. Thalaivasal Police Station Limit
2. Thammampatti Police Station
3. Malliyakarai Police Station
4. Karumandurai Police Station
5. Gangavalli Police Station
6. For The Trial Of The Offences In Respect
Of Sandal Wood Within The Local Limits Of Forest
Division Of Attur.
Judicial Magistrate No. I
Court, Sankari
1. Sankari Police Station
2. Poolampatti Police Station
3. Thevoor Police Station
Judicial Magistrate Court
No.Ii, Sankari
1. Edappadi Police Station Limit
2. Magudanchavadi Police Station
(Md. Choultry Police Station)
Judicial Magistrate No.I
Court, Mettur
1. Mettur Police Station
2. Kolathur Police Station
3. Nangavalli Police Station
Judicial Magistrate No. Ii
Court, Mettur
1. Mecheri Police Station
2. Karumalaikoodal Police Station
3. Jalakandapuram Police Station
Judicial Magistrate Court
Omalur
1. Omalur Police Station
2. Deevattipatti Police Station
3. Tharamangalam Police Station
4. Tholasampatti Police Station
Judicial Magistrate, Fast
Track Court, Attur
138 Ni Act Cases Arising Within The Jurisdiction Of
Judicial Magistrate Court No 1 &2, Attur.
Judicial Magistrate, Fast
Track Court, Omalur
138 Ni Act Cases Arising Within The Jurisdiction Of
Judicial Magistrate Court, Omalur.
Judicial Magistrate,
Additional Mahila Court,
Jurisdiction Over The Local Limits In Respect Of
Criminal Cases Arising Under The Offence Against The
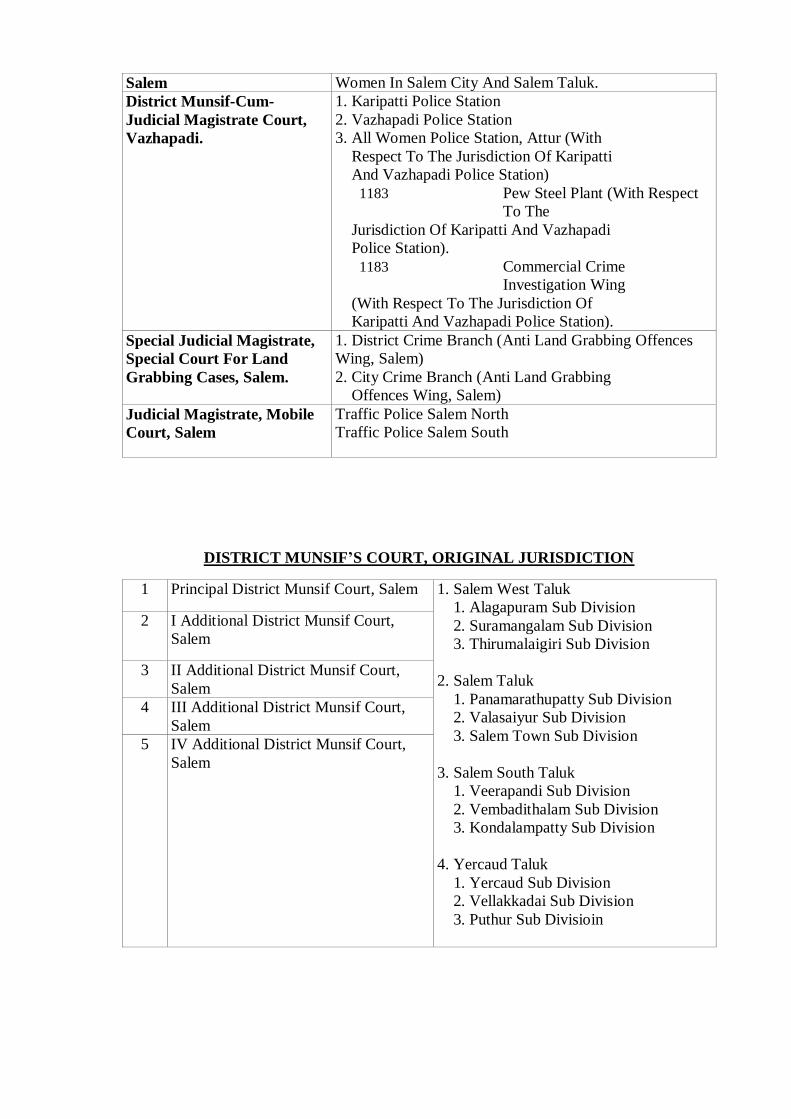
Salem Women In Salem City And Salem Taluk.
District Munsif-Cum-
Judicial Magistrate Court,
Vazhapadi.
1. Karipatti Police Station
2. Vazhapadi Police Station
3. All Women Police Station, Attur (With
Respect To The Jurisdiction Of Karipatti
And Vazhapadi Police Station)
1183 Pew Steel Plant (With Respect
To The
Jurisdiction Of Karipatti And Vazhapadi
Police Station).
1183 Commercial Crime
Investigation Wing
(With Respect To The Jurisdiction Of
Karipatti And Vazhapadi Police Station).
Special Judicial Magistrate,
Special Court For Land
Grabbing Cases, Salem.
1. District Crime Branch (Anti Land Grabbing Offences
Wing, Salem)
2. City Crime Branch (Anti Land Grabbing
Offences Wing, Salem)
Judicial Magistrate, Mobile
Court, Salem
Traffic Police Salem North
Traffic Police Salem South
DISTRICT MUNSIF’S COURT, ORIGINAL JURISDICTION
1 Principal District Munsif Court, Salem 1. Salem West Taluk
1. Alagapuram Sub Division
2. Suramangalam Sub Division
3. Thirumalaigiri Sub Division
2. Salem Taluk
1. Panamarathupatty Sub Division
2. Valasaiyur Sub Division
3. Salem Town Sub Division
3. Salem South Taluk
1. Veerapandi Sub Division
2. Vembadithalam Sub Division
3. Kondalampatty Sub Division
4. Yercaud Taluk
1. Yercaud Sub Division
2. Vellakkadai Sub Division
3. Puthur Sub Divisioin
2 I Additional District Munsif Court,
Salem
3 II Additional District Munsif Court,
Salem
4 III Additional District Munsif Court,
Salem
5 IV Additional District Munsif Court,
Salem
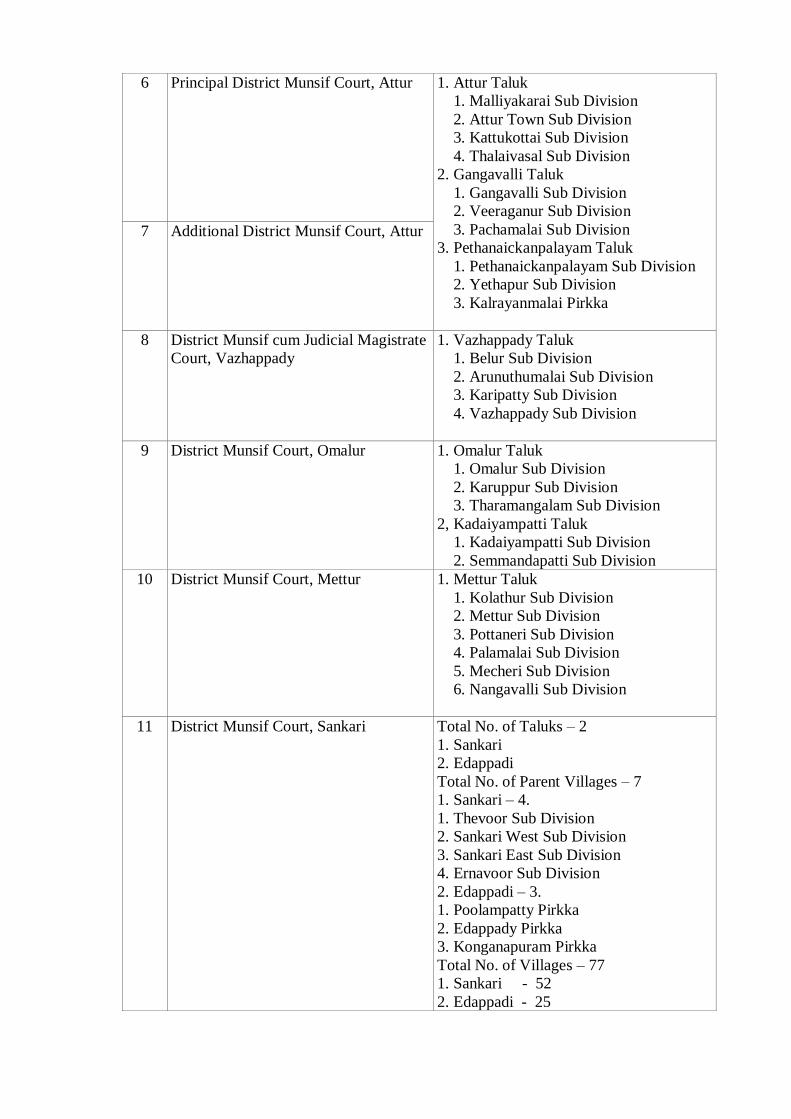
6 Principal District Munsif Court, Attur 1. Attur Taluk
1. Malliyakarai Sub Division
2. Attur Town Sub Division
3. Kattukottai Sub Division
4. Thalaivasal Sub Division
2. Gangavalli Taluk
1. Gangavalli Sub Division
2. Veeraganur Sub Division
3. Pachamalai Sub Division
3. Pethanaickanpalayam Taluk
1. Pethanaickanpalayam Sub Division
2. Yethapur Sub Division
3. Kalrayanmalai Pirkka
7 Additional District Munsif Court, Attur
8 District Munsif cum Judicial Magistrate
Court, Vazhappady
1. Vazhappady Taluk
1. Belur Sub Division
2. Arunuthumalai Sub Division
3. Karipatty Sub Division
4. Vazhappady Sub Division
9 District Munsif Court, Omalur 1. Omalur Taluk
1. Omalur Sub Division
2. Karuppur Sub Division
3. Tharamangalam Sub Division
2, Kadaiyampatti Taluk
1. Kadaiyampatti Sub Division
2. Semmandapatti Sub Division
10 District Munsif Court, Mettur 1. Mettur Taluk
1. Kolathur Sub Division
2. Mettur Sub Division
3. Pottaneri Sub Division
4. Palamalai Sub Division
5. Mecheri Sub Division
6. Nangavalli Sub Division
11 District Munsif Court, Sankari Total No. of Taluks – 2
1. Sankari
2. Edappadi
Total No. of Parent Villages – 7
1. Sankari – 4.
1. Thevoor Sub Division
2. Sankari West Sub Division
3. Sankari East Sub Division
4. Ernavoor Sub Division
2. Edappadi – 3.
1. Poolampatty Pirkka
2. Edappady Pirkka
3. Konganapuram Pirkka
Total No. of Villages – 77
1. Sankari - 52
2. Edappadi - 25
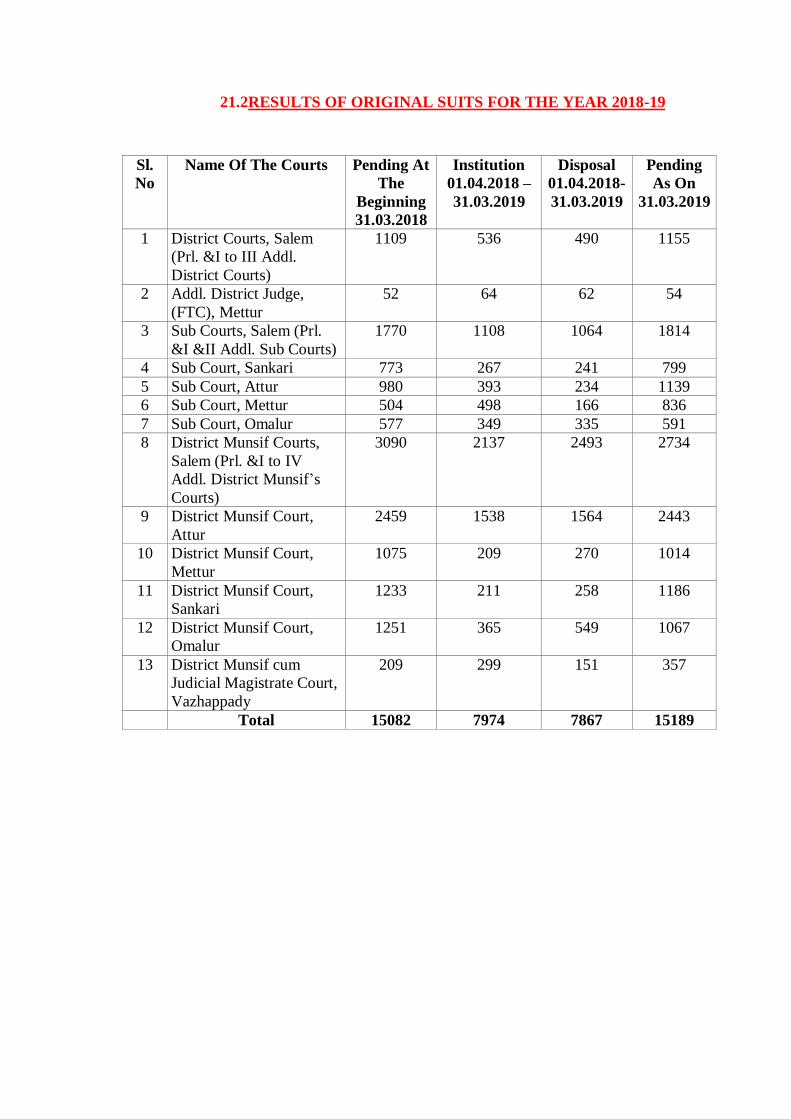
21.2RESULTS OF ORIGINAL SUITS FOR THE YEAR 2018-19
Sl.
No
Name Of The Courts Pending At
The
Beginning
31.03.2018
Institution
01.04.2018 –
31.03.2019
Disposal
01.04.2018-
31.03.2019
Pending
As On
31.03.2019
1 District Courts, Salem
(Prl. &I to III Addl.
District Courts)
1109 536 490 1155
2 Addl. District Judge,
(FTC), Mettur
52 64 62 54
3 Sub Courts, Salem (Prl.
&I &II Addl. Sub Courts)
1770 1108 1064 1814
4 Sub Court, Sankari 773 267 241 799
5 Sub Court, Attur 980 393 234 1139
6 Sub Court, Mettur 504 498 166 836
7 Sub Court, Omalur 577 349 335 591
8 District Munsif Courts,
Salem (Prl. &I to IV
Addl. District Munsif’s
Courts)
3090 2137 2493 2734
9 District Munsif Court,
Attur
2459 1538 1564 2443
10 District Munsif Court,
Mettur
1075 209 270 1014
11 District Munsif Court,
Sankari
1233 211 258 1186
12 District Munsif Court,
Omalur
1251 365 549 1067
13 District Munsif cum
Judicial Magistrate Court,
Vazhappady
209 299 151 357
Total 15082 7974 7867 15189
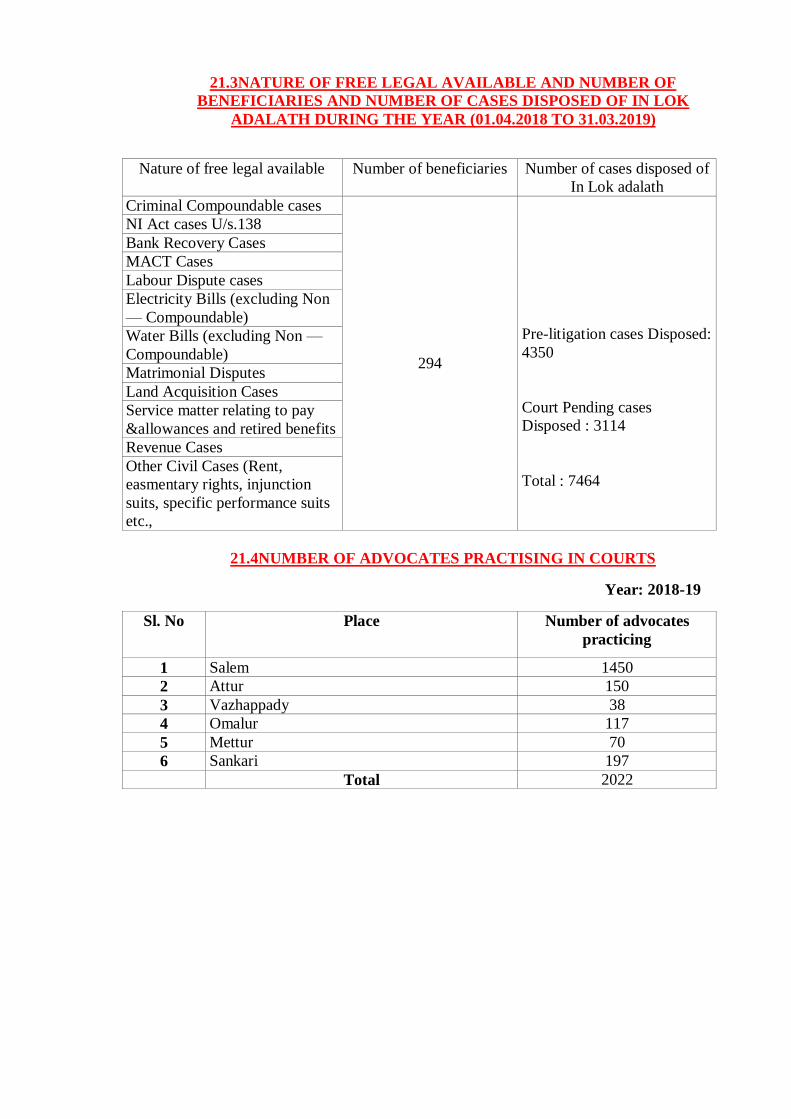
21.3NATURE OF FREE LEGAL AVAILABLE AND NUMBER OF
BENEFICIARIES AND NUMBER OF CASES DISPOSED OF IN LOK
ADALATH DURING THE YEAR (01.04.2018 TO 31.03.2019)
Nature of free legal available Number of beneficiaries Number of cases disposed of
In Lok adalath
Criminal Compoundable cases
294
Pre-litigation cases Disposed:
4350
Court Pending cases
Disposed : 3114
Total : 7464
NI Act cases U/s.138
Bank Recovery Cases
MACT Cases
Labour Dispute cases
Electricity Bills (excluding Non
— Compoundable)
Water Bills (excluding Non —
Compoundable)
Matrimonial Disputes
Land Acquisition Cases
Service matter relating to pay
&allowances and retired benefits
Revenue Cases
Other Civil Cases (Rent,
easmentary rights, injunction
suits, specific performance suits
etc.,
21.4NUMBER OF ADVOCATES PRACTISING IN COURTS
Year: 2018-19
Sl. No Place Number of advocates
practicing
1 Salem 1450
2 Attur 150
3 Vazhappady 38
4 Omalur 117
5 Mettur 70
6 Sankari 197
Total 2022
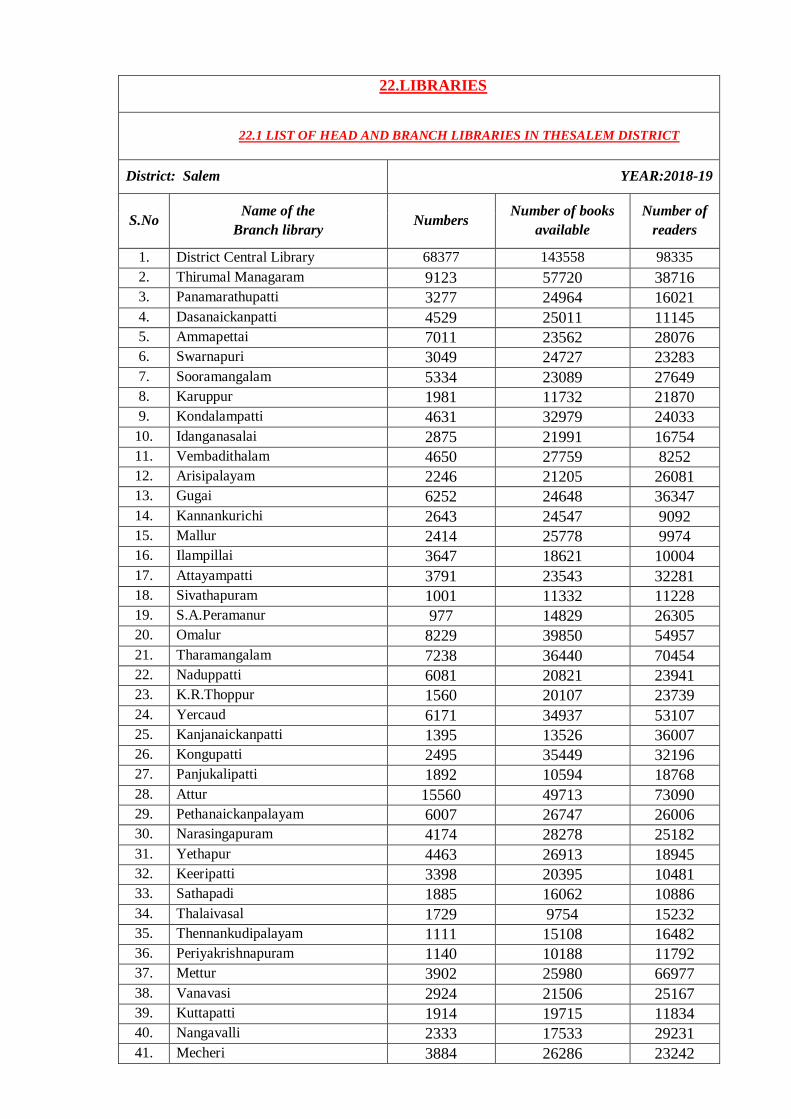
22.LIBRARIES
22.1 LIST OF HEAD AND BRANCH LIBRARIES IN THESALEM DISTRICT
District: Salem YEAR:2018-19
S.No Name of the
Branch library Numbers
Number of books
available
Number of
readers
1. District Central Library 68377 143558 98335
2. Thirumal Managaram 9123 57720 38716
3. Panamarathupatti 3277 24964 16021
4. Dasanaickanpatti 4529 25011 11145
5. Ammapettai 7011 23562 28076
6. Swarnapuri 3049 24727 23283
7. Sooramangalam 5334 23089 27649
8. Karuppur 1981 11732 21870
9. Kondalampatti 4631 32979 24033
10. Idanganasalai 2875 21991 16754
11. Vembadithalam 4650 27759 8252
12. Arisipalayam 2246 21205 26081
13. Gugai 6252 24648 36347
14. Kannankurichi 2643 24547 9092
15. Mallur 2414 25778 9974
16. Ilampillai 3647 18621 10004
17. Attayampatti 3791 23543 32281
18. Sivathapuram 1001 11332 11228
19. S.A.Peramanur 977 14829 26305
20. Omalur 8229 39850 54957
21. Tharamangalam 7238 36440 70454
22. Naduppatti 6081 20821 23941
23. K.R.Thoppur 1560 20107 23739
24. Yercaud 6171 34937 53107
25. Kanjanaickanpatti 1395 13526 36007
26. Kongupatti 2495 35449 32196
27. Panjukalipatti 1892 10594 18768
28. Attur 15560 49713 73090
29. Pethanaickanpalayam 6007 26747 26006
30. Narasingapuram 4174 28278 25182
31. Yethapur 4463 26913 18945
32. Keeripatti 3398 20395 10481
33. Sathapadi 1885 16062 10886
34. Thalaivasal 1729 9754 15232
35. Thennankudipalayam 1111 15108 16482
36. Periyakrishnapuram 1140 10188 11792
37. Mettur 3902 25980 66977
38. Vanavasi 2924 21506 25167
39. Kuttapatti 1914 19715 11834
40. Nangavalli 2333 17533 29231
41. Mecheri 3884 26286 23242
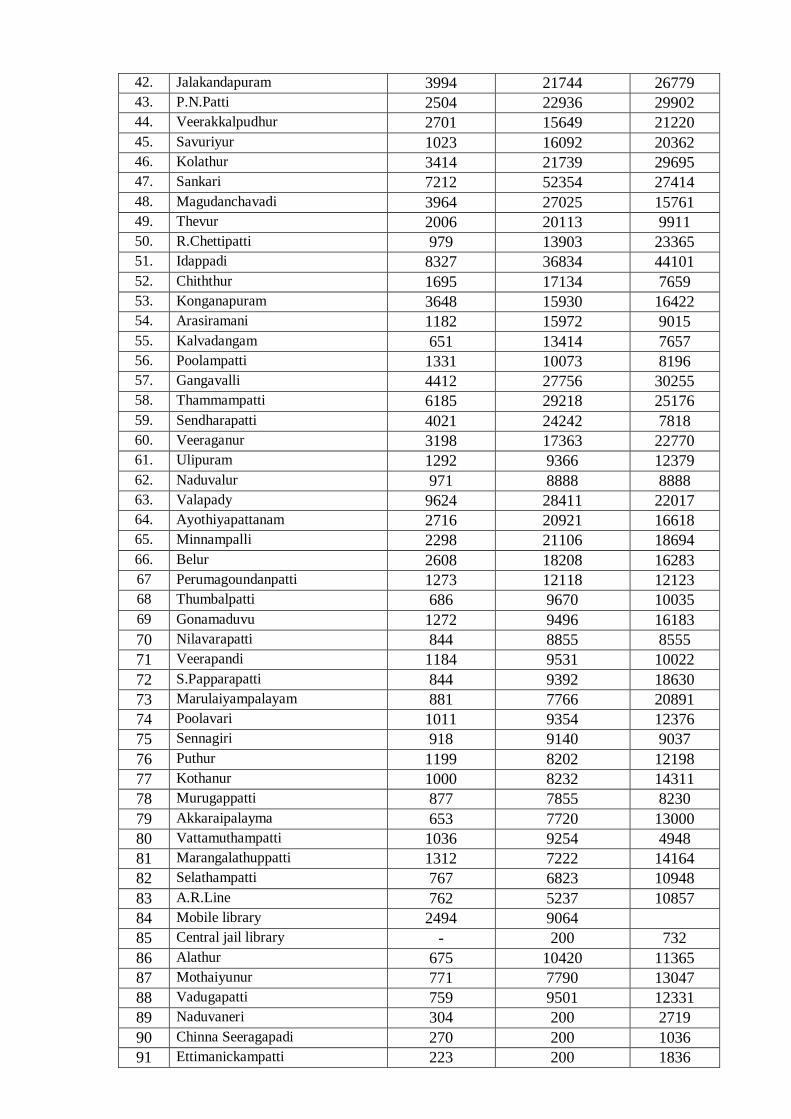
42. Jalakandapuram 3994 21744 26779
43. P.N.Patti 2504 22936 29902
44. Veerakkalpudhur 2701 15649 21220
45. Savuriyur 1023 16092 20362
46. Kolathur 3414 21739 29695
47. Sankari 7212 52354 27414
48. Magudanchavadi 3964 27025 15761
49. Thevur 2006 20113 9911
50. R.Chettipatti 979 13903 23365
51. Idappadi 8327 36834 44101
52. Chiththur 1695 17134 7659
53. Konganapuram 3648 15930 16422
54. Arasiramani 1182 15972 9015
55. Kalvadangam 651 13414 7657
56. Poolampatti 1331 10073 8196
57. Gangavalli 4412 27756 30255
58. Thammampatti 6185 29218 25176
59. Sendharapatti 4021 24242 7818
60. Veeraganur 3198 17363 22770
61. Ulipuram 1292 9366 12379
62. Naduvalur 971 8888 8888
63. Valapady 9624 28411 22017
64. Ayothiyapattanam 2716 20921 16618
65. Minnampalli 2298 21106 18694
66. Belur 2608 18208 16283
67
Perumagoundanpatti 1273 12118 12123
68
Thumbalpatti 686 9670 10035
69 Gonamaduvu 1272 9496 16183
70 Nilavarapatti 844 8855 8555
71
Veerapandi 1184 9531 10022
72 S.Papparapatti 844 9392 18630
73 Marulaiyampalayam 881 7766 20891
74 Poolavari 1011 9354 12376
75 Sennagiri 918 9140 9037
76 Puthur 1199 8202 12198
77 Kothanur 1000 8232 14311
78 Murugappatti 877 7855 8230
79 Akkaraipalayma 653 7720 13000
80 Vattamuthampatti 1036 9254 4948
81 Marangalathuppatti 1312 7222 14164
82 Selathampatti 767 6823 10948
83
A.R.Line 762 5237 10857
84
Mobile library 2494 9064
85 Central jail library - 200 732
86 Alathur 675 10420 11365
87 Mothaiyunur 771 7790 13047
88 Vadugapatti 759 9501 12331
89 Naduvaneri 304 200 2719
90 Chinna Seeragapadi 270 200 1036
91 Ettimanickampatti 223 200 1836
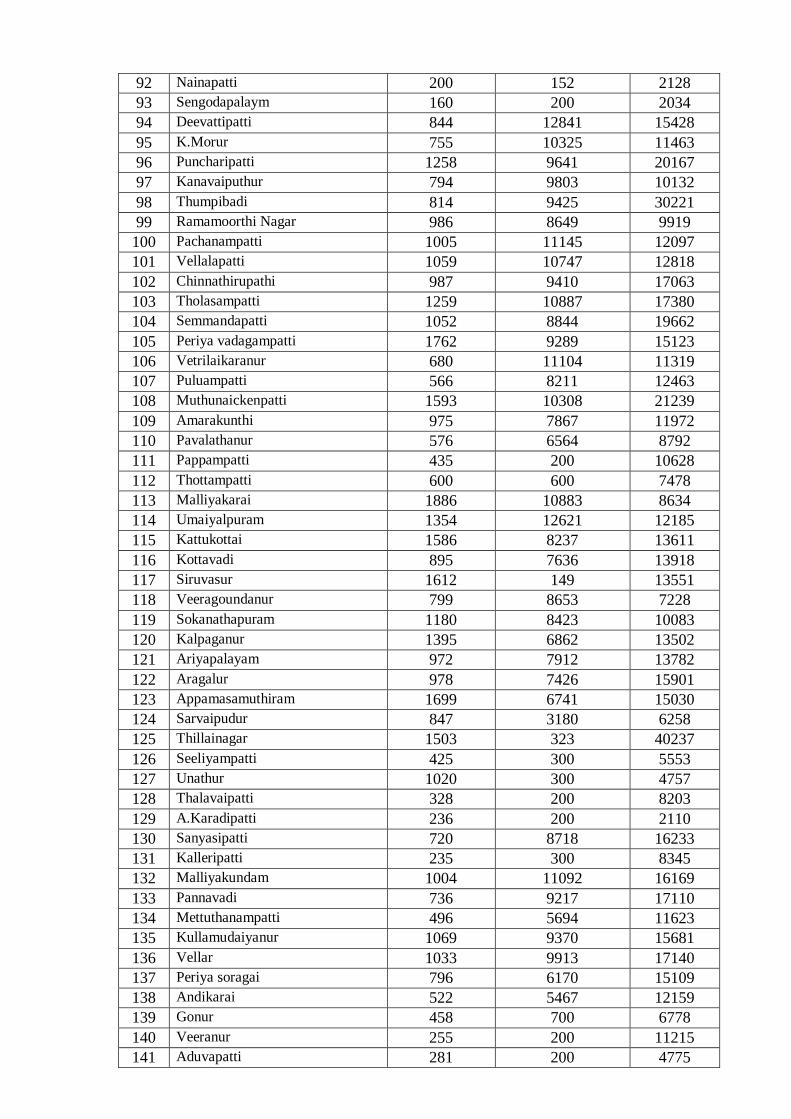
92 Nainapatti 200 152 2128
93 Sengodapalaym 160 200 2034
94 Deevattipatti 844 12841 15428
95 K.Morur 755 10325 11463
96 Puncharipatti 1258 9641 20167
97 Kanavaiputhur 794 9803 10132
98 Thumpibadi 814 9425 30221
99 Ramamoorthi Nagar 986 8649 9919
100 Pachanampatti 1005 11145 12097
101 Vellalapatti 1059 10747 12818
102 Chinnathirupathi 987 9410 17063
103 Tholasampatti 1259 10887 17380
104 Semmandapatti 1052 8844 19662
105 Periya vadagampatti 1762 9289 15123
106 Vetrilaikaranur 680 11104 11319
107 Puluampatti 566 8211 12463
108 Muthunaickenpatti 1593 10308 21239
109 Amarakunthi 975 7867 11972
110 Pavalathanur 576 6564 8792
111 Pappampatti 435 200 10628
112 Thottampatti 600 600 7478
113 Malliyakarai 1886 10883 8634
114 Umaiyalpuram 1354 12621 12185
115 Kattukottai 1586 8237 13611
116 Kottavadi 895 7636 13918
117 Siruvasur 1612 149 13551
118 Veeragoundanur 799 8653 7228
119 Sokanathapuram 1180 8423 10083
120 Kalpaganur 1395 6862 13502
121 Ariyapalayam 972 7912 13782
122 Aragalur 978 7426 15901
123 Appamasamuthiram 1699 6741 15030
124
Sarvaipudur 847 3180 6258
125
Thillainagar 1503 323 40237
126 Seeliyampatti
U
425 300 5553
127 Unathur 1020 300 4757
128 Thalavaipatti 328 200 8203
129 A.Karadipatti 236 200 2110
130 Sanyasipatti 720 8718 16233
131 Kalleripatti 235 300 8345
132
133
Malliyakundam 1004 11092 16169
133 Pannavadi 736 9217 17110
134 Mettuthanampatti 496 5694 11623
135 Kullamudaiyanur 1069 9370 15681
136 Vellar 1033 9913 17140
137 Periya soragai 796 6170 15109
138 Andikarai 522 5467 12159
139 Gonur 458 700 6778
140 Veeranur 255 200 11215
141 Aduvapatti 281 200 4775
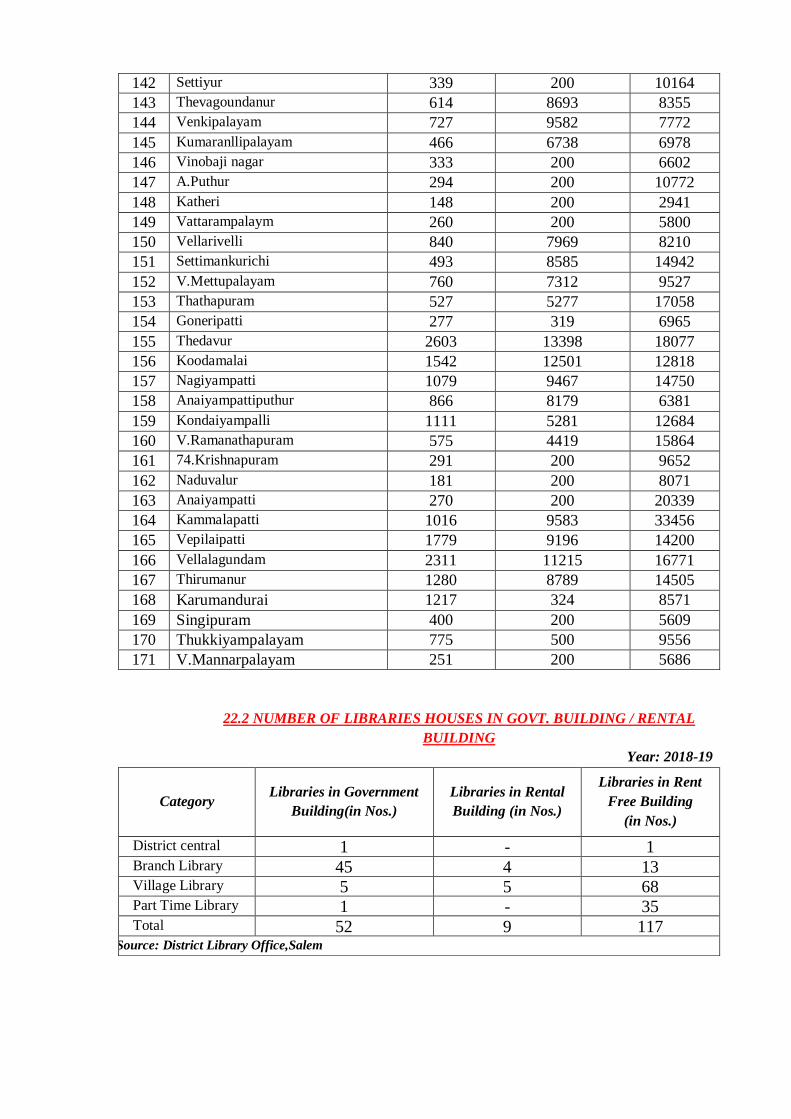
142 Settiyur 339 200 10164
143 Thevagoundanur 614 8693 8355
144 Venkipalayam 727 9582 7772
145 Kumaranllipalayam 466 6738 6978
146 Vinobaji nagar 333 200 6602
147 A.Puthur 294 200 10772
148 Katheri 148 200 2941
149 Vattarampalaym 260 200 5800
150 Vellarivelli 840 7969 8210
151 Settimankurichi 493 8585 14942
152 V.Mettupalayam 760 7312 9527
153 Thathapuram 527 5277 17058
154 Goneripatti 277 319 6965
155 Thedavur 2603 13398 18077
156 Koodamalai 1542 12501 12818
157 Nagiyampatti 1079 9467 14750
158 Anaiyampattiputhur 866 8179 6381
159 Kondaiyampalli 1111 5281 12684
160 V.Ramanathapuram 575 4419 15864
161 74.Krishnapuram 291 200 9652
162 Naduvalur 181 200 8071
163 Anaiyampatti 270 200 20339
164 Kammalapatti 1016 9583 33456
165 Vepilaipatti 1779 9196 14200
166 Vellalagundam 2311 11215 16771
167 Thirumanur 1280 8789 14505
168 Karumandurai 1217 324 8571
169 Singipuram 400 200 5609
170 Thukkiyampalayam 775 500 9556
171 V.Mannarpalayam 251 200 5686
22.2 NUMBER OF LIBRARIES HOUSES IN GOVT. BUILDING / RENTAL
BUILDING
Year: 2018-19
Category Libraries in Government
Building(in Nos.)
Libraries in Rental
Building (in Nos.)
Libraries in Rent
Free Building
(in Nos.)
District central
Library-1
1 - 1 Branch Library 45 4 13 Village Library 5 5 68 Part Time Library 1 - 35 Total 52 9 117
Source: District Library Office,Salem
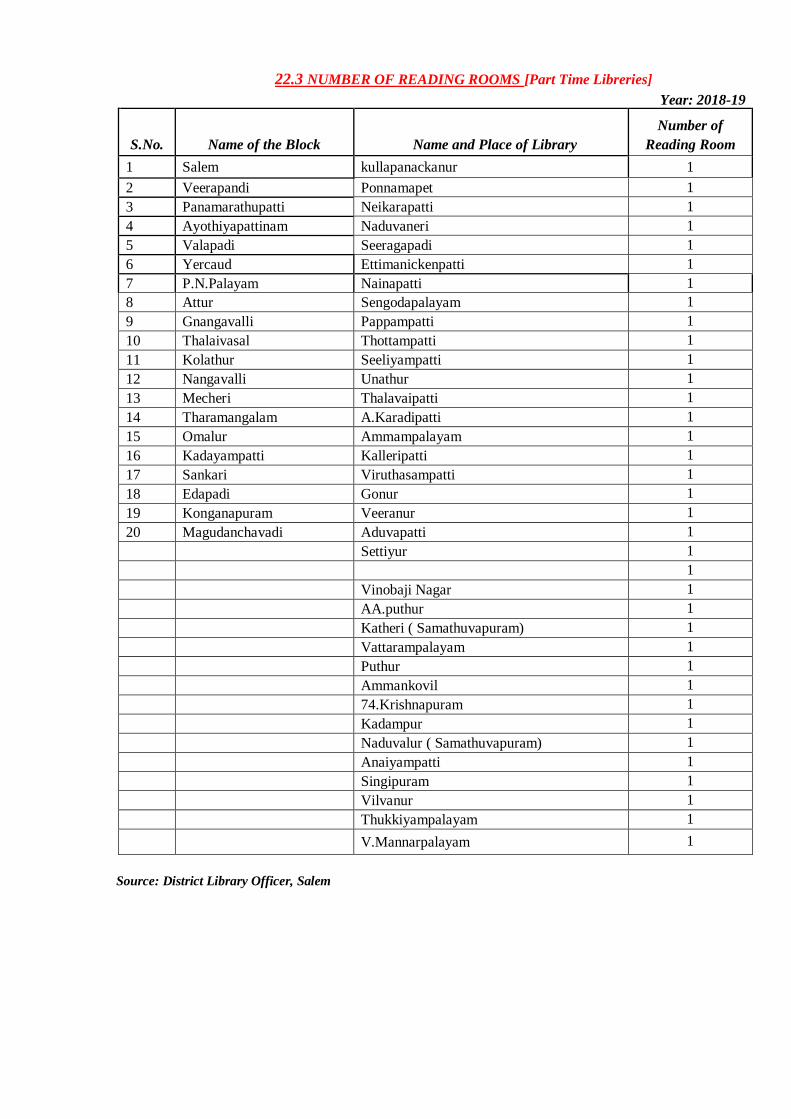
Source: District Library Officer, Salem
22.3 NUMBER OF READING ROOMS [Part Time Libreries]
Year: 2018-19
S.No. Name of the Block Name and Place of Library
Number of
Reading Room
1 Salem kullapanackanur 1
2 Veerapandi Ponnamapet 1
3 Panamarathupatti Neikarapatti 1
4 Ayothiyapattinam Naduvaneri 1
5 Valapadi Seeragapadi 1
6 Yercaud Ettimanickenpatti 1
7 P.N.Palayam Nainapatti 1
8 Attur Sengodapalayam 1
9 Gnangavalli Pappampatti 1
10 Thalaivasal Thottampatti 1
11 Kolathur Seeliyampatti 1
12 Nangavalli Unathur 1
13 Mecheri Thalavaipatti 1
14 Tharamangalam A.Karadipatti 1
15 Omalur Ammampalayam 1
16 Kadayampatti Kalleripatti 1
17 Sankari Viruthasampatti 1
18 Edapadi Gonur 1
19 Konganapuram Veeranur 1
20 Magudanchavadi Aduvapatti 1
Settiyur 1
1
Vinobaji Nagar 1
AA.puthur 1
Katheri ( Samathuvapuram) 1
Vattarampalayam 1
Puthur 1
Ammankovil 1
74.Krishnapuram 1
Kadampur 1
Naduvalur ( Samathuvapuram) 1
Anaiyampatti 1
Singipuram 1
Vilvanur 1
Thukkiyampalayam 1
V.Mannarpalayam 1
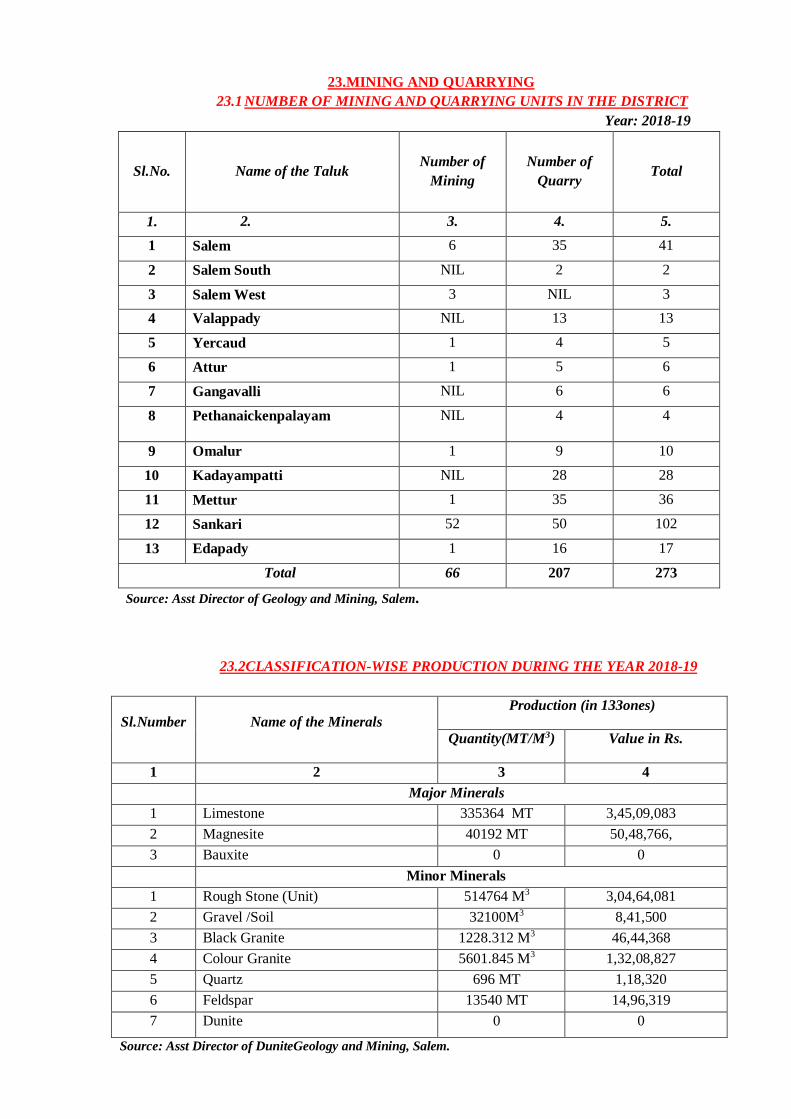
23.MINING AND QUARRYING
23.1 NUMBER OF MINING AND QUARRYING UNITS IN THE DISTRICT
Year: 2018-19
Sl.No. Name of the Taluk Number of
Mining
Number of
Quarry Total
1. 2. 3. 4. 5.
1 Salem 6 35 41
2 Salem South NIL 2 2
3 Salem West 3 NIL 3
4 Valappady NIL 13 13
5 Yercaud 1 4 5
6 Attur 1 5 6
7 Gangavalli NIL 6 6
8 Pethanaickenpalayam NIL 4 4
9 Omalur 1 9 10
10 Kadayampatti NIL 28 28
11 Mettur 1 35 36
12 Sankari 52 50 102
13 Edapady 1 16 17
Total 66 207 273
Source: Asst Director of Geology and Mining, Salem.
23.2CLASSIFICATION-WISE PRODUCTION DURING THE YEAR 2018-19
Sl.Number Name of the Minerals
Production (in 133ones)
Quantity(MT/M3) Value in Rs.
1 2 3 4
Major Minerals
1 Limestone 335364 MT 3,45,09,083
2 Magnesite 40192 MT 50,48,766,
3 Bauxite 0 0
Minor Minerals
1 Rough Stone (Unit) 514764 M3 3,04,64,081
2 Gravel /Soil 32100M3 8,41,500
3 Black Granite 1228.312 M3 46,44,368
4 Colour Granite 5601.845 M3 1,32,08,827
5 Quartz 696 MT 1,18,320
6 Feldspar 13540 MT 14,96,319
7 Dunite 0 0
Source: Asst Director of DuniteGeology and Mining, Salem.
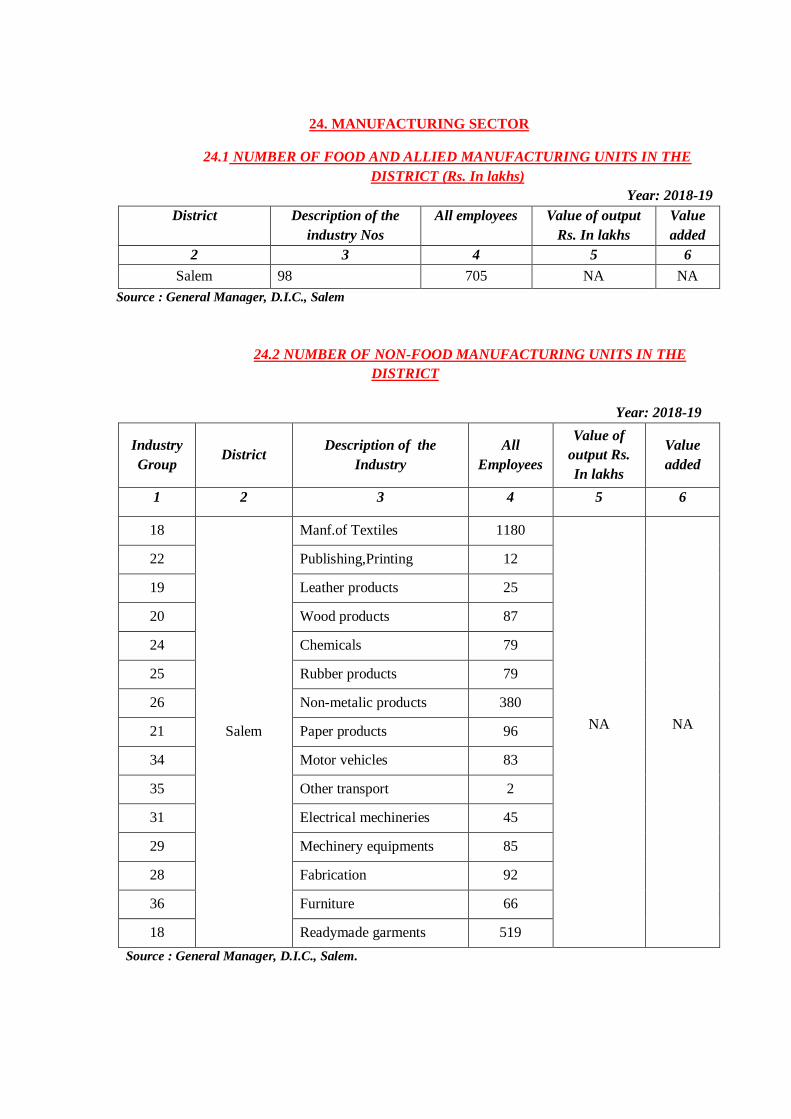
24. MANUFACTURING SECTOR
24.1 NUMBER OF FOOD AND ALLIED MANUFACTURING UNITS IN THE
DISTRICT (Rs. In lakhs)
Year: 2018-19
District Description of the
industry Nos
All employees Value of output
Rs. In lakhs
Value
added
2 3 4 5 6
Salem 98 705 NA NA
Source : General Manager, D.I.C., Salem
24.2 NUMBER OF NON-FOOD MANUFACTURING UNITS IN THE
DISTRICT
Year: 2018-19
Industry
Group District
Description of the
Industry
All
Employees
Value of
output Rs.
In lakhs
Value
added
1 2 3 4 5 6
18
Salem
Manf.of Textiles 1180
NA NA
22 Publishing,Printing 12
19 Leather products 25
20 Wood products 87
24 Chemicals 79
25 Rubber products 79
26 Non-metalic products 380
21 Paper products 96
34 Motor vehicles 83
35 Other transport 2
31 Electrical mechineries 45
29 Mechinery equipments 85
28 Fabrication 92
36 Furniture 66
18 Readymade garments 519
Source : General Manager, D.I.C., Salem.
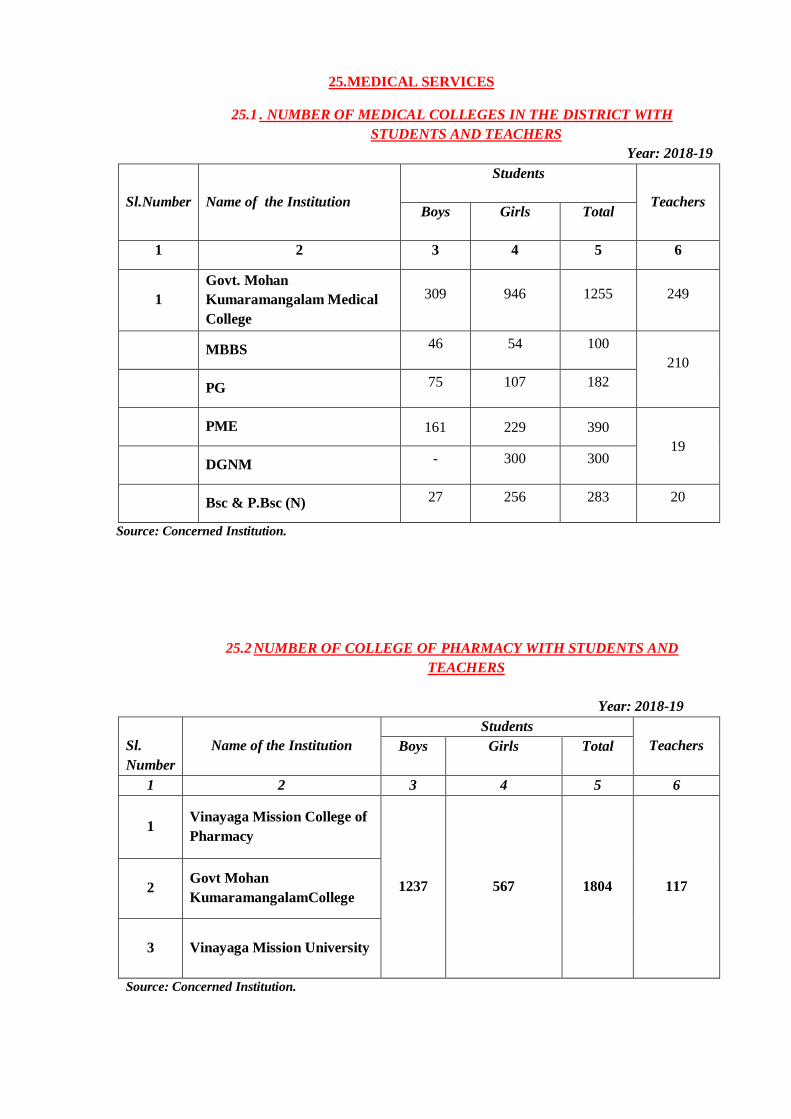
25.MEDICAL SERVICES
25.1 . NUMBER OF MEDICAL COLLEGES IN THE DISTRICT WITH
STUDENTS AND TEACHERS
Year: 2018-19
Sl.Number Name of the Institution
Students
Teachers Boys Girls Total
1 2 3 4 5 6
1
Govt. Mohan
Kumaramangalam Medical
College
309 946 1255 249
MBBS 46 54 100
210
PG 75 107 182
PME 161 229 390
19
DGNM - 300 300
Bsc & P.Bsc (N) 27 256 283 20
Source: Concerned Institution.
25.2 NUMBER OF COLLEGE OF PHARMACY WITH STUDENTS AND
TEACHERS
Year: 2018-19
Sl.
Number
Name of the Institution
Students
Teachers Boys Girls Total
1 2 3 4 5 6
1 Vinayaga Mission College of
Pharmacy
1237 567 1804 117 2 Govt Mohan
KumaramangalamCollege
3 Vinayaga Mission University
Source: Concerned Institution.
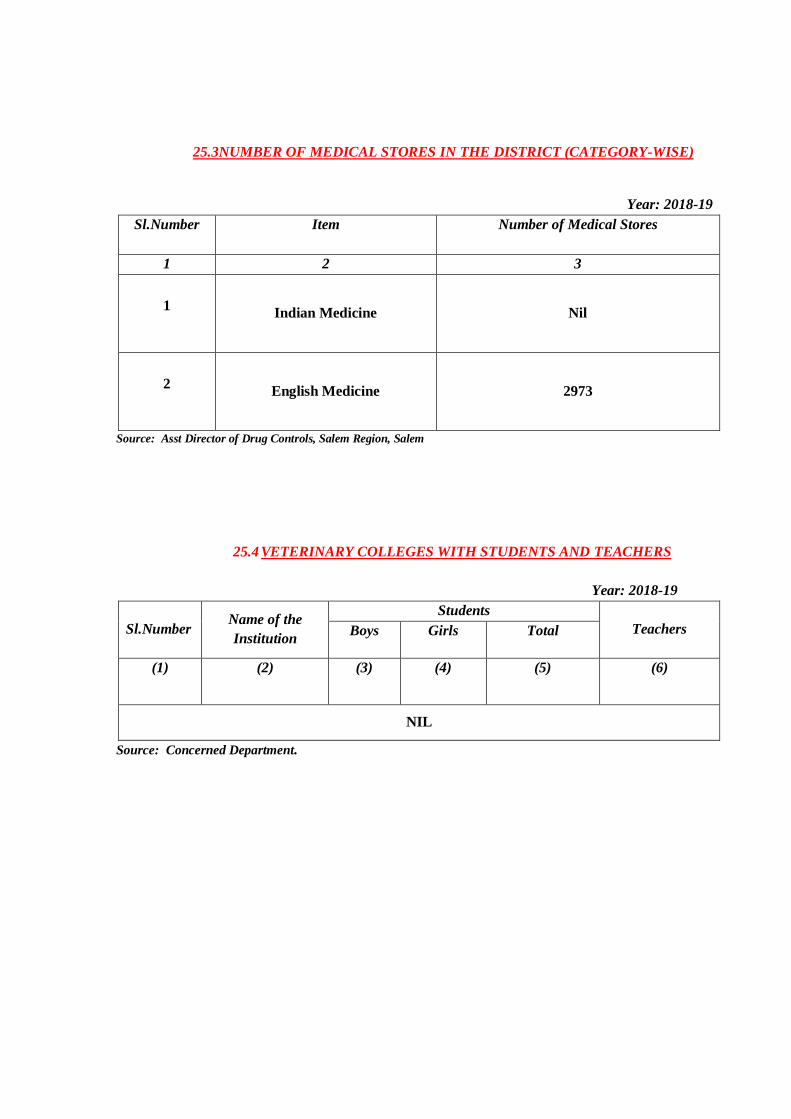
25.3NUMBER OF MEDICAL STORES IN THE DISTRICT (CATEGORY-WISE)
Year: 2018-19
Sl.Number
Item
Number of Medical Stores
1 2 3
1 Indian Medicine Nil
2 English Medicine 2973
Source: Asst Director of Drug Controls, Salem Region, Salem
25.4 VETERINARY COLLEGES WITH STUDENTS AND TEACHERS
Year: 2018-19
Sl.Number Name of the
Institution
Students
Teachers Boys Girls Total
(1) (2) (3) (4) (5) (6)
NIL
Source: Concerned Department.
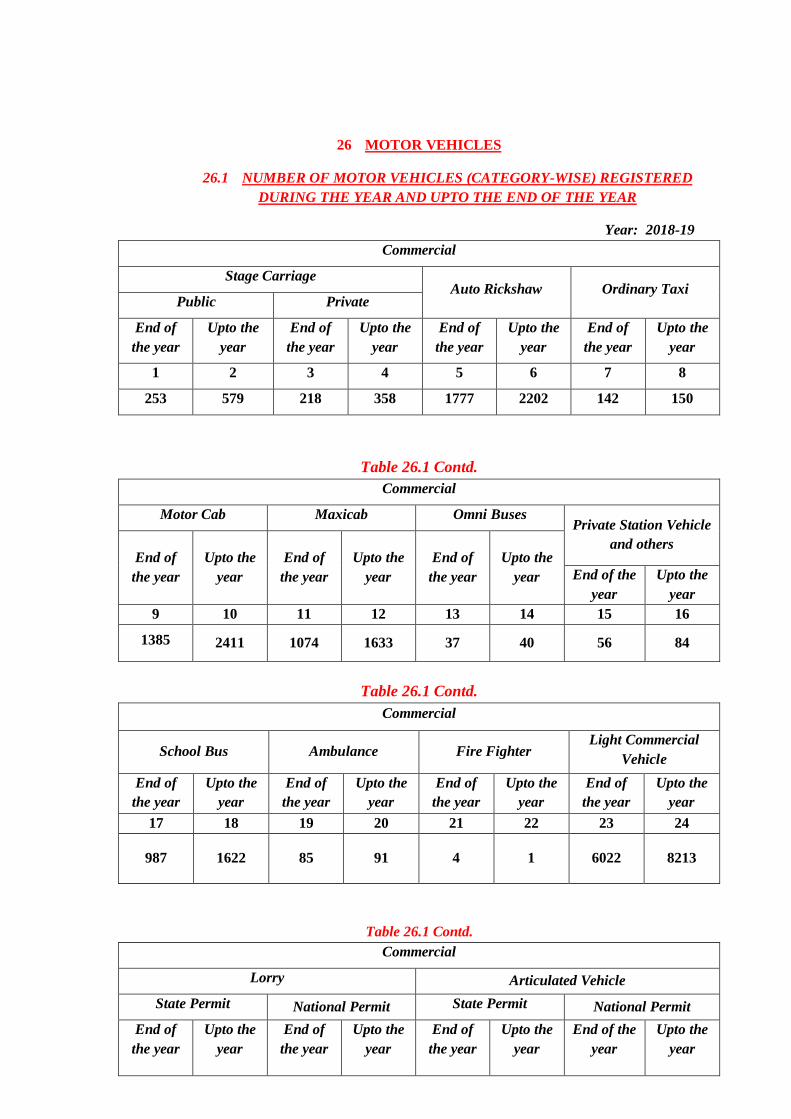
26 MOTOR VEHICLES
26.1 NUMBER OF MOTOR VEHICLES (CATEGORY-WISE) REGISTERED
DURING THE YEAR AND UPTO THE END OF THE YEAR
Year: 2018-19
Commercial
Stage Carriage Auto Rickshaw Ordinary Taxi
Public Private
End of
the year
Upto the
year
End of
the year
Upto the
year
End of
the year
Upto the
year
End of
the year
Upto the
year
1 2 3 4 5 6 7 8
253 579 218 358 1777 2202 142 150
Table 26.1 Contd.
Commercial
Motor Cab Maxicab Omni Buses Private Station Vehicle
and others End of
the year
Upto the
year
End of
the year
Upto the
year
End of
the year
Upto the
year End of the
year
Upto the
year
9 10 11 12 13 14 15 16
1385 2411 1074 1633 37 40 56 84
Table 26.1 Contd.
Commercial
School Bus Ambulance Fire Fighter Light Commercial
Vehicle
End of
the year
Upto the
year
End of
the year
Upto the
year
End of
the year
Upto the
year
End of
the year
Upto the
year
17 18 19 20 21 22 23 24
987 1622 85 91 4 1 6022 8213
Table 26.1 Contd.
Commercial
Lorry Articulated Vehicle
State Permit National Permit State Permit National Permit
End of
the year
Upto the
year
End of
the year
Upto the
year
End of
the year
Upto the
year
End of the
year
Upto the
year
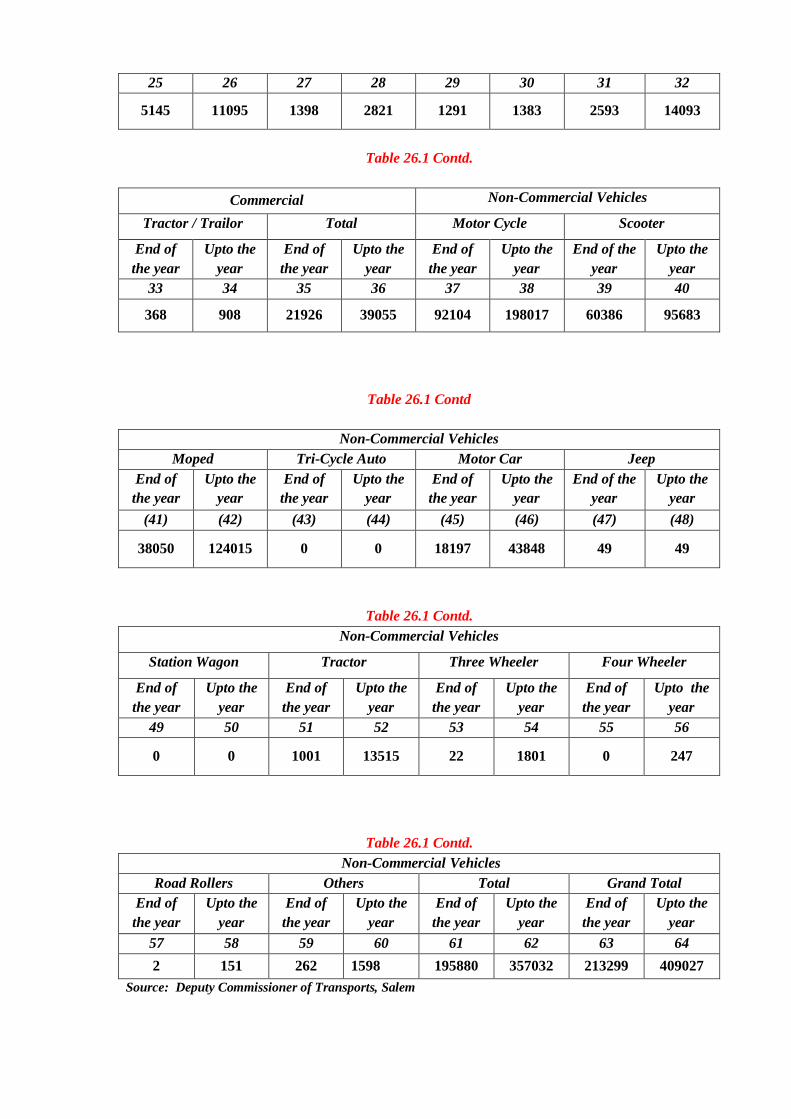
25 26 27 28 29 30 31 32
5145 11095 1398 2821 1291 1383 2593 14093
Table 26.1 Contd.
Commercial Non-Commercial Vehicles
Tractor / Trailor Total Motor Cycle Scooter
End of
the year
Upto the
year
End of
the year
Upto the
year
End of
the year
Upto the
year
End of the
year
Upto the
year
33 34 35 36 37 38 39 40
368 908 21926 39055 92104 198017 60386 95683
Table 26.1 Contd
Non-Commercial Vehicles
Moped Tri-Cycle Auto Motor Car Jeep
End of
the year
Upto the
year
End of
the year
Upto the
year
End of
the year
Upto the
year
End of the
year
Upto the
year
(41) (42) (43) (44) (45) (46) (47) (48)
38050 124015 0 0 18197 43848 49 49
Table 26.1 Contd.
Non-Commercial Vehicles
Station Wagon Tractor Three Wheeler Four Wheeler
End of
the year
Upto the
year
End of
the year
Upto the
year
End of
the year
Upto the
year
End of
the year
Upto the
year
49 50 51 52 53 54 55 56
0 0 1001 13515 22 1801 0 247
Table 26.1 Contd.
Non-Commercial Vehicles
Road Rollers Others Total Grand Total
End of
the year
Upto the
year
End of
the year
Upto the
year
End of
the year
Upto the
year
End of
the year
Upto the
year
57 58 59 60 61 62 63 64
2 151 262 1598 195880 357032 213299 409027
Source: Deputy Commissioner of Transports, Salem
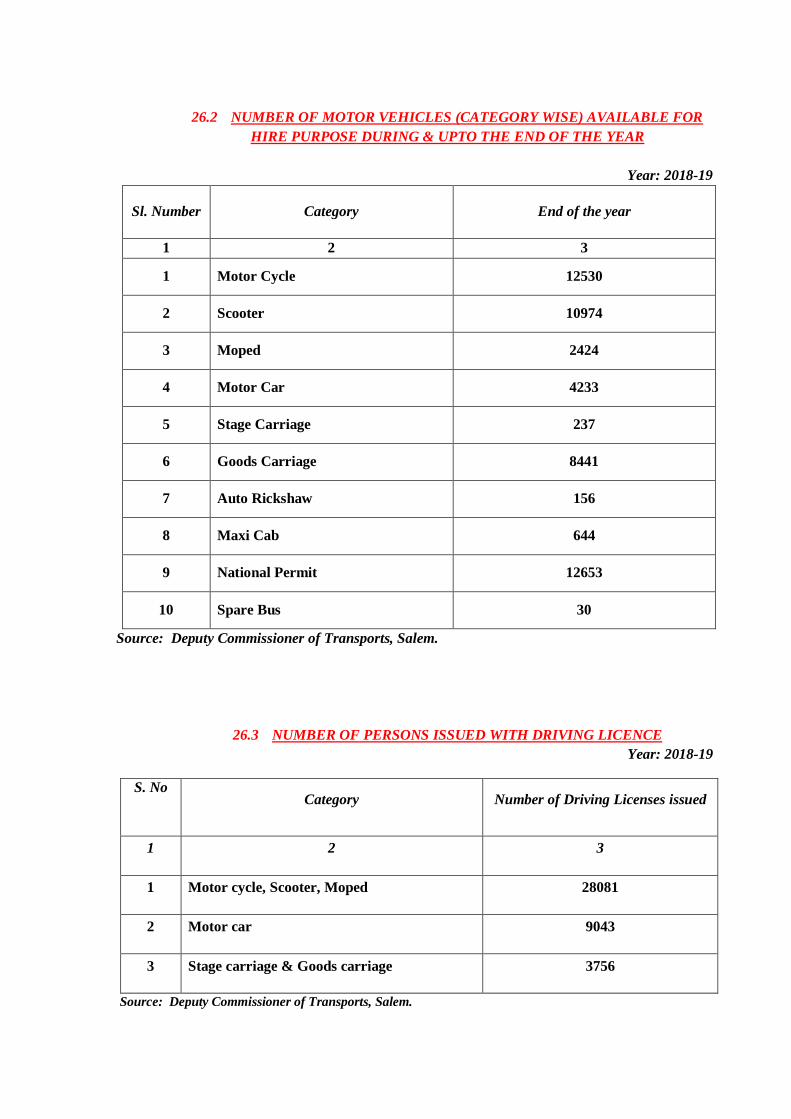
26.2 NUMBER OF MOTOR VEHICLES (CATEGORY WISE) AVAILABLE FOR
HIRE PURPOSE DURING & UPTO THE END OF THE YEAR
Year: 2018-19
Sl. Number Category End of the year
1 2 3
1 Motor Cycle 12530
2 Scooter 10974
3 Moped 2424
4 Motor Car 4233
5 Stage Carriage 237
6 Goods Carriage 8441
7 Auto Rickshaw 156
8 Maxi Cab 644
9 National Permit 12653
10 Spare Bus 30
Source: Deputy Commissioner of Transports, Salem.
26.3 NUMBER OF PERSONS ISSUED WITH DRIVING LICENCE
Year: 2018-19
S. No
Category Number of Driving Licenses issued
1 2 3
1 Motor cycle, Scooter, Moped 28081
2 Motor car 9043
3 Stage carriage & Goods carriage 3756
Source: Deputy Commissioner of Transports, Salem.
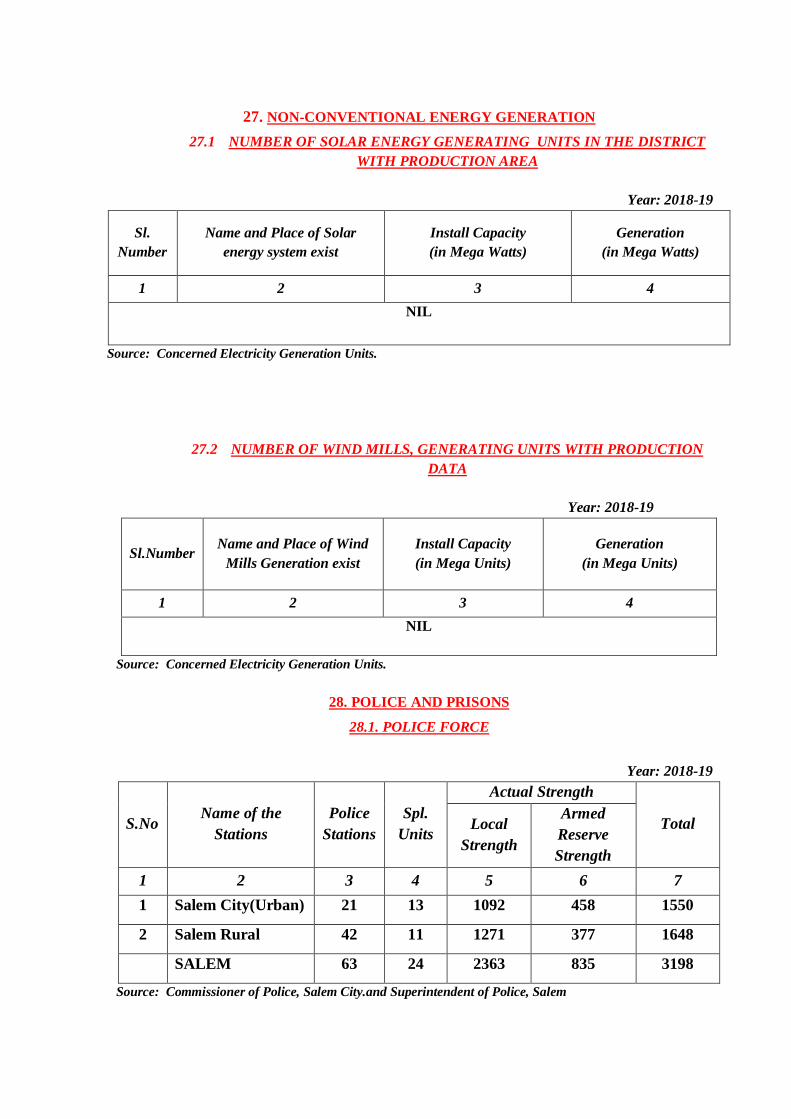
27. NON-CONVENTIONAL ENERGY GENERATION
27.1 NUMBER OF SOLAR ENERGY GENERATING UNITS IN THE DISTRICT
WITH PRODUCTION AREA
Year: 2018-19
Sl.
Number
Name and Place of Solar
energy system exist
Install Capacity
(in Mega Watts)
Generation
(in Mega Watts)
1 2 3 4
NIL
Source: Concerned Electricity Generation Units.
27.2 NUMBER OF WIND MILLS, GENERATING UNITS WITH PRODUCTION
DATA
Year: 2018-19
Sl.Number Name and Place of Wind
Mills Generation exist
Install Capacity
(in Mega Units)
Generation
(in Mega Units)
1 2 3 4
NIL
Source: Concerned Electricity Generation Units.
28. POLICE AND PRISONS
28.1. POLICE FORCE
Year: 2018-19
S.No
Name of the
Stations
Police
Stations
Spl.
Units
Actual Strength
Total Local
Strength
Armed
Reserve
Strength
1 2 3 4 5 6 7
1 Salem City(Urban) 21 13 1092 458 1550
2 Salem Rural 42 11 1271 377 1648
SALEM 63 24 2363 835 3198
Source: Commissioner of Police, Salem City.and Superintendent of Police, Salem
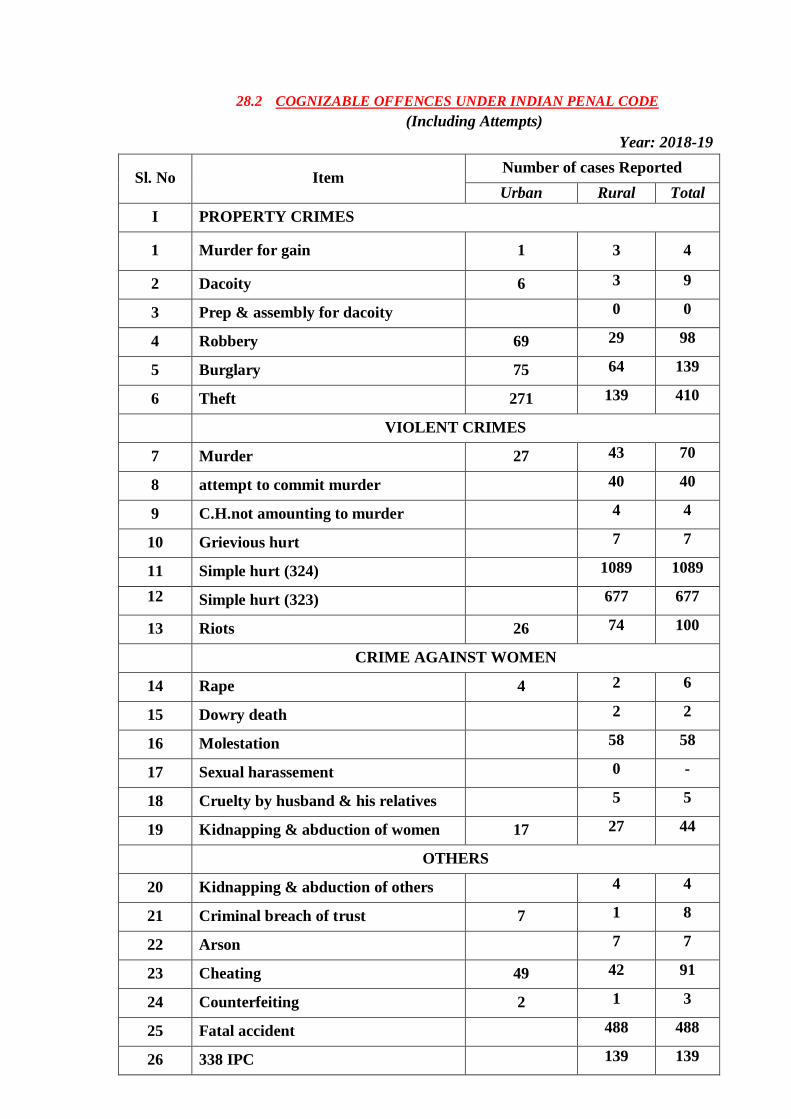
28.2 COGNIZABLE OFFENCES UNDER INDIAN PENAL CODE
(Including Attempts)
Year: 2018-19
Sl. No Item Number of cases Reported
Urban
Rural Total
I PROPERTY CRIMES
1 Murder for gain 1 3 4
2 Dacoity 6 3 9
3 Prep & assembly for dacoity 0 0
4 Robbery 69 29 98
5 Burglary 75 64 139
6 Theft 271 139 410
VIOLENT CRIMES
7 Murder 27 43 70
8 attempt to commit murder 40 40
9 C.H.not amounting to murder 4 4
10 Grievious hurt 7 7
11 Simple hurt (324) 1089 1089
12
Simple hurt (323) 677 677
13 Riots 26 74 100
CRIME AGAINST WOMEN
14 Rape 4 2 6
15 Dowry death 2 2
16 Molestation 58 58
17 Sexual harassement 0 -
18 Cruelty by husband & his relatives 5 5
19 Kidnapping & abduction of women 17 27 44
OTHERS
20 Kidnapping & abduction of others 4 4
21 Criminal breach of trust 7 1 8
22 Arson 7 7
23 Cheating 49 42 91
24 Counterfeiting 2 1 3
25 Fatal accident 488 488
26 338 IPC 139 139
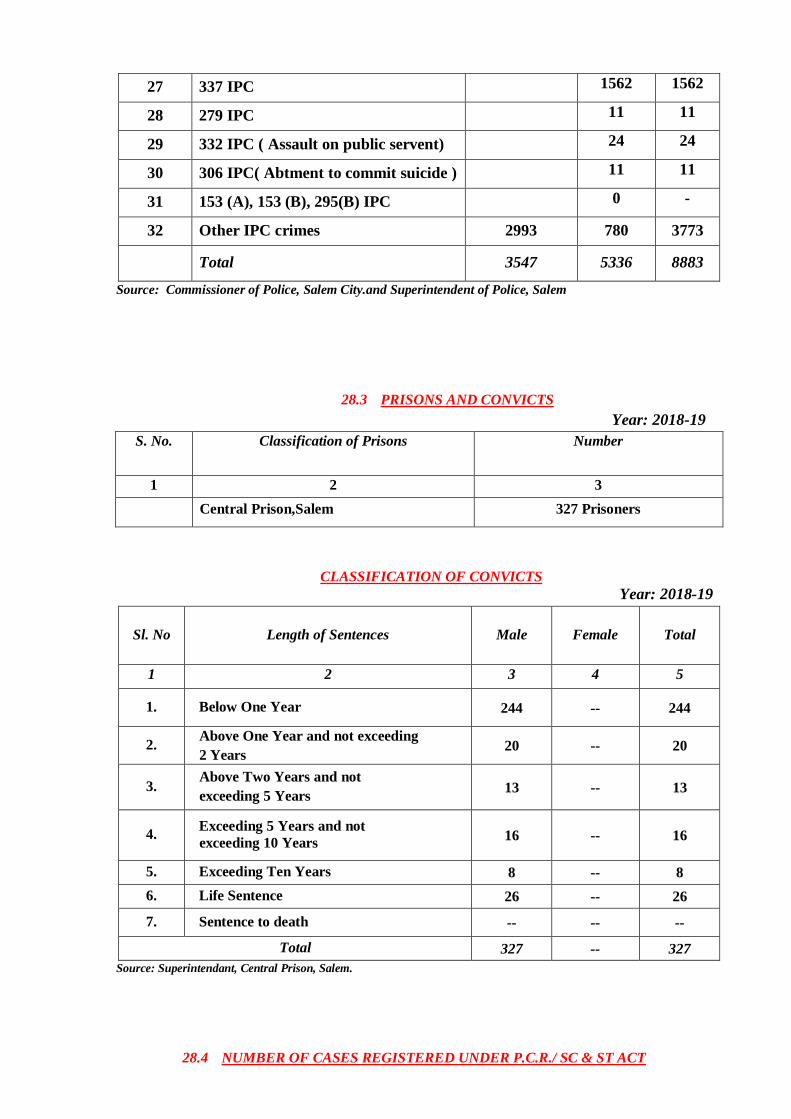
27 337 IPC 1562 1562
28 279 IPC 11 11
29 332 IPC ( Assault on public servent) 24 24
30 306 IPC( Abtment to commit suicide ) 11 11
31 153 (A), 153 (B), 295(B) IPC 0 -
32 Other IPC crimes 2993 780 3773
Total 3547 5336 8883
Source: Commissioner of Police, Salem City.and Superintendent of Police, Salem
28.3 PRISONS AND CONVICTS
Year: 2018-19
S. No.
Classification of Prisons
Number
1 2 3
Central Prison,Salem 327 Prisoners
CLASSIFICATION OF CONVICTS
Year: 2018-19
Sl. No
Length of Sentences
Male
Female Total
1 2 3 4 5
1. Below One Year 244 -- 244
2. Above One Year and not exceeding
2 Years 20 -- 20
3. Above Two Years and not
exceeding 5 Years 13 -- 13
4. Exceeding 5 Years and not
exceeding 10 Years 16 -- 16
5. Exceeding Ten Years 8 -- 8
6. Life Sentence 26 -- 26
7. Sentence to death -- -- --
Total 327 -- 327
Source: Superintendant, Central Prison, Salem.
28.4 NUMBER OF CASES REGISTERED UNDER P.C.R./ SC & ST ACT
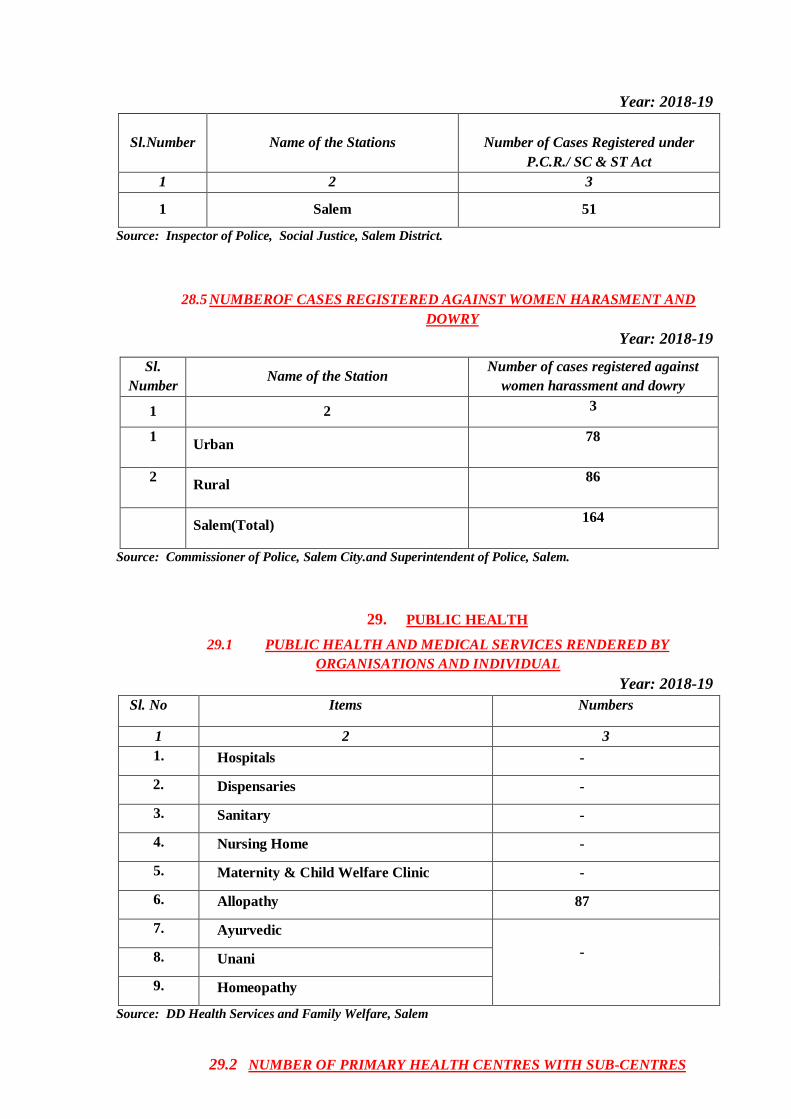
Year: 2018-19
Sl.Number
Name of the Stations
Number of Cases Registered under
P.C.R./ SC & ST Act
1 2 3
1 Salem 51
Source: Inspector of Police, Social Justice, Salem District.
28.5 NUMBEROF CASES REGISTERED AGAINST WOMEN HARASMENT AND
DOWRY
Year: 2018-19
Sl.
Number Name of the Station
Number of cases registered against
women harassment and dowry
1 2 3
1 Urban
78
2 Rural
86
Salem(Total)
164
Source: Commissioner of Police, Salem City.and Superintendent of Police, Salem.
29. PUBLIC HEALTH
29.1 PUBLIC HEALTH AND MEDICAL SERVICES RENDERED BY
ORGANISATIONS AND INDIVIDUAL
Year: 2018-19
Sl. No
Items
Numbers
1 2 3
1. Hospitals -
2. Dispensaries -
3. Sanitary -
4. Nursing Home -
5. Maternity & Child Welfare Clinic -
6. Allopathy 87
7. Ayurvedic
- 8. Unani
9. Homeopathy
Source: DD Health Services and Family Welfare, Salem
29.2 NUMBER OF PRIMARY HEALTH CENTRES WITH SUB-CENTRES
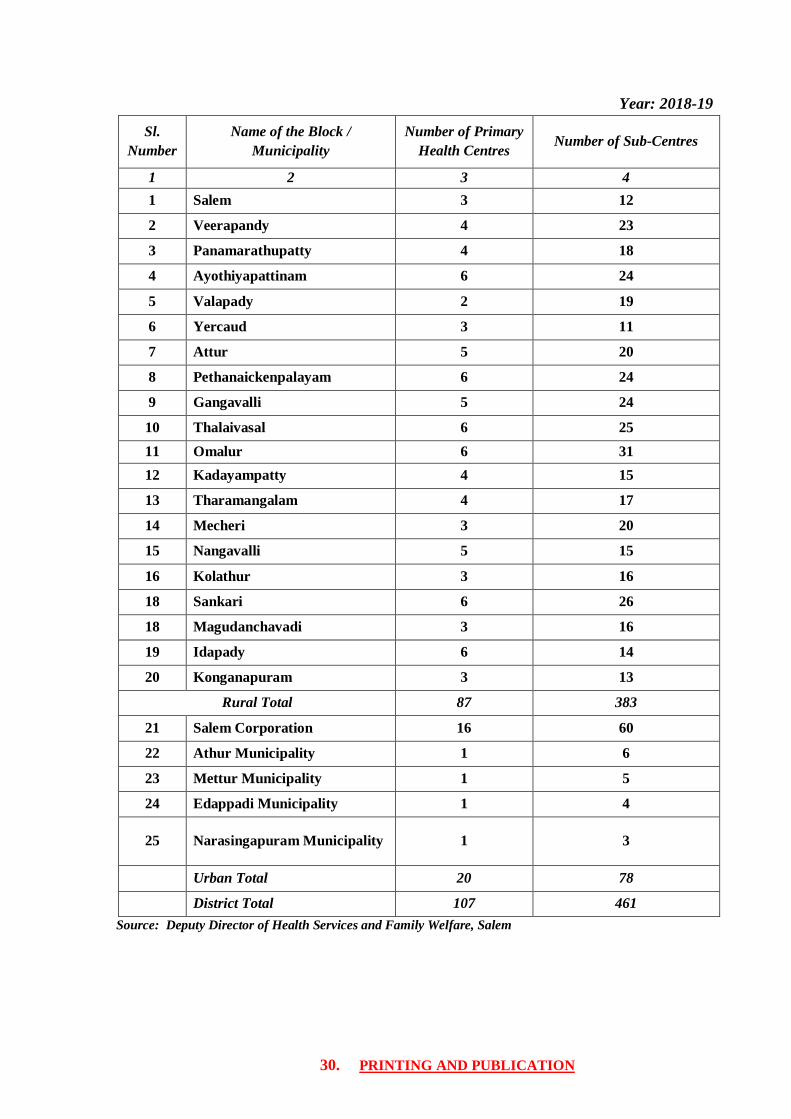
Year: 2018-19
Sl.
Number
Name of the Block /
Municipality
Number of Primary
Health Centres Number of Sub-Centres
1 2 3 4
1 Salem 3 12
2 Veerapandy 4 23
3 Panamarathupatty 4 18
4 Ayothiyapattinam 6 24
5 Valapady 2 19
6 Yercaud 3 11
7 Attur 5 20
8 Pethanaickenpalayam 6 24
9 Gangavalli 5 24
10 Thalaivasal 6 25
11 Omalur 6 31
12 Kadayampatty 4 15
13 Tharamangalam 4 17
14 Mecheri 3 20
15 Nangavalli 5 15
16 Kolathur 3 16
18 Sankari 6 26
18 Magudanchavadi 3 16
19 Idapady 6 14
20 Konganapuram 3 13
Rural Total 87 383
21 Salem Corporation 16 60
22 Athur Municipality 1 6
23 Mettur Municipality 1 5
24 Edappadi Municipality 1 4
25 Narasingapuram Municipality 1 3
Urban Total 20 78
District Total 107 461
Source: Deputy Director of Health Services and Family Welfare, Salem
30. PRINTING AND PUBLICATION
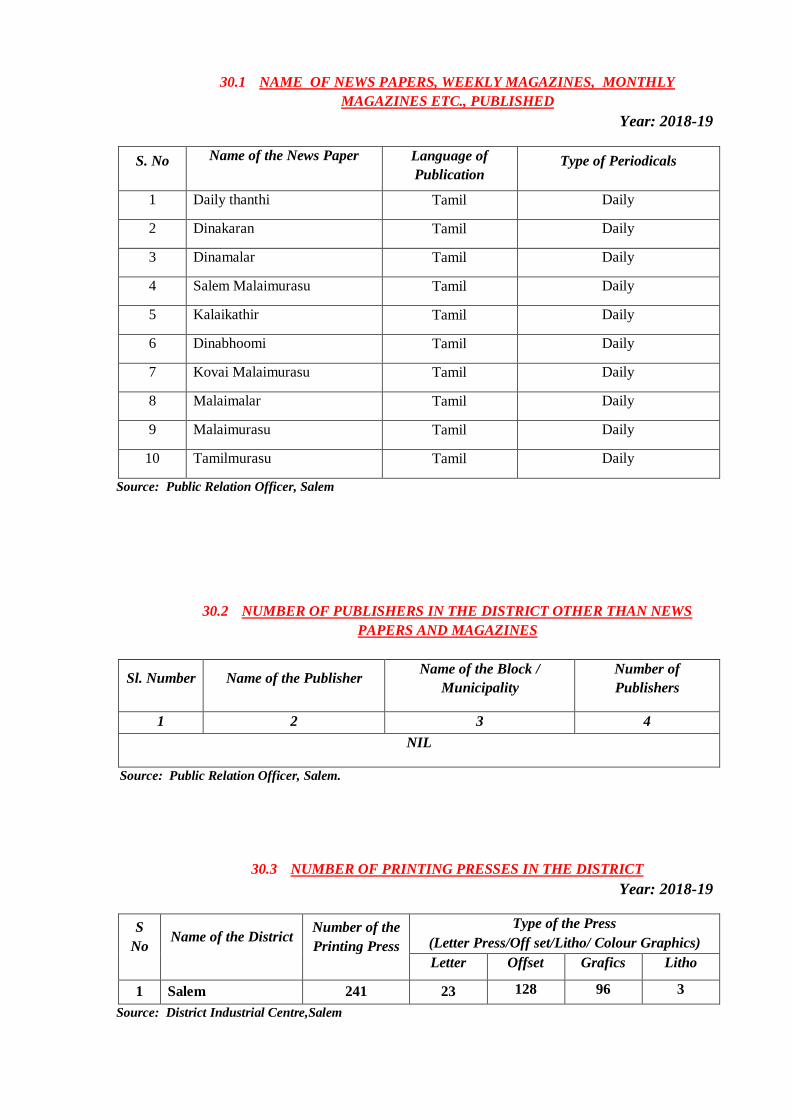
30.1 NAME OF NEWS PAPERS, WEEKLY MAGAZINES, MONTHLY
MAGAZINES ETC., PUBLISHED
Year: 2018-19
S. No Name of the News Paper
Language of
Publication Type of Periodicals
1 Daily thanthi Tamil
Daily
2 Dinakaran Tamil
Daily
3 Dinamalar Tamil
Daily
4 Salem Malaimurasu Tamil
Daily
5 Kalaikathir Tamil
Daily
6 Dinabhoomi Tamil
Daily
7 Kovai Malaimurasu Tamil
Daily
8 Malaimalar Tamil
Daily
9 Malaimurasu Tamil
Daily
10 Tamilmurasu Tamil
Daily
Source: Public Relation Officer, Salem
30.2 NUMBER OF PUBLISHERS IN THE DISTRICT OTHER THAN NEWS
PAPERS AND MAGAZINES
Sl. Number Name of the Publisher Name of the Block /
Municipality
Number of
Publishers
1 2 3 4
NIL
Source: Public Relation Officer, Salem.
30.3 NUMBER OF PRINTING PRESSES IN THE DISTRICT
Year: 2018-19
S
No
Name of the District
Number of the
Printing Press
Type of the Press
(Letter Press/Off set/Litho/ Colour Graphics)
Letter
press
Offset Grafics Litho
1 Salem 241 23 128 96 3
Source: District Industrial Centre,Salem
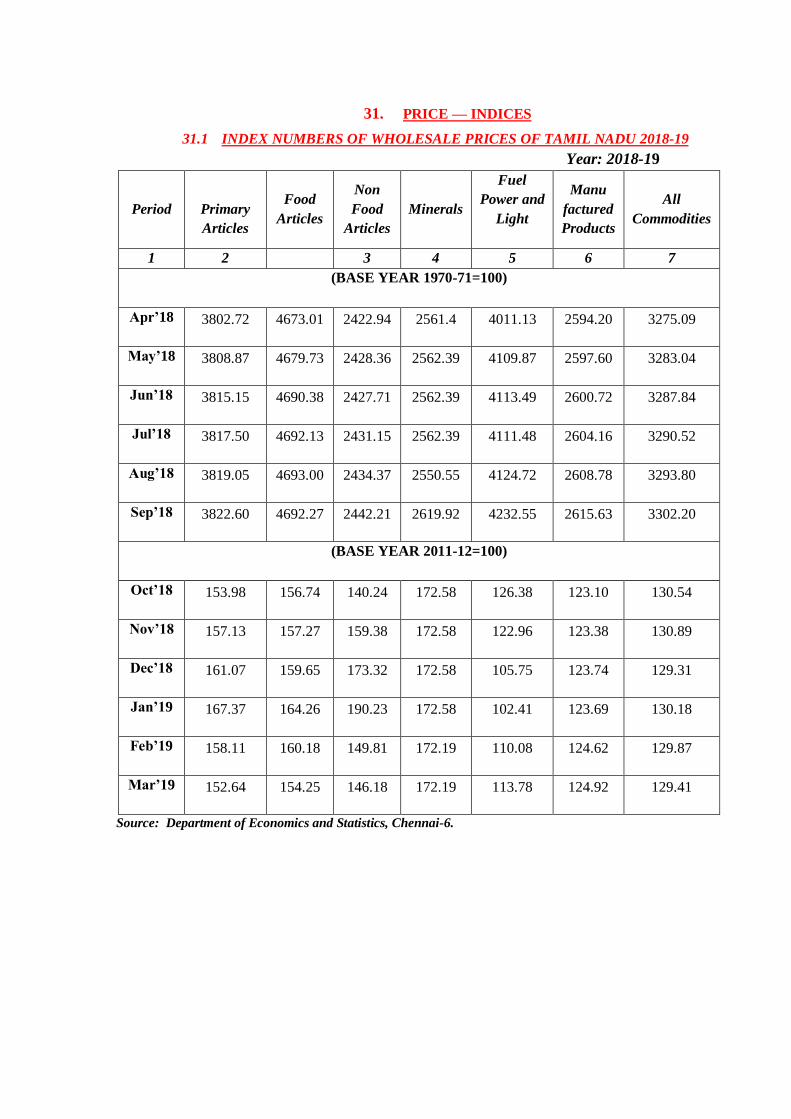
31. PRICE — INDICES
31.1 INDEX NUMBERS OF WHOLESALE PRICES OF TAMIL NADU 2018-19
Year: 2018-19
Period
Primary
Articles
Food
Articles
Non
Food
Articles
Minerals
Fuel
Power and
Light
Manu
factured
Products
All
Commodities
1 2 3 4 5 6 7
(BASE YEAR 1970-71=100)
Apr’18 3802.72 4673.01 2422.94 2561.4 4011.13 2594.20 3275.09
May’18 3808.87 4679.73 2428.36 2562.39 4109.87 2597.60 3283.04
Jun’18 3815.15 4690.38 2427.71 2562.39 4113.49 2600.72 3287.84
Jul’18 3817.50 4692.13 2431.15 2562.39 4111.48 2604.16 3290.52
Aug’18 3819.05 4693.00 2434.37 2550.55 4124.72 2608.78 3293.80
Sep’18 3822.60 4692.27 2442.21 2619.92 4232.55 2615.63 3302.20
(BASE YEAR 2011-12=100)
Oct’18 153.98 156.74 140.24 172.58 126.38 123.10 130.54
Nov’18 157.13 157.27 159.38 172.58 122.96 123.38 130.89
Dec’18 161.07 159.65 173.32 172.58 105.75 123.74 129.31
Jan’19 167.37 164.26 190.23 172.58 102.41 123.69 130.18
Feb’19 158.11 160.18 149.81 172.19 110.08 124.62 129.87
Mar’19 152.64 154.25 146.18 172.19 113.78 124.92 129.41
Source: Department of Economics and Statistics, Chennai-6.
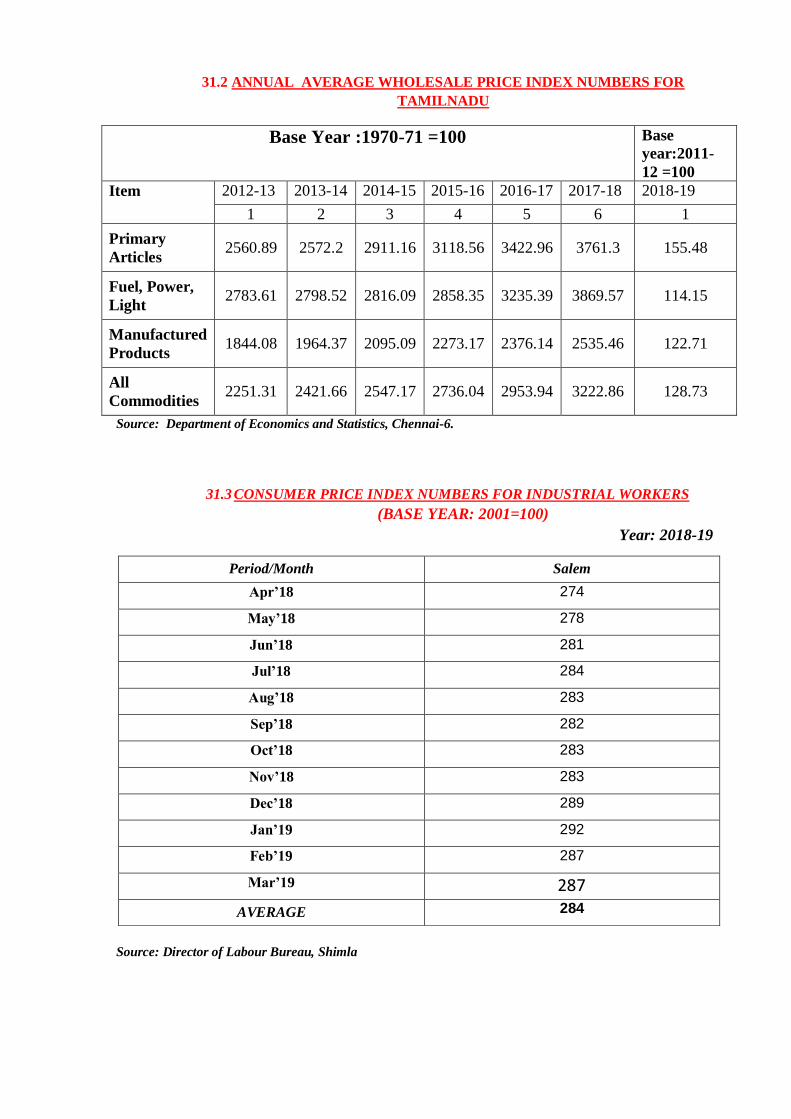
31.2 ANNUAL AVERAGE WHOLESALE PRICE INDEX NUMBERS FOR
TAMILNADU
Base Year :1970-71 =100 Base
year:2011-
12 =100
Item 2012-13 2013-14 2014-15 2015-16 2016-17 2017-18 2018-19
1 2 3 4 5 6 1
Primary
Articles 2560.89 2572.2 2911.16 3118.56 3422.96 3761.3 155.48
Fuel, Power,
Light 2783.61 2798.52 2816.09 2858.35 3235.39 3869.57 114.15
Manufactured
Products 1844.08 1964.37 2095.09 2273.17 2376.14 2535.46 122.71
All
Commodities 2251.31 2421.66 2547.17 2736.04 2953.94 3222.86 128.73
Source: Department of Economics and Statistics, Chennai-6.
31.3 CONSUMER PRICE INDEX NUMBERS FOR INDUSTRIAL WORKERS
(BASE YEAR: 2001=100)
Year: 2018-19
Source: Director of Labour Bureau, Shimla
Period/Month Salem
Apr’18 274
May’18 278
Jun’18 281
Jul’18 284
Aug’18 283
Sep’18 282
Oct’18 283
Nov’18 283
Dec’18 289
Jan’19 292
Feb’19 287
Mar’19 287
AVERAGE 284
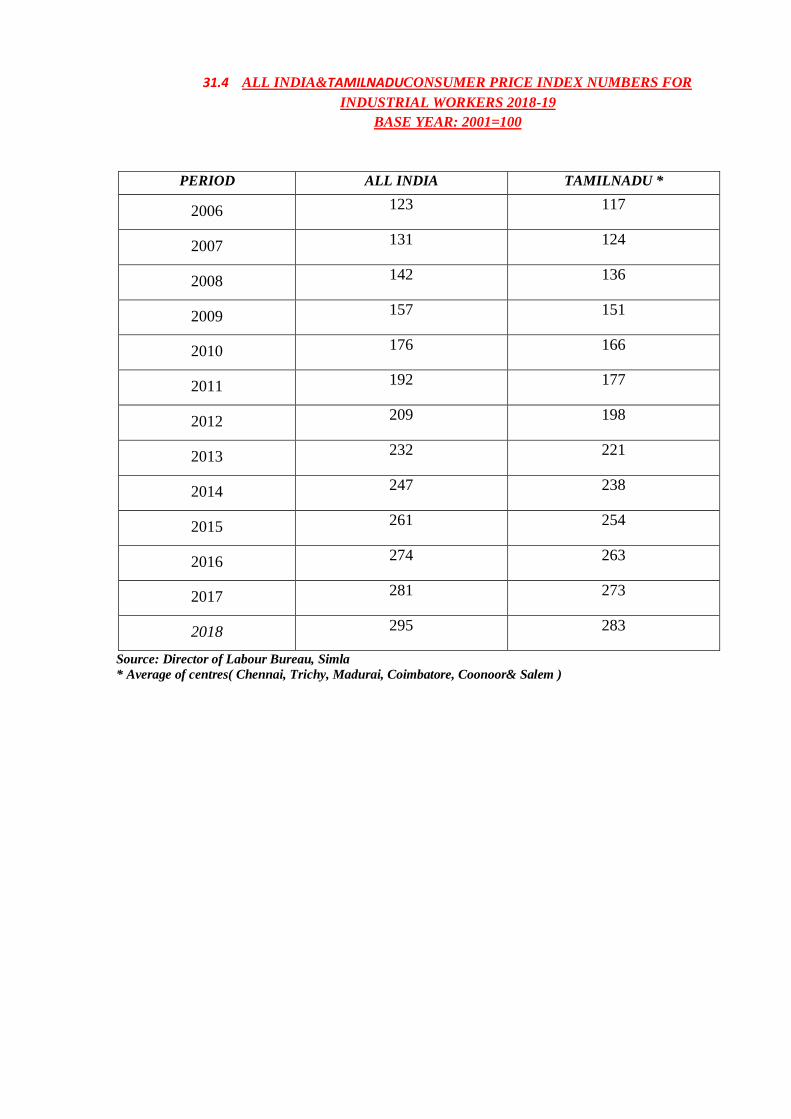
31.4 ALL INDIA&TAMILNADUCONSUMER PRICE INDEX NUMBERS FOR
INDUSTRIAL WORKERS 2018-19
BASE YEAR: 2001=100
PERIOD ALL INDIA TAMILNADU *
2006 123 117
2007 131 124
2008 142 136
2009 157 151
2010 176 166
2011 192 177
2012 209 198
2013 232 221
2014 247 238
2015 261 254
2016 274 263
2017 281 273
2018 295 283
Source: Director of Labour Bureau, Simla
* Average of centres( Chennai, Trichy, Madurai, Coimbatore, Coonoor& Salem )
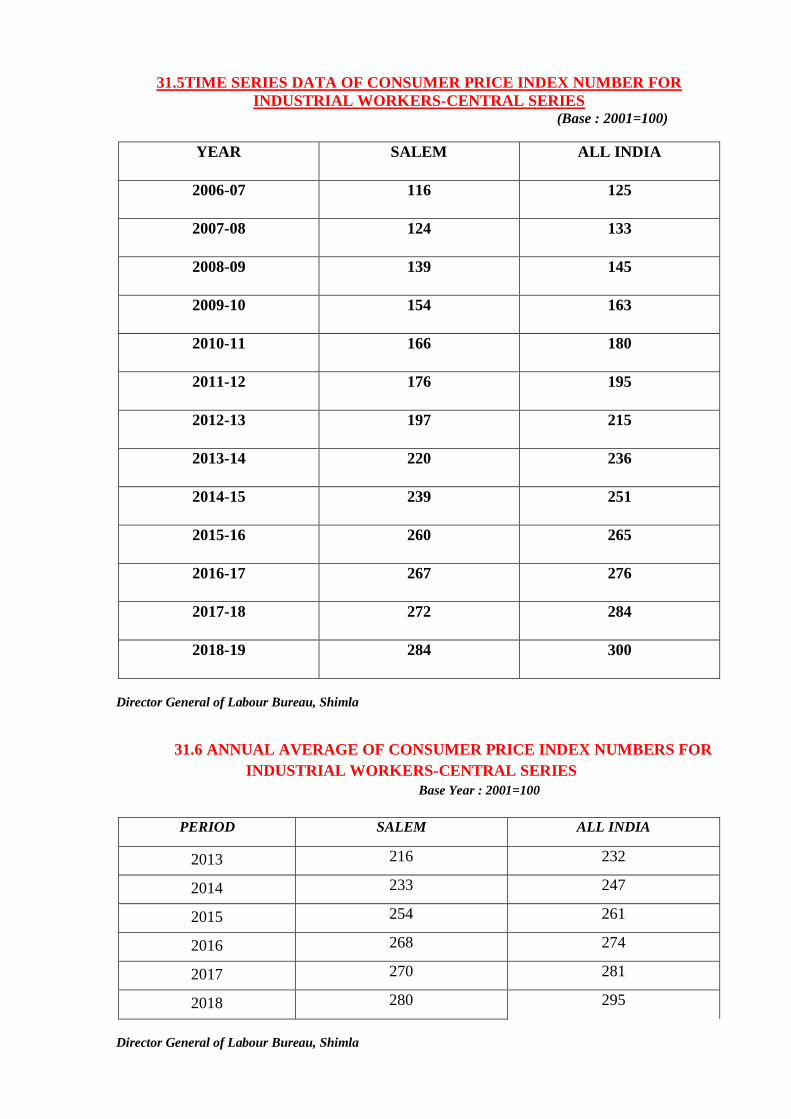
31.5TIME SERIES DATA OF CONSUMER PRICE INDEX NUMBER FOR
INDUSTRIAL WORKERS-CENTRAL SERIES (Base : 2001=100)
YEAR SALEM ALL INDIA
2006-07 116 125
2007-08 124 133
2008-09 139 145
2009-10 154 163
2010-11 166 180
2011-12 176 195
2012-13 197 215
2013-14 220 236
2014-15 239 251
2015-16 260 265
2016-17 267 276
2017-18 272 284
2018-19 284 300
Director General of Labour Bureau, Shimla
31.6 ANNUAL AVERAGE OF CONSUMER PRICE INDEX NUMBERS FOR
INDUSTRIAL WORKERS-CENTRAL SERIES
Base Year : 2001=100
PERIOD SALEM ALL INDIA
2013 216 232
2014 233 247
2015 254 261
2016 268 274
2017 270 281
2018 280 295
Director General of Labour Bureau, Shimla
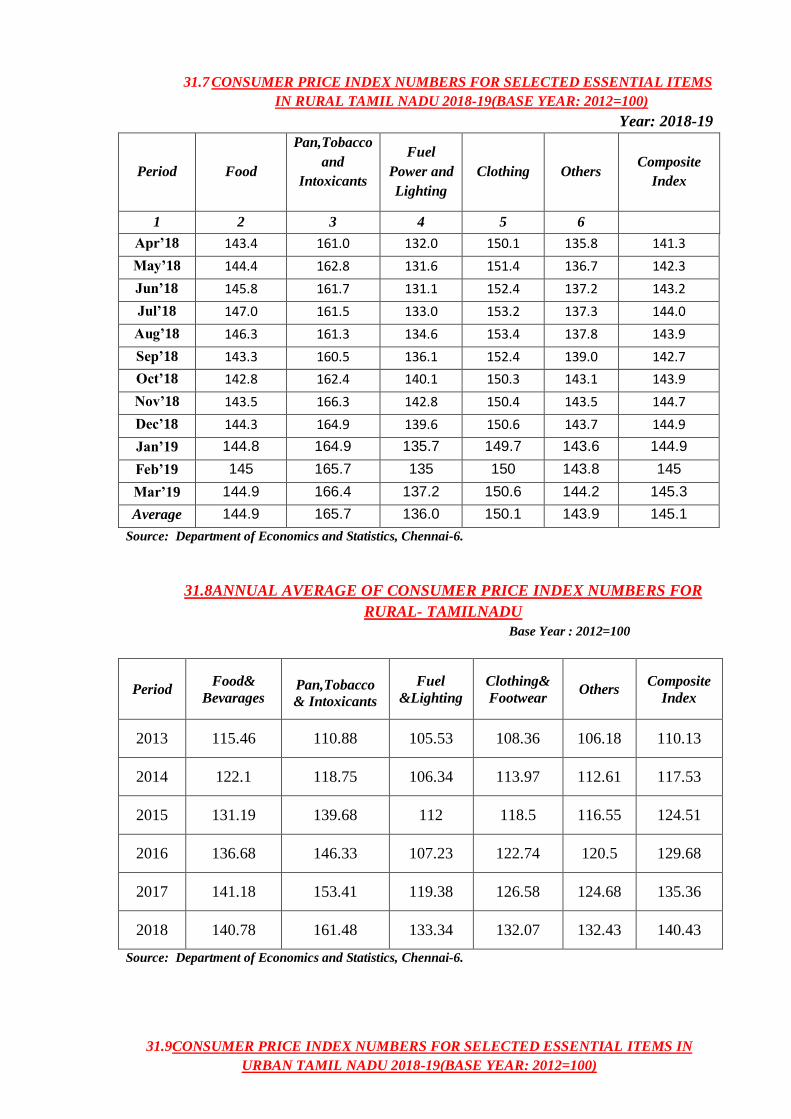
31.7 CONSUMER PRICE INDEX NUMBERS FOR SELECTED ESSENTIAL ITEMS
IN RURAL TAMIL NADU 2018-19(BASE YEAR: 2012=100)
Year: 2018-19
Period Food
Pan,Tobacco
and
Intoxicants
Fuel
Power and
Lighting
Clothing Others Composite
Index
1 2 3 4 5 6
Apr’18 143.4 161.0 132.0 150.1 135.8 141.3
May’18 144.4 162.8 131.6 151.4 136.7 142.3
Jun’18 145.8 161.7 131.1 152.4 137.2 143.2
Jul’18 147.0 161.5 133.0 153.2 137.3 144.0
Aug’18 146.3 161.3 134.6 153.4 137.8 143.9
Sep’18 143.3 160.5 136.1 152.4 139.0 142.7
Oct’18 142.8 162.4 140.1 150.3 143.1 143.9
Nov’18 143.5 166.3 142.8 150.4 143.5 144.7
Dec’18 144.3 164.9 139.6 150.6 143.7 144.9
Jan’19 144.8 164.9 135.7 149.7 143.6 144.9
Feb’19 145 165.7 135 150 143.8 145
Mar’19 144.9 166.4 137.2 150.6 144.2 145.3
Average 144.9 165.7 136.0 150.1 143.9 145.1
Source: Department of Economics and Statistics, Chennai-6.
31.8ANNUAL AVERAGE OF CONSUMER PRICE INDEX NUMBERS FOR
RURAL- TAMILNADU
Base Year : 2012=100
Period Food&
Bevarages
Pan,Tobacco
& Intoxicants
Fuel
&Lighting
Clothing&
Footwear Others
Composite
Index
2013 115.46 110.88 105.53 108.36 106.18 110.13
2014 122.1 118.75 106.34 113.97 112.61 117.53
2015 131.19 139.68 112 118.5 116.55 124.51
2016 136.68 146.33 107.23 122.74 120.5 129.68
2017 141.18 153.41 119.38 126.58 124.68 135.36
2018 140.78 161.48 133.34 132.07 132.43 140.43
Source: Department of Economics and Statistics, Chennai-6.
31.9CONSUMER PRICE INDEX NUMBERS FOR SELECTED ESSENTIAL ITEMS IN
URBAN TAMIL NADU 2018-19(BASE YEAR: 2012=100)
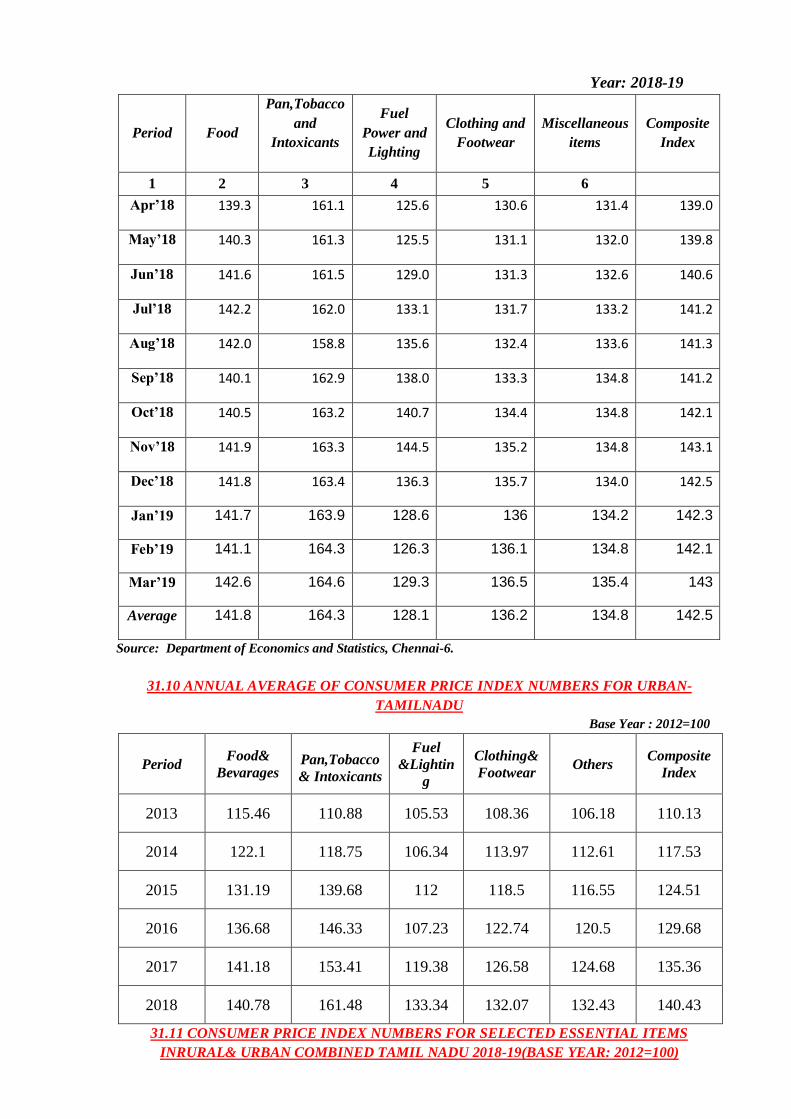
Year: 2018-19
Period Food
Pan,Tobacco
and
Intoxicants
Fuel
Power and
Lighting
Clothing and
Footwear
Miscellaneous
items
Composite
Index
1 2 3 4 5 6
Apr’18 139.3 161.1 125.6 130.6 131.4 139.0
May’18 140.3 161.3 125.5 131.1 132.0 139.8
Jun’18 141.6 161.5 129.0 131.3 132.6 140.6
Jul’18 142.2 162.0 133.1 131.7 133.2 141.2
Aug’18 142.0 158.8 135.6 132.4 133.6 141.3
Sep’18 140.1 162.9 138.0 133.3 134.8 141.2
Oct’18 140.5 163.2 140.7 134.4 134.8 142.1
Nov’18 141.9 163.3 144.5 135.2 134.8 143.1
Dec’18 141.8 163.4 136.3 135.7 134.0 142.5
Jan’19 141.7 163.9 128.6 136 134.2 142.3
Feb’19 141.1 164.3 126.3 136.1 134.8 142.1
Mar’19 142.6 164.6 129.3 136.5 135.4 143
Average 141.8 164.3 128.1 136.2 134.8 142.5
Source: Department of Economics and Statistics, Chennai-6.
31.10 ANNUAL AVERAGE OF CONSUMER PRICE INDEX NUMBERS FOR URBAN-
TAMILNADU
Base Year : 2012=100
Period Food&
Bevarages
Pan,Tobacco
& Intoxicants
Fuel
&Lightin
g
Clothing&
Footwear Others
Composite
Index
2013 115.46 110.88 105.53 108.36 106.18 110.13
2014 122.1 118.75 106.34 113.97 112.61 117.53
2015 131.19 139.68 112 118.5 116.55 124.51
2016 136.68 146.33 107.23 122.74 120.5 129.68
2017 141.18 153.41 119.38 126.58 124.68 135.36
2018 140.78 161.48 133.34 132.07 132.43 140.43
31.11 CONSUMER PRICE INDEX NUMBERS FOR SELECTED ESSENTIAL ITEMS
INRURAL& URBAN COMBINED TAMIL NADU 2018-19(BASE YEAR: 2012=100)
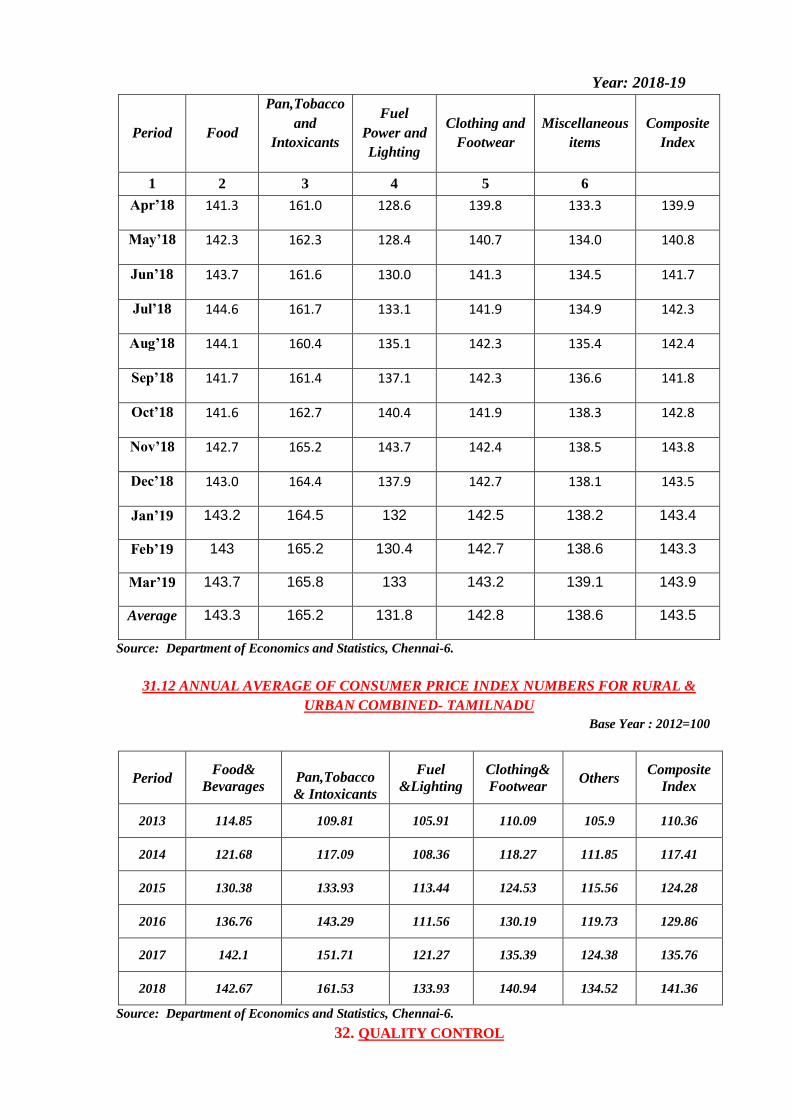
Year: 2018-19
Period Food
Pan,Tobacco
and
Intoxicants
Fuel
Power and
Lighting
Clothing and
Footwear
Miscellaneous
items
Composite
Index
1 2 3 4 5 6
Apr’18 141.3 161.0 128.6 139.8 133.3 139.9
May’18 142.3 162.3 128.4 140.7 134.0 140.8
Jun’18 143.7 161.6 130.0 141.3 134.5 141.7
Jul’18 144.6 161.7 133.1 141.9 134.9 142.3
Aug’18 144.1 160.4 135.1 142.3 135.4 142.4
Sep’18 141.7 161.4 137.1 142.3 136.6 141.8
Oct’18 141.6 162.7 140.4 141.9 138.3 142.8
Nov’18 142.7 165.2 143.7 142.4 138.5 143.8
Dec’18 143.0 164.4 137.9 142.7 138.1 143.5
Jan’19 143.2 164.5 132 142.5 138.2 143.4
Feb’19 143 165.2 130.4 142.7 138.6 143.3
Mar’19 143.7 165.8 133 143.2 139.1 143.9
Average 143.3 165.2 131.8 142.8 138.6 143.5
Source: Department of Economics and Statistics, Chennai-6.
31.12 ANNUAL AVERAGE OF CONSUMER PRICE INDEX NUMBERS FOR RURAL &
URBAN COMBINED- TAMILNADU
Base Year : 2012=100
Period Food&
Bevarages
Pan,Tobacco
& Intoxicants
Fuel
&Lighting
Clothing&
Footwear Others
Composite
Index
2013 114.85 109.81 105.91 110.09 105.9 110.36
2014 121.68 117.09 108.36 118.27 111.85 117.41
2015 130.38 133.93 113.44 124.53 115.56 124.28
2016 136.76 143.29 111.56 130.19 119.73 129.86
2017 142.1 151.71 121.27 135.39 124.38 135.76
2018 142.67 161.53 133.93 140.94 134.52 141.36
Source: Department of Economics and Statistics, Chennai-6.
32. QUALITY CONTROL
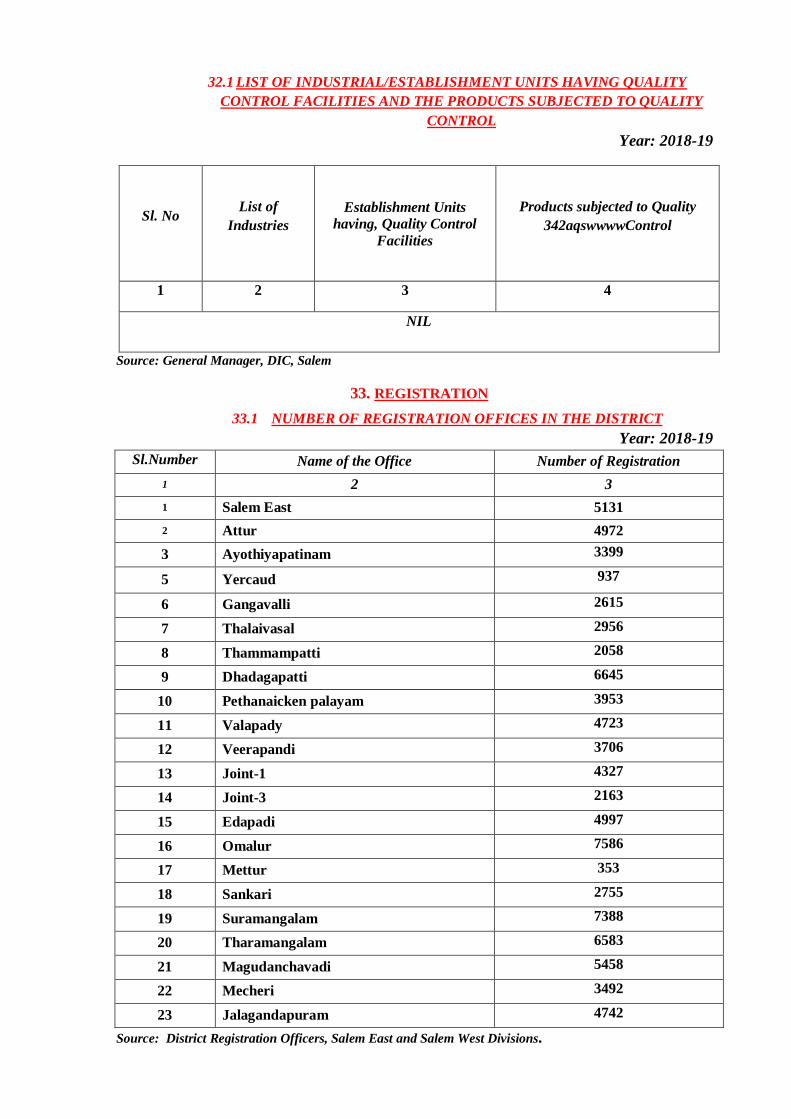
32.1 LIST OF INDUSTRIAL/ESTABLISHMENT UNITS HAVING QUALITY
CONTROL FACILITIES AND THE PRODUCTS SUBJECTED TO QUALITY
CONTROL
Year: 2018-19
Sl. No List of
Industries
Establishment Units
having, Quality Control
Facilities
Products subjected to Quality
342aqswwwwControl
1 2 3 4
NIL
Source: General Manager, DIC, Salem
33. REGISTRATION
33.1 NUMBER OF REGISTRATION OFFICES IN THE DISTRICT
Year: 2018-19
Sl.Number
Name of the Office Number of Registration
1 2 3
1 Salem East 5131
2 Attur 4972
3 Ayothiyapatinam 3399
5 Yercaud 937
6 Gangavalli 2615
7 Thalaivasal 2956
8 Thammampatti 2058
9 Dhadagapatti 6645
10 Pethanaicken palayam 3953
11 Valapady 4723
12 Veerapandi 3706
13 Joint-1 4327
14 Joint-3 2163
15 Edapadi 4997
16 Omalur 7586
17 Mettur 353
18 Sankari 2755
19 Suramangalam 7388
20 Tharamangalam 6583
21 Magudanchavadi 5458
22 Mecheri 3492
23 Jalagandapuram 4742
Source: District Registration Officers, Salem East and Salem West Divisions.
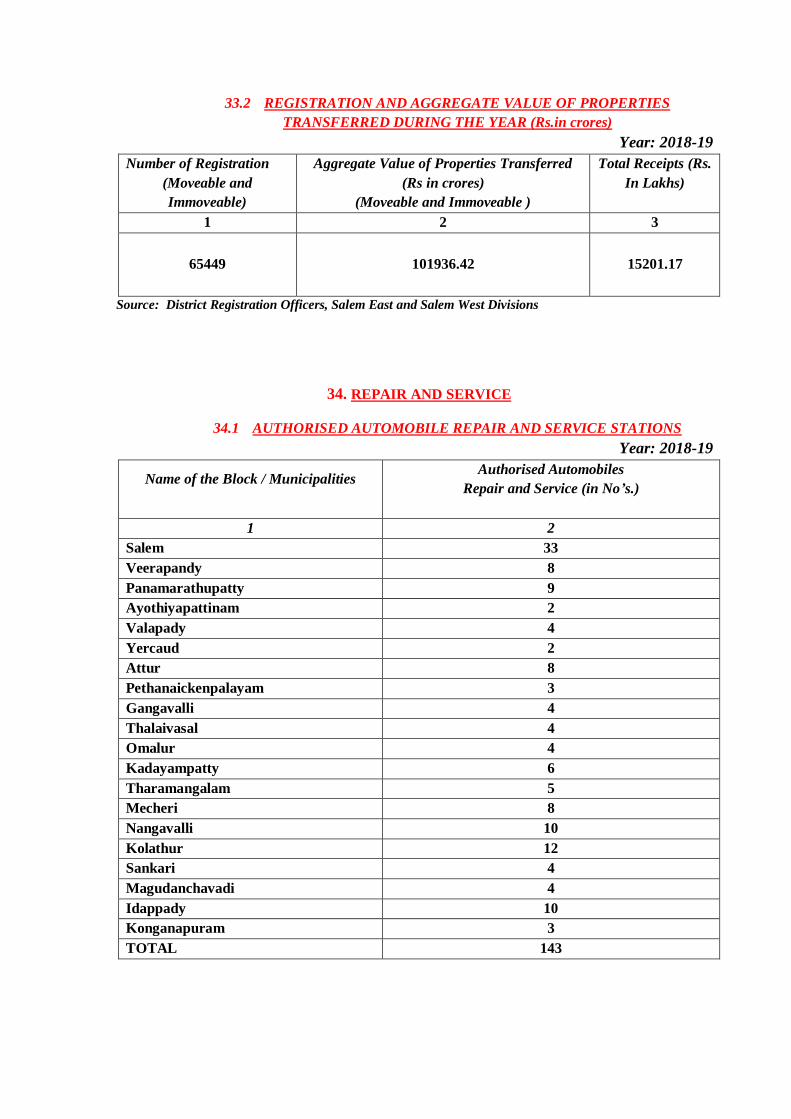
33.2 REGISTRATION AND AGGREGATE VALUE OF PROPERTIES
TRANSFERRED DURING THE YEAR (Rs.in crores)
Year: 2018-19
Number of Registration
(Moveable and
Immoveable)
Aggregate Value of Properties Transferred
(Rs in crores)
(Moveable and Immoveable )
Total Receipts (Rs.
In Lakhs)
1 2 3
65449 101936.42 15201.17
Source: District Registration Officers, Salem East and Salem West Divisions
34. REPAIR AND SERVICE
34.1 AUTHORISED AUTOMOBILE REPAIR AND SERVICE STATIONS
Year: 2018-19
Name of the Block / Municipalities
Authorised Automobiles
Repair and Service (in No’s.)
1 2
Salem 33
Veerapandy 8
Panamarathupatty 9
Ayothiyapattinam 2
Valapady 4
Yercaud 2
Attur 8
Pethanaickenpalayam 3
Gangavalli 4
Thalaivasal 4
Omalur 4
Kadayampatty 6
Tharamangalam 5
Mecheri 8
Nangavalli 10
Kolathur 12
Sankari 4
Magudanchavadi 4
Idappady 10
Konganapuram 3
TOTAL 143
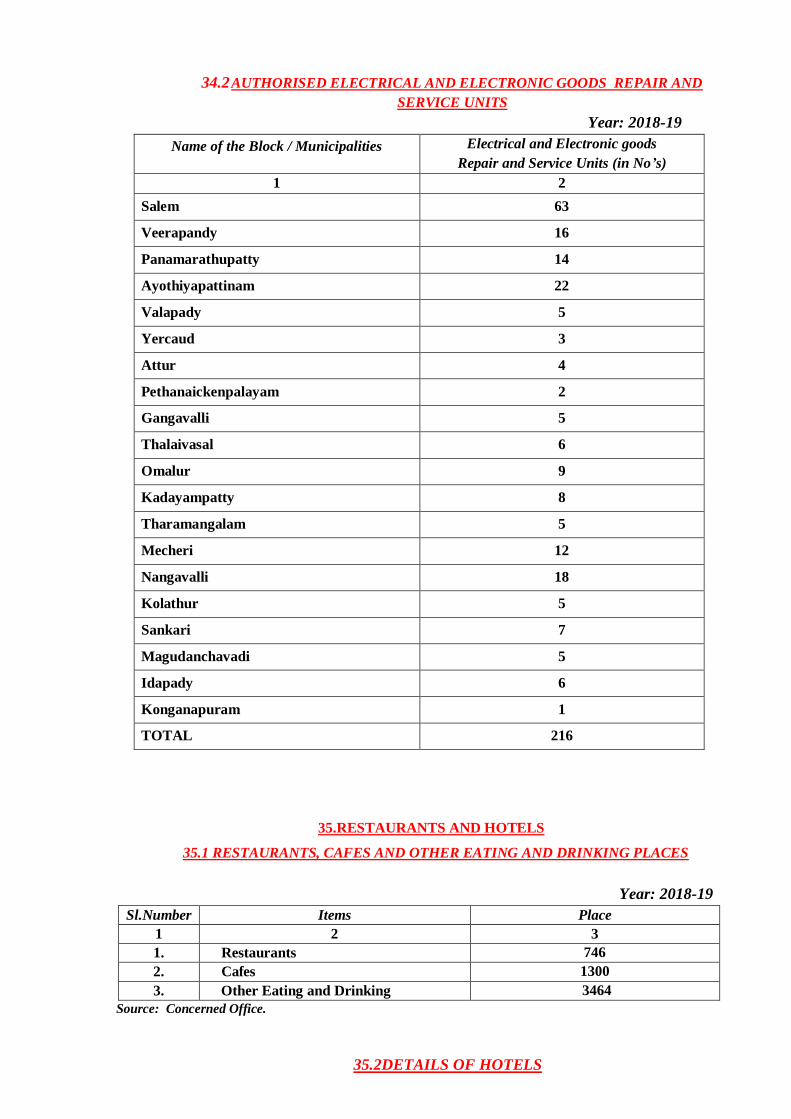
34.2 AUTHORISED ELECTRICAL AND ELECTRONIC GOODS REPAIR AND
SERVICE UNITS
Year: 2018-19
Name of the Block / Municipalities Electrical and Electronic goods
Repair and Service Units (in No’s)
1 2
Salem 63
Veerapandy 16
Panamarathupatty 14
Ayothiyapattinam 22
Valapady 5
Yercaud 3
Attur 4
Pethanaickenpalayam 2
Gangavalli 5
Thalaivasal 6
Omalur 9
Kadayampatty 8
Tharamangalam 5
Mecheri 12
Nangavalli 18
Kolathur 5
Sankari 7
Magudanchavadi 5
Idapady 6
Konganapuram 1
TOTAL 216
35.RESTAURANTS AND HOTELS
35.1 RESTAURANTS, CAFES AND OTHER EATING AND DRINKING PLACES
Year: 2018-19
Sl.Number Items Place
1 2 3
1. Restaurants 746
2. Cafes 1300
3. Other Eating and Drinking
Centres
3464
Source: Concerned Office.
35.2DETAILS OF HOTELS
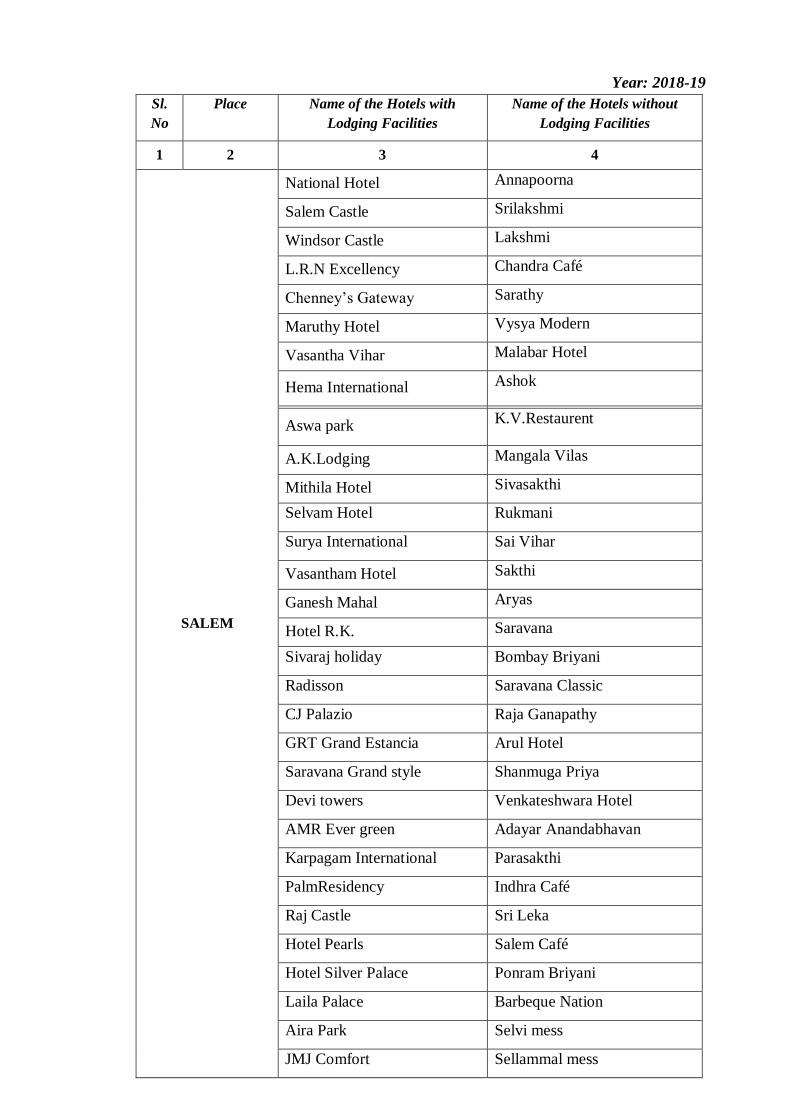
Year: 2018-19
Sl.
No
Place Name of the Hotels with
Lodging Facilities
Name of the Hotels without
Lodging Facilities
1 2 3 4
SALEM
National Hotel Annapoorna
Salem Castle Srilakshmi
Windsor Castle Lakshmi
L.R.N Excellency Chandra Café
Chenney’s Gateway Sarathy
Maruthy Hotel Vysya Modern
Vasantha Vihar Malabar Hotel
Hema International Ashok
Aswa park
K.V.Restaurent
A.K.Lodging Mangala Vilas
Mithila Hotel Sivasakthi
Selvam Hotel Rukmani
Surya International Sai Vihar
Vasantham Hotel Sakthi
Ganesh Mahal Aryas
Hotel R.K. Saravana
Sivaraj holiday Bombay Briyani
Radisson Saravana Classic
CJ Palazio Raja Ganapathy
GRT Grand Estancia Arul Hotel
Saravana Grand style Shanmuga Priya
Devi towers Venkateshwara Hotel
AMR Ever green Adayar Anandabhavan
Karpagam International Parasakthi
PalmResidency Indhra Café
Raj Castle Sri Leka
Hotel Pearls Salem Café
Hotel Silver Palace Ponram Briyani
Laila Palace Barbeque Nation
Aira Park Selvi mess
JMJ Comfort Sellammal mess
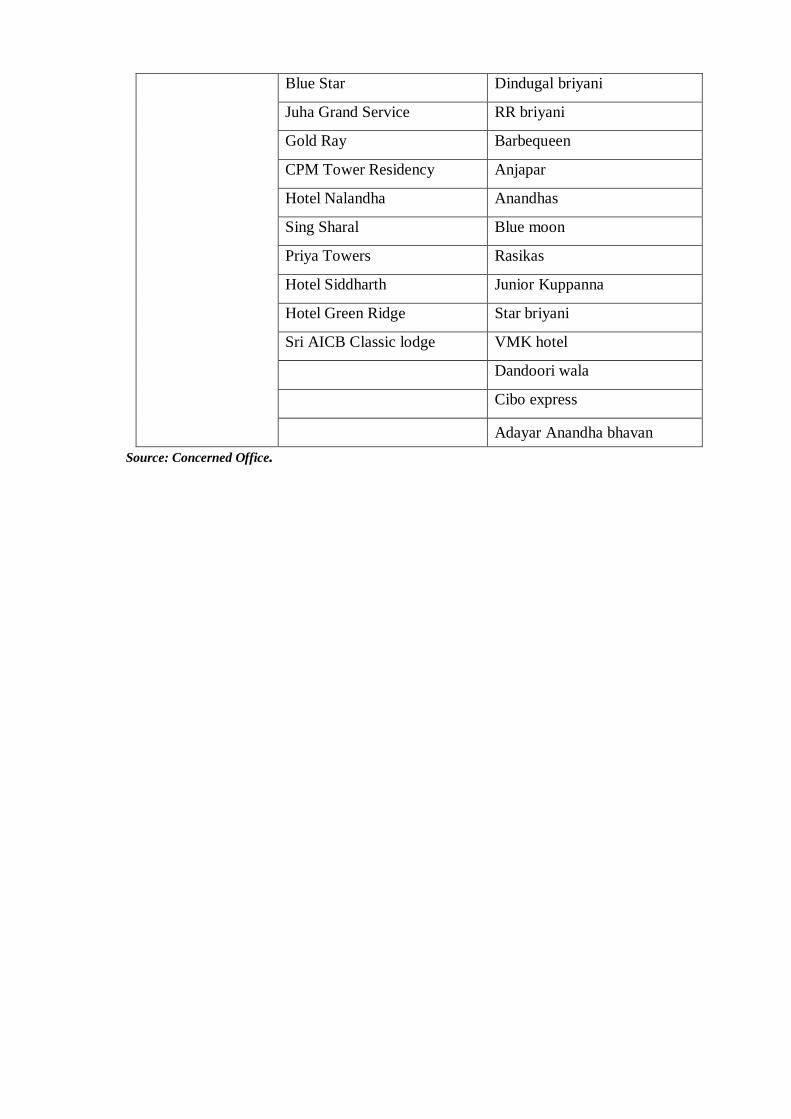
Blue Star Dindugal briyani
Juha Grand Service RR briyani
Gold Ray Barbequeen
CPM Tower Residency Anjapar
Hotel Nalandha Anandhas
Sing Sharal Blue moon
Priya Towers Rasikas
Hotel Siddharth Junior Kuppanna
Hotel Green Ridge Star briyani
Sri AICB Classic lodge VMK hotel
Dandoori wala
Cibo express
Adayar Anandha bhavan
Source: Concerned Office.
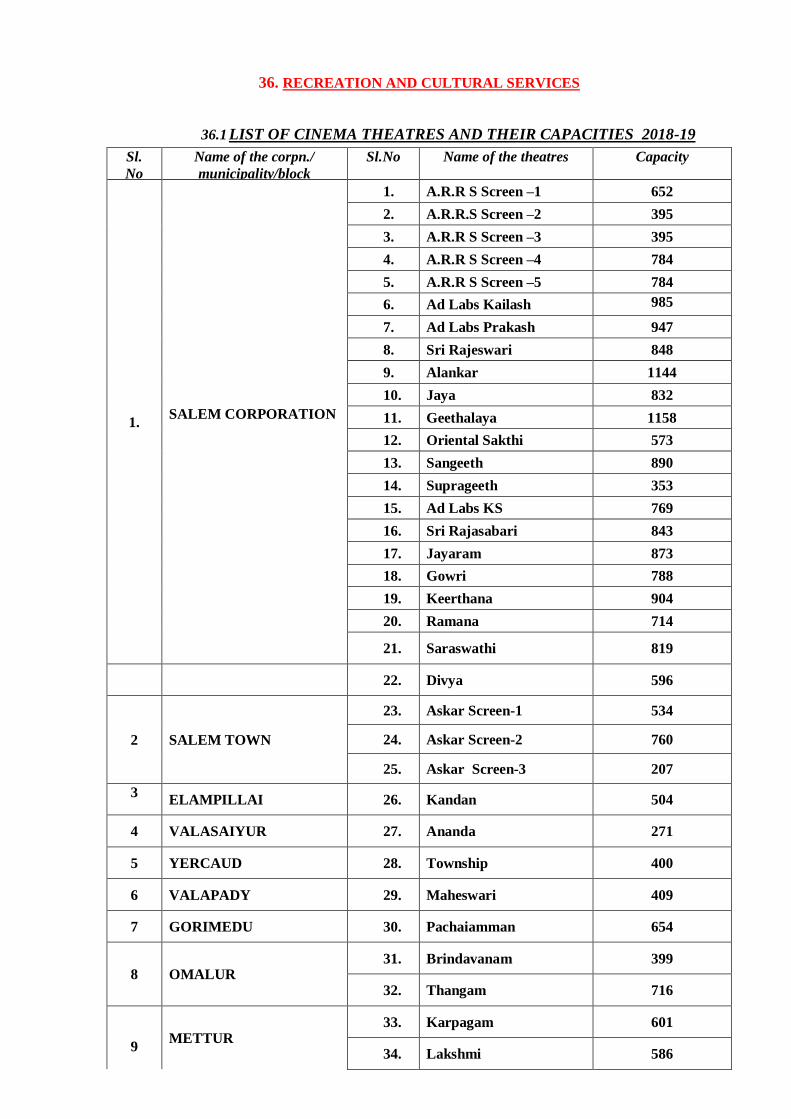
36. RECREATION AND CULTURAL SERVICES
36.1 LIST OF CINEMA THEATRES AND THEIR CAPACITIES 2018-19
36.2
Sl.
No
Name of the corpn./
municipality/block
Sl.No Name of the theatres Capacity
1.
SALEM CORPORATION
1. A.R.R S Screen –1 652
2. A.R.R.S Screen –2 395
3. A.R.R S Screen –3 395
4. A.R.R S Screen –4 784
5. A.R.R S Screen –5 784
6. Ad Labs Kailash 985
7. Ad Labs Prakash 947
8. Sri Rajeswari 848
9. Alankar 1144
10. Jaya 832
11. Geethalaya 1158
12. Oriental Sakthi 573
13. Sangeeth 890
14. Suprageeth 353
15. Ad Labs KS 769
16. Sri Rajasabari 843
17. Jayaram 873
18. Gowri 788
19. Keerthana 904
20. Ramana 714
21. Saraswathi 819
22. Divya 596
2 SALEM TOWN
23. Askar Screen-1 534
24. Askar Screen-2 760
25. Askar Screen-3 207
3
ELAMPILLAI 26. Kandan 504
4 VALASAIYUR 27. Ananda 271
5 YERCAUD 28. Township 400
6 VALAPADY 29. Maheswari 409
7 GORIMEDU 30. Pachaiamman 654
8 OMALUR 31. Brindavanam 399
32. Thangam 716
9 METTUR
33. Karpagam 601
34. Lakshmi 586
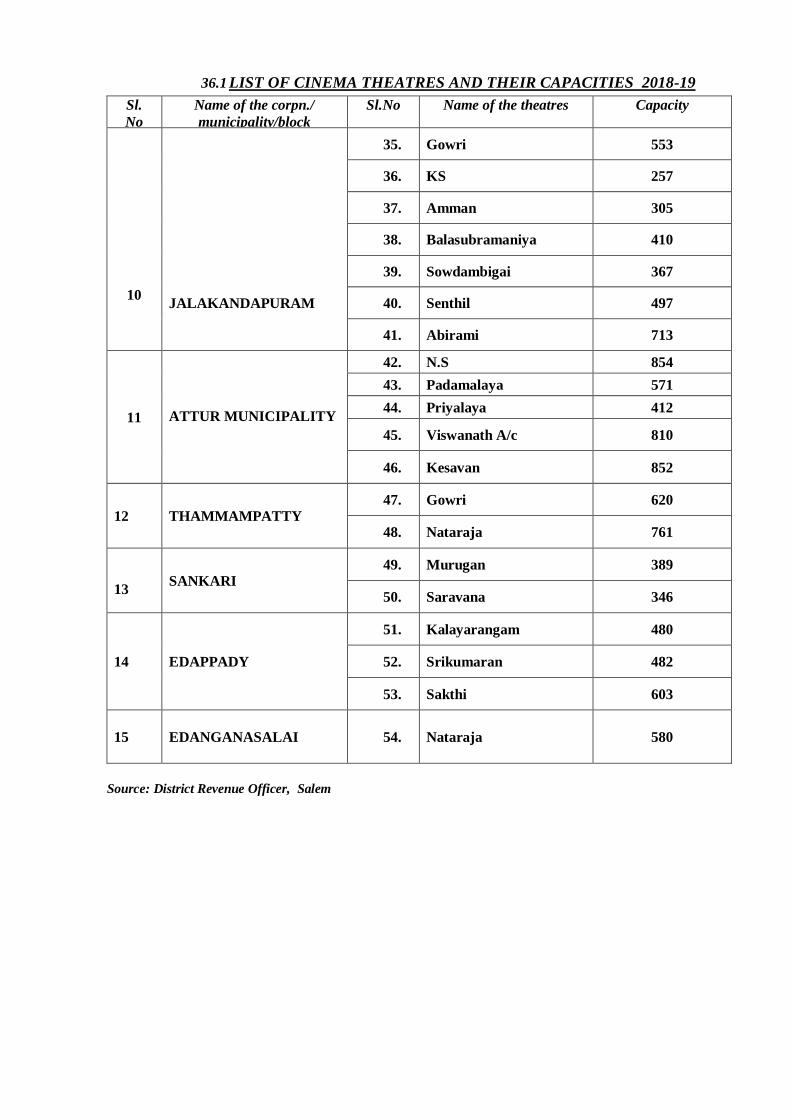
36.1 LIST OF CINEMA THEATRES AND THEIR CAPACITIES 2018-19
36.2
Sl.
No
Name of the corpn./
municipality/block
Sl.No Name of the theatres Capacity
35. Gowri 553
36. KS 257
37. Amman 305
38. Balasubramaniya 410
10
JALAKANDAPURAM
39. Sowdambigai 367
40. Senthil 497
41. Abirami 713
11 ATTUR MUNICIPALITY
42. N.S 854
43. Padamalaya 571
44. Priyalaya 412
45. Viswanath A/c 810
46. Kesavan 852
12 THAMMAMPATTY 47. Gowri 620
48. Nataraja 761
13 SANKARI
49. Murugan 389
50. Saravana 346
14 EDAPPADY
51. Kalayarangam 480
52. Srikumaran 482
53. Sakthi 603
15 EDANGANASALAI 54. Nataraja 580
Source: District Revenue Officer, Salem
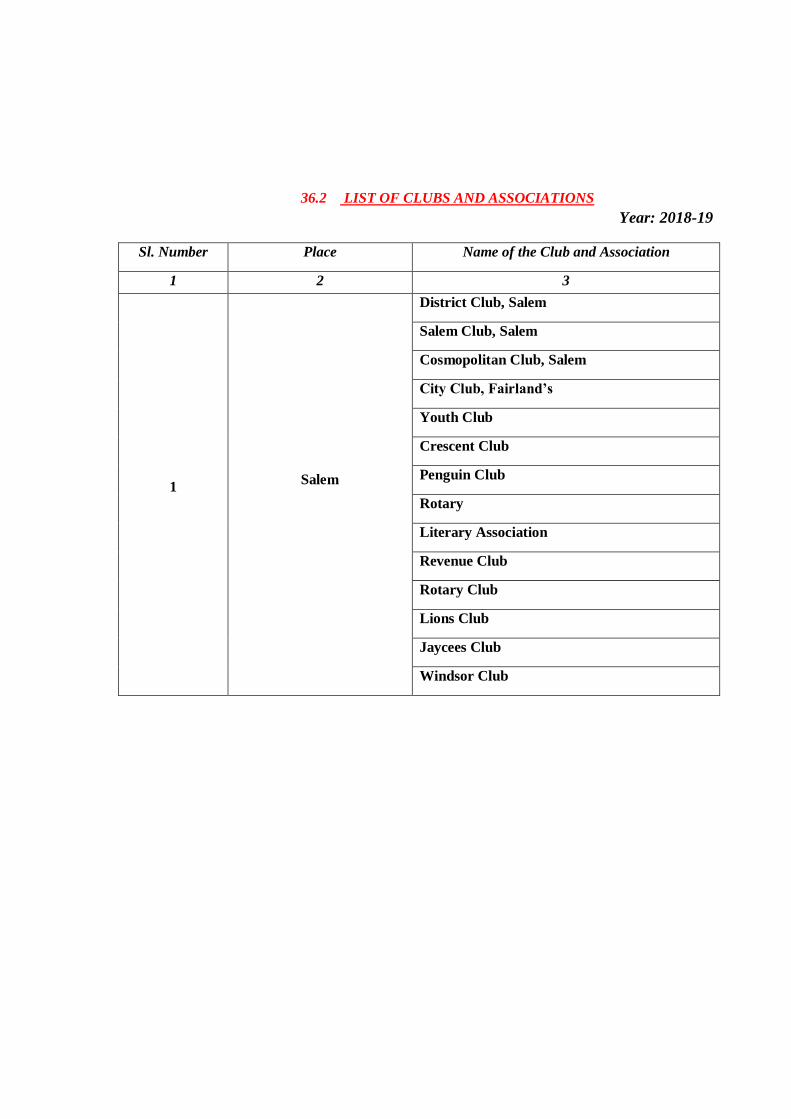
36.2 LIST OF CLUBS AND ASSOCIATIONS
Year: 2018-19
Sl. Number Place Name of the Club and Association
1
11
2 3
1
Salem
District Club, Salem
Salem Club, Salem
Cosmopolitan Club, Salem
City Club, Fairland’s
Youth Club
Crescent Club
Penguin Club
Rotary
Literary Association
Revenue Club
Rotary Club
Lions Club
Jaycees Club
Windsor Club
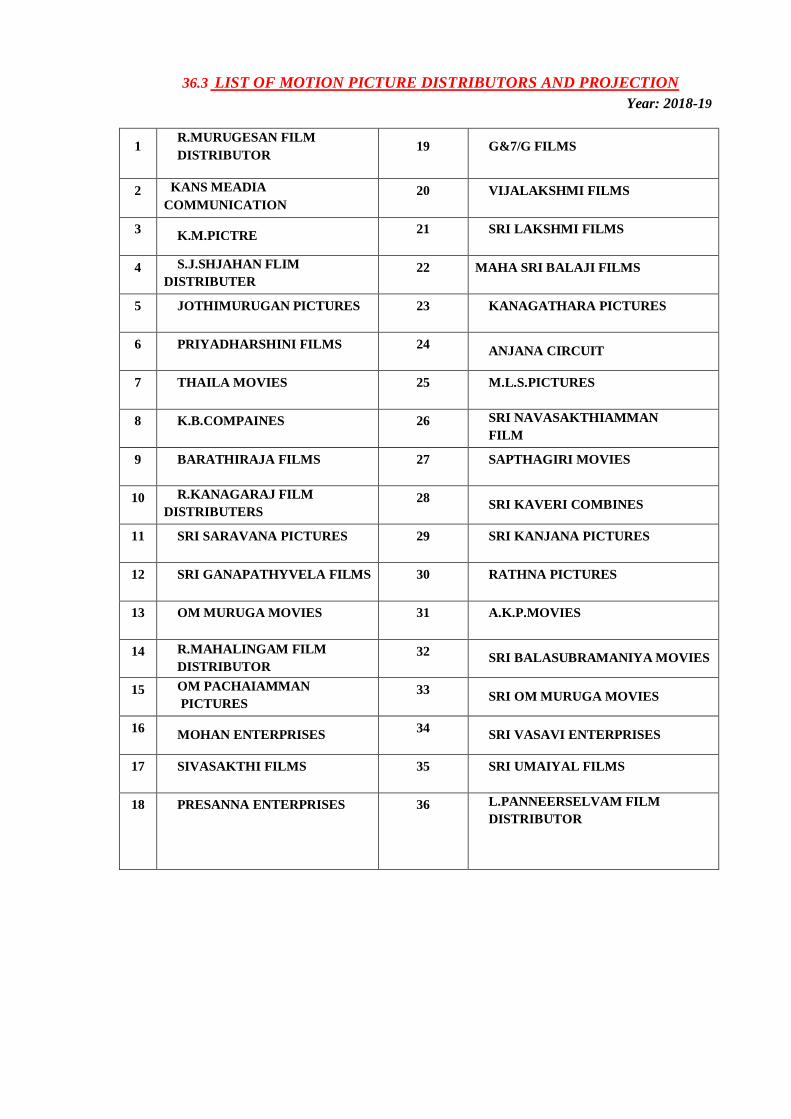
36.3 LIST OF MOTION PICTURE DISTRIBUTORS AND PROJECTION
Year: 2018-19
1 R.MURUGESAN FILM
DISTRIBUTOR 19 G&7/G FILMS
2 KANS MEADIA
COMMUNICATION 20 VIJALAKSHMI FILMS
3 K.M.PICTRE
21 SRI LAKSHMI FILMS
4 S.J.SHJAHAN FLIM
DISTRIBUTER 22 MAHA SRI BALAJI FILMS
5 JOTHIMURUGAN PICTURES 23 KANAGATHARA PICTURES
6 PRIYADHARSHINI FILMS 24 ANJANA CIRCUIT
7 THAILA MOVIES 25 M.L.S.PICTURES
8 K.B.COMPAINES 26 SRI NAVASAKTHIAMMAN
FILM
9 BARATHIRAJA FILMS 27 SAPTHAGIRI MOVIES
10 R.KANAGARAJ FILM
DISTRIBUTERS 28
SRI KAVERI COMBINES
11 SRI SARAVANA PICTURES 29 SRI KANJANA PICTURES
12 SRI GANAPATHYVELA FILMS 30 RATHNA PICTURES
13 OM MURUGA MOVIES 31 A.K.P.MOVIES
14 R.MAHALINGAM FILM
DISTRIBUTOR
32 SRI BALASUBRAMANIYA MOVIES
15 OM PACHAIAMMAN
PICTURES 33
SRI OM MURUGA MOVIES
16 MOHAN ENTERPRISES
34 SRI VASAVI ENTERPRISES
17 SIVASAKTHI FILMS 35 SRI UMAIYAL FILMS
18 PRESANNA ENTERPRISES 36 L.PANNEERSELVAM FILM
DISTRIBUTOR
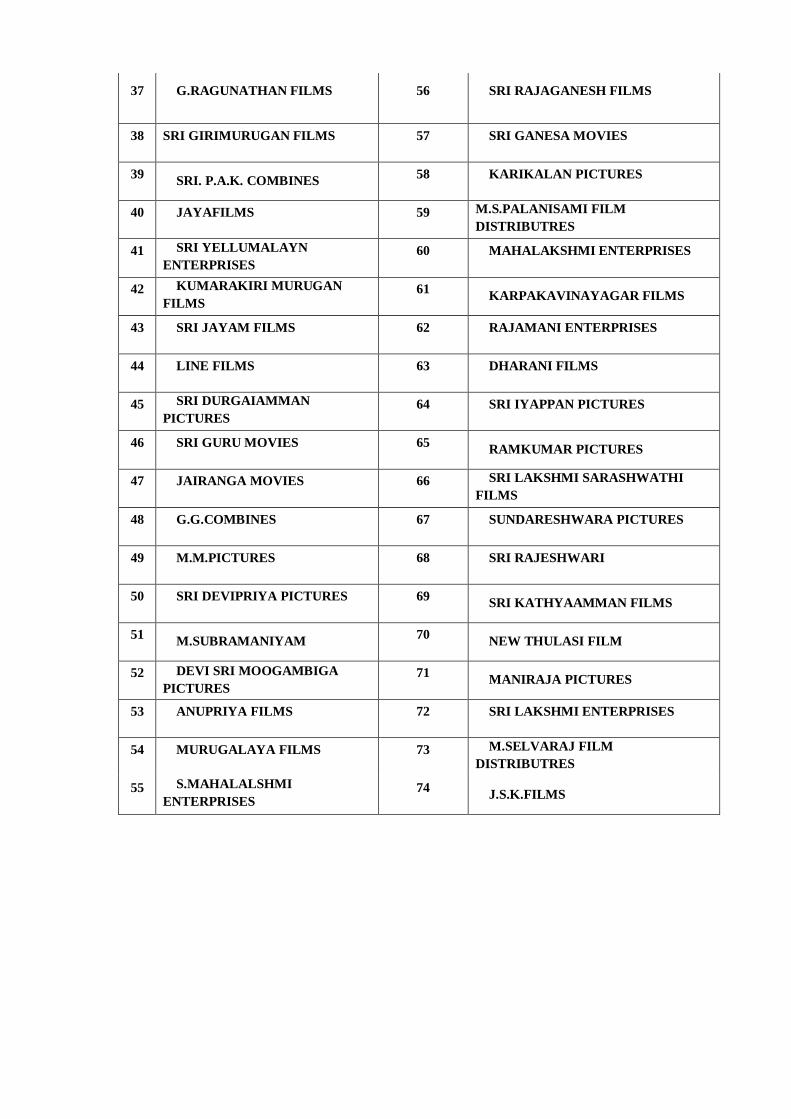
37 G.RAGUNATHAN FILMS 56 SRI RAJAGANESH FILMS
38 SRI GIRIMURUGAN FILMS 57 SRI GANESA MOVIES
39 SRI. P.A.K. COMBINES
58 KARIKALAN PICTURES
40 JAYAFILMS 59 M.S.PALANISAMI FILM
DISTRIBUTRES
41 SRI YELLUMALAYN
ENTERPRISES 60 MAHALAKSHMI ENTERPRISES
42 KUMARAKIRI MURUGAN
FILMS 61
KARPAKAVINAYAGAR FILMS
43 SRI JAYAM FILMS 62 RAJAMANI ENTERPRISES
44 LINE FILMS 63 DHARANI FILMS
45 SRI DURGAIAMMAN
PICTURES 64 SRI IYAPPAN PICTURES
46 SRI GURU MOVIES 65 RAMKUMAR PICTURES
47 JAIRANGA MOVIES 66 SRI LAKSHMI SARASHWATHI
FILMS
48 G.G.COMBINES 67 SUNDARESHWARA PICTURES
49 M.M.PICTURES 68 SRI RAJESHWARI
50 SRI DEVIPRIYA PICTURES 69 SRI KATHYAAMMAN FILMS
51 M.SUBRAMANIYAM
70 NEW THULASI FILM
52 DEVI SRI MOOGAMBIGA
PICTURES
71 MANIRAJA PICTURES
53 ANUPRIYA FILMS 72 SRI LAKSHMI ENTERPRISES
54 MURUGALAYA FILMS 73 M.SELVARAJ FILM
DISTRIBUTRES
55 S.MAHALALSHMI
ENTERPRISES 74
J.S.K.FILMS
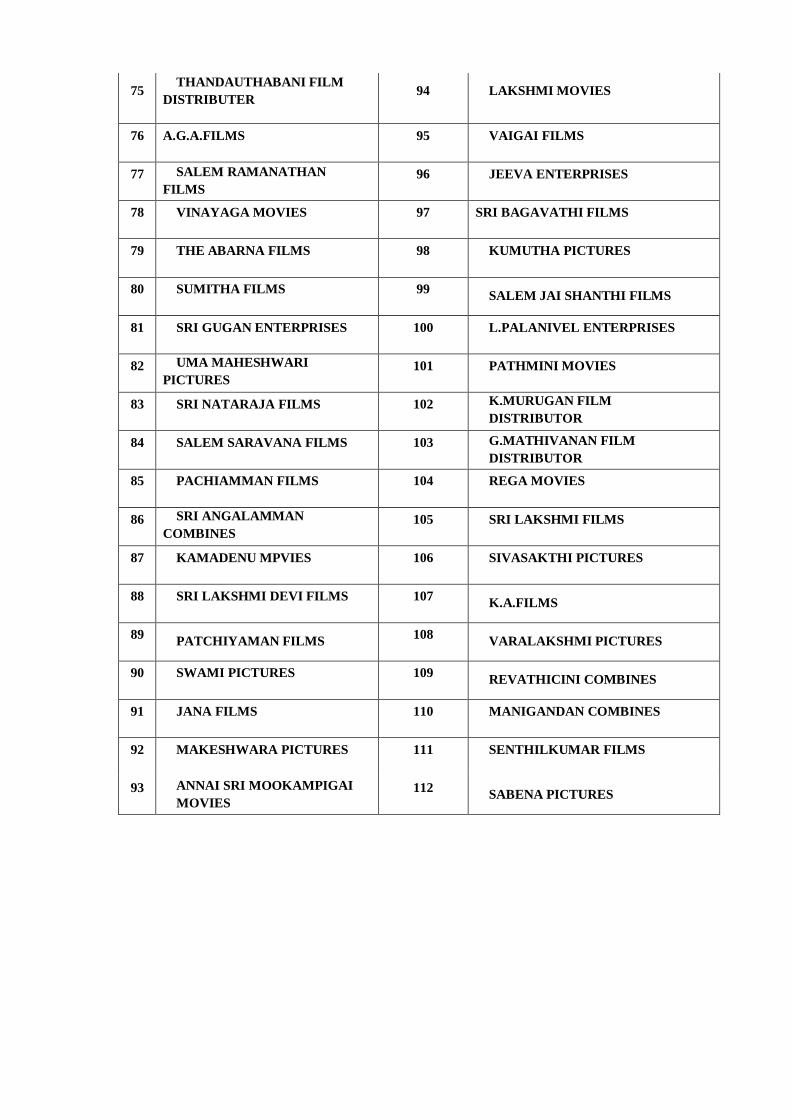
75 THANDAUTHABANI FILM
DISTRIBUTER 94 LAKSHMI MOVIES
76 A.G.A.FILMS 95 VAIGAI FILMS
77 SALEM RAMANATHAN
FILMS
96 JEEVA ENTERPRISES
78 VINAYAGA MOVIES 97 SRI BAGAVATHI FILMS
79 THE ABARNA FILMS 98 KUMUTHA PICTURES
80 SUMITHA FILMS 99 SALEM JAI SHANTHI FILMS
81 SRI GUGAN ENTERPRISES 100 L.PALANIVEL ENTERPRISES
82 UMA MAHESHWARI
PICTURES 101 PATHMINI MOVIES
83 SRI NATARAJA FILMS 102 K.MURUGAN FILM
DISTRIBUTOR
84 SALEM SARAVANA FILMS 103 G.MATHIVANAN FILM
DISTRIBUTOR
85 PACHIAMMAN FILMS 104 REGA MOVIES
86 SRI ANGALAMMAN
COMBINES 105 SRI LAKSHMI FILMS
87 KAMADENU MPVIES 106 SIVASAKTHI PICTURES
88 SRI LAKSHMI DEVI FILMS 107 K.A.FILMS
89 PATCHIYAMAN FILMS
108 VARALAKSHMI PICTURES
90 SWAMI PICTURES 109 REVATHICINI COMBINES
91 JANA FILMS 110 MANIGANDAN COMBINES
92 MAKESHWARA PICTURES 111 SENTHILKUMAR FILMS
93 ANNAI SRI MOOKAMPIGAI
MOVIES
112 SABENA PICTURES
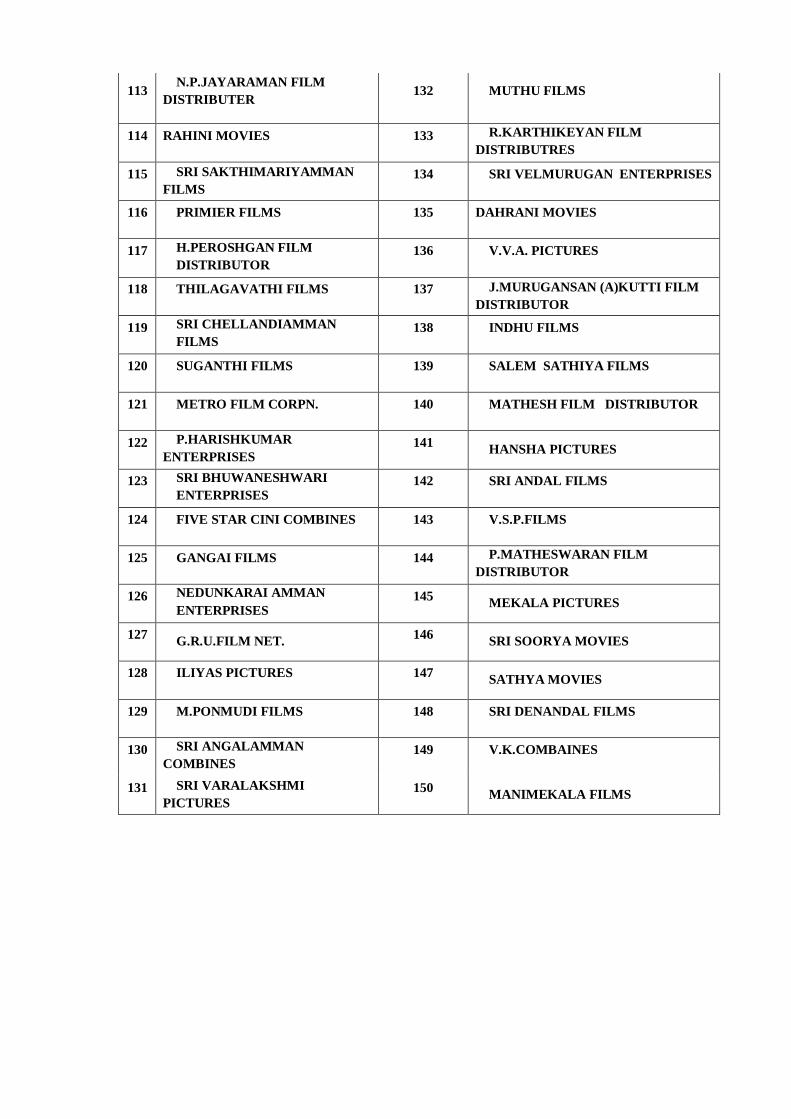
113 N.P.JAYARAMAN FILM
DISTRIBUTER 132 MUTHU FILMS
114 RAHINI MOVIES 133 R.KARTHIKEYAN FILM
DISTRIBUTRES
115 SRI SAKTHIMARIYAMMAN
FILMS
134 SRI VELMURUGAN ENTERPRISES
116 PRIMIER FILMS 135 DAHRANI MOVIES
117 H.PEROSHGAN FILM
DISTRIBUTOR 136 V.V.A. PICTURES
118 THILAGAVATHI FILMS 137 J.MURUGANSAN (A)KUTTI FILM
DISTRIBUTOR
119 SRI CHELLANDIAMMAN
FILMS 138 INDHU FILMS
120 SUGANTHI FILMS 139 SALEM SATHIYA FILMS
121 METRO FILM CORPN. 140 MATHESH FILM DISTRIBUTOR
122 P.HARISHKUMAR
ENTERPRISES 141
HANSHA PICTURES
123 SRI BHUWANESHWARI
ENTERPRISES 142 SRI ANDAL FILMS
124 FIVE STAR CINI COMBINES 143 V.S.P.FILMS
125 GANGAI FILMS 144 P.MATHESWARAN FILM
DISTRIBUTOR
126 NEDUNKARAI AMMAN
ENTERPRISES 145
MEKALA PICTURES
127 G.R.U.FILM NET.
146 SRI SOORYA MOVIES
128 ILIYAS PICTURES 147 SATHYA MOVIES
129 M.PONMUDI FILMS 148 SRI DENANDAL FILMS
130 SRI ANGALAMMAN
COMBINES 149 V.K.COMBAINES
131 SRI VARALAKSHMI
PICTURES
150 MANIMEKALA FILMS
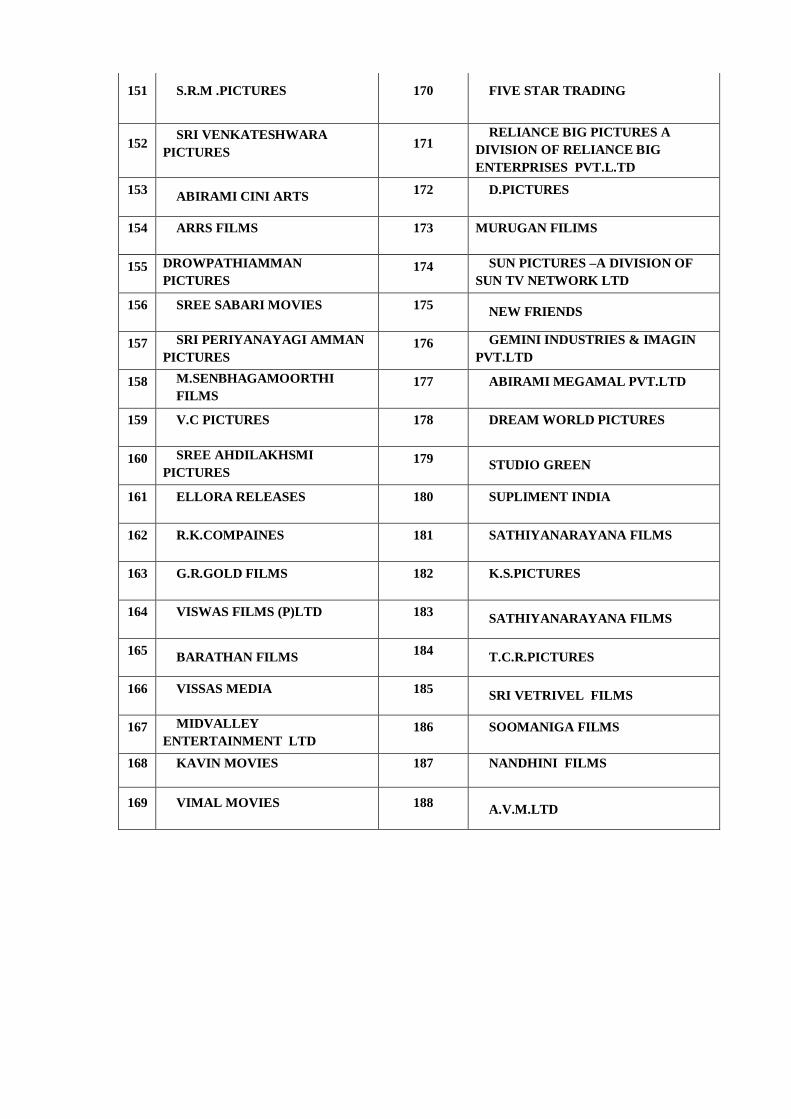
151 S.R.M .PICTURES 170 FIVE STAR TRADING
152 SRI VENKATESHWARA
PICTURES 171
RELIANCE BIG PICTURES A
DIVISION OF RELIANCE BIG
ENTERPRISES PVT.L.TD
JLVVENTERPRISES
ENTERPRISES FFHFFENTERJI
153 ABIRAMI CINI ARTS
172 D.PICTURES
154 ARRS FILMS 173 MURUGAN FILIMS
155 DROWPATHIAMMAN
PICTURES 174 SUN PICTURES –A DIVISION OF
SUN TV NETWORK LTD
156 SREE SABARI MOVIES 175 NEW FRIENDS
157 SRI PERIYANAYAGI AMMAN
PICTURES 176 GEMINI INDUSTRIES & IMAGIN
PVT.LTD
158 M.SENBHAGAMOORTHI
FILMS
177 ABIRAMI MEGAMAL PVT.LTD
159 V.C PICTURES 178 DREAM WORLD PICTURES
160 SREE AHDILAKHSMI
PICTURES 179
STUDIO GREEN
161 ELLORA RELEASES 180 SUPLIMENT INDIA
162 R.K.COMPAINES 181 SATHIYANARAYANA FILMS
163 G.R.GOLD FILMS 182 K.S.PICTURES
164 VISWAS FILMS (P)LTD 183 SATHIYANARAYANA FILMS
165 BARATHAN FILMS
184 T.C.R.PICTURES
166 VISSAS MEDIA 185 SRI VETRIVEL FILMS
167 MIDVALLEY
ENTERTAINMENT LTD 186 SOOMANIGA FILMS
168 KAVIN MOVIES 187 NANDHINI FILMS
169 VIMAL MOVIES 188
A.V.M.LTD
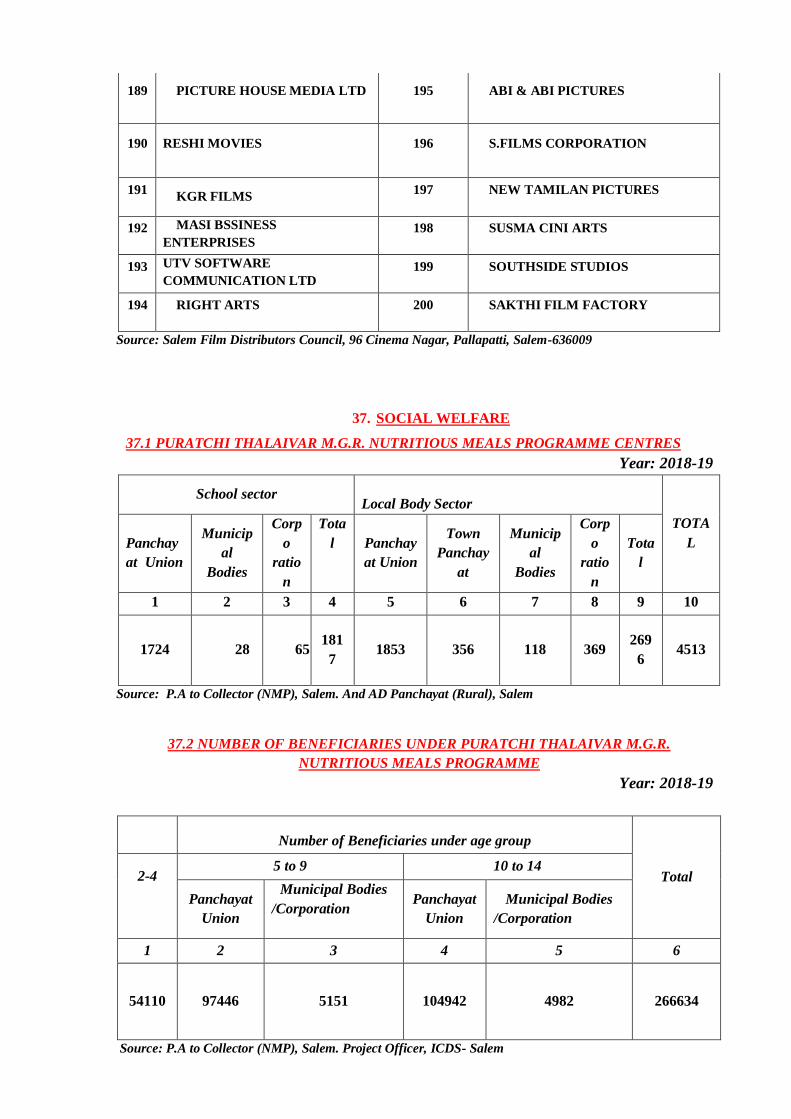
189 PICTURE HOUSE MEDIA LTD 195 ABI & ABI PICTURES
190 RESHI MOVIES 196 S.FILMS CORPORATION
191 KGR FILMS
197 NEW TAMILAN PICTURES
192 MASI BSSINESS
ENTERPRISES 198 SUSMA CINI ARTS
193 UTV SOFTWARE
COMMUNICATION LTD 199 SOUTHSIDE STUDIOS
194 RIGHT ARTS 200 SAKTHI FILM FACTORY
Source: Salem Film Distributors Council, 96 Cinema Nagar, Pallapatti, Salem-636009
37. SOCIAL WELFARE
37.1 PURATCHI THALAIVAR M.G.R. NUTRITIOUS MEALS PROGRAMME CENTRES
Year: 2018-19
School sector
Local Body Sector
TOTA
L Panchay
at Union
Municip
al
Bodies
Corp
o
ratio
n
Tota
l Panchay
at Union
Town
Panchay
at
Municip
al
Bodies
Corp
o
ratio
n
Tota
l
1 2 3 4 5 6 7 8 9 10
1724 28 65 181
7 1853 356 118 369
269
6 4513
Source: P.A to Collector (NMP), Salem. And AD Panchayat (Rural), Salem
37.2 NUMBER OF BENEFICIARIES UNDER PURATCHI THALAIVAR M.G.R.
NUTRITIOUS MEALS PROGRAMME
Year: 2018-19
Number of Beneficiaries under age group
Total
2-4
5 to 9 10 to 14
Panchayat
Union
Municipal Bodies
/Corporation
Panchayat
Union
Municipal Bodies
/Corporation
1 2 3 4 5 6
54110 97446 5151 104942 4982 266634
Source: P.A to Collector (NMP), Salem. Project Officer, ICDS- Salem
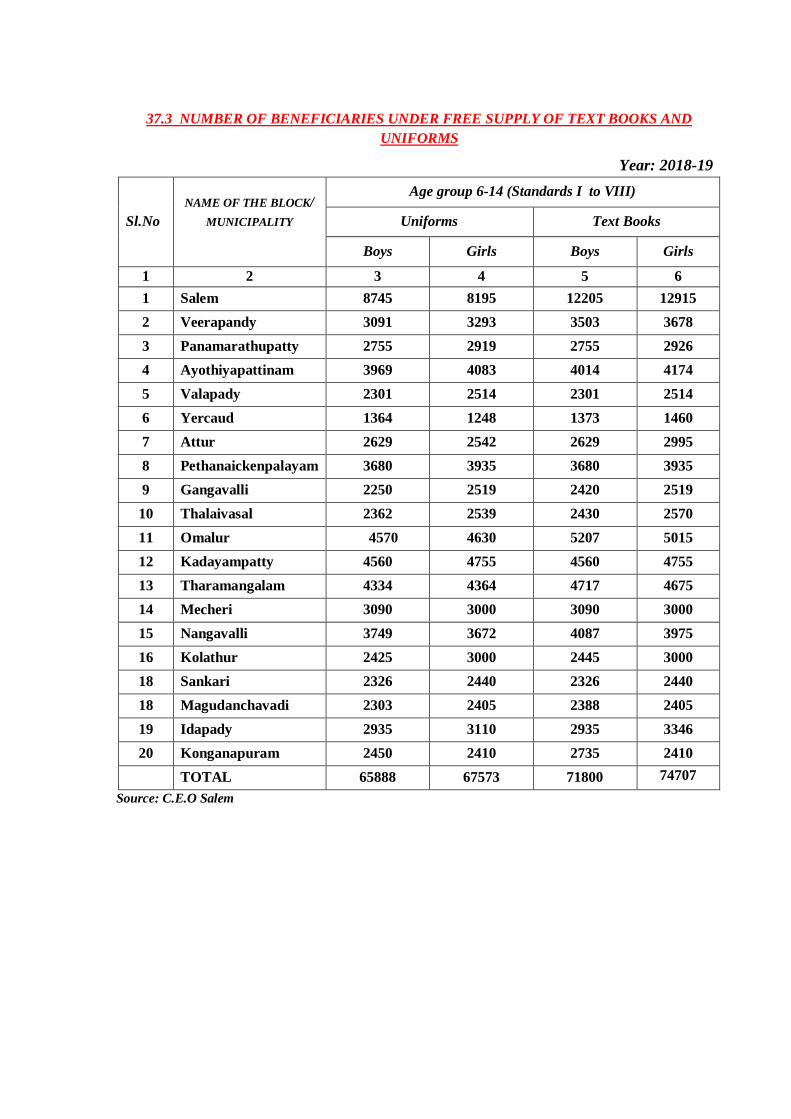
37.3 NUMBER OF BENEFICIARIES UNDER FREE SUPPLY OF TEXT BOOKS AND
UNIFORMS
Year: 2018-19
Sl.No
NAME OF THE BLOCK/
MUNICIPALITY
Age group 6-14 (Standards I to VIII)
Uniforms Text Books
Boys Girls Boys Girls
1 2 3 4 5 6
1 Salem 8745 8195 12205 12915
2 Veerapandy 3091 3293 3503 3678
3 Panamarathupatty 2755 2919 2755 2926
4 Ayothiyapattinam 3969 4083 4014 4174
5 Valapady 2301 2514 2301 2514
6 Yercaud 1364 1248 1373 1460
7 Attur 2629 2542 2629 2995
8 Pethanaickenpalayam 3680 3935 3680 3935
9 Gangavalli 2250 2519 2420 2519
10 Thalaivasal 2362 2539 2430 2570
11 Omalur 4570 4630 5207 5015
12 Kadayampatty 4560 4755 4560 4755
13 Tharamangalam 4334 4364 4717 4675
14 Mecheri 3090 3000 3090 3000
15 Nangavalli 3749 3672 4087 3975
16 Kolathur 2425 3000 2445 3000
18 Sankari 2326 2440 2326 2440
18 Magudanchavadi 2303 2405 2388 2405
19 Idapady 2935 3110 2935 3346
20 Konganapuram 2450 2410 2735 2410
TOTAL 65888 67573 71800 74707
Source: C.E.O Salem
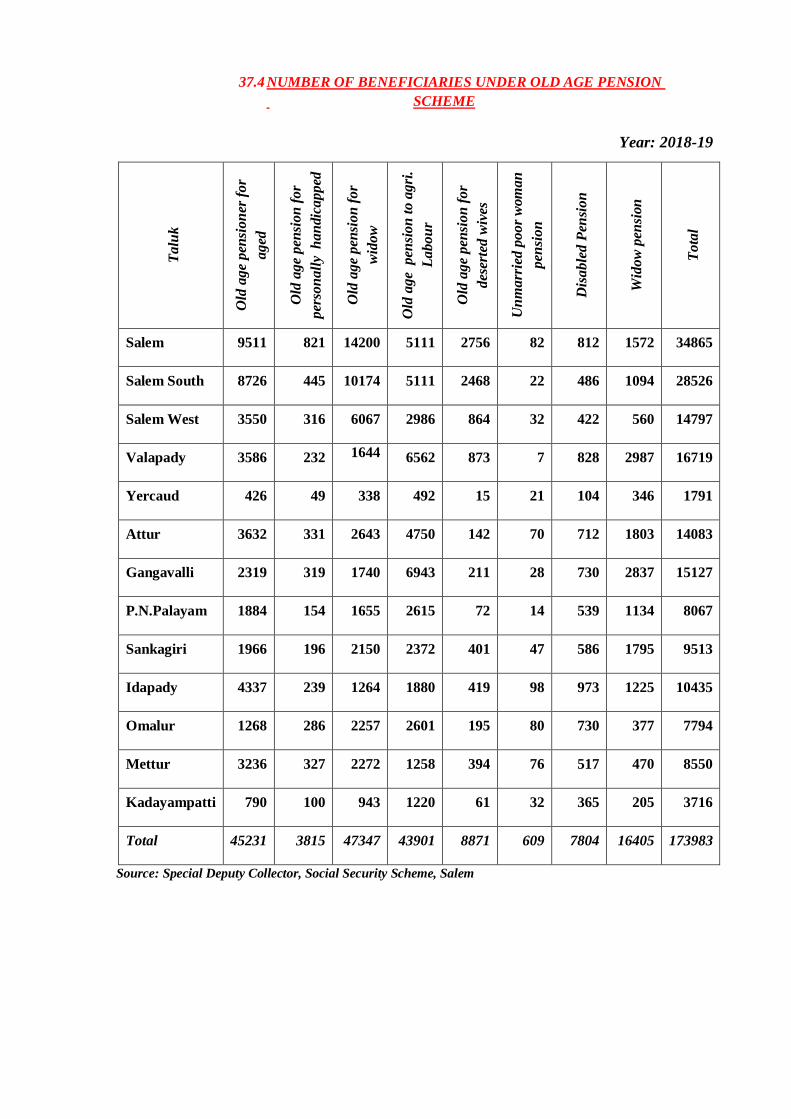
37.4 NUMBER OF BENEFICIARIES UNDER OLD AGE PENSION
SCHEME
Year: 2018-19
Ta
luk
Old
ag
e p
ensi
on
er f
or
ag
ed
Old
ag
e p
ensi
on
fo
r
per
son
all
y h
an
dic
ap
ped
Old
ag
e p
ensi
on
fo
r
wid
ow
Old
ag
e p
ensi
on
to
ag
ri.
La
bo
ur
Old
ag
e p
ensi
on
fo
r
des
erte
d w
ives
Un
ma
rrie
d p
oo
r w
om
an
pen
sio
n
Dis
ab
led
Pen
sio
n
Wid
ow
pen
sion
To
tal
Salem 9511 821 14200 5111 2756 82 812 1572 34865
Salem South 8726 445 10174 5111 2468 22 486 1094 28526
Salem West 3550 316 6067 2986 864 32 422 560 14797
Valapady 3586 232 1644
6562 873 7 828 2987 16719
Yercaud 426 49 338 492 15 21 104 346 1791
Attur 3632 331 2643 4750 142 70 712 1803 14083
Gangavalli 2319 319 1740 6943 211 28 730 2837 15127
P.N.Palayam 1884 154 1655 2615 72 14 539 1134 8067
Sankagiri 1966 196 2150 2372 401 47 586 1795 9513
Idapady 4337 239 1264 1880 419 98 973 1225 10435
Omalur 1268 286 2257 2601 195 80 730 377 7794
Mettur 3236 327 2272 1258 394 76 517 470 8550
Kadayampatti 790 100 943 1220 61 32 365 205 3716
Total 45231 3815 47347 43901 8871 609 7804 16405 173983
Source: Special Deputy Collector, Social Security Scheme, Salem
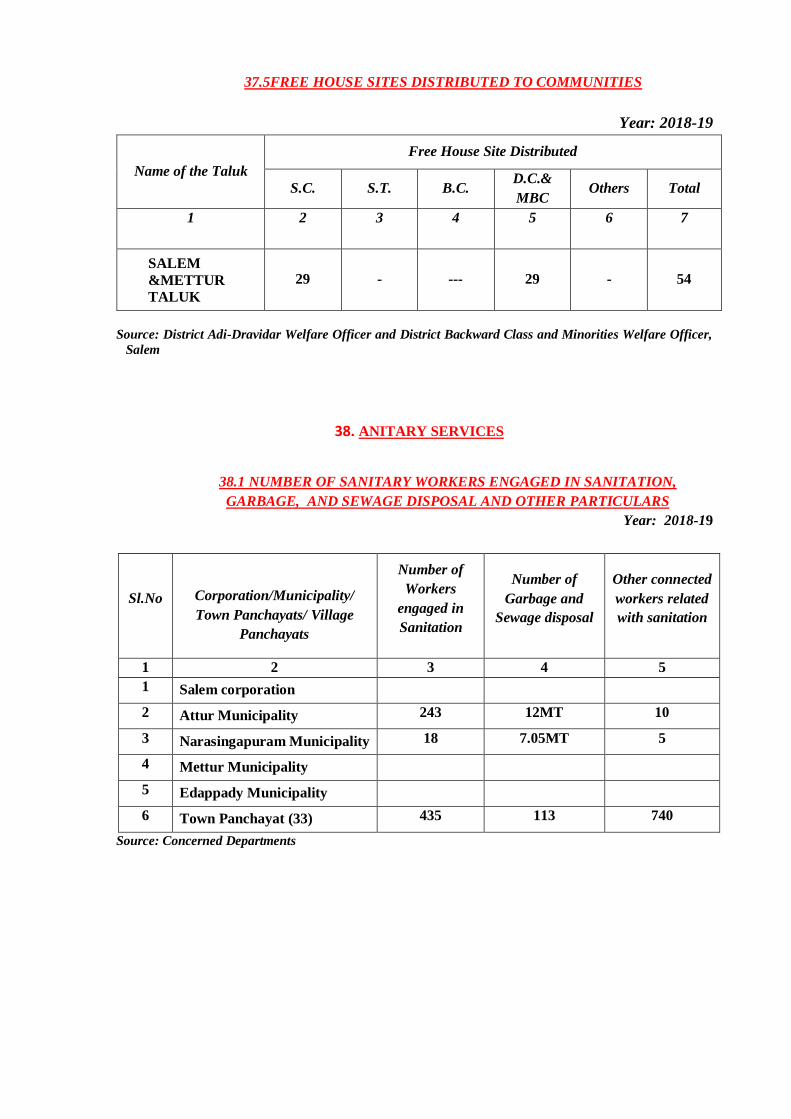
37.5FREE HOUSE SITES DISTRIBUTED TO COMMUNITIES
Year: 2018-19
Name of the Taluk
Free House Site Distributed
S.C. S.T. B.C. D.C.&
MBC Others Total
1 2 3 4 5 6 7
SALEM
&METTUR
TALUK
29 - --- 29 - 54
Source: District Adi-Dravidar Welfare Officer and District Backward Class and Minorities Welfare Officer,
Salem
38. ANITARY SERVICES
38.1 NUMBER OF SANITARY WORKERS ENGAGED IN SANITATION,
GARBAGE, AND SEWAGE DISPOSAL AND OTHER PARTICULARS
Year: 2018-19
Sl.No
Corporation/Municipality/
Town Panchayats/ Village
Panchayats
Number of
Workers
engaged in
Sanitation
Number of
Garbage and
Sewage disposal
Other connected
workers related
with sanitation
1 2 3 4 5
1 Salem corporation
2 Attur Municipality 243 12MT 10
3 Narasingapuram Municipality 18 7.05MT 5
4 Mettur Municipality
5 Edappady Municipality
6 Town Panchayat (33) 435 113 740
Source: Concerned Departments
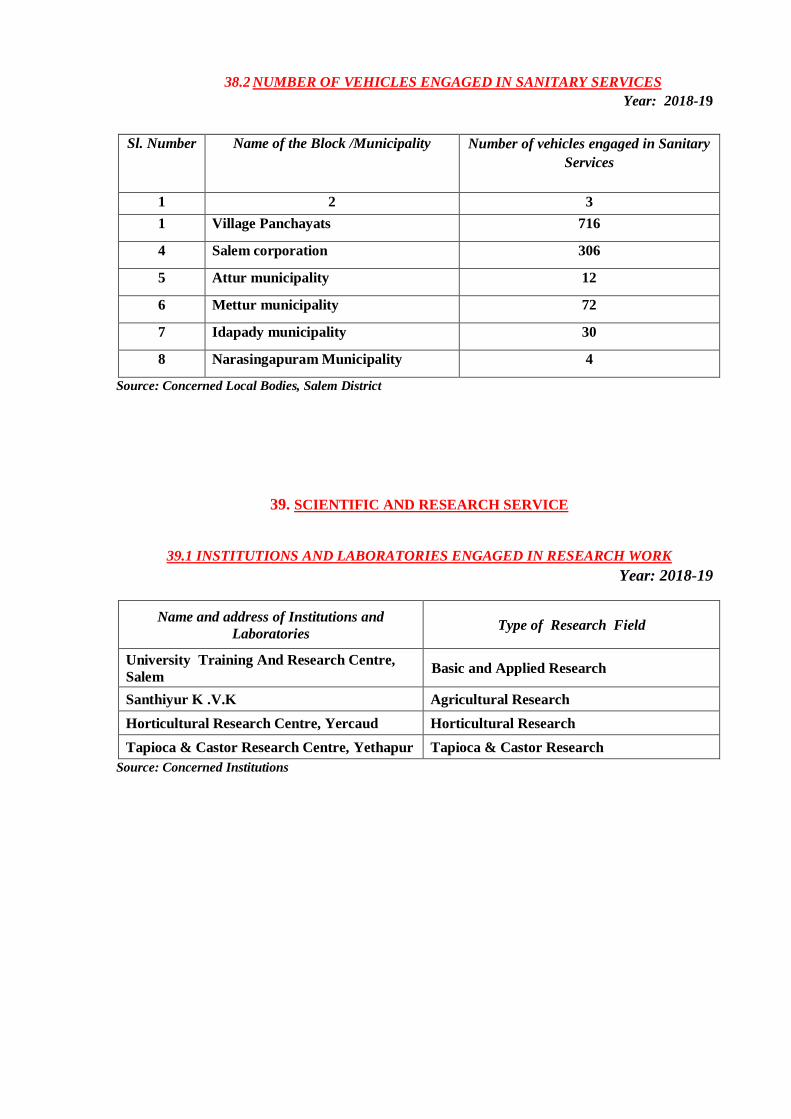
38.2 NUMBER OF VEHICLES ENGAGED IN SANITARY SERVICES
Year: 2018-19
Sl. Number
1.
Name of the Block /Municipality
2.
Number of vehicles engaged in Sanitary
Services
1 2 3
1 Village Panchayats 716
4 Salem corporation 306
5 Attur municipality 12
6 Mettur municipality 72
7 Idapady municipality 30
8 Narasingapuram Municipality 4
Source: Concerned Local Bodies, Salem District
39. SCIENTIFIC AND RESEARCH SERVICE
39.1 INSTITUTIONS AND LABORATORIES ENGAGED IN RESEARCH WORK
Year: 2018-19
Name and address of Institutions and
Laboratories Type of Research Field
University Training And Research Centre,
Salem Basic and Applied Research
Santhiyur K .V.K Agricultural Research
Horticultural Research Centre, Yercaud Horticultural Research
Tapioca & Castor Research Centre, Yethapur Tapioca & Castor Research
Source: Concerned Institutions
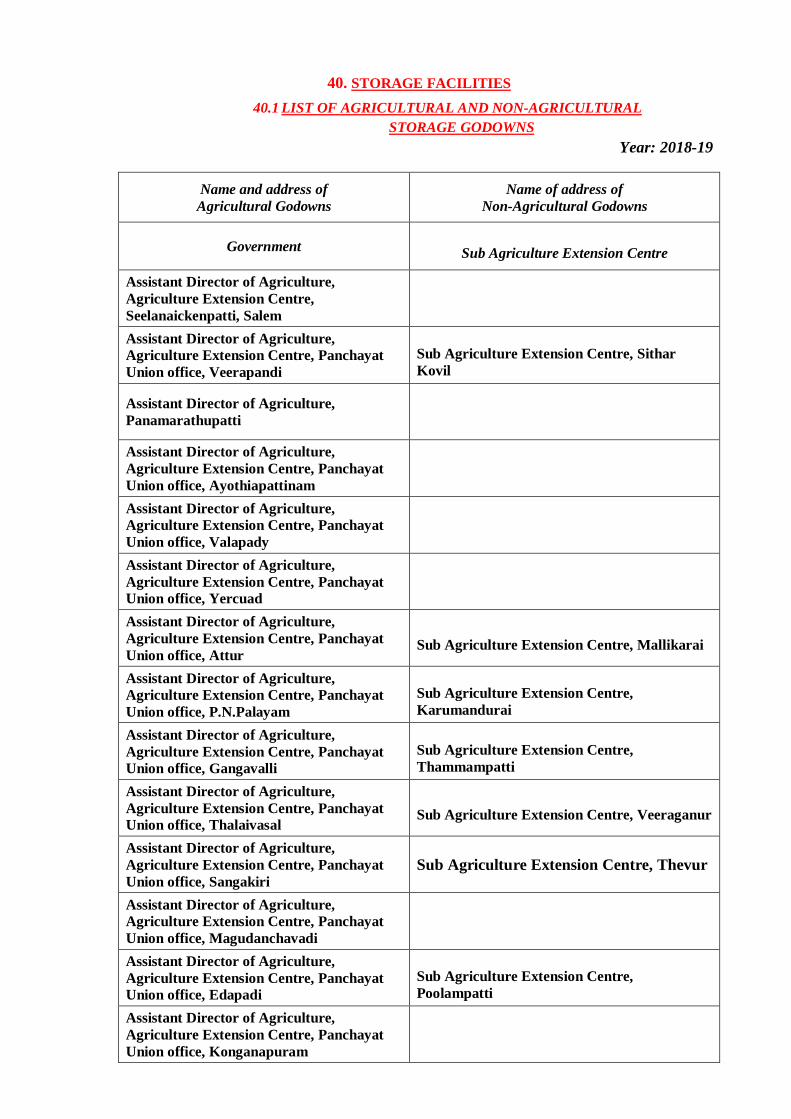
40. STORAGE FACILITIES
40.1 LIST OF AGRICULTURAL AND NON-AGRICULTURAL
STORAGE GODOWNS
Year: 2018-19
Name and address of
Agricultural Godowns
Name of address of
Non-Agricultural Godowns
Government Sub Agriculture Extension Centre
Assistant Director of Agriculture,
Agriculture Extension Centre,
Seelanaickenpatti, Salem
Assistant Director of Agriculture,
Agriculture Extension Centre, Panchayat
Union office, Veerapandi
Sub Agriculture Extension Centre, Sithar
Kovil
Assistant Director of Agriculture,
Panamarathupatti
Assistant Director of Agriculture,
Agriculture Extension Centre, Panchayat
Union office, Ayothiapattinam
Assistant Director of Agriculture,
Agriculture Extension Centre, Panchayat
Union office, Valapady
Assistant Director of Agriculture,
Agriculture Extension Centre, Panchayat
Union office, Yercuad
Assistant Director of Agriculture,
Agriculture Extension Centre, Panchayat
Union office, Attur Sub Agriculture Extension Centre, Mallikarai
Assistant Director of Agriculture,
Agriculture Extension Centre, Panchayat
Union office, P.N.Palayam
Sub Agriculture Extension Centre,
Karumandurai
Assistant Director of Agriculture,
Agriculture Extension Centre, Panchayat
Union office, Gangavalli
Sub Agriculture Extension Centre,
Thammampatti
Assistant Director of Agriculture,
Agriculture Extension Centre, Panchayat
Union office, Thalaivasal Sub Agriculture Extension Centre, Veeraganur
Assistant Director of Agriculture,
Agriculture Extension Centre, Panchayat
Union office, Sangakiri
Sub Agriculture Extension Centre, Thevur
Assistant Director of Agriculture,
Agriculture Extension Centre, Panchayat
Union office, Magudanchavadi
Assistant Director of Agriculture,
Agriculture Extension Centre, Panchayat
Union office, Edapadi
Sub Agriculture Extension Centre,
Poolampatti
Assistant Director of Agriculture,
Agriculture Extension Centre, Panchayat
Union office, Konganapuram
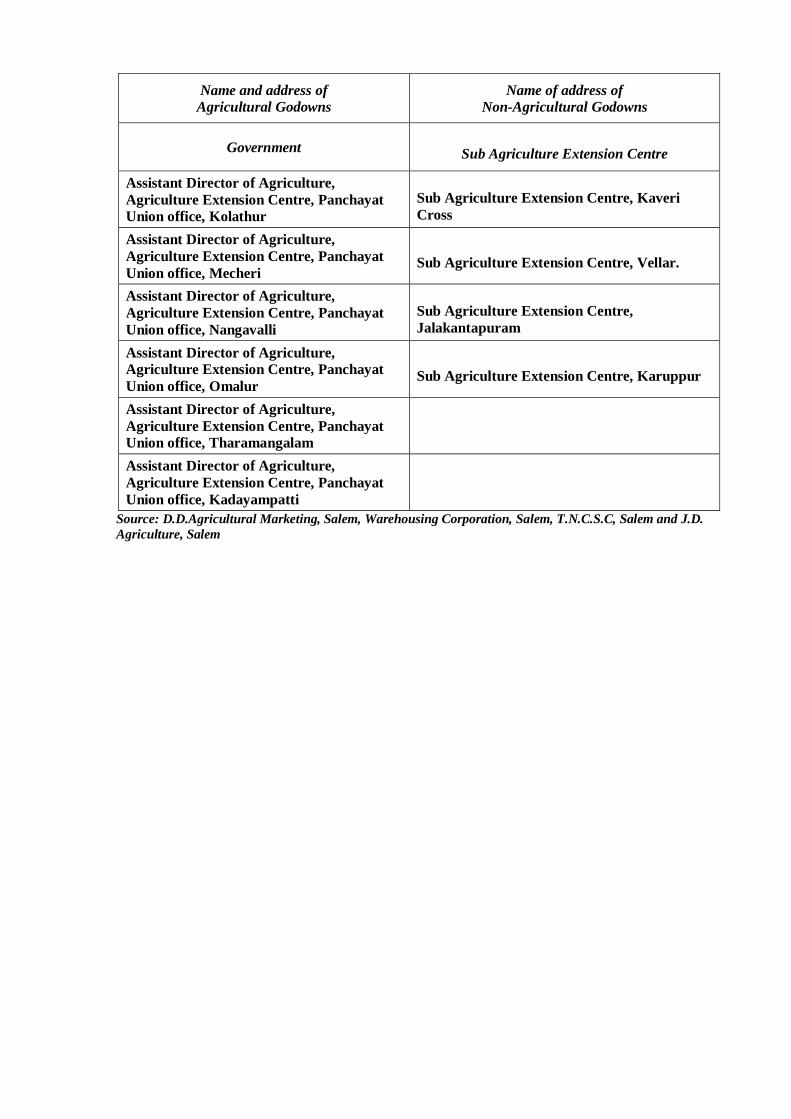
Name and address of
Agricultural Godowns
Name of address of
Non-Agricultural Godowns
Government Sub Agriculture Extension Centre
Assistant Director of Agriculture,
Agriculture Extension Centre, Panchayat
Union office, Kolathur
Sub Agriculture Extension Centre, Kaveri
Cross
Assistant Director of Agriculture,
Agriculture Extension Centre, Panchayat
Union office, Mecheri Sub Agriculture Extension Centre, Vellar.
Assistant Director of Agriculture,
Agriculture Extension Centre, Panchayat
Union office, Nangavalli
Sub Agriculture Extension Centre,
Jalakantapuram
Assistant Director of Agriculture,
Agriculture Extension Centre, Panchayat
Union office, Omalur Sub Agriculture Extension Centre, Karuppur
Assistant Director of Agriculture,
Agriculture Extension Centre, Panchayat
Union office, Tharamangalam
Assistant Director of Agriculture,
Agriculture Extension Centre, Panchayat
Union office, Kadayampatti
Source: D.D.Agricultural Marketing, Salem, Warehousing Corporation, Salem, T.N.C.S.C, Salem and J.D.
Agriculture, Salem
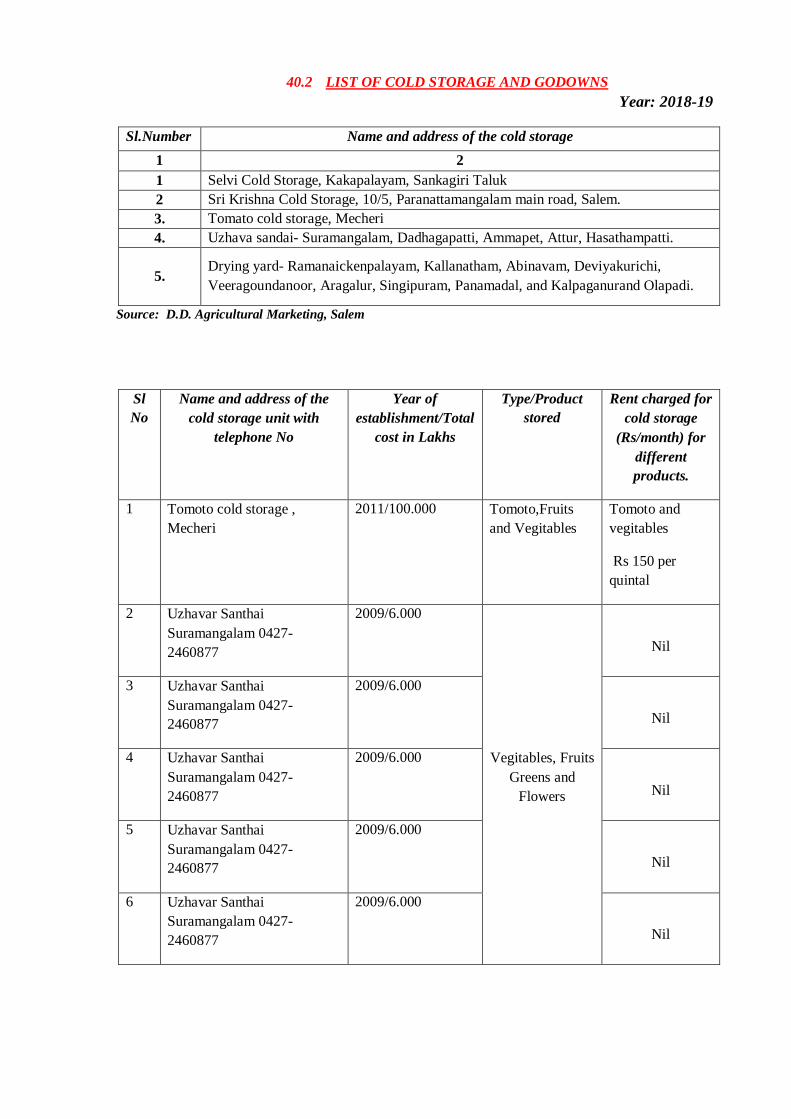
40.2 LIST OF COLD STORAGE AND GODOWNS
Year: 2018-19
Sl.Number Name and address of the cold storage
1 2
1 Selvi Cold Storage, Kakapalayam, Sankagiri Taluk
2 Sri Krishna Cold Storage, 10/5, Paranattamangalam main road, Salem.
3. Tomato cold storage, Mecheri
4. Uzhava sandai- Suramangalam, Dadhagapatti, Ammapet, Attur, Hasathampatti.
5. Drying yard- Ramanaickenpalayam, Kallanatham, Abinavam, Deviyakurichi,
Veeragoundanoor, Aragalur, Singipuram, Panamadal, and Kalpaganurand Olapadi.
Source: D.D. Agricultural Marketing, Salem
Sl
No
Name and address of the
cold storage unit with
telephone No
Year of
establishment/Total
cost in Lakhs
Type/Product
stored
Rent charged for
cold storage
(Rs/month) for
different
products.
1 Tomoto cold storage ,
Mecheri
2011/100.000 Tomoto,Fruits
and Vegitables
Tomoto and
vegitables
Rs 150 per
quintal
2 Uzhavar Santhai
Suramangalam 0427-
2460877
2009/6.000
Vegitables, Fruits
Greens and
Flowers
Nil
3 Uzhavar Santhai
Suramangalam 0427-
2460877
2009/6.000
Nil
4 Uzhavar Santhai
Suramangalam 0427-
2460877
2009/6.000
Nil
5 Uzhavar Santhai
Suramangalam 0427-
2460877
2009/6.000
Nil
6 Uzhavar Santhai
Suramangalam 0427-
2460877
2009/6.000
Nil
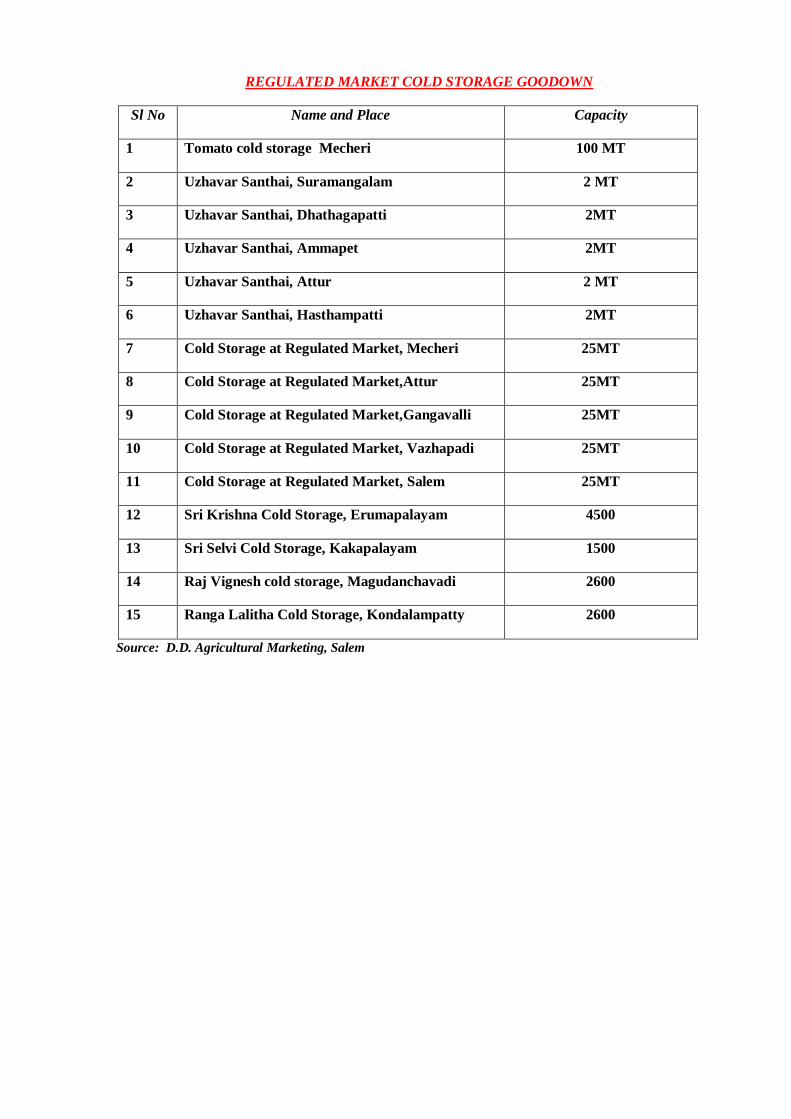
REGULATED MARKET COLD STORAGE GOODOWN
Sl No Name and Place Capacity
1 Tomato cold storage Mecheri 100 MT
2 Uzhavar Santhai, Suramangalam 2 MT
3 Uzhavar Santhai, Dhathagapatti 2MT
4 Uzhavar Santhai, Ammapet 2MT
5 Uzhavar Santhai, Attur 2 MT
6 Uzhavar Santhai, Hasthampatti 2MT
7 Cold Storage at Regulated Market, Mecheri 25MT
8 Cold Storage at Regulated Market,Attur 25MT
9 Cold Storage at Regulated Market,Gangavalli 25MT
10 Cold Storage at Regulated Market, Vazhapadi 25MT
11 Cold Storage at Regulated Market, Salem 25MT
12 Sri Krishna Cold Storage, Erumapalayam 4500
13 Sri Selvi Cold Storage, Kakapalayam 1500
14 Raj Vignesh cold storage, Magudanchavadi 2600
15 Ranga Lalitha Cold Storage, Kondalampatty 2600
Source: D.D. Agricultural Marketing, Salem
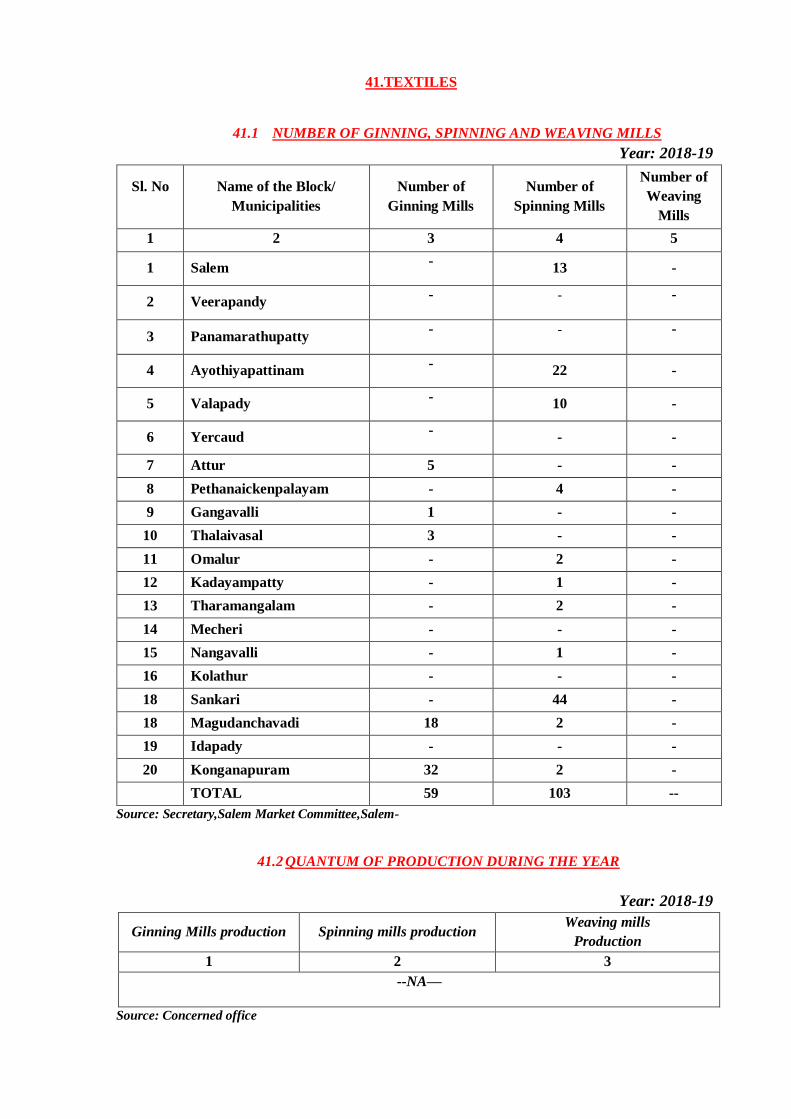
41.TEXTILES
41.1 NUMBER OF GINNING, SPINNING AND WEAVING MILLS
Year: 2018-19
Sl. No
Name of the Block/
Municipalities
Number of
Ginning Mills
Number of
Spinning Mills
Number of
Weaving
Mills
1 2 3 4 5
1 Salem -
13 -
2 Veerapandy - - -
3 Panamarathupatty - - -
4 Ayothiyapattinam -
22 -
5 Valapady -
10 -
6 Yercaud -
- -
7 Attur 5 - -
8 Pethanaickenpalayam - 4 -
9 Gangavalli 1 - -
10 Thalaivasal 3 - -
11 Omalur - 2 -
12 Kadayampatty - 1 -
13 Tharamangalam - 2 -
14 Mecheri - - -
15 Nangavalli - 1 -
16 Kolathur - - -
18 Sankari - 44 -
18 Magudanchavadi 18 2 -
19 Idapady - - -
20 Konganapuram 32 2 -
TOTAL 59 103 --
Source: Secretary,Salem Market Committee,Salem-
41.2 QUANTUM OF PRODUCTION DURING THE YEAR
Year: 2018-19
Ginning Mills production Spinning mills production Weaving mills
Production
1 2 3
--NA—
Source: Concerned office
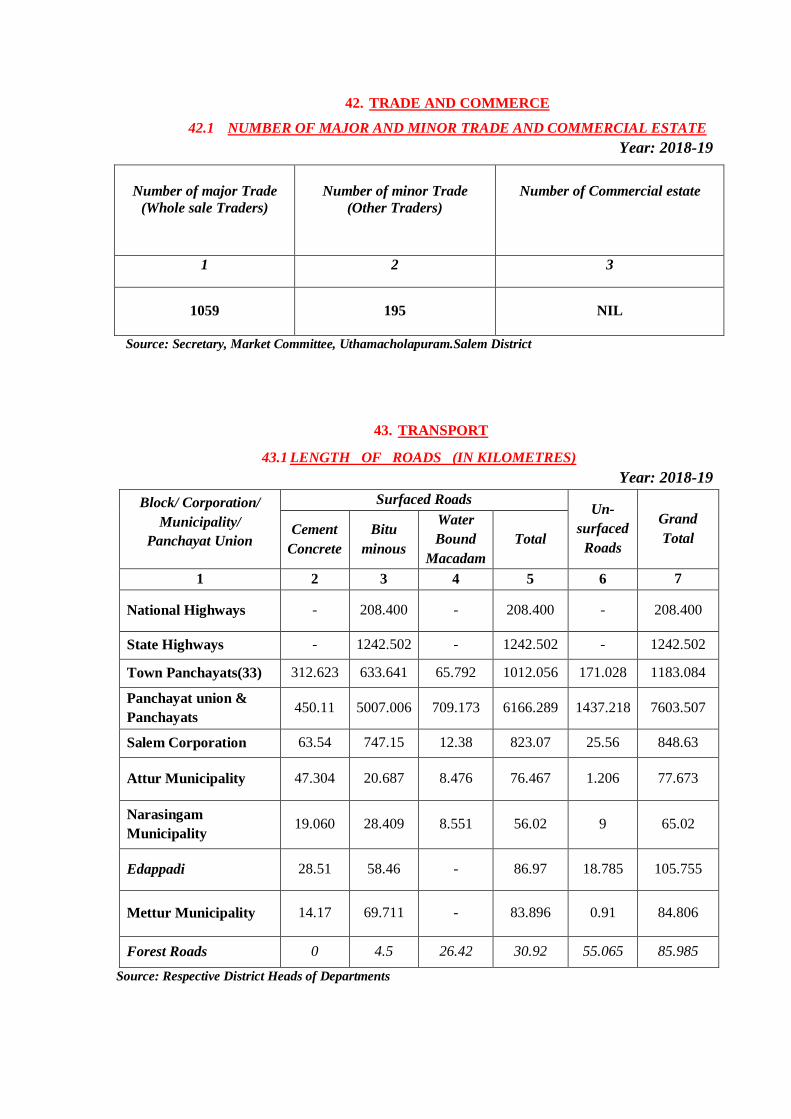
42. TRADE AND COMMERCE
42.1 NUMBER OF MAJOR AND MINOR TRADE AND COMMERCIAL ESTATE
Year: 2018-19
Number of major Trade
(Whole sale Traders)
Number of minor Trade
(Other Traders)
Number of Commercial estate
1 2 3
1059 195 NIL
Source: Secretary, Market Committee, Uthamacholapuram.Salem District
43. TRANSPORT
43.1 LENGTH OF ROADS (IN KILOMETRES)
Year: 2018-19
Block/ Corporation/
Municipality/
Panchayat Union
Surfaced Roads Un-
surfaced
Roads
Grand
Total Cement
Concrete
Bitu
minous
Water
Bound
Macadam
Total
1 2 3 4 5 6 7
National Highways - 208.400 - 208.400 - 208.400
State Highways - 1242.502 - 1242.502 - 1242.502
Town Panchayats(33) 312.623 633.641 65.792 1012.056 171.028 1183.084
Panchayat union &
Panchayats 450.11 5007.006 709.173 6166.289 1437.218 7603.507
Salem Corporation 63.54 747.15 12.38 823.07 25.56 848.63
Attur Municipality 47.304 20.687 8.476 76.467 1.206 77.673
Narasingam
Municipality 19.060 28.409 8.551 56.02 9 65.02
Edappadi 28.51 58.46 - 86.97 18.785 105.755
Mettur Municipality 14.17 69.711 - 83.896 0.91 84.806
Forest Roads 0 4.5 26.42 30.92 55.065 85.985
Source: Respective District Heads of Departments
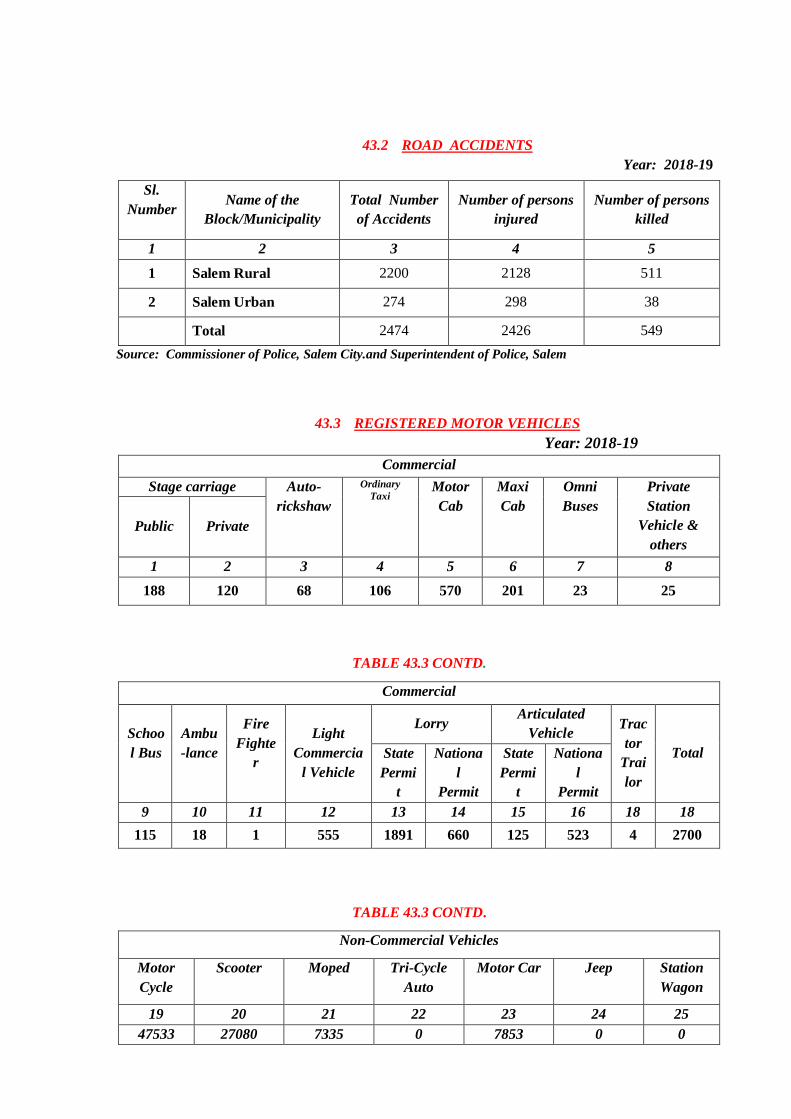
43.2 ROAD ACCIDENTS
Year: 2018-19
Sl.
Number
Name of the
Block/Municipality
Total Number
of Accidents
Number of persons
injured
Number of persons
killed
1 2 3 4 5
1 Salem Rural 2200 2128 511
2 Salem Urban 274 298 38
Total 2474 2426 549
Source: Commissioner of Police, Salem City.and Superintendent of Police, Salem
43.3 REGISTERED MOTOR VEHICLES
Year: 2018-19
Commercial
Stage carriage Auto-
rickshaw
Ordinary
Taxi
Motor
Cab
Maxi
Cab
Omni
Buses
Private
Station
Vehicle &
others
Public Private
1 2 3 4 5 6 7 8
188 120 68 106 570 201 23 25
TABLE 43.3 CONTD.
Commercial
Schoo
l Bus
Ambu
-lance
Fire
Fighte
r
Light
Commercia
l Vehicle
Lorry Articulated
Vehicle Trac
tor
Trai
lor
Total State
Permi
t
Nationa
l
Permit
State
Permi
t
Nationa
l
Permit
9 10 11 12 13 14 15 16 18 18
115 18 1 555 1891 660 125 523 4 2700
TABLE 43.3 CONTD.
Non-Commercial Vehicles
Motor
Cycle
Scooter
Moped
Tri-Cycle
Auto
Motor Car
Jeep
Station
Wagon
19 20 21 22 23 24 25
47533 27080 7335 0 7853 0 0
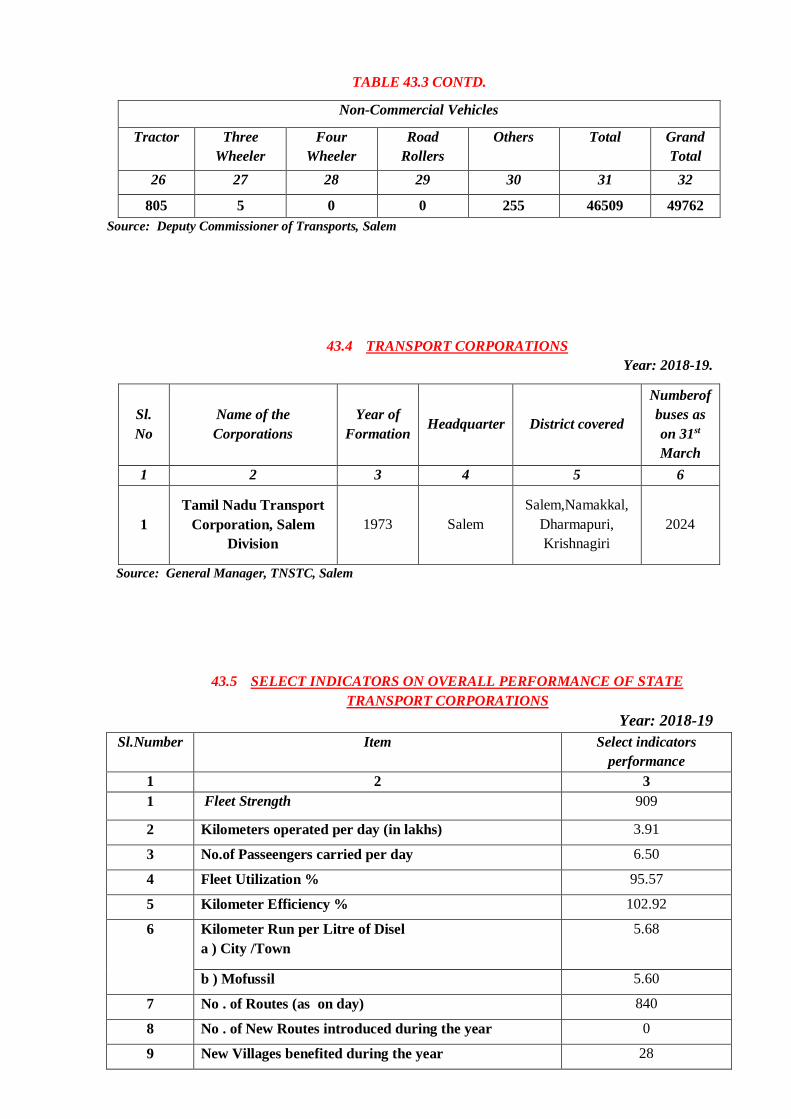
TABLE 43.3 CONTD.
Non-Commercial Vehicles
Tractor
Three
Wheeler
Four
Wheeler
Road
Rollers
Others
Total
Grand
Total
26 27 28 29 30 31 32
805 5 0 0 255 46509 49762
Source: Deputy Commissioner of Transports, Salem
43.4 TRANSPORT CORPORATIONS
Year: 2018-19.
Sl.
No
Name of the
Corporations
Year of
Formation Headquarter District covered
Numberof
buses as
on 31st
March
1 2 3 4 5 6
1
Tamil Nadu Transport
Corporation, Salem
Division
1973 Salem
Salem,Namakkal,
Dharmapuri,
Krishnagiri
2024
Source: General Manager, TNSTC, Salem
43.5 SELECT INDICATORS ON OVERALL PERFORMANCE OF STATE
TRANSPORT CORPORATIONS
Year: 2018-19
Sl.Number
Item
Select indicators
performance
1 2 3
1 Fleet Strength 909
2 Kilometers operated per day (in lakhs) 3.91
3 No.of Passeengers carried per day 6.50
4 Fleet Utilization % 95.57
5 Kilometer Efficiency % 102.92
6 Kilometer Run per Litre of Disel
a ) City /Town
5.68
b ) Mofussil 5.60
7 No . of Routes (as on day) 840
8 No . of New Routes introduced during the year 0
9 New Villages benefited during the year 28
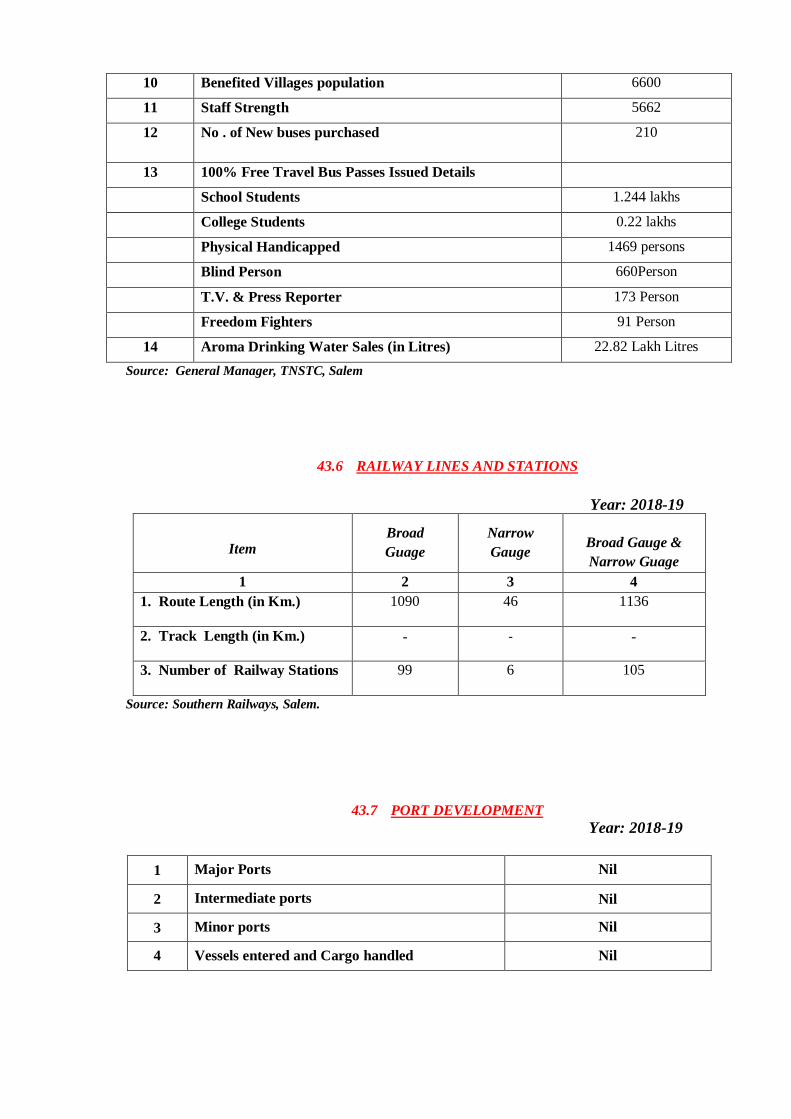
10 Benefited Villages population 6600
11 Staff Strength 5662
12 No . of New buses purchased 210
13
100% Free Travel Bus Passes Issued Details
School Students 1.244 lakhs
College Students 0.22 lakhs
Physical Handicapped 1469 persons
Blind Person 660Person
T.V. & Press Reporter 173 Person
Freedom Fighters 91 Person
14 Aroma Drinking Water Sales (in Litres) 22.82 Lakh Litres
Source: General Manager, TNSTC, Salem
43.6 RAILWAY LINES AND STATIONS
Year: 2018-19
Item Broad
Guage
Narrow
Gauge
Broad Gauge &
Narrow Guage
1 2 3 4
1. Route Length (in Km.) 1090 46 1136
2. Track Length (in Km.) - - -
3. Number of Railway Stations 99 6 105
Source: Southern Railways, Salem.
43.7 PORT DEVELOPMENT
Year: 2018-19
1 Major Ports Nil
2 Intermediate ports Nil
3 Minor ports Nil
4 Vessels entered and Cargo handled Nil
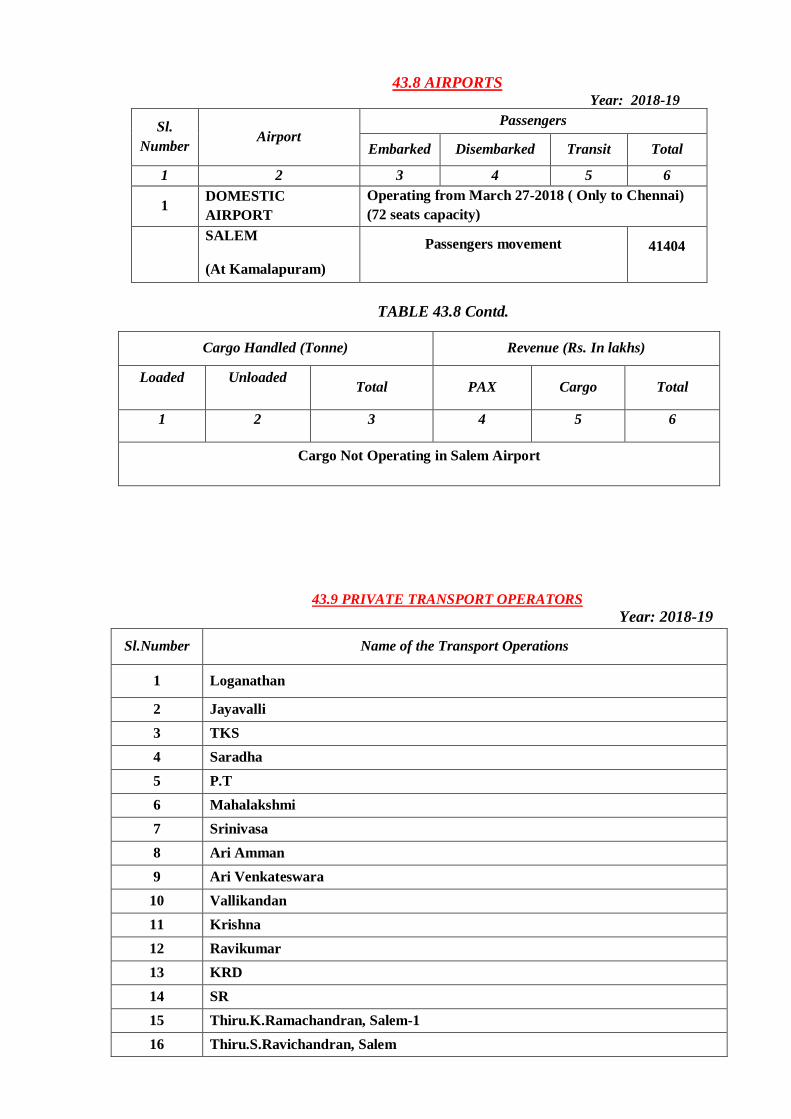
43.8 AIRPORTS Year: 2018-19
Sl.
Number Airport
Passengers
Embarked Disembarked Transit Total
1 2 3 4 5 6
1 DOMESTIC
AIRPORT
Operating from March 27-2018 ( Only to Chennai)
(72 seats capacity)
SALEM
(At Kamalapuram)
Passengers movement
41404
TABLE 43.8 Contd.
Cargo Handled (Tonne) Revenue (Rs. In lakhs)
Loaded
Unloaded
Total PAX Cargo Total
1 2 3 4 5 6
Cargo Not Operating in Salem Airport
43.9 PRIVATE TRANSPORT OPERATORS
Year: 2018-19
Sl.Number Name of the Transport Operations
1 Loganathan
2 Jayavalli
3 TKS
4 Saradha
5 P.T
6 Mahalakshmi
7 Srinivasa
8 Ari Amman
9 Ari Venkateswara
10 Vallikandan
11 Krishna
12 Ravikumar
13 KRD
14 SR
15 Thiru.K.Ramachandran, Salem-1
16 Thiru.S.Ravichandran, Salem
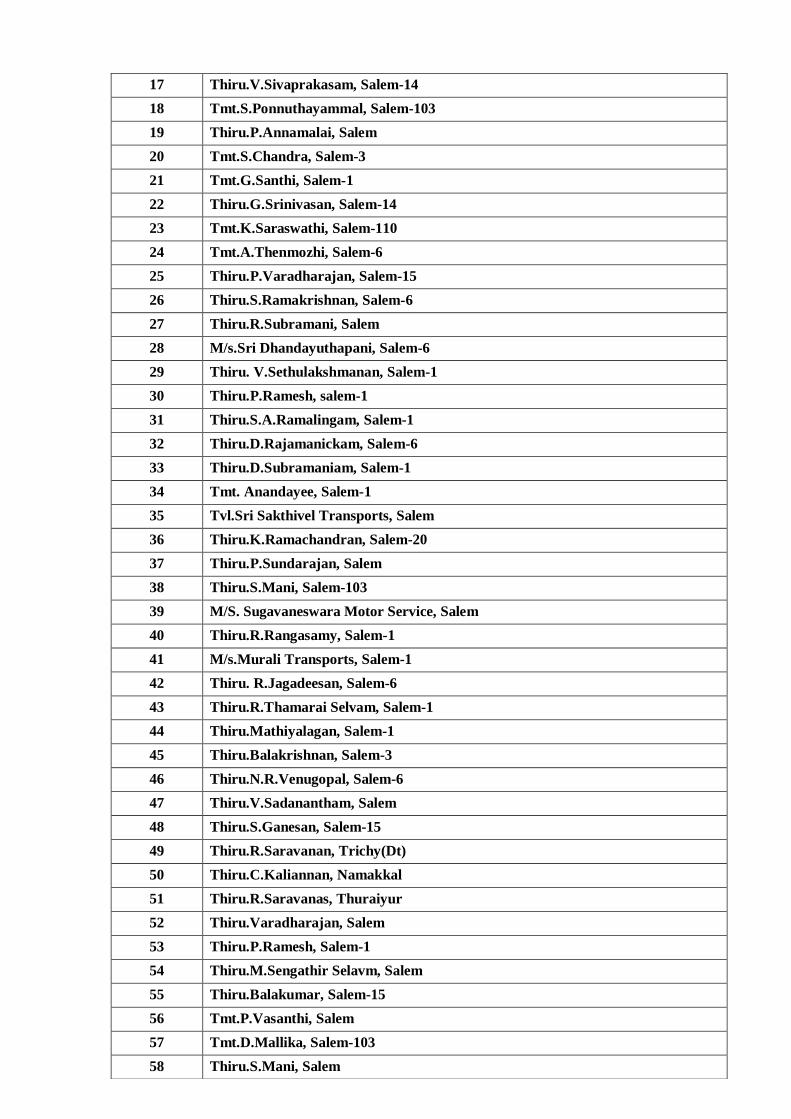
17 Thiru.V.Sivaprakasam, Salem-14
18 Tmt.S.Ponnuthayammal, Salem-103
19 Thiru.P.Annamalai, Salem
20 Tmt.S.Chandra, Salem-3
21 Tmt.G.Santhi, Salem-1
22 Thiru.G.Srinivasan, Salem-14
23 Tmt.K.Saraswathi, Salem-110
24 Tmt.A.Thenmozhi, Salem-6
25 Thiru.P.Varadharajan, Salem-15
26 Thiru.S.Ramakrishnan, Salem-6
27 Thiru.R.Subramani, Salem
28 M/s.Sri Dhandayuthapani, Salem-6
29 Thiru. V.Sethulakshmanan, Salem-1
30 Thiru.P.Ramesh, salem-1
31 Thiru.S.A.Ramalingam, Salem-1
32 Thiru.D.Rajamanickam, Salem-6
33 Thiru.D.Subramaniam, Salem-1
34 Tmt. Anandayee, Salem-1
35 Tvl.Sri Sakthivel Transports, Salem
36 Thiru.K.Ramachandran, Salem-20
37 Thiru.P.Sundarajan, Salem
38 Thiru.S.Mani, Salem-103
39 M/S. Sugavaneswara Motor Service, Salem
40 Thiru.R.Rangasamy, Salem-1
41 M/s.Murali Transports, Salem-1
42 Thiru. R.Jagadeesan, Salem-6
43 Thiru.R.Thamarai Selvam, Salem-1
44 Thiru.Mathiyalagan, Salem-1
45 Thiru.Balakrishnan, Salem-3
46 Thiru.N.R.Venugopal, Salem-6
47 Thiru.V.Sadanantham, Salem
48 Thiru.S.Ganesan, Salem-15
49 Thiru.R.Saravanan, Trichy(Dt)
50 Thiru.C.Kaliannan, Namakkal
51 Thiru.R.Saravanas, Thuraiyur
52 Thiru.Varadharajan, Salem
53 Thiru.P.Ramesh, Salem-1
54 Thiru.M.Sengathir Selavm, Salem
55 Thiru.Balakumar, Salem-15
56 Tmt.P.Vasanthi, Salem
57 Tmt.D.Mallika, Salem-103
58 Thiru.S.Mani, Salem
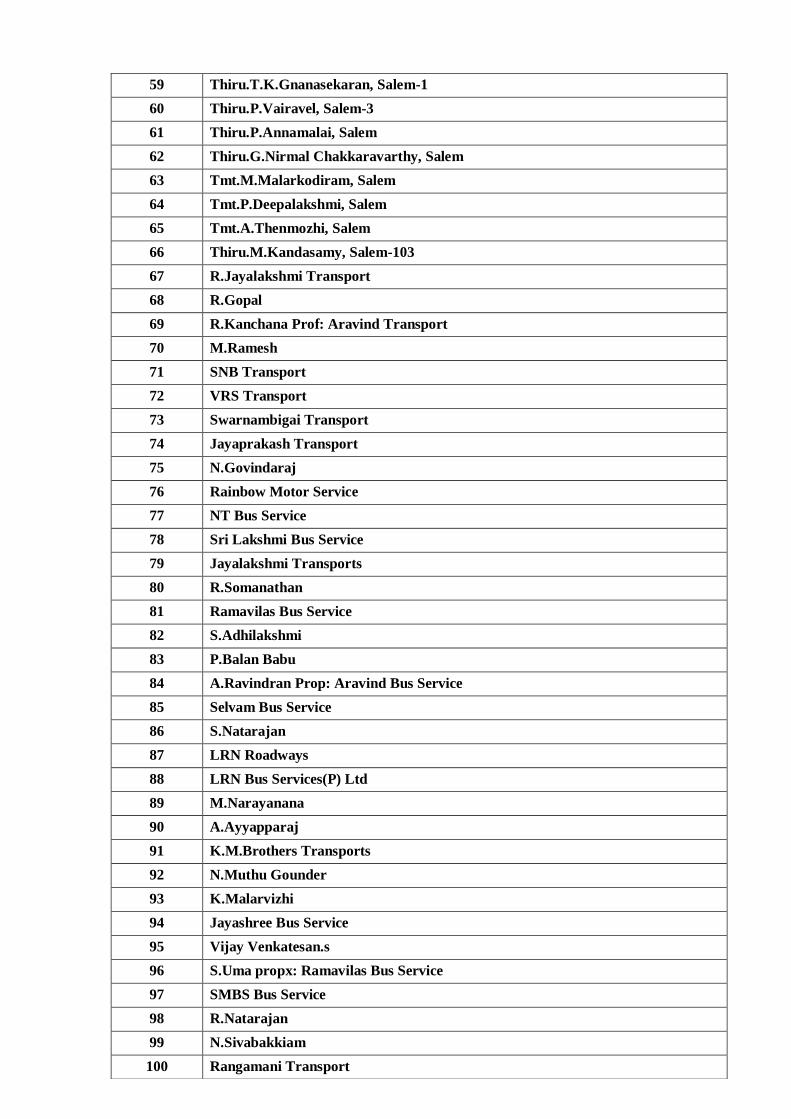
59 Thiru.T.K.Gnanasekaran, Salem-1
60 Thiru.P.Vairavel, Salem-3
61 Thiru.P.Annamalai, Salem
62 Thiru.G.Nirmal Chakkaravarthy, Salem
63 Tmt.M.Malarkodiram, Salem
64 Tmt.P.Deepalakshmi, Salem
65 Tmt.A.Thenmozhi, Salem
66 Thiru.M.Kandasamy, Salem-103
67 R.Jayalakshmi Transport
68 R.Gopal
69 R.Kanchana Prof: Aravind Transport
70 M.Ramesh
71 SNB Transport
72 VRS Transport
73 Swarnambigai Transport
74 Jayaprakash Transport
75 N.Govindaraj
76 Rainbow Motor Service
77 NT Bus Service
78 Sri Lakshmi Bus Service
79 Jayalakshmi Transports
80 R.Somanathan
81 Ramavilas Bus Service
82 S.Adhilakshmi
83 P.Balan Babu
84 A.Ravindran Prop: Aravind Bus Service
85 Selvam Bus Service
86 S.Natarajan
87 LRN Roadways
88 LRN Bus Services(P) Ltd
89 M.Narayanana
90 A.Ayyapparaj
91 K.M.Brothers Transports
92 N.Muthu Gounder
93 K.Malarvizhi
94 Jayashree Bus Service
95 Vijay Venkatesan.s
96 S.Uma propx: Ramavilas Bus Service
97 SMBS Bus Service
98 R.Natarajan
99 N.Sivabakkiam
100 Rangamani Transport
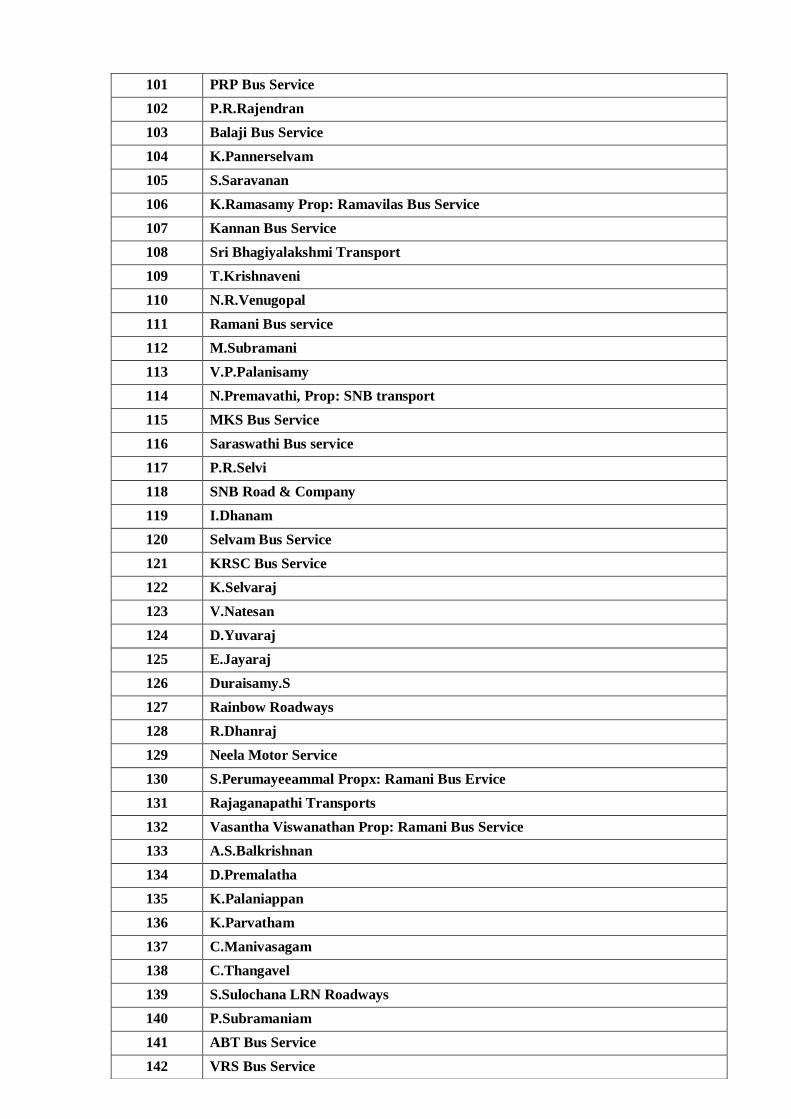
101 PRP Bus Service
102 P.R.Rajendran
103 Balaji Bus Service
104 K.Pannerselvam
105 S.Saravanan
106 K.Ramasamy Prop: Ramavilas Bus Service
107 Kannan Bus Service
108 Sri Bhagiyalakshmi Transport
109 T.Krishnaveni
110 N.R.Venugopal
111 Ramani Bus service
112 M.Subramani
113 V.P.Palanisamy
114 N.Premavathi, Prop: SNB transport
115 MKS Bus Service
116 Saraswathi Bus service
117 P.R.Selvi
118 SNB Road & Company
119 I.Dhanam
120 Selvam Bus Service
121 KRSC Bus Service
122 K.Selvaraj
123 V.Natesan
124 D.Yuvaraj
125 E.Jayaraj
126 Duraisamy.S
127 Rainbow Roadways
128 R.Dhanraj
129 Neela Motor Service
130 S.Perumayeeammal Propx: Ramani Bus Ervice
131 Rajaganapathi Transports
132 Vasantha Viswanathan Prop: Ramani Bus Service
133 A.S.Balkrishnan
134 D.Premalatha
135 K.Palaniappan
136 K.Parvatham
137 C.Manivasagam
138 C.Thangavel
139 S.Sulochana LRN Roadways
140 P.Subramaniam
141 ABT Bus Service
142 VRS Bus Service
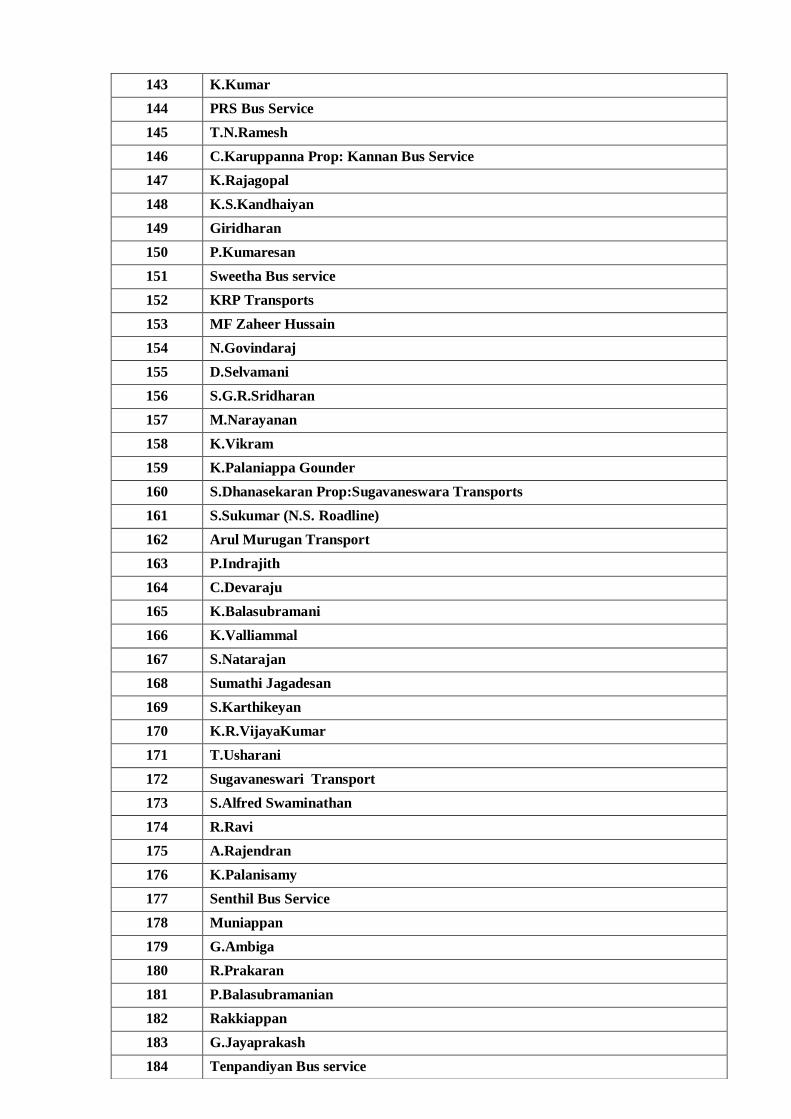
143 K.Kumar
144 PRS Bus Service
145 T.N.Ramesh
146 C.Karuppanna Prop: Kannan Bus Service
147 K.Rajagopal
148 K.S.Kandhaiyan
149 Giridharan
150 P.Kumaresan
151 Sweetha Bus service
152 KRP Transports
153 MF Zaheer Hussain
154 N.Govindaraj
155 D.Selvamani
156 S.G.R.Sridharan
157 M.Narayanan
158 K.Vikram
159 K.Palaniappa Gounder
160 S.Dhanasekaran Prop:Sugavaneswara Transports
161 S.Sukumar (N.S. Roadline)
162 Arul Murugan Transport
163 P.Indrajith
164 C.Devaraju
165 K.Balasubramani
166 K.Valliammal
167 S.Natarajan
168 Sumathi Jagadesan
169 S.Karthikeyan
170 K.R.VijayaKumar
171 T.Usharani
172 Sugavaneswari Transport
173 S.Alfred Swaminathan
174 R.Ravi
175 A.Rajendran
176 K.Palanisamy
177 Senthil Bus Service
178 Muniappan
179 G.Ambiga
180 R.Prakaran
181 P.Balasubramanian
182 Rakkiappan
183 G.Jayaprakash
184 Tenpandiyan Bus service
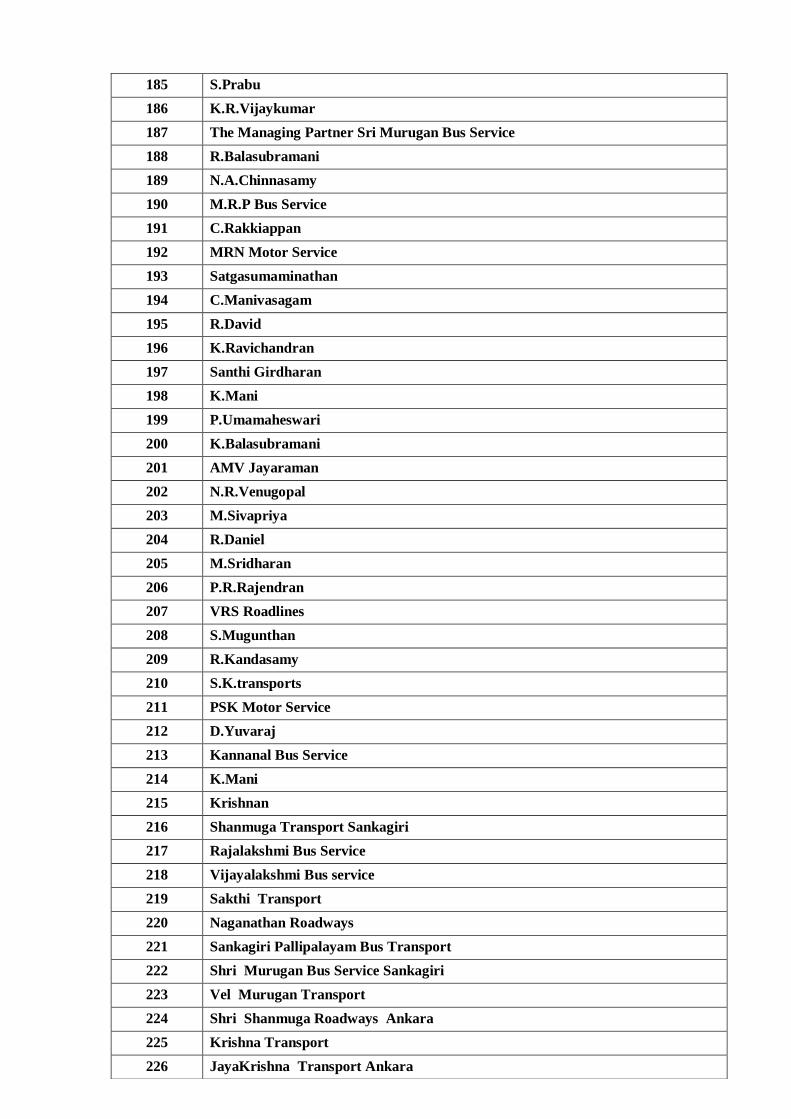
185 S.Prabu
186 K.R.Vijaykumar
187 The Managing Partner Sri Murugan Bus Service
188 R.Balasubramani
189 N.A.Chinnasamy
190 M.R.P Bus Service
191 C.Rakkiappan
192 MRN Motor Service
193 Satgasumaminathan
194 C.Manivasagam
195 R.David
196 K.Ravichandran
197 Santhi Girdharan
198 K.Mani
199 P.Umamaheswari
200 K.Balasubramani
201 AMV Jayaraman
202 N.R.Venugopal
203 M.Sivapriya
204 R.Daniel
205 M.Sridharan
206 P.R.Rajendran
207 VRS Roadlines
208 S.Mugunthan
209 R.Kandasamy
210 S.K.transports
211 PSK Motor Service
212 D.Yuvaraj
213 Kannanal Bus Service
214 K.Mani
215 Krishnan
216 Shanmuga Transport Sankagiri
217 Rajalakshmi Bus Service
218 Vijayalakshmi Bus service
219 Sakthi Transport
220 Naganathan Roadways
221 Sankagiri Pallipalayam Bus Transport
222 Shri Murugan Bus Service Sankagiri
223 Vel Murugan Transport
224 Shri Shanmuga Roadways Ankara
225 Krishna Transport
226 JayaKrishna Transport Ankara
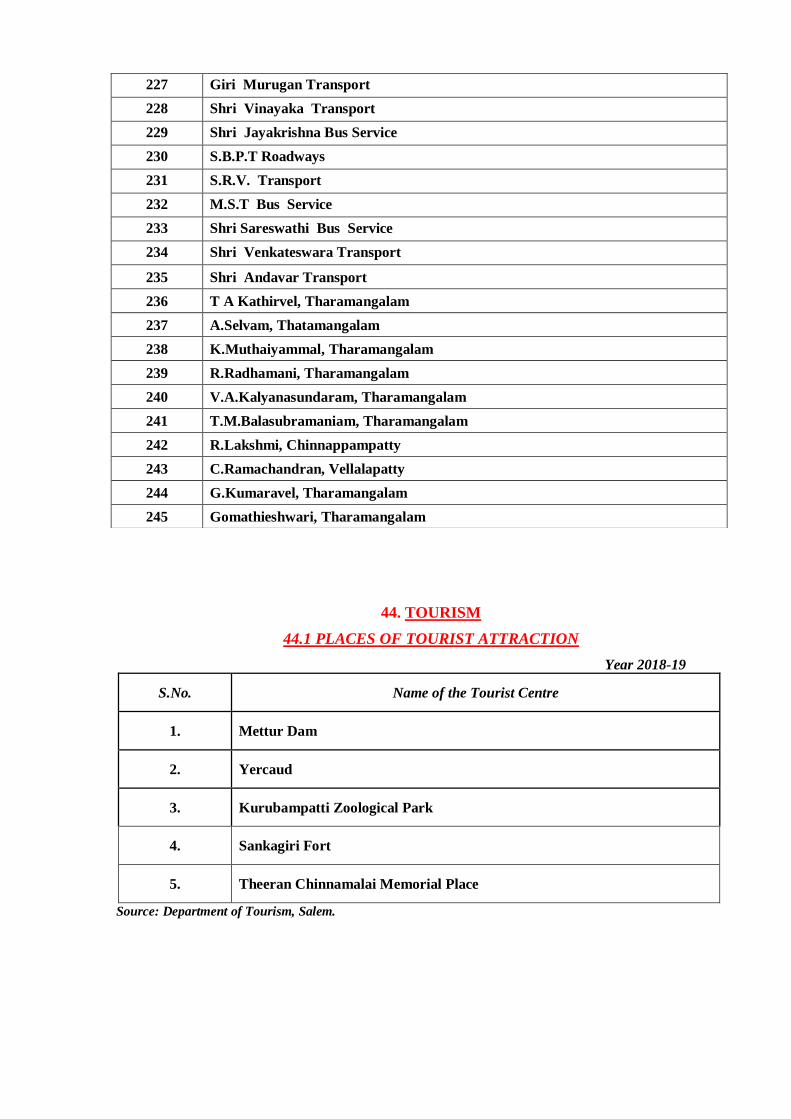
44. TOURISM
44.1 PLACES OF TOURIST ATTRACTION
Year 2018-19
S.No. Name of the Tourist Centre
1. Mettur Dam
2. Yercaud
3. Kurubampatti Zoological Park
4. Sankagiri Fort
5. Theeran Chinnamalai Memorial Place
Source: Department of Tourism, Salem.
227 Giri Murugan Transport
228 Shri Vinayaka Transport
229 Shri Jayakrishna Bus Service
230 S.B.P.T Roadways
231 S.R.V. Transport
232 M.S.T Bus Service
233 Shri Sareswathi Bus Service
234 Shri Venkateswara Transport
235 Shri Andavar Transport
236 T A Kathirvel, Tharamangalam
237 A.Selvam, Thatamangalam
238 K.Muthaiyammal, Tharamangalam
239 R.Radhamani, Tharamangalam
240 V.A.Kalyanasundaram, Tharamangalam
241 T.M.Balasubramaniam, Tharamangalam
242 R.Lakshmi, Chinnappampatty
243 C.Ramachandran, Vellalapatty
244 G.Kumaravel, Tharamangalam
245 Gomathieshwari, Tharamangalam
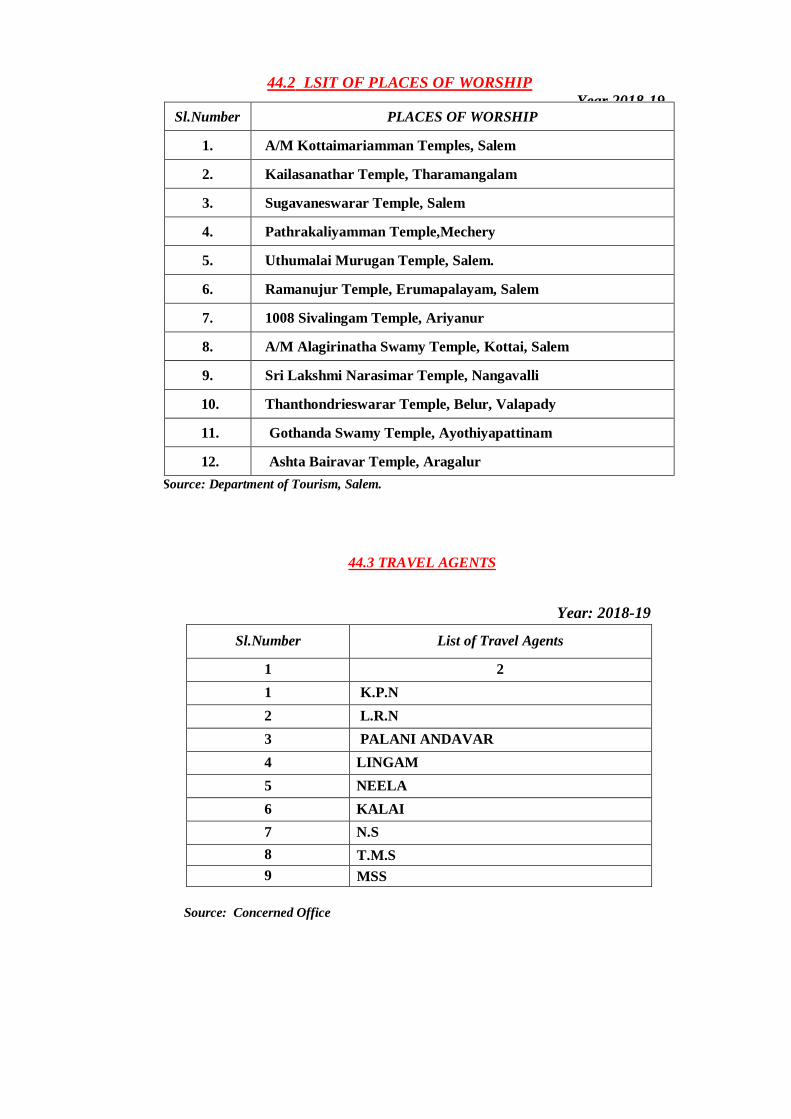
44.2 LSIT OF PLACES OF WORSHIP
Year 2018-19
Sl.Number PLACES OF WORSHIP
1. A/M Kottaimariamman Temples, Salem
2. Kailasanathar Temple, Tharamangalam
3. Sugavaneswarar Temple, Salem
4. Pathrakaliyamman Temple,Mechery
5. Uthumalai Murugan Temple, Salem.
6. Ramanujur Temple, Erumapalayam, Salem
7. 1008 Sivalingam Temple, Ariyanur
8. A/M Alagirinatha Swamy Temple, Kottai, Salem
9. Sri Lakshmi Narasimar Temple, Nangavalli
10. Thanthondrieswarar Temple, Belur, Valapady
11. Gothanda Swamy Temple, Ayothiyapattinam
12. Ashta Bairavar Temple, Aragalur
Source: Department of Tourism, Salem.
44.3 TRAVEL AGENTS
Year: 2018-19
Sl.Number List of Travel Agents
1 2
1 K.P.N
2 L.R.N
3 PALANI ANDAVAR
4 LINGAM
5 NEELA
6 KALAI
7 N.S
8 T.M.S
9 MSS
Source: Concerned Office
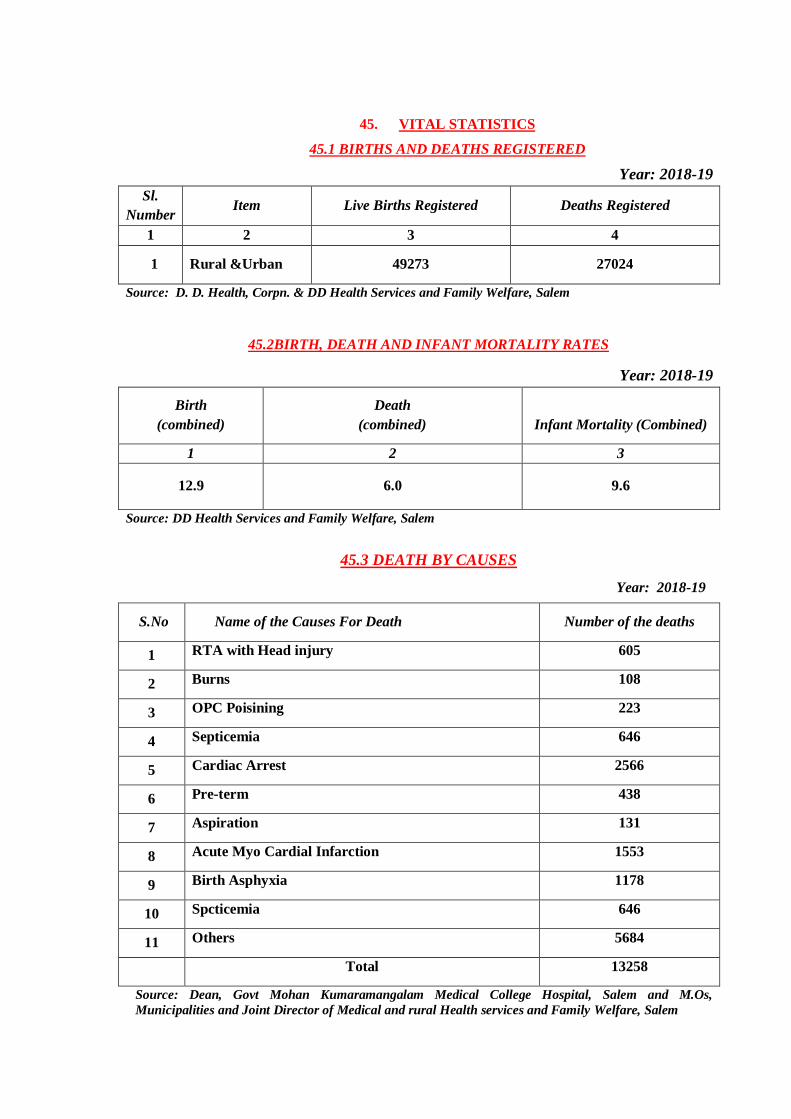
45. VITAL STATISTICS
45.1 BIRTHS AND DEATHS REGISTERED
Year: 2018-19
Sl.
Number Item Live Births Registered Deaths Registered
1 2 3 4
1 Rural &Urban 49273 27024
Source: D. D. Health, Corpn. & DD Health Services and Family Welfare, Salem
45.2BIRTH, DEATH AND INFANT MORTALITY RATES
Year: 2018-19
Birth
(combined)
Death
(combined)
Infant Mortality (Combined)
1 2 3
12.9 6.0 9.6
Source: DD Health Services and Family Welfare, Salem
45.3 DEATH BY CAUSES
Year: 2018-19
S.No Name of the Causes For Death Number of the deaths
1 RTA with Head injury 605
2 Burns 108
3 OPC Poisining 223
4 Septicemia 646
5 Cardiac Arrest 2566
6 Pre-term 438
7 Aspiration 131
8 Acute Myo Cardial Infarction 1553
9 Birth Asphyxia 1178
10 Spcticemia 646
11 Others
5684
Total 13258
Source: Dean, Govt Mohan Kumaramangalam Medical College Hospital, Salem and M.Os,
Municipalities and Joint Director of Medical and rural Health services and Family Welfare, Salem
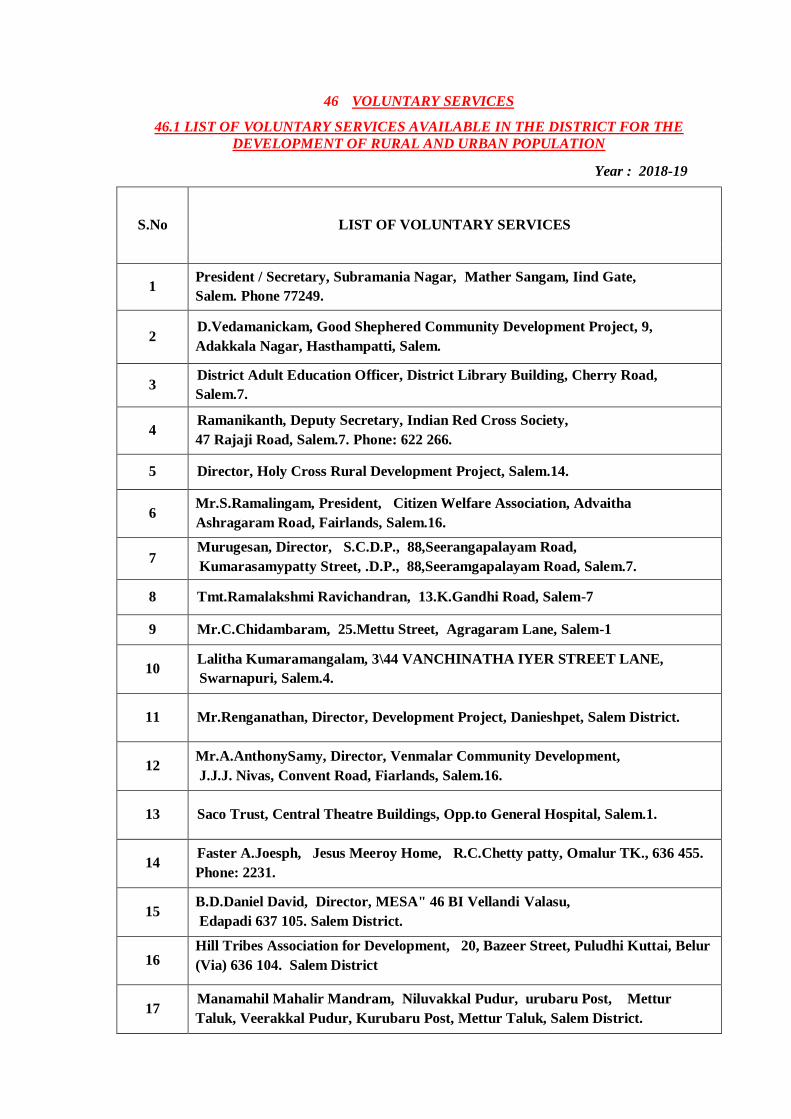
46 VOLUNTARY SERVICES
46. VOLUNTARY SERVICES
46.1 LIST OF VOLUNTARY SERVICES AVAILABLE IN THE DISTRICT FOR THE
DEVELOPMENT OF RURAL AND URBAN POPULATION
46.1 LIST OF VOLUNTARY SERVICES AVAILABLE IN THE DISTRICT FOR THE
DEVELOPMENT OF RURAL AND URBAN POPULATION.
Year : 2018-19
S.No LIST OF VOLUNTARY SERVICES
1 President / Secretary, Subramania Nagar, Mather Sangam, Iind Gate,
Salem. Phone 77249.
2 D.Vedamanickam, Good Shephered Community Development Project, 9,
Adakkala Nagar, Hasthampatti, Salem.
3 District Adult Education Officer, District Library Building, Cherry Road,
Salem.7.
4 Ramanikanth, Deputy Secretary, Indian Red Cross Society,
47 Rajaji Road, Salem.7. Phone: 622 266.
5 Director, Holy Cross Rural Development Project, Salem.14.
6 Mr.S.Ramalingam, President, Citizen Welfare Association, Advaitha
Ashragaram Road, Fairlands, Salem.16.
7 Murugesan, Director, S.C.D.P., 88,Seerangapalayam Road,
Kumarasamypatty Street, .D.P., 88,Seeramgapalayam Road, Salem.7.
8 Tmt.Ramalakshmi Ravichandran, 13.K.Gandhi Road, Salem-7
9 Mr.C.Chidambaram, 25.Mettu Street, Agragaram Lane, Salem-1
10 Lalitha Kumaramangalam, 3\44 VANCHINATHA IYER STREET LANE,
Swarnapuri, Salem.4.
11 Mr.Renganathan, Director, Development Project, Danieshpet, Salem District.
12 Mr.A.AnthonySamy, Director, Venmalar Community Development,
J.J.J. Nivas, Convent Road, Fiarlands, Salem.16.
13 Saco Trust, Central Theatre Buildings, Opp.to General Hospital, Salem.1.
14 Faster A.Joesph, Jesus Meeroy Home, R.C.Chetty patty, Omalur TK., 636 455.
Phone: 2231.
15 B.D.Daniel David, Director, MESA" 46 BI Vellandi Valasu,
Edapadi 637 105. Salem District.
16 Hill Tribes Association for Development, 20, Bazeer Street, Puludhi Kuttai, Belur
(Via) 636 104. Salem District
17 Manamahil Mahalir Mandram, Niluvakkal Pudur, urubaru Post, Mettur
Taluk, Veerakkal Pudur, Kurubaru Post, Mettur Taluk, Salem District.
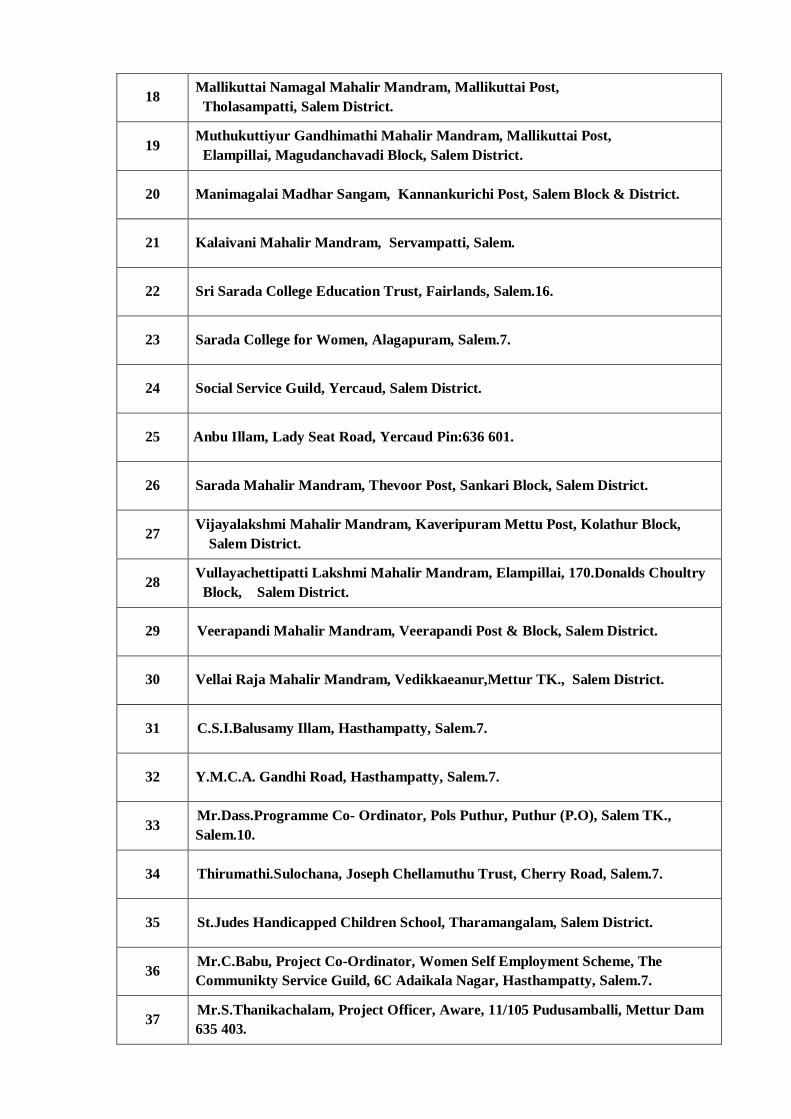
18 Mallikuttai Namagal Mahalir Mandram, Mallikuttai Post,
Tholasampatti, Salem District.
19 Muthukuttiyur Gandhimathi Mahalir Mandram, Mallikuttai Post,
Elampillai, Magudanchavadi Block, Salem District.
20 Manimagalai Madhar Sangam, Kannankurichi Post, Salem Block & District.
21 Kalaivani Mahalir Mandram, Servampatti, Salem.
22 Sri Sarada College Education Trust, Fairlands, Salem.16.
23 Sarada College for Women, Alagapuram, Salem.7.
24 Social Service Guild, Yercaud, Salem District.
25 Anbu Illam, Lady Seat Road, Yercaud Pin:636 601.
26 Sarada Mahalir Mandram, Thevoor Post, Sankari Block, Salem District.
27 Vijayalakshmi Mahalir Mandram, Kaveripuram Mettu Post, Kolathur Block,
Salem District.
28 Vullayachettipatti Lakshmi Mahalir Mandram, Elampillai, 170.Donalds Choultry
Block, Salem District.
29 Veerapandi Mahalir Mandram, Veerapandi Post & Block, Salem District.
30 Vellai Raja Mahalir Mandram, Vedikkaeanur,Mettur TK., Salem District.
31 C.S.I.Balusamy Illam, Hasthampatty, Salem.7.
32 Y.M.C.A. Gandhi Road, Hasthampatty, Salem.7.
33 Mr.Dass.Programme Co- Ordinator, Pols Puthur, Puthur (P.O), Salem TK.,
Salem.10.
34 Thirumathi.Sulochana, Joseph Chellamuthu Trust, Cherry Road, Salem.7.
35 St.Judes Handicapped Children School, Tharamangalam, Salem District.
36 Mr.C.Babu, Project Co-Ordinator, Women Self Employment Scheme, The
Communikty Service Guild, 6C Adaikala Nagar, Hasthampatty, Salem.7.
37 Mr.S.Thanikachalam, Project Officer, Aware, 11/105 Pudusamballi, Mettur Dam
635 403.
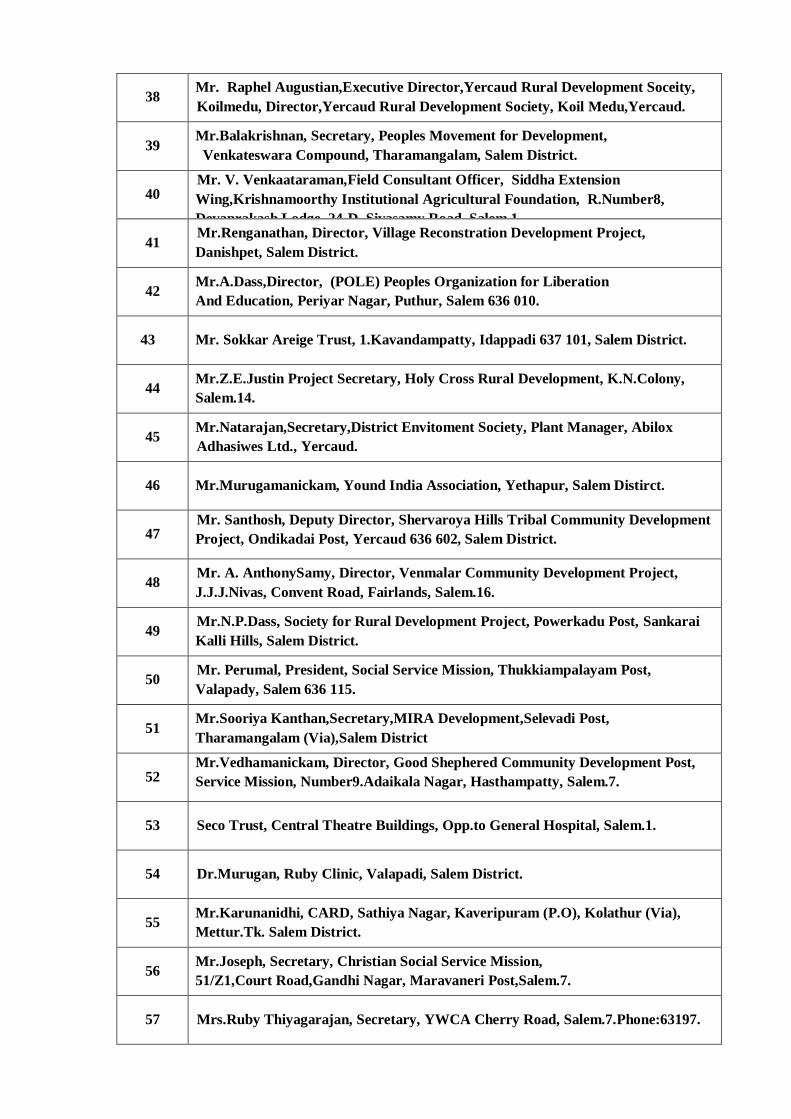
38 Mr. Raphel Augustian,Executive Director,Yercaud Rural Development Soceity,
Koilmedu, Director,Yercaud Rural Development Society, Koil Medu,Yercaud.
39 Mr.Balakrishnan, Secretary, Peoples Movement for Development,
Venkateswara Compound, Tharamangalam, Salem District.
40 Mr. V. Venkaataraman,Field Consultant Officer, Siddha Extension
Wing,Krishnamoorthy Institutional Agricultural Foundation, R.Number8,
Devaprakash Lodge, 24-D, Sivasamy Road, Salem.1.
41 Mr.Renganathan, Director, Village Reconstration Development Project,
Danishpet, Salem District.
42 Mr.A.Dass,Director, (POLE) Peoples Organization for Liberation
And Education, Periyar Nagar, Puthur, Salem 636 010.
43 Mr. Sokkar Areige Trust, 1.Kavandampatty, Idappadi 637 101, Salem District.
44 Mr.Z.E.Justin Project Secretary, Holy Cross Rural Development, K.N.Colony,
Salem.14.
45 Mr.Natarajan,Secretary,District Envitoment Society, Plant Manager, Abilox
Adhasiwes Ltd., Yercaud.
46 Mr.Murugamanickam, Yound India Association, Yethapur, Salem Distirct.
47 Mr. Santhosh, Deputy Director, Shervaroya Hills Tribal Community Development
Project, Ondikadai Post, Yercaud 636 602, Salem District.
48 Mr. A. AnthonySamy, Director, Venmalar Community Development Project,
J.J.J.Nivas, Convent Road, Fairlands, Salem.16.
49 Mr.N.P.Dass, Society for Rural Development Project, Powerkadu Post, Sankarai
Kalli Hills, Salem District.
50 Mr. Perumal, President, Social Service Mission, Thukkiampalayam Post,
Valapady, Salem 636 115.
51 Mr.Sooriya Kanthan,Secretary,MIRA Development,Selevadi Post,
Tharamangalam (Via),Salem District
52 Mr.Vedhamanickam, Director, Good Shephered Community Development Post,
Service Mission, Number9.Adaikala Nagar, Hasthampatty, Salem.7.
53 Seco Trust, Central Theatre Buildings, Opp.to General Hospital, Salem.1.
54 Dr.Murugan, Ruby Clinic, Valapadi, Salem District.
55 Mr.Karunanidhi, CARD, Sathiya Nagar, Kaveripuram (P.O), Kolathur (Via),
Mettur.Tk. Salem District.
56 Mr.Joseph, Secretary, Christian Social Service Mission,
51/Z1,Court Road,Gandhi Nagar, Maravaneri Post,Salem.7.
57 Mrs.Ruby Thiyagarajan, Secretary, YWCA Cherry Road, Salem.7.Phone:63197.
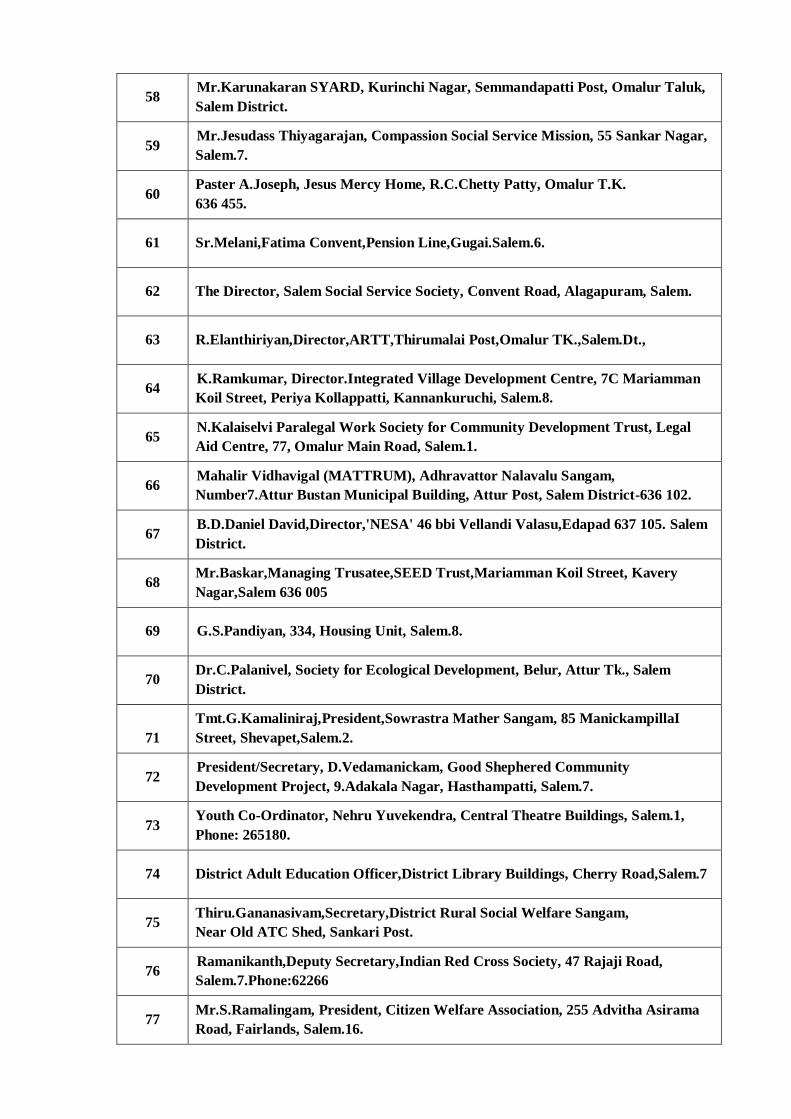
58 Mr.Karunakaran SYARD, Kurinchi Nagar, Semmandapatti Post, Omalur Taluk,
Salem District.
59 Mr.Jesudass Thiyagarajan, Compassion Social Service Mission, 55 Sankar Nagar,
Salem.7.
60 Paster A.Joseph, Jesus Mercy Home, R.C.Chetty Patty, Omalur T.K.
636 455.
61 Sr.Melani,Fatima Convent,Pension Line,Gugai.Salem.6.
62 The Director, Salem Social Service Society, Convent Road, Alagapuram, Salem.
63 R.Elanthiriyan,Director,ARTT,Thirumalai Post,Omalur TK.,Salem.Dt.,
64 K.Ramkumar, Director.Integrated Village Development Centre, 7C Mariamman
Koil Street, Periya Kollappatti, Kannankuruchi, Salem.8.
65 N.Kalaiselvi Paralegal Work Society for Community Development Trust, Legal
Aid Centre, 77, Omalur Main Road, Salem.1.
66 Mahalir Vidhavigal (MATTRUM), Adhravattor Nalavalu Sangam,
Number7.Attur Bustan Municipal Building, Attur Post, Salem District-636 102.
67 B.D.Daniel David,Director,'NESA' 46 bbi Vellandi Valasu,Edapad 637 105. Salem
District.
68 Mr.Baskar,Managing Trusatee,SEED Trust,Mariamman Koil Street, Kavery
Nagar,Salem 636 005
69 G.S.Pandiyan, 334, Housing Unit, Salem.8.
70 Dr.C.Palanivel, Society for Ecological Development, Belur, Attur Tk., Salem
District.
71
Tmt.G.Kamaliniraj,President,Sowrastra Mather Sangam, 85 ManickampillaI
Street, Shevapet,Salem.2.
72 President/Secretary, D.Vedamanickam, Good Shephered Community
Development Project, 9.Adakala Nagar, Hasthampatti, Salem.7.
73 Youth Co-Ordinator, Nehru Yuvekendra, Central Theatre Buildings, Salem.1,
Phone: 265180.
74 District Adult Education Officer,District Library Buildings, Cherry Road,Salem.7
75 Thiru.Gananasivam,Secretary,District Rural Social Welfare Sangam,
Near Old ATC Shed, Sankari Post.
76 Ramanikanth,Deputy Secretary,Indian Red Cross Society, 47 Rajaji Road,
Salem.7.Phone:62266
77 Mr.S.Ramalingam, President, Citizen Welfare Association, 255 Advitha Asirama
Road, Fairlands, Salem.16.
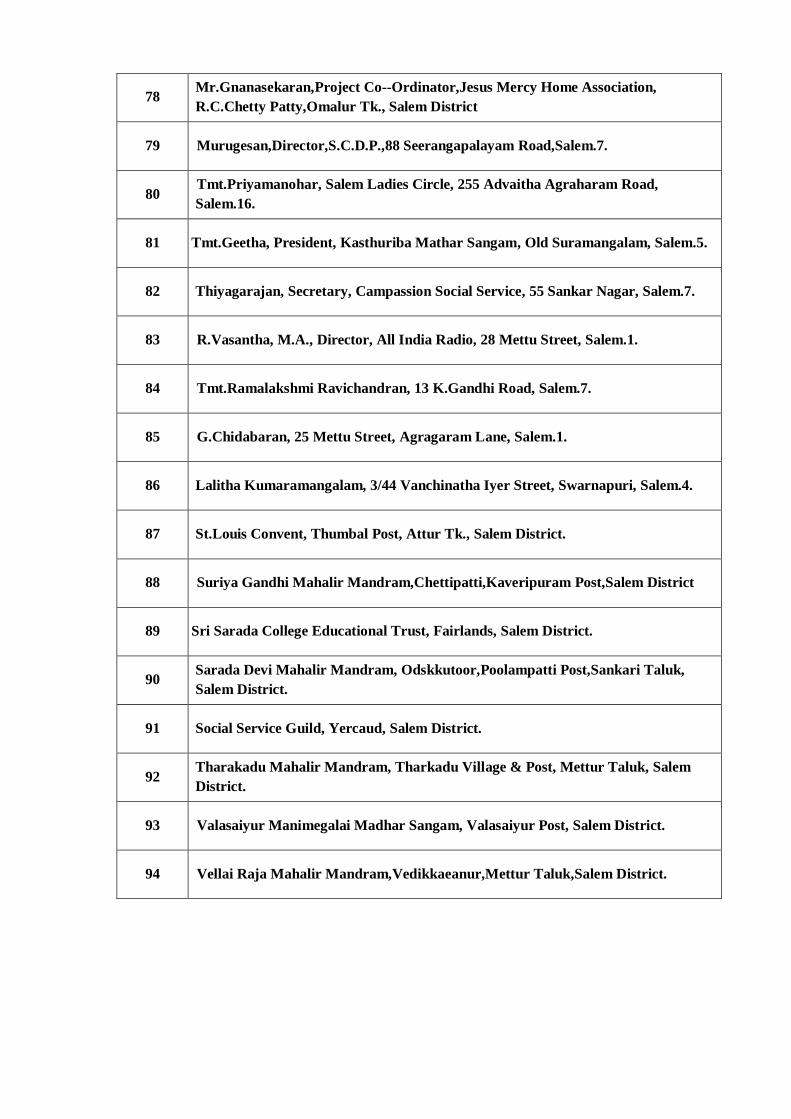
78 Mr.Gnanasekaran,Project Co--Ordinator,Jesus Mercy Home Association,
R.C.Chetty Patty,Omalur Tk., Salem District
79 Murugesan,Director,S.C.D.P.,88 Seerangapalayam Road,Salem.7.
80 Tmt.Priyamanohar, Salem Ladies Circle, 255 Advaitha Agraharam Road,
Salem.16.
81 Tmt.Geetha, President, Kasthuriba Mathar Sangam, Old Suramangalam, Salem.5.
82 Thiyagarajan, Secretary, Campassion Social Service, 55 Sankar Nagar, Salem.7.
83 R.Vasantha, M.A., Director, All India Radio, 28 Mettu Street, Salem.1.
84 Tmt.Ramalakshmi Ravichandran, 13 K.Gandhi Road, Salem.7.
85 G.Chidabaran, 25 Mettu Street, Agragaram Lane, Salem.1.
86 Lalitha Kumaramangalam, 3/44 Vanchinatha Iyer Street, Swarnapuri, Salem.4.
87 St.Louis Convent, Thumbal Post, Attur Tk., Salem District.
88 Suriya Gandhi Mahalir Mandram,Chettipatti,Kaveripuram Post,Salem District
89 Sri Sarada College Educational Trust, Fairlands, Salem District.
90 Sarada Devi Mahalir Mandram, Odskkutoor,Poolampatti Post,Sankari Taluk,
Salem District.
91 Social Service Guild, Yercaud, Salem District.
92 Tharakadu Mahalir Mandram, Tharkadu Village & Post, Mettur Taluk, Salem
District.
93 Valasaiyur Manimegalai Madhar Sangam, Valasaiyur Post, Salem District.
94 Vellai Raja Mahalir Mandram,Vedikkaeanur,Mettur Taluk,Salem District.
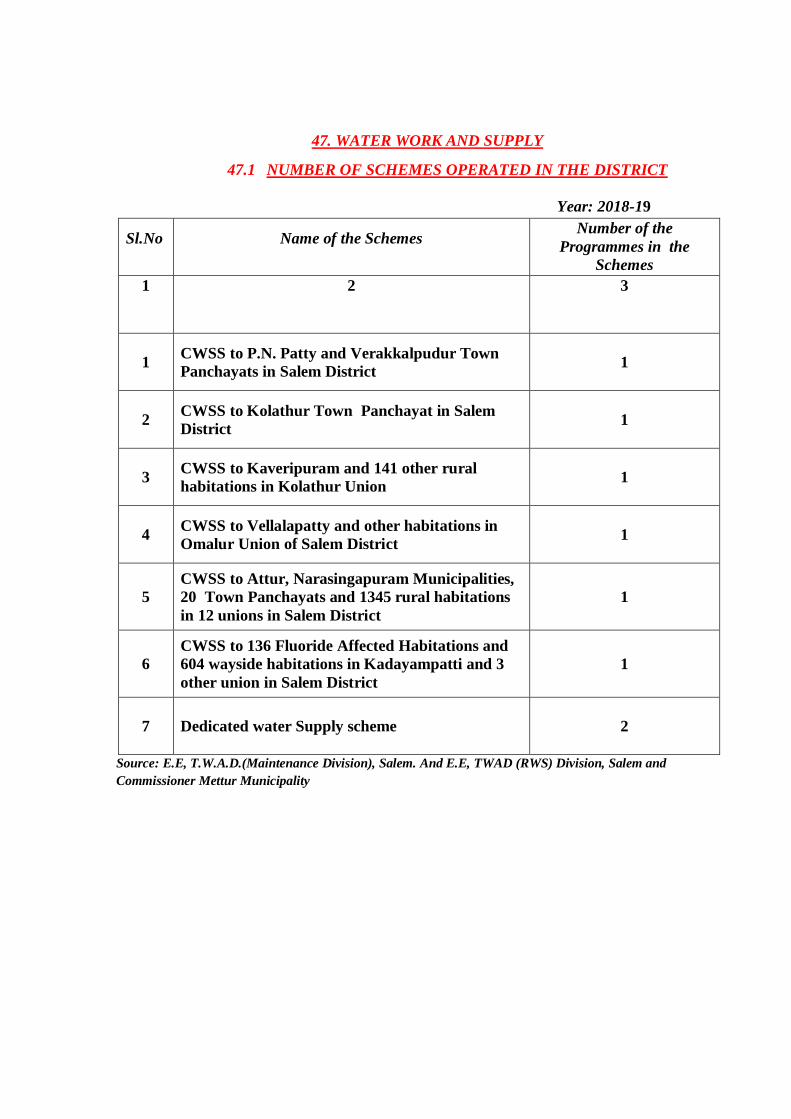
47. WATER WORK AND SUPPLY
47.1 NUMBER OF SCHEMES OPERATED IN THE DISTRICT
Year: 2018-19
Sl.No
Name of the Schemes
Number of the
Programmes in the
Schemes
1 2 3
1 CWSS to P.N. Patty and Verakkalpudur Town
Panchayats in Salem District 1
2 CWSS to Kolathur Town Panchayat in Salem
District 1
3 CWSS to Kaveripuram and 141 other rural
habitations in Kolathur Union 1
4 CWSS to Vellalapatty and other habitations in
Omalur Union of Salem District 1
5
CWSS to Attur, Narasingapuram Municipalities,
20 Town Panchayats and 1345 rural habitations
in 12 unions in Salem District 1
6
CWSS to 136 Fluoride Affected Habitations and
604 wayside habitations in Kadayampatti and 3
other union in Salem District
1
7 Dedicated water Supply scheme 2
Source: E.E, T.W.A.D.(Maintenance Division), Salem. And E.E, TWAD (RWS) Division, Salem and
Commissioner Mettur Municipality
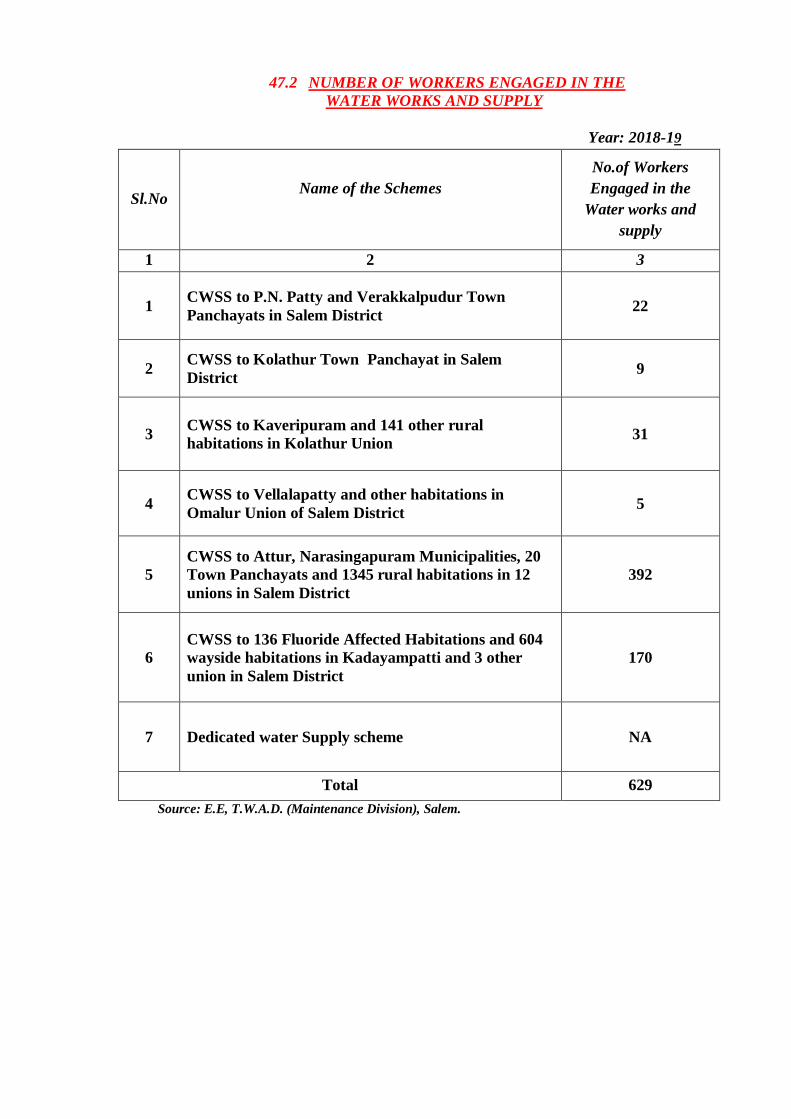
47.2 NUMBER OF WORKERS ENGAGED IN THE
WATER WORKS AND SUPPLY
Year: 2018-19
Sl.No
Name of the Schemes
No.of Workers
Engaged in the
Water works and
supply
1 2 3
1 CWSS to P.N. Patty and Verakkalpudur Town
Panchayats in Salem District 22
2 CWSS to Kolathur Town Panchayat in Salem
District 9
3 CWSS to Kaveripuram and 141 other rural
habitations in Kolathur Union 31
4 CWSS to Vellalapatty and other habitations in
Omalur Union of Salem District 5
5
CWSS to Attur, Narasingapuram Municipalities, 20
Town Panchayats and 1345 rural habitations in 12
unions in Salem District 392
6
CWSS to 136 Fluoride Affected Habitations and 604
wayside habitations in Kadayampatti and 3 other
union in Salem District
170
7 Dedicated water Supply scheme NA
Total 629
Source: E.E, T.W.A.D. (Maintenance Division), Salem.
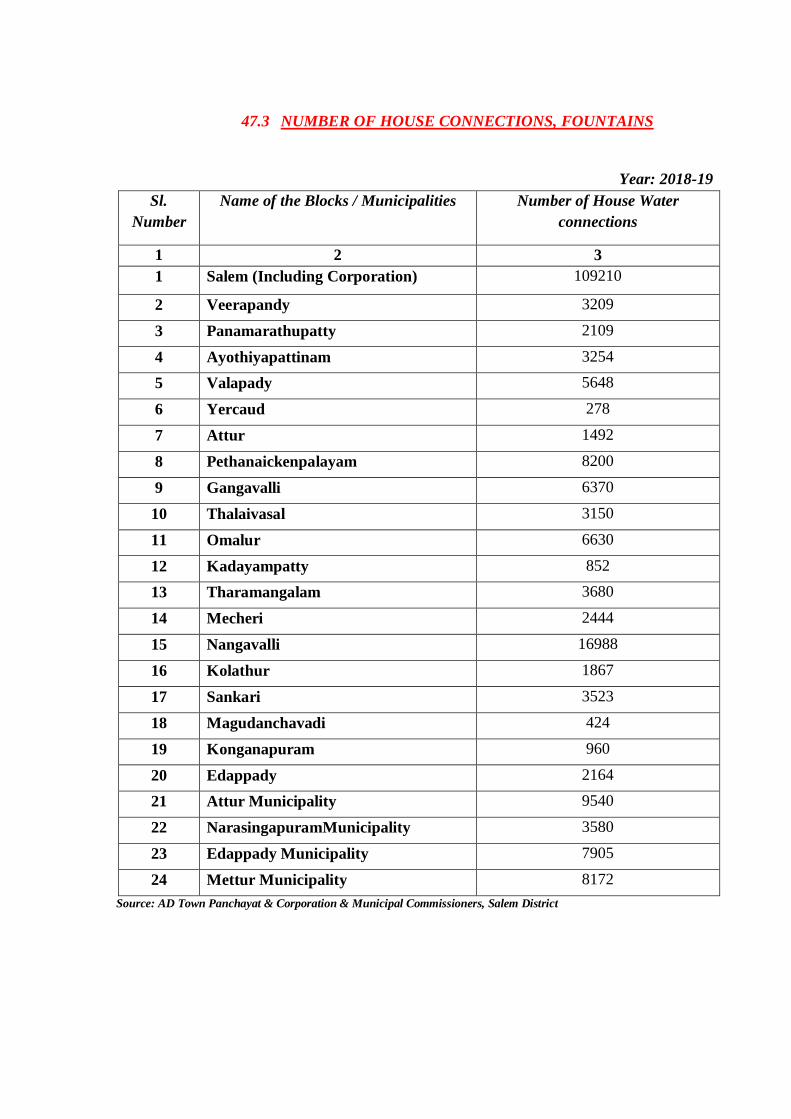
47.3 NUMBER OF HOUSE CONNECTIONS, FOUNTAINS
Year: 2018-19
Sl.
Number
Name of the Blocks / Municipalities Number of House Water
connections
1 2 3
1 Salem (Including Corporation) 109210
2 Veerapandy 3209
3 Panamarathupatty 2109
4 Ayothiyapattinam 3254
5 Valapady 5648
6 Yercaud 278
7 Attur 1492
8 Pethanaickenpalayam 8200
9 Gangavalli 6370
10 Thalaivasal 3150
11 Omalur 6630
12 Kadayampatty 852
13 Tharamangalam 3680
14 Mecheri 2444
15 Nangavalli 16988
16 Kolathur 1867
17 Sankari 3523
18 Magudanchavadi 424
19 Konganapuram 960
20 Edappady 2164
21 Attur Municipality 9540
22 NarasingapuramMunicipality 3580
23 Edappady Municipality 7905
24 Mettur Municipality 8172
Source: AD Town Panchayat & Corporation & Municipal Commissioners, Salem District
Related Documents