We Have A Plan Integrating Achieving the Dream with your Strategic Plan Joan Marchessault Capital Community College February 6th, 2008

We Have A Plan Integrating Achieving the Dream with your Strategic Plan Joan Marchessault Capital Community College February 6th, 2008.
Dec 26, 2015
Welcome message from author
This document is posted to help you gain knowledge. Please leave a comment to let me know what you think about it! Share it to your friends and learn new things together.
Transcript
We Have A PlanIntegrating Achieving the
Dream with your Strategic Plan
Joan MarchessaultCapital Community College
February 6th, 2008
2
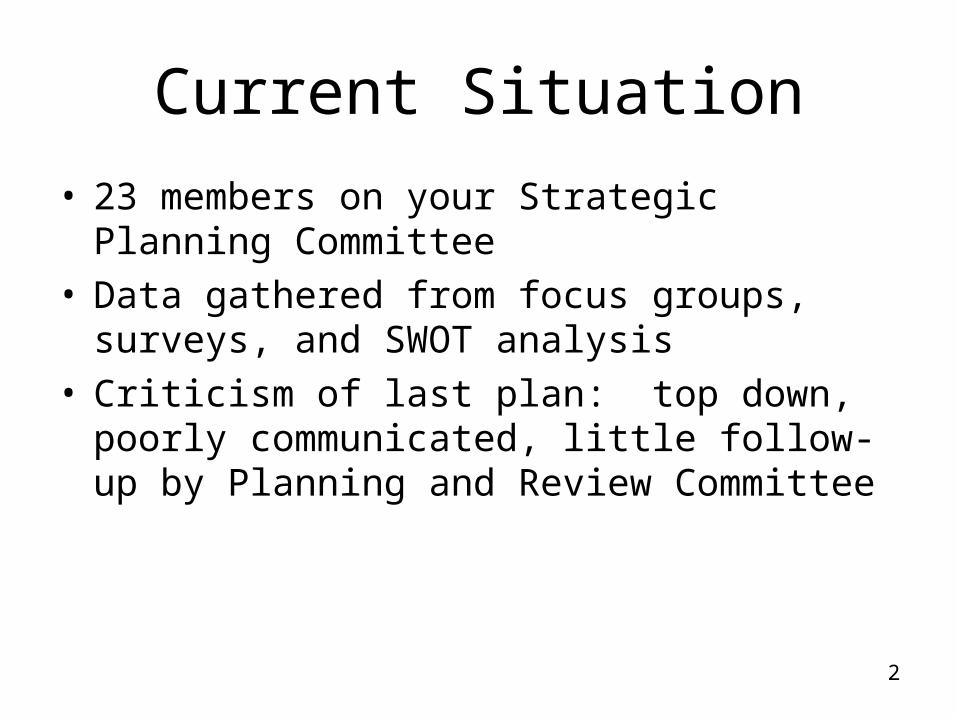
Current Situation
• 23 members on your Strategic Planning Committee
• Data gathered from focus groups, surveys, and SWOT analysis
• Criticism of last plan: top down, poorly communicated, little follow-up by Planning and Review Committee
3
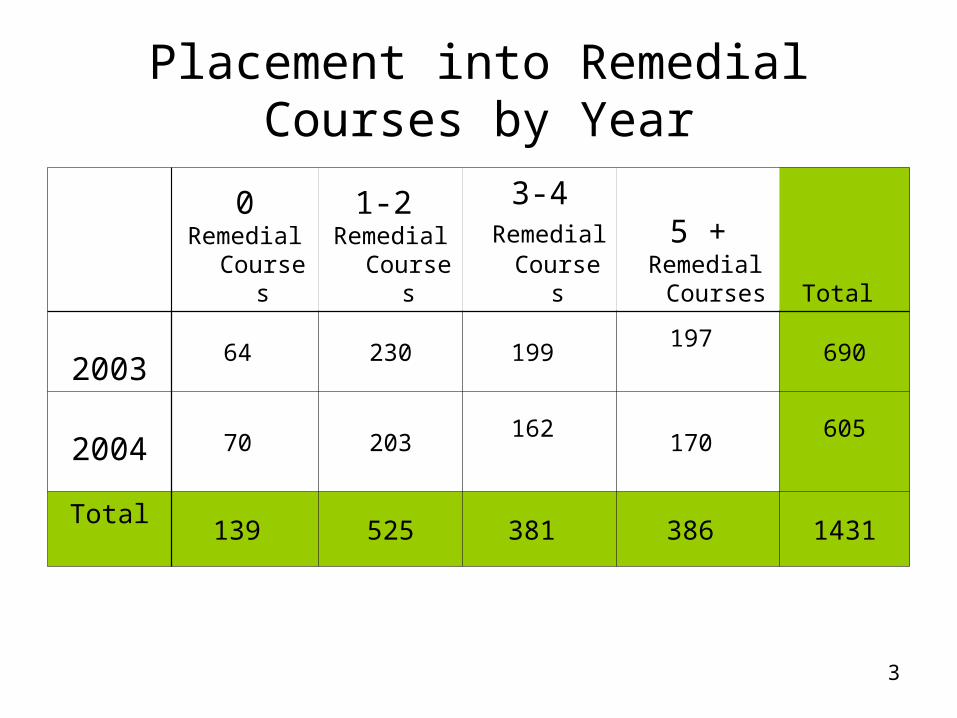
Placement into Remedial Courses by Year
0Remedial
Courses
1-2 Remedial
Courses
3-4 Remedial
Courses
5 + Remedial
Courses Total
2003
64 230 199 197
690
2004 70 203
162 170
605
Total139 525 381 386 1431
4
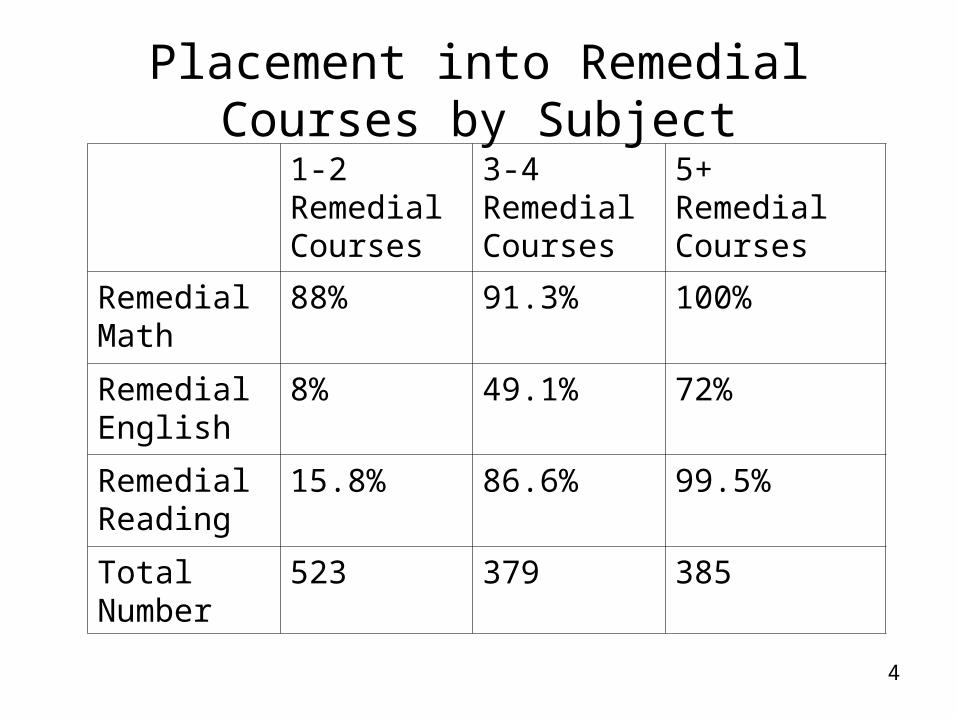
Placement into Remedial Courses by Subject
1-2RemedialCourses
3-4RemedialCourses
5+ RemedialCourses
Remedial Math
88% 91.3% 100%
RemedialEnglish
8% 49.1% 72%
RemedialReading
15.8% 86.6% 99.5%
TotalNumber
523 379 385
5
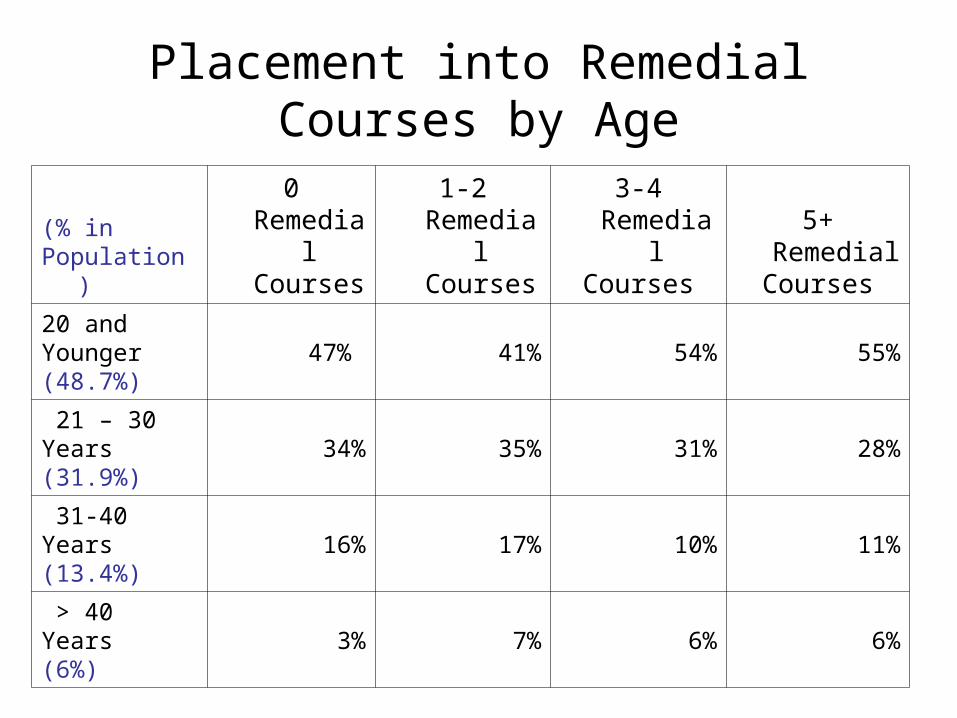
Placement into Remedial Courses by Age
(% inPopulation)
0 Remedi
al Courses
1-2 Remedia
l Courses
3-4 Remedia
lCourses
5+ Remedial
Courses
20 andYounger(48.7%)
47% 41% 54% 55%
21 – 30Years(31.9%)
34% 35% 31% 28%
31-40Years(13.4%)
16% 17% 10% 11%
> 40Years(6%)
3% 7% 6% 6%
6
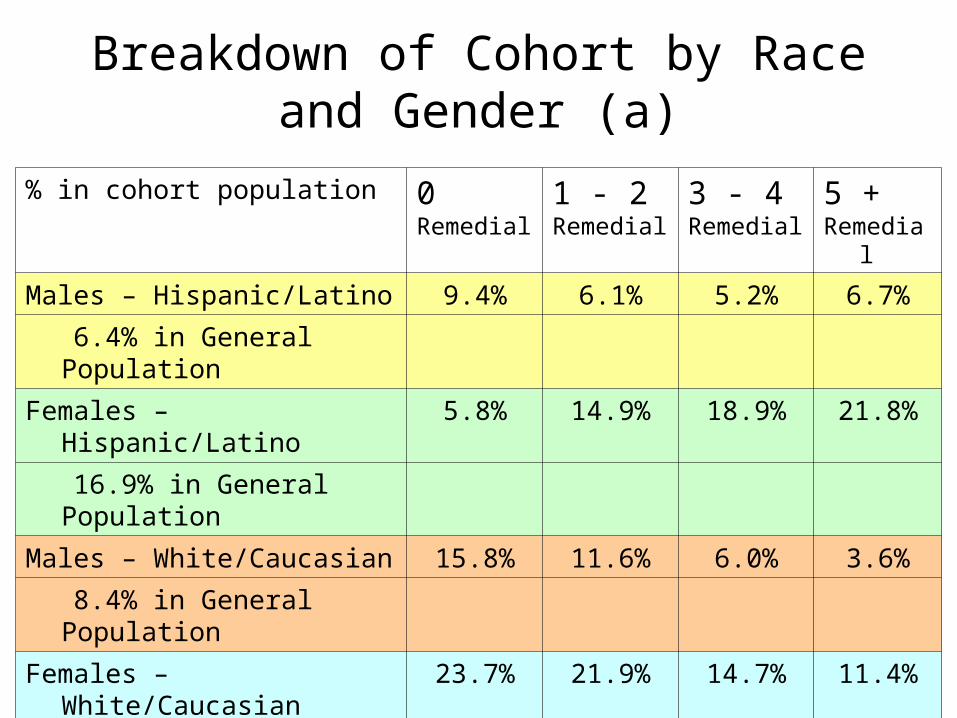
Breakdown of Cohort by Race and Gender (a)
% in cohort population 0Remedial
1 - 2Remedial
3 - 4Remedial
5 +Remedia
l
Males – Hispanic/Latino 9.4% 6.1% 5.2% 6.7%
6.4% in General Population
Females – Hispanic/Latino 5.8% 14.9% 18.9% 21.8%
16.9% in General Population
Males – White/Caucasian 15.8% 11.6% 6.0% 3.6%
8.4% in General Population
Females – White/Caucasian
23.7% 21.9% 14.7% 11.4%
17.3% in General Population
7
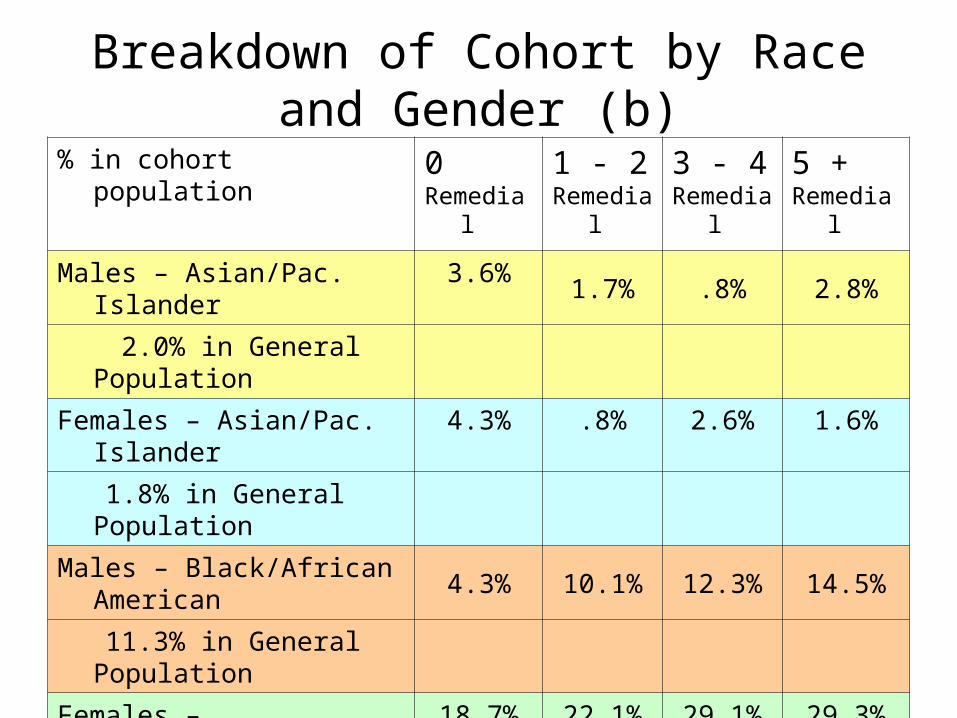
Breakdown of Cohort by Race and Gender (b)
% in cohort population 0Remedia
l
1 - 2Remedi
al
3 - 4Remedi
al
5 +Remedia
l
Males – Asian/Pac. Islander
3.6%1.7% .8% 2.8%
2.0% in General Population
Females – Asian/Pac. Islander
4.3% .8% 2.6% 1.6%
1.8% in General Population
Males – Black/African American
4.3% 10.1% 12.3% 14.5%
11.3% in General Population
Females – Black/African American
18.7% 22.1% 29.1% 29.3%
25.6% in General Population
8
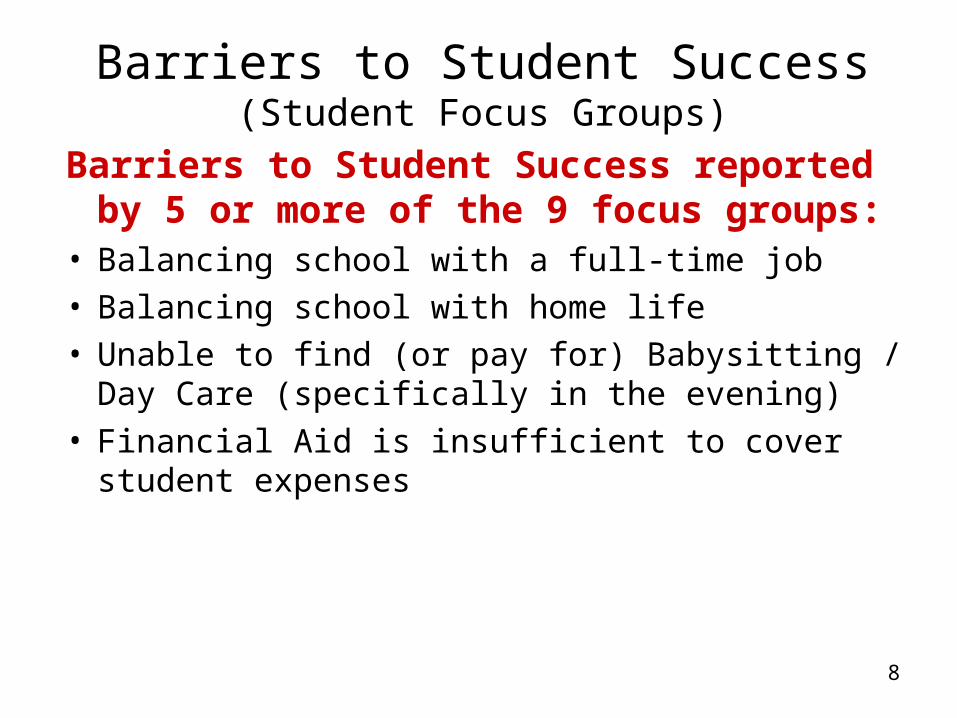
Barriers to Student Success (Student Focus Groups)
Barriers to Student Success reported by 5 or more of the 9 focus groups:
• Balancing school with a full-time job• Balancing school with home life• Unable to find (or pay for) Babysitting / Day
Care (specifically in the evening)• Financial Aid is insufficient to cover student
expenses
9
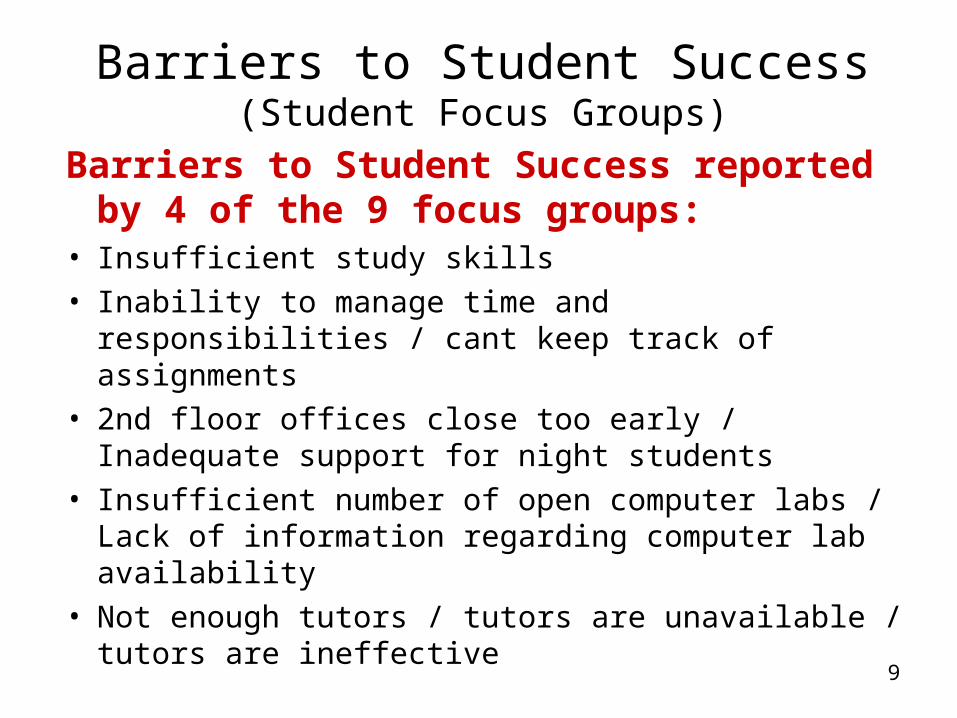
Barriers to Student Success (Student Focus Groups)
Barriers to Student Success reported by 4 of the 9 focus groups:
• Insufficient study skills• Inability to manage time and responsibilities /
cant keep track of assignments• 2nd floor offices close too early / Inadequate
support for night students• Insufficient number of open computer labs /
Lack of information regarding computer lab availability
• Not enough tutors / tutors are unavailable / tutors are ineffective
10
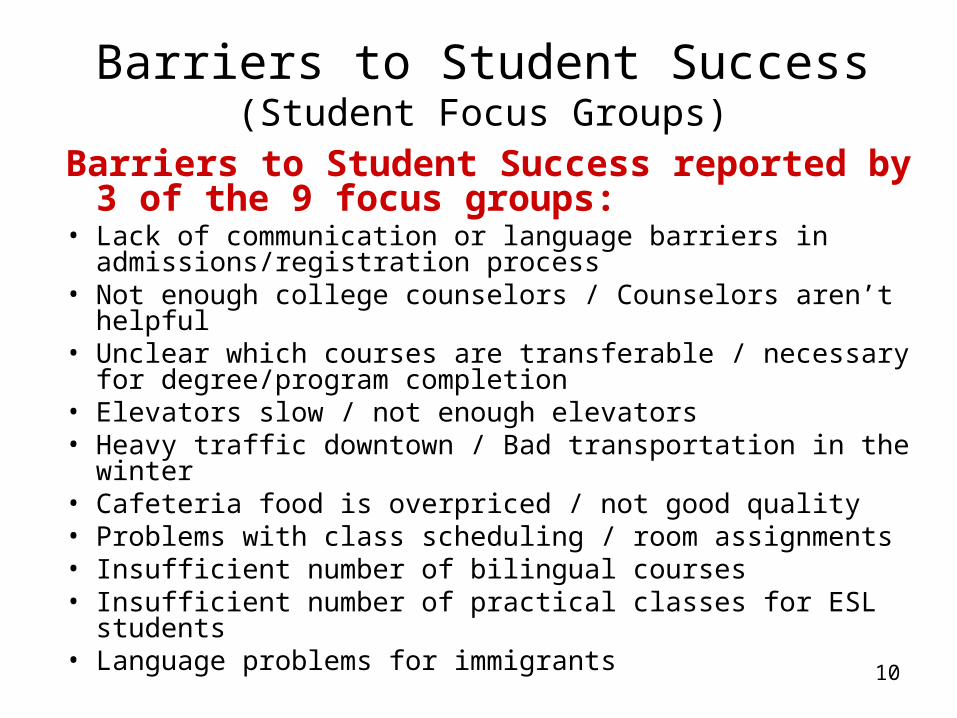
Barriers to Student Success (Student Focus Groups)
Barriers to Student Success reported by 3 of the 9 focus groups:
• Lack of communication or language barriers in admissions/registration process
• Not enough college counselors / Counselors aren’t helpful
• Unclear which courses are transferable / necessary for degree/program completion
• Elevators slow / not enough elevators• Heavy traffic downtown / Bad transportation in the
winter• Cafeteria food is overpriced / not good quality• Problems with class scheduling / room assignments• Insufficient number of bilingual courses• Insufficient number of practical classes for ESL
students• Language problems for immigrants
11
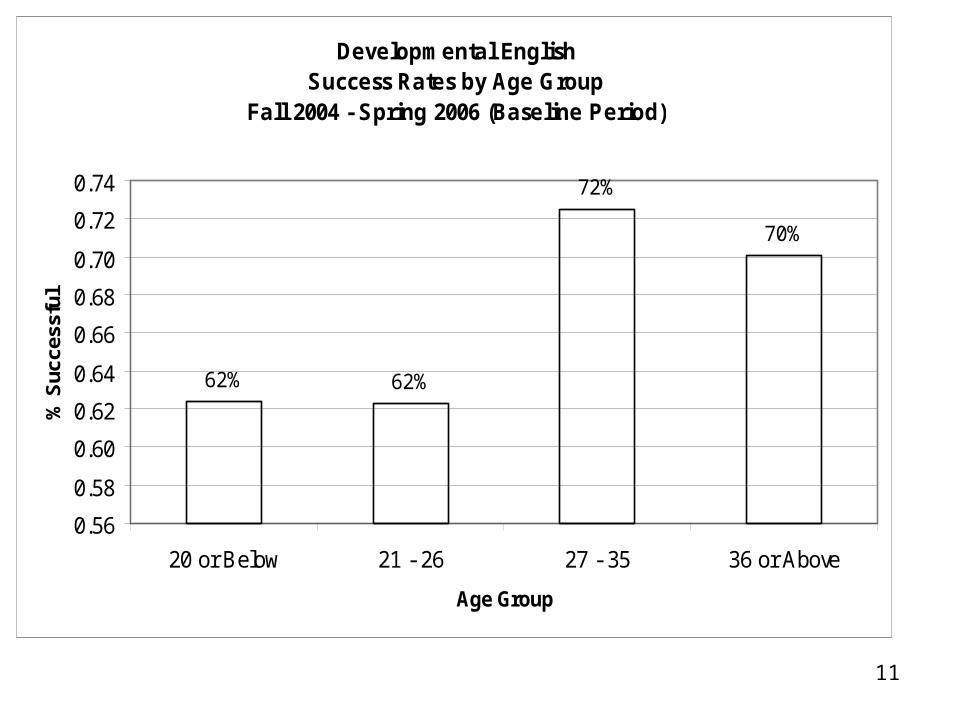
Developmental EnglishSuccess Rates by Age Group
Fall 2004 - Spring 2006 (Baseline Period)
62% 62%
72%
70%
0.56
0.58
0.60
0.62
0.64
0.66
0.68
0.70
0.72
0.74
20 or Below 21 - 26 27 - 35 36 or Above
Age Group
% S
ucce
ssfu
l
12
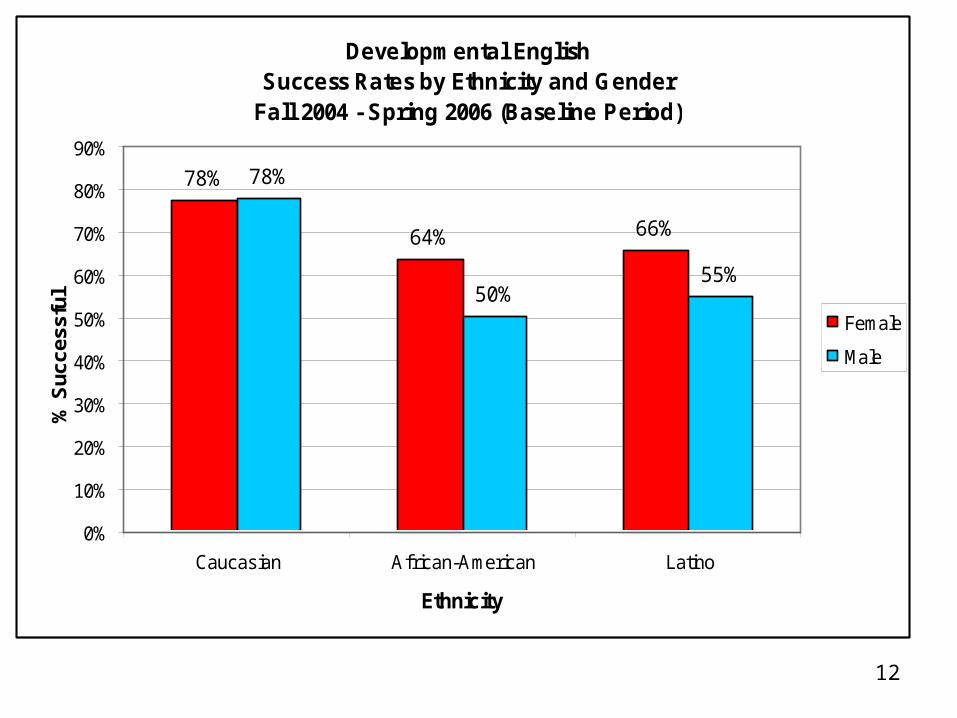
Developmental EnglishSuccess Rates by Ethnicity and Gender
Fall 2004 - Spring 2006 (Baseline Period)
64% 66%
78%
50%55%
78%
0%
10%
20%
30%
40%
50%
60%
70%
80%
90%
Caucasian African-American Latino
Ethnicity
% S
ucce
ssfu
l
Female
Male
13
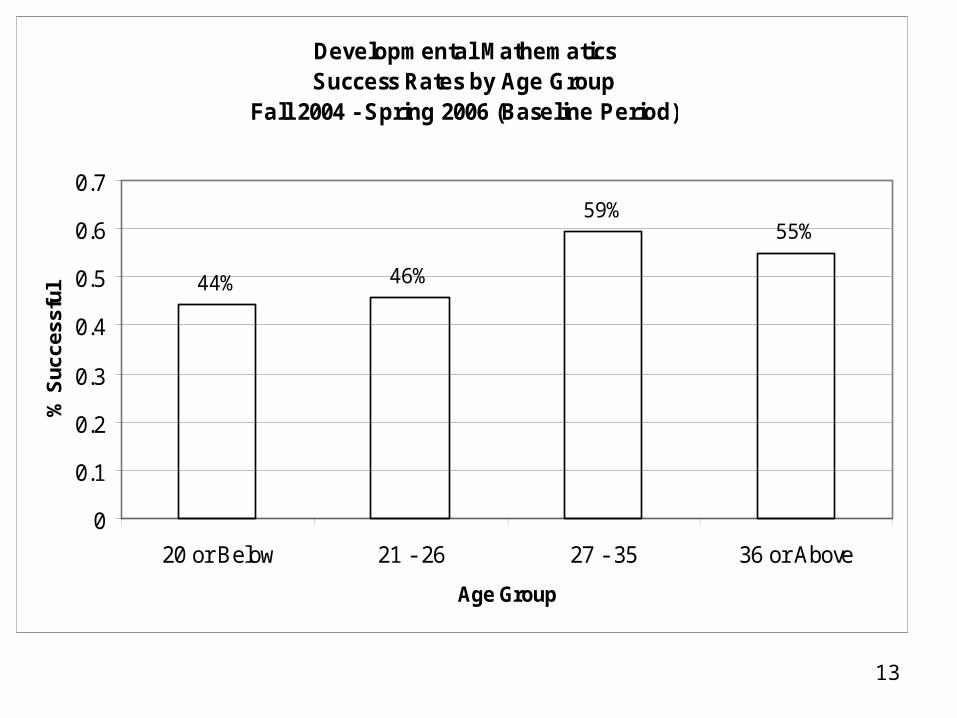
Developmental MathematicsSuccess Rates by Age Group
Fall 2004 - Spring 2006 (Baseline Period)
44% 46%
59%55%
0
0.1
0.2
0.3
0.4
0.5
0.6
0.7
20 or Below 21 - 26 27 - 35 36 or Above
Age Group
% S
ucce
ssfu
l
14
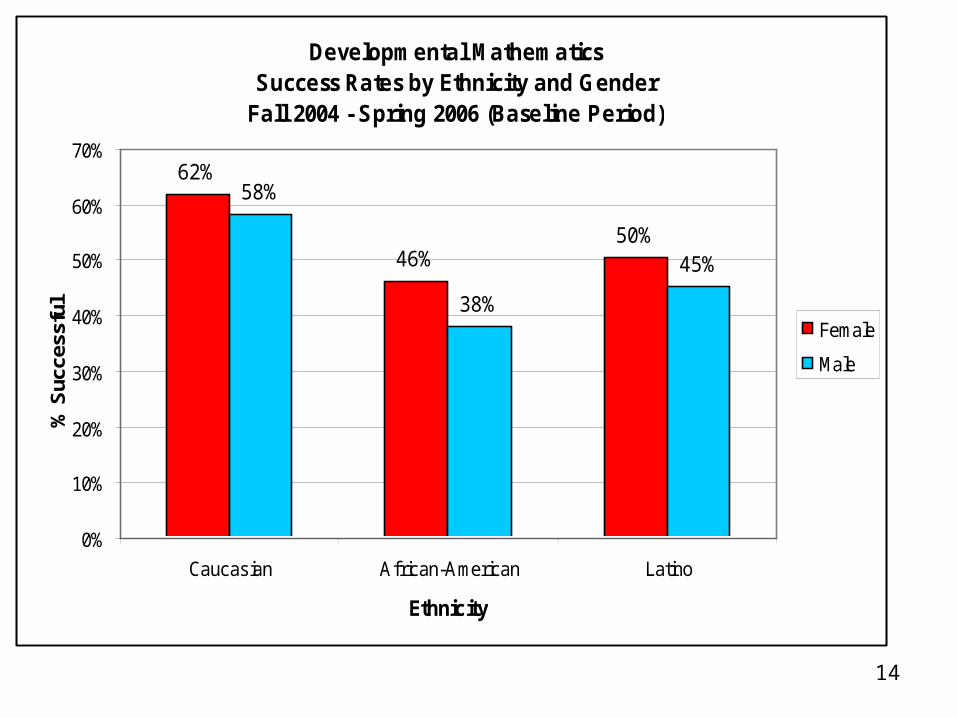
Developmental MathematicsSuccess Rates by Ethnicity and Gender
Fall 2004 - Spring 2006 (Baseline Period)
62%
46%50%
58%
38%
45%
0%
10%
20%
30%
40%
50%
60%
70%
Caucasian African-American Latino
Ethnicity
% S
ucce
ssfu
l
Female
Male
15
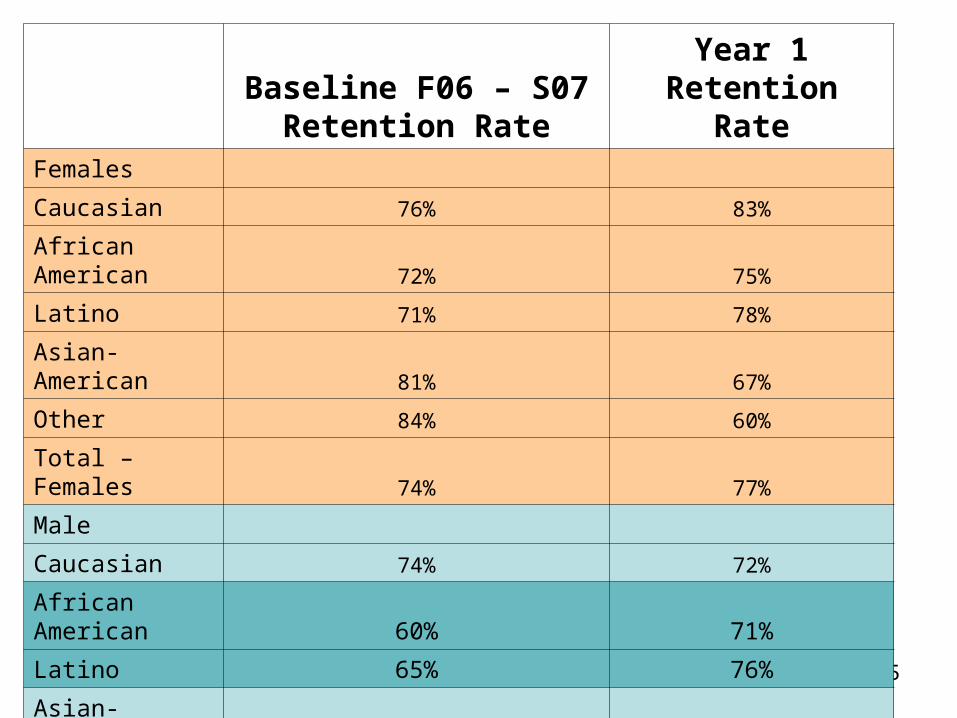
Baseline F06 – S07Retention Rate
Year 1Retention Rate
Females
Caucasian 76% 83%
African American 72% 75%
Latino 71% 78%
Asian-American 81% 67%
Other 84% 60%
Total – Females 74% 77%
Male
Caucasian 74% 72%
African American 60% 71%
Latino 65% 76%
Asian-American 71% 56%
Other 75% 56%
Total - Males 66% 71%
16
Group Assignment
• How should the committee proceed?• How will you integrate Achieving the Dream
initiatives?• How will you communicate the plan?• How will you monitor and report on your
planning process?
17
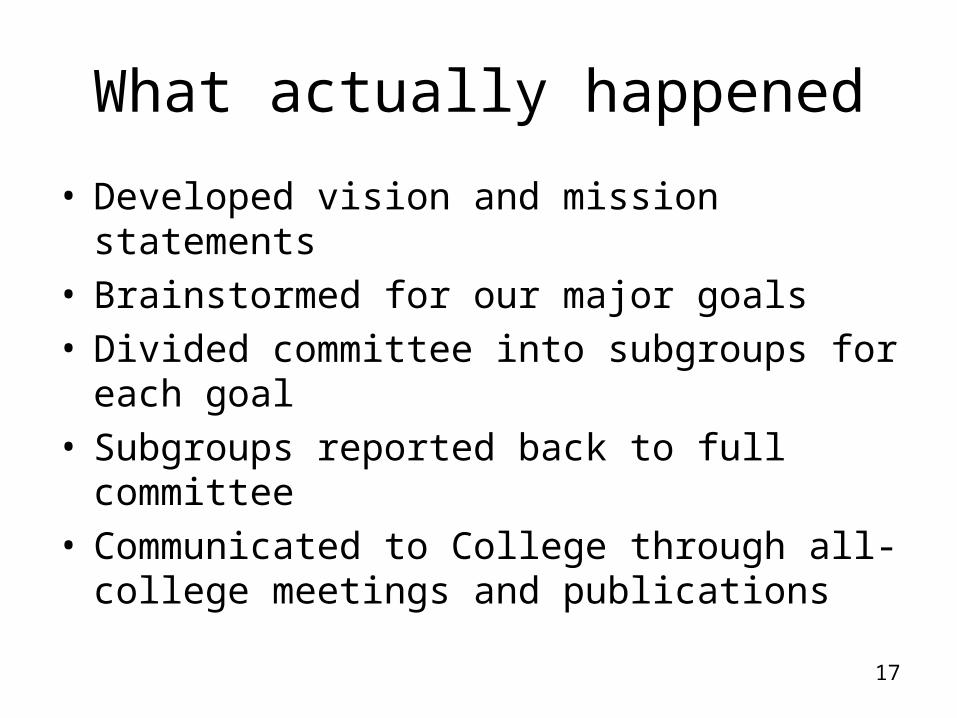
What actually happened
• Developed vision and mission statements• Brainstormed for our major goals• Divided committee into subgroups for each goal• Subgroups reported back to full committee• Communicated to College through all- college
meetings and publications
18
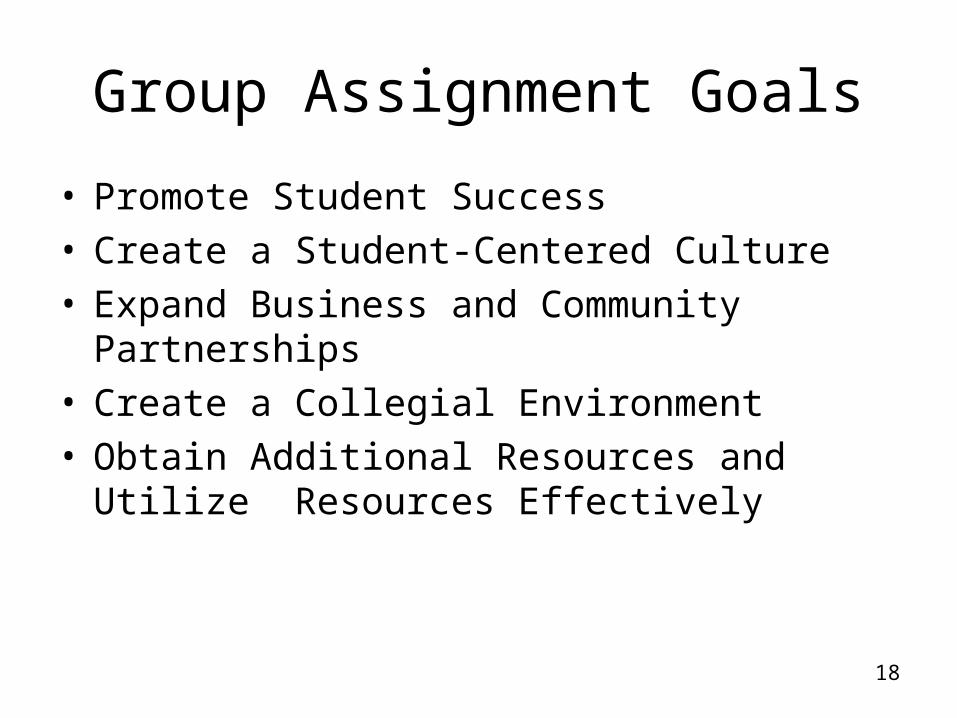
Group Assignment Goals
• Promote Student Success• Create a Student-Centered Culture• Expand Business and Community Partnerships• Create a Collegial Environment• Obtain Additional Resources and Utilize
Resources Effectively
19
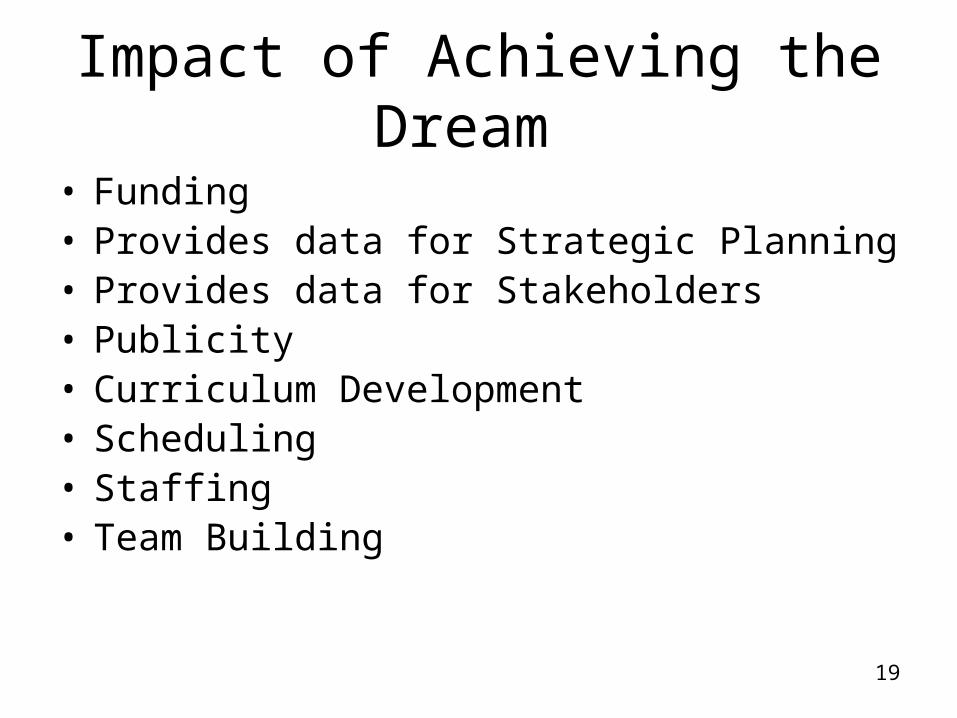
Impact of Achieving the Dream
• Funding• Provides data for Strategic Planning• Provides data for Stakeholders• Publicity• Curriculum Development• Scheduling• Staffing• Team Building
20
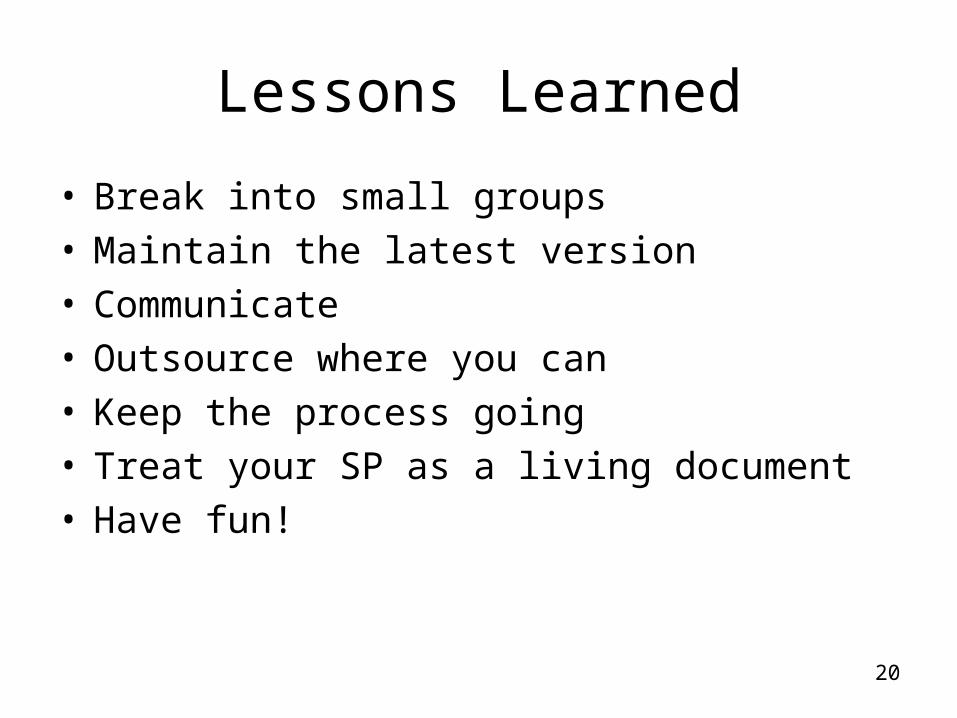
Lessons Learned
• Break into small groups• Maintain the latest version • Communicate • Outsource where you can• Keep the process going• Treat your SP as a living document• Have fun!
21
1. How many years are left in the Achieving the Dream Initiative (including this year) ?
A. 0B. 2C. 3D. ∞E. DA
CORRECT ANSWER: C (3)
ATD Quiz
22
2. Who is leading the Achieving the Dream Core Team for the 2007 – 2008 academic year ?
A. Britney Spears
B. Joan Marchessault
C. Fred Thompson
D. Andre Freeman
E. B & D
F. All of the Above
CORRECT ANSWER: E (Joan & Andre)
ATD Quiz
23
3. Where was last year’s Achieving the Dream Strategy Institute ?
A. New HampshireB. New YorkC. New MexicoD. New BritainE. None of the Above
CORRECT ANSWER: C (New Mexico)
ATD Quiz
24
4. Where are the Achieving the Dream Core Team meetings held ?
A. President’s Conference Room
B. Joe Blacks
C. Morgan Street Garage
D. Elevator # 1
E. Dean’s Conference Room
F. All of the Above
CORRECT ANSWER: A (President’s Conference Room)
ATD Quiz
25

26
27
28
29

30
31
Thank you
Questions
Related Documents