Wavelet analysis for single molecule localization microscopy I. Izeddin, 1 J. Boulanger, 2 V. Racine, 2 C.G. Specht, 3 A. Kechkar, 4,5 D. Nair, 4,5 A. Triller, 3 D. Choquet, 4,5 M. Dahan, 1 and J.B. Sibarita 4,5,* 1 Laboratoire Kastler Brossel, CNRS UMR 8552, Département de Physique et Institut de Biologie de l’Ecole Normale Supérieure, Université Pierre et Marie Curie-Paris 6, 46 rue d’Ulm 75005 Paris, France 2 UMR144-CNRS, Institut Curie, 12, rue Lhomond, 75005 Paris, France 3 Biologie Cellulaire de la Synapse, Institut de Biologie de l’Ecole Normale Supérieure, Inserm U1024, 46 rue d’Ulm, 75005 Paris, France 4 Interdisciplinary Institute for Neurosciences, CNRS UMR 5297, 146 rue Léo Saignat, 33077 Bordeaux, France 5 IINS, University of Bordeaux, Bordeaux, France * [email protected] Abstract: Localization of single molecules in microscopy images is a key step in quantitative single particle data analysis. Among them, single molecule based super-resolution optical microscopy techniques require high localization accuracy as well as computation of large data sets in the order of 10 5 single molecule detections to reconstruct a single image. We hereby present an algorithm based on image wavelet segmentation and single particle centroid determination, and compare its performance with the commonly used Gaussian fitting of the point spread function. We performed realistic simulations at different signal-to-noise ratios and particle densities and show that the calculation time using the wavelet approach can be more than one order of magnitude faster than that of Gaussian fitting without a significant degradation of the localization accuracy, from 1 nm to 4 nm in our range of study. We propose a simulation-based estimate of the resolution of an experimental single molecule acquisition. ©2012 Optical Society of America OCIS codes: (100.6640) Superresolution; (100.7410) Wavelets; (180.2520) Fluorescence microscopy; (170.3880) Medical and biological imaging References and links 1. S. J. Lord, H.-L. D. Lee, and W. E. Moerner, “Single-molecule spectroscopy and imaging of biomolecules in living cells,” Anal. Chem. 82(6), 2192–2203 (2010). 2. M. Dahan, S. Lévi, C. Luccardini, P. Rostaing, B. Riveau, and A. Triller, “Diffusion dynamics of glycine receptors revealed by single-quantum dot tracking,” Science 302(5644), 442–445 (2003). 3. A. Triller and D. Choquet, “New concepts in synaptic biology derived from single-molecule imaging,” Neuron 59(3), 359–374 (2008). 4. A. Yildiz, J. N. Forkey, S. A. McKinney, T. Ha, Y. E. Goldman, and P. R. Selvin, “Myosin V walks hand-over- hand: single fluorophore imaging with 1.5-nm localization,” Science 300(5628), 2061–2065 (2003). 5. E. Betzig, G. H. Patterson, R. Sougrat, O. W. Lindwasser, S. Olenych, J. S. Bonifacino, M. W. Davidson, J. Lippincott-Schwartz, and H. F. Hess, “Imaging intracellular fluorescent proteins at nanometer resolution,” Science 313(5793), 1642–1645 (2006). 6. S. T. Hess, T. P. K. Girirajan, and M. D. Mason, “Ultra-high resolution imaging by fluorescence photoactivation localization microscopy,” Biophys. J. 91(11), 4258–4272 (2006). 7. M. J. Rust, M. Bates, and X. Zhuang, “Sub-diffraction-limit imaging by stochastic optical reconstruction microscopy (STORM),” Nat. Methods 3(10), 793–796 (2006). 8. J. Fölling, M. Bossi, H. Bock, R. Medda, C. A. Wurm, B. Hein, S. Jakobs, C. Eggeling, and S. W. Hell, “Fluorescence nanoscopy by ground-state depletion and single-molecule return,” Nat. Methods 5(11), 943–945 (2008). 9. B. Huang, M. Bates, and X. Zhuang, “Super-resolution fluorescence microscopy,” Annu. Rev. Biochem. 78(1), 993–1016 (2009). 10. R. Ober and S. Ram, “Localization accuracy in single-molecule microscopy,” Biophys. J. (2004). 11. M. K. Cheezum, W. F. Walker, and W. H. Guilford, “Quantitative comparison of algorithms for tracking single fluorescent particles,” Biophys. J. 81(4), 2378–2388 (2001). 12. A. V. Abraham, S. Ram, J. Chao, E. S. Ward, and R. J. Ober, “Quantitative study of single molecule location estimation techniques,” Opt. Express 17(26), 23352–23373 (2009). #155779 - $15.00 USD Received 3 Oct 2011; revised 22 Dec 2011; accepted 2 Jan 2012; published 17 Jan 2012 (C) 2012 OSA 30 January 2012 / Vol. 20, No. 3 / OPTICS EXPRESS 2081

Welcome message from author
This document is posted to help you gain knowledge. Please leave a comment to let me know what you think about it! Share it to your friends and learn new things together.
Transcript

Wavelet analysis for single molecule localization microscopy
I. Izeddin,1 J. Boulanger,
2 V. Racine,
2 C.G. Specht,
3 A. Kechkar,
4,5 D. Nair,
4,5 A. Triller,
3
D. Choquet,4,5
M. Dahan,1 and J.B. Sibarita
4,5,*
1Laboratoire Kastler Brossel, CNRS UMR 8552, Département de Physique et Institut de Biologie de l’Ecole Normale Supérieure, Université Pierre et Marie Curie-Paris 6, 46 rue d’Ulm 75005 Paris, France
2UMR144-CNRS, Institut Curie, 12, rue Lhomond, 75005 Paris, France 3Biologie Cellulaire de la Synapse, Institut de Biologie de l’Ecole Normale Supérieure, Inserm U1024, 46 rue d’Ulm,
75005 Paris, France 4Interdisciplinary Institute for Neurosciences, CNRS UMR 5297, 146 rue Léo Saignat, 33077 Bordeaux, France
5 IINS, University of Bordeaux, Bordeaux, France *[email protected]
Abstract: Localization of single molecules in microscopy images is a key step in quantitative single particle data analysis. Among them, single molecule based super-resolution optical microscopy techniques require high localization accuracy as well as computation of large data sets in the order of 10
5 single molecule detections to reconstruct a single image. We hereby
present an algorithm based on image wavelet segmentation and single particle centroid determination, and compare its performance with the commonly used Gaussian fitting of the point spread function. We performed realistic simulations at different signal-to-noise ratios and particle densities and show that the calculation time using the wavelet approach can be more than one order of magnitude faster than that of Gaussian fitting without a significant degradation of the localization accuracy, from 1 nm to 4 nm in our range of study. We propose a simulation-based estimate of the resolution of an experimental single molecule acquisition.
©2012 Optical Society of America
OCIS codes: (100.6640) Superresolution; (100.7410) Wavelets; (180.2520) Fluorescence microscopy; (170.3880) Medical and biological imaging
References and links
1. S. J. Lord, H.-L. D. Lee, and W. E. Moerner, “Single-molecule spectroscopy and imaging of biomolecules in living cells,” Anal. Chem. 82(6), 2192–2203 (2010).
2. M. Dahan, S. Lévi, C. Luccardini, P. Rostaing, B. Riveau, and A. Triller, “Diffusion dynamics of glycine receptors revealed by single-quantum dot tracking,” Science 302(5644), 442–445 (2003).
3. A. Triller and D. Choquet, “New concepts in synaptic biology derived from single-molecule imaging,” Neuron 59(3), 359–374 (2008).
4. A. Yildiz, J. N. Forkey, S. A. McKinney, T. Ha, Y. E. Goldman, and P. R. Selvin, “Myosin V walks hand-over-hand: single fluorophore imaging with 1.5-nm localization,” Science 300(5628), 2061–2065 (2003).
5. E. Betzig, G. H. Patterson, R. Sougrat, O. W. Lindwasser, S. Olenych, J. S. Bonifacino, M. W. Davidson, J. Lippincott-Schwartz, and H. F. Hess, “Imaging intracellular fluorescent proteins at nanometer resolution,” Science 313(5793), 1642–1645 (2006).
6. S. T. Hess, T. P. K. Girirajan, and M. D. Mason, “Ultra-high resolution imaging by fluorescence photoactivation localization microscopy,” Biophys. J. 91(11), 4258–4272 (2006).
7. M. J. Rust, M. Bates, and X. Zhuang, “Sub-diffraction-limit imaging by stochastic optical reconstruction microscopy (STORM),” Nat. Methods 3(10), 793–796 (2006).
8. J. Fölling, M. Bossi, H. Bock, R. Medda, C. A. Wurm, B. Hein, S. Jakobs, C. Eggeling, and S. W. Hell, “Fluorescence nanoscopy by ground-state depletion and single-molecule return,” Nat. Methods 5(11), 943–945 (2008).
9. B. Huang, M. Bates, and X. Zhuang, “Super-resolution fluorescence microscopy,” Annu. Rev. Biochem. 78(1), 993–1016 (2009).
10. R. Ober and S. Ram, “Localization accuracy in single-molecule microscopy,” Biophys. J. (2004). 11. M. K. Cheezum, W. F. Walker, and W. H. Guilford, “Quantitative comparison of algorithms for tracking single
fluorescent particles,” Biophys. J. 81(4), 2378–2388 (2001). 12. A. V. Abraham, S. Ram, J. Chao, E. S. Ward, and R. J. Ober, “Quantitative study of single molecule location
estimation techniques,” Opt. Express 17(26), 23352–23373 (2009).
#155779 - $15.00 USD Received 3 Oct 2011; revised 22 Dec 2011; accepted 2 Jan 2012; published 17 Jan 2012(C) 2012 OSA 30 January 2012 / Vol. 20, No. 3 / OPTICS EXPRESS 2081
13. C. S. Smith, N. Joseph, B. Rieger, and K. A. Lidke, “Fast, single-molecule localization that achieves theoretically minimum uncertainty,” Nat. Methods 7(5), 373–375 (2010).
14. R. Henriques, M. Lelek, E. F. Fornasiero, F. Valtorta, C. Zimmer, and M. M. Mhlanga, “QuickPALM: 3D real-time photoactivation nanoscopy image processing in ImageJ,” Nat. Methods 7(5), 339–340 (2010).
15. S. Wolter, M. Schüttpelz, M. Tscherepanow, S. van de Linde, M. Heilemann, and M. Sauer, “Real-time computation of subdiffraction-resolution fluorescence images,” J. Microsc. 237, 12–22 (n.d.).
16. P. N. Hedde, J. Fuchs, F. Oswald, J. Wiedenmann, and G. U. Nienhaus, “Online image analysis software for photoactivation localization microscopy,” Nat. Methods 6(10), 689–690 (2009).
17. S. Manley, J. M. Gillette, G. H. Patterson, H. Shroff, H. F. Hess, E. Betzig, and J. Lippincott-Schwartz, “High-density mapping of single-molecule trajectories with photoactivated localization microscopy,” Nat. Methods 5(2), 155–157 (2008).
18. M. Holschneider, R. Kronland-Martinet, J. Morlet, and P. Tchamitchian, “A real-time algorithm for signal analysis with the help of the wavelet transform,” in Proceedings of the International Conference Wavelets. Time-Frequency Methods and Phase Space, J. M. Combes, A. Grossman, and P. Tchamitchian, eds. (Springer-Verlag, 1987) page 286.
19. M. Unser and A. Aldroubi, “Polynomial splines and wavelets: a signal processing perspective,” in Wavelets: A Tutorial in Theory and Applications (Academic Press, 1992).
20. J. Starck and F. Murtagh, Astronomical Image and Data Analysis (Springer, 2006). 21. J. Starck, E. Pantin, and F. Murtagh, “Deconvolution in astronomy: A review,” Publ. Astron. Soc. Pac. 114(800),
1051–1069 (2002). 22. D. Donoho and I. Johnstone, “Adapting to unknown smoothness via wavelet shrinkage,” J. Am. Stat. Assoc.
90(432), 1200–1224 (1995). 23. S. J. Holden, S. Uphoff, and A. N. Kapanidis, “DAOSTORM: an algorithm for high- density super-resolution
microscopy,” Nat. Methods 8(4), 279–280 (2011). 24. F. Huang, S. L. Schwartz, J. M. Byars, and K. A. Lidke, “Simultaneous multiple-emitter fitting for single
molecule super-resolution imaging,” Biomed. Opt. Express 2(5), 1377–1393 (2011). 25. S. Wolter, U. Endesfelder, S. van de Linde, M. Heilemann, and M. Sauer, “Measuring localization performance
of super-resolution algorithms on very active samples,” Opt. Express 19(8), 7020–7033 (2011). 26. L. Vincent and P. Soille, “Watersheds in digital spaces - an efficient algorithm based on immersion simulations,”
IEEE Trans. Pattern Anal. Mach. Intell. 13(6), 583–598 (1991). 27. A. Sergé, N. Bertaux, H. Rigneault, and D. Marguet, “Dynamic multiple-target tracing to probe spatiotemporal
cartography of cell membranes,” Nat. Methods 5(8), 687–694 (2008). 28. P. Křížek, I. Raška, and G. M. Hagen, “Minimizing detection errors in single molecule localization microscopy,”
Opt. Express 19(4), 3226–3235 (2011). 29. P. Sprawls, Physical Principles of Medical Imaging, 2nd ed. (Medical Physics Publishing Corporation, 1995), p.
656. 30. I. Izeddin, C. G. Specht, M. Lelek, X. Darzacq, A. Triller, C. Zimmer, and M. Dahan, “Super-resolution dynamic
imaging of dendritic spines using a low-affinity photoconvertible actin probe,” PLoS ONE 6(1), e15611 (2011). 31. G. Patterson, M. Davidson, S. Manley, and J. Lippincott-Schwartz, “Superresolution imaging using single-
molecule localization,” Annu. Rev. Phys. Chem. 61(1), 345–367 (2010). 32. B. Zhang, J. Zerubia, and J.-C. Olivo-Marin, “Gaussian approximations of fluorescence microscope point-spread
function models,” Appl. Opt. 46(10), 1819–1829 (2007). 33. R. E. Thompson, D. R. Larson, and W. W. Webb, “Precise nanometer localization analysis for individual
fluorescent probes,” Biophys. J. 82(5), 2775–2783 (2002). 34. F. V. Subach, G. H. Patterson, S. Manley, J. M. Gillette, J. Lippincott-Schwartz, and V. V. Verkhusha,
“Photoactivatable mCherry for high-resolution two-color fluorescence microscopy,” Nat. Methods 6(2), 153–159 (2009).
35. S. van de Linde, A. Löschberger, T. Klein, M. Heidbreder, S. Wolter, M. Heilemann, and M. Sauer, “Direct stochastic optical reconstruction microscopy with standard fluorescent probes,” Nat. Protoc. 6(7), 991–1009 (2011).
36. U. Kubitscheck, O. Kückmann, T. Kues, and R. Peters, “Imaging and tracking of single GFP molecules in solution,” Biophys. J. 78(4), 2170–2179 (2000).
1. Introduction
The field of optical microscopy for biological applications has taken a qualitative leap forward with the technical advances leading to the detection of single molecules. In recent years, single molecule experiments have become routine in many laboratories using imaging techniques in biology and biophysics, providing new insights into a multitude of biological processes [1]. In most cases, the first step for a quantitative analysis of single molecule experiments is the determination of the position of the particle with sub-pixel accuracy in the nanometer range, well below the diffraction limit of light. For instance, the precise position of fluorescently labeled proteins in consecutive time-lapse images can be used to determine the diffusion properties of specific membrane proteins [2, 3] or to unravel the stepping mechanisms of molecular motors [4].
#155779 - $15.00 USD Received 3 Oct 2011; revised 22 Dec 2011; accepted 2 Jan 2012; published 17 Jan 2012(C) 2012 OSA 30 January 2012 / Vol. 20, No. 3 / OPTICS EXPRESS 2082
In recent years, several super-resolution optical microscopy techniques have been developed that surpass the diffraction limit of light in optical systems (typically ~250 nm). Among these are (fluorescence) photoactivation localization microscopy [5, 6] ((F)PALM), stochastic optical reconstruction microscopy (STORM) [7] and more recently ground state depletion microscopy (GSD) [8] that are all based on the sequential photo-activation of sparse subsets of single fluorophores. These single molecule techniques rely on the ability to accurately determine the center of the point spread function (PSF) created by each single point emitter; ultimately, the resolution of the image is determined by the achieved particle localization accuracy [9, 10]. These techniques have become widespread due to their affordability and relatively simple implementation on a conventional total internal reflection fluorescence (TIRF) microscope for single molecule detection.
The typical procedure for successfully recording and reconstructing a super-resolution image with PALM / STORM microscopy involves post-processing of the images acquired in the microscope and includes the following steps: 1) A short pulse of visible light activates a subset of fluorophores whose distance to their first neighbor is large enough as to individually resolve each PSF. 2) A second laser with different wavelength is used to excite the active fluorophores until their (irreversible) photobleaching while one or several images are recorded. 3) Steps 1 and 2 are sequentially repeated so that the density of imaged fluorophores is high enough for a complete reproduction of the structure of interest (typically a few thousand frames). 4) Post-processing of the images, starting by the detection of the imaged fluorophores, frame by frame. 5) Fitting of each single PSF in order to determine its center. 6) Finally, reconstruction of the super-resolution image based on the positions determined in the previous step.
The standard mathematical model used for PSF fitting is a two-dimensional Gaussian function, due to its good performance in terms of localization [11, 12]. Normally steps 1 to 3 take from minutes to few hours, while steps 5 to 7 may take from 30 minutes up to several hours of computation when Gaussian fitting is carried out, since it requires an iterative minimization step, typically a maximum-likelihood estimation (MLE) or non-linear least squares (NLLS). This makes it virtually impossible to quickly evaluate the results obtained in the microscope right after acquisition, and to improve the experimental conditions on-site. Recently, a massively parallel implementation of MLE Gaussian fitting has been proposed [13]. This solution greatly reduced the computation time, but required the use of a dedicated graphics processing unit (GPU) hardware architecture.
To overcome the limitations caused by such a time-consuming data analysis we hereby propose a wavelet segmentation algorithm for particle detection and centroid localization. The advantages of the wavelet approach are two-fold: its fast processing time, more than one order of magnitude lower than that involving 2D Gaussian fitting, and a very good localization accuracy unlike other proposed fast-processing algorithms for PALM analysis [14–16].
2. Simulations and wavelet segmentation
2.1 Simulation of realistic single molecule images
In order to determine the speed, reliability and accuracy of the detection and position determination of the wavelet segmentation and centroid determination algorithm, we first performed simulations consisting of isolated single point emitters, convolved by a 2D point spread function with Gaussian shape of sigma 1 pixel (i.e. FWHM of 250nm). Blurred signal was then sampled on a 256x256 pixelated matrix, with a pixel size of 100 nm. Finally, digital images where corrupted by a combination of Gaussian and Poisson noise.
These simulations were performed with different SNR and particle density per image. With SNR values ranging from 2.6 to 10.3, and particle densities from 0.1 molecule/µm
2 to 1
molecule/µm2, we largely covered the entire range of experimental conditions encountered in
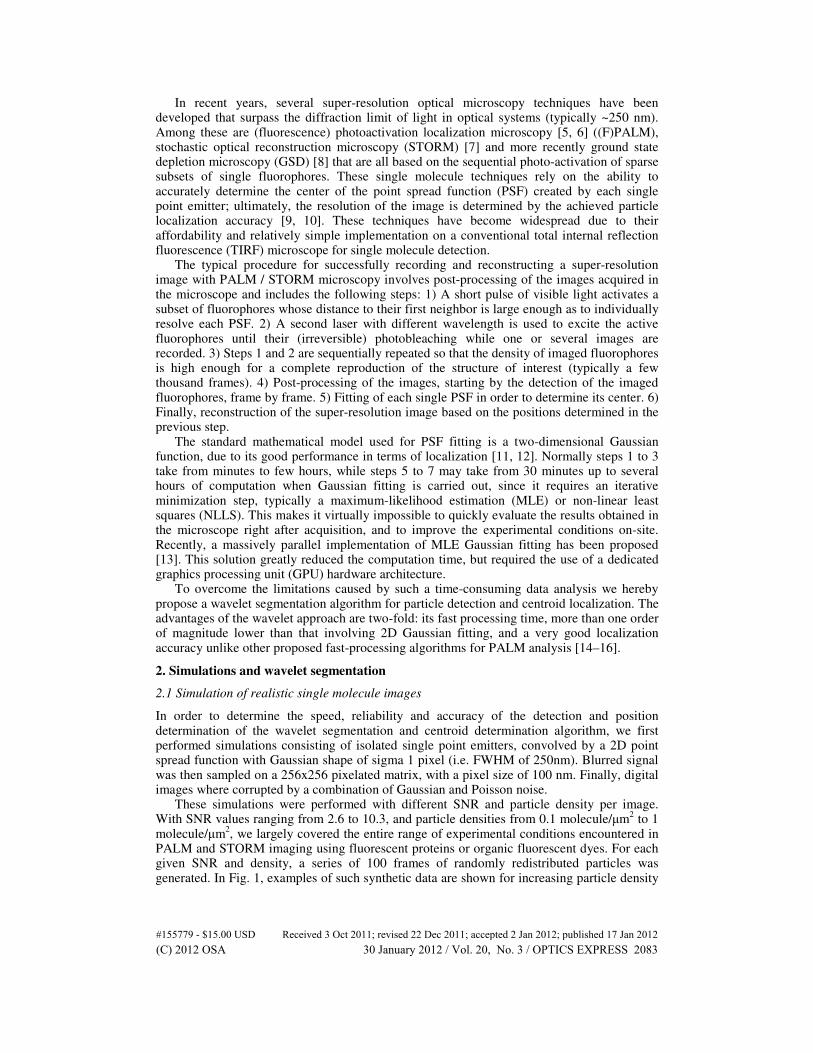
PALM and STORM imaging using fluorescent proteins or organic fluorescent dyes. For each given SNR and density, a series of 100 frames of randomly redistributed particles was generated. In Fig. 1, examples of such synthetic data are shown for increasing particle density
#155779 - $15.00 USD Received 3 Oct 2011; revised 22 Dec 2011; accepted 2 Jan 2012; published 17 Jan 2012(C) 2012 OSA 30 January 2012 / Vol. 20, No. 3 / OPTICS EXPRESS 2083
and decreasing SNR. In the lower panel of the figure, intensity profiles across an individual particle PSF are plotted for the different values of SNR of the simulated images. Typical SNR values of the experimental data are about 8 in our simulations, depending on the chosen fluorophore and experimental conditions. We then used the generated movies to compare the performances of the wavelet segmentation approach and an algorithm requiring Gaussian fitting in terms of speed and accuracy. One motivation for investigating much lower SNRs is to cover fluorescent probes with lower quantum yield and single particle tracking of photoactivatable fluorophores (sptPALM) [17], both cases leading to less detected photons in each image frame.
Fig. 1. Simulations of single particles. Examples of the simulated single molecule data on a 256 px x 256 px matrix of 100 nm pixel size. Each single point is convolved with a 2D Gaussian function with variance σ2 = 1 px, and the image corrupted with a mixture of Gaussian and Poisson noise. In panel A, examples at SNR = 7.1 and molecule density of 0.1, 0.25, 0.5, 0.75, and 1 molecule/µm2 (left to right). In panel B, examples at molecular density of 0.1 molecule/µm2 and SNR = 10.3, 6.6, 3.6, 3, and 2.6 (left to right). In panel C, intensity profile across one single molecule for different SNR, normalized in the inset, and shown as raw images on the right.
2.2 Wavelet segmentation
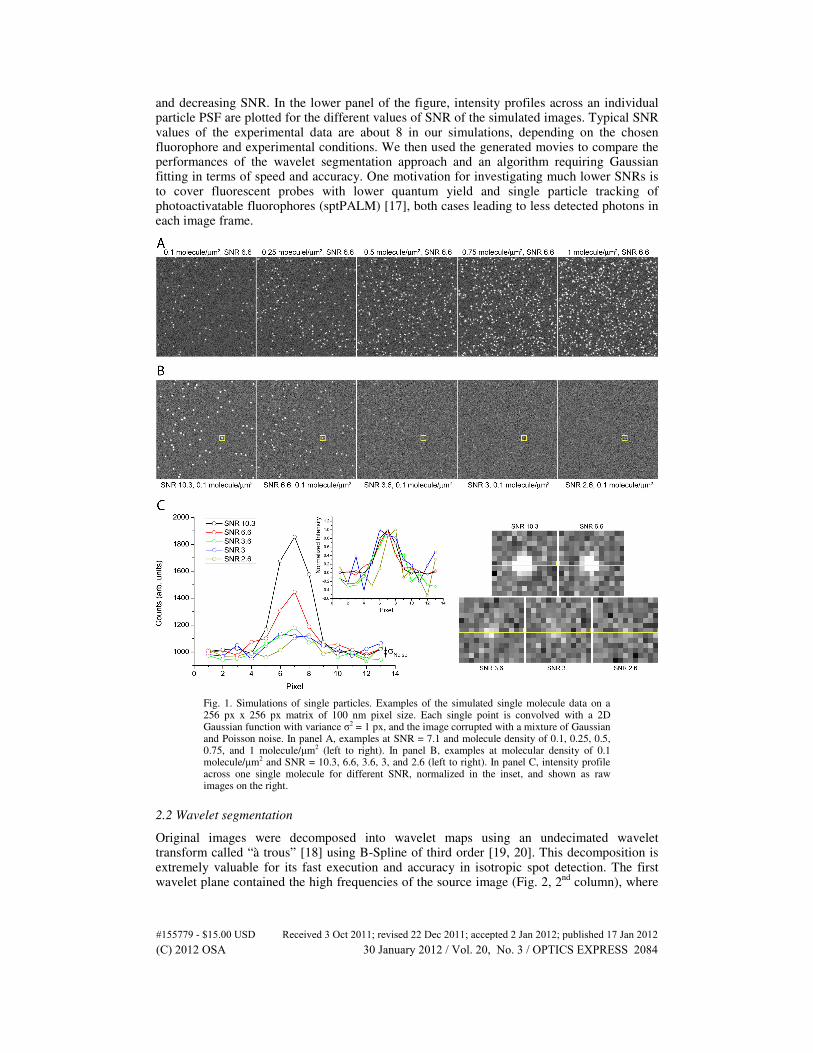
Original images were decomposed into wavelet maps using an undecimated wavelet transform called “à trous” [18] using B-Spline of third order [19, 20]. This decomposition is extremely valuable for its fast execution and accuracy in isotropic spot detection. The first wavelet plane contained the high frequencies of the source image (Fig. 2, 2
nd column), where
#155779 - $15.00 USD Received 3 Oct 2011; revised 22 Dec 2011; accepted 2 Jan 2012; published 17 Jan 2012(C) 2012 OSA 30 January 2012 / Vol. 20, No. 3 / OPTICS EXPRESS 2084
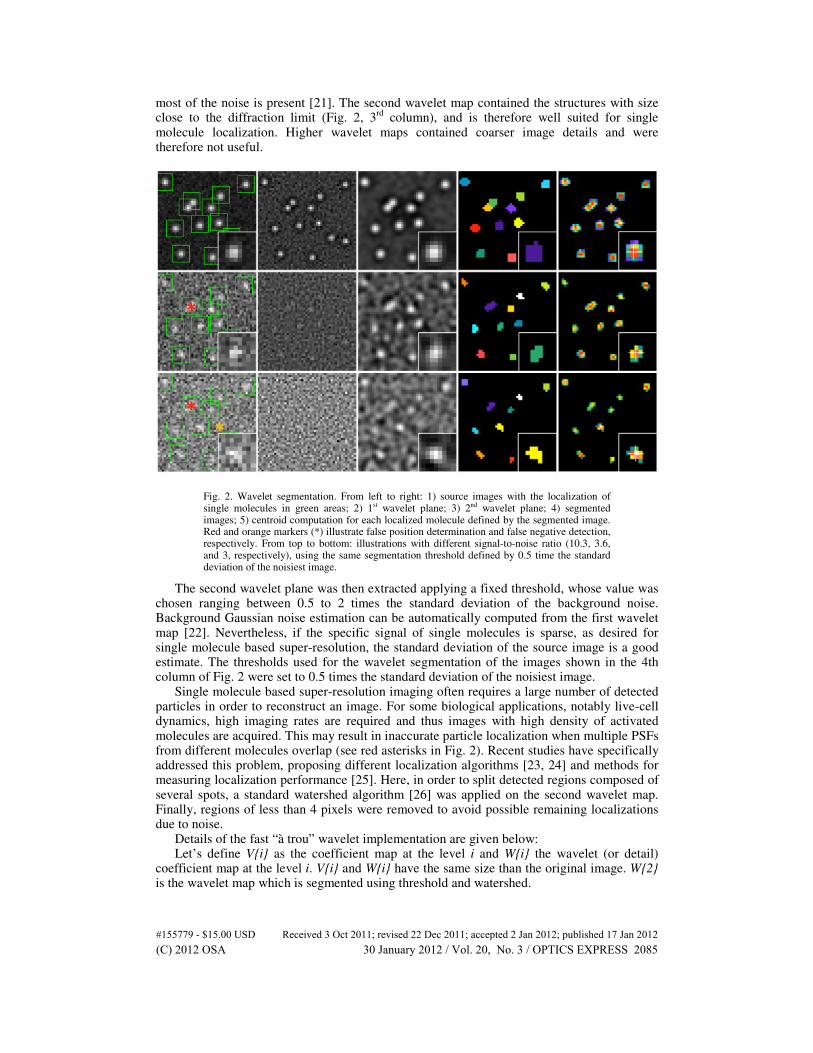
most of the noise is present [21]. The second wavelet map contained the structures with size close to the diffraction limit (Fig. 2, 3
rd column), and is therefore well suited for single
molecule localization. Higher wavelet maps contained coarser image details and were therefore not useful.
Fig. 2. Wavelet segmentation. From left to right: 1) source images with the localization of single molecules in green areas; 2) 1st wavelet plane; 3) 2nd wavelet plane; 4) segmented images; 5) centroid computation for each localized molecule defined by the segmented image. Red and orange markers (*) illustrate false position determination and false negative detection, respectively. From top to bottom: illustrations with different signal-to-noise ratio (10.3, 3.6, and 3, respectively), using the same segmentation threshold defined by 0.5 time the standard deviation of the noisiest image.
The second wavelet plane was then extracted applying a fixed threshold, whose value was chosen ranging between 0.5 to 2 times the standard deviation of the background noise. Background Gaussian noise estimation can be automatically computed from the first wavelet map [22]. Nevertheless, if the specific signal of single molecules is sparse, as desired for single molecule based super-resolution, the standard deviation of the source image is a good estimate. The thresholds used for the wavelet segmentation of the images shown in the 4th column of Fig. 2 were set to 0.5 times the standard deviation of the noisiest image.
Single molecule based super-resolution imaging often requires a large number of detected particles in order to reconstruct an image. For some biological applications, notably live-cell dynamics, high imaging rates are required and thus images with high density of activated molecules are acquired. This may result in inaccurate particle localization when multiple PSFs from different molecules overlap (see red asterisks in Fig. 2). Recent studies have specifically addressed this problem, proposing different localization algorithms [23, 24] and methods for measuring localization performance [25]. Here, in order to split detected regions composed of several spots, a standard watershed algorithm [26] was applied on the second wavelet map. Finally, regions of less than 4 pixels were removed to avoid possible remaining localizations due to noise.
Details of the fast “à trou” wavelet implementation are given below: Let’s define V{i} as the coefficient map at the level i and W{i} the wavelet (or detail)
coefficient map at the level i. V{i} and W{i} have the same size than the original image. W{2} is the wavelet map which is segmented using threshold and watershed.
#155779 - $15.00 USD Received 3 Oct 2011; revised 22 Dec 2011; accepted 2 Jan 2012; published 17 Jan 2012(C) 2012 OSA 30 January 2012 / Vol. 20, No. 3 / OPTICS EXPRESS 2085

Step 1: V{0} is initialized to the original image
Step 2: Calculation of V{1}: V{1} = convV(convH(V{1}, g{1}), g{1})
Step 3: Calculation of W{2}: V{2} = convV(convH(V{2}, g{2}), g{2})
Step 4: Calculation of W{2}: W{2} = V{1} - V{2}
Where g{1} refers to the low pass [ H2, H1,H0, H1, H2], g{2} refers to the low pass [ H2, 0, H1, 0, H0, 0, H1, 0, H2], with H0 = 3/8, H1 = 1/4, H2 = 1/16. convH refers to the convolution over the columns and convV refers to the convolution over the lines.
For comparison with our method, we chose the recently published multiple-target tracking (MTT) algorithm [27] as the Gaussian fitting approach. MTT is a robust algorithm for high-density single-particle detection calculations with performances close to the theoretical limits. Although the MTT algorithm is able of determining the position of overlapping PSFs and includes tracking capabilities, we limited the comparison to the detection and positioning of single PSFs, excluding deflation loops and trajectory determinations. MTT uses hypothesis-testing for particle detection followed by multi-parametric Gaussian fitting to estimate the subpixel position of single particles. Both the wavelet segmentation approach and MTT have a complexity of O(n), where n is the number of pixels in the image per frame. The main difference between the two approaches is how the localization coordinates are computed. For the wavelets, a simple centroid is computed on the 2
nd wavelet map for each region. Since the
number of molecules and their surface after segmentation are limited, the complexity of the watershed can be approximated to O(n) as well. Gaussian fitting relies on an iterative algorithm, with a minimum of 30 iterations, in order to extract the 5 parameters (x, y, sigma, intensity, and offset) that describe the two-dimensional Gaussian curve. We therefore decided to compare the two approaches by the number of computing operations instead of their computing complexity. The following Table 1 details the main steps of both methods:
Table 1. Steps followed by the Gaussian and wavelet approaches for particle detection and position determination.
Gaussian fitting Wavelets
Filtering Wavelet decomposition
For each region For each region
Loop for at least 30 times Computing the watershed
Computing the partial derivatives for the five Computing the centroid of the region(s)
parameters (x, y, sigma, intensity, offset) End for each region
Adjusting the parameters to minimize the errors
End loop
End for each region
3. Results
3.1 Computation time
In order to perform efficient imaging experiments, one key element is to be able to take decisions that might alter the experimental configuration during or right after acquisition. This is especially critical in live cell experiments, where the effective time of the experiment under the microscope may be limited in order to maintain the physiological conditions of the samples. A long post processing of the data after the actual experiment in the microscope room may thus severely limit the design and possible applications of super-resolution imaging experiments, which involve the quantitative analysis of hundreds of thousands of single molecule data points.
#155779 - $15.00 USD Received 3 Oct 2011; revised 22 Dec 2011; accepted 2 Jan 2012; published 17 Jan 2012(C) 2012 OSA 30 January 2012 / Vol. 20, No. 3 / OPTICS EXPRESS 2086

We performed the analysis in a Dell Precision T7500 computer, clock speed of 2.26GHz and 48GB of RAM, with two quad Intel Xeon processors E5520, although only one core was used during the calculations. Examining the calculation speed of the wavelet algorithm compared to MTT, we observed an improvement of more than one order of magnitude in the computation time. Figure 3 shows the calculation time for a series of 100 images of a wide range of SNR and particle density values. Whereas the calculation time as a function of the SNR saturates at similar values of SNR for both algorithms, the saturation level is about 20 times faster in the case of the wavelet analysis (note the logarithmic scale). On the other hand, Fig. 3B shows a linear increase of the computation time as a function of the particle density. Nevertheless, accurate experimental recordings will typically limit the particle density to the lower density levels, in order to avoid overlapping PSFs.
Fig. 3. Computation time. In panels A and B, comparisons of the computation time between the wavelet segmentation and the MTT algorithms. The total time needed to detect and determine the position of a series of 100 images with simulated single molecules, are represented as a function of the molecular density for different SNRs (A), and as a function of SNR for several molecular densities (B). Panel C shows a comparison between the wavelet algorithm and QuickPALM for a series of 4000 images at different molecular density. With QuickPALM, two to four CPU processors were used for the computation.
We also have also compared our method to the recently published QuickPALM algorithm [14] as an example of a widely used fast-processing algorithm. This algorithm uses a multithreading approach, which consists in partitioning the program into many tasks that can be processed in parallel, linking its performance to used processors. We have compared both methods on the same simulated data sets used above, with a particle density per image frame ranging from 0.1 to 0.75 molecule/µm
2 and using 1 to 4 CPUs for the QuickPALM algorithm.
These tests show that our method is more efficient for high densities (> 150 molecules), even with the use of four processors. For small densities (<150 molecules), both algorithms show
#155779 - $15.00 USD Received 3 Oct 2011; revised 22 Dec 2011; accepted 2 Jan 2012; published 17 Jan 2012(C) 2012 OSA 30 January 2012 / Vol. 20, No. 3 / OPTICS EXPRESS 2087

similar performance, with a variability depending on the number of processors used. It is noteworthy that our algorithm uses only one processor even with a multiprocessor architecture. Nevertheless, since in our wavelet segmentation the processing of images is completely independent, an implementation on a multiprocessor architecture is feasible.
3.3 Localization accuracy
As mentioned before, the resolution of the reconstructed image is ultimately given by the accuracy in determining the position of each single fluorophore. It is hence of the utmost importance for the overall performance of an algorithm not to compromise the pointing accuracy over the calculation speed. We computed the error made in each detection by measuring the Euclidean distance between coordinates of simulated data and the closest coordinates in the analyzed data. We then defined the localization accuracy as the mean value of the positioning error calculated for all the detections of each data set. Figure 4 shows the performance of both algorithms in retrieving the position of the fluorophores as a function of the SNR. As expected, the localization accuracy is inversely proportional to the SNR for high numbers of detected photons, and dominated by the background noise at low SNR. We found that the accuracy in determining the single molecule positions is comparable using both algorithms, for the entire range of SNRs and molecule densities used in this study. The results obtained with the wavelet approach algorithm are summarized in Table 2 for the different sets of simulated data with varying particle density and SNR.
Fig. 4. Localization accuracy. Comparison of the localization accuracy between the wavelet segmentation and the MTT algorithms. The localization accuracy was calculated as mean value of the positioning error calculated for all the detections of each data set, and is shown as a function of the SNR, for several molecular densities.
3.4 False positive/negative rate
Another important parameter to take into consideration is the reliability of the algorithms for particle detection. In other words, the ability of the algorithm to detect individual PSFs in a noisy image must be evaluated. When a particle present in the simulated data had no matching detection in the analyzed data set within a radius of 100 nm, it was counted as a false negative detection. Similarly, a false positive detection was defined as the identification of a molecule in the analyzed data set that was not present in the simulated data within a radius of 100 nm. Figure 5 shows the false positive (A) and false negative (B) rates as a function of the SNR. The results of the analysis show that the percentage of false positive and negative detections are similar for both algorithms, and strongly depend on the SNR of the simulated data, except for the false positive rate performed by the wavelet analysis, which remains fairly constant at a given molecular density. It is noteworthy that choosing a different minimum intensity threshold value would alter the rate of false positive and negative detections, without
#155779 - $15.00 USD Received 3 Oct 2011; revised 22 Dec 2011; accepted 2 Jan 2012; published 17 Jan 2012(C) 2012 OSA 30 January 2012 / Vol. 20, No. 3 / OPTICS EXPRESS 2088
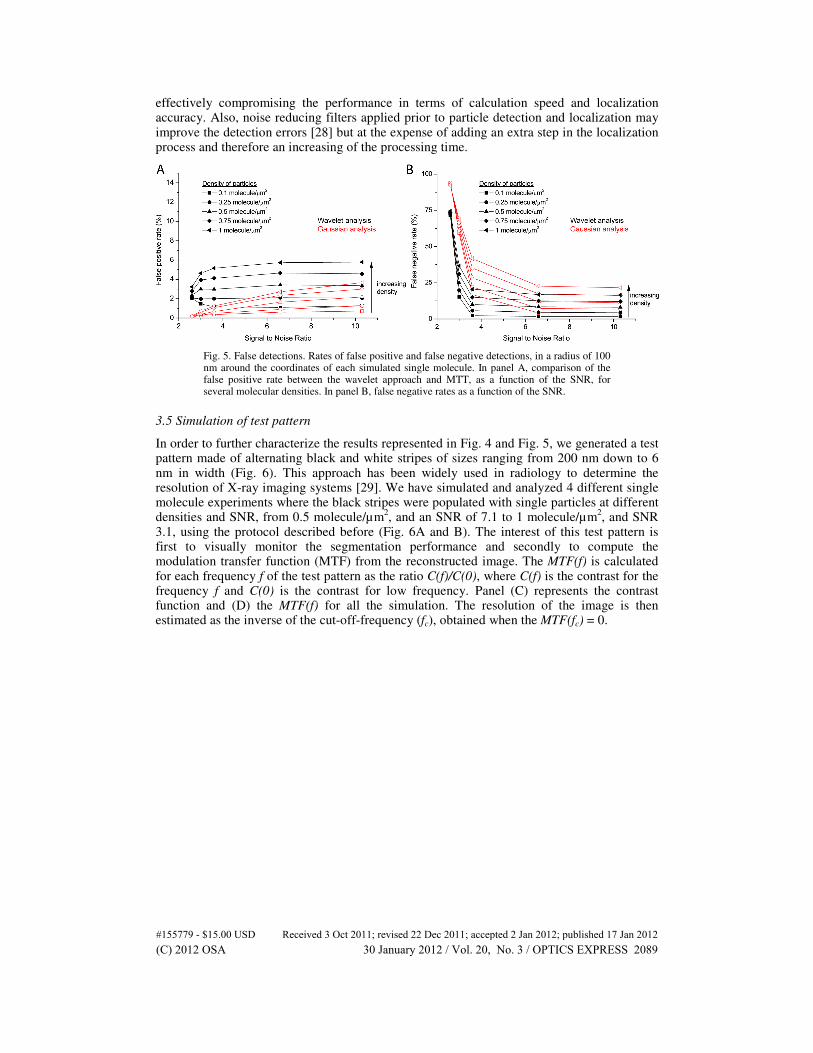
effectively compromising the performance in terms of calculation speed and localization accuracy. Also, noise reducing filters applied prior to particle detection and localization may improve the detection errors [28] but at the expense of adding an extra step in the localization process and therefore an increasing of the processing time.
Fig. 5. False detections. Rates of false positive and false negative detections, in a radius of 100 nm around the coordinates of each simulated single molecule. In panel A, comparison of the false positive rate between the wavelet approach and MTT, as a function of the SNR, for several molecular densities. In panel B, false negative rates as a function of the SNR.
3.5 Simulation of test pattern
In order to further characterize the results represented in Fig. 4 and Fig. 5, we generated a test pattern made of alternating black and white stripes of sizes ranging from 200 nm down to 6 nm in width (Fig. 6). This approach has been widely used in radiology to determine the resolution of X-ray imaging systems [29]. We have simulated and analyzed 4 different single molecule experiments where the black stripes were populated with single particles at different densities and SNR, from 0.5 molecule/µm
2, and an SNR of 7.1 to 1 molecule/µm
2, and SNR
3.1, using the protocol described before (Fig. 6A and B). The interest of this test pattern is first to visually monitor the segmentation performance and secondly to compute the modulation transfer function (MTF) from the reconstructed image. The MTF(f) is calculated for each frequency f of the test pattern as the ratio C(f)/C(0), where C(f) is the contrast for the frequency f and C(0) is the contrast for low frequency. Panel (C) represents the contrast function and (D) the MTF(f) for all the simulation. The resolution of the image is then estimated as the inverse of the cut-off-frequency (fc), obtained when the MTF(fc) = 0.
#155779 - $15.00 USD Received 3 Oct 2011; revised 22 Dec 2011; accepted 2 Jan 2012; published 17 Jan 2012(C) 2012 OSA 30 January 2012 / Vol. 20, No. 3 / OPTICS EXPRESS 2089
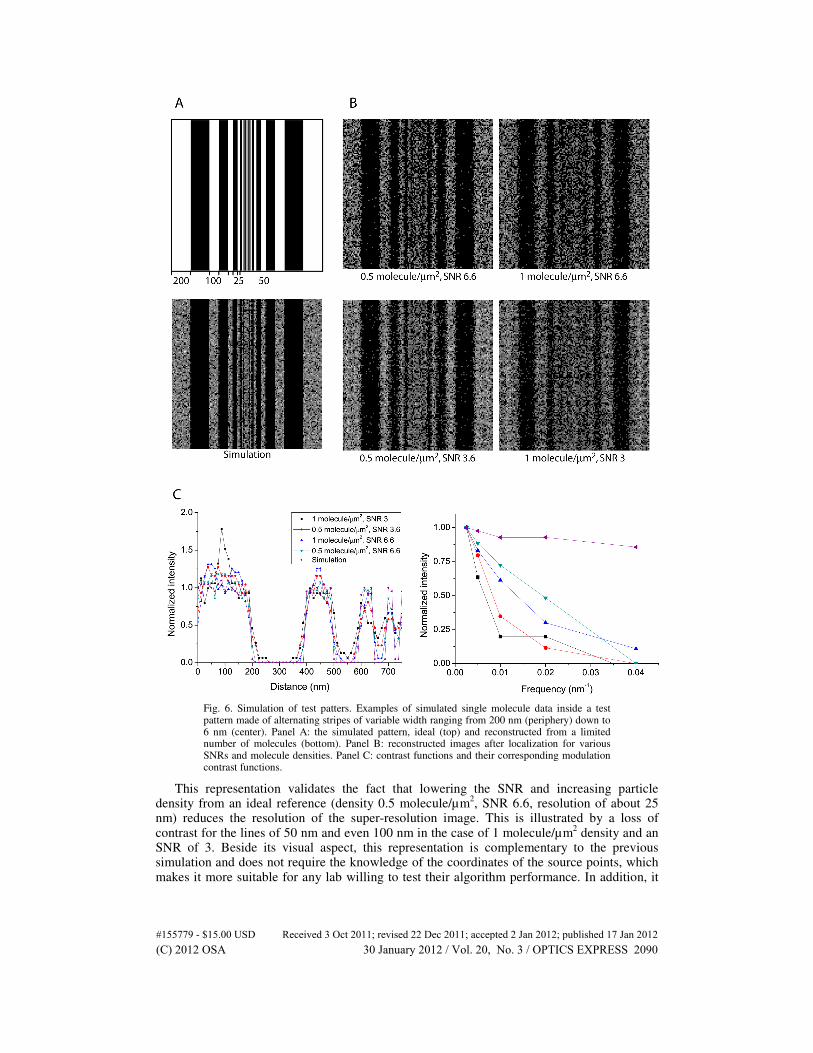
Fig. 6. Simulation of test patters. Examples of simulated single molecule data inside a test pattern made of alternating stripes of variable width ranging from 200 nm (periphery) down to 6 nm (center). Panel A: the simulated pattern, ideal (top) and reconstructed from a limited number of molecules (bottom). Panel B: reconstructed images after localization for various SNRs and molecule densities. Panel C: contrast functions and their corresponding modulation contrast functions.
This representation validates the fact that lowering the SNR and increasing particle density from an ideal reference (density 0.5 molecule/µm
2, SNR 6.6, resolution of about 25
nm) reduces the resolution of the super-resolution image. This is illustrated by a loss of contrast for the lines of 50 nm and even 100 nm in the case of 1 molecule/µm
2 density and an
SNR of 3. Beside its visual aspect, this representation is complementary to the previous simulation and does not require the knowledge of the coordinates of the source points, which makes it more suitable for any lab willing to test their algorithm performance. In addition, it
#155779 - $15.00 USD Received 3 Oct 2011; revised 22 Dec 2011; accepted 2 Jan 2012; published 17 Jan 2012(C) 2012 OSA 30 January 2012 / Vol. 20, No. 3 / OPTICS EXPRESS 2090

also enables the quantification of the effect of the density of detected molecules on the resolution, which is known to be crucial in single molecule super-resolution microscopy. Even if this aspect has not been quantified in the current paper, it is evident that the limited number of molecules affects the MTF of the simulated image. Finally, for each condition we have performed a linear interpolation of the MTF on the first points where MTF(f)>15%, a threshold below which the contrast is noisy, and computed the cut-off frequency. The results are in good agreement with the resolutions computed in the simulation, and are summarized in Table 2.
Table 2. Summary of the localization accuracy achieved with the wavelet algorithm approach for the sets of simulated data at different particle concentrations and SNRs. In brackets, localization accuracy as determined by the cutoff of the abscissa for the fit of the data points of the modulation transfer function above 15% normalized intensity.
SNR 10.3 SNR 6.6 SNR 3.6 SNR 3 SNR 2.6
0.1 molecule/µm2 9.2 nm 13.4 nm 28.9 nm 37.2 nm 47.6 nm
0.25 molecule/µm2 10.8 nm 14.7 nm 30.3 nm 38.1 nm 49 nm
0.5 molecule/µm2 13.2 nm
17 nm (11.9 nm)
31.8 nm (20.4 nm) 39.6 nm 50.3 nm
0.75 molecule/µm2 15.7 nm 19.4 nm 33.4 nm 40.9 nm 51.9 nm
1 molecule/µm2
18.4 nm 22.2 nm
(15.6 nm) 35.4 nm 42.4 nm
(35.7 nm) 54.8 nm
3.6 Comparison of the algorithms using experimental data
The analysis performed with the simulated data at different SNR and molecular density has shown that the wavelet algorithm approach does not compromise the localization accuracy nor the number of detected particles, compared to the classical Gaussian fit analysis, with an increase of up to a factor of 20 in the calculation speed. We then compared the performance of both algorithms with experimentally acquired data.
We performed PALM imaging experiments in dissociated rat hippocampal neurons expressing an actin marker fused to a photo-convertible fluorescent protein (ABP-tdEosFP, see reference [30] for details). A preliminary snapshot of the pre-converted form of the fluorophores allowed the acquisition of the diffraction-limited resolution image, shown in the left panel of Fig. 7. Subsequently, sparse subsets of single tdEosFP fluorophores were photoconverted and imaged until photobleached, recording a long-term acquisition of 50000 frames of 50 ms (~42 min of recording). We analyzed the raw data with both algorithms, and reconstructed the super-resolved images shown in Fig. 7.
#155779 - $15.00 USD Received 3 Oct 2011; revised 22 Dec 2011; accepted 2 Jan 2012; published 17 Jan 2012(C) 2012 OSA 30 January 2012 / Vol. 20, No. 3 / OPTICS EXPRESS 2091

Fig. 7. Experimental data. Performance of the wavelet segmentation algorithm and the MTT algorithm with experimental PALM data. Panel A: Low-resolution image (left) and super-resolution reconstructions (center and right) of the actin cytoskeleton of rat hippocampal neurons expressing ABP-tdEosFP and fixed with 4% paraformaldehyde. 50 000 individual frames were analyzed; the analysis with the wavelet segmentation algorithm took 7.7 minutes and identified 1 058 886 single molecule events, while the Gaussian approach took 116 minutes and detected 1 092 266 events. Panel B: Comparison of the intensity profiles across the shaft of the dendrite for the images shown in A (indicated by a white line). Panel C: higher
#155779 - $15.00 USD Received 3 Oct 2011; revised 22 Dec 2011; accepted 2 Jan 2012; published 17 Jan 2012(C) 2012 OSA 30 January 2012 / Vol. 20, No. 3 / OPTICS EXPRESS 2092

magnification of a 2.65 x 2.65 µm2 region (boxed region in A) containing an individual dendritic spine where 45 878 single molecule events were detected with the wavelet segmentation algorithm (top panel, detected particles are overlaid with the diffraction limited image of the pre-converted fluorophores); a super-resolution reconstruction is shown with a pixel size of 9.6 nm with each single molecule represented by one pixel of unitary intensity (lower panel). Panel D: Histogram of the SNR values of the single fluorophore intensities detected in the region, with a mean SNR of 5.3, and the mean values of the SNR considering the brightest 10%, 25%, 50%, 75%, and 100% detections.
In both cases, the total number of detected particles in the whole experiment was slightly over one million detections: 1 058 886 and 1 092 266 detected spots for the wavelet and the MTT algorithms, respectively. Whereas the total calculation time was only 7.7 minutes with the wavelet segmentation approach, it took 116 minutes with the Gaussian fit algorithm. The reconstructed super-resolution images have the same resolution and no degradation of the image could be observed. In panel B of Fig. 6, intensity profile sections across the shaft of the dendrite were compared for the low-resolution image and the super-resolution reconstructions performed with both algorithms, illustrating the high resolution imaging of cytoskeletal structures. We then analyzed the SNR of the detected fluorophores in a smaller region containing a single dendritic spine, shown in panel C. In this region, a total number of 45 878 individual events were detected in the 50 000 frames using the wavelet segmentation algorithm with a relatively broad distribution of fluorescence intensities and with a mean SNR of 5.3 (Fig. 7D).
4. Discussion
Super-resolution optical microscopy based on single molecule techniques strongly depends on both the acquisition parameters and the image analysis. In this work, we have proposed and validated an alternative approach to Gaussian fitting, based on wavelet filtering and centroid determination. We have measured a 20-fold gain in the speed of analysis only at the expense of a marginal loss in the pointing accuracy of 10%. Consequently the proposed method has revealed itself as a better approach for retrieving accurate detections at low SNR, and may be useful for reducing the minimum time required to obtain a satisfactory density of single molecules for super-resolution image reconstruction.
More generally, super-resolution microscopy lacks real quantitative knowledge of the image resolution obtained with experimental data. In most cases, the spatial resolution has been either quantified on the data themselves, or determined using a theoretical framework. In techniques based on single molecule localization (i.e. PALM, STORM, GSD), the resolution of the final reconstructed image depends on both, the SNR of each individual molecule (proportional to the number of detected photons per molecule) and the total particle density. The reconstructed image resolution can be regarded as the FWHM of the uncertainty distribution of the single molecule position that is 2.4 times the pointing accuracy. Yet, a meaningful representation of the super-resolution image requires a minimum sampling, which translates into a minimum density of detected particles. The Nyquist-Shannon information-sampling theorem states that a signal of bandwidth f can be reconstructed in its totality if this has been sampled with a frequency of 2f. In the field of single molecule based super-resolution, a generalization of this theorem is commonly used in terms of image resolution and density of detected particles: the sampling of detected molecules must be at least twice as dense as the image resolution [31]. We have quantified and illustrated such effects using realistic simulations of calibrated patterns and experimental data.
In the case of biological experimental data, the SNR of all the detected molecules can have a large distribution, as illustrated in Fig. 7D for the PALM representation of a dendritic spine. Given such broad distribution and the high density of single particle detections, one way of improving the resolution of the PALM reconstruction is to only consider the spots with the highest SNR, and rejecting those with a poor pointing accuracy that contribute to a loss in resolution. In Fig. 7D we plotted the mean SNR of the distribution considering the brightest 10%, 25%, 50%, 75%, and 100% of all detected molecules, corresponding to a number of detections of 4588, 11469, 22939, 34405, and 45878, and a mean value of SNR of
#155779 - $15.00 USD Received 3 Oct 2011; revised 22 Dec 2011; accepted 2 Jan 2012; published 17 Jan 2012(C) 2012 OSA 30 January 2012 / Vol. 20, No. 3 / OPTICS EXPRESS 2093
10.8, 8.7, 7.1, 6.1, and 5.3, respectively. This a posteriori filtering may improve the final image resolution but at the expense of decreasing the density of molecules, yet another limiting factor of the resolution. In practice, this imposes a minimum density of molecules in order to reach a certain image resolution, independent of the localization accuracy of each individual molecule. In the case of the individual spine of Fig. 7C, the detected actin molecules are distributed in an area of 1 µm
2. Considering that the distribution of molecules is
relatively homogenous in such a small region of the cell and assuming an unlimited localization accuracy, we have calculated the mean first-neighbor distance of the molecules. As a result, the best expected resolution as stated by the generalization of the sampling theorem was: 29.5 nm considering the brightest 10% of detections, 18.7 nm considering 25% of the brightest molecules, 13.2 nm with 50%, 10.8 nm with 75%, and 9.3 nm with 100% of the detections. Note that this resolution limit is given by the density of detected particles and not by the SNR of the detections. Therefore, for low densities the number of detected particles may define the maximal image resolution, whereas beyond that criterion, the SNR of the detections is the limiting parameter. The balance between molecular density and a posteriori filtering of the data are the two main factors to take into consideration when constructing a super-resolution image.
We have presented a new, fast, and efficient segmentation method for single molecule detection and localization. This work highlights the importance of a detailed characterization of the parameters that influence single molecule based super-resolution techniques. We propose different simulation strategies to quantify the experimental resolution of the system and show the significance of molecule density as a key parameter to take into account for best image reconstruction.
5. Materials and methods
5.1 Simulations
Single molecules images were simulated using 2D isotropic Gaussians [32], of maximum intensity I0, standard deviation σ and intensity offset B, sampled in a discrete space of pixel size D. σ and D refer to the objective resolution and the CCD camera pixel size in the object space respectively. We used σ = 1 and D = 100 nm simulating ideal sampling for high NA objective. 2πσI0 refers to the number of collected photons NP per single molecule [33]. We used an offset IB value of 1000 grey levels and Io intensities ranging from 100 to 1000 grey levels, compatible with the number of photons emitted by conventional genetic fluorescent proteins and organic single molecule dyes used in super-resolution microscopy [34, 35]. Then, we corrupted the images by a mixture of Poisson (photon) and Gaussian (electronic) noise. At each pixel p of the images the noise model for the intensities IP of the simulated images is the sum of a Poisson noise of rate µP coming from the limited number NP of photons and a Gaussian noise BP of mean IB and variance σB summarizing the electronic noises. A gain g represents the ratio of gray levels per photo-electrons in the image collected by the CCD. Finally, the intensity can be written as IP = gNP + BP. For each image, the SNR is defined as
2 2
B I
ISNR
σ σ
=
+
[36], where I is the maximum intensity of the single molecule signal, 2
Bσ is
the variance of the background intensities, and 2
Iσ accounts for the photon noise, computed
as the integrated signal for the single molecule, proportional to the number of photons.
5.2 Experimental data acquisition
Super-resolution imaging was performed on an inverted fluorescence microscope (see reference [30] for details). Photoactivation was performed with a 405 nm laser and excitation with a 561 nm laser, both of them collimated into the microscope and focused at the rear plane of a high NA (1.49) 100X objective, therefore illuminating the sample in wide field
configuration. The photon densities were 3x10⁻²
kW/cm2 (405 nm) and 4 kW/cm
2 (561 nm).
Single molecule signals were separated with a 561 nm dichroic and filtered with an emission
#155779 - $15.00 USD Received 3 Oct 2011; revised 22 Dec 2011; accepted 2 Jan 2012; published 17 Jan 2012(C) 2012 OSA 30 January 2012 / Vol. 20, No. 3 / OPTICS EXPRESS 2094

filter centered at 617 nm and a spectral width of 70 nm. The signal was expanded with a 1.5X lens and focused on an EMCCD with pixel size of 16 µm, therefore the pixel size on the image plane was 107 nm. The low-resolution image of the pre-converted form of the fluorophore was taken using a mercury lamp for illuminations (excitation at 485 nm, emission at 525 nm).
5.3 Rendering of super-resolution images
Super-resolution images were rendered by superimposing the position coordinates of the detected single molecules, represented with a 2D Gaussian curve of unitary intensity value, with standard deviation determined by the mean localization accuracy of the detected molecules.
#155779 - $15.00 USD Received 3 Oct 2011; revised 22 Dec 2011; accepted 2 Jan 2012; published 17 Jan 2012(C) 2012 OSA 30 January 2012 / Vol. 20, No. 3 / OPTICS EXPRESS 2095
Related Documents