The following discussion and analysis of financial results should be read in conjunction with the audited financial statements and the accompanying notes for the quarter ended May 31, 2015 and is based on information available to July 27, 2015. Additional information on Wavefront Technology Solutions Inc.’s (the “Company” or “Wavefront”) is available on SEDAR at www.sedar.com. Wavefront Technology Solutions Inc. Quarterly Report For the third Quarter ended May 31, 2015

Welcome message from author
This document is posted to help you gain knowledge. Please leave a comment to let me know what you think about it! Share it to your friends and learn new things together.
Transcript

The following discussion and analysis of financial results should be read in conjunction with the audited financial statements and the accompanying notes for the quarter ended May 31, 2015 and is based on information available to July 27, 2015. Additional information on Wavefront Technology Solutions Inc.’s (the “Company” or “Wavefront”) is available on SEDAR at www.sedar.com.
Wavefront Technology Solutions Inc.
Quarterly Report
For the third
Quarter ended
May 31, 2015
Management’s Discussion and Analysis of Financial Condition and Results of Operations
- 1 -
MANAGEMENT’S RESPONSIBILITY Management has prepared this Management’s Discussion and Analysis (“MD&A”). The MD&A is based upon Wavefront Technology Solutions Inc.’s (the “Wavefront” or “the Company”) financial results prepared in accordance with IFRS. The MD&A primarily compares the unaudited financial results for the third quarter ended May 31, 2015 to May 31, 2014. Management has established and maintains an accounting and reporting system supported by internal controls designed to safeguard assets from loss or unauthorized use and ensure the accuracy of the International Financial Reporting Standard’s (“IFRS”) financial records (also see section titled “Controls and Procedures” page 23). The financial information presented throughout this MD&A should be read in conjunction with the unaudited condensed consolidated interim financial statements and related notes for the quarter ended May 31, 2015 as well as the audited consolidated financial statements for the period ended August 31, 2014 and 2013 and the related notes. Unless otherwise indicated, all amounts shown below are in Canadian dollars. Additional information regarding our Company is available on SEDAR, www.sedar.com. Such additional information is not incorporated herein, unless otherwise specified, and should not be deemed to be made part of this MD&A. The Audit Committee of the Board of Directors, whose members are independent as defined in National Instrument 52-110: Audit Committee, met to review the condensed consolidated interim financial statements with management, and has reported to the Board of Directors thereon. On the recommendation of the Audit Committee, the Board of Directors has approved the condensed consolidated interim financial statements. NON-IFRS MEASURES AND SEGMENTED REPORTING The Company uses IFRS, additional and non-IFRS measures to make strategic decisions, set targets and are used in operating activities, as well the Company believes that these additional and non-IFRS measures provide useful supplemental information to investors. “working capital”, “gross profit”, “gross profit margin”, “cash used in operating activities”, “other technology revenues”, and “EBITDA” are measures used by the Company that do not have a standard meaning prescribed by IFRS and may not be comparable to similar measures used by other companies.
• Working capital is calculated by subtracting current liabilities from current assets. Working capital is a non-IFRS measure with no comparable IFRS measure;
• Gross profit is calculated by deducting cost of sales which includes direct costs, such as direct materials, direct labour, travel related expenditures, sub-contractors, shipping, duties and taxes, from gross revenue. Gross profit margin is calculated by dividing the gross profit by gross revenue. Gross profit is a non-IFRS measure with no comparable IFRS measure;
• Cash used in operating activities is a measure of the total cash generated from the Company’s operations
and is calculated by adding back amortization, share based payments and other non-cash items to net income and then adjusting for changes in working capital. Cash used in operating activities is a component of the IFRS consolidated statement of cash flows;
• Other Technologies Revenue consists of Primawave and Performance Drilling revenues. Other
Technologies revenues are non-IFRS measure with the most comparable IFRS measure being revenues; and,

Management’s Discussion and Analysis of Financial Condition and Results of Operations
- 2 -
• EBITDA, an acronym for earnings before interest, taxes, depreciation, and amortization, is calculated by adding back all interest, tax, depreciation and amortization to net loss. EBITDA is an additional IFRS measure with the most comparable IFRS measure is net income (loss).
Non-IFRS measures are viewed as key information as the chief decision maker, being the President and Chief Executive Officer, regularly reviews such measures in making expense and capital investment decisions. Wavefront also believes that the non-IFRS measures defined here are useful for providing investors with additional information to assist them in understanding components of Wavefront’s financial results. Wavefront operates with one reportable segment that covers all aspects of the Company’s business. Wavefront considers the basis on which it is organized, including the economic characteristics (such as the nature of the products and service, types of customers, quantitative and qualitative thresholds, etc.) and geographic areas, in identifying its reportable segment. The operating segment(s) of the Company is defined as components of the Company for which separate financial information is available and is evaluated regularly by the chief operating decision maker in allocating resources and assessing performance. Within this MD&A, however, Wavefront provides additional product level information such as revenues by product line and geography, and gross profit margins by product line, which are within its one reportable segment, as it believes this additional information is useful supplemental information to investors with respect to the development of the business. OVERVIEW OF BUSINESS Wavefront’s business operates in a market where there is increasing demand to bring economically beneficial solutions to exploration and production companies (“E&P”) to maximize oil and gas productivity. Central to Wavefront’s broad intellectual property portfolio is the fluid delivery process, Powerwave that encompasses a client’s post exploration operations. Wavefront focuses on two primary technology and services areas (generally referred to hereafter as “Powerwave”):
i. Maximizing Production: Oil and gas well workover or stimulation (revitalizing individual well productivity); and
ii. Mitigating Production Decline: Optimizing Improved or Enhanced Oil Recovery (“IOR” or “EOR”) strategies for mature fields through more efficient fluid injection.
A single well workover or stimulation is a remedial operation performed on; (a) producing well to restore or enhance productivity or (b) a water injection well to improve injection rates. In some instances a chemical is pumped into the well to stimulate a producing interval. In other cases workovers or cleanouts are used to remove scales such as calcium carbonate or barite, to rid a well of accumulated waxes on tubulars or to remove sand fill. A single well workover or stimulation is generally on the order of one day compared to IOR/EOR flooding operations (i.e. waterflooding) that can last much more than a decade. Improved well stimulation leading to increased post-stimulation production performance is achieved with Wavefront’s Powerwave well stimulation tools that maximize volumetric contact area with the well completion and reservoir during the stimulation operation. The well workover and stimulation market is in excess of $1 billion

Management’s Discussion and Analysis of Financial Condition and Results of Operations
- 3 -
annually1 as virtually all production and injection wells periodically require some form of stimulation to enhance production or injection. It is well established that many once-prolific oil fields are reaching or have reached maturity with production rates from these fields in steady decline. Not so widely known is that even after many stages of production up to 60% of all oil remains stranded in these fields. In the United States approximately 80% of the producing oil wells are classified as marginal (produce oil at less than 10 barrels of oil per day). Total United States production from these marginal wells represents about 1 million barrels of oil per day or approximately 19% of domestic oil production2. IOR and EOR strategies are aimed to mobilize oil trapped in the reservoir. This oil becomes increasingly more difficult to produce with time due to various physical limitations. The most common strategies for IOR and EOR projects involve the purposeful injection of a fluid to mobilize trapped oil or to re-pressurize the reservoir. Powerwave is applicable to all common IOR or EOR strategies (except acoustic or electromagnetic) as it works to improve how fluids are injected and distributed throughout the reservoir to rescue stranded oil. In North America there are approximately 166,400 active wells3 used to inject water, polymers, surfactants, and combinations thereof. These wells are heavily concentrated in Alberta, California, and Texas. OUTLOOK Wavefront has a wide-ranging market opportunity within the oil industry and the Company’s focus continues on positioning Powerwave to capitalize on immediate and future growth prospects. The prolonged turmoil in the oil sector has had repercussions across the oilfield services sector as oil producers scaled back on exploration and production activities in the midst of weaker cash flows. Furthermore, global macro-economics have also put further downward pressure on oil prices; thus extending the time to price stability and/or higher prices. These combined factors will continue to bring numerous challenges to the Company and as such, Management does not expect to see near term year-over-year revenue growth.
Wavefront’s overall financial results may also remain susceptible to technology adaption rates, client project scheduling, direct and indirect competition, and pricing pressure from customers as they seek to cut costs to improve profitability. Internationally Wavefront has on-going Powerwave IOR/EOR contracts in Argentina, Colombia, and Brazil as well as an expanded Powerwave program slated for Oman through domestic representative and distributors. These representatives and distributors are “Powerwave Certified Providers” and act as Wavefront’s daily marketing arm, are holders of Wavefront’s inventory, and supply field personnel for Powerwave related work. Subsequent to the third quarter ended May 31, 2015 Wavefront entered into a “Commercial Agreement” with NPS Energy DMCC (“NPS”), a United Arab Emirates headquarter company for the provision of Wavefront’s Powerwave Technology in the Middle East, North Africa and Far East Asia. NPS is the largest regionally-owned oil, gas and petrochemical services provider in the Middle East delivering drilling, customized well services and support to 1 Ducker Worldwide, LLC 2014 2 US Department of Energy, netl.doe.gov/research/oil-and-gas/stripper-wells 3 Ducker Worldwide, LLC 2014

Management’s Discussion and Analysis of Financial Condition and Results of Operations
- 4 -
customers in the Middle East, North Africa and Far East Asia through 20 subsidiaries and branches. Over the next several quarters Wavefront anticipates growth in its well workover and stimulation offering in the Middle East as positive Powerwave results continue to be realized and new marketing efforts providing further opportunities. With our strong market focus of Powerwave within two well defined industry verticals, Wavefront is seeking to minimize technology risk and accelerate commercialization timelines. We remain confident that with our know-how as well as the experience and positioning of our marketing partners that over the long-term our Company will continue to succeed to grow market penetration in key geographical areas. OVERALL RESULTS FROM OPERATIONS Total revenues for the nine months ended May 31, 2015 amounted to $3,766,363, which was a decrease of $626,381 compared to the comparative period that reported total revenues of $4,392,744. During this period the Company however, was able to increase international Powerwave IOR/EOR revenues by $353,502 and Powerwave stimulation and workover revenues in the United States by $34,020 over the comparative period in 2014. Total revenues declined by $285,838 for the third quarter (i.e., three months ended May 31, 2015) over the comparative period in 2014. The decline in quarterly revenues from the comparative was largest in the Powerwave workovers and stimulation (i.e., $521,166); however, Powerwave IOR/EOR increased by $207,757 and Tubing Pumps and Bailers increased by 47,053. The largest revenue gains were in international Powerwave IOR/EOR where revenues increased by $452,962 for the three months ended May 31, 2015 over the comparative period of 2014. As a result of the proactive positioning of the Company in the Powerwave stimulations, expense rationalization and focus on international projects, the cash used in operating activities was $94,666 (2014 – $609,230) and $593,435 (2014 - $1,948,316) for the three and three months ended May 31, 2015, respectively. The Company will continue to focus its resources on the markets and products with nearer term sales and those with higher potentials for recurring revenues. Throughout the fiscal year Management has focused on reducing operating expenditures dollar-for-dollar to any reductions in revenue and manage capital expenditures to those that are absolutely necessary and/or linked to near term revenue generation. To this end Management was able to reduce year to date expenses, excluding non-cash impairment charges, by $960,485, a 53.3% increase in expense reduction over the revenue reduction of $626,381. In addition, Management was able to reduce expenses for the three months ended May 31, 2015, excluding non-cash impairment charges, by $457,838, a 60.2% increase in expense reduction over the revenue reduction of $285,838. As part of the expense reduction efforts, and in addition to the prior quarter’s reduction in personnel, Management and staff have been rolled back wages and benefits between 7.5% and 9%, which may result in a reduction of annualized wages by approximately $195,600. With specific concentration on increasing market penetration for Wavefront’s Powerwave workover and stimulation suite of tools the Company believes that this may have contributed, at least in the short term, to offsetting decreases in Powerwave IOR/EOR revenue growth. Despite this strategic focus, Powerwave workover and stimulation quarterly revenues declined from prior quarter as a result of reduced activity by American and Canadian E&Ps companies as they began reducing their expenditures in face of the lower crude oil prices. The Company however, subsequent to the reporting quarter has seen an increase in activity in Powerwave workover and stimulation projects.

Management’s Discussion and Analysis of Financial Condition and Results of Operations
- 5 -
Impairment International Accounting Standards (“IAS”) 36, Impairment of Assets, seeks to ensure that an entity's assets are not carried at more than their recoverable amount (i.e. the higher of fair value less costs of disposal and value in use). The Company considers both external and internal sources of information in assessing whether there are indications that any of its CGUs are impaired in applying IAS 36. External sources of information that the Company considers include changes in the market, economic and legal environments in which the Company operates that are not within its control and may affect the recoverable amount of its net carrying amount of its assets. Internal sources of information the Company considers include any obsolescence, utilization or expected utilization rates, and economic performance or performance compared to Management’s expectations of its CGUs’ assets. In assessing whether there is objective evidence that the Company’s assets are impaired, Management considers observable data including the carrying amount of the Company’s net assets as compared to the Company’s market capitalization. As at May 31, 2015, the Company assessed impairment indicators for the Powerwave, Performance Drilling, Primawave, and Tubing Pump and Bailers CGUs and concluded no impairment indicators were present. In the prior quarters ended November 30, 2014 and February 28, 2015, however, the Company determined that impairment indicators existed related to the Company’s market capitalization being below the carrying value of its net assets, the drop in and volatility in crude oil prices, and the changes to operating and capital budgets of E&P company budgets. Additional impairment indicators were present at February 28, 2015 in that the Company experienced weaker than expected economic performance and implemented operation expense reduction measures, including rationalization of its work force, and managed capital programs. In accordance with International Accounting Standards (“IAS”) 36, the impairment loss allocated to the individual assets within the CGU is subject to a cap where the carrying amount of the individual asset should not be reduced below the highest of 1) its fair value less costs of disposal; 2) its value in use; and zero. In performing this allocation, the Company determined that it was able to estimate the recoverable amount of individual assets with the remaining items in property, plant and equipment in the CGU. The recoverable amount calculated for Powerwave tools and equipment within the property, plant and equipment category was determined based on a fair value less costs of disposal by applying similar market prices for recent sales and license of similar Powerwave tools. Similarly, the fair value less costs of disposal for certain leasehold improvements, computer, automotive, office and shop equipment was determined based on market prices for similar assets. After applying the requirements under paragraph 104 and 105 of IAS 36, the Company recognized a non-cash impairment charge of $5,023,475, which is allocated to the assets in the CGU consisting of $1,753,520 non-cash impairment charge for property, plant and equipment and $3,269,955 non-cash impairment charge for intangible assets. The Company determined that there was a remaining excess of $635,206 of the impairment loss and no liability has been recognized for this remaining amount. Further information regarding assumptions and estimates used, as well as a sensitivity analysis in respect of each of the annual growth rate and discount rate applied, being the key assumptions, is contained in Note 3, “Impairment” of the Unaudited Interim Condensed Consolidated Financial Statements for the period ended May 31, 2015 and is incorporated by reference herein. In the comparative quarter ended May 31, 2014, the Company determined impairment indicators exists and undertook impairment testing of its goodwill and the associated assets of the Tubing Pump and Bailers CGU to which the Company’s goodwill was solely attributed. Goodwill impairment testing was historically been done at the conclusion of the fourth quarter. However, as at May 31, 2014, the Company’s market capitalization was below the carrying value of its net assets, which represented a potential impairment indicator. More over Management concluded that impairment testing was required as Tubing Pump and Bailers CGU’s performance was weaker than expected as a result of the higher

Management’s Discussion and Analysis of Financial Condition and Results of Operations
- 6 -
heavy oil price differential in prior periods, which impacted drilling4 and thus affected the Tubing Pump and Bailers CGU. The May 31, 2014 impairment testing was based on Management’s internal projections, and also included a blended discount pre-tax rate of 18.5% given the CGU’s characterization of risk. Cash flows beyond the five year period were extrapolated using a 0.9% terminal growth rate equal to the Government of Canada Consumer Price Index as at the balance sheet date. In the comparative quarter ended May 31, 2014, the Company recorded a non-cash impairment loss of $1,338,584. Since the resulting impairment loss exceeded the goodwill allocated to the CGU, which had a carrying value of $1,222,217, the Company allocated the additional impairment loss to the Tubing Pump and Bailers CGU’s property, plant and equipment in the amount of $116,367. Management believes that the methodologies used to impair the CGUs, which involves a significant number of judgments and estimates, provides a reasonable basis for determining the impairment. Many factors used in determining the impairment are outside Management’s control and involve inherent uncertainty. Therefore, actual results could differ from those estimates and further changes in the numerous variables associated with the judgments, assumptions and estimates made in assessing the impairment could cause the CGUs to be further impaired. Given the continued volatility of markets, the Company will continue to monitor impairment indicators and to test for the recoverable amounts of the various CGUs as required. Consolidated Results – nine months ended May 31, 2015 Revenues Revenues for the nine months ended May 31, 2015 were $3,766,363, a decline of $626,381 over the comparative quarter ended May 31, 2014 that recognized revenues of $4,392,744. The changes in product line mix can be characterized as follows:
4 TD Economics, Drilling Down on Crude Oil Price Differentials, March 14, 2013 page 3
Powerwave: well
stimulations and
workovers$1,624,834
Powerwave: IOR/EOR
$1,595,783
Other technologies:
$47,954
Tubing pump and
bailers:$497,791
May 31, 2015
Powerwave: well
stimulations and
workovers, $1,965,685
Other technologies,
$206,522
Powerwave: IOR/EOR
$1,649,377
Tubing pump and bailers, $519,968
May 31, 2014

Management’s Discussion and Analysis of Financial Condition and Results of Operations
- 7 -
Revenue attributed to the Powerwave product lines were $3,220,618, a decline of $394,444 over revenues in the comparative quarter of $3,615,061. The Powerwave product line revenues can then be broken into short-term projects involving well workovers and stimulations, and long-term projects related to using Wavefront’s technology in IOR/EOR. For the nine months ended May 31, 2015, the total revenue related to Powerwave IOR/EOR projects totalled $1,595,783 compared to $1,649,377 in the comparative quarter. Of the $1,595,783 of revenue related to Powerwave IOR/EOR projects $1,022,513 relate to international projects and $485,384 related to Canadian projects. For the nine months ended May 31, 2015, Powerwave revenues related to well workover and stimulations totalled $1,624,834, a decrease of $340,850 compared to $1,965,685 in the comparative quarter. During this period of oil price volatility, the Company, was however able to marginally increase Powerwave well workover and stimulation revenues in the United States by $34,020 over comparative period revenues. For the nine months ended May 31, 2015, revenues from the tubing pumps and bailer product line totalled $497,791 compared to $519,968 in the comparative period. Tubing pumps and bailer revenues comprise of tool rental, delivery and refurbishment fees. Recent client discussions regarding bailer rentals has resulted in the Company being able to increase the three months tubing pump and bailer rentals to $207,190 from $160,137. The Company still expects to see continued variation in bailer revenues as more resources are designated to Powerwave projects and due to the influences of lower heavy oil drilling activity in Western Canada due to current oil prices. Tubing pump revenues are expected to remain lower as progressive capacity pumps are now able to manage larger volumes of sand, and thus, reduce demand for pump rentals in the early stages of well production. For the nine months ended May 31, 2015, Other Technology revenues totalled $47,955 for the reporting period compared to $206,523 from the comparative quarter. The Company expects to see continued variation in Other Technology revenues quarter over quarter. Geographically, $1,202,528 (2014 – $1,888,850) in revenue was generated in Canada, $1,421,626 (2014 - $1,645,769) from the United States, and $1,142,210 (2014 - $858,127) internationally. The Company’s focus in Canada and the United States is on Powerwave well workovers and stimulations and IOR/EOR projects. Working with our marketing partners and internal sales personnel our Company’s goal is to broadly expand the client base in well workovers and stimulations as well as IOR/EOR. The geographic revenues are more specifically described as follows:
Canada. Gross revenues in our Canadian operation decreased by $686,321 to $1,202,528 compared to $1,888,849 in comparative quarter. Powerwave IOR/EOR project revenues totalled $485,384 (2014 - $763,484); Powerwave well workover and stimulation revenues in Canada totalled $219,353 (2014 - $536,972); tubing pump and bailer revenues totalled $497,791 (2014 - $519,968). The Company also recognized Other Technology revenues of $nil (2014 - $17,233) and $nil (2014 - $51,192) in oil and gas revenues in the comparative period. United States. Gross revenues in our United States operation decreased by $224,143 to $1,421,626 (2014 - $1,645,769). Powerwave IOR/EOR project revenues totalled $87,886 (2014 - $216,881); Powerwave well workover and stimulation revenues totalled $1,286,285 (2014 - $1,252,264); and Other Technology revenues totalled $47,455 (2014 - $176,622).
International: Gross revenues outside our Canadian and United States operations increased by $284,083 to $1,142,210 (2014 - $858,127). Powerwave IOR/EOR project applications revenues totalled $1,022,513 (2014 - $669,012) Powerwave well workover and stimulation revenues totalled $119,197 (2014 - $176,448); and Other Technology revenues totalled $500 (2014 - $12,667). Wavefront has seen a general increase in the interest

Management’s Discussion and Analysis of Financial Condition and Results of Operations
- 8 -
Wavefront’s technology to bolster oil production in aging fields in the international community principally in the Middle East but also in Latin and South America, and Brazil. As well, as production revenues in certain state owned E&Ps, may supplement social programs, the Company anticipates some increases in demand; however, crude oil prices volatility has and may continue to impact demand that is unpredictable.
Direct Expenses Costs of sales for the nine month period ended May 31, 2015 were $1,515,968 or 40.3% of revenues (2014 - $1,343,336 or 30.6% of revenues). The increase in costs of sales principally relates to international Powerwave IOR/EOR project costs that amounted to $612,886 or 59.9% of those product line geographic revenues. Additionally, the sale of downhole Powerwave tools and surface electronic controllers to one Canadian client that had costs of sale that amounted to $237,236 or 48.9% of those revenues also negatively impacted gross profit margins. These particular costs and their relative proportion within the product mix in Powerwave EOR impacted the overall costs of sales. Gross Profit The following table sets out the gross profit margins by product line for the nine month ended May 31, 2015:
Powerwave EOR
Powerwave Stimulation
Tubing pumps & bailers
Other Technologies Total
Revenues 1,595,783$ 1,624,834$ 497,791$ 47,955$ 3,766,363$ Costs of sales 857,597 438,864 213,163 6,344 1,515,968
738,186$ 1,185,970$ 284,628$ 41,611$ 2,250,395$
Gross profit margin (note 1) 46.3% 73.0% 57.2% 86.8% 59.7%
The following table sets out the gross profit margins by product line for the nine months ended May 31, 2014:
Powerwave EOR
Powerwave Stimulations
Tubing pumps & bailers
Other Technologies Total
Revenues 1,649,377$ 1,965,684$ 519,968$ 206,523$ 4,341,552$ Costs of sales 345,154 687,770 230,359 80,053 1,343,336
1,304,223$ 1,277,914$ 289,609$ 126,470$ 2,998,216$
Gross profit margin (note 1) 79.1% 65.0% 55.7% 61.2% 69.1%
Note 1: Gross profit margin is calculated by subtracting direct costs from revenue and dividing the result by revenue, and is further discussed in Non-IFRS Measures In addition to the above noted revenues for the comparative nine months ended May 31, 2014, the Company had oil and gas production revenues of $51,192. Other Expenses Other expenses for the nine months ended May 31, 2015, amounted to $9,901,556, compared to $7,349,782 in 2014. Excluding the non-cash impairment charge as noted above (page 5) and costs of sales, expenses for the nine months ended May 31, 2015 amounted to $4,878,081, representing a decrease in these expenses of $628,784 compared to $6,011,198 in 2014. The decrease in expenses was principally a result of the following changes:
Management’s Discussion and Analysis of Financial Condition and Results of Operations
- 9 -
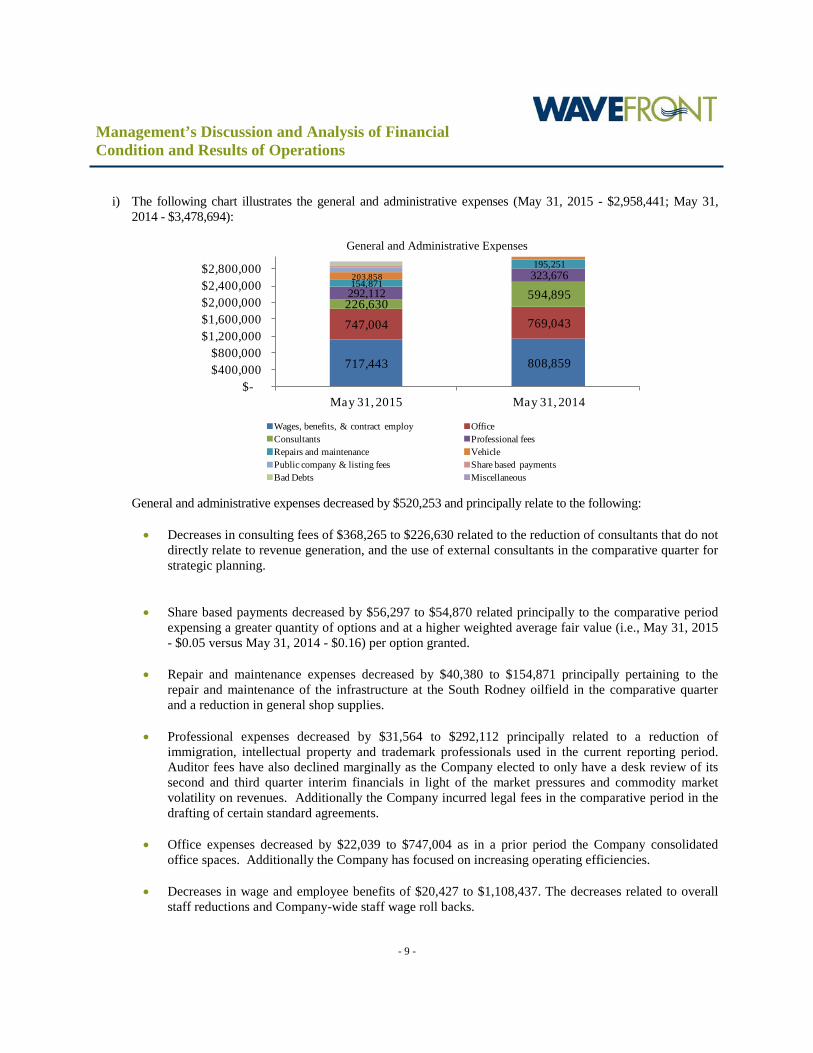
i) The following chart illustrates the general and administrative expenses (May 31, 2015 - $2,958,441; May 31, 2014 - $3,478,694):
717,443 808,859
747,004 769,043 226,630
594,895 292,112 323,676
154,871
195,251 203,858
$-$400,000 $800,000
$1,200,000 $1,600,000 $2,000,000 $2,400,000 $2,800,000
May 31, 2015 May 31, 2014
Wages, benefits, & contract employ OfficeConsultants Professional feesRepairs and maintenance VehiclePublic company & listing fees Share based paymentsBad Debts Miscellaneous
General and administrative expenses decreased by $520,253 and principally relate to the following: • Decreases in consulting fees of $368,265 to $226,630 related to the reduction of consultants that do not
directly relate to revenue generation, and the use of external consultants in the comparative quarter for strategic planning.
• Share based payments decreased by $56,297 to $54,870 related principally to the comparative period
expensing a greater quantity of options and at a higher weighted average fair value (i.e., May 31, 2015 - $0.05 versus May 31, 2014 - $0.16) per option granted.
• Repair and maintenance expenses decreased by $40,380 to $154,871 principally pertaining to the repair and maintenance of the infrastructure at the South Rodney oilfield in the comparative quarter and a reduction in general shop supplies.
• Professional expenses decreased by $31,564 to $292,112 principally related to a reduction of immigration, intellectual property and trademark professionals used in the current reporting period. Auditor fees have also declined marginally as the Company elected to only have a desk review of its second and third quarter interim financials in light of the market pressures and commodity market volatility on revenues. Additionally the Company incurred legal fees in the comparative period in the drafting of certain standard agreements.
• Office expenses decreased by $22,039 to $747,004 as in a prior period the Company consolidated
office spaces. Additionally the Company has focused on increasing operating efficiencies. • Decreases in wage and employee benefits of $20,427 to $1,108,437. The decreases related to overall
staff reductions and Company-wide staff wage roll backs.
General and Administrative Expenses
Management’s Discussion and Analysis of Financial Condition and Results of Operations
- 10 -
ii) Amortization and depreciation expense decreased by $490,891 to $778,372 from the comparative period. The amortization and depreciation expense decreased as result of prior period impairments to property, plant and equipment and intangible assets, and the transferring of certain IOR/EOR Powerwave tools to inventory which were sold to a Canadian E&P client.
iii) Selling and marketing expense decreased by $144,020 to $990,043. The decrease is a result of sales and marketing efforts to support the strategic focus on Powerwave workover and stimulations, in particular in the United States and the reduction of international Powerwave IOR/EOR sales trips that were not linked to near term revenue generation. Additionally, in the current period the Company had reduced sales and sales management compliment and the restructurings in the sales team, which may result in annualized saving of approximate $357,800.
iv) Offsetting the above decreases was an increase of $3,684,891 in the recognition of a non-cash impairment expense that totalled $5,023,475 as noted above (page 5); of which, $2,968,885 related to the non-cash impairment charge related to the Powerwave CGU that was recorded in the quarter ended February 28, 2015, and $2,054,590 related to the non-cash impairment charge related to the Powerwave, Primawave and Performance Drilling CGUs that was recorded in the quarter ended November 30, 2014.
v) As well, research and development expense increased by $22,047 to $151,225 from the comparative quarter. The increase in research and development principally relates to additional material purchases, and the recognition of a Scientific Research and Experimental Development (“SR&ED”) refund of $61,740 granted by Canada Revenue Agency in the comparative quarter. The SR&ED refunds are treated as an expense reduction in the expense category where the expense originally occurred.
Net Finance Section of Income Interest income of $83,927 (2014 - $96,677) includes interest earned for the reporting period of $51,790 (2014 - $70,091), and foreign exchange gain of $32,137 (2014 – $26,586). The decrease of $18,301 of interest earned relates to lower principal balances as cash on hand. The lower interest earned was partially offset as during a prior reporting period the Company invested some its investments at the National Bank earning 1.45% interest versus the interest rates of interest of 0.07% to 0.45% at TD Canada trust. Financing cost of $3,991 (2014 - $1,601) only includes interest expenses for each period.

Management’s Discussion and Analysis of Financial Condition and Results of Operations
- 11 -
Operating Cash Flows The following table sets out the cash used in operations for the nine months ended May 31, 2015 and 2014:
As at As atMay 31, 2015 May 31, 2014
Net loss (7,571,225)$ (4,205,298)$ Items not affecting cash Impairment 5,023,475 1,338,584 Amortization and depreciation 778,372 1,269,263 Unrealized foreign exchange gain 123,952 16,045 Share-based payment 62,105 151,994 Interest expense 3,991 7,230 Gain on disposal of property, plant and equipment (6,308) (10,069) Funds used in operations (1,585,638) (1,432,251)
Interest paid (3,991) (7,230) Net change in non-cash working capital items 996,194 (508,835)
Cash used in operating activities (593,435)$ (1,948,316)$
Although cash used in operating activities decreased by $1,354,881 or 69.5%, Wavefront expects continued volatility as it works towards sustainability in the current low crude oil price environment. Net Loss and Comprehensive Loss, and Loss Per Share The basic and diluted net loss for the nine months ended May 31, 2015 increased by $3,365,927 to $7,571,225 ($0.09 per share), compared to $4,205,298 ($0.05 per share) for the comparative period ended May 31, 2014. The increase in net losses was principally impacted by the recording of the non-cash impairment expense of $5,023,475 that represents 66.3% of the recorded net losses. Prior to the non-cash impairment expense of $5,023,475 (2014 – $1,338,584), the basic and diluted net loss for the nine months ended May 31, 2015 decreased by $318,964 to $2,547,750 ($0.031 per share) compared to $2,866,714 ($0.035 per share).

Management’s Discussion and Analysis of Financial Condition and Results of Operations
- 12 -
Earnings before interest tax, depreciation and amortization (“EBITDA”) The following table sets out the Company’s EBITDA loss and EBITDA loss per share:
As at As atMay 31, 2015 May 31, 2014
Net loss (7,571,225)$ (4,205,298)$ Items not affecting EBITDA Amortization and depreciation 778,372 1,269,263 Interest and tax expense 6,539 13,465
EBITDA (6,786,314)$ (2,922,570)$
EBITDA loss per share (0.082)$ (0.035)$
note 1: EBITDA is calculated by adding back all interest, tax, depreciation and amortization to net loss, and is further discussed in Non-IFRS Measures The Company’s EBITDA loss and EBITDA loss per share, prior to the non-cash impairment expenses (May 31, 2015 - $5,023,475; May 31, 2014 - $1,338,584), for the nine months ended May 31, 2015 was $1,762,839 ($0.021 per share) compared to $1,583,986 ($0.019 per share) in the comparative quarter. Consolidated Results – three months ended May 31, 2015 Revenues Revenues for the three months ended May 31, 2015 were $1,213,218, a decrease of $285,838 over the comparative quarter ended May 31, 2014 that recognized revenues of $1,499,056. The changes in product line mix can be characterized as follows:
Revenue attributed to the Powerwave product lines were $977,728, a decrease of $313,409 over revenues in the comparative quarter of $1,291,137. The Powerwave product line revenues can then be broken into short-term projects
Powerwave: well
stimulations and workovers
$360,843
Powerwave: enhance
secondary oil recovery$616,885
Other technologies
$28,300
Tubing pump and bailers$207,190
May 31, 2015
Powerwave: well
stimulations and workovers,
$882,008
Other technologies,
$32,817
Powerwave: enhance
secondary oil recovery, $409,128
Tubing pump and bailers, $160,137
May 31, 2014

Management’s Discussion and Analysis of Financial Condition and Results of Operations
- 13 -
involving well workover and stimulations and long-term projects related to using Wavefront’s technology in IOR/EOR projects. For the third quarter 2015, revenue related to Powerwave IOR/EOR projects increased by $207,757 to $616,885 compared to $409,128 in the comparative quarter. Of the $616,885 of revenue related to Powerwave IOR/EOR projects $499,094 related to international projects and $113,425 related to Canadian projects. For the third quarter 2015, Powerwave revenues related to well workover and stimulations totalled $360,843 compared to $882,008 in the comparative quarter. Of the $360,843 of revenue recognized related to Powerwave well workover and stimulation activities $264,139 related to work in the United States. For the third quarter 2015, revenues from the tubing pumps and bailer product revenues increased by $47,053 to $207,190 compared to $160,137 in the comparative quarter. For the third quarter 2015, Other Technology revenues totalled $28,300 for the reporting period compared to $32,817 from the comparative quarter. The Company also recognized $14,965 in oil and gas revenues in the comparative quarter. Geographically, $416,072 (2014 – $673,470) in revenue was generated in Canada, $296,806 (2014 - $714,000) from the United States, and $500,341 (2014 - $111,586) internationally. The Company’s focus in Canada and the United States is on Powerwave well workovers and stimulations. Internationally the Company focus is on Powerwave well workovers and stimulation and IOR/EOR projects. Working with our marketing partners and internal sales personnel our Company’s goal is to broadly expand the client base for well workovers and stimulations and IOR/EOR. The geographic revenues are more specifically described as follows:
Canada. Gross revenues in our Canadian operation decreased by $257,399 to $416,072 compared to $673,470 in comparative quarter. Powerwave IOR/EOR project revenues totalled $113,425 (2014 - $260,984); Powerwave well workover and stimulation revenues in Canada totalled $95,457 (2014 - $237,328); and tubing pump and bailer revenues totalled $207,190 (2014 - $160,137). The Company also recognized Other Technologies revenues of $57 and $14,965 in oil and gas revenues in the comparative period. United States. Gross revenues in our United States operation decreased by $417,194 to $296,806 (2014 - $714,00). Powerwave IOR/EOR project revenues totalled $4,366 (2014 - $102,012); Powerwave well workover and stimulation revenues totalled $264,139 (2014 - $581,726); and Other Technology revenues totalled $28,300 (2014 - $30,261).
International: Gross revenues outside our Canadian and United States operation increased by $388,755 to $500,341 (2014 - $111,586). Powerwave IOR/EOR project applications revenues totalled $499,094 (2014 - $46,132), and Powerwave well workover and stimulation revenues internationally totalled $1,246 (2014 - $62,954). The Company also recognized Other Technology revenues of $2,500 in the comparative period.
Direct Expenses Costs of sales for the three month period ended May 31, 2015 were $631,020 or 52.0% of revenues (2014 - $460,074 or 30.7% of revenues). The increase in costs of sales principally relates to international Powerwave IOR/EOR project costs that amounted to $334,087 or 66.9% of those product line geographic revenues. Additionally, the sale of downhole Powerwave IOR/EOR tools and surface electronic controllers to one Canadian client that had costs of sale that amounted to $113,425 or 100%

Management’s Discussion and Analysis of Financial Condition and Results of Operations
- 14 -
of those revenues also negatively impacted gross profit margins. The selling of Powerwave IOR/EOR tools and surface electronic controllers approximated the net book value of those assets. These particular costs and their relative proportion within the product mix in Powerwave EOR impacted the overall costs of sales. Gross Profit The following table sets out the gross profit margins by product line for the three months ended May 31, 2015:
Powerwave EOR
Powerwave Stimulation
Tubing pumps & bailers
Other Technologies Total
Revenues 616,885$ 360,843$ 207,190$ 28,300$ 1,213,218$ Costs of sales 452,513 120,884 52,210 5,413 631,020
164,372$ 239,959$ 154,980$ 22,887$ 582,198$
Gross profit margin (note 1) 26.6% 66.5% 74.8% 80.9% 48.0%
The following table sets out the gross profit margins by product line for the three months ended May 31, 2014:
Powerwave EOR
Powerwave Stimulations
Tubing pumps & bailers
Other Technologies Total
Revenues 409,128$ 882,008$ 160,137$ 32,817$ 1,484,090$ Costs of sales 111,149 241,455 88,177 19,293 460,074
297,979$ 640,553$ 71,960$ 13,524$ 1,024,016$
Gross profit margin (note 1) 72.8% 72.6% 44.9% 41.2% 69.0%
note 1: Gross profit margin is calculated by subtracting direct costs from revenue and dividing the result by revenue, and is further discussed in Non-IFRS Measures In addition to the above noted revenues for the comparative three months ended May 31, 2014, the Company had oil and gas production revenues of $14,966 with no costs of sales. In the previous fiscal year the Company experienced an average gross profit margin of approximately 68.3%. The trend of gross profit has declined in the past two quarters as a result of international Powerwave IOR/EOR project costs and the sale of certain Powerwave IOR/EOR tools and surface electronic controllers to a Canadian client. Management anticipates that as activity in the energy sector returns and sales increase, and these projects come to a conclusion that gross profit margins may move back toward previous levels. Other Expenses Other expenses for the third quarter ended May 31, 2015, amounted to $1,360,769, compared to $3,328,137 in 2014. Excluding the non-cash impairment charge in the comparative period and costs of sales, other expenses for the third quarter ended May 31, 2014 amounted to $1,989,553. Even by excluding the comparative non-cash impairment charge, the Company was still able to decrease all other expenses categories by $628,784. The change in expenses was principally a result of the following changes:
i) Amortization and depreciation expense decreased by $268,865 to $164,374 from the comparative quarter. The
amortization and depreciation expense decreased as result of impairments to property, plant and equipment and intangible assets, and the transferring of certain EOR Powerwave tools to other asset, a portion of which is recorded as cost of sales.

Management’s Discussion and Analysis of Financial Condition and Results of Operations
- 15 -
ii) Selling and marketing expenses decreased by $242,263 to $236,666. The decrease is a result of an ongoing effort to focus on near term Powerwave revenues in specific targeted markets and customer base. Additionally, in the a prior reporting period the Company had reduced its sales and sales management compliment and restructured its sales team to be more cost efficient.
iii) General and administrative expenses decreased by $110,689 (May 31, 2015 - $902,893; May 31, 2014 - $1,013,582) with the changes illustrated by the following table:
397,179 446,493
244,151 240,741
51,996 128,170 39,063 105,592
59,082 56,875 78,929
$-
$200,000
$400,000
$600,000
$800,000
$1,000,000
May 31, 2015 May 31, 2014Wages, benefits, & contract employ OfficeConsultants Professional feesRepairs and maintenance VehiclePublic company & listing fees Share based paymentsBad Debts Miscellaneous
General and administrative expenses decreased by $110,689 and principally relate to the following: • Decreases in consulting fees of $76,174 to $51,996 related principally to the use of external consultants
in the comparative quarter for strategic planning and the reduction of management and agent consultants.
• Decreases in professional fees of $66,529 to $39,063 related principally to the use of external consultants in the comparative quarter for strategic planning and the reduction of management and agent consultants. Additionally, the Company was able to reduce certain consultant monthly billables given the decrease in volume of work.
• Decreases in share based payments of $29,783 to $21,927 related principally to the comparative period
expensing a greater quantity of options and at a higher weighted average fair value per option granted. • Decrease in bad debts of $29,404 to $4,890 related principally to the successful collection of older
receivables and previously written off accounts in the current reporting period, thus reducing the allowance for doubtful accounts.
• Decrease in vehicle expenses of $22,054 to $56,875 principally pertains to decreases in non-sales
ground transportation, vehicle maintenance and fuel, which pertains to few tubing pump and bailer and Powerwave workover and stimulation projects.
General and Administrative Expenses

Management’s Discussion and Analysis of Financial Condition and Results of Operations
- 16 -
• Offsetting the above noted decreases were increases in wage and employee benefits of $70,989 to
$390,994, which relates to reduced allocation of wage expense to other functional expense categories (i.e., costs of goods sold, manufacturing of tools that are project volume related). Wage and employee benefits however, decreased slightly from the prior quarter (i.e., the three months ended February 28, 2015) which was $397,179.
Net Finance Section of Income Interest income of $17,106 (2014 - $21,511) only includes interest earned for the reporting periods. The decrease of $4,405 of interest earned relates to lower principal balances as cash on hand. Financing cost of $3,551 (2014 - $8,598) includes interest expenses of $500 (2014 - $647) and foreign exchange losses of $3,051 (2014 – $7,951). Operating Cash Flows The following table sets out the cash used in operations for the third quarter ended May 31, 2015 and 2014:
As at As atMay 31, 2015 May 31, 2014
Net loss (765,016)$ (2,276,240)$ Items not affecting cash Amortization and depreciation 164,376 433,239 Share-based payment 24,770 60,325 Interest expense 500 6,277 Impairment - 1,338,584 Gain on disposal of property, plant and equipment (390) - Unrealized foreign exchange gain (18,676) (43,528) Funds used in operations (594,436) (481,343)
Interest paid (500) (6,277) Net change in non-cash working capital items 500,270 (121,610)
Cash used in operating activities (94,666)$ (609,230)$
Although cash used in operating activities decreased by $514,564 or 84.5%, Wavefront expects continued volatility as it works towards sustainability in the low crude oil markets. Net Loss and Comprehensive Loss, and Loss Per Share The basic and diluted net loss for the third quarter ended May 31, 2015 decreased by $1,511,226 to $765,016 ($0.009 per share), compared to $2,276,240 ($0.027 per share) for the comparative quarter ended May 31, 2014. Prior to the comparative period (i.e., May 31, 2014) non-cash impairment expense of $1,338,584, the basic and diluted net loss for the third quarter ended May 31, 2014 was $937,658 ($0.011 per share). Excluding the prior to

Management’s Discussion and Analysis of Financial Condition and Results of Operations
- 17 -
the comparative period non-cash impairment charge, the Company was still able to decrease the net loss by $172,642. Earnings before interest tax, depreciation and amortization (“EBITDA”) The following table sets out the Company’s EBITDA loss and EBITDA loss per share:
As at As atMay 31, 2015 May 31, 2014
Net loss (765,016)$ (2,276,240)$ Items not affecting EBITDA Amortization and depreciation 164,376 433,239 Interest and tax expense 848 6,277
EBITDA (599,792)$ (1,836,724)$
EBITDA loss per share (0.007)$ (0.022)$
note 1: EBITDA is calculated by adding back all interest, tax, depreciation and amortization to net loss, and is further discussed in Non-IFRS Measures The Company’s EBITDA loss and EBITDA loss per share prior to the comparative period (i.e., May 31, 2014) non-cash impairment expense of $1,338,584, for the third quarter ended May 31, 2014 was $498,140 ($0.006 per share). LIQUIDITY AND CAPITAL RESOURCES Assets and Liabilities Total current assets decreased by $1,504,944 to $9,482,558 from the prior year ended August 31, 2014. Of the net decrease, $748,009 relates to a reduction of cash resources, of which $320,689 was used for the acquisition of leasehold improvements in the Lloydminster office and additional Powerwave tools and equipment, $593,435 was used to fund operations, and $251,038 was used to reduce current liabilities. The decreases were offset by the reduction in trade and other receivables by $1,075,487, and increase in prepaid and other current assets by $289,494, of which $296,300 of the prepaid and other current assets relates to the sale and license of Powerwave IOR/EOR tools. The changes in accounts receivable reflect timing differences in incurring installation expenses and collecting receivables and are directly related to increased Powerwave contracts and our financial accounting policy of recognizing Powerwave revenues and direct costs equally over the term of the contracts. Non-current assets also decreased by $5,961,050 from year ended August 31, 2014, of which $5,023,475 relates to non-cash impairments, $461,239 relates to transfer of property, plant and equipment to inventory, $320,689 of purchases of property, plant and equipment, $536,470 relates to amortization, and depreciation of property, plant and equipment, and $241,903 relates to the depreciation of intangible assets. Liabilities Total liabilities decreased by $251,037 from the prior year ended August 31, 2014 to $800,445. Of the liabilities, $243,013 relates to trade accounts payable, and $557,432 relates to accruals related to the Powerwave project costs,

Management’s Discussion and Analysis of Financial Condition and Results of Operations
- 18 -
design and manufacturing of Powerwave tool inventory, sales and marketing liabilities and other various corporate services. Liquidity The following table presents working capital information as at May 31, 2015 and August 31, 2014:
As at As atMay 31, 2015 August 31, 2014 Change
Current assets 9,482,558 10,987,502 (1,504,944) Current liabilities 800,445 1,051,482 (251,037) Working capital(note 1) 8,682,113 9,936,020 (1,253,907)
note 1: Working capital is calculated by subtracting current liabilities from current assets, and is further discussed in Non-IFRS Measures In a prior year, Wavefront issued a Letter of Credit for $325,000 as security for the Company’s new Edmonton office and warehouse lease. The value of the Letter of Credit declines each year by $65,000 to year four (i.e., 2014) and then is terminated after the conclusion of year five (i.e., 2015). As security against the Letter of Credit, the Company pledged a Guaranteed Investment Certificate as security. As at May 31, 2015 the balance of the Letter of Credit was $130,000. The balance of the Company’s capital is not subject to any external restrictions. Wavefront believes that its working capital position will continue to fluctuate and that our Company’s cash flow break-even will also be affected by degree of commercialization of the Powerwave well workover and stimulation and IOR/EOR products lines, the nature of product mixes between Powerwave well workover and stimulation, Powerwave IOR/EOR applications, other technologies, and tubing pumps and bailers. It is believed that, as our clients experience positive Powerwave results, further uptake of the Company’s technologies will result in future cash inflows, but the Company will be required to invest in additional Powerwave tool inventories. The Company did not default nor was it in arrears on any operating lease payments. Financings There were no financings during the reporting or the comparative quarter. Capital Resources Currently, and in addition to the Contractual Commitments (noted below), and in accordance with Wavefront’s strategic plan, cash resources will be required for the following:
• To fund ongoing operations and working capital needs;
• To support the marketing efforts with, and to train all licensees on, the implementation of our Company’s core technologies; and

Management’s Discussion and Analysis of Financial Condition and Results of Operations
- 19 -
• To build new tool inventory systems when supported by immediate revenues with acceptable pay back periods.
There are no known trends or expected fluctuations or restrictions in Wavefront’s capital resources. As of July 27, 2015, Wavefront had $7,008,063 of cash on hand. Of the cash on hand, Wavefront has $350,201 in Term Deposits on deposit with TD Canada Trust, maturing on August 21, 2015, with a guaranteed interest rate of 0.45% and; and a Guaranteed Investment Certificates in the amount of $2,000,000 and $2,500,000 on deposit with National Bank Financial cashable anytime without penalty but maturing on November 21, 2015 and March 20, 2016, respectively. Both investments with National Bank Financial have a guaranteed interest rate of 1.45%. Credit risk on the Term Deposit and Guaranteed Investment Certificates investment is linked to the insurance coverage limits as prescribed by the Canadian Deposit Insurance Corporation, Credit Union Deposit Insurance Corporation insurance and that of TD Canada Trust and National Bank Financial. CONTRACTUAL COMMITMENTS The Company has entered into long-term contractual arrangements from time-to-time for facilities, lines of credit, and the provision of goods and services. The following table presents contractual obligations arising from these arrangements currently in force:
In a prior year, the Company entered into a new office and warehouse space for its Edmonton, Alberta facilities. The office and warehouse lease had a commencement date of February 1, 2011 and a ten year term expiring on January 31, 2021. The Company has the option for early termination of the office and warehouse lease after year five (5) for a one-time payment of $100,000. The future commitment in base rental payments is $1,208,803 over the balance of the term. In a prior year, the Company entered into a new sales office lease for Calgary, Alberta. The new facilities are to create a greater presence for our Company in Calgary. The office lease has a commencement date of June 15, 2011 and a five (5) year term expiring on June 14, 2016. The balance of the future commitment in base rental payments is $48,116. As well, in a prior year, the Company entered into a new office and warehouse lease in Lloydminster, Alberta. The new facilities were required as our other facilities lease expired and to support our growing Powerwave well workover and stimulation business. The original Lloydminster facilities lease had a commencement date of July 1, 2012 and a five (5) year term. Effective March 1, 2015, the Lloydminster facilities lease was amended to expire on June 30, 2020. The balance of the future commitment in base rental payments is $782,180. The Company is of the opinion that its working capital position of $8,682,113 as at May 31, 2015 is sufficient to cover its current commitments and operations for the forthcoming fiscal year. Management will continue to be prudent stewards of Wavefront’s cash resources in monitoring operating and capital expenditures. The funding of cash used in operating activities and investing activities will continue to draw on cash balances on hand. It is also anticipated that internally generated cash from operations may increase as our Company’s core Technologies
TotalLess than 1
Year 1 – 3 Years 3 – 5 YearsMore than 5
YearsOperating lease obligations $ 2,073,143 $ 438,058 $ 732,702 $ 745,212 $ 157,171
Payments Due by Period

Management’s Discussion and Analysis of Financial Condition and Results of Operations
- 20 -
continue to be commercialized and as the general markets recover, thus decreasing the need to use cash resources on hand. Although Wavefront does not, currently, foresee any need for equity or debt financing, it may consider future financings based on expected need to finance Powerwave tools, working capital, or acquisitions. As our Company moves forward it will also consider debt financing of its Powerwave tools to better match the assets’ life and revenue stream with the financing sources. Any such financing will be dependent on Wavefront’s credit rating, quality of licensing contracts, etc. All future expenditures and investments in capital assets and projects will be governed by the Company’s working capital position throughout the year. OFF-BALANCE SHEET ARRANGEMENTS The Company has no off-balance sheet arrangements. TRANSACTIONS WITH RELATED PARTIES Expense transaction In a prior reporting period the Company entered into a Consulting Agreement with a director of the Company to provide certain services for a monthly fee of US $5,000 per month. During the three and nine month periods ended May 31, 2015, the Company recorded $17,853 (May 31, 2014 - $16,404) and $53,558 (May 31, 2014 - $49,212), respectively, in consulting expense, with $nil (August 31, 2013 - $nil) included in accounts payable and accrued liabilities. Subsequent to the reporting period the monthly fee for the services provided was reduced to US $3,000 per month. PROPOSED TRANSACTIONS At the time of this report the Company has no undisclosed proposed transactions. RISK AND UNCERTAINTIES
The Company’s business risks are the same as disclosed in its annual MD&A issued for the year ended August 31, 2014 and incorporated herein by reference. ENVIRONMENTAL RISK
The Company’s environmental risks are the same as disclosed in its annual MD&A issued for the year ended August 31, 2014 and incorporated herein by reference. CRITICAL ACCOUNTING POLICIES AND ESTIMATES The Company’s critical accounting policies and estimates are the same as disclosed in its annual MD&A issued for the year ended August 31, 2014 and incorporated herein by reference.

Management’s Discussion and Analysis of Financial Condition and Results of Operations
- 21 -
CHANGES IN ACCOUNTING POLICIES The changes in accounting policies are disclosed in Note 2, “Statement of Compliance”, of the Unaudited Interim Condensed Consolidated Financial Statements for the period ended November 30, 2014 and incorporated herein by reference. FINANCIAL AND OTHER INSTRUMENTS
Wavefront’s significant financial and other instruments consist of accounts receivable, accounts payable and accrued liabilities and interest bearing obligations such as its operating line, amounts due to shareholders, and other amounts that will result in future cash outlays. Credit Risk Credit risk arises from the potential that a counterparty will fail to perform its obligations. Wavefront’s financial instruments that are exposed to concentrations of credit risk consist primarily of accounts receivable and non-participation amounts due. Concentrations of credit risk with respect to accounts receivable are limited as the majority of transactions are with large publicly traded corporations or government organizations dispersed across geographic areas. Credit risk, with respect to accounts receivables in Canada and the United States, is also limited due to Wavefront’s credit evaluation and cash management processes. Foreign currency risk Wavefront is exposed to currency risks as a result of its export to foreign jurisdictions of goods produced in Canada or services provided from Canada, and the operational expenses and revenue of foreign operations. These risks are partially covered by purchases of goods and services in the foreign currency. Wavefront does not use derivative instruments to reduce its exposure to foreign currency risk. Fair value of financial instruments The carrying value of Wavefront’s financial instruments approximates their fair value. The estimated fair value approximates the amount for which the financial instruments could currently be exchanged in an arm’s length transaction between willing parties who are under no compulsion to act. Certain financial instruments lack an available trading market; therefore, fair value amounts should not be interpreted as being necessarily realizable in an immediate settlement of the instrument. SUPPLEMENTARY INFORMATION SUMMARY OF QUARTERLY RESULTS AND LOSS PER SHARE The following tables sets forth selected data derived from our unaudited condensed consolidated interim financial statements for each of the eight most recently completed quarters. This information should be read in conjunction with the applicable interim unaudited and annual audited financial statements and related notes thereto.

Management’s Discussion and Analysis of Financial Condition and Results of Operations
- 22 -
3rd Qtr 2nd Qtr 1st Qtr 4th QtrMay 31 '15 Feb 28 '15 Nov 30'14 Aug 31 '14
Revenue 1,213,218$ 1,059,555$ 1,493,590$ 1,486,805$
Net Loss (765,016)$ (4,089,528)$ (2,716,682)$ (1,005,009)$ Basic and diluted loss per share (0.009)$ (0.049)$ (0.033)$ (0.012)$
Common shares outstandingWeighted average shares outstanding 82,956,240 82,956,240 82,956,240 82,956,240
Notes:
was $1,120,643 or $0.014 per share.
was $678,672 or $0.008 per share. 2) The first quarter ended November 30, 2014 included a non-cash impairment expense of $2,054,590. Net loss prior to impairment
1) The second quarter ended February 28, 2015 included a non-cash impairment expense of $2,968,885. Net loss prior to impairment
3rd Qtr 2nd Qtr 1st Qtr 4th Qtr
May 31 '14 Feb 28 '14 Nov 30'13 Aug 31 '13
Revenue 1,499,056$ 1,247,048$ 1,646,640$ 1,693,856$
Net Loss (2,276,241)$ (1,136,653)$ (792,404)$ (1,409,644)$ Basic and diluted loss per share (0.027)$ (0.014)$ (0.009)$ (0.017)$
Common shares outstandingWeighted average shares outstanding 82,956,240 82,956,240 82,956,240 82,956,240
Notes continued:
or $0.011 per share.4) The financial data has been prepared in accordance with IFRS.5) All amounts in Canadian dollars except share data.
3) The third quarter ended May 31, 2014 included a non-cash impairment expense of $1,338,584. Net loss prior to impairment was $937,657
DESCRIPTION OF SHARE CAPITAL As at May 31, 2015, Wavefront’s share capital consisted of the following: Common sharesAuthorized: unlimited
Issued and outstanding:Free trading 82,956,240
Convertible into common sharesIncentive stock options 2,895,000
2,895,000
Fully diluted share capital: 85,851,240
As at July 27, 2015, Wavefront’s number of issued and outstanding shares is 82,956,240.
Management’s Discussion and Analysis of Financial Condition and Results of Operations
- 23 -
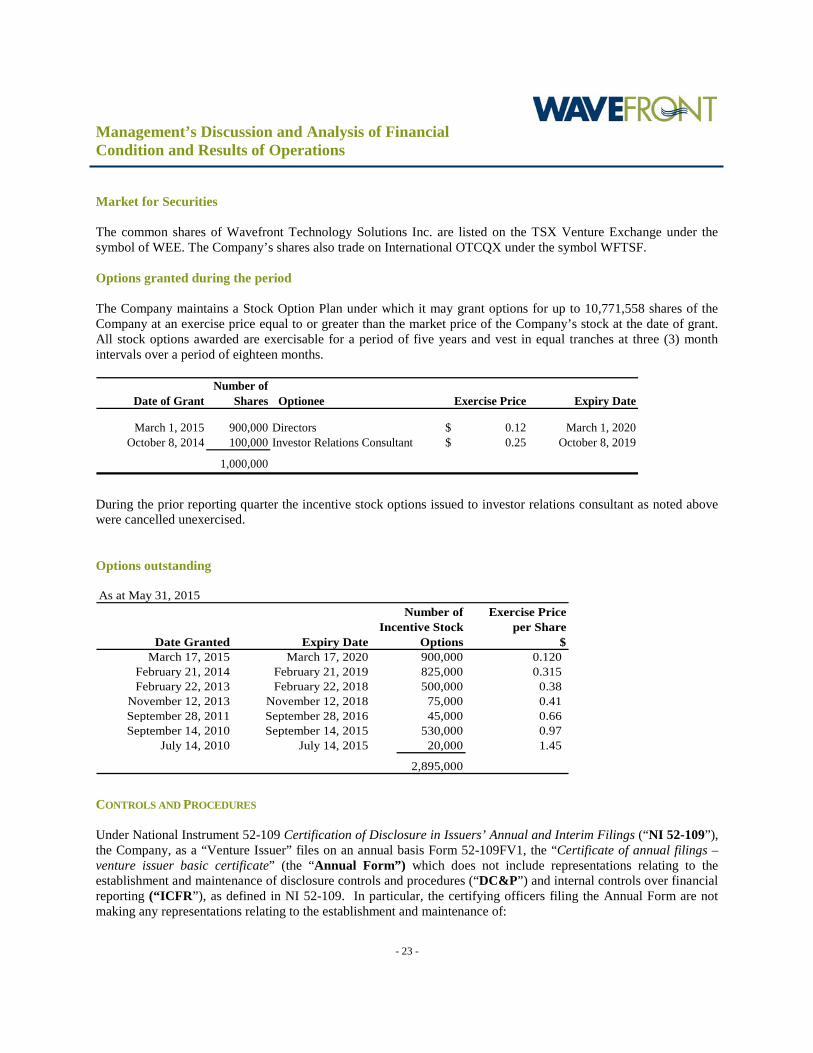
Market for Securities The common shares of Wavefront Technology Solutions Inc. are listed on the TSX Venture Exchange under the symbol of WEE. The Company’s shares also trade on International OTCQX under the symbol WFTSF. Options granted during the period The Company maintains a Stock Option Plan under which it may grant options for up to 10,771,558 shares of the Company at an exercise price equal to or greater than the market price of the Company’s stock at the date of grant. All stock options awarded are exercisable for a period of five years and vest in equal tranches at three (3) month intervals over a period of eighteen months.
March 1, 2015 900,000 Directors $ 0.12 March 1, 2020October 8, 2014 100,000 Investor Relations Consultant $ 0.25 October 8, 2019
1,000,000
Date of GrantNumber of
Shares Optionee Exercise Price Expiry Date
During the prior reporting quarter the incentive stock options issued to investor relations consultant as noted above were cancelled unexercised. Options outstanding As at May 31, 2015
Exercise Price per Share $
March 17, 2015 March 17, 2020 900,000 0.120 February 21, 2014 February 21, 2019 825,000 0.315 February 22, 2013 February 22, 2018 500,000 0.38
November 12, 2013 November 12, 2018 75,000 0.41 September 28, 2011 September 28, 2016 45,000 0.66 September 14, 2010 September 14, 2015 530,000 0.97
July 14, 2010 July 14, 2015 20,000 1.45
2,895,000
Expiry DateDate Granted
Number of Incentive Stock
Options
CONTROLS AND PROCEDURES Under National Instrument 52-109 Certification of Disclosure in Issuers’ Annual and Interim Filings (“NI 52-109”), the Company, as a “Venture Issuer” files on an annual basis Form 52-109FV1, the “Certificate of annual filings – venture issuer basic certificate” (the “Annual Form”) which does not include representations relating to the establishment and maintenance of disclosure controls and procedures (“DC&P”) and internal controls over financial reporting (“ICFR”), as defined in NI 52-109. In particular, the certifying officers filing the Annual Form are not making any representations relating to the establishment and maintenance of:
Management’s Discussion and Analysis of Financial Condition and Results of Operations
- 24 -
i) controls and other procedures designed to provide reasonable assurance that information required to be
disclosed by the issuer in its annual filings, interim filings or other reports filed or submitted under securities legislation is recorded, processed, summarized and reported within the time periods specified in securities legislation; and,
ii) a process to provide reasonable assurance regarding the reliability of financial reporting and the preparation
of financial statements for external purposes in accordance with the issuer’s GAAP. However, the Company’s Management, and its certifying officers on the Annual Form are responsible for ensuring that processes are in place to provide them with sufficient knowledge to support the representations they are making in that Annual Form. The Annual Form does contain representations which confirms that management has established processes, which are in place to provide the certifying officers with sufficient knowledge to support their written representations that they have exercised reasonable diligence that (i) the audited annual financial statements do not contain any untrue statement of material fact or omit to state a material fact required to be stated or that is necessary to make a statement not misleading in light of the circumstances under which it is made, as of the date of and for the periods presented by the unaudited interim financial statements and that (ii) the audited annual financial statements fairly present in all material respects the financial condition, results of operations and cash flows of the Company, as of the date of and for the periods presented by the audited financial statements. The Company’s certifying officers of the Annual Form are responsible for ensuring that processes are in place to provide them with sufficient knowledge to support the representations they are making in that certificate. However, the reader should be aware that inherent limitations on the ability of the certifying officers to design and implement, on a cost effective basis, DC&P and ICFR for the Company as defined in NI 52-109, may result in additional risks to the quality, reliability, transparency and timeliness of interim and annual filings and other reports provided under securities legislation, including this MD&A.
FORWARD-LOOKING INFORMATION Certain statements contained herein regarding Wavefront and its operations constitute “forward-looking statements” within the meaning of Canadian securities laws and the United States Private Securities Litigation Reform Act of 1995. All statements that are not historical or current facts, including without limitation statements regarding future estimates, plans, objectives, assumptions or expectations or future performance of Wavefront and or any of its subsidiaries, as described in this MD&A, are “forward-looking statements”. Forward-looking information can be identified by the use of the future tense or other forward-looking words such as “believe”, “expect”, “anticipate”, “intend”, “should”, “may”, “could”, “would”, objective” “forecast”, “position”, “intend” or the negative of those terms or other variations of them or comparable terminology. Examples of such forward-looking information in this document include, but are not limited to statements with respect to the following, each of which is subject to significant risks and uncertainties and is based on a number of assumptions that may prove to be incorrect:
• under the heading “Outlook” the outlook for Wavefront’s business and for the industry in which Wavefront
operates, its plans to capitalize on new business, expectations regarding the new business model and discussions of how goals will be achieved;
• under the heading “Overall Results from Operations”, Wavefront’s expectations for reduction of annualized wage expense, further impairment charges in the short term, continued variation in bailer

Management’s Discussion and Analysis of Financial Condition and Results of Operations
- 25 -
revenues and stable tubing pump revenues, Other Technology revenues, production revenue increases among state owned E&Ps and associated increases in demand, continued volatility in operating cash flows, future international revenues, expectations once Powerwave is fully commercialized, the belief that international Powerwave well workover and stimulation revenues will grow in 2015, the near future plans of clients, expectations for revenue patterns and discussions of goals relating to expansion of client base;
• under the heading “Liquidity and Capital Resources”, Wavefront’s beliefs about its working capital position and cash flow break even, its expectations about cash inflows and investment and its use of cash; and
• under the heading “Contractual Commitments”, Wavefront’s beliefs about working capital sufficiency and potential sources of financing.
We provide this forward-looking information for Wavefront’s business in order to describe the management expectations and targets by which Wavefront measures its success and to assist Wavefront shareholders in understanding Wavefront’s financial position as at and for the periods ended on the dates presented in this report. Readers are cautioned that this information may not be appropriate for other purposes. We caution that such “forward-looking statements” involve known and unknown risks and uncertainties that could cause actual results and future events to differ materially from those anticipated in such statements. Accordingly, readers should not place undue reliance on forward-looking information. Such material factors include fluctuations in the acceptance rates of Wavefront’s Powerwave and Primawave Processes, demand for products and services, fluctuations in the market for oil and gas related products and services, the ability of Wavefront to attract and maintain key personnel, technology changes, volatility in commodity pricing, client operational and scheduling difficulties, client infrastructure limitations and budgetary priorities, direct and indirect compensation and pricing pressure from customers, global political and economic conditions. For a more detailed description of these risks, and of other risks to which Wavefront is subject, please see the "Risks and Uncertainties" section in this MD&A. In determining Wavefront's forward-looking statements, Wavefront considers material factors including assumptions and expectations contained in: the “Technology Adoption” section in the annual MD&A for the year ended August 31, 2014, incorporated herein by reference, as well as expectations regarding customer demand and adoption rates for Wavefront's products; commodity prices, interest and foreign exchange rates; accounting and impairment estimates; and the availability and cost of inputs, labour and services, patent, technology and competitive risk. These material risk factors and material assumptions are not intended to represent a complete list of the factors that could affect Wavefront; please see other factors that are described in further detail in Wavefront’s continuous disclosure filings, from time to time, and available on SEDAR at www.sedar.com. The forward-looking statements contained herein represent Wavefront's expectations at July 27, 2015, and, accordingly are subject to change after such date. Except as may be required by law, Wavefront does not undertake to update any forward-looking statement, whether written or verbal, that may be made from time to time.
ADDITIONAL INFORMATION Additional information regarding Wavefront Technology Solutions Inc. can be found on System for the Electronic Document Analysis and Retrieval (“SEDAR” at www.sedar.com).
Related Documents