Waveforms Waveforms RC 270

Waveforms RC 270 Pressure Volume Curves Graphic display of changes in compliance and resistance Used for TREND analysis! – One set of waveforms must.
Dec 17, 2015
Welcome message from author
This document is posted to help you gain knowledge. Please leave a comment to let me know what you think about it! Share it to your friends and learn new things together.
Transcript

WaveformsWaveforms
RC 270

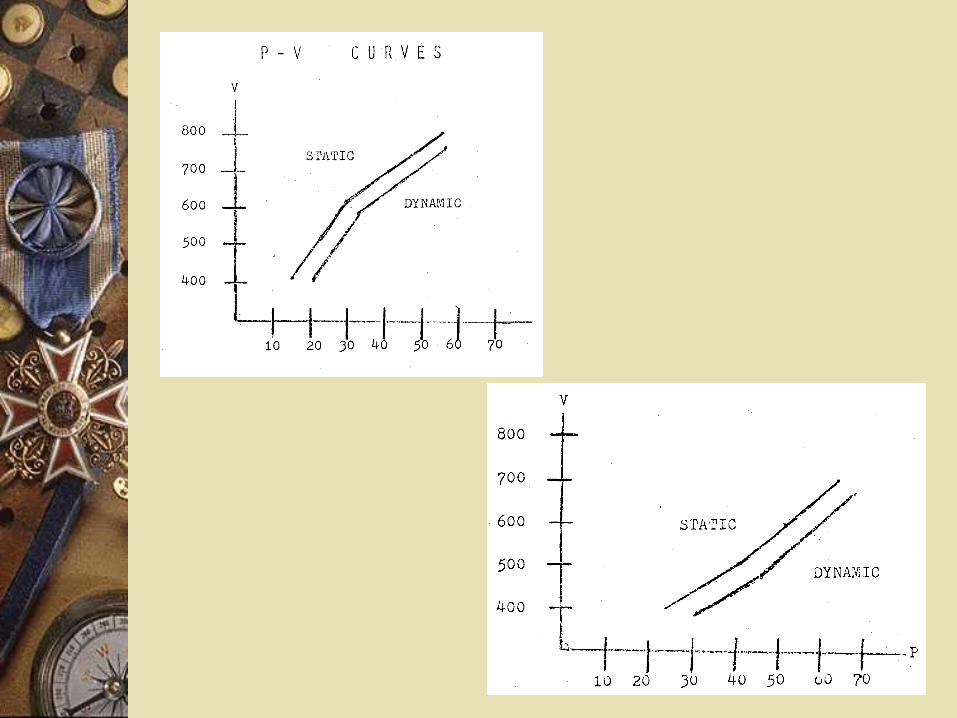
Pressure Volume Curves
Graphic display of changes in compliance and resistance
Used for TREND analysis!– One set of waveforms must be compared to
another set Pressure is on the x-axis; volume on the y-
axis Separate curves for static and dynamic

Static Curve
If static curve shifts, than static compliance and elastic resistance have changed– Plateau pressure also will change
A change in the static curve causes the dynamic curve to shift also– Just as a plateau pressure change also affects peak pressure
Rightward shift: decreased static compliance and increased elastic resistance
Leftward shift: increased static compliance and decreased elastic resistance


Dynamic Curve
Is affected by both elastic and airway resistance
If the dynamic curve shifts, but the static curve doesn’t, than only airway resistance has changed– Rightward means increased airway resistance– Leftward means decreased airway resistance

When to plot P-V Curves
Initiation of CMV Q 8-12 PRN
– Change in patient status– After any therapeutic intervention

P-V Loop: Overdistension(Hyperinflation)

Flow-Time Curve: Air Trapping(AutoPeep)
Continuous Positive Continuous Positive Pressure BreathingPressure Breathing
Breathing at a baseline airway pressure that is greater than ambient

Types of CPPB
Positive End Expiratory Pressure (PEEP)– When patient is on
CMV
Continuous Positive Airway Pressure– When patient is
breathing without CMV


Indication for Indication for PEEP/CPAP: PEEP/CPAP:
Refractory HypoxemiaRefractory Hypoxemia
PaO2 < 60mmhg on an FIO2 of 60% or >

Refractory Hypoxemia Usually Indicates Alveolar Instability
Decreased surfactant Increased interstitial pressure Nitrogen washout Oxygen toxicity

Alveolar Instability
Atelectasis Decreased FRC Increased shunting Decreased static compliance (increased
elastic resistance) Increased W.O.B.

PEEP/CPAP
Airway pressure does not drop to ambient Helps stabilize alveoli and small airways

Without PEEP/CPAP
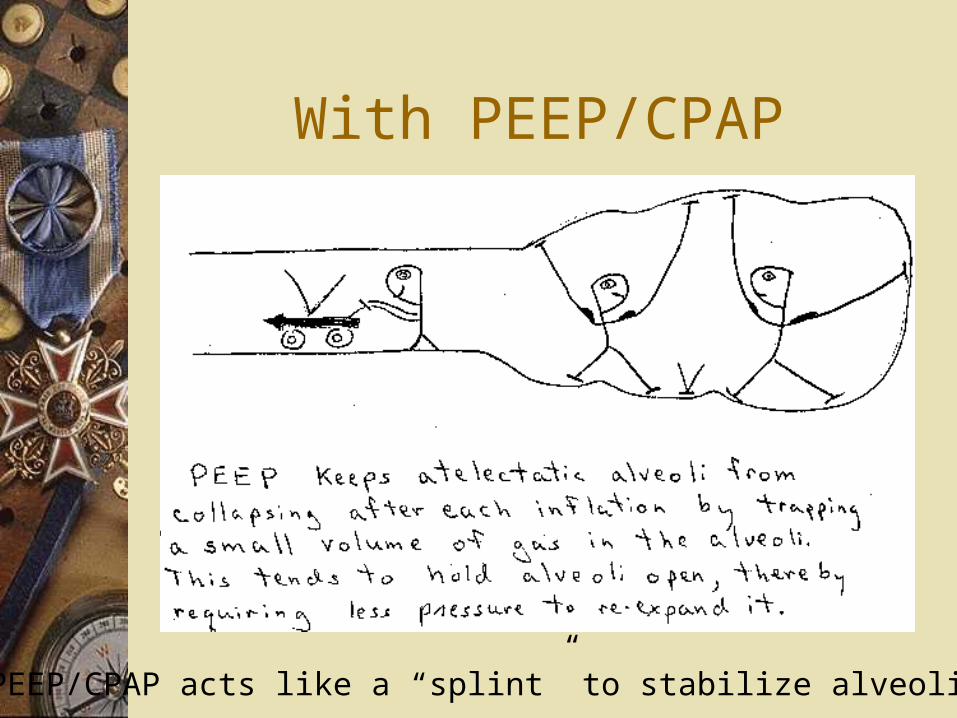
With PEEP/CPAP
PEEP/CPAP acts like a “splint” to stabilize alveoli/airways

PEEP/CPAP EFFECTS
Increases FRC back towards normal Decreases shunt Increases static compliance (decreases
elastic resistance) Decreases W.O.B. Acceptable PaO2 at lowest possible FIO2

PEEP/CPAP Precautions

Potential Side Effects
Increased mean intrathoracic pressure (ITP)– Hemodynamic compromise
• Decreased venous return• Decreased cardiac output• Decreased blood pressure• Increased intracranial pressure (ICP)
– Pulmonary baro/volutrauma– Fluid retention
If PEEP/CPAP is indicated and applied appropriately, these effects should be minimized

PEEP/CPAP Precautions
Unilateral lung disease Neuro patients COPD

PEEP/CPAP Controversy
Classical indication: increased elastic resistance
Controversy: Increased airway resistance too?

Can we please take a break!

PEEP/CPAP Systems: Flow Resistor

PEEP/CPAP Systems: Threshold Resistor

Selecting a PEEP/CPAP Level
Random– Start at 5 cmH2O and watch PaO2
Optimal/Best -Set PEEP/CPAP 2 cmH2O greater than lower inflection point (LIP or Pflex) on P-V curve Best/Optimal PEEP alternative
– Peep only—use PEEP level that gives best static compliance

LIP or Pflex
LIP


Best PEEP Best PEEP always always occurs at the lowest /\ Poccurs at the lowest /\ P
Remember /\P is gauge plateau pressure
minus the peep

What if more than one PEEP level gives the same highest
Cstat?
Look at blood pressure Look at PvO2 Look at C.O. Look at %shunt Look at mixed venous saturation Look at P/F ratio
– PaO2 divided by FIO2 (expressed in decimal form)

Recruitment Maneuver
Also known as Open Lung Tool
A Sustained Maximal Inspiration (SMI) performed after optimal/best PEEP/CPAP has been determined and set
Example: 40 cmh2o of CPAP applied for 40 seconds (the 40/40 technique)

PEEP/CPAP works best PEEP/CPAP works best for diseases that cause for diseases that cause
increased elastic increased elastic resistanceresistance
May be of help in diseases with
increased airway resistance

Lets see what we can dig up
Related Documents