Waterbird response to practices aimed at reducing greenhouse gas emissions from rice fields in the Sacramento Valley Report to the Environmental Defense Fund August 29, 2014 Kristin A. Sesser, Matthew E. Reiter, Daniel A. Skalos, Khara M. Strum, and Catherine M. Hickey

Welcome message from author
This document is posted to help you gain knowledge. Please leave a comment to let me know what you think about it! Share it to your friends and learn new things together.
Transcript

Waterbird response to practices aimed at reducing
greenhouse gas emissions from rice fields in the
Sacramento Valley
Report to the Environmental Defense Fund
August 29, 2014
Kristin A. Sesser, Matthew E. Reiter, Daniel A. Skalos, Khara M.
Strum, and Catherine M. Hickey

Point Blue Conservation Science – Point Blue’s 140 staff and seasonal scientists
conserve birds, other wildlife and their ecosystems through scientific research and
outreach. At the core of our work is ecosystem science, studying birds and other
indicators of nature’s health. Visit Point Blue on the web www.pointblue.org.
Cover photo by D. Skalos

TABLE OF CONTENTS
EXECUTIVE SUMMARY ............................................................................................................ 1
INTRODUCTION .......................................................................................................................... 3
METHODS ..................................................................................................................................... 5
Study Area .................................................................................................................................. 5
I. Post-harvest Management Practices ................................................................................... 5
II. Seeding Practices .............................................................................................................. 12
RESULTS ..................................................................................................................................... 13
I. Post-harvest Management Practices ................................................................................. 13
II. Seeding Practices .............................................................................................................. 16
DISCUSSION ............................................................................................................................... 17
I. Post-harvest Management Practices ................................................................................. 17
II. Seeding Practices .............................................................................................................. 18
CONCLUSIONS........................................................................................................................... 19
ACKNOWLEDGMENTS ............................................................................................................ 20
LITERATURE CITED ................................................................................................................. 21
LIST OF TABLES ........................................................................................................................ 25
LIST OF FIGURES ...................................................................................................................... 26
LIST OF APPENDICES ............................................................................................................... 27

P a g e | 1
EXECUTIVE SUMMARY
The benefits of agricultural landscapes for wildlife, particularly birds, are many.
In California’s Sacramento Valley, management practices of rice fields can benefit both
farmers and wildlife. Flooding, in particular, increases the decomposition of rice stubble
post-harvest while providing habitat for over 50 species of waterbirds. Post-harvest
flooding of over 143,000 hectares of rice fields is estimated to provide 85% of flooded
habitat in the Sacramento Valley during winter. This flooding, however, contributes to
greenhouse gas (GHG) emissions, specifically methane. Greenhouse gas emissions
contribute significantly to global climate change and finding ways to reduce overall
GHG emissions is a goal for mitigating the effects of climate change in California.
Recent efforts to develop practices that reduce GHG emissions within the context of rice
production have identified several approaches that may be effective including reduced
winter flooding, removal of rice straw via baling, and drill seeding. The potential
impacts to waterbirds of these proposed alternative strategies, particularly baling and
drill seeding, were not well-understood prior to this study.
During December and January of 2011-2012 and 2012-2013, we examined the
effects of reduced winter flooding and baling on waterbird use and food availability by
comparing waterbird and food densities in four combinations of practices:
baled/flooded, baled/non-flooded, non-baled/flooded, and non-baled/non-flooded. We
also evaluated factors that may be causing the observed differences in waterbird
densities among practices.
We found significantly higher dabbling duck and shorebird densities in the non-
baled/flooded practice compared to the other three practices. Goose densities
were not significantly different among the four practices.
Dabbling duck and shorebird densities were strongly associated with presence
and depth of water which explained differences in use between flooded and non-
flooded practices.
Shorebird densities were positively associated with whether the leftover straw
and stubble was incorporated, or mixed into the soil (via stomping, chiseling, or
disking), and both ducks and shorebirds were negatively associated with the
amount of standing stubble. After accounting for the possible influence of
incorporation, shorebird densities were still significantly higher in non-baled
versus baled fields.

P a g e | 2
We found flooded fields had significantly higher densities of nematodes and
crustaceans than non-flooded fields with no significant difference between baled
and non-baled. We found similar densities of oligochaetes in all four practices
and no discernible patterns in densities of insects or moist soil seeds among
practices.
We found significantly lower mass-densities of waste rice in fields after they
were baled.
During April and May of 2012 and 2013, we examined the response of waterbirds to
drill seeding versus the traditional wet fly-on seeding.
We found no significant differences in mean density between the two seeding
practices for dabbling ducks or shorebirds. Geese were only observed twice, and
in low abundance, during these surveys.

P a g e | 3
INTRODUCTION
The mosaic of natural wetlands and agricultural fields in the Central Valley of
California make it an internationally important area for migratory waterbirds in the
Pacific Flyway (Gilmer et al. 1982, WHSRN 2003). Although the Central Valley has lost
90% of its original natural wetlands, largely to agriculture and urbanization (Frayer et
al. 1989), nearly three million ducks, one million geese, and 350,000 shorebirds continue
to overwinter in this region (Shuford et al. 1998, Collins et al. 2011). A large proportion
of these birds rely on flooded rice fields, which provide habitat for over 50 species of
waterbirds during the winter (Day and Colwell 1998, Elphick and Oring 1998). As a
result, the future of migratory waterbirds in the Central Valley depends upon how both
wetlands and agriculture are managed.
The post-harvest management of rice fields has changed over time and depends
on a number of environmental considerations. State regulations enacted in the 1990s
restricted the amount of allowable straw burning (Rice Straw Burning Reduction Act,
AB 1378 1991) resulting in an increase in the amount of rice that is winter-flooded post-
harvest for the purpose of stubble decomposition (Miller et al. 2010). This reduction in
burning for straw management post-harvest decreased air pollution but increased
annual greenhouse gas (GHG) emissions (Bossio et al. 1999, Fitzgerald et al. 2000,
Lindberg 2003). Greenhouse gas emissions increased because the by-product of straw
fermentation via flooding is methane (CH4), which is a more potent GHG than carbon
dioxide (CO2), the by-product of rice burning.
Recent work has identified several post-harvest management practices that may
reduce methane GHG emissions from rice fields (Lauren et al. 1994, Bossio et al. 1999,
Fitzgerald et al. 2000, EDF 2010, Suddick et al. 2010). These practices include reduced
winter flooding, removal of rice straw after harvest via baling, and drill seeding during
spring planting, an alternative to the traditional fly-on seeding method. Currently only
3% of rice fields are baled post-harvest while approximately 50% of all rice fields are
flooded (Garr 2014). Although waterbird use of winter-flooded rice has been studied
(Taft and Elphick 2007, Strum et al. 2013), little information is available regarding the
effect of straw removal via baling on waterbird use or on waterbird food resources (i.e.
invertebrates and seeds).

P a g e | 4
Greenhouse gas emissions contribute significantly to global climate change
(IPCC 2007) and finding ways to reduce overall GHG emissions is a goal for mitigating
the effects of climate change in California (AB-32). The potential impacts of climate
change on agriculture include decreased yields, increased variation in water
availability, an increase or change in pressures from pests and weeds, and changes in
abundance and diversity of pollinators (Hayhoe et al. 2004, Lee et al. 2011, Lobell and
Field 2011, Hatfield et al. 2014). When weighing the costs and benefits of implementing
GHG-reducing management practices in rice, it is important to understand the impacts
of these practices on wildlife, particularly waterbirds, some of which are reliant on rice
agriculture.
Our overall goal was to study the effects of GHG emissions-reducing rice
management practices on waterbirds and their food resources. Specifically, we (1)
compared waterbird density, food resources, and other indicators of habitat quality for
shorebirds and waterfowl across four combinations of post-harvest management
practices in rice fields including flooding and baling; and (2) compared waterbird
density between drill seeding and the traditional wet fly-on seeding.

P a g e | 5
METHODS
Study Area
The Sacramento Valley is located north of the Sacramento-San Joaquin River
Delta in the Central Valley of California (Fig. 1). Average annual rainfall is 51 cm and
most falls between the months of October and February. The region historically flooded
in late winter creating seasonal wetlands across the valley floor, probably on the order
of 1.5 million ha (CVJV 2006). Over the last century, the majority of these historical
wetlands have been converted to agricultural fields. Currently, there are approximately
199,000 ha of rice grown in the Sacramento Valley. On average, flooded habitat is
provided by over 143,000 ha of rice and 28,300 ha of managed wetlands irrigated by a
series of highly managed, interconnected canals and ditches (CVJV 2006).
I. Post-harvest Management Practices
Practice descriptions. We surveyed wintering waterbirds on four combinations of
baling and winter flooding practices: baled/flooded (BF), baled/non-flooded (BNF), non-
baled/flooded (NBF), and non-baled/non-flooded (NBNF).
After harvest, there is usually 0.3–1 meter (height) of standing stubble left in a
rice field. Baling removes most of this bulk as straw, but still leaves 7–15 cm of standing
stubble which is the base of the rice stalk. These baled fields are left either “as-is” until
spring, burned, or the remaining stubble is incorporated (mixed) into the soil. Since
most of the straw has been removed from baled fields, neither flooding nor
incorporation is required for straw decomposition. However, some rice farmers flood
baled fields to provide waterfowl habitat and hunting opportunities, and some growers
prefer to incorporate all the remaining standing stubble. Non-baled fields still have the
0.3–1 meter of standing stubble that is often chopped or mowed to break the standing
stubble into shorter pieces, creating loose straw that lies horizontally, often on top of the
standing stubble. Many growers then incorporate (or mix) that straw and the remaining
standing stubble into the soil through various methods such as disking, chiseling, or
stomping, the latter of which is performed after they flood using special equipment
which smashes the straw into the mud. Depending on the incorporation method and
the grower’s individual preference, there can be varying amounts of remaining
standing stubble left by the path of the tractor, sometimes even up to 30-40% cover of

P a g e | 6
the field. In addition to the incorporation methods, flooding also enhances straw
decomposition and can occur immediately after, to a month or more after, harvest.
Within the four practice combinations studied herein, the amount, timing, and
method of incorporation, if used, varied across fields. For example a BF field may be
baled then flooded without any incorporation, or baled, disked, then flooded. Similarly,
a NBF field may be chopped, disked, and then flooded, or flooded, then stomped, or
chopped and flooded with no incorporation. Given the complexity and constraints of
working with many different private landowners and their different preferences and
capabilities, it was not practical to design a study where all the practice combinations
were implemented with the exact same set of methods, timing, and equipment.
Study design. We used a study design that captured the variation in waterbird density
and habitat characteristics across existing post-harvest practices. In the first year, we
contacted rice growers and identified 11 farms where one or more of the four study
practice combinations, hereafter “practices”, were implemented. Across these farms, we
made an effort to achieve a spatially balanced distribution of practices and survey
locations. Within farms, rice fields are divided into subunits called paddies that are
separated by internal earthen levees. We considered the individual paddy to be the
sample unit. Thus, paddies were spatially nested within fields, and fields were further
nested within farms. We selected paddies from participating farms using Generalized
Random Tessellation Stratified (GRTS) sampling methodology, which enabled the
selection of spatially balanced random locations with respect to practice (Stevens and
Olsen 2004). The number of paddies in each practice varied among farms. In the second
year, we worked on five of the same farms as in the previous year and added nine more
farms. We used the same sampling methodology as the first year. Some of the same
paddies, fields, and farms were visited in both years of the study. Overall, we worked
on a total of 20 rice-growing farms spread across the Sacramento Valley (Fig. 1).
Because this study was conducted in coordination with private landowners,
relying on their cooperation, and occurred during standard operations on each farm we
were not able to select a completely random set of farms from across the Sacramento
Valley. However, our sample of farms and practices is spatially representative of the
rice growing region and thus we feel we can make reasonable inference to the broader
landscape with our findings.

P a g e | 7
Waterbird surveys. From 2 December 2011 – 27 January 2012 and 3 December 2012 – 25
January 2013, we surveyed waterbirds (ducks, geese, and shorebirds) approximately
every 10 days in the four post-harvest rice management practices defined above: BF,
BNF, NBF, and NBNF. We conducted 2,270 surveys across 479 paddies representing the
four post-harvest practices (Table 1). We conducted surveys from a randomly selected,
pre-determined point on the edge of an individual rice paddy and used a 200-m fixed-
radius and the paddy boundary (whichever was closer) to define the survey area.
Where possible, we varied the order in which we surveyed points to avoid bias in
counts due to the effects of time of day. We identified all waterbirds to species and
counted all individuals. All survey areas were scanned for at least two minutes. There
was no maximum time limit for completing a count, though they ranged from 2–15
minutes, with a median of 3 minutes. We only counted waterbirds using the survey
area, and did not count birds that flew over. Surveys were not conducted in inclement
weather, i.e. winds ≥ 40 kph, heavy fog, or rain.
For our analysis, we focused on three guilds – dabbling ducks, geese and swans,
and shorebirds. We selected these guilds because they represent the largest use of rice
by waterbirds in the Sacramento Valley (Sterling and Buttner 2011). Furthermore,
quantitative objectives are established for these guilds in conservation planning by the
Central Valley Joint Venture (CVJV 2006), thus understanding their response to
different rice agriculture practices is important for their conservation and management.
Sample sizes for individual species were often not large enough to analyze separately.
Paddy characteristics. During each survey, we collected data on water depth using two
wooden stakes placed at 50-m and 200-m in the center of the paddy marked with 5-cm
depth increments. We confirmed whether incorporation or mixing of the straw and/or
standing stubble into the soil had occurred within the survey area. We also recorded
several metrics to characterize cover and soil moisture in the survey area on each visit,
including the
proportion of the survey area with standing rice stubble,
proportion flooded (completely covered in water),
proportion saturated (no standing water but soil appearing with a sheen),
proportion moist (wet areas visible in soil but no sheen), and
proportion dry (no moisture content visible in soil).
P a g e | 8
Food resource availability. Rice seed remaining in both flooded and non-flooded rice
fields after harvest (waste rice) is a critical food resource for wintering waterfowl
including dabbling ducks, geese, and swans (Miller et al. 1989, CVJV 2006). We sampled
waste rice seed immediately after harvest using the line-intercept method
recommended by Halstead et al. (2011). We compared waste rice mass-density between
baled and non-baled fields. In 2011, we sampled from three randomly placed plots in
fields that were either baled or non-baled. We discovered a large amount of variation in
waste rice mass-density among fields, likely due to harvester speed, efficiency, and
model. Many growers have multiple harvesters and drivers, so while this variation
exists among farms and among fields, often only one harvester will work on any one
particular field. In order to account for some of this variation, in fall of 2012, we again
sampled from three randomly placed plots in each field being sampled, however we
used a paired design and sampled all fields, both before and after baling occurred. For
both years, each sample plot consisted of one line intercept sample. The line intercept
method involved placing a 6-m line with alternating red and white sections, each 10-cm
in length, along the ground, perpendicular to and spanning the width of the path of the
rice harvester. We recorded the number of seeds that intercepted the red sections (each
is 0.001175 m2) and calculated the waste rice seed mass density (kg/ha) using an
equation provided by Halstead et al. (2011). A non-negligible amount of rice seed is
contained within the straw itself (still attached to the stem, not loose on the ground) and
is available as forage for waterbirds (Miller et al. 1989). The practice of baling removes
this straw and its associated waste rice. Waste rice in the straw, although not measured
directly, was estimated for fields where the straw was not removed (non- or pre-baled)
using our line transect estimates of rice seed mass-density and the regression equation
provided by Halstead et al. (2011).
Invertebrates are important food items in wetlands and rice fields for many
groups of waterbirds including ducks (Euliss and Harris 1987, Miller 1987, Safran et al.
1997) and shorebirds (Safran et al. 1997, Davis and Smith 1998, Smith et al. 2012).
Important groups of invertebrates include insects and their larvae (Orders: Diptera,
Coleoptera, Hemiptera), crustaceans and their aquatic larvae, nematodes, oligochaetes,
and gastropods. Moist-soil seeds (aka weed seeds) are also important food resources for
waterfowl (Euliss and Harris 1987, Miller 1987). We sampled invertebrates and moist-
soil seeds within the benthos (hereafter sediment) and the water column (for flooded
practices only) from 20 – 28 December 2011 and 10 – 17 December 2012 in all four post-

P a g e | 9
harvest management practices (BF, BNF, NBF, NBNF). We randomly selected fields and
two sampling plots per field. At each sampling plot, we used a 0.5-m2 frame to contain
mobile invertebrates and collected two samples, each at opposite corners of the frame,
using a 125-mm diameter steel corer. We placed sediment cores in a plastic bag and
stored them in a cool place. In flooded fields, we sampled the water column using a
stovepipe affixed to the top of our benthic corer. We poured the water sample into a 0.5-
mm sieve in the field then stored the sample in 90% ethanol with rose bengal dye in a
cool place until laboratory processing (Mitchell and Grubaugh 2005). We washed all
benthic samples within three weeks of collection using a 0.5-mm sieve. All invertebrates
in the samples were sorted and counted by broad taxonomic classifications (e.g.
phylum, class, subclass, order) by the USGS Western Ecological Research Center, San
Francisco Bay Field Station. To increase efficiency of core processing, for samples with
large numbers of invertebrates (e.g., Nematoda) or moist-soil seeds, a random 25% of
the sample was used to estimate density.
Data analysis. We calculated the area (ha) surveyed for waterbirds at each sample point
using ArcMap Version 9.3.1 (© 1999-2009 ESRI Inc.). We compared waterbird densities,
calculated for dabbling duck, shorebird, and goose guilds, among practices and years
using the average of the pooled mean density (birds/ha) from each survey location and
95% confidence intervals (95% CI). Due to the large number of zeroes and non-normal
distribution of bird counts and subsequently bird density estimates, we used
bootstrapping and the percentile method to estimate the 95% CI for the mean density
estimates of each guild (Manly 2007). We chose to use this non-parametric bootstrap
approach as it was better able to characterize the mean values by practice than a
parametric regression model which assumes a specific distribution. To calculate the
confidence intervals, we generated 1000 bootstrap iterations (random resample with
replacement) from the original data set, and then calculated the mean for each bootstrap
replicate. To account for correlation from repeated measurements on the same paddy,
we sampled with replacement from each paddy, averaged those values within paddy
and then averaged across paddies in each bootstrap iteration. We considered density
estimates from different practices to be significantly different if their 95% CI did not
overlap. We recognize that this is a strict measure of significance and represents ~P =
0.01 (Gardner and Altman 1986) but wanted to set a high burden of proof. We
calculated these statistics for both years combined and independently for the first and
second year of the study to assess year to year variation.
P a g e | 10
Our approach treated each paddy as the independent sample unit but by
averaging repeated measurements (surveys) on the same paddy we limited temporal
autocorrelation (as source of pseudoreplication; Hurlbert 1984). If there was additional
spatial autocorrelation, our assumption of independence is violated, potentially raising
the risk of Type I error when interpreting parameter estimates (Legendre et al. 2004);
95% CI would be too small. To investigate possible correlation among the paddies
within farms and regions we used zero-inflated negative binomial regression models
(Zuur et al. 2009) to assess residual effects of farm or region after accounting for practice
effects. We found no significant effects and thus feel confident in considering paddies as
independent samples in our bootstrap analyses. However we did evaluate years
separately as there was evidence of differences in duck and shorebird abundance
between years.
Paddy Characteristics as Driving Mechanisms. We examined paddy
characteristics that could be considered mechanisms driving the observed differences in
waterbird density among practices. To better assess continuous covariates (not possible
with bootstrapping) we used zero-inflated negative binomial regression models (Zuur
et al. 2009) to quantify the effect of the following possible mechanisms on waterbird
density. We examined the effect of whether a survey area was incorporated or not, and
combined all the different methods of incorporation (disking, chiseling, stomping). We
expected some waterbird groups such as ducks and geese to have higher use of non-
incorporated paddies since the waste grain should be on the surface and more
accessible (Miller et al. 1989) though Elphick and Oring (1998) showed no effect of straw
management practices on ducks. However shorebirds have been shown to be positively
associated with incorporation (Elphick and Oring 1998) and would be expected to use
paddies with little to no standing stubble which would be more likely in an
incorporated paddy (Strum et al. 2013). We examined the effect of the proportion of the
survey area that was flooded (having standing water) and the effect of water depth in
both linear and quadratic forms, as both shorebirds and ducks have been shown to have
optimal depth range preferences (Strum et al. 2013). We also examined the effect of the
proportion of the survey area with standing stubble since previous studies have found
some groups, such as shorebirds, may avoid paddies with tall stubble which can
obstruct their view and make them more susceptible to predation. We considered the
effect of these paddy characteristics to be significant if the 95% CI of the model
coefficient estimate did not overlap zero. To assess the relative influence of our selected

P a g e | 11
paddy characteristics as mechanisms influencing densities of waterbird guilds, we
ranked models using Akaike’s Information Criterion (AIC; Burnham and Anderson
2002). Generally models within 2 AIC units of the model with the lowest AIC are
considered in the top model set.
Habitat Quality. One measure of habitat quality is whether water of the
appropriate depth is being provided by each of the practices. We examined the
probability that a practice provided suitable water depths for shorebirds and dabbling
ducks following methods outlined in Strum et al. (2013). They defined suitable water
depth for shorebirds to be between mudflat and 16 cm and suitable water depth for
dabbling ducks to be greater than 16 cm. Geese use a wide range of water depths from 0
to greater than 16 cm, so were not assigned a suitable depth range. We also compared
the probability of incorporation (all methods combined) among practices. We used
mixed-effects logistic regression models to estimate the mean and 95% CI of the
probability of suitable water depth or incorporation by practice (Zuur et al. 2009). We
again considered coefficient estimates for practices significantly different if their 95% CI
did not overlap.
Food Resource Availability. For waste rice data collected in 2011, we compared
mean rice seed mass-density from baled and non-baled fields using a two-tailed t-test
on log-transformed data. For the data collected in 2012, we used paired t-tests on non-
transformed mean rice seed mass-densities (after testing for normality) to compare
densities pre- and post- baling. Significance was set at P ≤ 0.05.
For sediment and water column samples in all four practices, we compared
densities of broad taxonomic groups (invertebrates and seeds) among practices using
the average of the pooled mean density (individuals/m2) from each field and 95% CI.
Due to the large number of zeroes and non-normal distribution of these counts and
subsequently density, we used bootstrapping and the percentile method to estimate the
95% CI for the density estimates of each group (Manly 2007 and see description on page
9). We considered density estimates from different practices within groups to be
significantly different if their 95% CI did not overlap.
We used R v.3.0.2 (©2013 The R Foundation for Statistical Computing) for all
statistical analyses.

P a g e | 12
II. Seeding Practices
Practice descriptions. We compared waterbird use of the traditional wet fly-on seeding
practice with an alternative drill seeding practice. Fly-on seeding involved rolling a rice
field to create furrows then flooding the field 10–13 cm deep and distributing pre-
germinated rice seed over the field by airplane. The rice seed then sinks into the
furrows and begins to grow. These fields are continuously flooded for the growing
season. Drill-seeded fields in our study were not flooded prior to seeding. A seed drill is
pulled over the field and sows seeds below the surface of dry ground. Fields are then
flooded in pulses 2–3 times to germinate the rice seed before flooding is constant.
Eventually, both seeding methods are kept flooded at 8–10 cm for the remainder of the
growing season.
Study design. Similar to our study on post-harvest practices, rice fields are divided into
subunits called paddies that are separated by internal earthen levees. We considered the
individual paddy to be the sample unit. Thus, paddies were spatially nested within
fields, and fields were further nested within farms. On the two larger farms where we
had relationships with the growers, we selected survey points using GRTS sampling
methodology. In order to bolster our sample size, we also selected rice fields that were
close to our known farms, accessible from public roads, and starting the seeding process
at about the same time. On these fields, we used simple random sampling to select
paddies to survey. This study was conducted primarily in Sutter County (Fig. 1).
Waterbird surveys. From 3 – 26 May 2012 and 18 April – 24 May 2013, we conducted
two waterbird surveys per week in the two rice seeding practices, drill and fly-on
seeding. We conducted 1,911 surveys across 281 paddies, including 149 drill-seeded and
132 fly-on seeded paddies. The early start to seeding in 2013 prompted our study to
start earlier in Year 2 than in Year 1. Survey methods were the same as those described
above for post-harvest practices (page 6).
Paddy Characteristics. For the seeding practices, we recorded the same cover and soil
moisture measurements that we recorded with the post-harvest practices (proportion of
survey area flooded, saturated, moist, dry, and with stubble).
Data analysis. We compared densities, calculated for dabbling duck and shorebird
guilds, between seeding practices and years using the same methods described above
for post-harvest practices (page 9). For shorebirds, we summarized mean densities per
P a g e | 13
seeding practice both including and excluding the April surveys to account for any
potential effects bird migration, as spring shorebird migration peaks in April in the
Sacramento Valley. We assumed that populations of dabbling ducks and geese were
relatively stable during this time period as migration is generally complete for those
guilds (at least in the Sacramento Valley).
We used individual zero-inflated negative binomial regression models (Zuur et
al. 2009) to evaluate paddy characteristics that could be considered mechanisms driving
the observed differences in waterbird densities between seeding practices. We
considered the proportion of the survey area that was flooded, saturated, moist, and
dry as model covariates. We assessed these gradients in soil moisture, as generally,
water characteristics are more variable and dynamic in fields during planting than
during post-harvest winter flooding. We again considered coefficient estimates to be
significant if the 95% CI did not overlap zero and we compared among models using
AIC.
RESULTS
I. Post-harvest Management Practices
Waterbirds. We observed 36 species of waterbirds, representing six foraging guilds
(Table 2, Appendix A). The most numerous species were American coot (Fulica
americana), mixed goose flocks (Chen/Anser spp.), northern pintail (Anas acuta), and
dunlin (Calidris alpina). The two flooded practices, BF and NBF, had almost twice the
waterbird species richness compared to non-flooded practices.
When both years were combined, we found dabbling duck mean density to be
significantly higher in the NBF practice than the BF practice (Fig. 2). However the 95%
CI were very close to overlapping between these two flooded practices. The difference
between non-baled and baled was not significant in the first year but was significant in
the second year of the study. We found no dabbling ducks in the two non-flooded
practices (BNF, NBNF). Shorebird mean density was significantly higher in the NBF
practice than in the other three practices (Fig. 2) although we found more variation
around the mean density for NBF in the second year; this led to a small amount of
overlap of the 95% CIs with the other practices. We detected some very large flocks of
geese in the first year which resulted in the large 95% CIs (Fig. 2). Our data suggested
no significant differences among the practices for geese.
P a g e | 14
Mechanism models used to evaluate the effects of paddy characteristics on
waterbird density suggested significant effects of water depth, proportion flooded, and
proportion standing stubble on dabbling duck and shorebird density, as 95% CIs of the
parameter estimates did not overlap zero; however none of the covariates had a
significant effect on goose density (Table 3). Additionally, whether a paddy was
incorporated or not also had a significant effect on shorebird density. The proportion of
the survey area that had standing stubble had a significant negative effect on both
shorebird and dabbling duck densities. Overall, for shorebirds, the quadratic water
depth model had the lowest AIC and was >2 AIC units less than the next best supported
mechanism model which included the variable indicating whether straw incorporation
had occurred. Similarly, the quadratic depth model was best supported by AIC for
dabbling ducks; however the model including the proportion flooded was within 2 AIC
units of the top dabbling duck model, further emphasizing that water is essential for
dabbling duck use. All models for shorebirds and all models except the incorporation
model for ducks were a significant improvement, based on AIC, over the intercept-only
model. However, for geese, the intercept-only model was best supported, further
substantiating the finding that none of the covariates considered had a significant effect
on goose density.
Habitat quality. Differences in field characteristics were often associated with the four
practices (Fig. 3) and consequently may help explain the observed variation in
waterbird use. Predictably, water was more prevalent and deeper in flooded practices
than in the non-flooded practices. Water depth was not significantly different from a
bird’s perspective between the two flooded practices, BF and NBF. The probability of
water being at shorebird depth was significantly higher in both BF (0.21; 0.15 – 0.29 95%
CI) and NBF (0.29; 0.19 – 0.49 95% CI) than in BNF (0.08; 0.05 – 0.14 95% CI). However
there was considerable uncertainty in our estimate of the effect of NBNF on water depth
resulting in a large 95% CI (0.13; 0.08 – 0.61 95% CI) despite a low probability for
shorebird depth. There also was not a significant difference in the probability of water
of suitable depth for dabbling ducks between the two flooded practices, BF (0.78; 0.68 –
0.87 95% CI) and NBF (0.65; 0.48 – 0.79 95% CI) but both non-flooded practices had zero
probability of providing water depth suitable for dabbling ducks. Standing stubble was
strongly associated with non-flooded practices which may be related to water depth
obscuring the substrate of the field when flooded. Where visible in dry practices, BNF
had a higher average proportion standing stubble than NBNF which, in part, may be

P a g e | 15
explained by the higher frequency of incorporation in our sample of non-baled practices
resulting in lower amounts of standing stubble in that practice (Fig. 3). In baled
practices in our study, BF (0.52; 0.46 – 0.58 95% CI) and BNF (0.35; 0.28 – 0.42 95% CI),
there was a significantly lower probability of incorporation than in non-baled practices,
NBF (0.90; 0.86 – 0.93 95% CI) and NBNF (0.83; 0.78 – 0.98 95% CI).
Post-hoc. Our results suggested that shorebirds were significantly associated with
incorporation and that the probability of incorporation was associated with whether a
field was baled or not-baled. We further examined whether differences in incorporation
was the mechanism driving the difference in use between baled and non-baled fields by
filtering the dataset to control for flooding and incorporation. We performed
bootstrapping according to the methods described above, separately for baled and non-
baled fields that were incorporated and non-incorporated. For shorebirds, non-baled
and incorporated paddies still had significantly higher densities (mean=5.3; 2.97–8.05
95% CI) than any other combination of practices (Table 4). Our mechanism models did
not indicate straw incorporation was important for ducks, or geese and swans, which is
supported to some extent by other research (Elphick and Oring 1998) thus we feel our
initial comparison of means by practice is robust to differences in incorporation rates
between baled and non-baled practices.
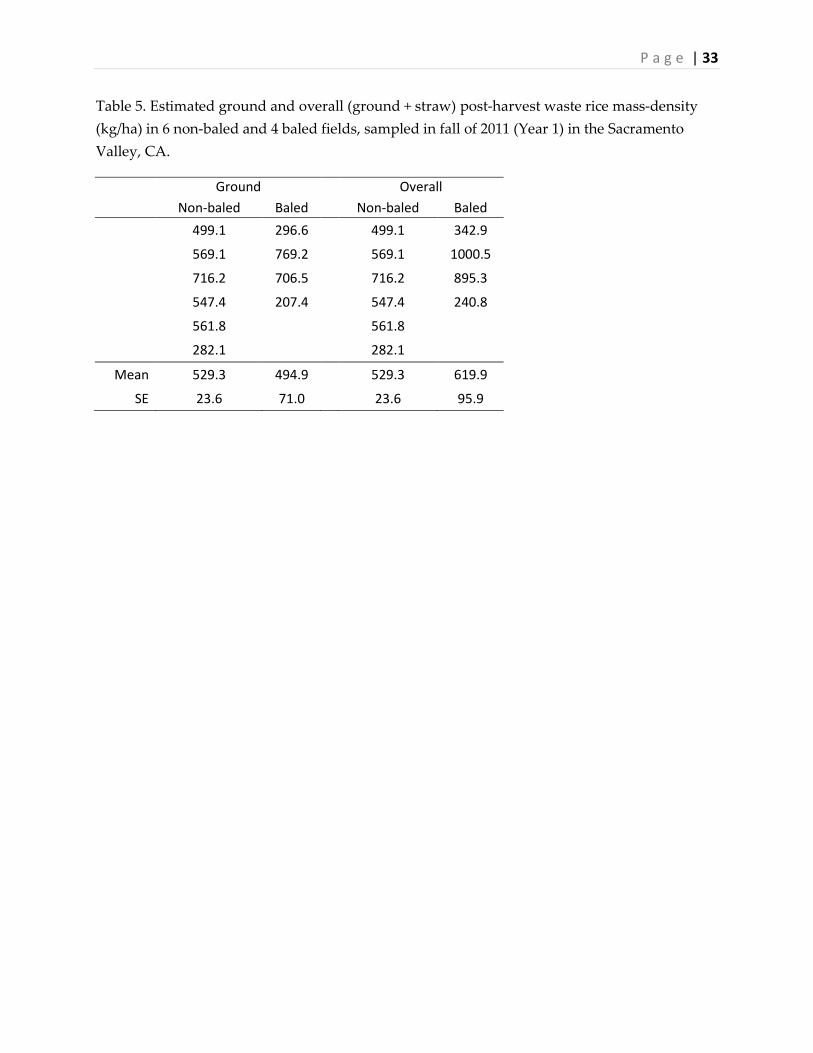
Food resource availability. When assessing waste rice, we sampled a total of 30 plots in
10 fields (6 baled, 4 non-baled) in 2011 and 60 plots in 10 fields (3 plots per field both
pre- and post-baling) in 2012. In 2011, we found no significant difference in rice mass-
density (t = 0.22, df = 4, P = 0.83) between baled and non-baled fields, although we found
large variation in rice seed mass-density from field to field (Table 5). In 2012 our sample
size was larger and we found no significant difference in rice mass-density on the
ground pre- and post-baling (t = 1.13, df = 9, P = 0.29). However, when we took into
account the estimated amount of rice seed in the straw layer (above the ground), we
found that overall, fields had significantly higher waste rice mass-density before the
field was baled than after (t = 3.11, df = 9, P = 0.013; Table 6).
We sampled invertebrates and moist soil seeds in 15 fields during December
2011 and 31 fields during December 2012 (Table 7). Eleven broad invertebrate taxa and
moist soil seeds were found in our samples (Table 8). Moist soil seeds and nematodes
were the most numerous potential food items found in flooded and non-flooded fields.
Other abundant invertebrates included oligochaete worms and several orders of

P a g e | 16
crustaceans (Cladocera, Copepoda, Ostracoda). We found flooded fields had
significantly higher densities of nematodes and crustaceans than non-flooded fields,
with no significant difference between baled and non-baled. We found similar densities
of oligochaetes in all practices and generally no discernible patterns in densities of
insects or moist soil seeds among practices, although insects were very low in NBF and
moist soil seeds very high in BF (Fig. 4).
II. Seeding Practices
Waterbirds. We observed 28 species of waterbirds representing six foraging guilds
(Table 9, Appendix A). The most numerous species were mallards (Anas platyrhyncos),
western sandpiper (Calidris mauri), white-faced ibis (Plegadis chihi), and American coot
(Fulica americana). Over 99% of the ducks observed in seeding surveys were mallards.
We found no significant difference in mean dabbling duck density between the two
seeding practices (Fig. 5). There was also no significant difference in mean shorebird
density between the two practices, whether we included the April observations or not.
Mean shorebird density was actually higher when we excluded April, likely because the
cut-off did not include the high number of shorebirds observed on 2 May 2013. Geese
(all greater white-fronted geese) were only detected twice during this study, and both
times in small groups. Many of the shorebirds and dabbling ducks encountered in May
were likely breeding locally; potentially even in the rice fields.
Mechanism models used to evaluate the effects of paddy characteristics on
waterbird density suggested that both shorebirds and dabbling ducks had significant
negative associations with the proportion of the survey area that was dry (Table 10)
and, inversely, a significant positive association with the proportion of the survey area
that was flooded. The proportion of dry area was the best supported model based on
AIC for both guilds. Shorebirds were also positively associated with proportion of the
survey area that was saturated with water.
Habitat quality. Overall the average proportion of the survey area that was flooded
was higher and less variable in the fly-on practice (0.86) than in drill seeding (0.33; Fig.
6), while the opposite was true for the proportion of the survey area that was dry.
However, the proportion of the survey area that was saturated and moist was, on
average, higher in the drill seeding practice.

P a g e | 17
DISCUSSION
I. Post-harvest Management Practices
Our study documented significant differences in densities of shorebirds and
dabbling ducks in rice fields in the winter depending on the post-harvest practices.
Overall, the flooded practices had significantly higher waterbird densities than non-
flooded practices, as has been found in other studies (Elphick and Oring 1998, Taft and
Elphick 2007, Strum et al. 2013). Non-flooded practices received some use by geese with
the highest density of geese occurring in baled, non-flooded fields. Other studies have
also found geese to use both flooded and non-flooded fields (Elphick and Oring 1998).
Overall, our flooded practices had comparable but lower density estimates for dabbling
ducks than another recent study in winter-flooded rice using the same survey protocol,
but slightly higher density estimates for shorebirds (Strum et al. 2013).
Of the two flooding practices, we found significantly higher densities of
shorebirds and dabbling ducks in the NBF than BF. Even though mean duck densities
were three times larger in NBF than BF, the difference between 95% CIs for ducks was
small. These differences in use may result from the additional post-harvest practices
applied to non-baled fields; though, ducks and geese and swans were not significantly
associated with incorporation while shorebirds were. However, after controlling for
incorporation (about half of our BF fields were not incorporated, leaving more standing
stubble on the surface compared to NBF fields of which about 90% were incorporated,
resulting in more exposed soil on the surface and less standing stubble) shorebird
density was still significantly higher in non-baled compared to baled paddies. This
additional result further supports the higher value of non-baled fields compared to
baled fields for shorebirds.
Our study estimated day-time use of rice by waterbirds and it is possible that
day-time use underestimates dabbling duck densities, as it has been documented that
there is greater use of flooded agricultural fields by waterfowl at night during
December and January, especially when farms are close to wetland refuges (Fleskes et
al. 2005). As well, it is possible that our density estimates were low, as some dabbling
duck species flush easily and may use habitat outside the 200-m range of our survey
area though our densities, albeit slightly lower, were similar to those from Elphick and
Oring (2003) which were based on surveys of the entire rice field. We have no evidence,
P a g e | 18
however, to suggest that there would be an interaction between time of day and field
management practice thus our findings would likely not change if there were higher
night-time densities.
Food resource availability. Prior to this study, the effect of baling on the availability of
waste rice seed was unknown and our study provides some data to answer this
question, although our sample sizes were modest. The baling process shakes some
unknown portion of remaining rice seeds from the straw onto the ground as the straw is
pushed into rows and bales are created, thus increasing ground density of rice seed.
However, the baling equipment and multiple passes through the field also likely push a
portion of rice down into the soil where it is no longer available to waterbirds and
removal of straw along with its associated waste rice should decrease the availability of
waste rice from the field overall. Our results suggest that while baling may increase the
ground density of waste rice in some fields, when rice seed in the straw layer is
accounted for before baling, fields have significantly less waste rice available after
baling. Overall, our rice densities were greater than those found in similar studies in the
Sacramento Valley (Fleskes et al. 2012: 364 kg/ha, Miller et al. 1989: 386 kg/ha). Our
results support food availability from rice seed as a plausible mechanism resulting in
the differences in dabbling duck use between baled and non-baled fields.
Our data indicate baling does not have a large impact on invertebrate or moist
soil seed density, but flooding does. Both nematodes and crustaceans had significantly
higher densities in the flooded practices, both of which are known food resources for
shorebirds and the latter for waterfowl. We did not find any other discernible patterns
in invertebrate and seed abundance though overall we had low samples sizes given the
spatial variability in invertebrate abundance. The invertebrate densities in our four
post-harvest practices may have been influenced by other factors which we were unable
to control for, such as grower preference for herbicides and pesticides as well as the
water source, if flooded.
II. Seeding Practices
Our results suggest that drill seeding, and the resulting pulses of flooding,
provide comparable habitat for shorebirds and dabbling ducks to fly-on seeding. Fly-on
seeding had a greater proportion flooded, but drill seeding provided more saturated
and moist habitat. Shorebirds were significantly associated with saturated soils.
P a g e | 19
During seeding, there are two major lifecycle stages to consider for migratory
birds when assessing results and making decisions about seeding practices: spring
migration for shorebirds and the beginning of the breeding season for Central Valley
nesting species (e.g. mallard, black-necked stilt). The timing of rice planting varies
annually (2012 was a late year for planting) and waterbird use of rice fields in spring
likely varies annually as well, in response to variation in timing of flooding and with
regard to migration timing. Migration was apparent in our data as western sandpipers
were the second most abundant shorebird species in this study, yet they were only
present through 18 May in 2012 and 3 May in 2013. Dunlin, semipalmated plover
(Charadrius semipalmatus), whimbrel (Numenius phaeopus), and dowitchers (Limnodromus
spp.) were all present during the study with numbers decreasing during the course of
our surveys, making it more difficult to assess differences between the seeding
practices. Another variable not accounted for in this analysis is the behavioral shift for
some waterfowl and shorebirds from maintenance (loafing and foraging) to breeding
(incubation) which could potentially decrease the number of individuals detected in
either of the practices. For dabbling ducks, females would be sitting quietly on a nest on
the edge of rice or in surrounding uplands. For shorebirds, while some species that nest
in the middle of rice fields would be easy to detect (e.g. black-necked stilts), others
would be quietly incubating on the rice checks (e.g. American avocet, killdeer) and thus
more difficult to detect. However, we have no reason to suspect that these behavioral
shifts would differ between practices, so this should not dramatically influence our
results, only decrease our overall densities. Further evaluation of the effects of these two
seeding practices on breeding species (i.e. nest success, productivity) is needed.
Overall, our study suggests that some post-harvest practices (reduced winter
flooding, baling) to reduce greenhouse gas emissions from rice may reduce use by
waterbirds. The relative GHG reductions of different practices (EDF 2010) must be
evaluated against the trade-off of reduced habitat for waterbirds.
CONCLUSIONS
Rice paddies that were baled prior to flooding had lower densities of dabbling
ducks and shorebirds than paddies that were not baled. Baled fields also had less
waste rice seed than non-baled fields.

P a g e | 20
Ducks and shorebirds were significantly associated with flooded fields, with
ducks not even being observed in non-flooded practices.
Shorebirds were positively associated with fields in which the straw and stubble
had been incorporated, or mixed, into the soil. Though after accounting for
differences in incorporation among practices, shorebird density was still higher
in non-baled compared to baled fields.
Shorebirds and ducks were negatively associated with the amount of the survey
area with standing stubble which may suggest why there were higher densities
of both guilds in non-baled fields compared to baled fields.
Seeding practices were nearly equivalent in the potential to support shorebirds
and dabbling ducks. Further evaluation of the effects of these two seeding
practices on breeding species (i.e. nest success, productivity) is needed.
ACKNOWLEDGMENTS
This study would not have been possible without the participation and support
of many Sacramento Valley rice growers. We are also grateful for the support of our
partners at Environment Defense Fund, the California Rice Commission, and the
Migratory Bird Conservation Partnership (with Audubon California and The Nature
Conservancy). We thank Monica Iglecia and Paul Buttner for outreach support. We
thank Jeff Stoddard and the Yolo Bypass Wildlife Area for providing a location to wash
benthic core samples and Ryan Gilpin, Michelle Gilbert, and Brent Campos for help
washing benthic core samples in the cold and rain. We thank the USGS Western
Ecological Research Center and San Francisco Bay Estuary Field Station personnel John
Takekawa, Isa Woo, and Ashley Smith for their support with our invertebrate sampling
and processing efforts. Nat Seavy and Lynne Stenzel of Point Blue offered helpful
discussions on study design for the food resources component. Nat Seavy, Tom Gardali,
Robert Parkhurst, and Sara Snider provided valuable comments on earlier versions of
this report. Funding was provided by a contract through EDF from their USDA Natural
Resources Conservation Service National Conservation Innovation Grant and the S. D.
Bechtel, Jr. Foundation. This is contribution No. 1999 of Point Blue Conservation
Science.

P a g e | 21
LITERATURE CITED
AB-32. Global Warming Solutions Act of 2006. California Assembly Bill 32.
<www.arb.ca.gov/cc/ab32/ab32.htm>
Bossio, D. A., W. R. Horwath, R. G. Mutters, and C. van Kessel. 1999. Methane pool and flux
dynamics in a rice field following straw incorporation. Soil Biology and Biochemistry 31:
1313–1322.
Burnham, K. P., and D. R. Anderson. 2002. Model selection and multimodel inference: a
practical information-theoretic approach. Springer, New York, NY.
Collins, D. P., C. A. Palmer, and R. E. Trost. 2011. Pacific Flyway Data Book 2011: Waterfowl
harvests and status, hunter participation and success in the Pacific Flyway and United
States. U. S. Fish and Wildlife Service Division of Migratory Bird Management, Portland,
Oregon.
CVJV. 2006. Central Valley Joint Venture Implementation Plan—conserving bird habitat. U.S.
Fish and Wildlife Service, Sacramento, CA.
Davis, C. A., and L. M. Smith. 1998. Ecology and management of migrant shorebirds in the
Playa Lakes region of Texas. Wildlife Monographs 140: 3–45.
Day, J. H., and M. A. Colwell. 1998. Waterbird communities in rice fields subjected to different
post-harvest treatments. Colonial Waterbirds 21: 185–197.
EDF. 2010. Creating and quantifying carbon credits from voluntary practices on rice farms in
the Sacramento Valley: accounting for multiple benefits for producers and the
environment. Final report to NRCS from Environmental Defense Fund, Inc., Sacramento,
CA.
Elphick, C. S., and L. W. Oring. 1998. Winter management of Californian rice fields for
waterbirds. Journal of Applied Ecology 35: 95–108.
Elphick, C. S., and L. W. Oring. 2003. Conservation implications of flooding rice fields on winter
waterbird communities. Agriculture, Ecosystems & Environment 94: 17–29.
Euliss, Jr., N. H., and S. W. Harris. 1987. Feeding ecology of northern pintails and green-winged
teal wintering in California. The Journal of Wildlife Management 51: 724–732.
Fitzgerald, G. J., K. M. Scow, and J. E. Hill. 2000. Fallow season straw and water management
effects on methane emissions in California rice. Global Biogeochemical Cycles 14: 767–
776.
Fleskes, J. P., J. L. Yee, M. L. Casazza, M. R. Miller, J. Y. Takekawa, and D. L. Orthmeyer. 2005.
Waterfowl distribution, movements, and habitat use relative to recent habitat changes in
the Central Valley of California: A cooperative project to investigate impacts of the
Central Valley Joint Venture and changing agricultural practices on the ecology of
wintering waterfowl. Final Report. U.S. Geological Survey-Western Ecological Research
Center, Dixon Field Station, Dixon, California.

P a g e | 22
Fleskes J. P., B. J. Halstead, M. L. Casazza, P. S. Coates, J. D. Kohl, and D. A. Skalos. 2012. Waste
rice seed in conventional and stripper-head harvested fields in California: Implications
for wintering waterfowl. Journal of Fish and Wildlife Management 3: 266–275.
Frayer, W. E., D. D. Peters, and H. R. Pywell. 1989. Wetlands of the California Central Valley:
Status and Trends - 1939 to mid-1980s. U.S. Fish and Wildlife Service, Region 1,
Portland, Oregon, 28 pp.
Gardner, M. J., and D. G. Altman. 1986. Confidence intervals rather than p values: estimation
rather than hypothesis testing. British Medical Journal 292: 746–750.
Garr, J. D. 2014. The status of rice fields during mid-winter in the Sacramento Valley, California:
2013 – 2014 Data Summary. Final Report to The Central Valley Joint Venture, The
California Rice Commission, and Ducks Unlimited. Wildlife Friendly Farming, Colusa,
CA.
Gilmer, D. S., M. R. Miller, R. D. Bauer, and J. R. LeDonne. 1982. California’s Central Valley
wintering waterfowl: concerns and challenges. Transactions of the North American
Wildlife and Natural Resources Conference 47: 441–452.
Hatfield, J., G. Takle, R. Grotjahn, P. Holden, R. C. Izaurralde, T. Mader, E. Marshall, and D.
Liverman. 2014. Chapter 6: Agriculture. Climate Change Impacts in the United States:
The Third National Climate Assessment in J. M. Melillo, T. C. Richmond, and G. W.
Yohe, Eds., U. S. Global Change Research Program. pp. 150–174.
<http://nca2014.globalchange.gov/report/sectors/agriculture>.
Halstead, B. J., M. R. Miller, M. L. Casazza, P. S. Coates, M. A. Farinha, K. B. Gustafson, J. L.
Yee, and J. P. Fleskes. 2011. Rapid assessment of rice seed availability for wildlife in
harvested fields. Wildlife Society Bulletin 35: 377–393.
Hayhoe, K., D. Cayan, C. B. Field, P. C. Frumhoff, E. P. Maurer, N. L. Miller, S. C. Moser, S. H.
Schneider, K. N. Cahill, E. E. Cleland, L. Dale, R. Drapek, R. M. Hanemann, L. S.
Kalkstein, J. Lenihan, C. K. Lunch, R. P. Neilson, S. C. Sheridan, and J. H. Verville. 2004.
Emissions pathways, climate change, and impacts on California. Proceedings of the
National Academy of Sciences, USA. 101: 12422–12427.
Hurlbert, S. H. 1984. Pseudoreplication and the design of ecological field experiments.
Ecological Monographs 54: 187–211.
IPCC. 2007. Climate Change 2007: The Physical Science Basis. Contribution of Working Group I
to the Fourth Assessment Report of the Intergovernmental Panel on Climate Change
[Solomon, S., D. Qin, M. Manning, Z. Chen, M. Marquis, K.B. Averyt, M.Tignor and H.L.
Miller (eds.)]. Cambridge University Press, Cambridge, United Kingdom and New York,
NY, USA.
Lauren, J. G., G. S. Pettgrove, and J. M. Duxbury. 1994. Methane emissions associated with a
green manure amendment to flooded rice in California. Biogeochemistry 24: 53–65.
Lee, J., S. DeGryze, and J. Six. 2011. Effect of climate change on field crop production in
California’s Central Valley. Climatic Change 109: S335–S353.

P a g e | 23
Legendre, P., M. R. T. Dale, M. J. Fortin, P. Casgrain, and J. Gurevitch. 2004. Effects of spatial
structures on the results of field experiments. Ecology 85: 3202–3214.
Lindberg, Jeff. 2003. Progress report on the phase-down of rice straw burning in the Sacramento
Valley Air Basin. California Air Resources Board, California Department of Food and
Agriculture December. Accessed on 25 July 2014.
<http://www.arb.ca.gov/research/apr/reports/l2075.pdf>
Lobell, D. B., and C. B. Field. 2011. California perennial crops in a changing climate. Climatic
Change. 109: 317–333.
Manly, B. F. 2007. Randomization, bootstrap, and Monte Carlo methods in biology. Chapman
and Hall, Boca Raton, Florida, USA.
Miller, M. R. 1987. Fall and winter foods of northern pintails in the Sacramento Valley,
California. The Journal of Wildlife Management 51: 405–414.
Miller, M. R., D. E. Sharp, D. S. Gilmer, and W. R. Mulvaney. 1989. Rice available to waterfowl
in harvested fields in the Sacramento Valley, California. California Fish and Game 75:
113–123.
Miller, M. R., J. D. Garr, and P. S. Coates. 2010. Changes in the status of harvested rice fields in
the Sacramento Valley, California: Implications for wintering waterfowl. Wetlands 30:
939–947.
Mitchell, D. W., and J. W. Grubaugh. 2005. Impacts of shorebirds on macroinvertebrates in the
Lower Mississippi Alluvial Valley. The American Midland Naturalist 154: 188–200.
R Core Development Team. 2013. R: A language and environment for statistical computing. R
Foundation for Statistical Computing, Vienna, Austria. Accessed in December 2013.
<http://www.R-project.org/>.
Safran, R. J., C. R. Isola, M. A. Colwell, and O. E. Williams. 1997. Benthic invertebrates at
foraging locations of nine waterbird species in managed wetlands of the northern San
Joaquin Valley, California. Wetlands 17: 407–415.
Shuford, W. D., G. W. Page, and J. E. Kjelmyr. 1998. Patterns and dynamics of shorebird use of
California's Central Valley. Condor. 100: 227–244.
Shuford, W. D., M. E. Reiter, K. M. Strum, C. J. Gregory, M. M. Gilbert, and C. M. Hickey. 2013.
The effects of crop treatments on migrating and wintering waterbirds at Staten Island,
2010-2012. Final Report to The Nature Conservancy. Point Blue Conservation Science,
Petaluma, CA.
Smith, R. V., J. D. Stafford, A. P. Yetter, M. M. Horath, C. S. Hine, and J. P. Hoover. 2012.
Foraging ecology of fall-migrating shorebirds in the Illinois River Valley. PLOS One 7:
e45121.
Sterling, J. and P. Buttner. 2011. Wildlife known to use California ricelands. California Rice
Commission, Sacramento, CA.

P a g e | 24
Stevens, D. L., and A. R. Olsen. 2004. Spatially balanced sampling of natural resources. Journal
of the American Statistical Association. 99: 262–278.
Strum, K. M., M. E. Reiter, C. A. Hartman, M. N. Iglecia, T. R. Kelsey, and C. M. Hickey. 2013.
Winter management of California’s rice fields to maximize waterbird habitat and
minimize water use. Agriculture, Ecosystems and Environment 179: 116-124.
Suddick, E. C., K. M. Scow, W. R. Horwath, L. E. Jackson, D. R. Smart, J. Mitchell, and J. Six.
2010. The potential for California agricultural crop soils to reduce greenhouse gas
emissions: a holistic evaluation. In D. L. Sparks, ed. Advances in Agronomy, Vol. 107,
Academic Press, Burlington, VT, pp. 123–126.
Taft, O. W. and C. S. Elphick. 2007. Waterbirds on working lands: literature review and
bibliography development. Technical Report. National Audubon Society, New York,
New York. http://www.audubon.org/bird/waterbirds/downloads.html, accessed January
10, 2009.
Western Hemisphere Shorebird Reserve Network (WHSRN). 2003. Sacramento Valley as site of
international importance to shorebirds. <http://www.whsrn.org/site-profile/sacramento-
valley>
Zuur, A. F., E. N. Ieno, N. Walker, A. A. Saveliev, and G. M. Smith. 2009. Mixed Effects Models
and Extensions in Ecology with R. Springer, New York, NY.

P a g e | 25
LIST OF TABLES
Table 1. Total number of rice field paddies in each post-harvest practice for waterbird
surveys conducted from 2 December 2011 – 27 January 2012 (Year 1) and 3 December
2012 – 25 January 2013 (Year 2) in the Sacramento Valley, CA. ..................................................... 28
Table 2. Waterbird occurrence (# surveys detected; Occ.), abundance (total count;
Abun.), and species richness grouped by guild in four post-harvest rice field practices
surveyed from 2 December 2011 – 27 January 2012 and 3 December 2012 – 25 January
2013 in the Sacramento Valley, CA. ..................................................................................................... 29
Table 3. Summary of models evaluating mechanisms influencing waterbird use of four
post-harvest rice field practices surveyed from 2 December 2011 – 27 January 2012 and 3
December 2012 – 25 January 2013 in the Sacramento Valley, CA. In addition to covariates
listed, all models included an intercept, an overdispersion parameter, and a zero-
inflation parameter. ............................................................................................................................... 31
Table 4. Mean shorebird densities and 95% CIs in the two flooded post-harvest rice field
practices, BF and NBF, with incorporation (or non-incorporation) of straw and/or
standing stubble separated for each practice. Paddies surveyed from 2 December 2011 –
27 January 2012 and 3 December 2012 – 25 January 2013 in the Sacramento Valley, CA. n
is the number of surveyed paddies in each group. ............................................................................ 32
Table 5. Estimated ground and overall (ground + straw) post-harvest waste rice mass-
density (kg/ha) in 6 non-baled and 4 baled fields, sampled in fall of 2011 (Year 1) in the
Sacramento Valley, CA. ......................................................................................................................... 33
Table 6. Estimated ground and overall (ground + straw) post-harvest waste rice mass-
density (kg/ha) in 10 fields, sampled pre- and post-baled, in fall of 2012 (Year 2) in the
Sacramento Valley, CA. .......................................................................................................................... 34
Table 7. Total number of rice fields (field) sampled for invertebrates and seeds, including
the number of core samples (sample) processed and identified, collected during
December 2011 and 2012 in the Sacramento Valley, CA. .................................................................. 35
Table 8. Food resources in four post-harvest rice field practices BF (baled/flooded), BNF
(baled/non-flooded), NBF (non-baled/flooded), and NBNF (non-baled/non-flooded).
Occurrence (proportion of fields in which detected; Occ.) and abundance (total count:
Abun.) of invertebrates and seeds, ranked by total abundance, sampled in December
2011 and 2012 in the Sacramento Valley, CA. ..................................................................................... 36
P a g e | 26
Table 9. Waterbird occurrence (# surveys detected; Occ.), abundance (total count;
Abun.), and species richness in fields of two seeding practices (Drill and Fly-on)
surveyed from 5 – 26 May 2012 and 18 April – 24 May 2013 in the Sacramento Valley,
CA.............................................................................................................................................................. 37
Table 10. Summary of models evaluating mechanisms influencing waterbird use of rice
fields during seeding (April – May) in the Sacramento Valley, CA. In addition to
covariates listed, all models included an intercept, an overdispersion parameter, and a
zero-inflation parameter. ....................................................................................................................... 38
LIST OF FIGURES
Figure 1. Participating rice farms in the Sacramento Valley, CA. All farms were
included in waterbird surveys and a subset of farms was sampled for waste rice and
winter invertebrates and seeds. ............................................................................................................ 39
Figure 2. Mean waterbird density (birds/ha) and 95% confidence intervals in four post-
harvest rice field practices, BF (baled/flooded), BNF (baled/non-flooded), NBF (non-
baled/flooded), and NBNF (non-baled /non-flooded) surveyed from 2 December 2011 –
27 January 2012 (Year 1) and 3 December 2012 – 25 January 2013 (Year 2) in the
Sacramento Valley, CA. .......................................................................................................................... 40
Figure 3. Distribution of observed paddy characteristics in four post-harvest rice
practices surveyed from 2 December 2011 – 27 January 2012 and 3 December 2012 – 25
January 2013 in the Sacramento Valley, CA. ....................................................................................... 41
Figure 4. Mean invertebrate density (count/m2) and 95% confidence intervals in four
post-harvest rice field practices, BF (baled/flooded), BNF (baled/non-flood), NBF (non-
baled/flooded), and NBNF (non-baled /non-flooded) sampled in December 2011 and
2012 in the Sacramento Valley, CA. ...................................................................................................... 42
Figure 5. Mean waterbird density (birds/ha) and 95% confidence intervals in two
seeding practices, drill and fly-on seeding from surveys conducted from 5 – 26 May 2012
(Year 1) and 18 April – 24 May 2013 (Year 2) in the Sacramento Valley, CA. ................................ 43
Figure 6. Distribution of observed soil moisture characteristics in rice paddies in two
seeding practices, drill and fly-on seeding from surveys conducted from 5 – 26 May 2012
and 18 April – 24 May 2013 in the Sacramento Valley, CA............................................................... 44

P a g e | 27
LIST OF APPENDICES
Appendix A. List of all species detected during surveys of rice fields during the post-
harvest and seeding studies in the Sacramento Valley, CA.............................................................. 45

P a g e | 28
Table 1. Total number of rice field paddies in each post-harvest practice for waterbird surveys
conducted from 2 December 2011 – 27 January 2012 (Year 1) and 3 December 2012 – 25 January
2013 (Year 2) in the Sacramento Valley, CA.
Baled/
Flooded Baled/ Non-
flooded Non-baled/
Flooded Non-baled/
Non-flooded Overall
Year 1 45 74 54 60 233
Year 2 65 39 72 70 246
Both years combined
110 113 126 130 479

P a g e | 29
Table 2. Waterbird occurrence (# surveys detected; Occ.), abundance (total count; Abun.), and
species richness grouped by guild in four post-harvest rice field practices surveyed from 2
December 2011 – 27 January 2012 and 3 December 2012 – 25 January 2013 in the Sacramento
Valley, CA. “--“ indicates 0.
Common Name BF BNF NBF NBNF
Total Occ. Abun. Occ. Abun. Occ. Abun. Occ. Abun.
Dabbling ducks
Wood Duck 1 1
-- --
-- --
-- -- 1
Gadwall -- --
-- --
6 52
-- -- 52
Eurasian Wigeon -- --
-- --
1 2
-- -- 2
American Wigeon 4 130
-- --
8 277
-- -- 407
Mallard 2 23
-- --
15 242
-- -- 265
Northern Shoveler 9 164
-- --
34 763
-- -- 927
Northern Pintail 7 808
-- --
39 6,084
-- -- 6,892
Green-winged Teal 4 12
-- --
12 1,174
-- -- 1,186
Unknown Duck -- --
-- --
1 600
-- -- 600
Geese and Swans
Gr. White-fronted Goose
6 372
6 407
12 563
7 2,583 3,925
White geese (Snow + Ross’s)
4 409
2 582
6 523
3 1,156 2,670
Canada Goose 1 25
-- --
-- --
-- -- 25
Mixed Goose -- --
1 5,000
1 3,000
-- -- 8,000
Tundra Swan 9 693
1 150
7 423
-- -- 1,266
Shorebirds
Black-bellied Plover 1 6
2 37
3 5
-- -- 48
Killdeer 25 128
36 249
67 380
72 427 1,184
Black-necked Stilt 6 18
-- --
-- --
-- -- 18
Greater Yellowlegs 8 40
2 2
54 176
1 2 220
Lesser Yellowlegs -- --
-- --
1 1
-- -- 1
Long-billed Curlew 3 3
13 174
28 156
18 156 489
Western Sandpiper -- --
-- --
1 3
-- -- 3
Least Sandpiper 4 61
-- --
29 1,864
9 111 2,036
Unknown Peep -- --
-- --
1 18
-- -- 18
Dunlin 3 221
4 90
30 4,879
12 203 5,393
Dowitcher spp. 2 5
-- --
15 1,102
-- -- 1,107
Wilson's Snipe 9 17
10 18
28 81
20 62 178
Species richness - waterfowl & shorebirds
19 9 20 9 24

P a g e | 30
Table 2, continued. Waterbird occurrence (# surveys detected; Occ.), abundance (total count;
Abun.), and species richness grouped by guild in four post-harvest rice field practices surveyed
from 2 December 2011 – 27 January 2012 and 3 December 2012 – 25 January 2013 in the
Sacramento Valley, CA. “--“ indicates 0.
Common Name BF BNF NBF NBNF
Total Occ. Abun. Occ. Abun. Occ. Abun. Occ. Abun.
Long-legged waders
Great Blue Heron 29 29
17 17
31 32
20 22 100
Great Egret 20 21
35 37
30 36
28 35 129
Snowy Egret 3 6
1 5
6 8
2 2 21
Green Heron
--
--
--
1 1 1
White-faced Ibis 10 2,785
2 3
5 205
-- 2,993
Sandhill Crane 2 25
16 605
8 157
11 264 1,051
Gulls and marsh birds
Ring-billed Gull 8 34
15 295
57 281
11 83 693
California Gull 1 19
--
4 53
1 2 74
Herring Gull 3 9
2 2
2 2
1 1 14
Pied-billed Grebe 1 1
--
--
-- 1
American Bittern
--
--
1 1
-- 1
American Coot 71 7,636
2 370
49 3,569
-- 11,575
Species richness - all waterbirds
29 17 30 17 36

P a g e | 31
Table 3. Summary of models evaluating mechanisms influencing waterbird use of four post-harvest rice field practices surveyed
from 2 December 2011 – 27 January 2012 and 3 December 2012 – 25 January 2013 in the Sacramento Valley, CA. In addition to
covariates listed, all models included an intercept, an overdispersion parameter, and a zero-inflation parameter.
Guild Model Covariate AIC1 DeltaAIC2 LL3 K4 Estimate5 95%Low6 95%Up7 EstQ8 95%Low 95% Up
Dabbling Depth9 + Depth^210 948.52 0.00 -469.26 5 0.96 0.56 1.36 -0.02 -0.04 -0.01
Ducks Flood11 950.20 1.68 -471.10 4 6.19 4.24 8.15
Depth 963.77 15.25 -477.89 4 0.19 0.08 0.30
Stubble12 965.83 17.31 -478.92 4 -7.45 -10.79 -4.12
Intercept13 976.07 27.56 -485.04 3
Incorporation14 977.12 28.60 -484.56 4 0.83 -0.52 2.19
Geese Intercept 817.72 0.00 -405.86 3
Stubble 818.70 0.98 -405.35 4 0.96 -1.01 2.93
Flood 818.75 1.04 -405.38 4 -1.20 -3.41 1.00
Depth 819.48 1.76 -405.74 4 -0.02 -0.11 0.06
Depth + Depth^2 821.46 3.75 -405.73 5 -0.04 -0.29 0.21 0.00 -0.01 0.01
Incorporation 822.26 4.54 -407.13 4 -0.38 -2.12 1.35
Shorebirds Depth + Depth^2 2065.84 0.00 -1027.92 5 0.41 0.30 0.53 -0.02 -0.02 -0.01
Incorporation 2083.58 17.74 -1037.79 4 2.13 1.49 2.77
Flood 2099.84 33.99 -1045.92 4 1.89 0.86 2.91
Stubble 2104.30 38.46 -1048.15 4 -2.00 -3.16 -0.84
Intercept 2111.21 45.37 -1052.61 3
Depth 2112.10 46.26 -1052.05 4 0.03 -0.03 0.09 1Akaike’s Information Criterion;
2difference from model with lowest AIC;
3log likelihood;
4number of parameters in model;
5parameter estimate for model
covariate; 6lower 95% confidence bound;
7upper 95% confidence bound;
8parameter estimate for quadratic term of water depth model (Depth^2);
9average
water depth (cm); 10
quadratic term for water depth; 11
proportion of the survey area that was flooded; 12
proportion of the survey area with standing stubble; 13
intercept-only model; 14
whether a field was stomped, chiseled or disked post-harvest.

P a g e | 32
Table 4. Mean shorebird densities and 95% CIs in the two flooded post-harvest rice field
practices, BF and NBF, with incorporation (or non-incorporation) of straw and/or standing
stubble separated for each practice. Paddies surveyed from 2 December 2011 – 27 January 2012
and 3 December 2012 – 25 January 2013 in the Sacramento Valley, CA. n is the number of
surveyed paddies in each group.
Flooded practices only n mean 95% CI
Baled, incorporated 59 0.484 0.129 - 0.985
Baled, non-incorporated 51 0.124 0.078 - 0.173
Non-baled, incorporated 114 5.333 2.963 - 8.052
Non-baled, non-incorporated 14 1.047 0.300 - 2.069
P a g e | 33
Table 5. Estimated ground and overall (ground + straw) post-harvest waste rice mass-density
(kg/ha) in 6 non-baled and 4 baled fields, sampled in fall of 2011 (Year 1) in the Sacramento
Valley, CA.
Ground Overall
Non-baled Baled Non-baled Baled
499.1 296.6
499.1 342.9
569.1 769.2
569.1 1000.5
716.2 706.5
716.2 895.3
547.4 207.4
547.4 240.8
561.8
561.8
282.1
282.1
Mean 529.3 494.9 529.3 619.9
SE 23.6 71.0 23.6 95.9

P a g e | 34
Table 6. Estimated ground and overall (ground + straw) post-harvest waste rice mass-density
(kg/ha) in 10 fields, sampled pre- and post-baled, in fall of 2012 (Year 2) in the Sacramento
Valley, CA.
Ground Overall
Pre-baled Post-baled Pre-baled Post-baled
243.5 267.7
281.7 267.7
161.6 142.3
189.8 142.3
995.9 856.0
1467.3 856.0
716.2 501.6
911.0 501.6
653.5 754.8
812.0 754.8
631.8 419.6
779.3 419.6
653.5 535.3
812.0 535.3
844.0 704.1
1137.7 704.1
658.3 827.1
819.4 827.1
424.4 491.9
497.2 491.9
Mean 598.3 550.0 770.7 550.0
SE 25.6 23.7 38.0 23.7

P a g e | 35
Table 7. Total number of rice fields (field) sampled for invertebrates and seeds, including the
number of core samples (sample) processed and identified, collected during December 2011 and
2012 in the Sacramento Valley, CA.
Year BF BNF NBF NBNF Total
fields Total
samples field sample field sample field sample field sample
2011 3 8
5 10
4 7
3 6 15 31
2012 7 14
7 14
8 16
9 18 31 62
Total 10 22 12 24 12 23 12 24 46 93

P a g e | 36
Table 8. Food resources in four post-harvest rice field practices BF (baled/flooded), BNF
(baled/non-flooded), NBF (non-baled/flooded), and NBNF (non-baled/non-flooded). Occurrence
(proportion of fields in which detected; Occ.) and abundance (total count: Abun.) of
invertebrates and seeds, ranked by total abundance, sampled in December 2011 and 2012 in the
Sacramento Valley, CA.
Taxonomic Group BF BNF NBF NBNF Total
Abun. Occ. Abun. Occ. Abun. Occ. Abun. Occ. Abun.
Invertebrates
Nematoda 1 3,401
1 2,164
1 4,863
1 1,509 11,937
Oligochaeta 1 1,986
0.9 1,430
1 1,001
1 1,872 6,289
Crusteaceans (all) 0.9 2,265
0.2 20
1 2,613
0.2 9 4,907
Cladocera 0.7 728
0 0
0.6 1,279
0.1 8 2,015
Copepoda 0.9 811
0.2 20
0.9 727
0 0 1,558
Ostracoda 0.8 715
0 0
0.8 552
0 0 1,267
Insecta 0.7 189
0.8 229
0.4 34
1 211 663
Gastropoda 0.4 35
0.1 11
0.3 34
0.3 164 244
Collembola 0.4 12
0.4 22
0.1 4
0.3 21 59
Arachnida 0 0
0.1 4
0 0
0 0 4
Seeds
Moist soil seeds 1 19,077 1 5,639 1 12,704 1 10,395 47,815
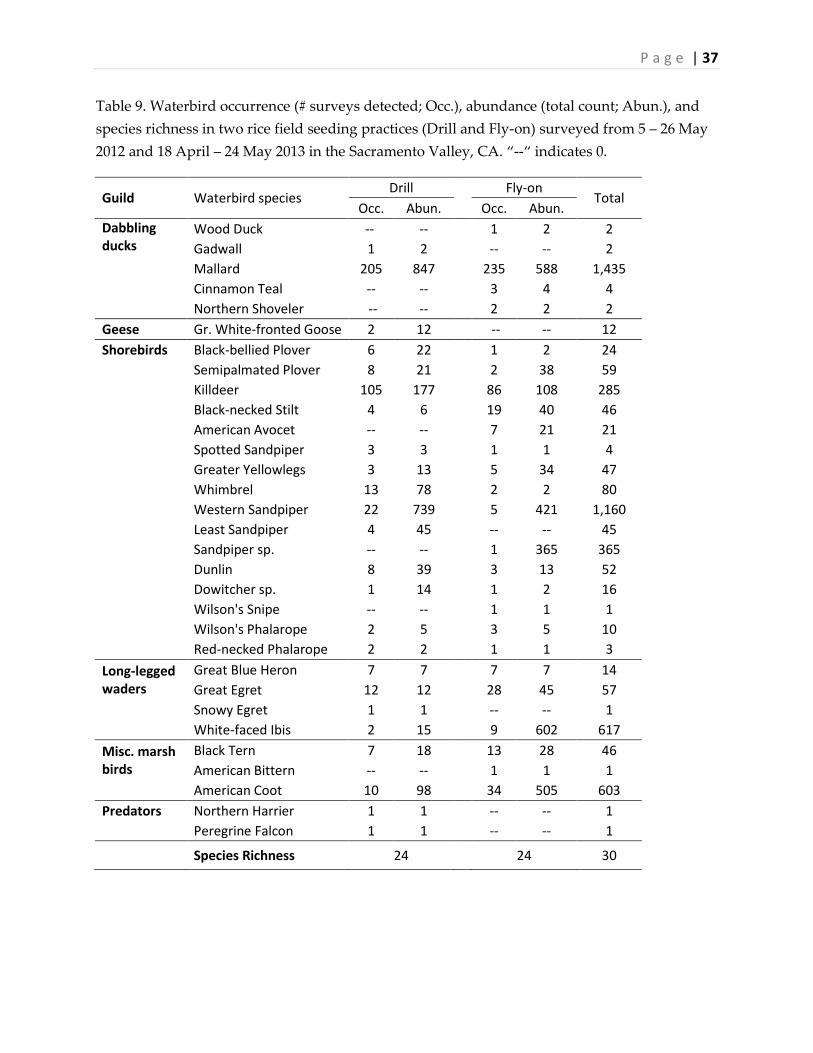
P a g e | 37
Table 9. Waterbird occurrence (# surveys detected; Occ.), abundance (total count; Abun.), and
species richness in two rice field seeding practices (Drill and Fly-on) surveyed from 5 – 26 May
2012 and 18 April – 24 May 2013 in the Sacramento Valley, CA. “--“ indicates 0.
Guild Waterbird species Drill Fly-on
Total Occ. Abun. Occ. Abun.
Dabbling ducks
Wood Duck -- -- 1 2 2
Gadwall 1 2
-- -- 2
Mallard 205 847
235 588 1,435
Cinnamon Teal -- --
3 4 4
Northern Shoveler -- -- 2 2 2
Geese Gr. White-fronted Goose 2 12 -- -- 12
Shorebirds Black-bellied Plover 6 22 1 2 24
Semipalmated Plover 8 21
2 38 59
Killdeer 105 177
86 108 285
Black-necked Stilt 4 6
19 40 46
American Avocet -- --
7 21 21
Spotted Sandpiper 3 3
1 1 4
Greater Yellowlegs 3 13
5 34 47
Whimbrel 13 78
2 2 80
Western Sandpiper 22 739
5 421 1,160
Least Sandpiper 4 45
-- -- 45
Sandpiper sp. -- --
1 365 365
Dunlin 8 39
3 13 52
Dowitcher sp. 1 14
1 2 16
Wilson's Snipe -- --
1 1 1
Wilson's Phalarope 2 5
3 5 10
Red-necked Phalarope 2 2 1 1 3
Long-legged waders
Great Blue Heron 7 7 7 7 14
Great Egret 12 12
28 45 57
Snowy Egret 1 1
-- -- 1
White-faced Ibis 2 15 9 602 617
Misc. marsh birds
Black Tern 7 18
13 28 46
American Bittern -- --
1 1 1
American Coot 10 98
34 505 603
Predators Northern Harrier 1 1 -- -- 1
Peregrine Falcon 1 1 -- -- 1
Species Richness 24 24 30

P a g e | 38
Table 10. Summary of models evaluating mechanisms influencing waterbird use of two rice field seeding practices, surveyed from 5
– 26 May 2012 and 18 April – 24 May 2013 in the Sacramento Valley, CA. In addition to covariates listed, all models included an
intercept, an overdispersion parameter, and a zero-inflation parameter.
Guild Model /Covariate AIC1 DeltaAIC2 LL3 K4 Estimate5 95%Low6 95%Up7
Dabbling ducks
Dry8 1744.18 0.00 -867.09 5 -1.60 -2.30 -0.90
Flood9 1753.30 9.12 -871.65 5 0.79 0.30 1.27
Intercept10 1761.69 17.51 -877.84 3
Saturated11 1762.68 18.50 -876.34 5 -0.41 -1.52 0.71
Moist12 1763.17 18.99 -876.58 5 0.10 -1.34 1.54
Shorebirds
Dry8 1421.68 0.00 -705.84 5 -3.34 -4.64 -2.04
Saturated11 1431.99 10.31 -711.00 5 4.53 1.41 7.65
Flood9 1435.92 14.24 -712.96 5 1.39 0.25 2.53
Moist12 1439.39 17.71 -714.69 5 -1.91 -4.51 0.68
Intercept10 1460.87 39.19 -727.43 3 1Akaike’s Information Criterion;
2difference from model with lowest AIC;
3log likelihood;
4number of parameters in model;
5parameter estimate for model covariate;
6lower 95% confidence bound;
7upper 95% confidence bound;
8proportion of survey area
that was dry; 9proportion of survey area that was flooded;
10intercept-only model;
11proportion of survey area that was saturated;
12proportion of survey area that was moist.

P a g e | 39
Figure 1. Participating rice farms in the Sacramento Valley, CA. All farms were included in
waterbird surveys and a subset of farms was sampled for waste rice and invertebrates and
seeds.

P a g e | 40
Figure 2. Mean waterbird density (birds/ha) and 95% confidence intervals in four post-harvest
rice field practices, BF (baled/flooded), BNF (baled/non-flooded), NBF (non-baled/flooded), and
NBNF (non-baled /non-flooded) surveyed from 2 December 2011 – 27 January 2012 (Year 1) and
3 December 2012 – 25 January 2013 (Year 2) in the Sacramento Valley, CA.
Dabbling ducks
Geese
Shorebirds

P a g e | 41
Figure 3. Distribution of observed paddy characteristics in four post-harvest rice practices, BF (baled/flooded), BNF (baled/non-
flood), NBF (non-baled/flooded), and NBNF (non-baled /non-flooded), surveyed from 2 December 2011 – 27 January 2012 and 3
December 2012 – 25 January 2013 in the Sacramento Valley, CA.

P a g e | 42
Figure 4. Mean invertebrate density (count/m2) and 95% confidence intervals in four post-
harvest rice field practices, BF (baled/flooded), BNF (baled/non-flood), NBF (non-
baled/flooded), and NBNF (non-baled /non-flooded) sampled in December 2011 and 2012 in the
Sacramento Valley, CA.

P a g e | 43
Figure 5. Mean waterbird density (birds/ha) and 95% confidence intervals in two seeding
practices, drill and fly-on seeding from surveys conducted from 5 – 26 May 2012 (Year 1) and 18
April – 24 May 2013 (Year 2) in the Sacramento Valley, CA.
Dabbling ducks (April & May)
Shorebirds (April & May)
Shorebirds (May only)
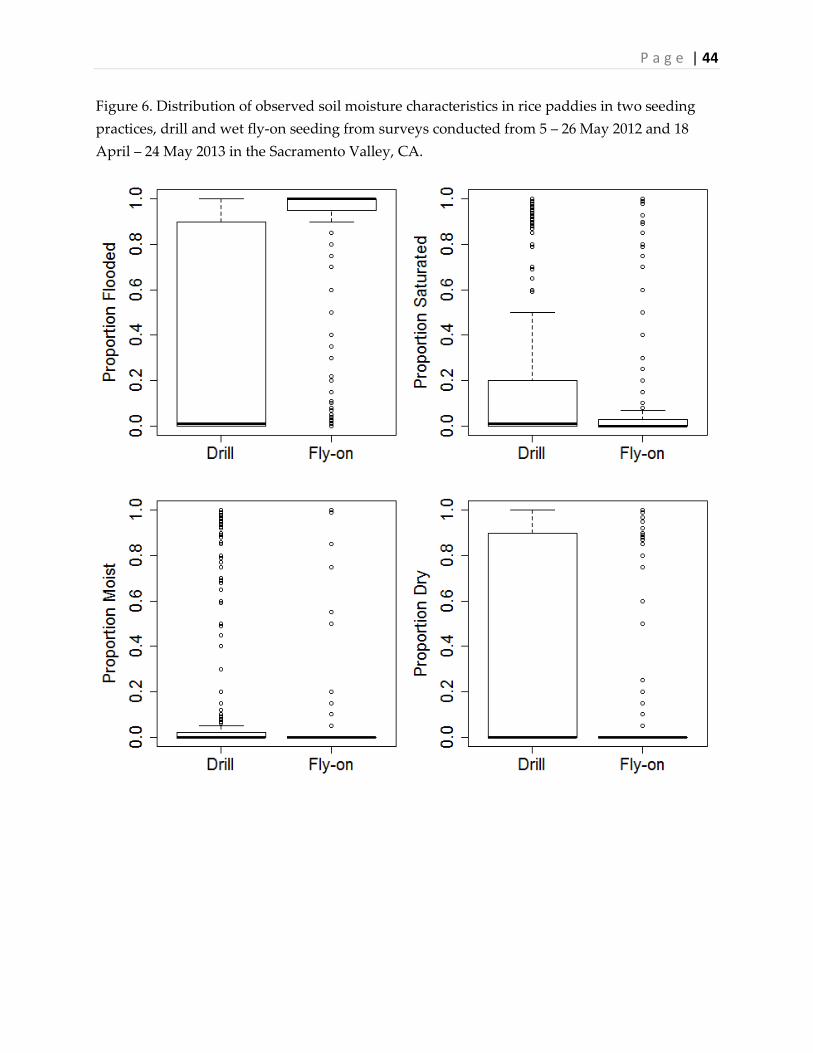
P a g e | 44
Figure 6. Distribution of observed soil moisture characteristics in rice paddies in two seeding
practices, drill and wet fly-on seeding from surveys conducted from 5 – 26 May 2012 and 18
April – 24 May 2013 in the Sacramento Valley, CA.

P a g e | 45
Appendix A. List of all species detected during surveys in rice fields during the post-harvest
and seeding studies in the Sacramento Valley, CA.
Common Name Scientific Name
Common Name Scientific Name
Gr. White-fronted Goose Anser albifrons
Sandhill Crane Grus canadensis
Mixed Goose Anser/Chen/Branta
Black-bellied Plover Pluvialis squatarola
Snow Goose Chen caerulescens
Semipalmated Plover Charadrius semipalmatus
Ross's Goose Chen rossii
Killdeer Charadrius vociferus
Canada Goose Branta canadensis
Black-necked Stilt Himantopus mexicanus
Tundra Swan Cygnus columbianus
American Avocet Recurvirostra americana
Wood Duck Aix sponsa
Greater Yellowlegs Tringa melanoleuca
Gadwall Anas strepera
Lesser Yellowlegs Tringa flavipes
Eurasian Wigeon Anas penelope
Whimbrel Numenius phaeopus
American Wigeon Anas americana
Long-billed Curlew Numenius americanus
Mallard Anas platyrhynchos
Sanderling Calidris alba
Cinnamon Teal Anas cyanoptera
Western Sandpiper Calidris mauri
Northern Shoveler Anas clypeata
Least Sandpiper Calidris minutilla
Northern Pintail Anas acuta
Western/Least Sandpiper Calidris mauri/minutilla
Green-winged Teal Anas crecca
Dunlin Calidris alpina
Unknown Duck Anatidae
Long-billed Dowitcher Limnodromus scolopaceus
Canvasback Aythya valisineria
Unknown Dowitcher Limnodromus sp.
Ring-necked Pheasant Phasianus colchicus
Wilson's Snipe Gallinago delicata
Pied-billed Grebe Podilymbus podiceps
Wilson's Phalarope Phalaropus tricolor
American Bittern Botaurus lentiginosus
Red-necked Phalarope Phalaropus lobatus
Great Blue Heron Ardea herodias
Ring-billed Gull Larus delawarensis
Great Egret Ardea alba
California Gull Larus californicus
Snowy Egret Egretta thula
Herring Gull Larus argentus
Green Heron Butorides virescens
Black Tern Chlidonias niger
White-faced Ibis Plegadis chihi
Mourning Dove Zenaida macroura
Turkey Vulture Cathartes aura
Great Horned Owl Bubo virginianus
White-tailed Kite Elanus leucurus
Short-eared Owl Asio flammeus
Bald Eagle Haliaeetus leucocephalus
Black Phoebe Sayornis nigricans
Northern Harrier Circus cyaneus
Western Kingbird Tyrannus verticalis
Sharp-shinned Hawk Accipiter striatus
Loggerhead Shrike Lanius ludovicianus
Cooper's Hawk Accipiter cooperii
American Crow Corvus brachyrhynchos
Unknown Accipiter sp. Accipiter sp.
Common Raven Corvus corax
Red-shouldered Hawk Buteo lineatus
Horned Lark Eremophila alpestris
Red-tailed Hawk Buteo jamaicensis
Tree Swallow Tachycineta bicolor
Rough-Legged Hawk Buteo lagopus
Violet-green Swallow Tachycineta thalassina
American Kestrel Falco sparverius
Bank Swallow Riparia riparia
Merlin Falco columbarius
Cliff Swallow Petrochelidon pyrrhonota
Peregrine Falcon Falco peregrinus
Barn Swallow Hirundo rustica
Prairie Falcon Falco mexicanus
Marsh Wren Cistothorus palustris
Unknown Hawk Accipitridae
Red-winged Blackbird Agelaius phoeniceus
American Coot Fulica americana
Tricolored Blackbird Agelaius tricolor
Related Documents