1 STUDY REPORT ON AGRICULTURAL PILOT PROJECT THAT RESPONDS TO CLIMATE CHANGE IN SVAY RIENG

Welcome message from author
This document is posted to help you gain knowledge. Please leave a comment to let me know what you think about it! Share it to your friends and learn new things together.
Transcript
1
STUDY REPORT ON
AGRICULTURAL PILOT PROJECT
THAT RESPONDS TO CLIMATE CHANGE
IN SVAY RIENG
2
Contents
1 Executive summary .................................................................................................... 4
2 Introduction ............................................................................................................... 5
2.1 Background of the study ................................................................................................ 5
2.2 Objectives of the study .................................................................................................. 5
2.3 Scope and limitation of the study .................................................................................... 5
2.4 Study design and methodology ....................................................................................... 5
2.5 Questionnaires ............................................................................................................. 6
2.5 Outline of report ........................................................................................................... 7
3 Pilot project on promoting vegetable crop production through water storage and
supply system enhancement .................................................................................................. 8
3.1 Introduction to the pilot project ....................................................................................... 8
3.2 Objective of the pilot project and performance indicators .................................................... 8
3.3 Effectiveness of the introduced technology ........................................................................ 9
Area and amount of water used for vegetable cultivation: ............................................................... 9
Estimated time when water in the improved pond will dry up ........................................................ 10
Capacity of the improved pond ................................................................................................. 11
3.4 Farmers' practice and adoption ..................................................................................... 11
Use of the improved pond: ....................................................................................................... 11
Use of diesel for pumping ........................................................................................................ 11
Application of Rovei pump ........................................................................................................ 12
Cultivation practice ................................................................................................................. 12
3.5 Return on investment of the introduced technology .......................................................... 13
Income and expenditure from vegetable cultivation ..................................................................... 13
Change of net income before and after pond improvement ........................................................... 14
Invest or not invest in the new improved pond system ................................................................. 14
3.6 Gender impacts .......................................................................................................... 15
3.7 Sustainability of the interventions .................................................................................. 16
3.8 SWOT analysis of the interventions ................................................................................ 16
Strengths: ............................................................................................................................. 16
Weaknesses: ......................................................................................................................... 16
Opportunities: ........................................................................................................................ 16
Threat: 17
3.9 Measurement tool ....................................................................................................... 17
4 Pilot project on combination of plastic lining pond with Rovei pump for vegetable
cultivation ........................................................................................................................... 19
4.1 Introduction to the pilot project ..................................................................................... 19
4.2 Objective of the pilot project ......................................................................................... 19
4.3 Effectiveness of the introduced technology ...................................................................... 19
Review of the setup indicators .................................................................................................. 19
Amount of water produced by the wind-pumps ........................................................................... 20
4.4 Farmers' practice and adoption ..................................................................................... 21
4.5 Return on investment of the introduced technology .......................................................... 22
4.6 Sustainability of the interventions .................................................................................. 22
4.7 Measuring tool for rice pilot project ................................................................................ 22
3
5 Conclusion and recommendation .............................................................................. 25
6 Annex ...................................................................................................................... 27
Annex 1: Farmer’s list ............................................................................................................. 27
Annex 2: Questionnaire for rice pilot project focusing on wind-pump .............................................. 28
Annex 3: Questionnaire for vegetable pilot project focusing on improved pond and Rovei pump ......... 30
Annex 4: Terms of Reference for the study ................................................................................. 33
List of Tables:
Table 1: Distribution of recording schedule ................................................................................... 6
Table 2: Size of vegetable area and amount of water used for cultivation ........................................ 10
Table 3: Remaining capacity of the pond water for vegetable cultivation ......................................... 10
Table 4: Frequency of using Rovei pump and covered area ........................................................... 12
Table 5: Watering methods ...................................................................................................... 12
Table 6: Gross margin analysis for vegetable area of 410 square meters ........................................ 13
Table 7: Changes in net income before and after pond improvement .............................................. 14
Table 8: Cost of pond improvement ........................................................................................... 14
Table 9: Net Present Value (NPV) of investment .......................................................................... 15
Table 10: Time spent per cycle for Rovei pedalling and vegetable watering ..................................... 15
Table 11: Amount of water produced by each wind-pump ............................................................. 20
Table 12: Amount of water produced for a whole cycle of rice crop by wind-pump ............................ 21
List of figures:
Figure 1: Fluctuation of the water amount produced by each wind-pump by hour categories .............. 21
List of acronyms
CDI Cambodian Development Institute
CFAP Cambodian Farmer Association Federation of Agricultural Producers
DTW Development Technology Workshop
NPV Net Present Value
ROI Return on Investment
SNV Netherland International Development
4
1 Executive summary
A study to review the progress of two pilot projects implemented in Svay Chrum district, Svay Rieng
province by SNV Netherlands Development Organisation in cooperation with CFAP was carried out by a
consultant team from 12 December 2012 until 23 January 2013. Daily records on the amount of water
used and produced, capacity of the introduced technology to achieve the target of irrigation and the
return of investment were conducted.
A pilot project focusing on enhancing vegetable production through improved tarpaulin-lined pond and
Rovei pump was introduced to ten farmers. The project was designed to have an improved pond capable
of irrigating 1,000 square meter land, improved profitability and increase production up to 4 cycles per
year.
The result shows that the improved pond supported by the project was capable of irrigating in average
410 m2 for 4 cycles per year. This is below the target. However, the relative profitability is promising as
the relative net income increased by $144 compared to baseline situation. The achievement is likely to
be contributed by the improved productivity and the prolonged period of water availability for
production. Rovei pump is found to be convenient among female farmers as it relieved hard-work of
carrying water to irrigate the fields. However, this was not applicable among some farmers, particularly
energetic male farmers who often found it duplicating their work. Whilst, the improved techniques are
still new to all of them more time is needed for them to adapt the use. However, the time spent for both
Rovei and irrigating were found to be decreasing compared to baseline situation.
If farmers had to invest on their own cost over the improved techniques the breakeven period is likely to
be over three years. However, this is not the case when farmers invested only in tarpaulin-lined pond by
excluding Rovei pump. While profitability out of improving pond was gradually perceived by the target
farmers they would continue to practice the improved techniques, especially the improved pond. The
resulted profitability will lead adaptation among farmers to be resilient to climate change though the real
causes are still vague among them.
Adoption varies among farmers and in accordance with specific households' endowment. Farmers with
constraints in family labour would still continue to practice pumping machine. Whilst some had other
income opportunities they had to postpone the cultivation, leaving the supported materials unused
though they had already contributed and made commitment.
Rice enhancement pilot project, on the other hand is unlikely to achieve the set target either. Due to
shortage of wind in the target location both wind-pump could not produce enough water to irrigate even
a hectare of paddy field. By simulation, the total amount of water produced by a wind-pump was about
4,000 cubic meters while, in the target areas the required amount of water to produce short-term rice
varieties is about 14,000 cubic meters. Wind-pump is still too new to the farmers to place their
confidence. Some of the target farmers who were cultivating rice crop had still to use pumping machines
to help irrigating their crop in addition to the wind-pump. About 20 to 30 litres had been used for
pumping.
5
2 Introduction
2.1 Background of the study
SNV Netherland Development Organization has expanded its operation since 2009 to focus on water,
sanitation and hygiene; and smallholder cash crops, which is called Agriculture and Forest Product (AFP), in
addition to the previous two sectors of renewable energy and pro-poor sustainable tourism in the North East
Cambodia. In the new sectors, SNV has been working to explore options of mainstreaming climate change
adaptation in the agriculture sector and has piloted two sub-projects in Svay Chrum district, Svay Rieng
province. These two pilot projects are "promoting vegetable crop production through water storage and
supply system enhancement" and "rice production enhancement through wind-pump water supply system".
Both projects are expected to support farmers to produce additional crop cycles during the dry-season,
improved profitability, and reduce cost of fuel-based pumping and ultimately contribute to environmentally
friendly practices through reduction of underground water use and avoidance of harmful fuel combustion to
the environment.
As the climate change topic is a new priority for donors and the government, introduced by the European
Union (EU) in 2007 the information on good practices , successful projects and activities is often not publicly
available as they are often not properly recorded, disseminated, or there is limited sharing among
practitioners in Cambodia. This study is to respond to this situation while other objectives are included for
the sake of pilot project implementation.
The two pilot projects has been implemented by a local partner "Cambodia Farmer's Association Federation
of Agricultural Producers (CFAP-Cambodia) and SNV has subsidized the cost of initiating the adaptation
practices among the target farmers.
2.2 Objectives of the study
The overall objectives of this study are to:
establish the tools and techniques to measure outputs and outcomes;
Monitor and review project implementation;
Work with the famers and CFAP to measure the achievement of results to date; and
establish the methodology and assess the potential return on investment in terms of the future
impacts and cost -effectiveness of the introduced technology
2.3 Scope and limitation of the study
The study was conducted in targeted areas of Svay Rieng province by closely working with farming
households piloting the Rovei pumps and the wind-pumps. Whilst the study focuses as well on the amount of
water used for both productions the technical detailed hydraulic study was not included. No measurement
was done on the wind speed nor the evaporation and soil percolation included. Rather, the study focused on
the actual practice of the targeted farmers and used this data to simulate the result. In addition to this, no
specific technical study e.g. amount of CO2 or improved underground structure on how much the adaptation
conducted contribute to reducing climate change impact. However, the amount of diesel use that could affect
pollution to the environment would be quantified by this study.
On the other hand, in actual fieldwork some target farmers did not cultivate any crop and left the supported
structures unused these cases were excluded from the study and return on investment was not carried out
for these cases.
2.4 Study design and methodology
The study was conducted by a consultant team of three members including two field-staff to deal with day-
to-day recording and a team leader to supervise the whole work. The study methodology entails three steps
as following:
6
Step 1: Desk review of available SNV project documents:
Existing project documents were reviewed. These include (i) pilot project proposals including performance
indicators, (ii) baseline report, (iii) baseline information, and (iv) assessment report. Based on the result, a
draft of workplan and questionnaires were developed and presented to the SNV project team for comments.
A discussion meeting was held on 19th December 2012 with the project team in Phnom Penh office. The draft
questionnaire incorporated with SNV experts' comments were used for piloting in the field. CFAP has
cooperated to allow the study team to pilot the questionnaire. Final questionnaires were completed after this
field-piloting and approval from the project team.
Step 2: Data gathering
Data collection started on 25th December 2012 and last 20 days in total. Daily record on the farmers'
practices and economic transaction were included in the record.
Step 3: Data analysis and report of findings
The collected data was coded and entered into a spread sheet-based database. The data was cleaned and
used for the analysis and reporting. Reporting outline was prepared and discussed with the project team as
well.
2.5 Questionnaires
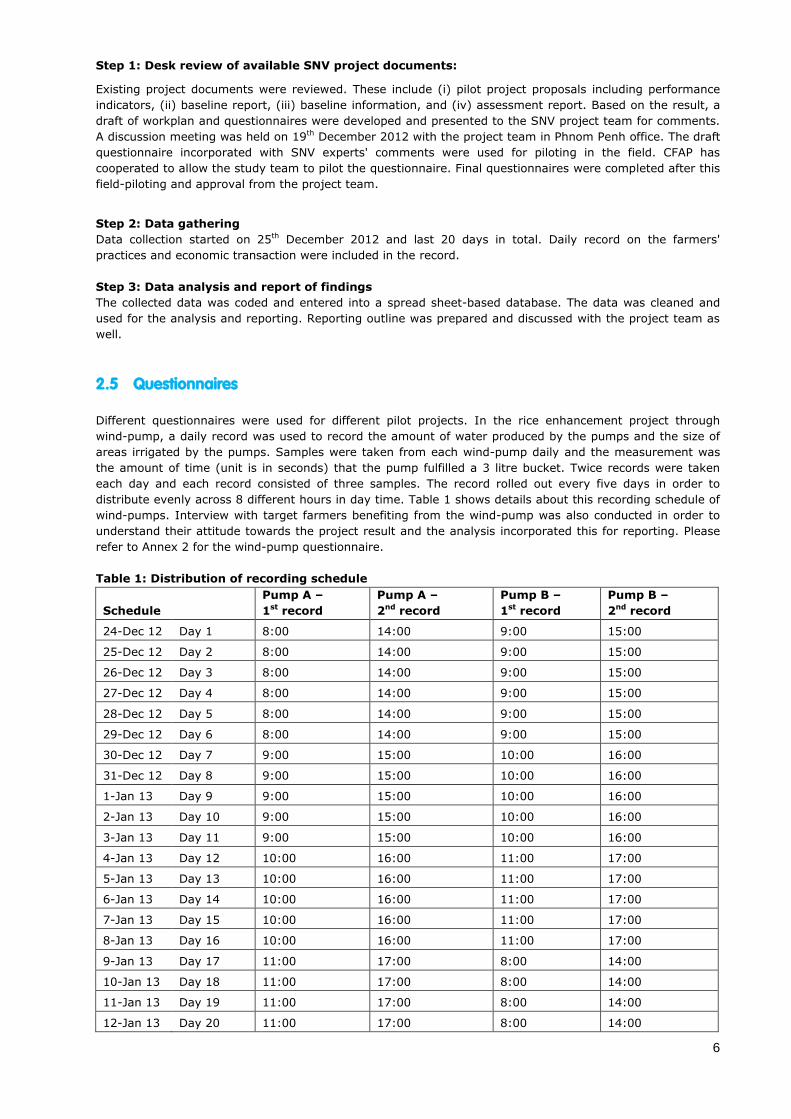
Different questionnaires were used for different pilot projects. In the rice enhancement project through
wind-pump, a daily record was used to record the amount of water produced by the pumps and the size of
areas irrigated by the pumps. Samples were taken from each wind-pump daily and the measurement was
the amount of time (unit is in seconds) that the pump fulfilled a 3 litre bucket. Twice records were taken
each day and each record consisted of three samples. The record rolled out every five days in order to
distribute evenly across 8 different hours in day time. Table 1 shows details about this recording schedule of
wind-pumps. Interview with target farmers benefiting from the wind-pump was also conducted in order to
understand their attitude towards the project result and the analysis incorporated this for reporting. Please
refer to Annex 2 for the wind-pump questionnaire.
Table 1: Distribution of recording schedule
Schedule
Pump A –
1st record
Pump A –
2nd record
Pump B –
1st record
Pump B –
2nd record
24-Dec 12 Day 1 8:00 14:00 9:00 15:00
25-Dec 12 Day 2 8:00 14:00 9:00 15:00
26-Dec 12 Day 3 8:00 14:00 9:00 15:00
27-Dec 12 Day 4 8:00 14:00 9:00 15:00
28-Dec 12 Day 5 8:00 14:00 9:00 15:00
29-Dec 12 Day 6 8:00 14:00 9:00 15:00
30-Dec 12 Day 7 9:00 15:00 10:00 16:00
31-Dec 12 Day 8 9:00 15:00 10:00 16:00
1-Jan 13 Day 9 9:00 15:00 10:00 16:00
2-Jan 13 Day 10 9:00 15:00 10:00 16:00
3-Jan 13 Day 11 9:00 15:00 10:00 16:00
4-Jan 13 Day 12 10:00 16:00 11:00 17:00
5-Jan 13 Day 13 10:00 16:00 11:00 17:00
6-Jan 13 Day 14 10:00 16:00 11:00 17:00
7-Jan 13 Day 15 10:00 16:00 11:00 17:00
8-Jan 13 Day 16 10:00 16:00 11:00 17:00
9-Jan 13 Day 17 11:00 17:00 8:00 14:00
10-Jan 13 Day 18 11:00 17:00 8:00 14:00
11-Jan 13 Day 19 11:00 17:00 8:00 14:00
12-Jan 13 Day 20 11:00 17:00 8:00 14:00
7
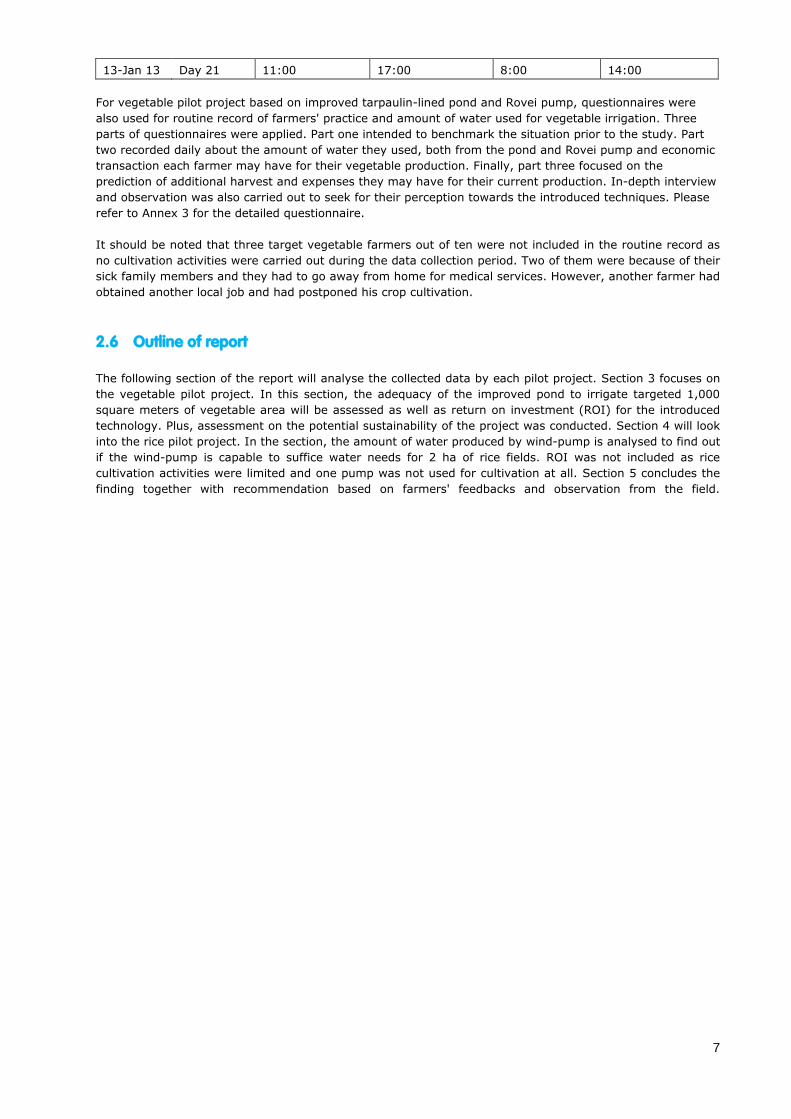
13-Jan 13 Day 21 11:00 17:00 8:00 14:00
For vegetable pilot project based on improved tarpaulin-lined pond and Rovei pump, questionnaires were
also used for routine record of farmers' practice and amount of water used for vegetable irrigation. Three
parts of questionnaires were applied. Part one intended to benchmark the situation prior to the study. Part
two recorded daily about the amount of water they used, both from the pond and Rovei pump and economic
transaction each farmer may have for their vegetable production. Finally, part three focused on the
prediction of additional harvest and expenses they may have for their current production. In-depth interview
and observation was also carried out to seek for their perception towards the introduced techniques. Please
refer to Annex 3 for the detailed questionnaire.
It should be noted that three target vegetable farmers out of ten were not included in the routine record as
no cultivation activities were carried out during the data collection period. Two of them were because of their
sick family members and they had to go away from home for medical services. However, another farmer had
obtained another local job and had postponed his crop cultivation.
2.6 Outline of report
The following section of the report will analyse the collected data by each pilot project. Section 3 focuses on
the vegetable pilot project. In this section, the adequacy of the improved pond to irrigate targeted 1,000
square meters of vegetable area will be assessed as well as return on investment (ROI) for the introduced
technology. Plus, assessment on the potential sustainability of the project was conducted. Section 4 will look
into the rice pilot project. In the section, the amount of water produced by wind-pump is analysed to find out
if the wind-pump is capable to suffice water needs for 2 ha of rice fields. ROI was not included as rice
cultivation activities were limited and one pump was not used for cultivation at all. Section 5 concludes the
finding together with recommendation based on farmers' feedbacks and observation from the field.
8
3 Pilot project on promoting vegetable crop production
through water storage and supply system enhancement
3.1 Introduction to the pilot project
In respond to climate change adaptation, SNV has designed and implemented a pilot project that introduces
a new engineering model for water storage in Svay Chrum district, Svay Rieng province. The initiative model
was a type of rain water harvesting techniques (RWH) by using plastic lining pond with Rovei pump to
address water availability for vegetable production in the target areas. The model was designed by climate
change consultant based on the current sectorial and provincial agriculture situation assessment conducted
during project designed. The overall purpose of the pilot project is dealing with climate risk and variation.
This new model is believed to play important role in increasing water available for local farmers and reduce
production cost from diesel-based pumping. However, the success of application among farmers is yet fully
known.
The model design set up a 130 cubic meter pond lined with a tarpaulin sheet to reduce water percolation into
the soil and a manually operated Rovei pump connected with the pond is the way to reduce farmer carry
water to irrigate crop and to facilitate farmers on the use of this appropriate technology. The pond size is
10m x 5m for the bottom part and 12m x 7 m for the upper surface with 2 meter height. The design is
expected to support around 1,000 square meter vegetable land for 2cycles crop cultivation during dry
season and additional 2 more cycle during wet season, totally 4 cycles per year.
Ten vegetable farming households were selected based on agreed criteria. The beneficiary selection was
done under cooperation between SNV and the Cambodian Farmer's Association Federation of Agricultural
Producers (CFAP – Cambodia) as the contracting partner to implementing the project. As the result 10
farmers were able to assist and achieved the set result in the project proposal and equipped all input like:
pond was improved, tarpaulin was equipped and the Rovai pump installed. However, during the study there
were only 7 farmers practiced vegetable cultivation by using the introduced facilities and the other 3 farmers
did not on various reasons, since the activity just completed recent week before conducting study and it
overlapping the rice harvesting season and illness like farmer Orn Ratha from Trabek village and Tey Sarin
from Pothireach village were impacted by sick family members and they had to go to Vietnam and Phnom
Penh for medical treatment. Whilst farmer Pheuk Sawath did not start cultivate vegetable yet during study.
Therefore, the analysis was carried out among only the 7 farmers.
3.2 Objective of the pilot project and performance indicators
With the above mentioned attempt the pilot project was designed with its objective to enhance vegetable
production for year round by using appropriate water storage, supply system and reducing farmer expenses
for diesel use to irrigate crops and improving farming household income.
The following performance indicators were set up to measure the achievement:
4 crop cycles per year will be implemented by using quick growing crop species and market demand
vegetable varieties (3cycles in dry season and additional one cycle in wet season);
10 plastic lining ponds will be developed. Each pond has water storage capacity of around 130m3;
Farmers will have water to irrigate crops until the end of dry season (April);
Increase farmer net income at least US$400 per year generated from 1000 m2 cultivated land;
Deduct farmer’s expenses for diesel use to pump water at least US$240/year;
Develop tools to measure the project output and outcome
The following study findings will address these indicators.
9
3.3 Effectiveness of the introduced technology
Routine record on farmers' use of water from the improved pond is conducted in order to measure the
amount of water needed for their vegetable production and unintended water use during this study. The
project introduced the 130 cubic meter pond that collect water from rainfall and being lined with a tarpaulin
sheet in an attempt to cover vegetable production capacity of 1,000 m2 for 4 cycles per year (2cycles in dry
season and additional 2 cycles in wet season). The following analysis intends to address this attempt.
The finding is based on actual practices of 7 farmer beneficiaries by looking into the amount of water used
for their specific size of vegetable areas they cultivated during the period of data collection (which is 18
days). The result is also cross tabulated to measure the water availability and use to irrigate their crops.
Area and amount of water used for vegetable cultivation:
Ten farmers were selected through facilitation of CFAP to participate in the pilot project. As the water
reservoir was constructed during the wet season, this makes all developed ponds able to harvest water
properly and all 100% of ponds have full water capacity during study period (based on the study result). We
noticed that because this year dry season had just started in recent week before conducting the study, only
7 farmers properly started vegetable cultivation by using the equipped pond provided by the project.
However, three farmers as mentioned earlier have not yet started vegetable cultivation activities since they
have had health problems. There are seven farmers to be subjects for the study. Due to the fact that
farmers highly value water in their everyday life and for their crops some farmers tried to collect additional
water from outside sources to fill in their ponds. The additional amount of water into the improved pond was
factored into the calculation of water used for vegetables. The frequency of pumping water from outsources
to fill into the pond before the study period was found with an average of 2 hours per time and capacity
produced around 15 cubic meters.
In average, farmers used water from the improved pond to cultivate about 410 m2 of vegetable (Table 2).
This figure does not indicate the actual size of accessible vegetable land among the beneficiaries. The actual
accessible vegetable land among them is larger than this. The reason is that some farmers wish to test the
capacity of the improved pond for his vegetable production e.g. farmer named Ros Ny in Veal Langeut
village. Whilst some farmers just could not cope with production of the whole areas and they needed to roll
out their cultivation continuously.
Prior to data collection, the 5 target farmers had already used water in the improved ponds for their
vegetable production by using Rovei pump regularly, whilst 2 farmers still irregular use the Rovai pump yet.
The average depth of available water prior to data collection was about 1.66 meters, equivalent of about 111
cubic meters of water volume. By measuring the depth of water before and after the period of data collection
the target beneficiaries have used water in average about 22 cubic meters for the above mentioned for 410
square meter vegetable land areas (Table 2). The amount water used is in equivalence of approximately
1.32 cubic meters for daily watering onto the areas. It should be noted that during the data collection period
the vegetable cultivation of different farmers were at different stage of production. Some farmers had
already cultivated their vegetables up to harvest period that they could sell for daily income on an extended
period and some were still in either sowing seeds period or vegetative period that could not yet be sold. In
addition, different farmers also practiced different frequency and methods of watering. Some did water
everyday and some did on a regular interval. In this regard, the resulted amount of water used for
cultivation presented earlier was the rough estimated result across different stage of vegetable production
and different pattern of watering frequency.
Based on simple calculation of a 45 days-cycle of vegetable production for ordinary and leaves vegetable
was used as the basic for the water used calculation, the required amount of water to grow vegetable on 410
square meters until complete harvest is about 59 cubic meters. This means that they will need at least about
145 cubic meter to grow vegetable on 1,000 square meter per cycle. Whilst the full capacity of the improved
pond is only 130 cubic meters the project intention to cover 1,000 square meters for 4 cycles is unlikely to
be achieved. However, due to wet season the pond is easily to harvesting water any time rainfall, so the
amount of water would fill up anytime have rain during wet season. This factor make the pond can increase
potential water and irrigation capacity to meet their requirement of 1000 square meters if farmer committed
to expansion cultivation capacity.
10
The amount of water largely varies depending on cultivation practice, types of crops and the need to use
water for other purposes rather than vegetable production. Two farmers out seven cultivated their vegetable
including radish, Chinese cabbage, gourd without laying plastic mulch whilst the other five grew yard long
bean and cucumber by laying plastic mulch onto the rows. Such mulching practices are technically known as
contributing to reducing water needed for vegetables. This is so because plastic mulch reduces hydration in
the soil and also absorbs sunlight to disable weeds to grow in the vegetable rows.
As part of the project design, farmers agreed to use water from the pond to water vegetable production
only. But during study we notice that some farmers used water for both vegetable crops cultivation and
unintended activities support for their daily livelihood. Four farmers out of seven farmers have perceived the
potentials of fish-raising as subsidiary source of food for their families, along with the vegetable cultivation.
Others also used water for their livestock and of course emergency needs, for instance social safeguarding
against drought or fire. Though this is unintended by the project design and while the field staff tried to
encourage them not to do so and as water elsewhere became scarce, water in the pond was the only source
that they could easily access to and nearest to fetch especially for their cattle and livestock. This is particular
for those who are located far from main water sources e.g. stream or lake. The situation is inevitable during
the water scarce season and farmers' strategy to allocate the available water for different purposes was
immediately opted rather than considering about comparative advantages over vegetable production and
this ultimately contribute to their livelihood improvement resulted from the improved pond storage.
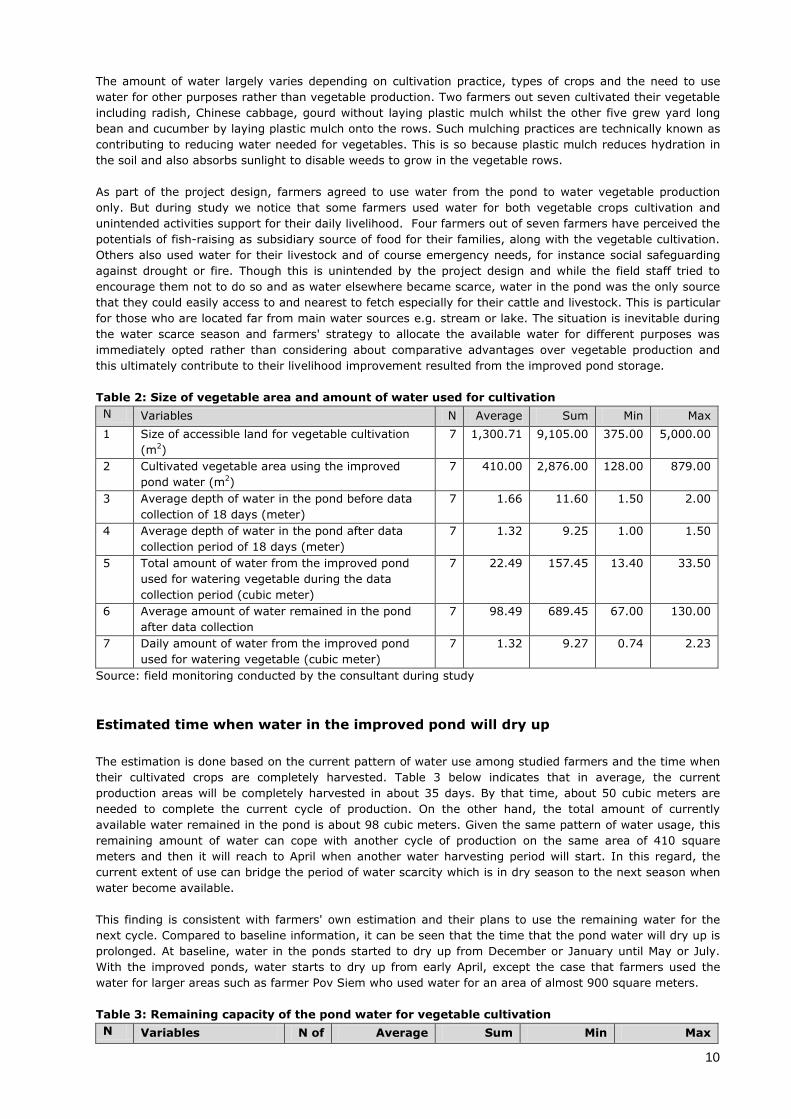
Table 2: Size of vegetable area and amount of water used for cultivation
N Variables N Average Sum Min Max
1 Size of accessible land for vegetable cultivation
(m2)
7 1,300.71 9,105.00 375.00 5,000.00
2 Cultivated vegetable area using the improved
pond water (m2)
7 410.00 2,876.00 128.00 879.00
3 Average depth of water in the pond before data
collection of 18 days (meter)
7 1.66 11.60 1.50 2.00
4 Average depth of water in the pond after data
collection period of 18 days (meter)
7 1.32 9.25 1.00 1.50
5 Total amount of water from the improved pond
used for watering vegetable during the data
collection period (cubic meter)
7 22.49 157.45 13.40 33.50
6 Average amount of water remained in the pond
after data collection
7 98.49 689.45 67.00 130.00
7 Daily amount of water from the improved pond
used for watering vegetable (cubic meter)
7 1.32 9.27 0.74 2.23
Source: field monitoring conducted by the consultant during study
Estimated time when water in the improved pond will dry up
The estimation is done based on the current pattern of water use among studied farmers and the time when
their cultivated crops are completely harvested. Table 3 below indicates that in average, the current
production areas will be completely harvested in about 35 days. By that time, about 50 cubic meters are
needed to complete the current cycle of production. On the other hand, the total amount of currently
available water remained in the pond is about 98 cubic meters. Given the same pattern of water usage, this
remaining amount of water can cope with another cycle of production on the same area of 410 square
meters and then it will reach to April when another water harvesting period will start. In this regard, the
current extent of use can bridge the period of water scarcity which is in dry season to the next season when
water become available.
This finding is consistent with farmers' own estimation and their plans to use the remaining water for the
next cycle. Compared to baseline information, it can be seen that the time that the pond water will dry up is
prolonged. At baseline, water in the ponds started to dry up from December or January until May or July.
With the improved ponds, water starts to dry up from early April, except the case that farmers used the
water for larger areas such as farmer Pov Siem who used water for an area of almost 900 square meters.
Table 3: Remaining capacity of the pond water for vegetable cultivation
N Variables N of Average Sum Min Max
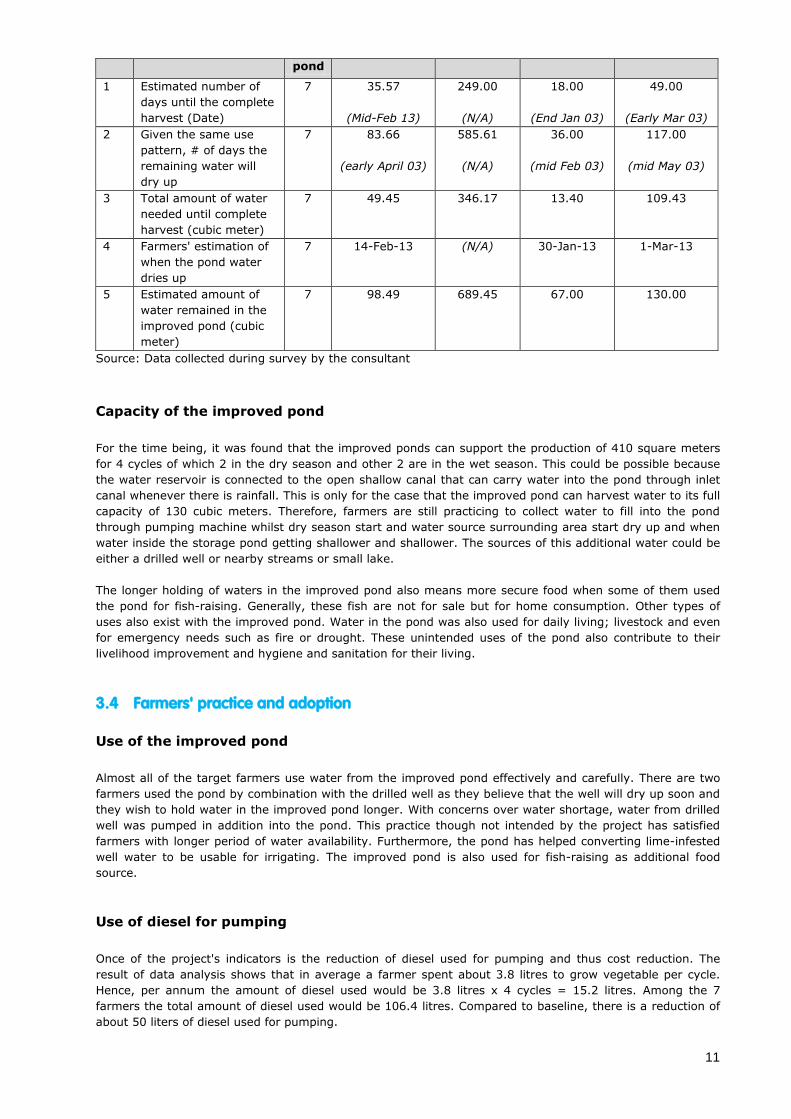
11
pond
1 Estimated number of
days until the complete
harvest (Date)
7 35.57
(Mid-Feb 13)
249.00
(N/A)
18.00
(End Jan 03)
49.00
(Early Mar 03)
2 Given the same use
pattern, # of days the
remaining water will
dry up
7 83.66
(early April 03)
585.61
(N/A)
36.00
(mid Feb 03)
117.00
(mid May 03)
3 Total amount of water
needed until complete
harvest (cubic meter)
7 49.45 346.17 13.40 109.43
4 Farmers' estimation of
when the pond water
dries up
7 14-Feb-13 (N/A) 30-Jan-13 1-Mar-13
5 Estimated amount of
water remained in the
improved pond (cubic
meter)
7 98.49 689.45 67.00 130.00
Source: Data collected during survey by the consultant
Capacity of the improved pond
For the time being, it was found that the improved ponds can support the production of 410 square meters
for 4 cycles of which 2 in the dry season and other 2 are in the wet season. This could be possible because
the water reservoir is connected to the open shallow canal that can carry water into the pond through inlet
canal whenever there is rainfall. This is only for the case that the improved pond can harvest water to its full
capacity of 130 cubic meters. Therefore, farmers are still practicing to collect water to fill into the pond
through pumping machine whilst dry season start and water source surrounding area start dry up and when
water inside the storage pond getting shallower and shallower. The sources of this additional water could be
either a drilled well or nearby streams or small lake.
The longer holding of waters in the improved pond also means more secure food when some of them used
the pond for fish-raising. Generally, these fish are not for sale but for home consumption. Other types of
uses also exist with the improved pond. Water in the pond was also used for daily living; livestock and even
for emergency needs such as fire or drought. These unintended uses of the pond also contribute to their
livelihood improvement and hygiene and sanitation for their living.
3.4 Farmers' practice and adoption
Use of the improved pond
Almost all of the target farmers use water from the improved pond effectively and carefully. There are two
farmers used the pond by combination with the drilled well as they believe that the well will dry up soon and
they wish to hold water in the improved pond longer. With concerns over water shortage, water from drilled
well was pumped in addition into the pond. This practice though not intended by the project has satisfied
farmers with longer period of water availability. Furthermore, the pond has helped converting lime-infested
well water to be usable for irrigating. The improved pond is also used for fish-raising as additional food
source.
Use of diesel for pumping
Once of the project's indicators is the reduction of diesel used for pumping and thus cost reduction. The
result of data analysis shows that in average a farmer spent about 3.8 litres to grow vegetable per cycle.
Hence, per annum the amount of diesel used would be 3.8 litres x 4 cycles = 15.2 litres. Among the 7
farmers the total amount of diesel used would be 106.4 litres. Compared to baseline, there is a reduction of
about 50 liters of diesel used for pumping.
12
Application of Rovei pump
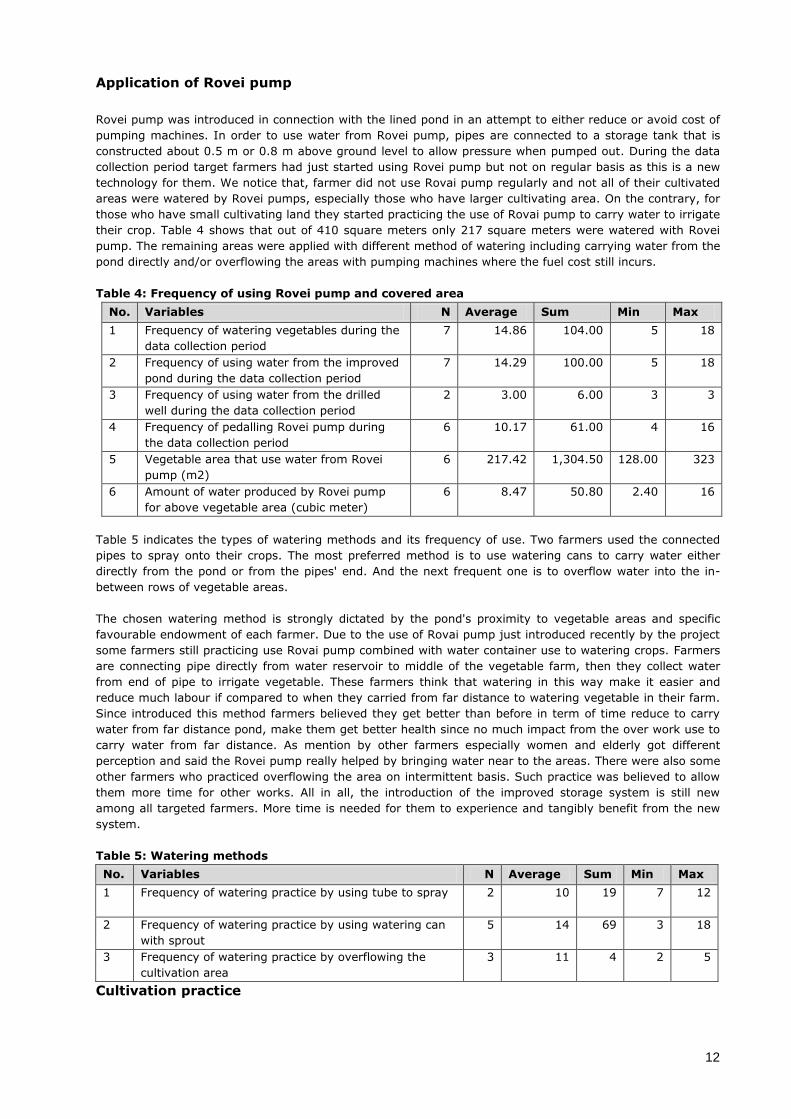
Rovei pump was introduced in connection with the lined pond in an attempt to either reduce or avoid cost of
pumping machines. In order to use water from Rovei pump, pipes are connected to a storage tank that is
constructed about 0.5 m or 0.8 m above ground level to allow pressure when pumped out. During the data
collection period target farmers had just started using Rovei pump but not on regular basis as this is a new
technology for them. We notice that, farmer did not use Rovai pump regularly and not all of their cultivated
areas were watered by Rovei pumps, especially those who have larger cultivating area. On the contrary, for
those who have small cultivating land they started practicing the use of Rovai pump to carry water to irrigate
their crop. Table 4 shows that out of 410 square meters only 217 square meters were watered with Rovei
pump. The remaining areas were applied with different method of watering including carrying water from the
pond directly and/or overflowing the areas with pumping machines where the fuel cost still incurs.
Table 4: Frequency of using Rovei pump and covered area
No. Variables N Average Sum Min Max
1 Frequency of watering vegetables during the
data collection period
7 14.86
104.00
5
18
2 Frequency of using water from the improved
pond during the data collection period
7 14.29
100.00
5
18
3 Frequency of using water from the drilled
well during the data collection period
2 3.00
6.00
3
3
4 Frequency of pedalling Rovei pump during
the data collection period
6 10.17
61.00
4
16
5 Vegetable area that use water from Rovei
pump (m2)
6 217.42
1,304.50 128.00
323
6 Amount of water produced by Rovei pump
for above vegetable area (cubic meter)
6 8.47
50.80
2.40
16
Table 5 indicates the types of watering methods and its frequency of use. Two farmers used the connected
pipes to spray onto their crops. The most preferred method is to use watering cans to carry water either
directly from the pond or from the pipes' end. And the next frequent one is to overflow water into the in-
between rows of vegetable areas.
The chosen watering method is strongly dictated by the pond's proximity to vegetable areas and specific
favourable endowment of each farmer. Due to the use of Rovai pump just introduced recently by the project
some farmers still practicing use Rovai pump combined with water container use to watering crops. Farmers
are connecting pipe directly from water reservoir to middle of the vegetable farm, then they collect water
from end of pipe to irrigate vegetable. These farmers think that watering in this way make it easier and
reduce much labour if compared to when they carried from far distance to watering vegetable in their farm.
Since introduced this method farmers believed they get better than before in term of time reduce to carry
water from far distance pond, make them get better health since no much impact from the over work use to
carry water from far distance. As mention by other farmers especially women and elderly got different
perception and said the Rovei pump really helped by bringing water near to the areas. There were also some
other farmers who practiced overflowing the area on intermittent basis. Such practice was believed to allow
them more time for other works. All in all, the introduction of the improved storage system is still new
among all targeted farmers. More time is needed for them to experience and tangibly benefit from the new
system.
Table 5: Watering methods
No. Variables N Average Sum Min Max
1 Frequency of watering practice by using tube to spray 2 10
19
7
12
2 Frequency of watering practice by using watering can
with sprout
5 14
69
3
18
3 Frequency of watering practice by overflowing the
cultivation area
3 11
4
2 5
Cultivation practice
13
Most farmers cultivated fruit-based vegetables of short time varieties which is 45 days. The preferred crops
are cucumber, yard long bean, and radish. Some of them also grew mustard green, Chinese cabbage, and
onion leaf. Remarkably, plastic mulching was used for cucumber and yard long bean. This is a good practice
as such mulching help reduce the amount of water needed for the crop. Certified seeds were used and
bought from nearby market rather than retaining on their own. Trellis was also used for yard long bean and
cucumber. Despite these improved practices, more improvement is still needed to improve the production.
Farmers need to understand that plastic mulch needs to be firmly tucked into the soil and not leave it loosely
laid over the rows. Trellis should be tight and higher to allow more branch to grow so that more fruits can
come out.
3.5 Return on investment of the introduced technology
Analysis on Return on Investment (ROI) will start from gross margin analysis of the current vegetable
production. Then, assessment on whether the investment on improved pond is worth taking by farmers will
be done based on the result of Net Present Value of the investment (NPV). Finally, the time to break even
with the investment is included.
Data on income and expenditure among target farmers was recorded on regular basis by the field staff. As
the final harvest was not yet completed the prediction of additional income and expense for the current
production was done based on farmers' own assessment. Then, the data was amalgamated for analysis of
the whole production areas. Two outliers were spotted as their cultivation practice and management were
exceptional compared to others. One farmer named Pov Siem always used electricity-based pumping
machine to irrigate his crops through overflowing. The cost of using this machine is found to be too high and
not common among the others. He himself also acknowledged this huge loss but said no choice because he
is too old and sick and could not carry water to spray his crops. Another case is Mr. Ros Ny whose radish
crop is too early to be assessed. Hence, these two cases were excluded from the analysis. In addition, fixed
cost incurred from pond improvement (both SNV supported and own contribution) is not included in the
gross margin analysis for the production either but this will be included in NPV calculation and break-even
analysis.
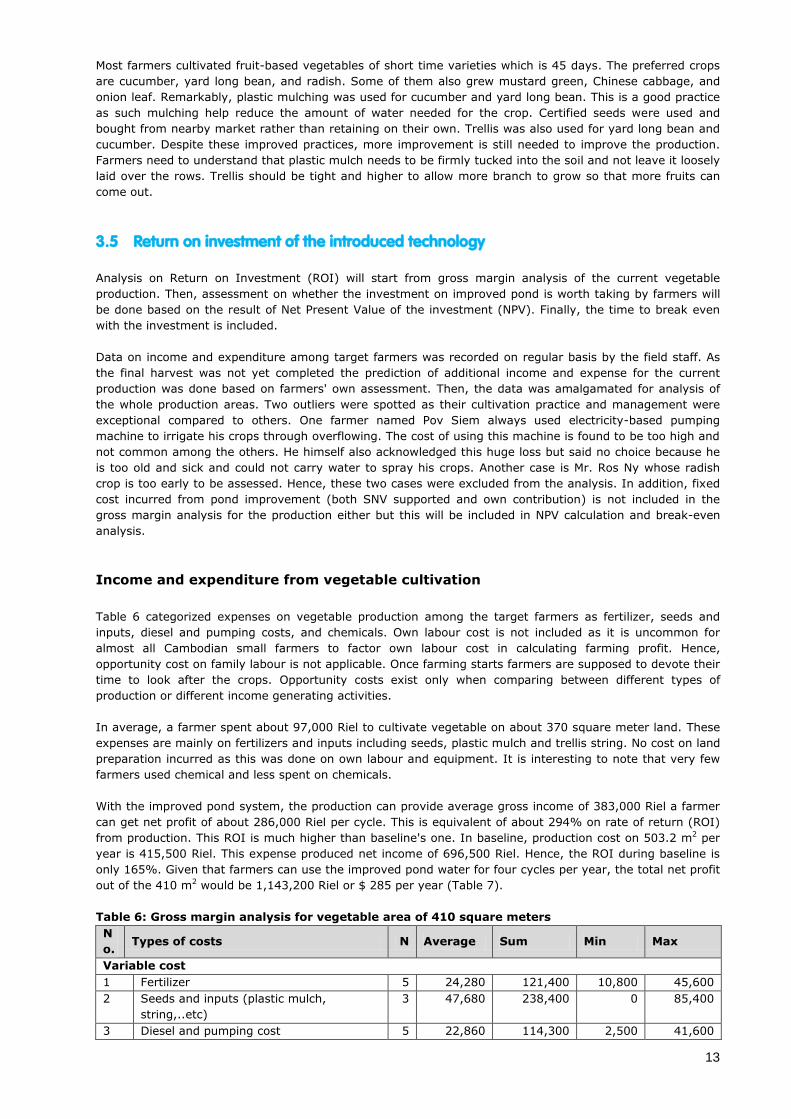
Income and expenditure from vegetable cultivation
Table 6 categorized expenses on vegetable production among the target farmers as fertilizer, seeds and
inputs, diesel and pumping costs, and chemicals. Own labour cost is not included as it is uncommon for
almost all Cambodian small farmers to factor own labour cost in calculating farming profit. Hence,
opportunity cost on family labour is not applicable. Once farming starts farmers are supposed to devote their
time to look after the crops. Opportunity costs exist only when comparing between different types of
production or different income generating activities.
In average, a farmer spent about 97,000 Riel to cultivate vegetable on about 370 square meter land. These
expenses are mainly on fertilizers and inputs including seeds, plastic mulch and trellis string. No cost on land
preparation incurred as this was done on own labour and equipment. It is interesting to note that very few
farmers used chemical and less spent on chemicals.
With the improved pond system, the production can provide average gross income of 383,000 Riel a farmer
can get net profit of about 286,000 Riel per cycle. This is equivalent of about 294% on rate of return (ROI)
from production. This ROI is much higher than baseline's one. In baseline, production cost on 503.2 m2 per
year is 415,500 Riel. This expense produced net income of 696,500 Riel. Hence, the ROI during baseline is
only 165%. Given that farmers can use the improved pond water for four cycles per year, the total net profit
out of the 410 m2 would be 1,143,200 Riel or $ 285 per year (Table 7).
Table 6: Gross margin analysis for vegetable area of 410 square meters
N
o. Types of costs N Average Sum Min Max
Variable cost
1 Fertilizer 5 24,280 121,400 10,800 45,600
2 Seeds and inputs (plastic mulch,
string,..etc)
3 47,680 238,400 0 85,400
3 Diesel and pumping cost 5 22,860 114,300 2,500 41,600
14
4 Chemicals 1 2,500 12,500 0 12,500
Sub-total 6 97,320 486,600 31,000 150,800
Gross income
5 Income from sale 6 383,110 1,915,550 108,000 962,300
Net profit
6 Net profit (gross income – variable cost) 6 285,790 1,428,950 70,200 820,700
Change of net income before and after pond improvement
If we look into how much increase in net income attributed by the pond improvement baseline data is used
for comparison. The comparison is based on the same land size factor. Table 7 shows that with the same
size of land cultivation (which is 410 m2) the net income would increase by 575,700 Riel or about $144. This
means that 144$ is the net return from production per year out of investment of 585$ on material for
improving pond, tarpaulin and Rovai pump installation (Table 8).
Table 7: Changes in net income before and after pond improvement
N Variables N Average
Without improvement pond - Baseline
1 Net income per annum from 2.7 cycles of production on 503.2 m2 (Riel) 10 696,500
2 Net income per annum from 2.7 cycles of production on 410 m2 (Riel) 10 567,500
With improved pond and storage
3 Net income per cycle of production on 410 m2 (Riel) 5 285,800
4 Net income per annum of 4 cycle production on 410 m2 (Riel) 5 1,143,200
5 Net return from investment (Riel) 575,700
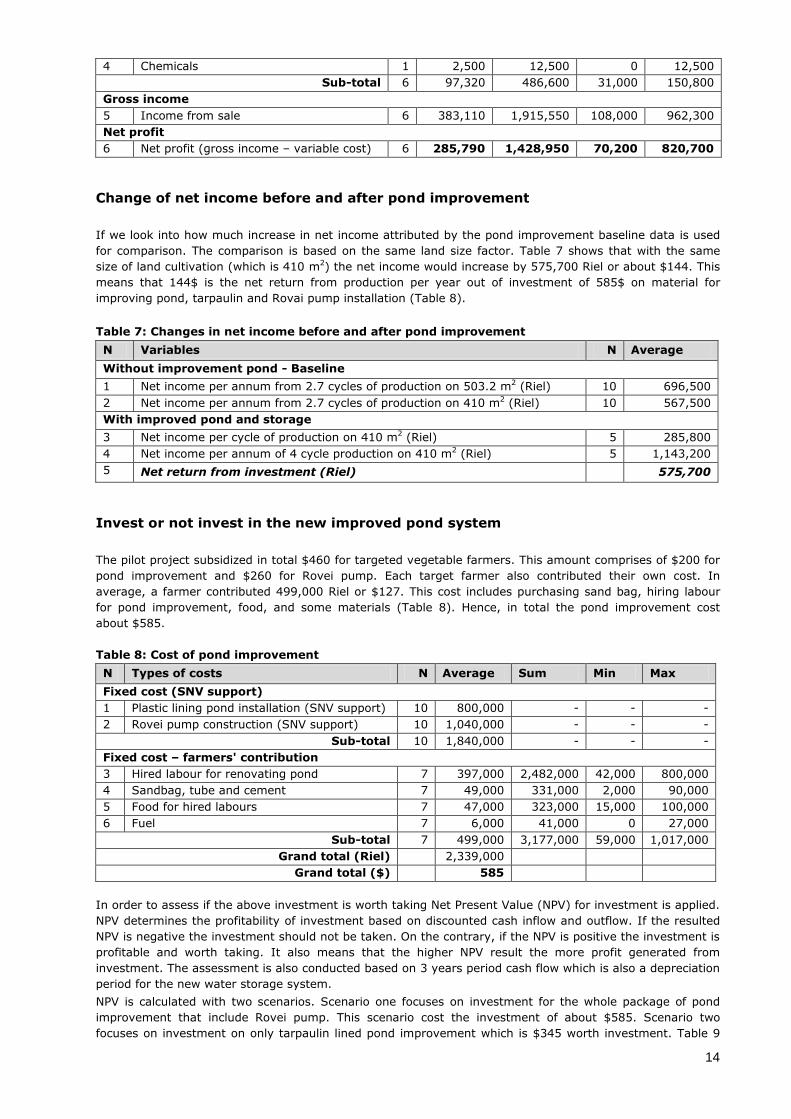
Invest or not invest in the new improved pond system
The pilot project subsidized in total $460 for targeted vegetable farmers. This amount comprises of $200 for
pond improvement and $260 for Rovei pump. Each target farmer also contributed their own cost. In
average, a farmer contributed 499,000 Riel or $127. This cost includes purchasing sand bag, hiring labour
for pond improvement, food, and some materials (Table 8). Hence, in total the pond improvement cost
about $585.
Table 8: Cost of pond improvement
N Types of costs N Average Sum Min Max
Fixed cost (SNV support)
1 Plastic lining pond installation (SNV support) 10 800,000 - - -
2 Rovei pump construction (SNV support) 10 1,040,000 - - -
Sub-total 10 1,840,000 - - -
Fixed cost – farmers' contribution
3 Hired labour for renovating pond 7 397,000 2,482,000 42,000 800,000
4 Sandbag, tube and cement 7 49,000 331,000 2,000 90,000
5 Food for hired labours 7 47,000 323,000 15,000 100,000
6 Fuel 7 6,000 41,000 0 27,000
Sub-total 7 499,000 3,177,000 59,000 1,017,000
Grand total (Riel) 2,339,000
Grand total ($) 585
In order to assess if the above investment is worth taking Net Present Value (NPV) for investment is applied.
NPV determines the profitability of investment based on discounted cash inflow and outflow. If the resulted
NPV is negative the investment should not be taken. On the contrary, if the NPV is positive the investment is
profitable and worth taking. It also means that the higher NPV result the more profit generated from
investment. The assessment is also conducted based on 3 years period cash flow which is also a depreciation
period for the new water storage system.
NPV is calculated with two scenarios. Scenario one focuses on investment for the whole package of pond
improvement that include Rovei pump. This scenario cost the investment of about $585. Scenario two
focuses on investment on only tarpaulin lined pond improvement which is $345 worth investment. Table 9
15
below indicates that in three year time the current production and income cannot be profitability if the
investment was made on the whole package of pond improvement (NPV <0). By contrast, if a farmer invests
only in the tarpaulin lined pond a small profit can be made from this investment in three year period.
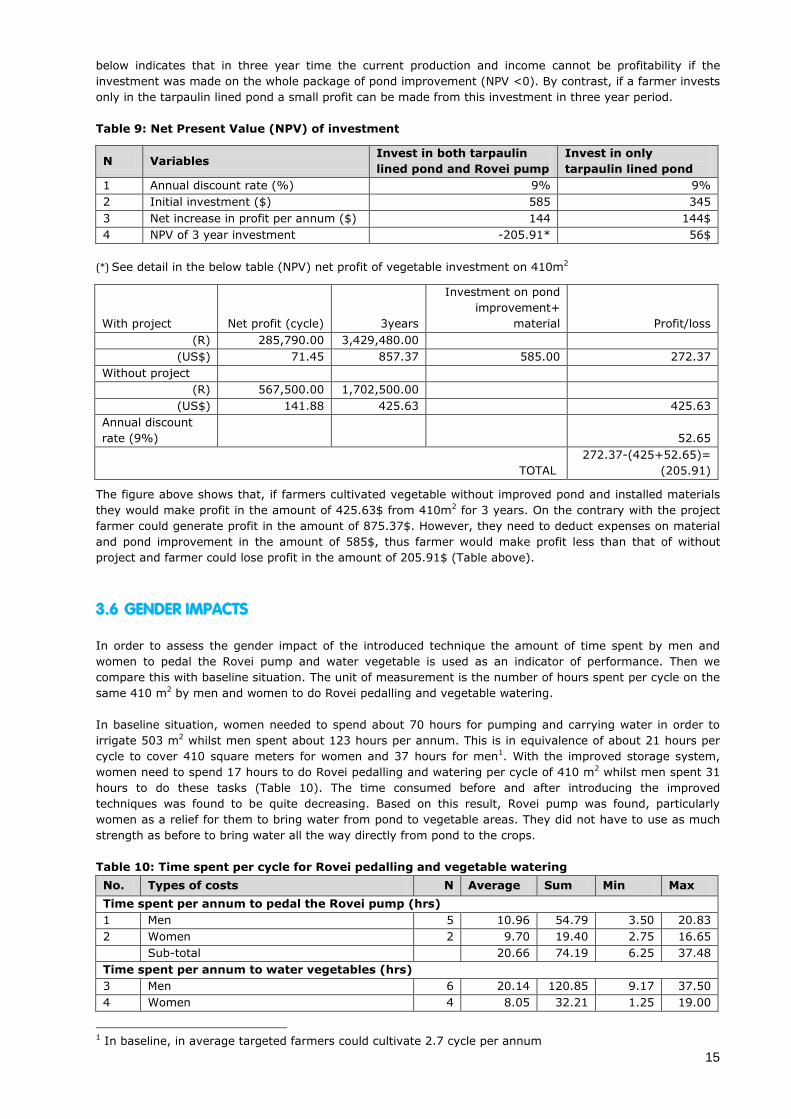
Table 9: Net Present Value (NPV) of investment
N Variables Invest in both tarpaulin
lined pond and Rovei pump
Invest in only
tarpaulin lined pond
1 Annual discount rate (%) 9% 9%
2 Initial investment ($) 585 345
3 Net increase in profit per annum ($) 144 144$
4 NPV of 3 year investment -205.91* 56$
(*) See detail in the below table (NPV) net profit of vegetable investment on 410m2
With project Net profit (cycle) 3years
Investment on pond
improvement+
material Profit/loss
(R) 285,790.00 3,429,480.00
(US$) 71.45 857.37 585.00 272.37
Without project
(R) 567,500.00 1,702,500.00
(US$) 141.88 425.63
425.63
Annual discount
rate (9%) 52.65
TOTAL
272.37-(425+52.65)=
(205.91)
The figure above shows that, if farmers cultivated vegetable without improved pond and installed materials
they would make profit in the amount of 425.63$ from 410m2 for 3 years. On the contrary with the project
farmer could generate profit in the amount of 875.37$. However, they need to deduct expenses on material
and pond improvement in the amount of 585$, thus farmer would make profit less than that of without
project and farmer could lose profit in the amount of 205.91$ (Table above).
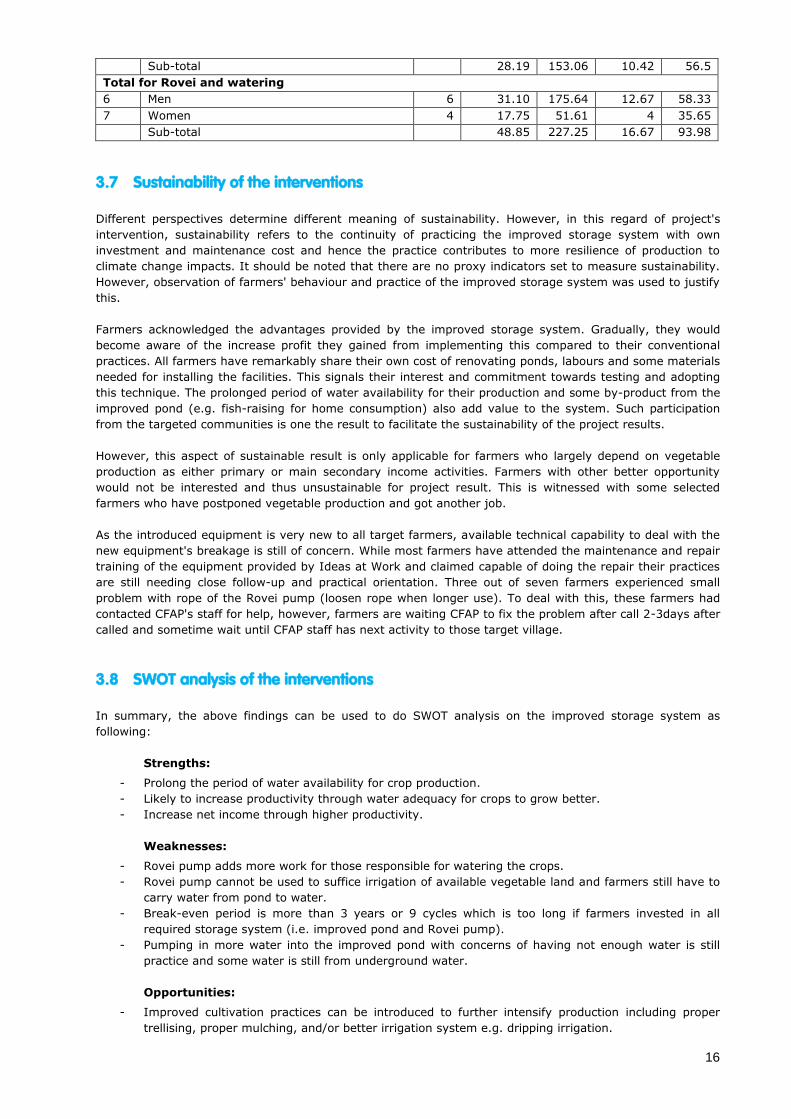
3.6 GENDER IMPACTS
In order to assess the gender impact of the introduced technique the amount of time spent by men and
women to pedal the Rovei pump and water vegetable is used as an indicator of performance. Then we
compare this with baseline situation. The unit of measurement is the number of hours spent per cycle on the
same 410 m2 by men and women to do Rovei pedalling and vegetable watering.
In baseline situation, women needed to spend about 70 hours for pumping and carrying water in order to
irrigate 503 m2 whilst men spent about 123 hours per annum. This is in equivalence of about 21 hours per
cycle to cover 410 square meters for women and 37 hours for men1. With the improved storage system,
women need to spend 17 hours to do Rovei pedalling and watering per cycle of 410 m2 whilst men spent 31
hours to do these tasks (Table 10). The time consumed before and after introducing the improved
techniques was found to be quite decreasing. Based on this result, Rovei pump was found, particularly
women as a relief for them to bring water from pond to vegetable areas. They did not have to use as much
strength as before to bring water all the way directly from pond to the crops.
Table 10: Time spent per cycle for Rovei pedalling and vegetable watering
No. Types of costs N Average Sum Min Max
Time spent per annum to pedal the Rovei pump (hrs)
1 Men 5 10.96 54.79 3.50 20.83
2 Women 2 9.70 19.40 2.75 16.65
Sub-total 20.66 74.19 6.25 37.48
Time spent per annum to water vegetables (hrs)
3 Men 6 20.14 120.85 9.17 37.50
4 Women 4 8.05 32.21 1.25 19.00
1 In baseline, in average targeted farmers could cultivate 2.7 cycle per annum
16
Sub-total 28.19 153.06 10.42 56.5
Total for Rovei and watering
6 Men 6 31.10 175.64 12.67 58.33
7 Women 4 17.75 51.61 4 35.65
Sub-total 48.85 227.25 16.67 93.98
3.7 Sustainability of the interventions
Different perspectives determine different meaning of sustainability. However, in this regard of project's
intervention, sustainability refers to the continuity of practicing the improved storage system with own
investment and maintenance cost and hence the practice contributes to more resilience of production to
climate change impacts. It should be noted that there are no proxy indicators set to measure sustainability.
However, observation of farmers' behaviour and practice of the improved storage system was used to justify
this.
Farmers acknowledged the advantages provided by the improved storage system. Gradually, they would
become aware of the increase profit they gained from implementing this compared to their conventional
practices. All farmers have remarkably share their own cost of renovating ponds, labours and some materials
needed for installing the facilities. This signals their interest and commitment towards testing and adopting
this technique. The prolonged period of water availability for their production and some by-product from the
improved pond (e.g. fish-raising for home consumption) also add value to the system. Such participation
from the targeted communities is one the result to facilitate the sustainability of the project results.
However, this aspect of sustainable result is only applicable for farmers who largely depend on vegetable
production as either primary or main secondary income activities. Farmers with other better opportunity
would not be interested and thus unsustainable for project result. This is witnessed with some selected
farmers who have postponed vegetable production and got another job.
As the introduced equipment is very new to all target farmers, available technical capability to deal with the
new equipment's breakage is still of concern. While most farmers have attended the maintenance and repair
training of the equipment provided by Ideas at Work and claimed capable of doing the repair their practices
are still needing close follow-up and practical orientation. Three out of seven farmers experienced small
problem with rope of the Rovei pump (loosen rope when longer use). To deal with this, these farmers had
contacted CFAP's staff for help, however, farmers are waiting CFAP to fix the problem after call 2-3days after
called and sometime wait until CFAP staff has next activity to those target village.
3.8 SWOT analysis of the interventions
In summary, the above findings can be used to do SWOT analysis on the improved storage system as
following:
Strengths:
- Prolong the period of water availability for crop production.
- Likely to increase productivity through water adequacy for crops to grow better.
- Increase net income through higher productivity.
Weaknesses:
- Rovei pump adds more work for those responsible for watering the crops.
- Rovei pump cannot be used to suffice irrigation of available vegetable land and farmers still have to
carry water from pond to water.
- Break-even period is more than 3 years or 9 cycles which is too long if farmers invested in all
required storage system (i.e. improved pond and Rovei pump).
- Pumping in more water into the improved pond with concerns of having not enough water is still
practice and some water is still from underground water.
Opportunities:
- Improved cultivation practices can be introduced to further intensify production including proper
trellising, proper mulching, and/or better irrigation system e.g. dripping irrigation.
17
- Awareness raising on climate change is necessary for farmers to understand along side with their
adaptability practices.
- Vegetable cultivation is subsidiary income activities which can provide frequent cash to support daily
living cost. Meanwhile rice is a staple crop to secure their food in-take.
Threat:
- Rovei pump is new to most of the target farmers. Though most of them have attended the
maintenance course provided by CFAP and claimed they could repair the tools when broken the
practice did not verify this claim. Some who’s Rovei was broken just waited for technical staff to
come and fix.
- Market fluctuation and competition with imported vegetables especially those from Vietnam.
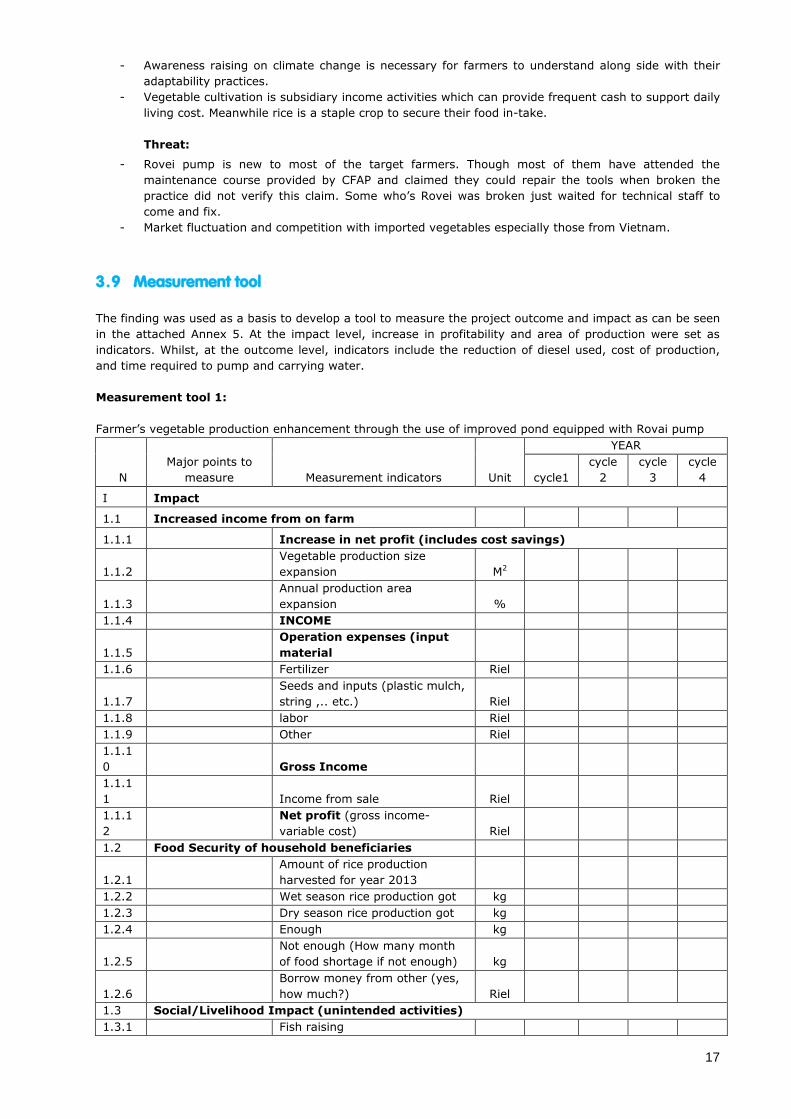
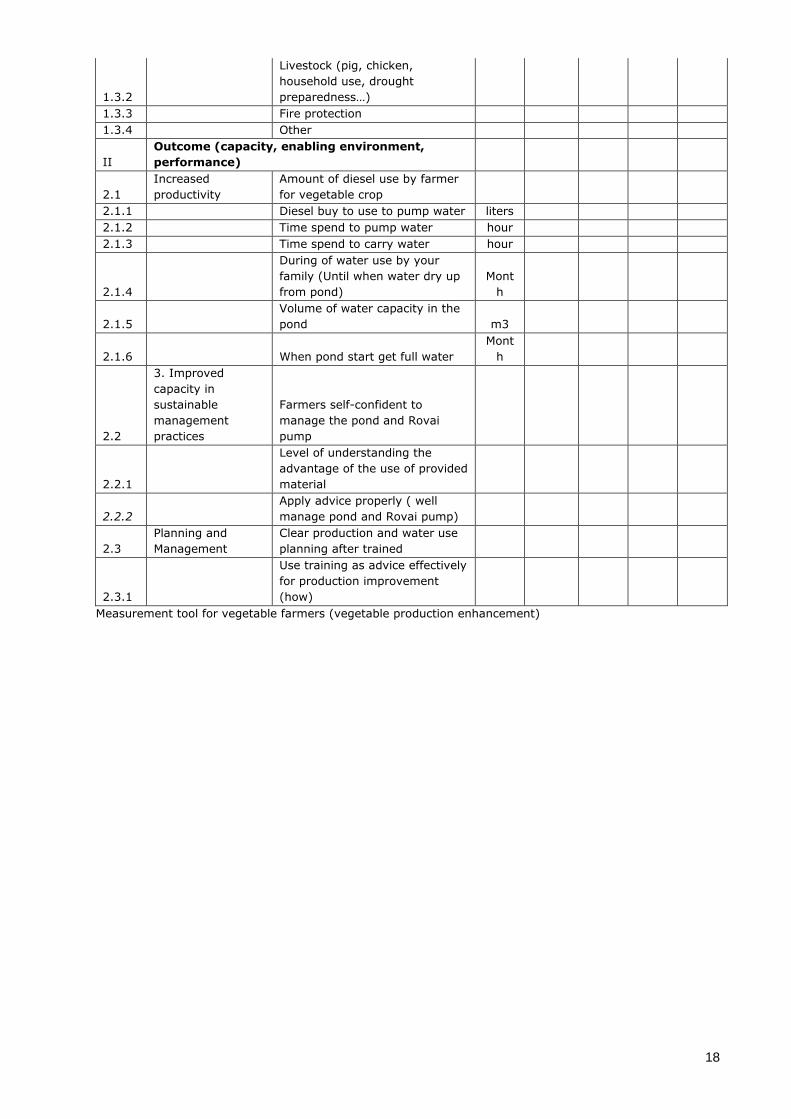
3.9 Measurement tool
The finding was used as a basis to develop a tool to measure the project outcome and impact as can be seen
in the attached Annex 5. At the impact level, increase in profitability and area of production were set as
indicators. Whilst, at the outcome level, indicators include the reduction of diesel used, cost of production,
and time required to pump and carrying water.
Measurement tool 1:
Farmer’s vegetable production enhancement through the use of improved pond equipped with Rovai pump
N
Major points to
measure Measurement indicators Unit
YEAR
cycle1
cycle
2
cycle
3
cycle
4
I Impact
1.1 Increased income from on farm
1.1.1 Increase in net profit (includes cost savings)
1.1.2
Vegetable production size
expansion M2
1.1.3
Annual production area
expansion %
1.1.4 INCOME
1.1.5
Operation expenses (input
material
1.1.6 Fertilizer Riel
1.1.7
Seeds and inputs (plastic mulch,
string ,.. etc.) Riel
1.1.8 labor Riel
1.1.9 Other Riel
1.1.1
0 Gross Income
1.1.1
1 Income from sale Riel
1.1.1
2
Net profit (gross income-
variable cost) Riel
1.2 Food Security of household beneficiaries
1.2.1
Amount of rice production
harvested for year 2013
1.2.2 Wet season rice production got kg
1.2.3 Dry season rice production got kg
1.2.4 Enough kg
1.2.5
Not enough (How many month
of food shortage if not enough) kg
1.2.6
Borrow money from other (yes,
how much?) Riel
1.3 Social/Livelihood Impact (unintended activities)
1.3.1 Fish raising
18
1.3.2
Livestock (pig, chicken,
household use, drought
preparedness…)
1.3.3 Fire protection
1.3.4 Other
II
Outcome (capacity, enabling environment,
performance)
2.1
Increased
productivity
Amount of diesel use by farmer
for vegetable crop
2.1.1 Diesel buy to use to pump water liters
2.1.2 Time spend to pump water hour
2.1.3 Time spend to carry water hour
2.1.4
During of water use by your
family (Until when water dry up
from pond)
Mont
h
2.1.5
Volume of water capacity in the
pond m3
2.1.6 When pond start get full water
Mont
h
2.2
3. Improved
capacity in
sustainable
management
practices
Farmers self-confident to
manage the pond and Rovai
pump
2.2.1
Level of understanding the
advantage of the use of provided
material
2.2.2
Apply advice properly ( well
manage pond and Rovai pump)
2.3
Planning and
Management
Clear production and water use
planning after trained
2.3.1
Use training as advice effectively
for production improvement
(how)
Measurement tool for vegetable farmers (vegetable production enhancement)
19
4 Pilot project on combination of plastic lining pond with Rovei
pump for vegetable cultivation
4.1 Introduction to the pilot project
Another pilot project focusing on climate change adaptation is the installation of two wind-pumps in Svay
Chrum district, Svay Rieng province under cooperation with Cambodian Development Institute (CDI) and
CFAP. The project entitled "rice production enhancement through wind-pump water supply system". Two
pumps were installed on the edge of a reservoir in order to bring water from the reservoir to the nearby
paddy fields so as to reduce or avoid fuel-based pumping and the use of underground water. Fifteen farming
households whose paddy fields are located near by the installed pumps were selected to participate in the
pilot project. The installation of the two wind-pumps was completed just before the start of the data
collection for this study.
4.2 Objective of the pilot project
The objectives of the pilot project is to improve livelihood of farming household through rice production
enhancement using wind pump water supply, reduce underground water pumping, reduce the high expenses
diesel cost and contribute to sustainable water resource management. In order to measure the project's
achievement the following indicators were set up.
- Reduce pumping underground water to irrigate rice amongst farming household beneficiaries;
- Contribute to protect environment by reducing gas emission from the diesel water pump usage;
- Farmers have enough water to irrigate 3 crop cycles/year by using short, purity rice seed;
- 2 wind pumps will install in the target location for supplying water to rice and vegetable crops;
- Around 4 hectare of paddy field will have enough water to irrigate;
- At least 36tonnes of paddy will produced by 4ha of rice field/ year;
- Deduct farmer expenses on diesel use at least US$1200/year;
- Develop the measurement tools and techniques to collect data for output and outcomes
4.3 Effectiveness of the introduced technology
Review of the setup indicators
It is necessary to review the performance indicators to suit the reality of target farmers' situation.
Apparently, there are no farmers whose target paddy fields were irrigated by underground water. Since the
fields are located nearby the reservoir pumping machines were the immediate way to irrigate the field. In
this regard, if the project succeeded to achieve its objectives the impact is likely to be on deduction of fuel
use for pumping rather than of underground water use.
In addition, as only few farmers were cultivating rice during the data collection and some farmers just
jumping in the rice production at the very early stage of of rice cultivation process, it make little difficult to
do the assessment on yield and profit. Furthermore, since the wind pump just completed construction recent
weeks before the study conducted, We found that there are 3-4 farmers are starting to do rice cultivation by
using water supply from the wind pump. However, due to irregular wind blow, It makes water produced by
pump was not insufficient to cover whole area.
Some farmers were used pumping machine along with the wind-pumps to irrigate their fields. We notice
that, planning of field cultivation expansion was designed by CFAP by starting from plot to plot make sure
the amount of water produced by wind pump could manage to irrigate paddy field from plot to plot. There
are 2 wind pumps were installed, which located in Russey Prey village, Kampong Chamlorng commune, Svay
Chrum district. Whereas, another wind-pump located in Chek commune was not used for any cultivation at
all after the harvest in November 2012.
20
It should be noted that the wind-pump designed was not a type of rain-water harvesting technique. Thus the
availability of water is dependent on the water amount in the natural water sources available for irrigation.
In this regard, the water supply from wind pump will rely much on the water from the natural steam that
could supply. As water in the reservoir never dries up, this would be the potential water source to supply to
the target paddy field. Therefore, the analysis framework mainly focused on whether the wind-pump can
achieve the target of supply water for 2 hectare rice cultivation or not.
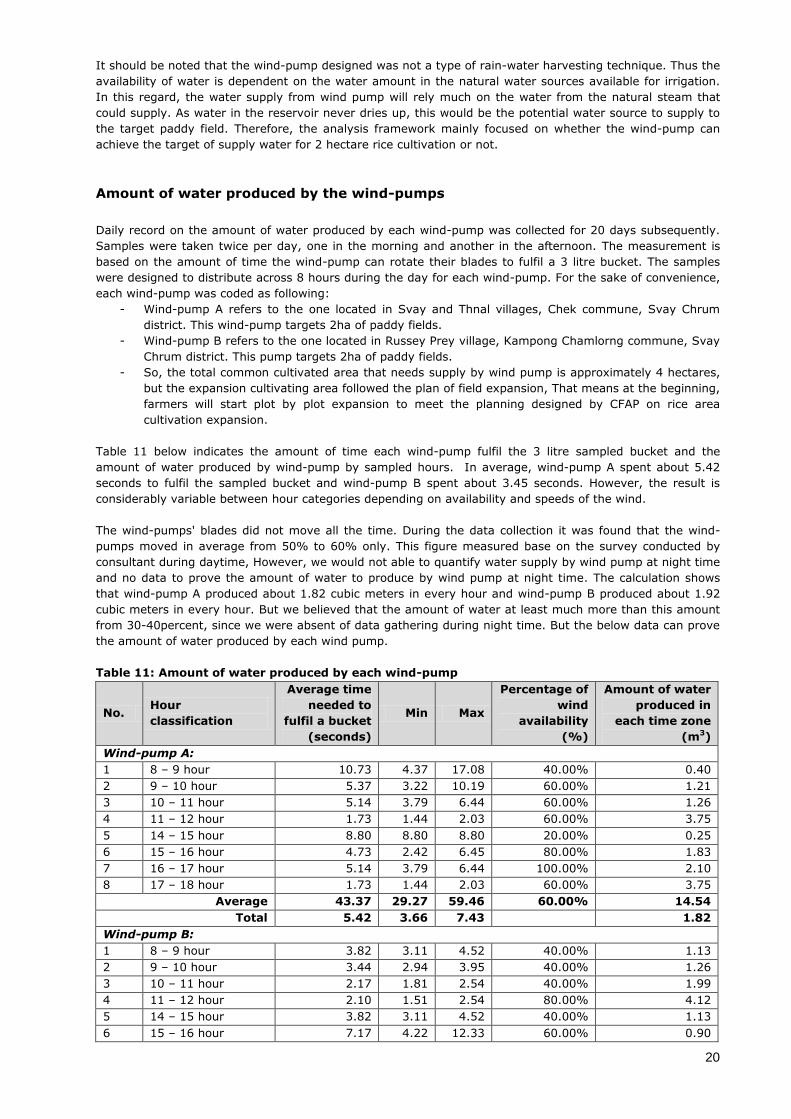
Amount of water produced by the wind-pumps
Daily record on the amount of water produced by each wind-pump was collected for 20 days subsequently.
Samples were taken twice per day, one in the morning and another in the afternoon. The measurement is
based on the amount of time the wind-pump can rotate their blades to fulfil a 3 litre bucket. The samples
were designed to distribute across 8 hours during the day for each wind-pump. For the sake of convenience,
each wind-pump was coded as following:
- Wind-pump A refers to the one located in Svay and Thnal villages, Chek commune, Svay Chrum
district. This wind-pump targets 2ha of paddy fields.
- Wind-pump B refers to the one located in Russey Prey village, Kampong Chamlorng commune, Svay
Chrum district. This pump targets 2ha of paddy fields.
- So, the total common cultivated area that needs supply by wind pump is approximately 4 hectares,
but the expansion cultivating area followed the plan of field expansion, That means at the beginning,
farmers will start plot by plot expansion to meet the planning designed by CFAP on rice area
cultivation expansion.
Table 11 below indicates the amount of time each wind-pump fulfil the 3 litre sampled bucket and the
amount of water produced by wind-pump by sampled hours. In average, wind-pump A spent about 5.42
seconds to fulfil the sampled bucket and wind-pump B spent about 3.45 seconds. However, the result is
considerably variable between hour categories depending on availability and speeds of the wind.
The wind-pumps' blades did not move all the time. During the data collection it was found that the wind-
pumps moved in average from 50% to 60% only. This figure measured base on the survey conducted by
consultant during daytime, However, we would not able to quantify water supply by wind pump at night time
and no data to prove the amount of water to produce by wind pump at night time. The calculation shows
that wind-pump A produced about 1.82 cubic meters in every hour and wind-pump B produced about 1.92
cubic meters in every hour. But we believed that the amount of water at least much more than this amount
from 30-40percent, since we were absent of data gathering during night time. But the below data can prove
the amount of water produced by each wind pump.
Table 11: Amount of water produced by each wind-pump
No. Hour
classification
Average time
needed to
fulfil a bucket
(seconds)
Min Max
Percentage of
wind
availability
(%)
Amount of water
produced in
each time zone
(m3)
Wind-pump A:
1 8 – 9 hour 10.73 4.37 17.08 40.00% 0.40
2 9 – 10 hour 5.37 3.22 10.19 60.00% 1.21
3 10 – 11 hour 5.14 3.79 6.44 60.00% 1.26
4 11 – 12 hour 1.73 1.44 2.03 60.00% 3.75
5 14 – 15 hour 8.80 8.80 8.80 20.00% 0.25
6 15 – 16 hour 4.73 2.42 6.45 80.00% 1.83
7 16 – 17 hour 5.14 3.79 6.44 100.00% 2.10
8 17 – 18 hour 1.73 1.44 2.03 60.00% 3.75
Average 43.37 29.27 59.46 60.00% 14.54
Total 5.42 3.66 7.43 1.82
Wind-pump B:
1 8 – 9 hour 3.82 3.11 4.52 40.00% 1.13
2 9 – 10 hour 3.44 2.94 3.95 40.00% 1.26
3 10 – 11 hour 2.17 1.81 2.54 40.00% 1.99
4 11 – 12 hour 2.10 1.51 2.54 80.00% 4.12
5 14 – 15 hour 3.82 3.11 4.52 40.00% 1.13
6 15 – 16 hour 7.17 4.22 12.33 60.00% 0.90
21
7 16 – 17 hour 2.96 2.96 2.96 20.00% 0.73
8 17 – 18 hour 2.10 1.51 2.54 80.00% 4.12
Average 27.58 21.17 35.91 50.00% 15.37
Total 3.45 2.65 4.49 1.92
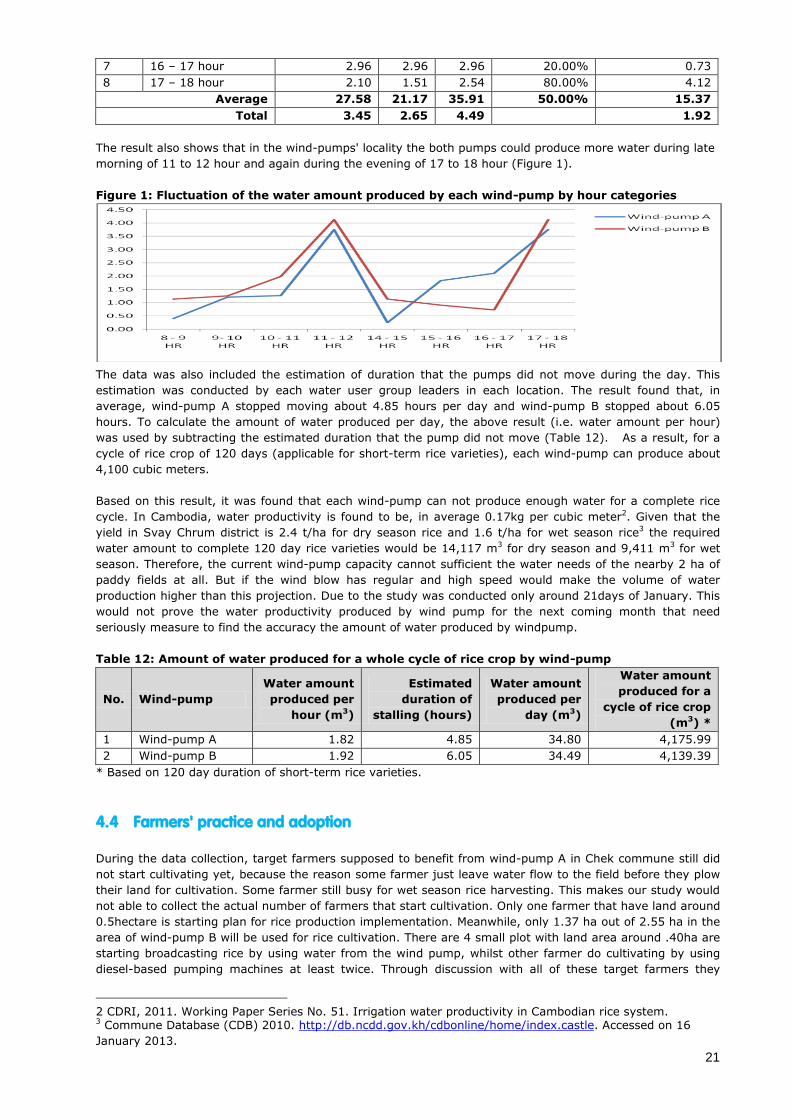
The result also shows that in the wind-pumps' locality the both pumps could produce more water during late
morning of 11 to 12 hour and again during the evening of 17 to 18 hour (Figure 1).
Figure 1: Fluctuation of the water amount produced by each wind-pump by hour categories
The data was also included the estimation of duration that the pumps did not move during the day. This
estimation was conducted by each water user group leaders in each location. The result found that, in
average, wind-pump A stopped moving about 4.85 hours per day and wind-pump B stopped about 6.05
hours. To calculate the amount of water produced per day, the above result (i.e. water amount per hour)
was used by subtracting the estimated duration that the pump did not move (Table 12). As a result, for a
cycle of rice crop of 120 days (applicable for short-term rice varieties), each wind-pump can produce about
4,100 cubic meters.
Based on this result, it was found that each wind-pump can not produce enough water for a complete rice
cycle. In Cambodia, water productivity is found to be, in average 0.17kg per cubic meter2. Given that the
yield in Svay Chrum district is 2.4 t/ha for dry season rice and 1.6 t/ha for wet season rice3 the required
water amount to complete 120 day rice varieties would be 14,117 m3 for dry season and 9,411 m3 for wet
season. Therefore, the current wind-pump capacity cannot sufficient the water needs of the nearby 2 ha of
paddy fields at all. But if the wind blow has regular and high speed would make the volume of water
production higher than this projection. Due to the study was conducted only around 21days of January. This
would not prove the water productivity produced by wind pump for the next coming month that need
seriously measure to find the accuracy the amount of water produced by windpump.
Table 12: Amount of water produced for a whole cycle of rice crop by wind-pump
No. Wind-pump
Water amount
produced per
hour (m3)
Estimated
duration of
stalling (hours)
Water amount
produced per
day (m3)
Water amount
produced for a
cycle of rice crop
(m3) *
1 Wind-pump A 1.82 4.85 34.80 4,175.99
2 Wind-pump B 1.92 6.05 34.49 4,139.39
* Based on 120 day duration of short-term rice varieties.
4.4 Farmers' practice and adoption
During the data collection, target farmers supposed to benefit from wind-pump A in Chek commune still did
not start cultivating yet, because the reason some farmer just leave water flow to the field before they plow
their land for cultivation. Some farmer still busy for wet season rice harvesting. This makes our study would
not able to collect the actual number of farmers that start cultivation. Only one farmer that have land around
0.5hectare is starting plan for rice production implementation. Meanwhile, only 1.37 ha out of 2.55 ha in the
area of wind-pump B will be used for rice cultivation. There are 4 small plot with land area around .40ha are
starting broadcasting rice by using water from the wind pump, whilst other farmer do cultivating by using
diesel-based pumping machines at least twice. Through discussion with all of these target farmers they
2 CDRI, 2011. Working Paper Series No. 51. Irrigation water productivity in Cambodian rice system. 3 Commune Database (CDB) 2010. http://db.ncdd.gov.kh/cdbonline/home/index.castle. Accessed on 16
January 2013.
22
expressed concerns over the slowness of the pump to bring enough water for their crops and therefore, they
could not wait for the pump. Some of them had spent on fuel ranging from 20 litres to 30 litres already to
irrigate their 0.5 ha of paddy field. However, this expense was a bit reduced from their previous cultivation
as claimed by the informants.
It should be noted that rice is a staple crop in rural livelihood as a whole. Likewise, farmers regarded rice
cultivation as a main livelihood activity to secure the entire family consumption. The essence of rice
cultivation makes it difficult for any farmers to respond to new improved technique. While the wind-pump is
still in early stage of introduction farmers have the attitude to wait and see for a period of time.
4.5 Return on investment of the introduced technology
Return on investment was not carried out for rice pilot project due to the fact that the target farmers were
still using pumping machine for their irrigation and the others did not cultivate any crops at all.
4.6 Sustainability of the interventions
Based on the findings plus farmer observation and discussion, the introduced technology is found challenging
to be sustainable. But, the introduced technology is sound environmental friendly and economically,
However, due to the period of study seem very short period to measure the water production by wind pump
and short it make difficulty to measure the sustainable of the wind pump use and water supply. But in
general, the water produced by wind pump sound great to provide farmer to get available water to farmer
for crop cultivation. With this regards, farmers should think about profitable crops planning if the water
would produce to only limited amount especially the value vegetable crop. We notice that for quick analysis
is sound that, wind pump would not produce sufficient the water that rice need for the 2ha of rice field and
they still opt to pumping machine to some extent in addition to the wind-pump.
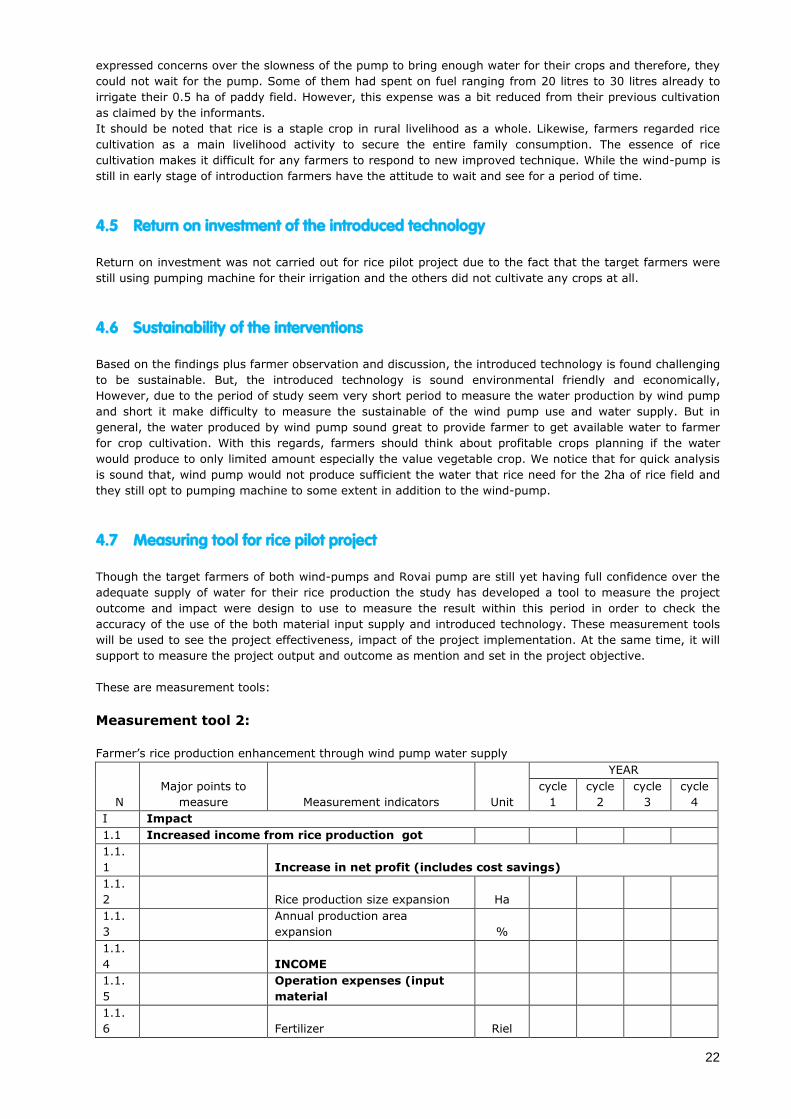
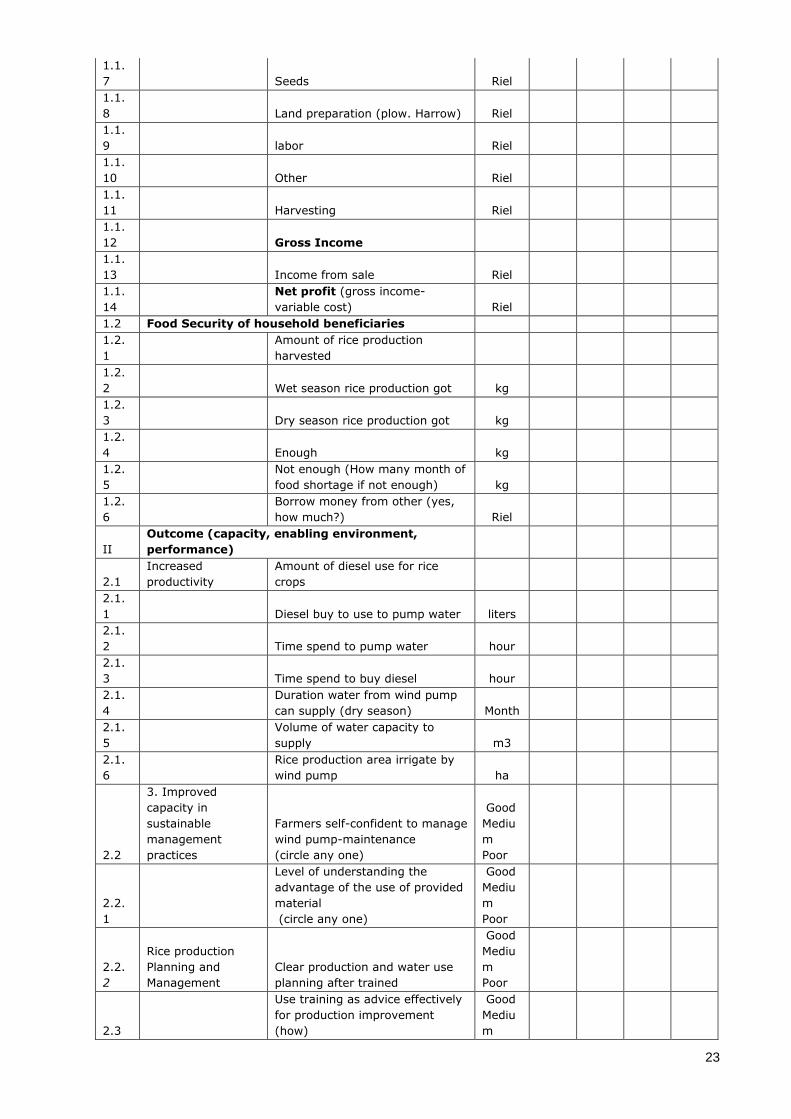
4.7 Measuring tool for rice pilot project
Though the target farmers of both wind-pumps and Rovai pump are still yet having full confidence over the
adequate supply of water for their rice production the study has developed a tool to measure the project
outcome and impact were design to use to measure the result within this period in order to check the
accuracy of the use of the both material input supply and introduced technology. These measurement tools
will be used to see the project effectiveness, impact of the project implementation. At the same time, it will
support to measure the project output and outcome as mention and set in the project objective.
These are measurement tools:
Measurement tool 2:
Farmer’s rice production enhancement through wind pump water supply
N
Major points to
measure Measurement indicators Unit
YEAR
cycle
1
cycle
2
cycle
3
cycle
4
I Impact
1.1 Increased income from rice production got
1.1.
1 Increase in net profit (includes cost savings)
1.1.
2 Rice production size expansion Ha
1.1.
3
Annual production area
expansion %
1.1.
4 INCOME
1.1.
5
Operation expenses (input
material
1.1.
6 Fertilizer Riel
23
1.1.
7 Seeds Riel
1.1.
8 Land preparation (plow. Harrow) Riel
1.1.
9 labor Riel
1.1.
10 Other Riel
1.1.
11 Harvesting Riel
1.1.
12 Gross Income
1.1.
13 Income from sale Riel
1.1.
14
Net profit (gross income-
variable cost) Riel
1.2 Food Security of household beneficiaries
1.2.
1
Amount of rice production
harvested
1.2.
2 Wet season rice production got kg
1.2.
3 Dry season rice production got kg
1.2.
4 Enough kg
1.2.
5
Not enough (How many month of
food shortage if not enough) kg
1.2.
6
Borrow money from other (yes,
how much?) Riel
II
Outcome (capacity, enabling environment,
performance)
2.1
Increased
productivity
Amount of diesel use for rice
crops
2.1.
1 Diesel buy to use to pump water liters
2.1.
2 Time spend to pump water hour
2.1.
3 Time spend to buy diesel hour
2.1.
4
Duration water from wind pump
can supply (dry season) Month
2.1.
5
Volume of water capacity to
supply m3
2.1.
6
Rice production area irrigate by
wind pump ha
2.2
3. Improved
capacity in
sustainable
management
practices
Farmers self-confident to manage
wind pump-maintenance
(circle any one)
Good
Mediu
m
Poor
2.2.
1
Level of understanding the
advantage of the use of provided
material
(circle any one)
Good
Mediu
m
Poor
2.2.
2
Rice production
Planning and
Management
Clear production and water use
planning after trained
Good
Mediu
m
Poor
2.3
Use training as advice effectively
for production improvement
(how)
Good
Mediu
m

24
Poor
Measurement tool for rice farmers (wind pump water supply enhancement)
25
5 Conclusion and recommendation
In general, the pilot project implementation shows significant progress and achieved to most of it indications
and it output set in the project proposal. Such as 10 farmers were selected and pond were improved by
equipped with introduced technique designed. 2windpumps were able to install on time with make
beneficiaries are strongly support and participation;
Projects were designed sound very environmental friendly project, especially to respond to the climate
change and viability encountered by farmers, Such as the irregular rainfall, drought that farmer experience
faced before the project. Rainwater harvesting by improve tarpaulin pond anytime have rain. Especially that
would contribute to farmers to expansion vegetable cultivation longer that before project start and
economically sound in term of deduction of diesel use to pump water, reduce underground water that
practicing by farmers before the project;
Both pilot project of vegetable production enhancement and rice production enhancement still show
significant challenges in term of appropriate technology use it impact to social, especially the intended
activity of vegetable production and unintended activity that contributed by the introduced project especially
to the livelihood. As prove farmer use the project for diversifying with other livelihood improvement activities
such as fish raising, livestock, and disaster preparedness and prevention of fire and drought that would
happen cause by the climate change. This built the project is very impressive to support for the future and
for scaling up this relevance techniques;
However, based on the data analysis result, some conclusions and recommendations would be consider for
the future improvement or scaling up, especially in term of economic investment and profit of the introduced
pilot project such as:
The pilot project on vegetable production enhancement was found to have increase net income among target
farmers by 155$. Though the capacity of the improved pond cannot reach the target of 1,000 m2 and the 4
cycles of production per year the relative profitability is showing a relative improved profitability. This is
likely to be attributed from the improved productivity due to adequate water supply in each crop cycle and
prolonged period of water availability. This resulted situation also provides a good signal for farmers'
adoption of the improved ponds used for vegetable production.
In case that a farmer needs to invest on his/her own in the whole package of improved storage system for
vegetable production and increased net income was found not profitable in three year time. However, if a
farmer needs to invest only on the improved tarpaulin lined pond the return was found profitable in three
year period. This is responsive to the reality that most farmers were still carrying water or overflowing as
means for vegetable watering, except female farmers who found it convenience in term of hard-work
involved from carrying water directly from ponds. To some farmers especially male farmers, Rovei pump was
found it would create workload and time involved in irrigating vegetable areas increased.
Farmers could not completely avoid fuels-based pumping and costs of fuel still incurred. Most farmers had
to, at least, pump in additional water into the improved pond from their concerns that the pond water was
not enough for them to irrigate their available land. However, the improved productivity and the relative
profitability will encourage farmers to focus on surface water harvesting rather than underground water.
Ultimately, the resulted economic benefits will also catalyse the adaptation practice to climate change among
the target farmers, though most farmers do not have any ideas about the causes of the changes.
In addition, it was found that further intensification of production is still possible through improved
cultivation techniques and water-saving irrigation system e.g. dripping system once the project scales up.
Further awareness-raising on the causes of climate change and adaptation opportunities should be delivered
together with technical training as most of them were still not fully aware of the causes though they knew
about the impacts.
Wind-pump, on the other hand, was found to be not promising to achieve the target. After observing the fact
that the wind-pump could not bring water just in time of the rice crop needs the farmers who were
cultivating the land started using the pumping machine as they used to. 20 or 30 litres fuel had been used
for pumping. The amount of water produced by wind-pump was not enough either to irrigate the planned 2
ha of paddy fields. Plus, the availability of water in the reservoir will not change and it will run short during
26
March the wind-pump will be unusable. Therefore, the target size of field should be much smaller for each
wind-pump to cope with;
Additional recommendations
Due to the introduce pilot project shows significant impact to the social and livelihood of communities in
term of unintended activities that diversified by farmers during implementation, This should quantify and
deeply consider if protect intended to scaling up in the future; especially to where farmers faced with water
problems that this model with suit to those situation;
High value crops and vegetable production should motivate through the use of water supply from the wind
pump because crops need limited amount of water, rather than focusing only rice crop that need longer time
and much volume of water utilization; this required cross cutting technical capacity building on appropriate
vegetable crop cultivation techniques and market linkages;
Capacity building to both target farmer on the operation and maintenance of the provided input material is
needed, this CFAP should be the key player in coordination with service providers such as Idea at Work and
CDI, whilst, this competent agency in the capable service provider for both Rovai pump and Wind Pump. At
the same time, farmer’s capacity should strengthen to build confident and ensure they could manage the
project effectively.
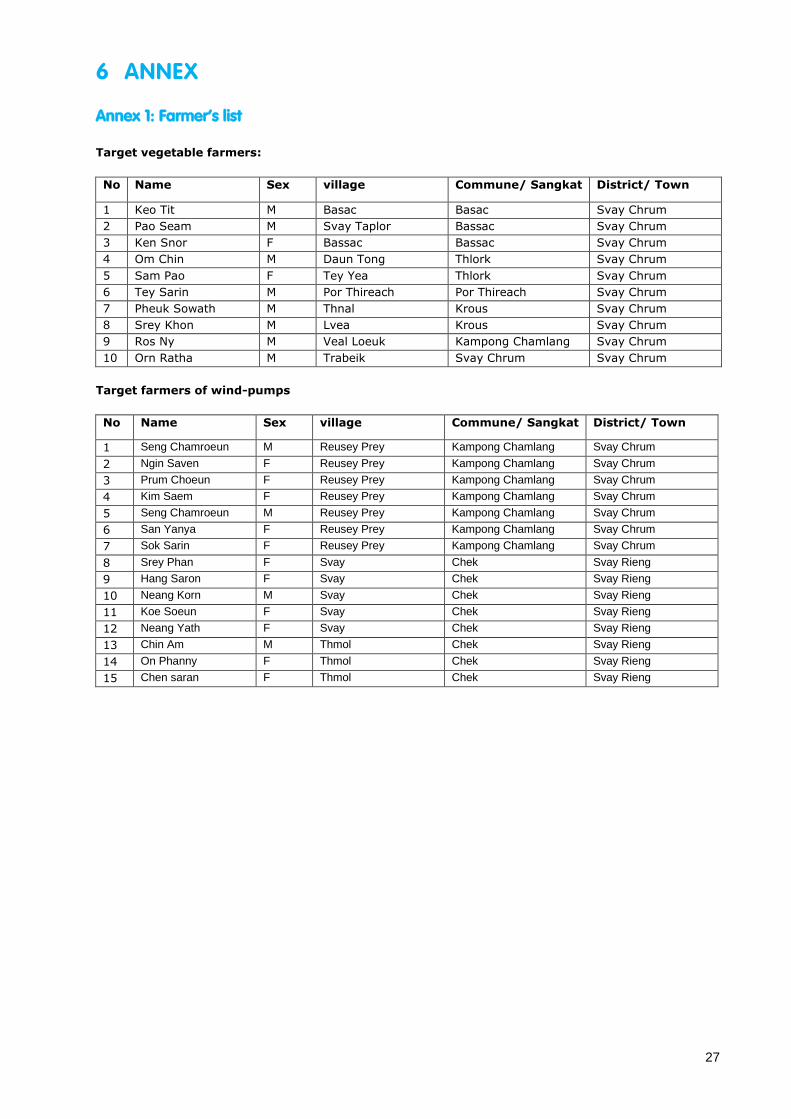
27
6 ANNEX
Annex 1: Farmer’s list
Target vegetable farmers:
No Name Sex village Commune/ Sangkat District/ Town
1 Keo Tit M Basac Basac Svay Chrum
2 Pao Seam M Svay Taplor Bassac Svay Chrum
3 Ken Snor F Bassac Bassac Svay Chrum
4 Om Chin M Daun Tong Thlork Svay Chrum
5 Sam Pao F Tey Yea Thlork Svay Chrum
6 Tey Sarin M Por Thireach Por Thireach Svay Chrum
7 Pheuk Sowath M Thnal Krous Svay Chrum
8 Srey Khon M Lvea Krous Svay Chrum
9 Ros Ny M Veal Loeuk Kampong Chamlang Svay Chrum
10 Orn Ratha M Trabeik Svay Chrum Svay Chrum
Target farmers of wind-pumps
No Name Sex village Commune/ Sangkat District/ Town
1 Seng Chamroeun M Reusey Prey Kampong Chamlang Svay Chrum
2 Ngin Saven F Reusey Prey Kampong Chamlang Svay Chrum
3 Prum Choeun F Reusey Prey Kampong Chamlang Svay Chrum
4 Kim Saem F Reusey Prey Kampong Chamlang Svay Chrum
5 Seng Chamroeun M Reusey Prey Kampong Chamlang Svay Chrum
6 San Yanya F Reusey Prey Kampong Chamlang Svay Chrum
7 Sok Sarin F Reusey Prey Kampong Chamlang Svay Chrum
8 Srey Phan F Svay Chek Svay Rieng
9 Hang Saron F Svay Chek Svay Rieng
10 Neang Korn M Svay Chek Svay Rieng
11 Koe Soeun F Svay Chek Svay Rieng
12 Neang Yath F Svay Chek Svay Rieng
13 Chin Am M Thmol Chek Svay Rieng
14 On Phanny F Thmol Chek Svay Rieng
15 Chen saran F Thmol Chek Svay Rieng
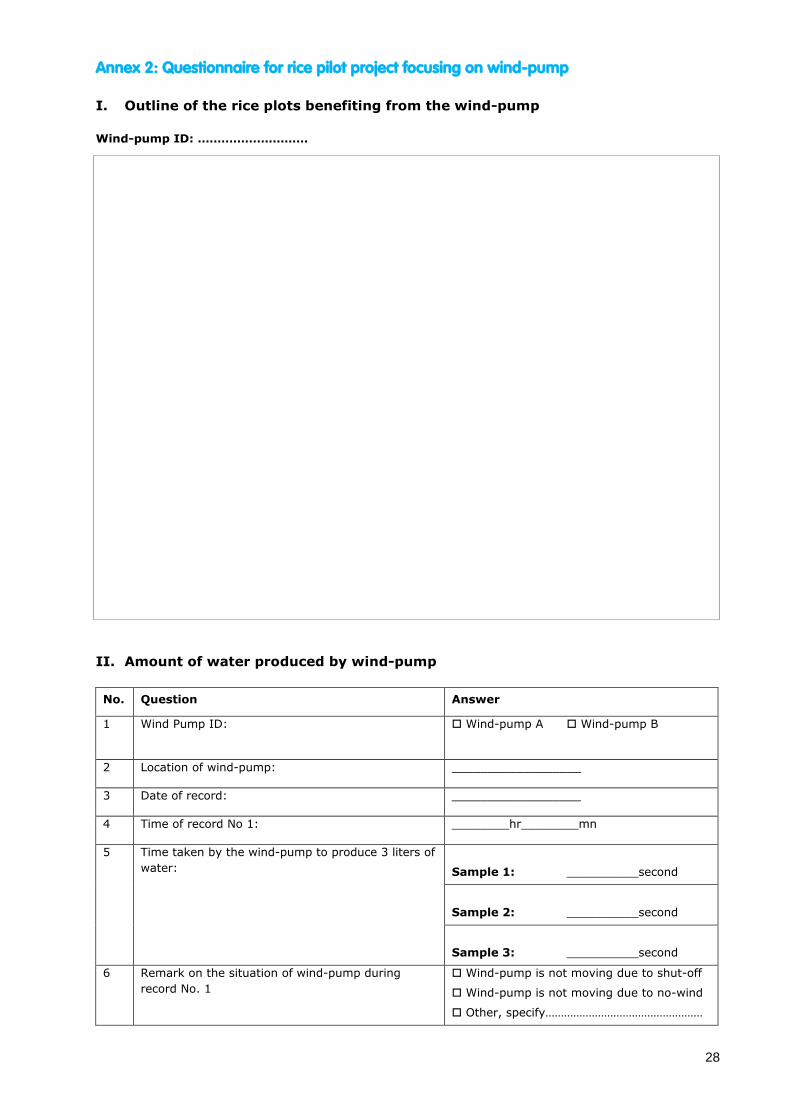
28
Annex 2: Questionnaire for rice pilot project focusing on wind-pump
I. Outline of the rice plots benefiting from the wind-pump
Wind-pump ID: ……………………….
II. Amount of water produced by wind-pump
No. Question Answer
1 Wind Pump ID: Wind-pump A Wind-pump B
2 Location of wind-pump: __________________
3 Date of record: __________________
4 Time of record No 1: ________hr________mn
5 Time taken by the wind-pump to produce 3 liters of
water:
Sample 1: __________second
Sample 2: __________second
Sample 3: __________second
6 Remark on the situation of wind-pump during
record No. 1
Wind-pump is not moving due to shut-off
Wind-pump is not moving due to no-wind
Other, specify……………………………………………
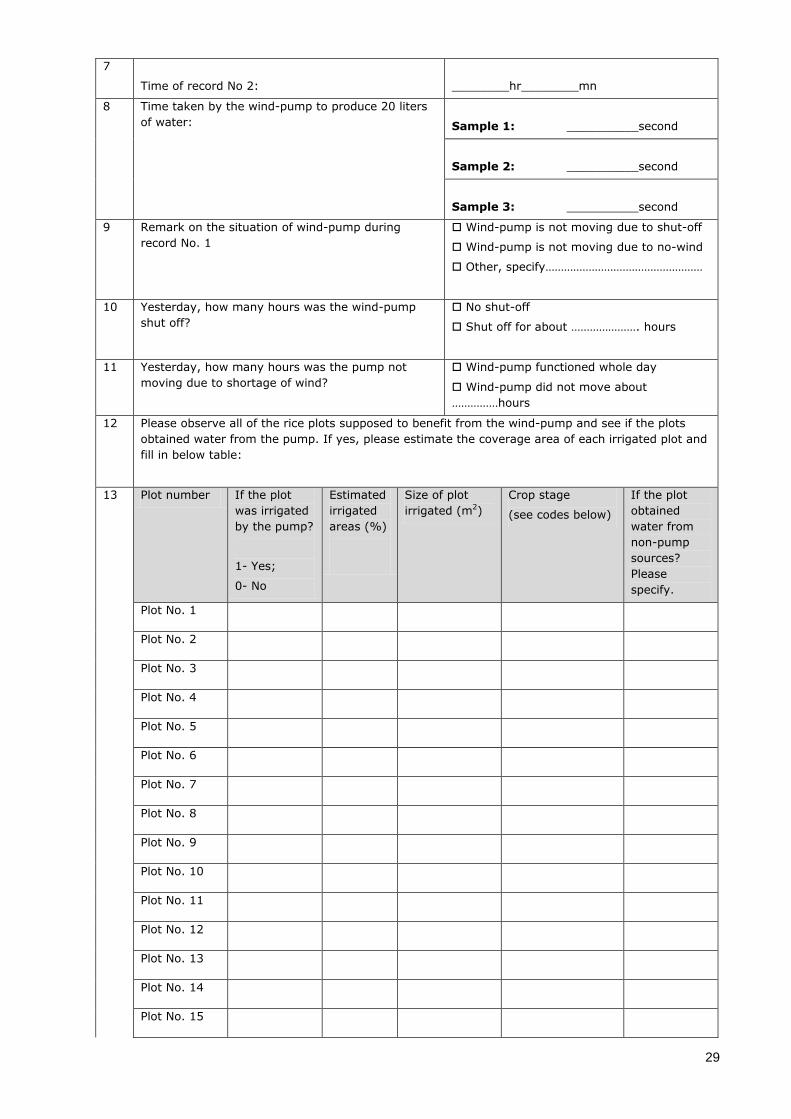
29
7
Time of record No 2:
________hr________mn
8 Time taken by the wind-pump to produce 20 liters
of water:
Sample 1: __________second
Sample 2: __________second
Sample 3: __________second
9 Remark on the situation of wind-pump during
record No. 1
Wind-pump is not moving due to shut-off
Wind-pump is not moving due to no-wind
Other, specify……………………………………………
10 Yesterday, how many hours was the wind-pump
shut off?
No shut-off
Shut off for about …………………. hours
11 Yesterday, how many hours was the pump not
moving due to shortage of wind?
Wind-pump functioned whole day
Wind-pump did not move about
……………hours
12 Please observe all of the rice plots supposed to benefit from the wind-pump and see if the plots
obtained water from the pump. If yes, please estimate the coverage area of each irrigated plot and
fill in below table:
13 Plot number If the plot
was irrigated
by the pump?
1- Yes;
0- No
Estimated
irrigated
areas (%)
Size of plot
irrigated (m2) Crop stage
(see codes below)
If the plot
obtained
water from
non-pump
sources?
Please
specify.
Plot No. 1
Plot No. 2
Plot No. 3
Plot No. 4
Plot No. 5
Plot No. 6
Plot No. 7
Plot No. 8
Plot No. 9
Plot No. 10
Plot No. 11
Plot No. 12
Plot No. 13
Plot No. 14
Plot No. 15
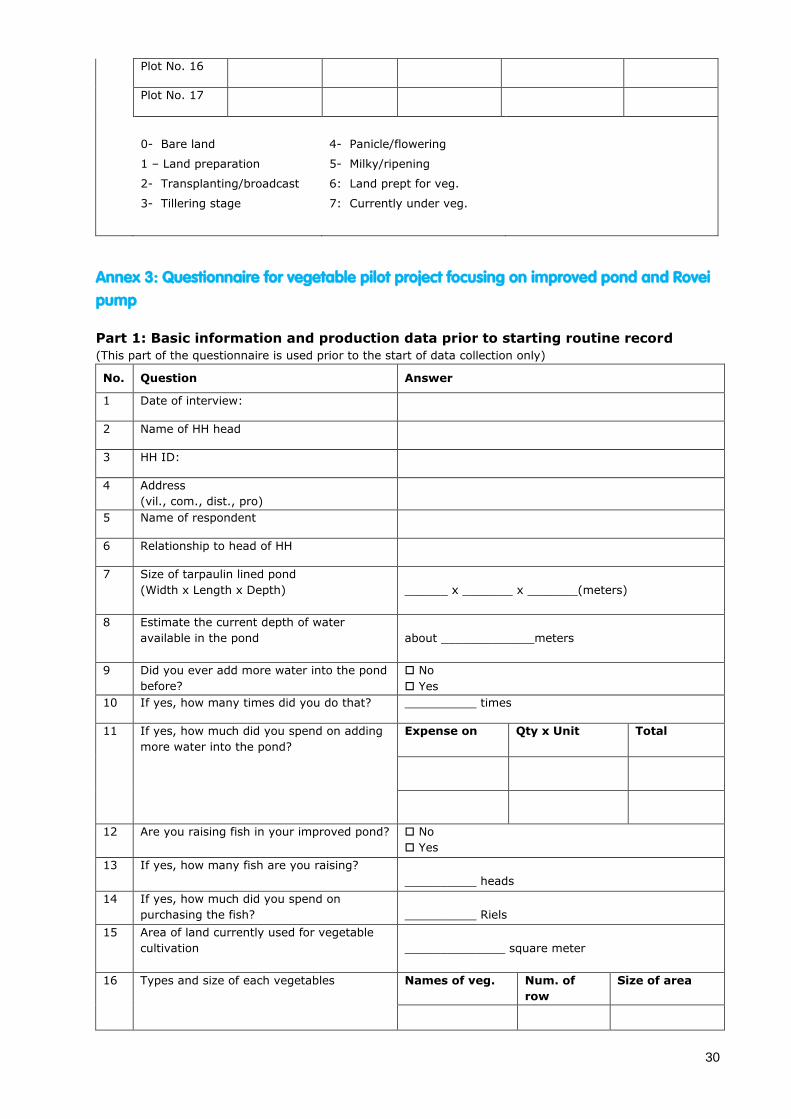
30
Plot No. 16
Plot No. 17
0- Bare land
1 – Land preparation
2- Transplanting/broadcast
3- Tillering stage
4- Panicle/flowering
5- Milky/ripening
6: Land prept for veg.
7: Currently under veg.
Annex 3: Questionnaire for vegetable pilot project focusing on improved pond and Rovei
pump
Part 1: Basic information and production data prior to starting routine record
(This part of the questionnaire is used prior to the start of data collection only)
No. Question Answer
1 Date of interview:
2 Name of HH head
3 HH ID:
4 Address
(vil., com., dist., pro)
5 Name of respondent
6 Relationship to head of HH
7 Size of tarpaulin lined pond
(Width x Length x Depth)
______ x _______ x _______(meters)
8 Estimate the current depth of water
available in the pond
about _____________meters
9 Did you ever add more water into the pond
before?
No
Yes
10 If yes, how many times did you do that? __________ times
11 If yes, how much did you spend on adding
more water into the pond? Expense on Qty x Unit Total
12 Are you raising fish in your improved pond? No
Yes 13 If yes, how many fish are you raising?
__________ heads 14 If yes, how much did you spend on
purchasing the fish?
__________ Riels
15 Area of land currently used for vegetable
cultivation
______________ square meter
16 Types and size of each vegetables Names of veg. Num. of
row
Size of area
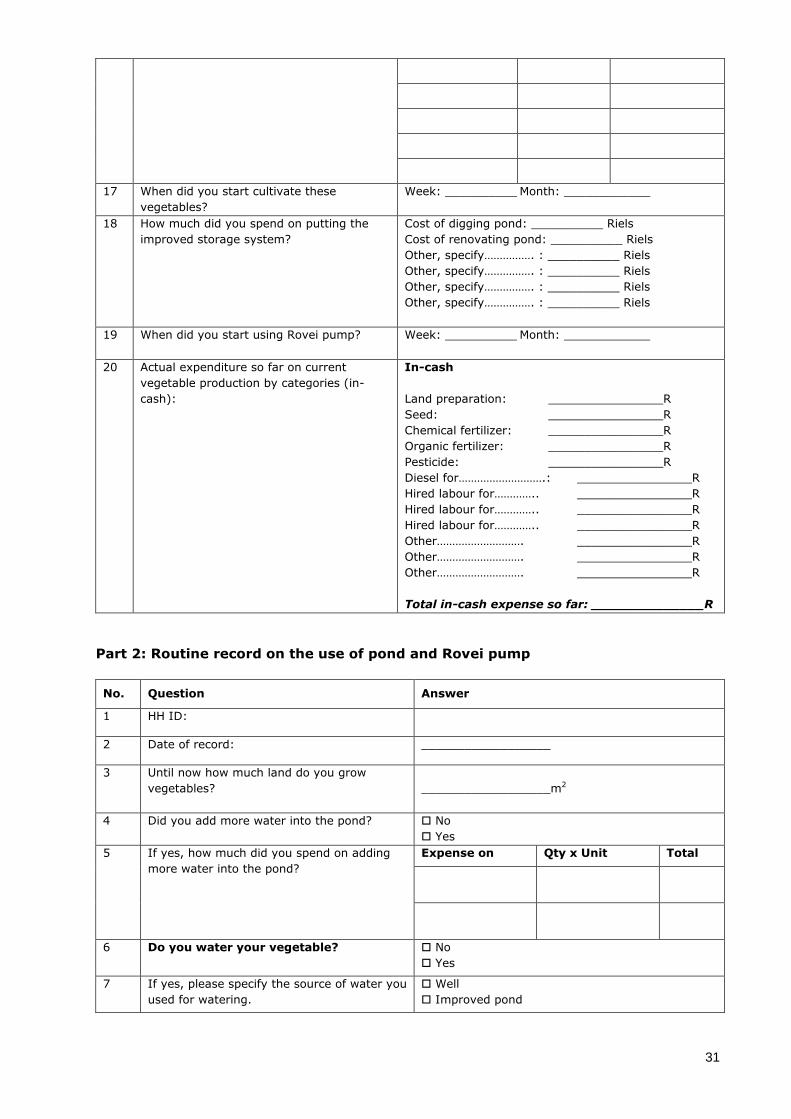
31
17 When did you start cultivate these
vegetables? Week: __________ Month: ____________
18 How much did you spend on putting the
improved storage system? Cost of digging pond: __________ Riels
Cost of renovating pond: __________ Riels
Other, specify……………. : __________ Riels
Other, specify……………. : __________ Riels
Other, specify……………. : __________ Riels
Other, specify……………. : __________ Riels
19 When did you start using Rovei pump? Week: __________ Month: ____________
20 Actual expenditure so far on current
vegetable production by categories (in-
cash):
In-cash
Land preparation: ________________R
Seed: ________________R
Chemical fertilizer: ________________R
Organic fertilizer: ________________R
Pesticide: ________________R
Diesel for……………………….: ________________R
Hired labour for………….. ________________R
Hired labour for………….. ________________R
Hired labour for………….. ________________R
Other………………………. ________________R
Other………………………. ________________R
Other………………………. ________________R
Total in-cash expense so far: ______________R
Part 2: Routine record on the use of pond and Rovei pump
No. Question Answer
1 HH ID:
2 Date of record: __________________
3 Until now how much land do you grow
vegetables?
__________________m2
4 Did you add more water into the pond? No
Yes
5 If yes, how much did you spend on adding
more water into the pond? Expense on Qty x Unit Total
6 Do you water your vegetable? No
Yes 7 If yes, please specify the source of water you
used for watering. Well
Improved pond
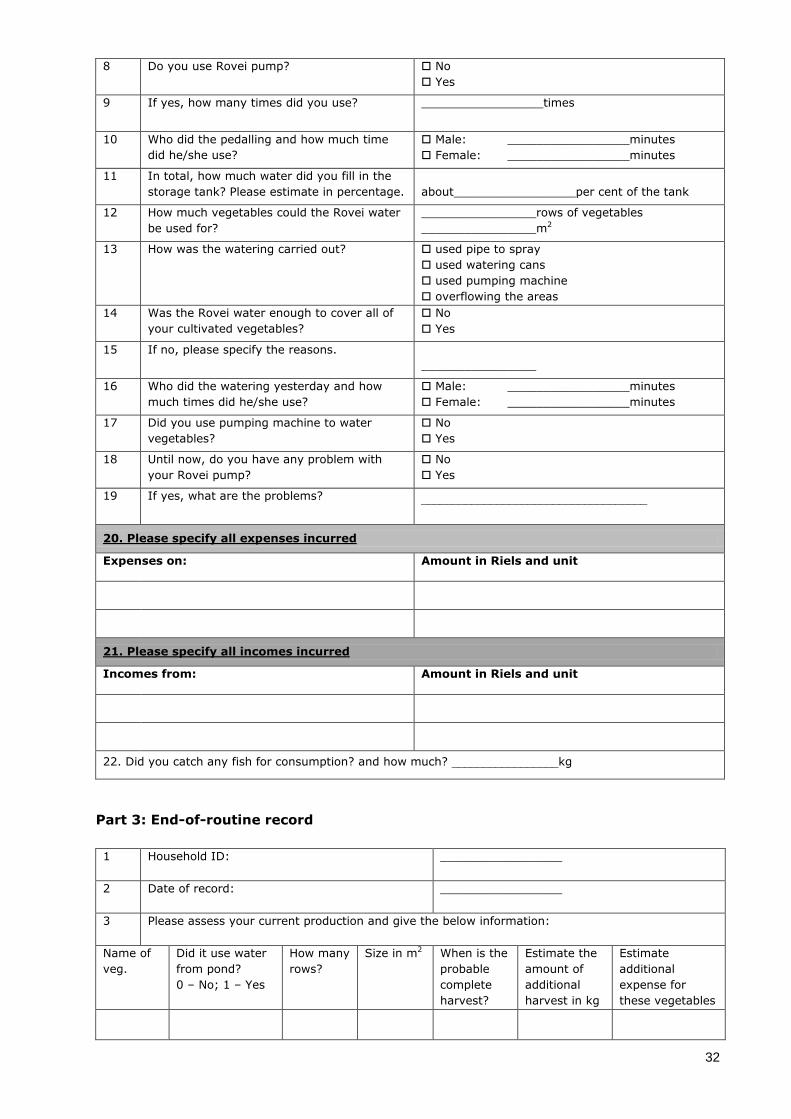
32
8 Do you use Rovei pump? No
Yes
9 If yes, how many times did you use? _________________times
10 Who did the pedalling and how much time
did he/she use?
Male: _________________minutes
Female: _________________minutes
11 In total, how much water did you fill in the
storage tank? Please estimate in percentage.
about_________________per cent of the tank
12 How much vegetables could the Rovei water
be used for? ________________rows of vegetables
________________m2 13 How was the watering carried out? used pipe to spray
used watering cans
used pumping machine
overflowing the areas
14 Was the Rovei water enough to cover all of
your cultivated vegetables? No
Yes
15 If no, please specify the reasons.
________________
16 Who did the watering yesterday and how
much times did he/she use?
Male: _________________minutes
Female: _________________minutes
17 Did you use pumping machine to water
vegetables? No
Yes
18 Until now, do you have any problem with
your Rovei pump? No
Yes
19 If yes, what are the problems? ____________________________________
20. Please specify all expenses incurred Expenses on: Amount in Riels and unit
21. Please specify all incomes incurred
Incomes from: Amount in Riels and unit
22. Did you catch any fish for consumption? and how much? _________________kg
Part 3: End-of-routine record
1 Household ID: _________________
2 Date of record: _________________
3 Please assess your current production and give the below information:
Name of
veg.
Did it use water
from pond?
0 – No; 1 – Yes
How many
rows?
Size in m2 When is the
probable
complete
harvest?
Estimate the
amount of
additional
harvest in kg
Estimate
additional
expense for
these vegetables
33
4 What is the depth of water remained in the
improved pond?
_________________ meters
5 When do you think the remaining water will dry
up?
_________________
6 How many more cycles do you think the
remaining water can be used for?
_________________
7 How many more cycles do you plan to cultivate
vegetables next year (including the use of any
sources of water)?
_________________
8 Last year, how many cycles did you cultivate
vegetables?
9 Have you ever attended the repair and
maintenance course?
_________________
10 Has your Rovei pump ever broken? No
Yes
10.1 If yes, can you fix it yourself?
10.2 If no, why?
11 If you are raising fish in the improved pond,
please estimated the amount of fish you can
harvest in kg?
11.1 If the harvested fish is sold how much per kg?
Annex 4: Terms of Reference for the study
Background & Rationale
SNV Netherlands Development Organisation is an international development organisation of Dutch origin
with over 40 years of experience. We currently work in 38 countries in Africa, Asia, the Balkans and Latin
America. SNV supports national and local actors within government, civil society and the private sector to
find and implement local solutions to social and economic development challenges. We stimulate and set the
framework for the poor to strengthen their capacities and escape poverty.
SNV in Cambodia is part of SNV Netherlands Development Organisation. It began operating in Cambodia in
2005 in two sectors, Renewable Energy (National Biodigester Programme) in 12 provinces of Cambodia and
Pro-poor Sustainable Tourism in the North East Cambodia. In 2009, SNV in Cambodia expanded into two
more sectors, Water, Sanitation and Hygiene, and Small Holder Cash Crops which is now called Agriculture
and Forest Products (AFP).
Climate change is new priority for donors and the government, introduced by the European Union in 2007.
Cambodia was selected to be pilot country. Since then, a range of policy and program interventions, have
been carried out by development organizations and the government across different sectors. However,
information on good practices, successful projects and activities is often not publicly available as they are
often not properly recorded, disseminated, or there is limited sharing among practitioners in Cambodia.
These factors make it difficult for policy makers and planners, to address issues related to climate change
practice in Cambodia. Thus the research on good agriculture practices respond to climate change in
Cambodia is an important mechanism in order to record those good practice activities, prioritization and
sharing with stakeholders.
SNV has been exploring the options, needs and challenges to mainstream climate change adaptation in the
agriculture sector, with particular focus on Svay Rieng province. Following a feasibility study a climate
change adaptation pilot project was implemented by SNV Cambodia in July 2012. There are two elements
which have been implemented by a local partner “Cambodian Farmer’s Association Federation of agricultural
Producers (CFAP- Cambodia)” Promoting vegetable crop production through water storage and supply
system enhancement (Rovai pump together with tarpaulin lining pond) and Rice production enhancement
through wind pump water supply system. Both are expected to support farmers to produce an additional
34
crop cycle during the dry season – for vegetables harvesting is anticipated in late December, while rice
harvest is expected to be completed in April 2013.
Objective
The objective of this study is to:
establish the tools and techniques to measure outputs and outcomes;
monitor and review project implementation;
work with the famers and CFAP to measure the achievement of results to date; and
establish the methodology and assess the potential return on investment in terms of the future
impacts and cost -effectiveness of the introduced technology.
Scope of Study
The assignment will be conducted in targeted areas of Svay Rieng Province by closely working with farmer
households piloting the Rovai pump and wind pump. While the results for the vegetable cultivation are
expected to be completed within the timeframe of this study, the rice harvest falls outside it. It is therefore
expected that analysis on the results available and lessons to date from the rice farmers are captured and
that the measurement approaches and systems are established that will support reporting on the end
results.
The Consultant team is expected to consist of 1 team leader with 2 members who will stay in Svay Rieng
province during the period of assignment.
Deliverables and Reporting Timeframe
The assignment is expected to commence from 26 November 2012 and to be completed by 23 January
2013. The Consultant team is expected to organise and provide the following:
1. A review of the project’s Monitoring plan and develop:
a) measurement tools, data capture techniques (data recording, date entry form) and timelines for
data gathering;
b) concrete suggestions for additions or improvements to the Monitoring system (taking into account
cost-efficiency and effectiveness in methodologies); and
c) a detailed work plan reflecting the above which is to be provided and agreed with the SNV project
team by 30 November 2012 prior to being implemented.
2. On a day to day basis the focus for the consultant team will be :
a) to measure the amount of water produced by wind pump and capacity of water collection from rain
fall by storage pond
b) to measure the vegetable cultivation area by farmer after water storage and water supply system
improved;
c) measurement of the amount of water use for crop (rice and vegetable) and capacity of water supply
from pond to crops; and
d) monitoring and reporting the cultivating methods applied by farmers for both vegetable and rice
crops after the project interventions are introduced.
3. A presentation on the findings and feedback to date is to be provided at a climate change pilot project
workshop in Svay Rieng in late December 2012.
4. A draft report in English delivered to SNV, along with a presentation on the key findings and results no
later than 16 January 2013. This should include:
a) the measurement results available and comprehensive assessment of the up-take and effectiveness
of the introduced technology to date (Wind pump and Rovei pump). This needs to include changes
to farmer practices/adoption rates against the planned interventions and identification of any
barriers to change;
35
b) an assessment on return on investment and cost–effectiveness taking into account set up costs,
time investment of farmers and supporting organisation and estimates of future harvests;
c) an assessment of the gender impacts of introduced technology for example on participation, labour
and time reduction, income, and decision making;
d) potential for local project ownership and sustainability of the interventions including capacity to
scale up and maintain technology and changed agricultural practices;
e) recommendations on opportunities and linkages/synergies for better results; and
f) advice on unplanned positive and negative effects of the project, and possible mitigation measures.
5. The final report, in English and Khmer, submitted to SNV by 23 January 2013 incorporating SNV feedback.
Methodology
The consultant team should propose and select methods and approaches in their proposal. These
methodologies should include, but is not solely restricted to, the following:
Desk study on the available SNV project document including the feasibility study, the project
proposal, measurement plan (planned results and key indicators),baseline survey and monthly
progress project provided by CFAP; and
day to day data collection techniques including interviewing and observing farmer households.
Requirements of the Consultant
The consultant team must have the following required qualification, skills and experience:
Proven track record of carrying out similar assignments;
Demonstrated understanding of Cambodia agriculture context and climate related activities;
Proven knowledge of climate change context in Cambodia;
3-5 year experience in conducting qualitative and quantitative research, including data entry,
analysis, interpretation and writing report skill;
Experience in developing and establishing monitoring tools and approaches
Experience working with rural communities in Cambodia;
Willingness to work with community and stay in the province of Svay Rieng (consultant team
members);
Excellent analytical, interpersonal and communication skills; and
Excellent organisational skills.
Proposal
The firm must submit their proposal in two sections. The first section is the technical proposal which includes
the detailed work plan with timelines, methodology to the research, and response to the required
qualification, skills and experience and the second section is the proposed budget for activities undertaken in
the assignment, including daily rate.
Related Documents