Water Treatment Plant City of Bangor, Maine Final Revision 16 December 2015 Prepared by: David Smallwood Co-Authored: Seth MacDonald

Welcome message from author
This document is posted to help you gain knowledge. Please leave a comment to let me know what you think about it! Share it to your friends and learn new things together.
Transcript

Water Treatment Plant City of Bangor, Maine
Final Revision
16 December 2015
Prepared by:
David Smallwood Co-Authored:
Seth MacDonald

2
Table of Contents
TABLEOFFIGURES 4
TABLES 4
EXECUTIVESUMMARY 5
OBJECTIVE 6
POPULATION 7
BACKGROUND 7POPULATIONFORECASTING 8TRANSIENTPOPULATIONS 10
WATERDEMAND 13
WATERQUALITY 15
WATERSOURCEANDAVAILABILITY 18
FLOOD’SPOND 18CLIMATECHANGE 20
TREATMENTPLANT 21
TREATMENTPLANT 22PRE-TREATMENT:SCREENING 22COAGULATION 23NATURALORGANICMATTER(NOM) 23COLLOIDALDISPERSIONS 23ALUMINUMSULFATECOAGULATION 25ALKALINITY 25CHEMICALFEED 26CHEMICALMIXING 27ALTERNATIVECOAGULANTS 27FLOCCULATION 28SEDIMENTATION 29IRONANDMANGANESEREMOVAL 31FILTRATION 32TURBIDITY 34BACKWASHING 34
CHLORINEDISINFECTION 35
CHEMICALS 35REMOVALCREDITS 36CT 37CLEARWELLTANK 38DISINFECTIONBYPRODUCTS 39
3
HALOGENATEDBYPRODUCTS 39CHLORAMINES 40
DISTRIBUTIONSYSTEM 40
REACTORHYDRAULICS 44
WORKSCITED 45
APPENDIX1 47
POPULATIONFORECASTING 47
APPENDIX2 49
A:WATERDEMAND 49B:CHEMICALDOSING 49C:FLOCCULATION 49D:SETTLING 49E:FILTRATION 49F:CHEMICALDISINFECTION 49
APPENDIX3 61
EPAMCLLIST 61

4
Table of Figures Figure1:PopulationofBangor1960-2014................................................................................................7Figure2:BangorPopulationForecast[1]...................................................................................................8Figure3:2005CityofBangorZoningMap[2]............................................................................................9Figure4:BarHarborTouristsbyMonth...................................................................................................11Figure5:MaineTurnpikeTrafficbyMonth([6]......................................................................................11Figure6:DailyWaterConsumptionperCapita........................................................................................13Figure7:CityofBangorWaterDistributionSystem................................................................................18Figure8:Flood'sPondDepthMap[10]....................................................................................................19Figure9:ClimateChangeModels[13].....................................................................................................20Figure10:ConventionalWaterTreatmentProcessFlowDiagram..........................................................21Figure11:TreatmentPlantSchematic.....................................................................................................22Figure12:DiffuseDoubleLayer(source:AzoMaterials).........................................................................24Figure13:ZetaPotential[14]...................................................................................................................24Figure14:ChemicalMixing[15]...............................................................................................................27Figure15:FlocculationTank.....................................................................................................................28Figure16:SedimentationTankPlanView................................................................................................30Figure17:FiltrationMechanisms[15].....................................................................................................32Figure18:DualMediaFilterSchematic....................................................................................................33Figure19:FlowThroughTurbidimeter[19].............................................................................................34Figure20:TurbidityandHeadlossvs.Time[20]......................................................................................35Figure21:HOCLvsOCL[25].....................................................................................................................37Figure22:ClearwellTanks........................................................................................................................39Figure23:TypicalDistributionSystem.....................................................................................................41Figure24:ProposedDistributionSystemSchematic...............................................................................42Figure23:MapofBangor(Google)..........................................................................................................43
Tables Table1:AnnualWaterUsagefortheCityofBangor[8]..........................................................................13Table2:WaterUsageperCapita..............................................................................................................14Table3:MaximumContaminantLimits[9]..............................................................................................16Table4:SecondaryMaximumContaminantLimits[9]............................................................................16Table5:TestedCompounds[8]...............................................................................................................17Table6:FlocculatorVelocityGradients....................................................................................................28Table7:PaddleVelocities........................................................................................................................29Table8:CTTableforInactivationofGiardiaat5˚C[26]..........................................................................38

5
Executive Summary TomeetthedemandsofcurrentandfuturecustomerstheagingwatertreatmentplantanddistributionsystemfortheCityofBangormustbereplaced.Theproposedwatertreatmentfacilityhasbeendesignedtosupply34,000peoplewithanaveragedailydemandof5.5MGD.Thiswillaccommodatethecurrentpopulation,aswellasanyfuturepopulationandtransientpopulationsduetosummertourism.Water is tobe sourced fromanearby surfacewater reservoir: Flood’sPond. Located17miles fromBangoritprovidesexceptionallyclearwaterataratecapableofsustainingBangor’sdemand(8.2MGDreplenishmentrate).WaterwillbetransportedbypipelinefromthepumpingstationlocatedonFlood’sPondtothepointofdeliveryonMt.HopeAvenueinBangor.Fromtherewaterwillbedistributedtocustomersoverapproximately35squaremiles.Thewater treatmentplantwilloperateusingstandardwater treatmentprocedures.Water fromthesource is coagulated, particles settled, filtered, and treated with chlorine before distribution. Thetreatmentplantwilloperate3treatmenttrainswithafourthavailableforunforeseentimesofincreaseddemandorintheeventoffailureonanothertrain.Thecoagulatingagentusedwillbealuminumsulfateat15mg/Lwiththeadditionofcalciumhydroxidetoincreasealkalinity.Coagulatedwaterwillbemovedtoflocculatingtanksfor1hourtoagglomerateparticlestoexpeditethesettlingprocess.Flocculatingtankswillhaveaseriesofthreeflocculatingpaddleswithdecreasingvelocitygradients.Thevelocitygradiententeringthetankis451/s,andexitingvelocitygradientis151/s.Eachflocculatorwillhavefourarmswiththreeseven-square-footpaddlesattachedtoeacharm.Flocculationwillprovidedestabilizedwithsufficientkineticenergytoovercomerepulsiveforcesandagglomerateintolargerfloc.Agglomeratedparticleswillbe removed from the treatedwaterbygravityassisted settling.PerEPAstandards,settlingwilllast4hourstoallowformaximumsettlingofagglomeratedparticles.Thesettlingtankwillhaveasurfaceareaof3500ft2andadepthof12ft.settlingofparticlesis100%efficientforparticleswithadiameterlargerthan2.16E-4m.Fromsettling,thewaterwillbefilteredusingadual-mediasandfilter.Thetwolayerswillbecomprisedofanthraciteandsand,withasupportlayerofgravel.Eachtreatmenttrainwillhavetwofilters,foratotalofsixonline filters,andtwooffline.The filtersarecapableofprocessing4gpm/ft2, requiringasurfaceareaof160ft2.Eachfilterwillprocess9.2E5gallonsperday.Eachfilteriscapableofbeingrunforapproximately18hoursbeforerequiringabackwashsequence.Theindividualfilterswillbewashedseparately to minimize the total amount of water being drawn from the system at one point.Backwashingwilloccurat20gpm/ft2fora15-minuteinterval,requiring48,000gallonstocleaneachtank–288,000gallonsintotal.Duringbackwashthemediawillbefluidizedandexpandedto150%ofitsinitialvolume,andwillbestrippedofexcess impingedandadsorbedparticles,whicharewashedoffthroughbackwashtroughs.Beforedistributionthewatermustbechemicallytreatedtopreventthespreadofharmfulpathogens.TheEPA requires a99.9% inactivation (3-log)ofGiardia lamblia forwater tobe considered safe forconsumption.Thetreatmentplant’sphysicaltreatmentprocessesaredemonstratedtoremove2.5-logof Giardia, requiring an additional 0.5-log or greater chemical inactivation. To ensure adequate

6
inactivation,chemicaldosingwillbedeterminedfora2-loginactivation.Becausechemicaldisinfectionisdependentonachemicalreactionbetweenchlorinedisinfectantsandpathogens,thereactionkineticsmustbetakenintoaccounttoensureadequatetreatmenttime.ThenecessarytreatmenttimedependsonthepHandtemperatureofthewater,temperaturebeingacriticalparameterforBangor.Giventheexceptionally coldwinters the treatment tankmust be sized usingwater at 5˚C to ensurewater isproperlytreatedduringthecoldestmonths.UsingEPAsuppliedCTproducttablesthecontacttimefor2-loggiardiainactivationwasdeterminedfora2.6mg/Lchlorineconcentrationtobe370minutes.Thechemicaldisinfectanttobeemployedissodiumhypochloriteataconcentrationof2.75mg/L.TOtreat5.5MGDa12%sodiumhypochloritesolutionwillbefedintoaclearwelltreatmenttankatarateof0.125gpm.Thisrequires1800lbsof70%puresolidsodiumhypochloriteperday.Treatmentwilloccurinsideofabaffledclearwelltanktoensurethatthetankbehavessimilarlytoanidealreactor.Anun-baffled tank could cause short circuiting, leading to a potential distribution of active pathogens tocustomers.Fourclearwelltanksarerequiredforthetreatmentplantwithavolumeof47,100gallonseach.Thefourthtankwillbekeptofflineaspartofthebackuptrain.Adisinfectantresidualwillbecreatedusingammoniatoformmonochloramineanddichloramine.Theseresidualsdonotreactwithpathogensasrapidlyashypochloriteandthuswillremaininthewaterduringitsresidencetimeinthedistributionsystem.Giventhesizeofthedistributionsystemandthepotentiallylongperiodof timewaterwill remain in thesystem,asecondarydisinfectant isabsolutelycritical toensure high quality water is delivered to all customers regardless of their geographic location. Thedistributionsystemwillbedevelopedtomaintainadequatepressureandflowthroughoutbyusingpipeswithdecreasingdiameters.Themajortransportmainfromthetreatmentfacilitywillhaveadiameterof30”,andthepipeswillgraduallyreducedownto4”atthefurthestreachesofthedistributionsystem.Thevelocityofwaterwithinthepipesystemshouldnotexceed5ft/s.Atallpointsofusethewatermainswillbeconnectedtocustomersusingbackflowpreventerstoeliminatethepossibilityofuntreatedwaterfromre-enteringthesystem.IntroductionThecityofBangor,Maine’swatertreatmentplantanddistributionsystemhasreachedtheendofitsoperablelifespan.ThecityofBangorrequiresthedevelopmentofanewwatertreatmentplantcapableofservingits32,000residentsoveranareaofthirty-fivesquaremiles.Thenewwatertreatmentplantwillincludeacompletereplacementofthedistributionsystemasmuchoftheexistinginfrastructureisdegrading.ThefinalplantdesignmustbecapableofmeetingcurrentandfuturewaterdemandsforthecityofBangorandprovideredundanciesforeventsofemergencyortimesofincreasedwaterusage.
Objective TheobjectiveofthisreportistodevelopapreliminaryoutlineforawatertreatmentplantthatwillservethecommunityofBangor,Maine.Theproposedplantmustoperateusingsurfacewaterreservoirsandtreatwaterusingconventionalmethods,i.e.coagulation,chlorination.Theplantmustmeetthedemandof year-round residents as well as the extra demand generated in summermonths by the existingtourismindustry.

7
Population Background The population of Bangor, Maine is relatively difficult to model accurately. The population fluctuates by approximately 2,000 persons every ten years but experiences continual negative population growth as shown in Figure 1. The volatility and negative growth can be attributed to the demographics of the population: Bangor has an aging, mostly white population. In 2010 14.4% of the population was over 65 years; only 5.5% was under the age of 5, and 17.8% under the age of 18 [1]. Combined with a 2009-2013 median household income of only $35,107 and a population that is 24.3% below the poverty level, Bangor is not a picture of economic or population growth (US Census Data).
Figure1:PopulationofBangor1960-2014
31200
31400
31600
31800
32000
32200
32400
32600
32800
33000
33200
33400
1960 1970 1980 1990 2000 2010 2020 2030 2040 2050 2060
Popu
lation
Year
BangorPopulation

8
Population Forecasting TopredictthefuturepopulationofBangor,alinearmodelwascreatedusingthemaximumpopulationsizes between 1970 and 2014. While the population of Bangor has historically fluctuated between31,400 and33,200people, theoverall trend is that of negative growth (see Figure2).As thewatertreatmentfacilitymustbecapableofhandlingthecurrentpopulation,themaximumpopulationfromthedataset(33,200people)willbeusedtodevelopBangor’swatertreatmentfacility.While it isnotlikelythatthepopulationwilleverreachthatlevelagain,itprovidesthecityaddedflexibility.
Figure2:BangorPopulationForecast[1]
OutlinedintheCityofBangorComprehensivePlan2012isthezoningpolicyforthecityofBangor(SeeFigure3).ThemajorityoflandinBangorhasalreadybeendeveloped,orwillnotbefurtherdeveloped.Thelimitforurbandevelopmenthasnearlybeenreached,meaningthepopulationofBangorcannotphysicallygrowmuchlarger.
y=-3.225x+39547
31200
31400
31600
31800
32000
32200
32400
32600
32800
33000
33200
33400
1965 1975 1985 1995 2005 2015 2025 2035 2045 2055 2065
Popu
lation
Year
BangorPopulation

9
Figure3:2005CityofBangorZoningMap[2]

10
Where city development is no longer much of a possibility for the city of Bangor, and the growth-rate over the past 45 years has been negative, it is not expected that the population will ever increase over 34,000. While this is an estimate that is not directly supported by a mathematical model, it is a reasonable figure for developing a water treatment facility that will support the city of Bangor for at least the next fifty years. A population prediction of 34,000 gives the city a level of flexibility that will eliminate any concern of water availability – now, or in the future.
Transient Populations What is experiencing major growth in Bangor is the tourism sector, especially in summer months. Bangor is geographically very central to Maine, making it an excellent travel hub to nearby attractions: Acadia National Park, thirty-six state parks, shopping centers, etc. Bangor, being equally as close to the Canadian border as the New Hampshire border, serves as not only a destination, but also a stepping point for travel to other parts of the state or country. In 2010 Bangor began to invest in its potential as a destination point. The waterfront area along the Penobscot River was renovated and a concert pavilion erected. It was estimated that in the first three years the Waterfront Concert Series has generated more than $30 [3] million and attracted more than 200,000 people [4]. Further development along the waterfront area includes the Hollywood Slots & Casino – a hotel and casino complex; and the Cross Insurance Center – an arena capable of seating 8,500 people and an attached 2,000-person convention center. Because of Bangor’s central location and steadily growing tourism economy the population of the city using water is somewhat transient. A large influx of people is seen during the summer months, typically peaking in August. Bar Harbor, Bangor’s closest major tourist destination experiences an average of 1.8 million tourists between the months of June and September [5], monthly tourism shown in Figure 4. Travel from out of state to Bar Harbor is routed directly through Bangor if traveling by I-95. The influx of travel on I-95 through the summer months is shown in Figure 5.

11
Figure4:BarHarborTouristsbyMonth
Figure5:MaineTurnpikeTrafficbyMonth([6]
0
100,000
200,000
300,000
400,000
500,000
600,000
700,000
Jan Feb Mar Apr May Jun Jul Aug Sep Oct Nov Dec
TotalV
isitors
BarHarborTouristsbyMonth
2015 2014 2013 2012 2011 2010
3,500,000
4,000,000
4,500,000
5,000,000
5,500,000
6,000,000
6,500,000
7,000,000
7,500,000
Jan Feb Mar Apr May Jun Jul Aug Sep Oct Nov Dec
TotalCars
MaineTurnpikeTrafficbyMonth
2015 2014 2013

12
Many tourists visiting Bar Harbor and Acadia National Park choose to not stay on the island and will stay in either Ellsworth or Bangor, Bangor being only forty-five minutes away; Ellsworth twenty. Bangor has 2350 individual hotel rooms [3] and a new hotel with 124 additional rooms is being developed next to the Cross Insurance Center [7]. Shown in the next section are the fluctuations in water usage per month, much of which can be attributed to an influx of tourists.

13
Water Demand The existing water treatment plant for the city of Bangor provides ample data to predict the sizerequirementsofthenewplant.Inthetablebelow(Table1),themonthlyandyearlywaterdemandsforthecityofBangorfrom2009-2014areshown.
WaterUsage(inmillionsofgallons)Month 2009 2010 2011 2012 2013 2014
January 139 137 125 129 129 127February 148 126 117 121 117 119March 139 137 129 132 128 129April 132 136 124 124 129 133May 142 158 133 140 137 133June 148 157 145 129 140 134July 146 173 152 154 145 141August 165 188 143 157 146 140September 163 166 135 136 135 131October 150 167 134 140 136 127November 157 149 127 129 130 121December 136 130 129 124 125 117YearTotal 1765 1824 1594 1614 1596 1554GallonsDaily 4.83 5.00 4.37 4.42 4.37 4.26
Table1:AnnualWaterUsagefortheCityofBangor[8]
From the provided water usage data, average, minimum, and maximum daily flow rates can be calculated and used to design a plant of optimal size for Bangor.
Figure6:DailyWaterConsumptionperCapita
0
20
40
60
80
100
120
140
160
180
200
2009 2010 2011 2012 2013 2014
GPC
D
Year
DailyWaterConsumptionperCapita
MaxGPCD MinGPCD AnnualAverage

14
AsshowninFigure6,thedailywaterconsumptionpercapitastaysconsistentfrom2011forwardwithanannualaverageof138gallonspercapitaperday(gpcd).Theaveragemaximumwaterusagefrom2011to2014is146gpcd.
WaterUsageperCapitaYear 2009 2010 2011 2012 2013 2014
Population 33000 33039 33000 33000 32800 32568MaxGPCD 161 184 149 154 144 140MinGPCD 133 123 127 127 123 116AnnualAverage 146 151 132 134 133 131
Table2:WaterUsageperCapita
Assumingamaximumpopulationof34,000people,themaximumdailywaterdemandfortheCityofBangoris4.96milliongallonsperday(MGD).Toaccountforleakagethroughoutthedistributionsystem,a10%leakageratewasusedyieldinga5.5MGDmaximumdailydemand.Thepeakhourlydemand forBangor is2 timesgreater thanthepeakhourlydemand,11MGD.ThepeakhourlydemandwillnotbeusedforsizingthetreatmentplantasdemandfluctuationswillbemanagedbystandpipeslocatedaroundBangor.CalculationsinAppendixA.

15
Water Quality The quality of water that leaves the treatment plant must be in compliance with standards implemented by the Environmental Protection Agency (EPA) Safe Drinking Water Act. In accordance with Maine Title 22: Health and Welfare, Chapter 601: Water for Human Consumption §2611.
1. State primary drinking water regulations. The commissioner shall promulgate and enforce primary drinking water regulations which are necessary to protect the public health and which shall apply to all public water systems. Such regulations shall include:
a. Identification of contaminants which may have an adverse effect on the health of persons;
b. Specifies for each contaminant either: i. A Maximum contaminant level that is acceptable in water for human
consumption, if it is feasible to ascertain the level of such contaminant in water in public water systems; or
ii. One or more such treatment techniques or methods which lead to a reduction of the level of such contaminant sufficient to protect the public health, if it is not feasible to ascertain the level of such contaminant in water in the public water system; and
c. Criteria and procedures to assure compliance with the levels or methods determined under paragraph B, including quality control and testing procedures to insure compliance with such levels or methods and to insure proper operation and maintenance of the system, and requirements as to the minimum quality of water which may be taken into the system and the siting for new facilities.
Such regulations shall be no less stringent than the most recent National Primary Drinking Water Regulations in effect, as issued or promulgated by the United States Environmental Protection Agency. Regulations under this subsection may be amended from time to time, as necessary.
2. State secondary drinking water regulations or guidelines. The commissioner shall adopt secondary drinking water regulations or guidelines which are necessary to protect the public welfare. Such regulations or guidelines may apply to any contaminant in drinking water which may adversely affect the color, odor or appearance of the water and consequently may cause a substantial number of persons to discontinue using a public water system, or which may otherwise adversely affect the public welfare. Such regulations or guidelines may vary according to geographic, economic, technical or other relevant circumstances. Such regulations or guidelines shall reasonably assure the protection of the public welfare and the supply of aesthetically adequate drinking water; and shall be based upon the National Secondary Drinking Water Regulations promulgated by the United States Environmental Protection Agency. Regulations or guidelines under this subsection may be amended from time to time, as necessary.

16
The Maximum Contaminant Limits (MCLs) of compounds after treatment are shown below in Table 1 along with Maximum Contaminant Limit Goals (MCLGs) for the City of Bangor. MCLs are limits that the Environmental Protection Agency strictly enforces, MCLGs are goals set by the City of Bangor for maximum contaminant limits in the drinking water.
Pre-TreatmentMeasurement Units MCLG MCLTurbidity NTU N/A 5
TreatedWater Disinfectant Units MCLG MCLChloramines mg/l 4 4Compound Barium mg/l 2 2Copper mg/l 1.3 AL>1.3Fluoride mg/l 4 4HaloaceticAcids µg/l N/A 60Lead µg/l 0 AL>15Trihalomethanes µg/l N/A 80Uranium µg/l 0 30
Table3:MaximumContaminantLimits[9]
SecondaryMaximumContaminantLimit(SMCLs)areshownbelowinTable2.SMCLsarenotenforcedlimits,butare limits recommendedby theEPAsetbecauseofemergingevidenceofnegativehealthconsequencesorforaestheticpurposes.
Table4:SecondaryMaximumContaminantLimits[9]
SecondaryGoalsCompound Units SMCLChloride mg/l 250Color unit 15Copper mg/l 1Hardness mg/l 500Iron µg/l 300Silver µg/l 100Sodium mg/l 100Sulfate mg/l 250Zinc mg/l 5

17
Thefollowinglistsofcompoundswillbetestedforregularly:
PesticidesandHerbicides:Allnotfoundwhenlasttested.2,4-D; 2,4,5-TP (Silvex); Alachlor; Atrazine; Carbofuran; Chlordane; Dalapon; Dinoseb; Diquat; Endothal; Endrin;Glyphosate; Heptachlor; Heptachlor epoxide; Lindane; Methoxychlor; Oxamyl (Vydate); Pen- tachlorophenol;Pichloram;Simazine;andToxaphene.SyntheticOrganicCompounds:Allnotfoundwhenlasttested.Benzo (a) pyrene [PAHs]; Di (2-ethylhexyl) adipate; Di (2-ethylhexyl) phthlates; Hexachlorobenzene;Hexachlorocyclopentadiene;andpolychlorinatedbiphenyls.InorganicChemicals:Antimony; Arsenic; Asbestos; Beryllium; Bromate; Cadmium; Cyanide; Iron; Lead; Mercury; Nitrate; Nitrite;Selenium;Silver;Thallium;andZinc.VolatileOrganicCompounds:Allnotfoundwhenlasttested.Ethylbenzene;Styrene;cis-1,3-Dichloropropene;trans-1,3-Dichloropropene;n-Propylbenzene;n-Butylbenzene;4-Chlorotoluene; 1,4-Dichlorobenzene; 1,2-Dibromoethane; 1,2-Dichloroethane; 1,3,5- Trimethylbenzene;Bromobenzen; Toluene; Chlorobenzene; 1,2,4-Trichlorobenzene; Dibromochloromethane; Tetra- chloroethene;sec-Butylbenzene; m,p-Xylenes; 1,3-Dichloropropane; cis-1,2-Dichloroethene; trans-1,2-Dichloroethene; Methyltert-Butyl Ether; 1,3-Dichlorobenzene; Carbon Tetrachloride; 1,1-Dichloropropene; 2,2-Dichloropropane; 1,1,1,2-Tetrachloroethane; Chloroform; Benzene; 1,1,1-Trichloroethane; Bromomethane; Chloromethane;Dibromomethane;Bromochloromethane;Chloroethane;VinylChloride;Bromoform;Bromodichloromethane;1,1-Dichloroethane; 1,1- Dichloroethene; Trichlorofluoromethane; Dichlorodifluoromethane; 1,2-Dichloropropane;1,1,2-Trichloroethane;Trichlo-roethene;1,1,2,2-Tetrachloroethane;Hexachlorobutadiene;Naphthalene;o-Xylene;2-Chlorotoluene; 1,2- Dichlorobenzene; 1,2,4-Trimethylbenzene; 1,2-Dibromo-3-chloropropane; 1,2,3-Trichloropropane; tert-Butylbenzene; Isopropylbenzene; 4-Isopropyltoluene; Methyl Ethyl Ketone;Dichloromethane;CarbonDisulfide;MIBK;2-Hexanone;Nitrobenzene;and1,2,3-Trichlorobenzene.MicrobialParameters:Allnotfoundwhenlasttested.TotalcoliformbacteriaandE.coli;andCryptosporidium:testedquarterlybeforetreatment.UnregulatedCompounds:1,2,3-trichloropropane; bromomethane; chloromethane; bromochloromethane; chlorodifluo- romethane; 1,3-butadiene;1,1-dichloroethane;1,4-dioxane;molybdenum;cobalt;perfluorooctanesulfonicacid;perfluo-rooctanoicacid;perfluorobutanesulfonicacid;perfluorohexanesulfonicacid;perfluoroheptanoicacid;andperfluoronon-anoicacid.Table5:TestedCompounds[8]
Forcompoundgroupsannotatedwith“Allnot foundwhen last tested”,compoundswerepresent inamountssmallerthanthedetectablelimit(foruntreatedwaterfromFlood’sPond).Compoundsfoundto be above detectable limits are listed in Table 1 and Table 2. The complete list of contaminantsregulatedbytheEPAcanbefoundinAppendixB.

18
Water Source and Availability Flood’s Pond Water for theCity of Bangorwill be sourced fromFlood’s Pond, a naturally occurring pond locatedseventeenmileseastofBangor.Flood’sPondliesinawatershedofapproximately8squaremiles
Figure7:CityofBangorWaterDistributionSystem
TheestimateddependableyieldofFlood’sPondisabout8.2milliongallonsperday.Toprotectthiswatersource,theBangorWaterDistricthaspurchasedthousandsofacressurroundingthepondtopreventactivitieswhichcouldimpactwaterquality.

19
Figure8:Flood'sPondDepthMap[10]
Flood’sPondcoversanareaof654acreswithamaximumdepthof133 feet.Access to thispond isrestrictedbya lockedgateand fishing isprohibited in theareawithin1.5milesof the intakeof theBangor Water District [10]. Water sourced from Flood’s Pond is exceptionally clear with a highestturbiditymeasurementof0.56NTU[8].Itisanon-coloredlake(averagecolor14SPU)withanaverageSecc[11]hiDiskTransparencyof7.6m[12].Flood’spondprovidesexceptionallycleanwaterthatdoesnotrequireasignificantamountoftreatmentbeforedistributiontocustomers.TheonlydisadvantagetoFlood’sPondisitsdistancefromthecityofBangor,requiringa17-milepipelinebetweenthesourceandpointofdistribution.

20
Climate Change Bangor,MaineislocatedintheNortheastUnitedStates,aregionwithmoderateseasonalprecipitationandatemperateclimate.Thereareabundantwaterways,aquifers,andnaturalspringswithintheregion.
Figure9:ClimateChangeModels[13]
Though it is predicted by allmodels in Figure 9 that the average temperature in theNortheastwillgraduallyincrease,theprecipitationwillsimultaneouslyincrease.Bangorislocatedinawater-richregionanditisnotlikelythattherewillbeawatershortagewithintheforeseeablefuture.

21
Treatment Plant The treatmentplant for theCityofBangorwilloperateusingconventionalmethodsof treatment.AproceduralflowchartforconventionalwatertreatmentisshownbelowinFigure10.
Figure10:ConventionalWaterTreatmentProcessFlowDiagram
Waterispumpeddirectlyfromthesurfacewaterreservoir(Flood’sPond)throughascreentopreventanylargeimpurities(e.g.logs,leaves,fish,etc.)fromenteringthesystem.Waterisrapidlymixedwithacoagulating agent before moving to a flocculation tank where it is gently agitated to aggregatesuspendedparticles,allowingthemtosettleoutinthesettlingtank.Waterispassedthroughafiltrationsystem,chemicaldisinfectantisadded,andthetreatedwaterissentoutfordistribution.

22
Treatment Plant The layoutof this treatmentplant follows the typical designofmany conventionalwater treatmentplants.Surfacewaterisrapidlymixedwithcoagulatingagentsbeforemovingintoflocculationtanks.Asthecoagulatedwatermovesthroughtheflocculationtankstheenergytransferredtothewaterbythepaddlesisreducedbeforemovingintosettlingtanks.Thesettledwaterisremovedbyweirsandmovedintoafiltrationstagebeforebeingmixedwithchemicaldisinfectantsinclearwelltanksandsenttothedistributionsystem.Atop-viewschematicoftheproposedtreatmentplantisshownbelowinFigure11.
Figure11:TreatmentPlantSchematic
Threeofthetreatmenttrainswillbeutilizedduringnormaloperation.Afourthtrainispresentfortimesofincreaseddemandandservesasabackupintheeventofatrainfailure.Eachtrainhastwofilterstoreducetheloadonotherfiltersduringbackwash.
Pre-Treatment: Screening WaterthatistakenfromFlood’sPondwillbescreenedtopreventlargeparticles,suchaslogsorleavesfromenteringthetreatmentsystem.BecauseofthehighclarityofwaterinFlood’spond(NTU=.56[9])waterenteringthetreatmentsystemdoesnotrequirepre-sedimentationoranyotherpre-treatments.

23
Coagulation Coagulationistheprocessofaddingchemicalstowatertocollectsmallclustersofparticlesintolargergroupssothattheycanberemovedbysedimentationorfiltration.Thegoalofcoagulationistoremovesurfacechargefromparticlessuspendedinthewatersothattheycancollideandaggregate.Turbidityparticlesrangeinsizefrom0.01to100micronsinsizeandcarriesanegativesurfacecharge.Particleswithsimilarsurfacechargesrepeleachotherandthuscannotinteracttoformaggregates[14].AsecondaryfunctionofcoagulationistoremoveNaturalOrganicMatter(NOM)fromthewater.NOMcanbecreatedbyalgalactivityorleachfromsoilsintothewater.NOMcanbepresentinparticulateformoroccurinasolubleform.NOMparticleshavenodefinitechemicalcompositionbuttypicallycarryanegativecharge.NOMcausesnaturalcolorinwater,whichdoesn’tnecessarilyimpactthequalityofthewaterbutcanproduceharmfulbyproductsduringtheprocessofchemicaldisinfection[15].NOMmustberemovedbeforewaterisfurthertreated.NaturalOrganicMatter(NOM)NaturalOrganicmatter is created by the activity of algae inwater or can be leached from soil in awatershed.NOMhavenodefinitemolecularcompositionandcanbepresent ineitherparticulateorsolubleform.NOMarenotbynecessityharmful,butcancausepotentiallyharmfulbyproductsinduringtheprocessofchemicaldisinfection,andthusmustberemovedbeforedistribution[15].ColloidalDispersionsColloidaldispersionsarediscreteparticlesheldinsuspensionbytheirsmallsize(1-200nm)andsurfaceelectriccharge.Forlargeparticles,gravityforceshaveagreateffectonsettlingthemoutofwaterduetothelowsurfaceareatomassratio.Smallparticleswithasmallsurfaceareatomassratioaregreatlyinfluencedbysurfacephenomenasuchaselectrostaticrepulsion.Acolloidaldispersionisclassifiedasstable when the dispersion shows no tendency to aggregate. The repulsive force of a net-negativesurfacechargepreventsparticlesfromcontacting[15].Thenet-negativesurfacechargeisbetterdescribedasadouble-layersurroundingahydrophobiccolloidparticle.Anegativeparticlesuspendedinwaterwillattractpositiveionsbyelectrostaticattraction.ThislayerofpositiveionsisknownastheSternlayer(showninFigure11).

24
Figure12:DiffuseDoubleLayer(source:AzoMaterials)
TheSternlayer’snetpositivechargeattractsnegativeparticleformingadiffuselayerofcounter-ions(negativelycharged).The layerofdiffuse ions results ina zetapotential,anelectricpotential that isequivalenttothemagnitudeofchargeatthesurfaceoftheshearplane[15].
Figure13:ZetaPotential[14]

25
AluminumSulfateCoagulationAluminumsulfateasa coagulatingworksbyneutralizing chargeson suspendedparticles so that theparticlescan interactandcombineto form largerparticlesthatwill settlemorequickly.Asecondaryfunctionofaluminumsulfateistoproduce“sweepfloc”,hydrousmetaloxidesthatprecipitateoutofsolutionandentrapcolloidalparticlesand“sweep”themoutofthewater[14].Aluminum sulfate neutralizes particles in the water by producing positively charged hydroxidecomplexesasperthefollowingreactions:
Overall:!"# $%& ' ∙ 14+#% + 3./ %+ # → 2!" %+ ' + 3./$%& + 6.%# + 14+#%
Step1:!"'3 + %+4 → !" %+ #3Step2:!" %+ #3 + %+4 → !" %+ #
3Step3:!" %+ #
3 + %+4 → !" %+ 'Reaction1:HydrolysisofAluminumSulfate
Toremovecolloidalparticlesfromthewatertheymustbedestabilizedandaggregated.Destabilizationis accomplished by compressing the double charge layer (reducing the zeta potential), chargeneutralization, and enmeshment. By compressing the double charge layer particles are allowed tocontactwhenvanderWaalsattractiveforcesovercometheelectrostaticrepulsiveforces[15].Compressionofthedoublechargelayerisnotaseffectiveasdirectchargeneutralization,asoccurswiththeadditionofpositivelychargedaluminumcomplexes.Chargedspeciesadsorbthecolloidtoreducethesurfacecharge.Asthecolloidalparticlesrealizeneutralchargestheybegintoaggregate[15].AlkalinityForaluminumsulfatetoadequatelycoagulateparticlesthehydrolysisreactionmustgotocompletion.AsshownaboveinEquation1,thestoichiometryofthealuminumsulfatehydrolysisreactionrequires3molesofhydroxideionstoreact1moleofaluminumsulfate.WithoutsufficienthydroxideionspresentAl3+ ions will not hydrolyze to produce hydroxide complexes capable of adsorbing stable colloidalparticles.Inwaterwithnoalkalinitypresenttheoverallhydrolysisofaluminumsulfateis:
!"# $%& ' ∙ 14+#% + 6+#% ↔ 2!" %+ #3 + 2+3 + 3$% + 14+#%Reaction2:AluminumSulfateEquilibriumwithWater
ThecreationofhydrogenionswilldepressthepHofthewater,shiftingtheequilibriumofthereactiontofavorreactantsuntilthereactiondoesnotproceedfurther.Tokeep the reactionproceeding forward thepHmustbeadjusted toavaluebetween6and8 [15]providingsufficienthydroxide ionsforthereactiontoproceed(Reaction1).Theadditionofeach1.0

26
mg/L of aluminum sulfate decreases the alkalinity ofwater by 0.5mg/L (from the stoichiometry ofreaction3)[15].
!"# $%& ' ∙ 14+#% + 6+#% ↔ 2!" %+ ' ↓ +6+3 + 3$% + 14+#%Reaction3:PrecipitationofAluminumHydroxides
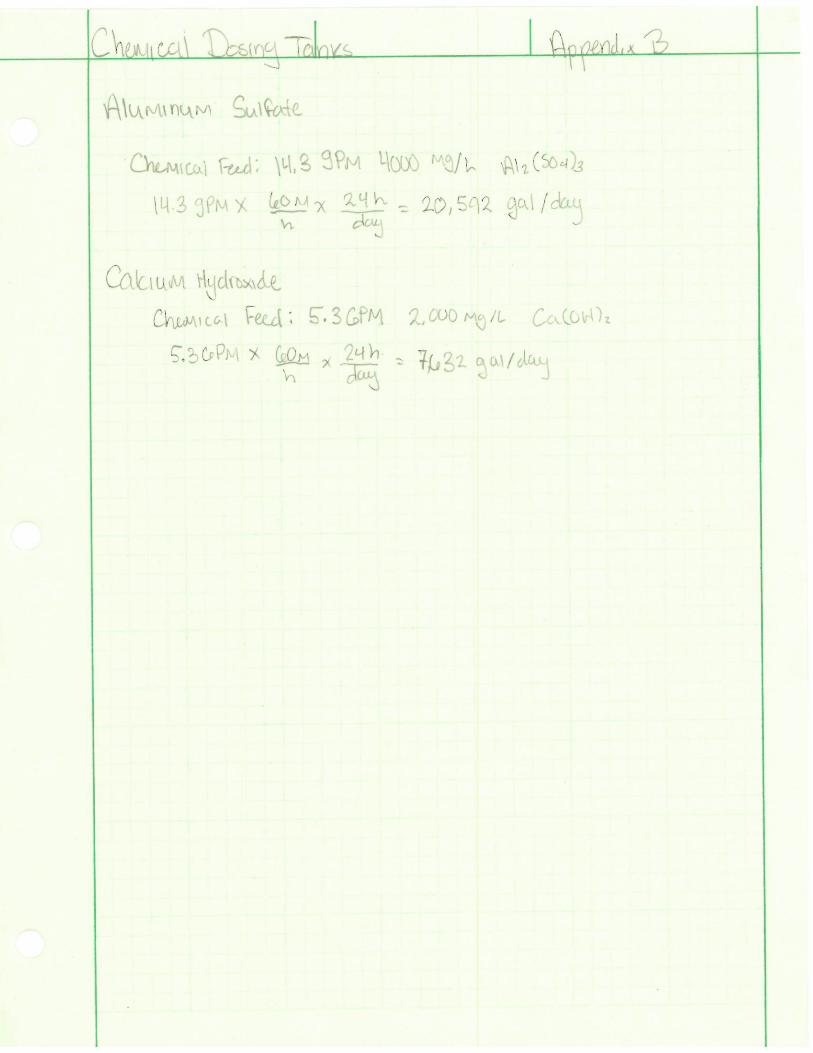
Toincreasethealkalinityofthewatertheadditionofcalciumhydroxide(lime)isrequired[13].GiventhegeographiclocationofFlood’sPondthenaturalalkalinityisnotsufficientforthealuminumhydroxidehydrolysisreaction.Inregionswherelargeamountsofnaturallyoccurringlimestoneispresentalkalinitytreatmentisnotalwaysnecessary,butwheretheprimaryrockformationsinMainearegranitethewaterhaslittlenaturalalkalinity.ThenaturalalkalinityofFlood’sPondis5mg/LasCaCO3(assumed,nodataavailable)andmustbeincreasedbeforealuminumsulfatecoagulationisperformed.ChemicalFeedAluminum Sulfate ThenecessarydoseforcoagulatingwaterfromFlood’sPondis15mg/L.Toadequatelytreat5.5MGD,688.5lbs/dayofaluminumsulfatearerequired.Assumingachemicalpurityof90%thistranslatesto765lbs/day.Toaddthistothewaterfortreatmentthealuminumsulfatewillbemadeintoaslurrywithaconcentrationof4,000mg/L.Thefeedflowrateforthealuminumsulfateslurryis14.3gpm.CalculationsinAppendixB.Thechemicalfeedtankforaluminumsulfateequippedtotreat5.5MGDofwateris20,600gallonsifonebatch of slurry is prepared daily. This design assumes one tank to feed all three treatment trains,however it could also be split into four tanks capable of handling 6,900 gallons each. The primaryadvantagetoindividualfeedtanksisredundancyforthesystemincaseofafailure.Calcium Hydroxide Toachievethecorrectalkalinityforcoagulation,2.78mg/LCa(OH)2(lime)mustbeadded.Aslurrywithlimewillbepreparedtoaconcentrationof2,000mg/Landaddedtothewateratarateof5.3gal/min.CalculationsinAppendixB.Aswiththealuminumsulfatechemicalfeedthecalciumhydroxideslurrytankcanbeeitherone7,700-gallontankorfour2,600-gallontanks.

27
ChemicalMixingChemicalslurrieswillberapidlymixedwithwaterusingamixerasshownbelowinFigure14.
Figure14:ChemicalMixing[15]
WaterthatentersthetreatmentsystemfromFlood’sPondwillbeimmediatelysubjectedtorapidmixingwitha coagulatingagent. The recommended residence time formixingwater isbetween10and30secondswithavelocitygradientof750s-1[15].Toadequatelymix5.5MGD,thetreatmentplantforthecityofBangorwillrequirefour1.5horsepower,320gallonmixerswitha15seconddetentiontime.Thisspecificationisassuminga70%mixerefficiency.CalculationsfoundinAppendixB.AlternativeCoagulantsAlternativestoaluminumsulfateasacoagulatingexist,aluminumsulfatewaschosenbecauseitistheleastcostinhibitive.Othercommonmetal-basedcoagulantsinclude:aluminumchloride,ferricsulfate,andferricchloride.Inadditiontometal-basedcoagulantstherearepolymer-basedcoagulatingagents,whicharegenerallypurerandproducefewersolids;butaremoreexpensiveanddon’tproducesweepfloc.Ironbased coagulants aremore effectiveover awider pH range and are typicallymore effective atremoving NOM from water [15]. Because Flood’s Pond has a very low concentration of NOM, asindicatedbyanaveragecolor14SPU(colorless)andlowturbidity(0.56NTU)theuseofmoreexpensiveironbasedcoagulantsisnotjustifiable.

28
Flocculation Flocculationisthephysicalprocessofagitatingcoagulatedwatertopromoteaggregationofparticlessuspendedinthewater.Onceparticleshavebeendestabilizedbycoagulationtheparticlesarecapableofaggregatingbut lacksufficientkineticenergytoformflocs.Gentleagitationofthewaterprovideskineticenergytotheparticles,butnotenoughtobreakapartflocs.Coagulatedwaterwillmovethroughathree-stageflocculationtankthroughflocculatorpaddleswithdecreasingvelocitygradients.Waterthathasbeentreatedwithcoagulatingagentswillimmediatelymovetoflocculatingtankswhereparticleswillagglomeratewiththeaidofgentlemixing.Flocculationdetentiontimeshouldbeatleast30minutesandutilizeadiminishingvelocitygradientdesign.Theflow-throughvelocityshallalsonotexceed1.5feetperminute.TheEPArecommendedflocculationretentiontimeis1–2hours[16].
Figure15:FlocculationTank
Flocculationwilloccurinthreeseparatetanks,withafourthidenticaltankconstructedasaback-up.Toservethe5.5MGDsystem,thethreetankswilleachhandle1.83MGDwithaflocculationtimeof1hour.Thenecessarytanksizetoaccommodatetheseparametersis76,250gallons(289m3).Thedimensionsoftheflocculationtankare59.5’Lx15’Wx12’H,accommodatingflocculatorpaddlesthatare14’long.Paddlearmswillhavea5’totalradiuswiththree7ft2paddlesat2’,3.5’,and5’.CalculationsinAppendixC.ThevelocitygradientsofthestagesareshownbelowinTable6.
Stage VelocityGradient(s-1) ResidenceTime(min) Power(ftlbs-1)1 45 20 6002 30 20 266.53 15 20 66.6
Table6:FlocculatorVelocityGradients

29
Theflocculationstagesconsistof4-armflocculators,eacharmholding3paddles.Thedimensionsofeachpaddleare14ftx0.5ftforasurfaceareaof7ft2.TomeetthepowerrequirementsoutlinedinTable6thepaddlerotationalvelocitieswerecalculatedusingtheequation:
8 =:2.;!<= 1 − ? ' 2@A ' B<
'
<
C
Equation1:PowerDissipatedbyPaddleFlocculator[15]
Theresultsofthisequation,solvingforNareshownbelowinTable7.CalculationsinAppendixC.Stage Power(ftlbs-1) RPM Velocity
1 600 5.55 3.06ft/s2 266.5 4.29 2.25ft/s
3 66.6 2.70 1.42ft/sTable7:PaddleVelocities
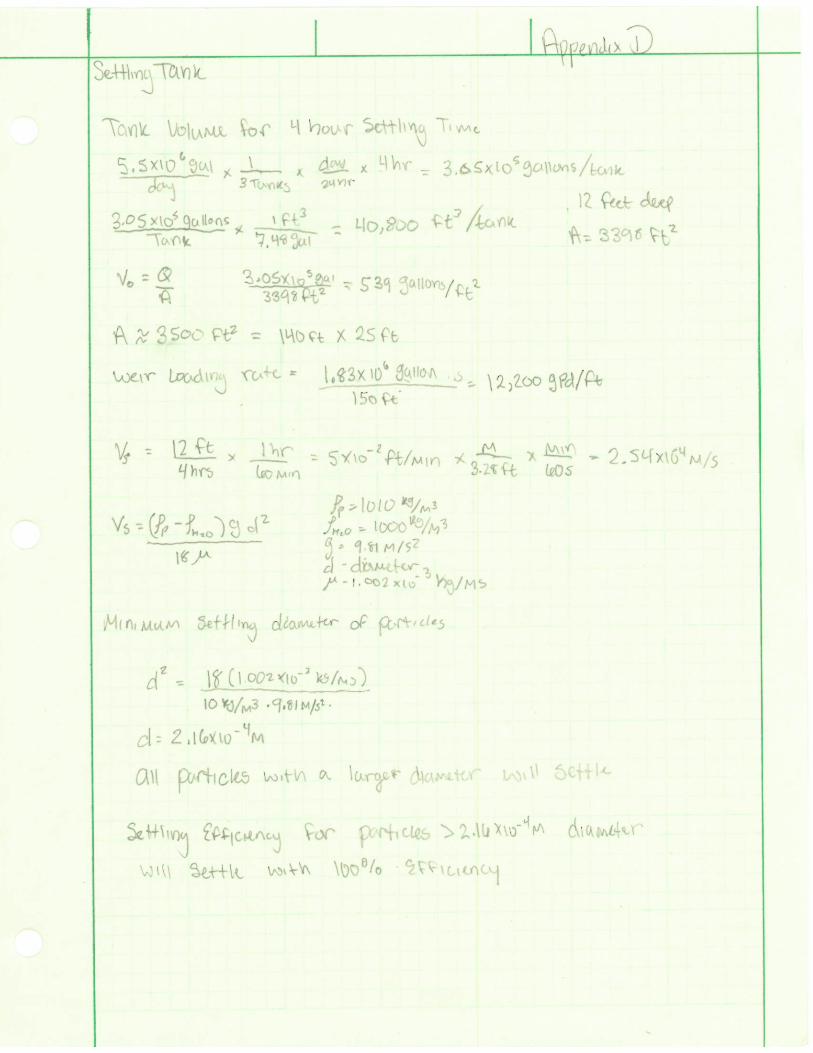
Sedimentation Sedimentationistheprocessofsettlingparticlesoutofthewaterusinggravity.Thesettlingtankmustallowforatleastfourhoursofsettling.Settledwaterwillbeoutletthroughweirsontheoppositesideoftheinlet.Therateofflowovertheoutletweirsmustnotexceed20,000gallonsperdayperfoot[16].Toallowforeffectivesettling,thetankmustprovidenon-turbulent,calm,laminarflow.Toachievethisthehydraulicloadingrateofthetankmustnotexceed0.5gpmpersquarefoot[16].Aswithflocculation,sedimentationwillbedividedintothreetankswithafourthback-uptank.Thetankrequiredtohandle1.83MGDis3.05E5gallons(1155m3)andallowsforafourhoursettlingtime.The tankwill be 12 ft deep and have a surface area of 3400 ft2: 140 ft long, 25 ftwide. For thesedimensionstheweir loadingratewillbe12,200gpd/ftusingsix,25ftweirspertank;andthecriticalsettlingvelocityis0.05ft/min.CalculationsinAppendixD.Thetheminimumsettlingdiameterofflocculatedparticlesisdeterminedusingthefollowingequation:
DE ==FGHI − =JKL MN#
18µ
Where=FGHIIisthedensityofcoagulatedparticles(1010kg/m3foralumflocc),andµistheviscosityof
waterat20˚C(1.004E-3kg/ms).Givenacriticalsettlingvelocityof0.05ft/min(2.54E-4m/s),theminimumparticlediameterfor100%settlingefficiencyis2.16E-4m.CalculationsinAppendixD.

30
Figure16:SedimentationTankPlanView
Thetankwillgraduallyaccumulatesettledmaterialatthebottomwhichmustbeperiodicallyremoved.Thereareseveralsystemsthatcanbeimplementedtoremovethesettledmaterial,andwillbediscussedatgreaterlengthinfuturereports.Thegeneralmechanismformaterialremovalisamovingscraperthatspansthewidthofthetank,pushingsludgeintoaremovaltrough.

31
Iron and Manganese Removal Ironandmanganesearebothnaturallyoccurringingroundandsurfacewaterandwhiletheyposenohealththreattheirpresencebecomesanaestheticproblem.Ironinconcentrationsgreaterthan0.3mg/landmanganeseconcentrationsgreaterthan0.05mg/lcanstainplumbingfixturesandlaunderedclothes[15].Toprovideasatisfactoryaestheticwaterqualitytoconsumers,ironandmanganeseconcentrationsmustbereducedbelowlevelsthatcancausestaining.Whenmanganeseconcentrationsexceed0.1mg/lthemanganeseioncanimpartanundesirabletaste[17].Whencompoundscontainingmanganese(II)undergooxidationmanganeseisprecipitatedcausingencrustationandblackcoatingsonpipesatconcentrationsaslowas0.02mg/l[17].Thepresenceofiron,whilealsonotthreatening,canproducefoultastesandodorsfromthegrowthofironbacteriainthewatermains.Thebacteriausereducedironasanenergysource,causingittoprecipitate.Thedecayofaccumulatedbacterialslimescanproducebadtastesandodors[15].Bothiron(II)andmanganese(II)aresoluble,reducedformsthatexistinanaerobicenvironments.Whenexposed to oxidizing conditions both reducedmetals oxidize into their stable formsof iron (III) andmanganese(IV)[15].Therateofoxidationofironandmanganesedependsontheoxidizingagent,pH,alkalinity,organiccontent,andthepresenceofcatalysts[15].Becauseofthekineticsofthereactionsbetweenmanganeseandair,andironandairanoxidantmayneedtobeintroducedtothefeedtofacilitateoxidationbeforethecoagulationstep.Ifparticlesarenotprecipitatedbeforecoagulationoccurs,theywillnotformflocandthuswillnotsettle.Inthepresenceof air, iron is oxidized relatively quickly, on the order of a minute depending on temperature andconcentration.Magnesium,however,takesdaysorweekstobeoxidized[18].Toadequatelyprecipitatebothionsbeforecoagulationoccursaoxidizingagentmustbeaddedtothewater.Commonoxidizingagents include: ozone, chlorine dioxide, potassium permanganate, hypochlorite, chlorine gas, andoxygen[18].Water present in Flood’s Pond does not have high enough levels of iron ormanganese towarranttreatment.For2014theconcentrationofmanganesepresentwas3.2µg/l(SMCL=50µg/l)andironwasnot detected (SMCL = 300 µg/l) [9]. Should future tests show an increased concentration of eithermanganese or iron that exceeds their respective SMCLs a chemical feed line for potassiumpermanganatewillbeavailablebutnotimplementedunlessrequired.Manganeseandironareoxidizedwithpotassiumpermanganatebythefollowingreactions:
3QR#3 + S:%&4 → 3QR'3 + S:%#3S:#3 + 2S:%&4 → 5S:%#
Equation2:OxidationofIronandManganese
Bothreactionsoccurinseconds,effectivelyprecipitatingsolidparticlesbeforecoagulationoccurs.

32
Filtration Filtrationisthefinalstepofwatertreatmentbeforechemicaldisinfectionanddistributionandisthefinal chance tophysically removeparticulates (including virusesandbacteria fromwater). Themostcommon typeof filtration is gravity granular-media filtration. Themechanisms involved in removingsuspended particles include interception, straining, flocculation, and sedimentation [15]. ThemechanismsareshownbelowinFigure16.
Figure17:FiltrationMechanisms[15]
Smallerparticlesthathavenotbeencoagulatedcanphysicallypassthroughthefiltermediawithlittleresistance. The effectiveness of a filtration system is equally dependent on effective coagulation asflocculation.Manysmallerparticles(includingbacteriaandviruses)areremovedbyadsorptionontothefiltermedia,aresultofproperparticledestabilization.ThefilterstobeusedfortheBangorwatertreatmentfacilitywillbedual-mediagravityfiltrationsystemsusinganthraciteandsand:Filteranthracitemustconsistofhard,durableanthraciteparticleswithaneffectivesizeof0.8mm–1.2mmandauniformitycoefficientlessthan1.7.Thespecificgravityoftheanthracitemustbegreaterthan1.4,haveanacidsolubilityoflessthan5%,andbeharderthana2.7ontheMho’sscale[16].Thelayerofsandmusthaveaneffectivesizeof0.45mm–0.55mmwithauniformitycoefficientnotgreaterthan1.65.Thesandmusthaveaspecificgravitygreaterthan2.5withanacidsolubilityoflessthan5%[16].

33
Thefinallayerofgravelwillconsistofcleanedgravelthatdoesnotincludeflatorelongatedparticles.Thecoarsestgravelshallbe2.5incheswhenitrestsdirectlyonalateralsurface,andnotlessthanfourlayersofgravelmustbeprovidedwiththefollowingsizeanddepthdistributions:[16]
Typicalfiltrationratesarebetween2and4gpm/ft2,andmustnotexceed4gpm/ft2unlesseffectivenessathigherflowratescanbedemonstrated[16].ToaccommodateBangor’s5.5MGDsystem,six160ft2filtersarerequired:twofilterspertrain,withtwoadditionalbackupfiltersonthefourthtrain.Eachfilteriscapableoffiltering9.2E5gallonsperday.Thefiltermediawillconsistof24inchesofanthracite,12inchesofsand,and6inchesofgravelforatotalmediaheightof42inches.Duringbackwashthemediawillexpand150%foraheightof63inches.Backwashtroughscannotbeplacedbelow63inchestopreventlosingfiltermedia.Thetankabovethemediawillhold4feetofwater.CalculationsinAppendixE.AschematicoftheproposedfiltrationsystemisshownbelowinFigure18.
Figure18:DualMediaFilterSchematic

34
TurbidityThemostefficientindicatoroffilterperformanceisturbidity.Thefiltereffluentmustnotexceed0.3NTU(nephelometricunits),whichisaproportionalmeasurementofhowmuchlightisscatteredbyasampleofwater.Turbidimetersshineabeamoflightthroughasampleofwateranddetecthowmuchlighthasbeenscattered90˚totheincidentbeam.Theamountoflightscatteredisdirectlyproportionaltotheamountofmattersuspendedinthewater.Flow-throughturbidimeterswillbeattachedtotheeffluentpipetomeasuretheturbidityofwaterthathas passed through the filters. This information will ensure optimal quality, and allow the processengineerstodeterminewhenfiltersshouldbebackwashed,optimizingtheefficiencyofthetreatmentplant.Thebasicmechanismofaflow-throughturbidimetersisshownbelowinFigure19.
Figure19:FlowThroughTurbidimeter[19].
BackwashingTooptimizetheefficiencyandoperationofthefiltrationsystem,filtersmustbeperiodicallybackwashed.Backwashingrequiresreversingtheflowofwateratahighervelocitytofluidizethemediaandremovepreviouslytrappedparticulates.Backwashingwill occur at a rate of 20 gpm/ft2 for a duration of 15minutes. The amount ofwaterrequiredtobackwasheachindividualfilteris48,000gallons,288,000gallonsaretobackwashtheentiresystemofsixfiltersonetime.Backwashingofeachfilterwilloccurapproximatelyevery18hours,eachfilterbeingonastaggeredbackwashschedule.Onlyonefilterwillbebackwashedatatimetominimizetheamountofwaterbeingdrawnfromthecleantreatedwater.Allcalculationsinappendix.Asfilterstrapmoreparticulatestheybecomemoreeffectiveduetoagreatereffectivemediasurfacearea.Abrandnewfilterbroughton-linewillshowdecreasingturbidityinthefirsthoursofoperation,eventually reachingaminimum.After apoint themediawill become too saturatedwithparticulatemattertofunctioneffectivelyandtheturbiditywillbegintoincrease,aswellastheamountofheadloss.ThisrelationshipisshownbelowinFigure20foragenericfilter.Thesamerelationshipwillbeexhibitedatthelargerwatertreatmentplantscale.

35
Figure20:TurbidityandHeadlossvs.Time[20]
Beforetheturbidityreachesacriticallevelabackwashsequencemustbeinitiatedbyanoperatororaspartofaprogramedsequence.
Chlorine Disinfection Thefinalstepofwatertreatmentbeforedistributionisdisinfection.Beforethispointallremovalisdonethroughphysicalprocesses,butdisinfectionchemicallyinactivatespathogens.Inactivatedpathogenswillbedistributedatthepointofuse,butwillnotcausenegativeeffects.Chlorinedisinfectionisthefinalthefinalbarriertopathogensinthewatertreatmentprocess.Theinactivationofpathogensmustoccurnotonlyatthetreatmentplant,butalsowithinthedistributionsystem.Aswatermaysitforseveraldaysbeforeitisusedthequalitymustbemaintainedthroughtheadditionofchemicaldisinfectants.Thoughitisnotfullyunderstood,themostacceptedtheoryofbacterialinactivationisthe“multiplehit”theoryof inactivation.Bacterial inactivation likelyoccurswhenchlorineattacksavarietyofbacterialmolecules including enzymes, nucleic acids, andmembrane lipids [21]. In treatingwater for humanconsumption,oneofthemostresistantpathogenspresentisGiardialamblia,aflagellatedprotozoanparasitethatcolonizesinthesmallintestine[22].Becauseofitsresistancetochlorine,contacttimesanddisinfectioneffectivenesswillbebasedonGiardiainactivation.
Chemicals Chlorinecanbeaddedindifferentforms,themostcommonofwhichareCl2(diatomicchlorine,gas),NaOCl(sodiumhypochlorite,liquid),andCa(OCl)2(calciumhypochlorite,solid).Theprimarydifferencesbetweenthethreearetheirphysicalstatesandhowtheyaffectthewaterchemistry.
36
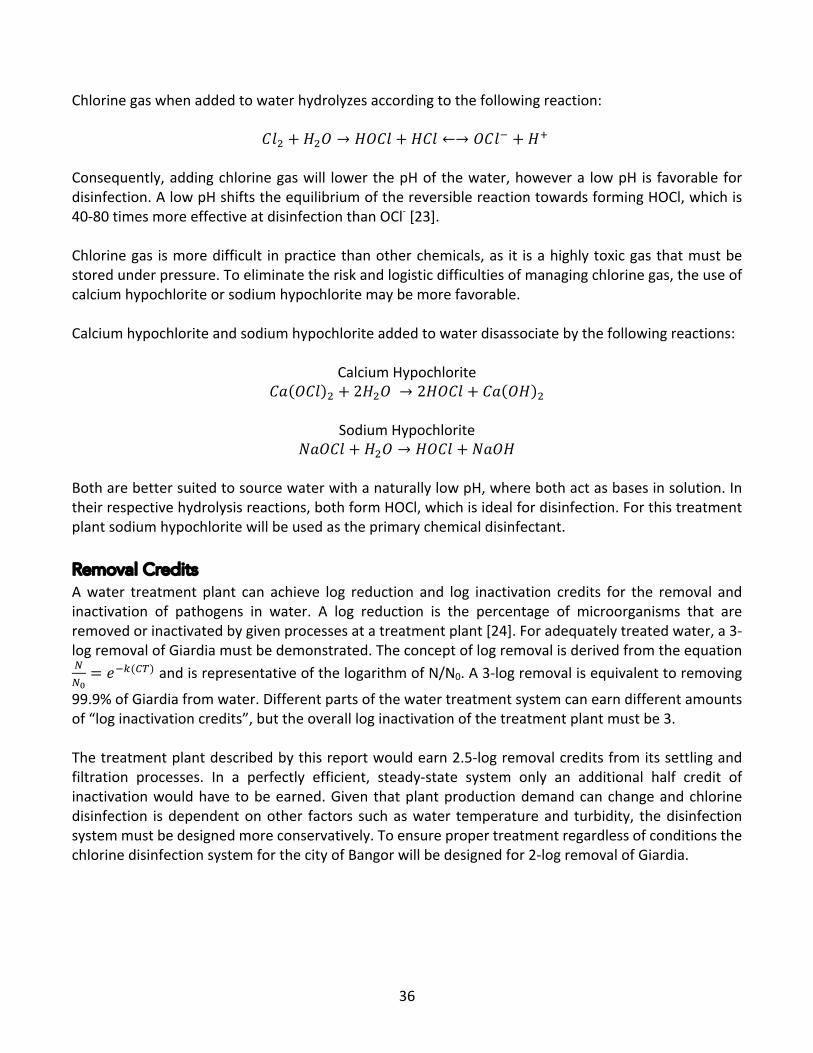
Chlorinegaswhenaddedtowaterhydrolyzesaccordingtothefollowingreaction:
."# + +#% → +%." + +." ←→ %."4 + +3Consequently,addingchlorinegaswill lowerthepHofthewater,howevera lowpH is favorablefordisinfection.AlowpHshiftstheequilibriumofthereversiblereactiontowardsformingHOCl,whichis40-80timesmoreeffectiveatdisinfectionthanOCl-[23].Chlorinegas ismoredifficult inpracticethanotherchemicals,as it isahighlytoxicgasthatmustbestoredunderpressure.Toeliminatetheriskandlogisticdifficultiesofmanagingchlorinegas,theuseofcalciumhypochloriteorsodiumhypochloritemaybemorefavorable.Calciumhypochloriteandsodiumhypochloriteaddedtowaterdisassociatebythefollowingreactions:
CalciumHypochlorite
./ %." # + 2+#% → 2+%." + ./ %+ #
SodiumHypochloriteA/%." + +#% → +%." + A/%+
BotharebettersuitedtosourcewaterwithanaturallylowpH,wherebothactasbasesinsolution.Intheirrespectivehydrolysisreactions,bothformHOCl,whichisidealfordisinfection.Forthistreatmentplantsodiumhypochloritewillbeusedastheprimarychemicaldisinfectant.
Removal Credits Awater treatment plant can achieve log reduction and log inactivation credits for the removal andinactivation of pathogens in water. A log reduction is the percentage of microorganisms that areremovedorinactivatedbygivenprocessesatatreatmentplant[24].Foradequatelytreatedwater,a3-logremovalofGiardiamustbedemonstrated.TheconceptoflogremovalisderivedfromtheequationV
VW= R4X(Z[)andisrepresentativeofthelogarithmofN/N0.A3-logremovalisequivalenttoremoving
99.9%ofGiardiafromwater.Differentpartsofthewatertreatmentsystemcanearndifferentamountsof“loginactivationcredits”,buttheoverallloginactivationofthetreatmentplantmustbe3.Thetreatmentplantdescribedbythisreportwouldearn2.5-logremovalcreditsfromitssettlingandfiltration processes. In a perfectly efficient, steady-state system only an additional half credit ofinactivationwouldhave tobeearned.Giventhatplantproductiondemandcanchangeandchlorinedisinfection isdependentonother factors suchaswater temperatureand turbidity, thedisinfectionsystemmustbedesignedmoreconservatively.ToensurepropertreatmentregardlessofconditionsthechlorinedisinfectionsystemforthecityofBangorwillbedesignedfor2-logremovalofGiardia.

37
CT TheCTistheproductoftheresidualdisinfectantconcentrationandthedisinfectanttime,i.e.C*T[24].ThecontacttimerequiredcanbedeterminedfromaCTtable,whichgivesknownCTvaluesforgivenloginactivationprovidedthepH,temperatureandchlorinedose.TheCTproductishighlydependentonpHandtemperaturebecauseofthekineticsandmechanismsofthe reactions between chlorine andGiardia. In the above section the hydrolysis reaction of sodiumhypochlorite(thedisinfectanttobeused)isshownformingHOCl,whichthendissociatesformingH+andOCl-.HOClisamuchmorepowerfuldisinfectant,butitsconcentrationinthewaterisdependentonthepHasshowninFigure19.
Figure21:HOCLvsOCL[25]
Thetemperaturegreatlyaffectstherateatwhichinactivationoccurs.Therateconstantofareactionisexponentiallydependentontemperature,asgivenbytheArrheniusequation:
? = !R4]^/`[ Forregionswithgreatlyvariabletemperatures,suchasBangor,Maine,thetreatmentfacilitymustbedesignedforthecoldesttemperaturesthatwillbeexperiencedasthereactionratewilldecreasetoapointwherewaterispotentiallyunsafeforconsumption.Thetemperatureusedtodeterminecontacttimewillbe5˚C.ThepHofthelakeisslightlyacidic,soapHof6.5willbeusedincalculations.Achlorinedoseof2.75mg/LwillbeaddedtothewaterintheformofNaOCl(2.6mg/LCl2equivalent)CalculationsinAppendix.

38
Table8:CTTableforInactivationofGiardiaat5˚C[26]
TheCTvaluefromtable8fora2.6mg/Lchlorinedoseat5˚CwithapHof6.5is97min*mg/L.Todetermine thenecessary contact time for treatment theCTvalue canbedividedby the chlorineconcentrationtofindtheT10time.The10%time(T10)ascalculatedfromthetable(CT/concentration)is37 minutes. To ensure adequate inactivation this time must be multiplied by ten, yielding a totalretentiontimeof370minutes.Thenecessaryamountofsodiumhypochloriteforproperdisinfectionof5.5MGDofwateris1800lbsof70%puresodiumhypochlorite.Thiswillbeaddedasa12%solutionfromachemicalfeedtankatarateof0.125gal/min.Calculationsinappendix.
Clearwell Tank Toprovidepropercontacttimeforthewaterandchlorine,thefinalprocessbeforedistributionwillberetentioninaclearwelltank.Aclearwelltankusesbafflingtopreventshort-circuitingwithinthetankandoptimizethereactor.Ifwaterisnotretainedforthecorrectamountoftimeduringthisphaseoftreatment,watersentfordistributionmaybeinadequatelysanitized,whichcouldleadtosickness.

39
Figure22:ClearwellTanks
Figure20showsthefourclearwelltanksrequiredforthewatertreatmentplant.Thefourthtankwillbeofflineasabackup,andthethreetanksinusewilltreat1.83MGD.Thetotalvolumeofeachclearwelltankis47,100gallonsforaretentiontimeof370minutes.Calculationsinappendix.Chemicaldisinfectantfeedwillenterattheleftandhave370minutestoinactivatepathogensbeforeexitingtothedistributionsystem.
Disinfection Byproducts HalogenatedByproductsWhilechemicaldisinfection isessential toproperlytreatingwater, itcanhavenegativeeffects ifnotmonitoredcorrectly.Naturallyoccurringmoleculesinthewaterthathavenotbeencompletelyremovedby theclarificationand filtrationprocessescanreactwithchlorinebeingaddedto thesystemto fordisinfectionbyproducts(DBPs).ThetwomostheavilymonitoredDBPsaretrihalomethaneandhaloaceticacids,thoughmanyothercanform.Thechlorineionaddedtothewatercansubstitutehydrogensonthemethanemoleculeforminga carcinogenic haloalkane. Trihalomethanes are Cancer Group B carcinogens having been shown tocauseacancerriskinlaboratoryanimalsatconcentrationsaslowas6µg/L[27].TheEPAhascreatedaMCLfortrihalomethaneswithamaximumallowableannualaverageof80ppb.Haloaceticacides, similarly,areproductsofasubstitutionreactionwithhalogens thathavenegativehealthaffects.Highlevelsofhaloaceticacidshavebeenshowntocausenervoussystemandlivereffects.TheEPAlimitstotalhaloaceticacidsat60ppb[27].

40
ThemosteffectivemethodofcontrollingDBPsisremovalbeforetreatment,thoughtheamountofDBPscreatedcanbelimitedbychangingtheconcentrationofthedisinfectantortypeofdisinfectantused,changingthepHtolimitreactionextents,orremovingDBPsaftertheyareformed[15].ChloraminesWaterthathasbeensenttothedistributiontimecanpotentiallyremaininwatermainsforseveraldays.Inthefirstseveralhoursthechlorinedosethatwasappliedhasgreatlydiminishedduetothekineticsofthechemicalreaction.Tomaintainappropriatedisinfectant levelswithinthedistributionsystemthatpreventsre-contaminationoftreatedwateralongerlastingdisinfectantmustbeapplied.Oneofthemostcommonmethodsofcreatingadisinfectantresidualistheapplicationofchloramines.By adding ammonia at the end of the treatment process, chlorine in the water reacts to formchloramines.DependingonthepHofthewater,differentchloraminescanbeformed:monochloramine,dichloramine, or trichloramine. In water treatment, at relatively neutral pHs, the most commonchloraminesformedaremono-anddichloramine[15].Chloraminesarenotaseffectiveatpathogeninactivationasfreechlorine,butgiventhereactionkineticsremain in water longer, protecting the water supply. Chloramine should not be used as a primarydisinfectantgivenitslargeCTvalues:3-logGiardiainactivationat10˚CwithchloramineshasaCTof1850mg/L*min,comparedto112mg/L*minforchlorine[15].TheincreasedCTproductissuitableforuseasasecondarydisinfectant inthewaterdistributionsystem.Additionally, theformationofchloraminesreducestheamountoffreechlorineavailabletocreatedisinfectionbyproducts.
Distribution System AdistributionsystemtosupplytheCityofBangormustberobustenoughtotransportwater17milesfromitssourceanddistributeitovera35square-mileregion.ThegeographyandsprawlofBangorwillnecessitatetheimplementationofseveralstandpipestomeetthedemandsofconsumers.ThepipesusedtotransportthewaterfromthetreatmentfacilityatFlood’sPondare30”diameterpre-stressedconcrete.Throughoutthedistributionsystem,thediameterofthepipeswillgraduallyreduceasthepointofuseisfurtherfromthepointofdelivery.Majorwatermainswillhavelargerdiameters,typically 12” to 20” in diameter. The smallest mains within the system will have diameters of 4”.Differentialpipediameterswillensureaconsistentwaterpressurethroughoutthesystem,andachieveaconsistentwatervelocity,whichshouldnotexceed5ft/s[18].Thewaterdistributionsystemmustbedesignedtominimize theresidence timeofwaterwithin thepipesatallpointsofusesothatconsumersthroughoutthesystemreceivethesamequalitywater.Thesystemmustalsobedesignedtopreventwatershortagesthroughtheuseof loops.ShownbelowinFigure20isatypicaldistributionsystemwithloopsandadeadend.Theuseofdeadendsshouldbeminimizedastheyencouragehighresidencetime,andafailureofthepipewillresultinalossofservicetocustomersbeyondthefailure.

41
Figure23:TypicalDistributionSystem
Figure21showsaproposedlayoutofthedistributionsystemfortheCityofBangor.Watermainsfollowmain roadswithin the city, and cross connections (loops) are frequentlymade indenselypopulatedresidentialareas.AroadmapofBangorisshownbelowinFigure22.

42
Figure24:ProposedDistributionSystemSchematic
Fourstandpipesarepresentinthedesignofthedistributionsystemtomeettimesofhighdemandandmaintainwaterpressureacrossalargegeographicregion.

43
Figure25:MapofBangor(Google)

44
Reactor Hydraulics The reactors discussed in this report assume ideal reactor hydraulics. Rapid mix, flocculation,sedimentation, and chlorine disinfection tankswere assumed to have the hydraulics of a plug flowreactor, or an infinite series of complete mix reactors. While these assumptions allow for quickapproximationsinapreliminaryassessment,theyarenotsufficientforfutureprojectrevisions.Aplugflowreactorisassumedtohaveaunidirectionalflowwithnomixing.Apacketofwaterenteringaplugflowreactorwillberetainedforatimeexactlyequaltothevolumedividedbytheflowrate.AtraceraddedtothereactorwillexitafteraretentiontimeofV/Q.Asecondmodelofanidealreactorisacompletelymixedreactor,alsoknownasacontinuouslystirredtankreactor.Thismodelassumesthatthetankisinstantaneouslyandcompletelymixed.Apacketofwaterenteringthetankisimmediatelydispersedbetweenallotherelementsofthetank.Theeffluentconcentrationofthetankisthesameasthereactor liquidconcentration.Foratracer injectedtothe inletstream,thetracerconcentration isinitiallyequaltothetotalmassoftracerdividedbythereactorvolume,andwillslowlydecayovertime.AfteratimeequaltoV/Q,theretentiontimeofthetank,thetracerlevelwillreturntozero[28].Inanon-idealreactorstheresultofatraceradditiondeviatesfromanidealreactorbecauseofshortcircuitingandstagnation.Waterenteringareactormayeithermovethroughthetankwithoutbeingtreated,orenteradeadzoneandremain in the tank fora long time.Tracerstudiescanbeused todeterminehow reactors behave relative to ideal reactors and calculate the tank efficiency. Becauseactual reactorsdonotbehaveasplug flowor completemix reactors it isnecessary toestimate theexpected efficiency before large scale implementation using mathematical models and computersimulations.

45
Works Cited
[1] USCensusBureau,Bangor(city),Maine,2010.[2] CityofBangorPlanningDivision,CityofBangorMaineComprehensivePlan2012,Bangor,Maine,
2012.
[3] bangorinfo.com, "Bangor Lodging," 2015. [Online]. Available: bangorinfo.com/visitor_info.html.[Accessed2015].
[4] N.McCrea,"WaterfrontConcertsPumps$30MillionintoBangorEconomy,UMaineStudyFinds,"BangorDailyNews,14January2013.
[5] NationalParkService,NPSVisitorUseStatistics,2015.[6] MaineTurnpikeAuthority,TrafficStatistics,2015.[7] N.McCrea,"OceanPropertiesUnveilsDesignfor124-roomHotelNexttoCrossInsuranceCenter,"
BangorDailyNews,Bangor,2013.
[8] BangorWaterDistrict,"BangorWaterDistrict,"2014.[Online].Available:bangorwater.org.
[9] BangorWaterDistrict,"2014WaterQualityReport,"Bangor,2014.
[10]U.S.G.S.,"PhysicalCharacteristis:FloodsPond,"Orland.
[11]EnvironmentalProtectionAgency,"NationalPrimaryDrinkingWaterRegulations,"2009.
[12]MaineVolunteerLakeMonitoringProgram,"Flood'sPond:DEPWaterQualityOverview,"Otis.
[13]F.HartandE.Sawyer,"WaterShortagesintheUS".
[14]Zeta-Meter, Inc., "Everything youWant to KnowAbout Coagulation& Flocculation," Staunton,1993.
[15]W.Viessman,M.Hammer,E.PerezandP.Chadik,WaterSupply&PollutionControl,8thEditioned.,UpperSaddleRiver,NewJersey:Pearson,2009.
[16]UpperMississippiRiverBoardofState,"RecommendedStandardsforWaterWorks,"2012.
[17]WorldHealthOrganization,"ManganeseinDrinkingWater,"2004.
[18]J.Goodwill,WaterTreatment,Worcester,MA,2015.
[19]TC007Turbidimeter,Kemtrak,2015.
[20]S. McGregor, "Know Your Filters," [Online]. Available:http://www.wioa.org.au/conference_papers/2001/images/9a.gif.
[21]J. J. Calomiris, "How does chlorine added to drinking water kill bacteria and other harmfulorganisms?,"ScientificAmerican,4May1998.
[22]OxfordtextbookofMedicine,4thEditioned.,2003,pp.759-760.
[23]F.HartandJ.Goodwill,FreeChlorineResiduals,Worcester,MA,2015.
[24]EnvironmentalProtectionAgency,EPAGuidanceManual,2003.[25]L.McPherson, "Amperometric vs. ColoimetricMethods forOn-lineMeasurement of Chlorine,"
[Online].Available:waterworld.com.
[26]AWWA,"CTValuesforInactivationofGiardiaCystsbyFreeChlorineat5˚C,"1991.

46
[27]B. Oram, "Disinfection By-Products Trihalomethanes," [Online]. Available: water-research.net.[AccessedDecember2015].
[28]F.Hart,IdealReactors,Worcester,MA,2008.
[29]"Maine:AnEncyclopedia,"[Online].[Accessed3November2015].
47
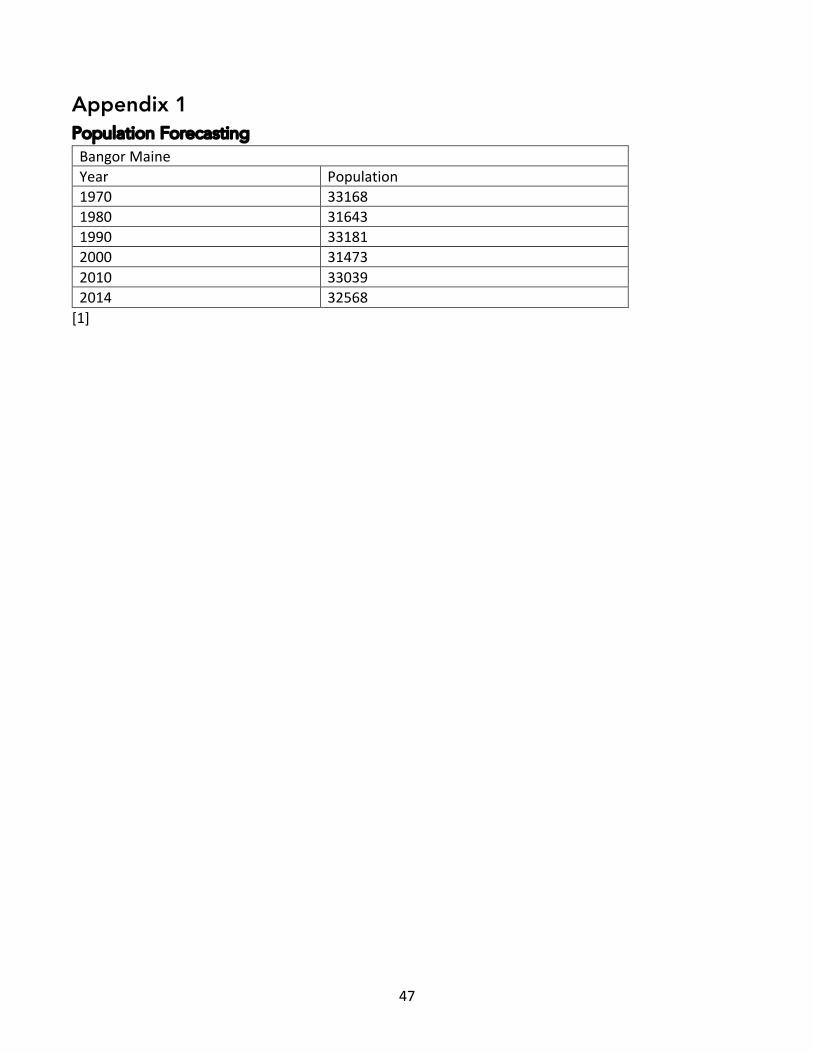
Appendix 1 Population Forecasting BangorMaineYear Population1970 331681980 316431990 331812000 314732010 330392014 32568[1]

48
WaterDemandYearlyAccounts 2009 2010 2011 2012 2013 2014
Residential 8,665 8,588 8603 8689 8588 8479
Commercial 1,509 1,429 1426 1383 1429 1467
Industrial 18 19 19 20 19 16
Governmental
486 467 462 416 467 490
Fire 508 517 530 533 531 542
Hampden 3 3 3 3 3 3
Total 11,189 11,023 11,043 11,044 11,037 10,997
GallonsPumpedMonthly 2009 2010 2011 2012 2013 2014
January 139,166,000 136,779,000 125,213,000 128,844,000 128,910,000 127,471,000 January
February 148,334,000 125,844,000 117,325,000 121,191,000 117,315,000 118,912,000 February
March 138,719,000 136,749,000 129,185,000 131,623,000 128,031,000 128,880,000 March
April 132,101,000 136,159,000 124,238,000 124,135,000 129,118,000 133,411,000 April
May 141,755,000 158,285,000 132,900,000 139,798,000 136,590,000 133,197,000 May
June 147,681,000 157,235,000 145,488,000 129,226,000 139,989,000 134,242,000 June
July 146,044,000 172,984,000 151,996,000 153,998,000 144,505,000 141,338,000 July
August 164,653,000 188,398,000 142,980,000 157,045,000 145,958,000 140,228,000 August
September 162,858,000 166,146,000 135,105,000 135,862,000 134,654,000 131,150,000 September
October 149,897,000 166,770,000 134,069,000 139,659,000 136,223,000 126,956,000 October
November 157,232,000 149,313,000 127,022,000 128,524,000 130,014,000 121,139,000 November
December 136,139,000 129,718,000 128,846,000 124,317,000 124,716,000 117,169,000 December
YearTotal 1,764,579,000
1,824,380,000
1,594,367,000
1,614,222,000
1,596,023,000
1,554,093,000
Max Average
GallonsDaily 4834463 4998301 4368129 4422526 4372666 4257789 4998301 4542312
Peak 164,653,000 188,398,000 151,996,000 157,045,000 145,958,000 141,338,000
Month August August July August August July Max Average
GPD peakmonth
5311387 6077355 4903097 5065968 4708323 4559290 6077355 5104237
Minimum 132,101,000 125,844,000 117,325,000 121,191,000 117,315,000 117,169,000
Month April February February February February December Min Average
GPD minmonth
4403367 4059484 4190179 4179000 4045345 3779645 3779645 4109503
[8]
49
Appendix 2 A: Water Demand
B: Chemical Dosing
C: Flocculation
D: Settling
E: Filtration
F: Chemical Disinfection


61
Appendix 3 EPA MCL List

National Primary Drinking Water Regulations Contaminant MCL or Potential health effects from Common sources of contaminant Public Health
TT1 (mg/L)2 long-term3 exposure above the MCL in drinking water Goal (mg/L)2
OC Acrylamide TT4 Nervous system or blood problems; Added to water during sewage/ zero increased risk of cancer wastewater treatment
OC Alachlor 0.002 Eye, liver, kidney or spleen problems; Runoff from herbicide zero anemia; increased risk of cancer used on row crops R Alpha/photon emitters 15 picocuries Increased risk of cancer Erosion of natural deposits of certain zero per Liter minerals that are radioactive and (pCi/L) may emit a form of radiation known as alpha radiation
IOC Antimony 0.006 Increaseinbloodcholesterol;decrease Dischargefrompetroleumrefineries; 0.006 inbloodsugar fireretardants;ceramics;electronics; solder
IOC Arsenic 0.010 Skin damage or problems with circulatory Erosion of natural deposits; runoff 0 systems, and may have increased from orchards; runoff from glass & risk of getting cancer electronics production wastes
IOC Asbestos(fibers>10 7million Increasedriskofdevelopingbenign Decayofasbestoscementinwater 7MFL micrometers) fibersper intestinalpolyps mains;erosionofnaturaldeposits Liter(MFL)
OC Atrazine 0.003 Cardiovascular system or reproductive Runoff from herbicide used on row 0.003 problems crops
IOC Barium 2 Increase in blood pressure Discharge of drilling wastes; discharge 2 frommetalrefineries;erosion of natural deposits
OC Benzene 0.005 Anemia; decrease in blood platelets; Discharge from factories; leaching zero increasedriskofcancer fromgasstoragetanksandlandfills
OC Benzo(a)pyrene 0.0002 Reproductivedifficulties;increasedrisk Leachingfromliningsofwaterstorage zero (PAHs) of cancer tanks and distribution lines
IOC Beryllium 0.004 Intestinallesions Dischargefrommetalrefineriesand 0.004 coal-burning factories; discharge from electrical, aerospace, and defense industries
R Beta photon emitters 4 millirems Increased risk of cancer Decay of natural and man-made zero per year deposits of certain minerals that are radioactive and may emit forms of radiation known as photons and beta radiation
DBP Bromate 0.010 Increased risk of cancer Byproduct of drinking water disinfection zero
IOC Cadmium 0.005 Kidney damage Corrosion of galvanized pipes; erosion 0.005 of natural deposits; discharge frommetalrefineries;runofffrom waste batteries and paints
OC Carbofuran 0.04 Problems with blood, nervous system, or Leaching of soil fumigant used on rice 0.04 reproductive system and alfalfa
OC Carbon tetrachloride 0.005 Liver problems; increased risk of cancer Discharge from chemical plants and zero other industrial activities
D Chloramines (as Cl ) MRDL=4.01 Eye/noseirritation;stomachdiscomfort; Wateradditiveusedtocontrol MRDLG=4
1 2
anemia microbes
OC Chlordane 0.002 Liver or nervous system problems; Residue of banned termiticide zero increased risk of cancer
D Chlorine (as Cl ) MRDL=4.01 Eye/noseirritation;stomachdiscomfort Wateradditiveusedtocontrol MRDLG=4
1 2
microbes
D Chlorinedioxide MRDL=0.81 Anemia;infants,youngchildren,andfetusesof Wateradditiveusedtocontrol MRDLG=0.8
1
(as ClO ) pregnant women: nervous system effects microbes 2
DBP Chlorite 1.0 Anemia;infants,youngchildren,andfetusesof Byproductofdrinkingwater 0.8 pregnant women: nervous system effects disinfection
OC Chlorobenzene 0.1 Liver or kidney problems Discharge from chemical and agricultural 0.1 chemical factories
IOC Chromium (total) 0.1 Allergic dermatitis Discharge from steel and pulp mills; 0.1 erosion of natural deposits
IOC Copper TT5; Short-termexposure:Gastrointestinal Corrosionofhouseholdplumbing 1.3
Action distress. Long-term exposure: Liver or systems; erosion of natural deposits Level= kidneydamage.PeoplewithWilson’s 1.3 Disease should consult their personal doctor if the amount of copper in their water exceeds the action level
M Cryptosporidium TT7 Short-termexposure:Gastrointestinalillness Humanandanimalfecalwaste zero
(e.g., diarrhea, vomiting, cramps)
LEGEND
D Disinfectant IOC Inorganic Chemical OC Organic Chemical DBP Disinfection Byproduct M Microorganism R Radionuclides

Contaminant
MCL or TT1 (mg/L)2
Potential health effects from long-term3 exposure above the MCL
Common sources of contaminant in drinking water
Public Health Goal (mg/L)2
IOC
OC
Cyanide (as free cyanide)
2,4-D
0.2
0.07
Nerve damage or thyroid problems
Kidney,liver,oradrenalglandproblems
Discharge from steel/metal factories; discharge from plastic and fertilizerfactories
Runofffromherbicideusedonrow
0.2
0.07 crops
OC
OC
Dalapon
1,2-Dibromo-3-
chloropropane (DBCP)
0.2
0.0002
Minorkidneychanges
Reproductivedifficulties;increasedrisk of cancer
Runofffromherbicideusedonrights of way
Runoff/leachingfromsoilfumigant used on soybeans, cotton, pineapples,and orchards
0.2
zero
OC o-Dichlorobenzene
0.6
Liver, kidney, or circulatory system problems
Discharge from industrial chemical factories
0.6
OC p-Dichlorobenzene
0.075
Anemia;liver,kidneyorspleendamage;
changes in blood Dischargefromindustrialchemical factories
0.075
OC 1,2-Dichloroethane
0.005
Increased risk of cancer
Discharge from industrial chemical factories
zero
OC
OC
OC
1,1-Dichloroethylene
cis-1,2-Dichloroethylene
trans-1,2- Dichloroethylene
0.007
0.07
0.1
Liverproblems
Liverproblems
Liver problems
Dischargefromindustrialchemical factories
Dischargefromindustrialchemical factories
Discharge from industrial chemical factories
0.007
0.07
0.1
OC Dichloromethane
0.005
Liver problems; increased risk of cancer
Discharge from drug and chemical factories
zero
OC
OC
1,2-Dichloropropane
Di(2-ethylhexyl) adipate
0.005
0.4
Increased risk of cancer
Weight loss, liver problems, or possible reproductivedifficulties
Discharge from industrial chemical factories
Discharge from chemical factories
zero
0.4
OC Di(2-ethylhexyl)
phthalate 0.006
Reproductivedifficulties;liverproblems;
increased risk of cancer Dischargefromrubberandchemical factories
zero
OC
OC
OC
Dinoseb
Dioxin(2,3,7,8-TCDD)
Diquat
0.007
0.00000003
0.02
Reproductivedifficulties
Reproductivedifficulties;increasedrisk of cancer
Cataracts
Runofffromherbicideusedonsoybeans and vegetables
Emissionsfromwasteincineration and other combustion; dischargefrom chemical factories
Runoff from herbicide use
0.007
zero
0.02
OC Endothall 0.1 Stomach and intestinal problems Runoff from herbicide use 0.1
OC Endrin 0.002 Liver problems Residue of banned insecticide 0.002
OC Epichlorohydrin
TT4
Increased cancer risk; stomach problems
Discharge from industrial chemical factories; an impurity of some watertreatment chemicals
zero
OC Ethylbenzene 0.7 Liverorkidneyproblems Dischargefrompetroleumrefineries 0.7
OC
M
Ethylenedibromide
Fecalcoliformand E. coli
0.00005
MCL6
Problemswithliver,stomach,reproductive Dischargefrompetroleumrefineries system, or kidneys; increased risk of cancer
FecalcoliformsandE. coli are bacteria whose Human and animal fecal waste presence indicates that the water may be contaminated withhumanoranimalwastes.Microbesinthesewastes
zero
zero6
may cause short term effects, such as diarrhea, cramps,nausea, headaches, or other symptoms. They may pose aspecial health risk for infants, young children, and peoplewith severely compromised immune systems.
IOC
M
OC
Fluoride
Giardia lamblia
Glyphosate
4.0
TT7
0.7
Bonedisease(painandtendernessof the bones); children may get mottled
teeth
Short-termexposure:Gastrointestinalillness (e.g., diarrhea, vomiting, cramps)
Kidneyproblems;reproductive difficulties
Wateradditivewhichpromotes strong teeth; erosion of naturaldeposits; discharge from fertilizerand aluminum factories
Humanandanimalfecalwaste
Runofffromherbicideuse
4.0
zero
0.7
DBP
OC OC M
Haloacetic acids (HAA5)
Heptachlor
Heptachlor epoxide
Heterotrophic plate count (HPC)
0.060
0.0004
0.0002
TT7
Increased risk of cancer
Liver damage; increased risk of cancer
Liver damage; increased risk of cancer
HPC has no health effects; it is an analytic method used to measure the
variety of bacteria that are common in water. The lower the concentration of
Byproduct of drinking waterdisinfection
Residue of banned termiticide
Breakdown of heptachlor
HPC measures a range of bacteriathat are naturally present in theenvironment
n/a9
zero
zero
n/a
bacteria in drinking water, the bettermaintained the water system is.
LEGEND
D Disinfectant IOC Inorganic Chemical OC Organic Chemical DBP Disinfection Byproduct M Microorganism R Radionuclides

Contaminant MCL or Potential health effects from Common sources of contaminant Public Health TT1 (mg/L)2 long-term3 exposure above the MCL in drinking water Goal (mg/L)2
OC Hexachlorobenzene 0.001 Liverorkidneyproblems;reproductive Dischargefrommetalrefineriesand zero difficulties;increasedriskofcancer agriculturalchemicalfactories
OC Hexachlorocyclopentadiene 0.05 Kidney or stomach problems Discharge from chemical factories 0.05 IOC Lead TT5; Infants and children: Delays in physical or Corrosion of household plumbing zero Action or mental development; children could systems; erosion of natural deposits Level=0.015 showslightdeficitsinattentionspan
and learning abilities; Adults: Kidney problems; high blood pressure
M Legionella TT7 Legionnaire’sDisease,atypeof Foundnaturallyinwater;multipliesin zero pneumonia heating systems
OC Lindane 0.0002 Liver or kidney problems Runoff/leaching from insecticide used 0.0002 on cattle, lumber, gardens
IOC Mercury(inorganic) 0.002 Kidneydamage Erosionofnaturaldeposits;discharge 0.002 fromrefineriesandfactories; runofffromlandfillsandcroplands
OC Methoxychlor 0.04 Reproductivedifficulties Runoff/leachingfrominsecticideused 0.04 on fruits, vegetables, alfalfa, livestock
IOC Nitrate (measured as 10 Infants below the age of six months who Runoff from fertilizer use; leaching 10 Nitrogen) drink water containing nitrate in excess from septic tanks, sewage; erosion of oftheMCLcouldbecomeseriouslyill naturaldeposits and, if untreated, may die. Symptoms include shortness of breath and blue-baby syndrome.
IOC Nitrite (measured as 1 Infants below the age of six months who Runoff from fertilizer use; leaching 1 Nitrogen) drink water containing nitrite in excess from septic tanks, sewage; erosion of oftheMCLcouldbecomeseriouslyill naturaldeposits and, if untreated, may die. Symptoms include shortness of breath and blue-baby syndrome.
OC Oxamyl (Vydate) 0.2 Slight nervous system effects Runoff/leaching from insecticide used 0.2 on apples, potatoes, and tomatoes
OC Pentachlorophenol 0.001 Liver or kidney problems; increased Discharge from wood-preserving zero cancer risk factories
OC Picloram 0.5 Liver problems Herbicide runoff 0.5
OC Polychlorinatedbiphenyls 0.0005 Skinchanges;thymusglandproblems; Runofffromlandfills;dischargeof zero (PCBs) immunedeficiencies;reproductiveor wastechemicals nervoussystemdifficulties;increased
risk of cancer
R Radium 226 and 5 pCi/L Increased risk of cancer Erosion of natural deposits zero Radium228(combined)
IOC Selenium 0.05 Hairorfingernailloss;numbnessinfingers Dischargefrompetroleumandmetalrefineries; 0.05 or toes; circulatory problems erosion of natural deposits; discharge from mines OC Simazine 0.004 Problems with blood Herbicide runoff 0.004
OC Styrene 0.1 Liver, kidney, or circulatory system problems Discharge from rubber and plastic 0.1 factories;leachingfromlandfills
OC Tetrachloroethylene 0.005 Liver problems; increased risk of cancer Discharge from factories and dry cleaners zero
IOC Thallium 0.002 Hair loss; changes in blood; kidney, intestine, Leaching from ore-processing sites; 0.0005 or liver problems discharge from electronics, glass, and drug factories
OC Toluene 1 Nervous system, kidney, or liver problems Discharge from petroleum factories 1
M Total Coliforms 5.0 Coliforms are bacteria that indicate that other, Naturally present in the environment zero percent8 potentially harmful bacteria may be present.
See fecal coliforms and E. coli DBP TotalTrihalomethanes 0.080 Liver,kidneyorcentralnervoussystemproblems; Byproductofdrinkingwaterdisinfection n/a
9
(TTHMs) increasedriskofcancer
OC Toxaphene 0.003 Kidney, liver, or thyroid problems; Runoff/leaching from insecticide used zero increased risk of cancer on cotton and cattle
OC 2,4,5-TP (Silvex) 0.05 Liver problems Residue of banned herbicide 0.05
OC 1,2,4-Trichlorobenzene 0.07 Changesinadrenalglands Dischargefromtextilefinishing 0.07 factories
OC 1,1,1-Trichloroethane 0.2 Liver, nervous system, or circulatory Discharge from metal degreasing 0.2 problems sites and other factories
OC 1,1,2-Trichloroethane 0.005 Liver, kidney, or immune system Discharge from industrial chemical 0.003 problems factories
OC Trichloroethylene 0.005 Liver problems; increased risk of cancer Discharge from metal degreasing zero sites and other factories
LEGEND
D Disinfectant IOC Inorganic Chemical OC Organic Chemical DBP Disinfection Byproduct M Microorganism R Radionuclides

Contaminant
MCL or TT1 (mg/L)2
Potential health effects from long-term3 exposure above the MCL
Common sources of contaminant in drinking water
Public Health Goal (mg/L)2
M Turbidity TT7 Turbidity is a measure of the cloudiness of water. Soil runoff n/a Itisusedtoindicatewaterqualityandfiltration
effectiveness (e.g., whether disease-causing organisms are present). Higher turbidity levels are often associated with higher levels of disease-causing microorganisms such as viruses, parasites and some bacteria. These organisms can cause short term symptoms such as nausea, cramps, diarrhea, and associated headaches.
R Uranium 30µg/L Increased risk of cancer, kidney toxicity Erosion of natural deposits zero OC Vinyl chloride 0.002 Increased risk of cancer Leaching from PVC pipes; discharge zero from plastic factories
M Viruses (enteric) TT7 Short-termexposure:Gastrointestinalillness Humanandanimalfecalwaste zero
(e.g., diarrhea, vomiting, cramps)
OC Xylenes (total) 10 Nervous system damage Discharge from petroleum factories; 10 discharge from chemical factories
LEGEND
D Disinfectant IOC Inorganic Chemical OC Organic Chemical DBP Disinfection Byproduct M Microorganism R Radionuclides

NOTES 1 Definitions • MaximumContaminantLevelGoal(MCLG)—Thelevelofacontaminantindrinkingwaterbelow • Viruses:99.99percentremoval/inactivation whichthereisnoknownorexpectedrisktohealth.MCLGsallowforamarginofsafetyandare • Legionella:Nolimit,butEPAbelievesthatifGiardiaandvirusesareremoved/inactivatedaccording non-enforceablepublichealthgoals. tothetreatmenttechniquesinthesurfacewatertreatmentrule,Legionellawillalsobecontrolled. • MaximumContaminantLevel(MCL)—Thehighestlevelofacontaminantthatisallowedin • Turbidity:Forsystemsthatuseconventionalordirectfiltration,atnotimecanturbidity(cloudinessof drinkingwater.MCLsaresetasclosetoMCLGsasfeasibleusingthebestavailabletreatment water)gohigherthan1nephelolometricturbidityunit(NTU),andsamplesforturbiditymustbe technologyandtakingcostintoconsideration.MCLsareenforceablestandards. lessthanorequalto0.3NTUinatleast95percentofthesamplesinanymonth.Systemsthatuse • MaximumResidualDisinfectantLevelGoal(MRDLG)—Thelevelofadrinkingwaterdisinfectant filtrationotherthanconventionalordirectfiltrationmustfollowstatelimits,whichmustincludeturbidity belowwhichthereisnoknownorexpectedrisktohealth.MRDLGsdonotreflectthebenefitsof atnotimeexceeding5NTU. theuseofdisinfectantstocontrolmicrobialcontaminants. • HPC:Nomorethan500bacterialcoloniespermilliliter • MaximumResidualDisinfectantLevel(MRDL)—Thehighestlevelofadisinfectantallowedin • LongTerm1EnhancedSurfaceWaterTreatment;Surfacewatersystemsorgroundwatersystems drinkingwater.Thereisconvincingevidencethatadditionofadisinfectantisnecessaryfor underthedirectinfluenceofsurfacewaterservingfewerthan10,000peoplemustcomplywiththe controlofmicrobialcontaminants. applicableLongTerm1EnhancedSurfaceWaterTreatmentRuleprovisions(e.g.turbiditystandards, • TreatmentTechnique(TT)—Arequiredprocessintendedtoreducethelevelofacontaminantin individualfiltermonitoring,Cryptosporidiumremovalrequirements,updatedwatershedcontrol drinkingwater. requirementsforunfilteredsystems). 2Unitsareinmilligramsperliter(mg/L)unlessotherwisenoted.Milligramsperliterareequivalent • LongTerm2EnhancedSurfaceWaterTreatment;Thisruleappliestoallsurfacewatersystems topartspermillion(ppm). orgroundwatersystemsunderthedirectinfluenceofsurfacewater.Theruletargetsadditional 3Healtheffectsarefromlong-termexposureunlessspecifiedasshort-termexposure. Cryptosporidiumtreatmentrequirementsforhigherrisksystemsandincludesprovisionstoreduce 4 Eachwatersystemmustcertifyannually,inwriting,tothestate(usingthird-partyormanufacturers risksfromuncoveredfinishedwaterstoragesfacilitiesandtoensurethatthesystemsmaintainmicrobial certification)thatwhenitusesacrylamideand/orepichlorohydrintotreatwater,thecombination(or protectionastheytakestepstoreducetheformationofdisinfectionbyproducts.(Monitoring product)ofdoseandmonomerleveldoesnotexceedthelevelsspecified,asfollows:Acrylamide startdatesarestaggeredbysystemsize.Thelargestsystems(servingatleast100,000 =0.05percentdosedat1mg/L(orequivalent);Epichlorohydrin=0.01percentdosedat20mg/L people)willbeginmonitoringinOctober2006andthesmallestsystems(servingfewerthan (orequivalent). 10,000people)willnotbeginmonitoringuntilOctober2008.Aftercompletingmonitoringand 5 LeadandcopperareregulatedbyaTreatmentTechniquethatrequiressystemstocontrolthe determiningtheirtreatmentbin,systemsgenerallyhavethreeyearstocomplywithanyadditional corrosivenessoftheirwater.Ifmorethan10percentoftapwatersamplesexceedtheactionlevel, treatmentrequirements.) watersystemsmusttakeadditionalsteps.Forcopper,theactionlevelis1.3mg/L,andforleadis • FilterBackwashRecycling:TheFilterBackwashRecyclingRulerequiressystemsthatrecycleto 0.015mg/L. returnspecificrecycleflowsthroughallprocessesofthesystem’sexistingconventionalordirect 6Aroutinesamplethatisfecalcoliform-positiveorE. coli-positivetriggersrepeatsamples--ifany filtrationsystemoratanalternatelocationapprovedbythestate. repeatsampleistotalcoliform-positive,thesystemhasanacuteMCLviolation.Aroutinesample 8Nomorethan5.0percentsamplestotalcoliform-positiveinamonth.(Forwatersystemsthatcollect thatistotalcoliform-positiveandfecalcoliform-negativeorE. coli-negativetriggersrepeatsamples--if fewerthan40routinesamplespermonth,nomorethanonesamplecanbetotalcoliform-positive anyrepeatsampleisfecalcoliform-positiveorE. coli-positive,thesystemhasanacuteMCLviolation. permonth.)Everysamplethathastotalcoliformmustbeanalyzedforeitherfecalcoliformsor SeealsoTotalColiforms. E. coli.IftwoconsecutiveTC-positivesamples,andoneisalsopositiveforE. coliorfecalcoliforms, 7EPA’ssurfacewatertreatmentrulesrequiresystemsusingsurfacewaterorgroundwaterunder systemhasanacuteMCLviolation. thedirectinfluenceofsurfacewaterto(1)disinfecttheirwater,and(2)filtertheirwaterormeet 9AlthoughthereisnocollectiveMCLGforthiscontaminantgroup,thereareindividualMCLGsfor criteriaforavoidingfiltrationsothatthefollowingcontaminantsarecontrolledatthefollowinglevels: someoftheindividualcontaminants: • Cryptosporidium:99percentremovalforsystemsthatfilter.Unfilteredsystemsarerequiredto • Haloaceticacids:dichloroaceticacid(zero);trichloroaceticacid(0.3mg/L) includeCryptosporidiumintheirexistingwatershedcontrolprovisions. • Trihalomethanes:bromodichloromethane(zero);bromoform(zero);dibromochloromethane(0.06mg/L) • Giardialamblia:99.9percentremoval/inactivation

National Secondary DrinkingWater Regulation National Secondary Drinking Water Regulations are non-enforceable guidelines regarding contaminants that may cause cosmetic effects (such as skin or tooth discoloration) or aes-thetic effects (such as taste, odor, or color) in drinking water. EPA recommends secondary standards to water systems but does not require systems to comply. However, some states may choose to adopt them as enforceable standards.
Contaminant Secondary Maximum Contaminant Level Aluminum 0.05 to 0.2 mg/L Chloride 250 mg/L Color 15 (color units) Copper 1.0 mg/L Corrosivity noncorrosive Fluoride 2.0 mg/L Foaming Agents 0.5 mg/L Iron 0.3 mg/L Manganese 0.05 mg/L Odor 3 threshold odor number pH 6.5-8.5 Silver 0.10 mg/L Sulfate 250 mg/L Total Dissolved Solids 500 mg/L Zinc 5 mg/L
For More Information
EPA’s Safe Drinking Water Web site: http://www.epa.gov/safewater/ EPA’s Safe Drinking Water Hotline: (800) 426-4791
To order additional posters or other ground water and drinking water publications, please contact the National Service Center for Environmental Publications at : (800) 490-9198, or email: [email protected].
EPA 816-F-09-004 May 2009
Related Documents