April 11, 2016 Water Supply Forum Regional Water Supply Resiliency Project Earthquake Vulnerability Assessment Technical Memorandum Snohomish, King, and Pierce Counties, Washington

Welcome message from author
This document is posted to help you gain knowledge. Please leave a comment to let me know what you think about it! Share it to your friends and learn new things together.
Transcript
April 11, 2016
Water Supply Forum Regional Water Supply Resiliency Project
Earthquake Vulnerability Assessment Technical
Memorandum
Snohomish, King, and Pierce Counties, Washington

Earthquake Vulnerability Assessment
This page is intentionally left blank.

Earthquake Vulnerability Assessment iii
Contents
1.0 Summary ............................................................................................................... 1
1.1 Historic Damage of Water Systems ............................................................................. 2
1.2 Earthquake Risk and Consequences ........................................................................... 5
1.3 System Evaluation ....................................................................................................... 5
1.4 Limitations ................................................................................................................... 6
1.5 Water Supply Seismic Vulnerability in the Region ........................................................ 6
1.6 Economic Impact ......................................................................................................... 7
1.7 Approaches to Increasing Seismic Resiliency in the Region ........................................ 7
2.0 Methodology .......................................................................................................... 7
2.1 Earthquake Scenarios and Hazards ............................................................................. 8
2.2 Facilities and Transmission Pipelines........................................................................... 9
2.3 Distribution Systems ...................................................................................................10
2.4 Level of Service ..........................................................................................................11
2.5 Overall System Performance and Potential Economic Impact .....................................11
2.6 Mitigation ....................................................................................................................12
3.0 Earthquake Hazards ............................................................................................ 12
3.1 Geologic Hazards .......................................................................................................12
3.2 Earthquake Source Zones ..........................................................................................14
3.3 Earthquake Scenarios .................................................................................................17
3.4 Earthquake Hazards ...................................................................................................23
4.0 Transmission and Supply Facilities Analysis ....................................................... 29
4.1 Introduction and Evaluated Facilities and Pipelines.....................................................29
4.2 Analysis Methodology .................................................................................................30
4.3 Results ........................................................................................................................31
5.0 Water Distribution Systems ................................................................................. 40
5.1 Water Distribution System Performance in Past Earthquakes .....................................40
5.2 Distribution System Seismic Vulnerability Assessment Methodology ..........................42
6.0 Post-Earthquake Level of Service (PE-LOS) ....................................................... 42
6.1 Survey of Other Agency Post-Earthquake Levels of Service .......................................43
6.2 Parameters .................................................................................................................44
6.3 Guidelines for Establishing PE-LOS Goals .................................................................45

Earthquake Vulnerability Assessment iv
7.0 System Performance and Potential Economic Impact ......................................... 46
7.1 Estimated Post-Earthquake System Performance.......................................................46
7.2 Potential Economic Impact ..........................................................................................47
8.0 Mitigation ............................................................................................................. 49
8.1 Interutility Mitigations ..................................................................................................49
8.2 Intrautility Mitigations ..................................................................................................50
8.3 General Mitigations .....................................................................................................51
9.0 Conclusions and Recommendations ................................................................... 52
10.0 References .......................................................................................................... 55
11.0 Contributors ......................................................................................................... 56
Tables
Table 1 Everett Public Works Facilities and Transmission Mains..........................................29
Table 2 Seattle Public Utilities Facilities and Transmission Mains ........................................29
Table 3 Tacoma Water Facilities and Transmission Mains ...................................................30
Table 4 Cascade Water Alliance Transmission Main ............................................................30
Table 5 Post-Earthquake Service Level Categories ..............................................................45
Table 6 Post-Earthquake Current Water Treatment Plant Performance a,c ............................46
Table 7 Estimated Timeframe for Restoration of Water Service to 90 percent of Customers’ Taps at Average Winter Day Demanda, b ..................................................................47
Table 8 Potential Economic Losses Post-Earthquake Due to Water Lossa–e, g ......................48
Figures
Figure 1 Restoration of Water Supply Damaged by the Tohoku Earthquake, Japan, 2011 ..... 3
Figure 2 Seismic Hazards ......................................................................................................13
Figure 3 Earthquake Hazard Zones (United States Geological Survey) .................................14
Figure 4 Cascadia Subduction Zone ......................................................................................16
Figure 5 Cascadia Subduction Zone Scenario, Mw9.0 Peak Ground Acceleration .................18
Figure 6 South Whidbey Island Fault Scenario, Mw7.4 Peak Ground Acceleration .................20
Figure 7 Seattle Fault Scenario, Mw6.7 Peak Ground Acceleration ........................................21
Figure 8 Tacoma Fault Scenario, Mw7.1 Peak Ground Acceleration ......................................22
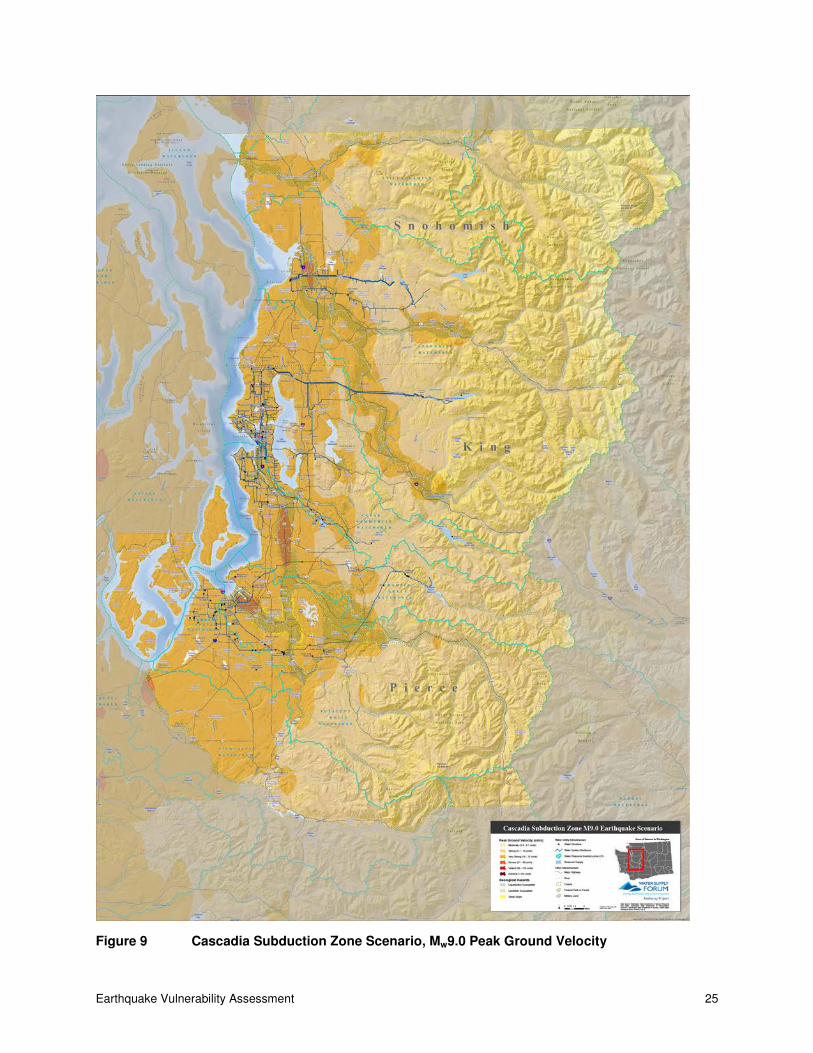
Figure 9 Cascadia Subduction Zone Scenario, Mw9.0 Peak Ground Velocity ........................25
Figure 10 South Whidbey Island Fault Scenario, Mw7.4 Peak Ground Velocity ........................26
Figure 11 Seattle Fault Scenario, Mw6.7 Peak Ground Velocity ...............................................27
Figure 12 Tacoma Fault Scenario, Mw7.1 Peak Ground Velocity .............................................28
Attachments
Attachment A Post Earthquake Level of Service Goals

Earthquake Vulnerability Assessment v
Abbreviations
ALA American Lifelines Alliance
AWD average winter demand
AWWA American Water Works Association
BIP Bellevue-Issaquah transmission pipeline
CSZ Cascadia Subduction Zone
CWA Cascade Water Alliance
Everett Everett Public Works
FEMA Federal Emergency Management Agency
g acceleration due to Earth’s gravity
GIS geographic information system
GRFF Green River Filtration Facility
HAZUS GIS-based natural hazard loss estimation methodology developed and distributed by FEMA
HDPE high-density polyethylene
K values ALA pipeline fragility constant for different pipe materials, joint types and pipe sizes
LADWP Los Angeles Department of Water and Power
PE-LOS post-earthquake level of service
MGD million gallons per day
Mw moment magnitude
PGA peak ground acceleration
PGD permanent ground deformation
PGV peak ground velocity
PVC polyvinyl chloride
Qa annual quantity
Qi total instantaneous quantity
SPU Seattle Public Utilities
SWIF South Whidbey Island Fault
TESS Tolt East Side Supply Line
USGS United States Geological Survey
Vs30 The average shear wave velocity in the top 30 meters
WWTP wastewater treatment plant

Earthquake Vulnerability Assessment vi
This page is intentionally left blank.

Earthquake Vulnerability Assessment 1
1.0 Summary
The objective of this study was to examine the resilience of water utilities in the three-county
region (King, Pierce, and Snohomish Counties) following an earthquake and to identify regional
strategies that would increase their resiliency. Water supply is considered critical for a resilient
community and, thus, the results are quantified in terms of restoration times and economic impacts. This study evaluated the potential impact of four earthquake scenarios on major
utilities in the region and their water supply systems:
• Mw9.0 Cascadia Subduction Zone (CSZ), 500-year average return period
• Mw7.4 South Whidbey Island Fault (SWIF) Scenario, 2,700-year return period
• Mw6.7 Seattle Fault Scenario, 1,000-year return period
• Mw7.1 Tacoma Fault Scenario, 4,500-year return period
The estimated return period for the shallow fault (SWIF, Seattle and Tacoma) scenarios is for an
earthquake occurring somewhere along the fault and not necessarily at the location assumed in this report.
The United States Geological Survey (USGS) estimates there is a 14 percent chance of an
Mw9.0 CSZ earthquake in the next 50 years. It also estimates a 15 percent chance of an Mw6.5
earthquake or higher from a surface fault in the Puget Sound region such as the Seattle, Tacoma, or South Whidbey Island faults.
Primary water supplies in the region come from four major surface waters and various
groundwater supplies. The major surface water supplies are:
• Snohomish County – Sultan River Watershed (Spada and Chaplain Reservoirs)
• King County – Tolt River Watershed (Tolt Reservoir)
• King County – Cedar River Watershed (Chester Morse Lake)
• Pierce County – Green River Watershed (Howard Hansen Reservoir)
The objectives of this study are to:
• Conduct a high-level evaluation of the seismic vulnerability of the water supply systems.
• Use the seismic vulnerability evaluations to identify ways that water agencies can work together to improve water system seismic resiliency in the region.
• Raise awareness among water agencies, the public, and regional leaders regarding the
seismic vulnerability of water supplies in the region.
Specific project tasks are to:
1. Develop earthquake hazard maps for the four earthquake scenarios.
2. Assess the regional post-earthquake water transmission system response to the four
earthquake scenarios.
3. Assess the regional post-earthquake water distribution system response to the four
earthquake scenarios.

Earthquake Vulnerability Assessment 2
4. Research and present post-earthquake service level goals that have been established
by other utilities in the region and throughout the Western states as examples and
describe the general process and stakeholder involvement needed to determine post-earthquake level of service (PE-LOS) goals.
5. Determine the existing post-earthquake performance of the water systems with respect
to recommended service level categories and calculate the potential economic impact.
6. Identify (at a high level) water system earthquake hazard mitigation measures to increase regional water system seismic resiliency.
7. Prepare a technical memorandum and maps to document the project findings.
This study was spearheaded by Water Supply Forum member agencies. Major contributors to
the study included Tacoma Water, Everett Public Works (Everett), Seattle Public Utilities (SPU), and Cascade Water Alliance (CWA). Several other agencies in the three-county area also made
significant contributions to the study. HDR, Inc., and Ballantyne Consulting, LLC, provided
management and technical expertise.
1.1 Historic Damage of Water Systems
Earthquakes have historically been very damaging to water systems. Five events that have
occurred over the past 25 years are described below with the name, year, and moment
magnitude (Mw) listed.
1. Tohoku, Japan, 2011, Mw9.0: This was a subduction earthquake very similar to what we
expect from a CSZ event. Many water treatment plants were damaged, particularly from
liquefaction and tsunamic waves as high as 9 meters (30 feet) high that came ashore,
obliterating structures in their path. In addition to disrupting water supplies throughout the Tohoku region, the earthquake caused 345 fires. The Abuta Water Purification Plant
site in Ishinomaki City underwent several feet of differential settlement that sheared off
site piping.
It took just over 40 days for restoration of service to houses and businesses following the Tohoku event. The restoration curve is shown in Figure 1. Well-planned mutual aid from
sister cities in western Japan kept outage times from being much longer. Although
tsunamic impacts in the Pacific Northwest coastal areas may be similar to those
experienced in the Tohoku region of Japan, any tsunami generated by a giant subduction event off the coast of Washington State is expected to be less than 1 foot
high by the time it reaches the Puget Sound Shores of Snohomish, King and Pierce
Counties.
2. Christchurch, New Zealand, 2011, Mw6.3: This relatively small magnitude earthquake
was a direct hit on Christchurch. It is similar to what might be expected on a crustal fault
in the Pacific Northwest such as on the Tacoma, Seattle, or South Whidbey Island faults.
Extensive liquefaction along the Avon River resulted in 1,645 water line failures (leaks and breaks) in approximately 1,700 kilometers (1,056 miles) of water main. It took over
40 days to restore service to households that were habitable.
3. Nisqually, Washington, 2001, Mw6.8: This earthquake was typical of deep Benioff
Intraplate Zone (zone of seismicity in the down-going slab in the subducting zone) events encountered every 30 to 50 years. While deep intraplate events can have large

Earthquake Vulnerability Assessment 3
magnitudes (release a lot of energy), intraplate events are deeper so that the ground
motions attenuate, resulting in only moderate shaking intensity. Other events in the
region such as the CSZ or Seattle Fault events will have much greater consequences.
Figure 1 Restoration of Water Supply Damaged by the Tohoku Earthquake, Japan, 2011
4. Kobe, Japan, 1995, Mw6.9: This event was a direct hit on the city of Kobe, a city similar in size to Seattle. The event produced very strong ground motions on the order of
80 percent times gravity, similar to what we might expect in a Seattle, Tacoma, or South
Whidbey Island fault event. Kobe was a major port, and was devastated in the
earthquake. Shipping companies redirected cargo. Even to this day, it has not fully recovered its 1995 throughput. There was moderate damage to a number of water
treatment plants situated on competent soils. Wastewater treatment plants (WWTPs)
were heavily damaged due to liquefaction. The Higashinada WWTP experienced
1 meter of settlement and 2 meters of lateral spread (Photo 1). There were approximately 1,200 water main failures in Kobe; the predominant failure mode (800+)
was pulled joints in ductile iron pipe with unrestrained bell and spigot joints. The pipe
failures resulted in draining most reservoirs within 6 hours; a conflagration burned
through the city. It took 60 days to fully restore household service.

Earthquake Vulnerability Assessment 4
Photo 1. The damaged Higashinada WWTP, Japan (photo courtesy of Don Ballantyne)
5. Northridge, California, 1994, Mw6.7: The epicenter was near the middle of the San
Fernando Valley in Los Angeles. There were strong ground motions similar to those in Kobe, 80 percent times gravity. There was moderate damage to two water treatment
plants, one owned by the Los Angeles Department of Water and Power (LADWP), and
the other by the Metropolitan Water District of Southern California. LADWP had
approximately 1,000 pipeline failures including about 35 in transmission lines. Most of the failures occurred in cast iron pipe. About half the Valley was without water, taking
nearly 2 weeks to provide household service restoration, although full functionality took
much longer.
It should be noted that just because water service has been restored after these earthquakes, it does not mean that the water system is functioning at its pre-earthquake LOS. The volume and
pressure of water that can be supplied at may be reduced for months or even years after a
major earthquake. Redundant supplies, transmission mains, or storage facilities may be out of
service, affecting system operability and reliability. For example, LADWP estimates that it took 6 years to restore the system functionality to 99 percent of what the functionality was prior to the
1994 Northridge Earthquake. LADWP estimates that although service to almost all customers
may be restored in a month following an Mw7.8 San Andreas Fault earthquake, water rationing
may be necessary for 18 months following the earthquake.

Earthquake Vulnerability Assessment 5
1.2 Earthquake Risk and Consequences
Earthquake risk is commonly assessed as a function of the likelihood of occurrence, the
expected damage, and the consequence of that damage. To truly represent the risk, many scenarios ranging in magnitude and location would have to be run and the results aggregated.
In this project, four earthquake scenarios were selected to get a snapshot of possible
consequences. According to the USGS, there is a 14 percent chance of an Mw9.0 subduction
earthquake occurring in the next 50 years. There is a 15 percent chance that a shallow fault rupture of Mw6.5 or higher will occur in the Puget Sound region in the next 50 years. The four
scenarios represent a range of likelihoods of occurrence (500- to 4,500-year return periods) and
earthquake fault locations distributed across the study area. The consequences were estimated
for each scenario in terms of water outage areas and the time it would take to restore service. Earthquake scenarios and their associated ground motions were evaluated rather than ground
motions with a specified probability of occurrence (e.g., 500-year return ground motions).
Probabilistic ground motions for a given occurrence probability do not occur simultaneously
across a region, so they cannot be used to predict how a (water) system that is spread over a wide geographical area will respond to a defined earthquake scenario.
1.3 System Evaluation
The project evaluated major supply and transmission assets owned by the four project
participants. In general, assets included:
• Dams and reservoirs
• Facilities and control structures
• Treatment plants
• Transmission pipelines
• Transmission pump stations
• Major reservoirs/Terminal reservoirs
• Well supplies
• Distribution piping (evaluated at a systemwide level, but not specific pipelines)
The expected damage state of each facility and the number of failures for pipelines were estimated for each scenario. The evaluations took into account earthquake hazards including:
• Ground motion shaking intensities
• Permanent ground deformation (PGD)-related hazards such as liquefaction and
landslide
• Vulnerability of the asset considering its age and associated code to which it was
designed
• Type of construction
The overall expected system performance was evaluated based on the damage state and
associated functionality of the system assets—facilities and pipelines. System performance considered the functionality of key components in the system as well as the system
Earthquake Vulnerability Assessment 6
configuration and redundancy. Restoration was determined by the extent of damage and
available resources to make repairs.
1.4 Limitations
The vulnerability assessments presented in this report were made with “high-level” analysis
methods. Although these methods provide a general understanding of how a water system will
respond to a specific earthquake scenario, more detailed analyses and site investigations are
needed to supply a more precise estimate of post-earthquake response. This study and utility-specific planning studies help identify the system components that have the highest risk of
affecting the overall system. Further analysis of these high-risk components could include
detailed geotechnical, structural, and hydraulic analyses to develop a better understanding of
the facilities’ risk, and mitigation alternatives that could be used to reduce that risk. Detailed analyses of low-risk components may not be required. Everett and Tacoma Water have recently
completed earthquake vulnerability assessments. SPU has a study underway. Some of the
members of CWA have also completed seismic assessments. The expectation is that this study
would identify opportunities to fill the gaps identified in those studies with regional mitigation strategies and help individual utilities coordinate their internal mitigation approaches with the
regional strategies.
1.5 Water Supply Seismic Vulnerability in the Region
Two categories of earthquakes were evaluated, the CSZ, which affects all the utilities with moderate to high (particularly if duration is considered) ground shaking intensity, and the three
crustal fault scenarios, which produce very high-intensity ground motion for one utility, but only
moderate or low-intensity ground motion for the others.
The CSZ scenario produces moderate-to high intensity ground motion in all the utilities; all
systems are damaged—primarily their transmission system pipelines in liquefiable soils. Time to
restore water service to at least 90 percent of customers varies from 7 to 30 days.
The SWIF scenario affects all of the systems because of its geography relative to each utility’s
footprint. This crustal fault results in high-intensity ground motions in Everett and affects the
Seattle Tolt supply and Cedar River pipelines, and the upper reaches of Tacoma’s Green River
transmission system. Time to restore water service to at least 90 percent of customers could take up to 60 days.
The Seattle Fault scenario results in heavy damage to the Seattle system with significant outages. Everett and Tacoma are subjected to smaller ground motions, and both are expected
to restore their systems more quickly. Time to restore water service to at least 90 percent of
customers could take up to 60 days.
The Tacoma Fault scenario produces high-intensity ground motions in Tacoma, resulting in
heavy damage to Tacoma Water’s system. Seattle and Everett will have minimal impacts to
their systems given their relatively long distance from the fault. Time to restore water service to
at least 90 percent of customers could take up to 40 days. The Tacoma Fault scenario is not expected to cause outages in Everett.

Earthquake Vulnerability Assessment 7
1.6 Economic Impact
The following table shows economic losses from the four earthquake scenarios attributable to
water loss. Refer to section 6 (System Performance and Potential Economic Impact) for more detail.
Regional Systema Cascadia
Subduction Zone South Whidbey Island Fault
Seattle Fault
Tacoma Fault
Everett $70M $490M $10M $0
SPU/CWA $810M $1,550M $1,770M $240M
Tacoma Water $750M $20M not evaluated $1,110M
Total loss $1,630M $2,060M $1,780M $1,360M
a Economic losses are calculated based on a Federal Emergency Management Agency (FEMA) Benefit Cost Analysis methodology that uses
a value of $103/person/day to calculate the community impact attributable to a complete water outage. Economic losses do not consider
losses due to loss of life or injuries, damage to property, losses due to boiled water or curtailment requirements, or losses due to fire damage arising from lack of water for firefighting. When added, the loss estimates could be significantly greater, possibly two to three times
the losses estimated above depending on the severity of the scenario. Additionally, the losses are based on high level analyses
and should be considered preliminary and highly approximate.
1.7 Approaches to Increasing Seismic Resiliency in the Region
Constructing an intertie between SPU and Tacoma Water would provide both agencies with
more redundant supplies. Internal improvements may provide comparable enhancement of
each agency’s PE-LOS. Mitigation alternatives and associated costs should be assessed in a subsequent phase. An intertie between Everett and SPU may provide benefits to both agencies.
Having regional access to groundwater supplies such as those owned by Lakehaven,
Lakewood, and Sammamish Plateau may improve the service restoration times to their
neighboring utilities. Management of resources for emergency response and recovery across the region would help all utilities involved. See Section 8.0 of this report for details.
2.0 Methodology
The following section describes the methodology used to assess the resiliency of the existing
water utilities in the region (King, Pierce, and Snohomish Counties) following a major
earthquake and identifies regional strategies that would increase resiliency. The methodology involved completing six tasks:
1. Develop earthquake hazard maps for the four earthquake scenarios.
2. Assess the regional post-earthquake water transmission system response to the four earthquake scenarios.
3. Assess the regional post-earthquake water distribution system response to the four
earthquake scenarios.
4. Research and present post-earthquake service level goals that have already been established by other utilities in the region and throughout the Western states as
Earthquake Vulnerability Assessment 8
examples; describe the general process and stakeholder involvement needed to
determine PE-LOS goals.
5. Determine the existing post-earthquake performance of the water systems with respect to service levels and calculate the potential economic impact.
6. Identify (at a high level) water system earthquake hazard mitigation measures to
increase regional water system seismic resiliency.
Each of those tasks is described in further detail below.
2.1 Earthquake Scenarios and Hazards
Use of scenario-based assessments is preferred for distributed systems such as water systems.
Scenarios are more representative of the variation and attenuation of ground motions over a
service area compared with probabilistic-based ground motions such as those used in building codes. Use of probabilistic-based ground motions tends to overestimate the damage expected
to facilities distributed over a large area for any single earthquake.
For this project, four scenarios were selected, trying to capture the range of earthquake source zones and earthquake return periods that occur in the study area. The four scenarios are:
• CSZ, Mw9.0, 500-year return period
• SWIF, Mw7.4, 2,700-year return period
• Seattle Fault – Mw6.7, 1,000-year return period
• Tacoma Fault – Mw7.1, 4,500-year return period
The estimated return period for the shallow fault (SWIF, Seattle and Tacoma) scenarios is for an
earthquake occurring somewhere along the fault and not necessarily at the location assumed in this report.
Moment magnitude (Mw) is a measure of energy release, and the return period is the average
time between earthquakes anywhere on a particular fault.
The first three scenarios were published by USGS with peak ground acceleration (PGA) and
peak ground velocity (PGV) ground motion intensities available in geographic information
system (GIS) format. For each of the four scenarios, this information was “related” to each asset including facilities (PGA) and pipelines (PGV) being evaluated. For the Tacoma Fault scenario,
Tacoma Water provided ground motion information for a modified Tacoma Fault that had
originally been developed by USGS. The modification relocated the fault movement to a strand
nearer to the city of Tacoma. The PGA and PGV data for all the scenarios incorporated site amplification based on the estimated site geology (Vs30 – the average shear wave velocity in
the top 30 meters) but did not account for other site amplification effects such as Seattle Basin
effects.
The ground motion data developed by USGS is based on modern ground motion attenuation
relationships and soil class mapping (Vs30). No site-specific information is used. It is the best
information available for high-level evaluations over a broad area but could be improved with site-specific investigations.
Earthquake Vulnerability Assessment 9
Liquefaction susceptibility data was acquired from the Washington State Department of Natural
Resources; Pierce, King, and Snohomish Counties; and the participating cities. The likelihood,
or probability, that liquefaction and PGD will occur was estimated based on similar studies. The probability of PGD occurring in an area mapped as being liquefiable was applied as the “areal
extent,” the percentage of the area mapped susceptible to liquefaction that would actually
undergo PGD. The PGD values were estimated based on similar studies. These liquefaction
probabilities and PGDs were used in estimating damage to pipelines.
The hazard mapping data from the state, counties, and cities are based on surficial soil
mapping, evaluation of available borings, and geologic mapping. Limited site-specific information is used. It is the best information available for high-level evaluations over a broad
area but could be improved with site-specific investigations.
2.2 Facilities and Transmission Pipelines
This section addresses the methodology for analyzing transmission facility and pipeline
vulnerabilities. The vulnerability is the likelihood of failure. Vulnerabilities are a function of the hazard/intensity and duration of shaking to which the asset is exposed, and the type, design,
and age of the asset. Higher intensity and/or longer duration ground shaking would lead to a
more vulnerable asset. Pipelines subjected to liquefaction (ground motion that causes loosely
consolidated soils to lose their strength and behave like a liquid) or other types of ground movement are more vulnerable than those in stable ground. Some pipeline types such as cast
iron pipe with leaded joints are more vulnerable than welded steel pipes or specially designed
earthquake-resistant pipes. When one or more critical assets fail, the overall system may fail.
The expected earthquake damage to facilities (damage states) was based on past and ongoing
studies by Everett and Tacoma Water. The expected damage to SPU facilities was based on
previous studies and engineering judgment. HAZUS, a multi-hazard loss estimation model developed by the Federal Emergency Management Agency (FEMA), provided guidance in
assessing the damage state to all of the facilities through application of fragility curves for
various categories of facilities. Fragility curves provide the probability or extent of damage as a
function of PGA. The higher the PGA, the greater the extent of damage.
Damage states for all of the facilities were categorized into four groups:
• Slight – facility remains fully operable
• Moderate – some damage, but facility remains operable, possibly at reduced capacity
• Extensive – facility is heavily damaged and is not operable, but is repairable
• Complete – facility is inoperable and must be replaced
This damage state of each facility was then used to help estimate the expected system
performance following the earthquake and the time it would take for restoration.
The expected damage to pipelines was estimated in accordance with the American Lifelines
Alliance (ALA) Seismic Fragility Formulations for Water Systems (2001) methodology. The number of repairs is estimated using two regression equations based on historical pipeline
performance, one for pipe subjected to shaking (using the PGV wave propagation/shaking
intensity parameter) and the other for pipe subjected to PGD from liquefaction, landslide,
settlement, or surface fault rupture. ALA provides an equation to calculate each. The failure rate

Earthquake Vulnerability Assessment 10
for damage due to PGD is substantially higher than for wave propagation (PGV). The ALA
methodology references the HAZUS methodology that divides breaks and leaks as follows: for
wave propagation (PGV) repairs, 20 percent breaks and 80 percent leaks; for PGD-caused repairs, 80 percent breaks and 20 percent leaks.
The ALA models are as follows: Wave propagation failure rate (failures per 1000 feet) = 0.00187 X K1 X PGV Permanent Ground Displacement failure rate (failures per 1000 feet) = 1.06 X K2 X PGA0.319
Where, K1 and K2 and constants dependent on the pipe material, size and joint type PGV = the peak ground velocity in inches/second PGD = the peak ground displacement in inches
K values range from 1.4 for leaded joint cast iron in corrosive soils to 0.15 for steel pipe with
welded joints. Ductile iron with push-on joints has a K value of 0.5. The analysis was performed within GIS with layers for ground shaking, PGD, and pipe/material.
The estimated number of breaks and leaks in transmission lines was used to help estimate the expected system performance following the earthquake and, if not operable, how long it would
take to restore the system. A pipeline with a break loses its ability to transmit water and must be
repaired before the pipeline can be put back in service. A pipeline with a leak can still transmit
water, although some of the water is lost. A pipeline can be kept in service if there are a limited number of leaks. Also, leaks are generally quicker to repair than breaks. A leak repair may
sometimes be accomplished, for example, by installing a clamp around a pulled joint or
circumferential crack. Breaks often require replacing a section of pipe.
Note on ALA and HAZUS Methodologies: While these are two of the most widely used
methodologies for assessing damages to water facilities and pipelines in an earthquake, they
have limitations. These methodologies can be considered appropriate for system wide and high
level analysis evaluating water systems across the region. The performance described is expected to range by plus 100 or minus 50 percent from the performance that may occur in any
given earthquake. The next step is to conduct facility-specific assessments to further confirm the
presence and extent of damages and develop mitigation options. Analyses that consider specific
facility and site characteristics require more resources than were available for this project. Consequently, high-level methodologies such as HAZUS and ALA were used.
2.3 Distribution Systems
Distribution pipe damage was estimated using the same ALA methodology used to estimate the
transmission pipe damage described above. The estimated number of leaks and breaks was estimated for each system and, in some cases, for each pressure zone. Distribution pipe
damage was estimated for Everett, Seattle, and Tacoma. Several smaller suburban utilities
provided estimates as well. For systems where no estimates were provided, estimates were
made based on population served, the predominant pipe material in the system, and the extent of liquefiable soil in the service area.
Earthquake Vulnerability Assessment 11
These estimates were then aggregated for each county (Snohomish, King, and Pierce) to
estimate the total number of leaks and breaks requiring repair materials and the time it would
take to restore distribution systems to a specified PE-LOS.
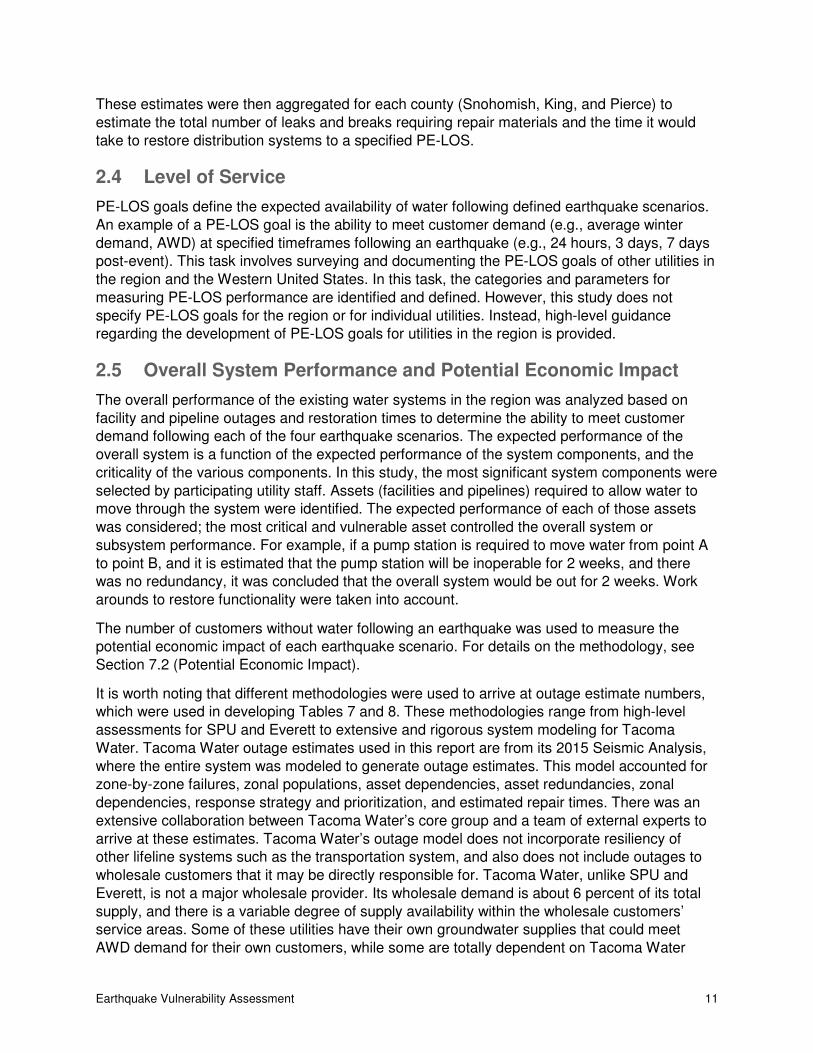
2.4 Level of Service
PE-LOS goals define the expected availability of water following defined earthquake scenarios.
An example of a PE-LOS goal is the ability to meet customer demand (e.g., average winter
demand, AWD) at specified timeframes following an earthquake (e.g., 24 hours, 3 days, 7 days post-event). This task involves surveying and documenting the PE-LOS goals of other utilities in
the region and the Western United States. In this task, the categories and parameters for
measuring PE-LOS performance are identified and defined. However, this study does not
specify PE-LOS goals for the region or for individual utilities. Instead, high-level guidance regarding the development of PE-LOS goals for utilities in the region is provided.
2.5 Overall System Performance and Potential Economic Impact
The overall performance of the existing water systems in the region was analyzed based on
facility and pipeline outages and restoration times to determine the ability to meet customer demand following each of the four earthquake scenarios. The expected performance of the
overall system is a function of the expected performance of the system components, and the
criticality of the various components. In this study, the most significant system components were
selected by participating utility staff. Assets (facilities and pipelines) required to allow water to move through the system were identified. The expected performance of each of those assets
was considered; the most critical and vulnerable asset controlled the overall system or
subsystem performance. For example, if a pump station is required to move water from point A
to point B, and it is estimated that the pump station will be inoperable for 2 weeks, and there was no redundancy, it was concluded that the overall system would be out for 2 weeks. Work
arounds to restore functionality were taken into account.
The number of customers without water following an earthquake was used to measure the potential economic impact of each earthquake scenario. For details on the methodology, see
Section 7.2 (Potential Economic Impact).
It is worth noting that different methodologies were used to arrive at outage estimate numbers, which were used in developing Tables 7 and 8. These methodologies range from high-level
assessments for SPU and Everett to extensive and rigorous system modeling for Tacoma
Water. Tacoma Water outage estimates used in this report are from its 2015 Seismic Analysis,
where the entire system was modeled to generate outage estimates. This model accounted for zone-by-zone failures, zonal populations, asset dependencies, asset redundancies, zonal
dependencies, response strategy and prioritization, and estimated repair times. There was an
extensive collaboration between Tacoma Water’s core group and a team of external experts to
arrive at these estimates. Tacoma Water’s outage model does not incorporate resiliency of other lifeline systems such as the transportation system, and also does not include outages to
wholesale customers that it may be directly responsible for. Tacoma Water, unlike SPU and
Everett, is not a major wholesale provider. Its wholesale demand is about 6 percent of its total
supply, and there is a variable degree of supply availability within the wholesale customers’ service areas. Some of these utilities have their own groundwater supplies that could meet
AWD demand for their own customers, while some are totally dependent on Tacoma Water

Earthquake Vulnerability Assessment 12
supply. In the future and as more information becomes available, the model could be updated
by Tacoma Water.
2.6 Mitigation
Three categories of mitigation alternatives were considered: 1) interties– development of new
facilities to allow movement of water from one system to another; 2) intra-system improvements
– replacement or upgrade of the assets that had the most impact on outage time within each
system, and 3) implementation of general plans and policies to improve emergency preparedness and response. The third category could include provisions for more generators,
more excavators for pipe repair, and acquisition of pipe and repair materials to enhance
restoration times.
3.0 Earthquake Hazards
3.1 Geologic Hazards
The Pacific Northwest is a very geologically active region of the United States with massive
basalt lava flows, very large-scale floods, and massive multiple glaciation events occurring in recent geologic history. The region is susceptible to very significant earthquakes, volcanic
eruptions, and significant landslides. The identification of potential geologic hazards is of
paramount interest to water utility managers and operators in the Puget Sound region to
improve the resiliency of their utilities to these potential events. Various geologic hazards were considered by the Water Supply Forum to help evaluate and improve the region’s resiliency to
potential future events.
Figure 2 is a GIS map of the region (Snohomish, King, and Pierce Counties) depicting geologic seismic hazards compiled from a variety of geologic and other resource maps. This map depicts
the locations and identifies the following geologic hazards:
• Significant known fault zones (example – Seattle, Tacoma, etc.)
• Potential liquefaction areas
• Potential landslide areas
• Potential tsunami inundation areas
These hazards are discussed further in Section 3.4. This map was created to locate faults, potential liquefaction and landslide areas for further evaluation of four earthquake scenarios,
and the impact on water utilities and their recovery from such events. The Geologic Hazards
Map should be used only as a general reference in evaluating potential geologic hazards for any
given area. Additional more detailed geologic and hazard maps should be evaluated during any focused risk assessment by a particular utility.

Earthquake Vulnerability Assessment 13
Figure 2 Seismic Hazards
Earthquake Vulnerability Assessment 14
3.2 Earthquake Source Zones
Three different types of earthquakes—each with different characteristics, depths, potential
energy, and ground motions—may shake Western Washington and the Puget Sound region. An understanding of the potential seismic impacts to the Puget Sound region begins with a basic
understanding of these three types of earthquakes. These earthquakes are the result of tectonic
movements and the strains and pressures placed on the North American Plate by the
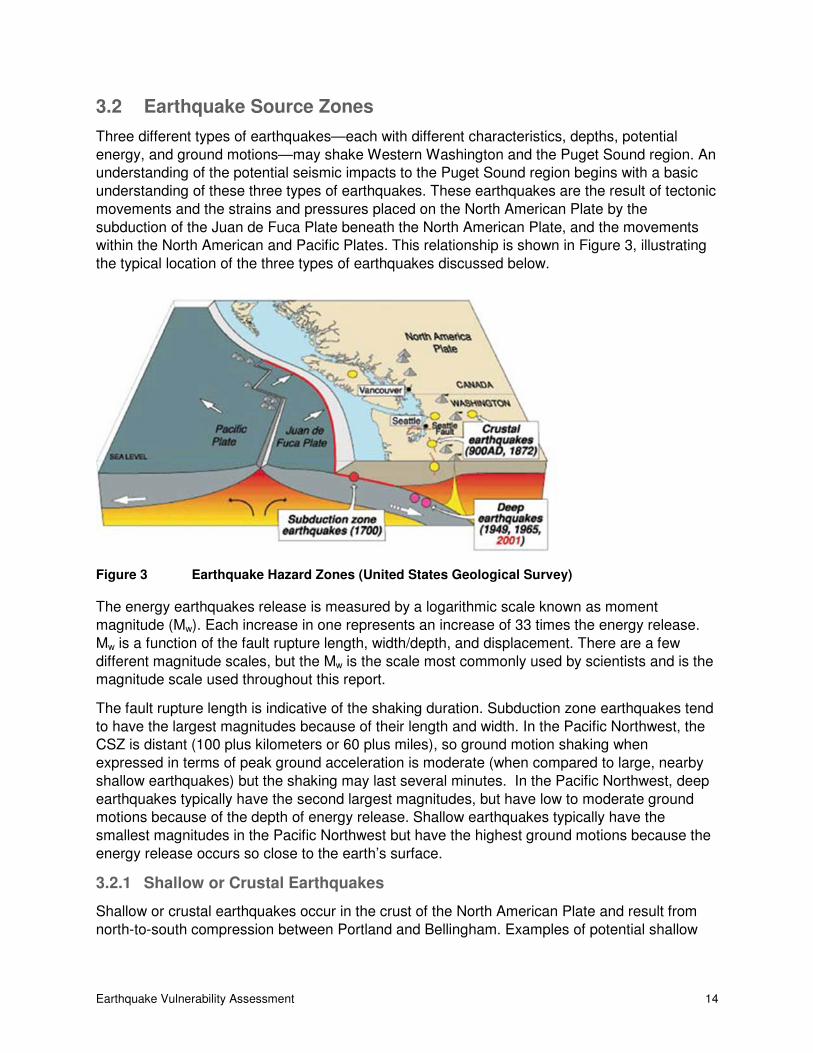
subduction of the Juan de Fuca Plate beneath the North American Plate, and the movements within the North American and Pacific Plates. This relationship is shown in Figure 3, illustrating
the typical location of the three types of earthquakes discussed below.
Figure 3 Earthquake Hazard Zones (United States Geological Survey)
The energy earthquakes release is measured by a logarithmic scale known as moment
magnitude (Mw). Each increase in one represents an increase of 33 times the energy release.
Mw is a function of the fault rupture length, width/depth, and displacement. There are a few
different magnitude scales, but the Mw is the scale most commonly used by scientists and is the magnitude scale used throughout this report.
The fault rupture length is indicative of the shaking duration. Subduction zone earthquakes tend
to have the largest magnitudes because of their length and width. In the Pacific Northwest, the CSZ is distant (100 plus kilometers or 60 plus miles), so ground motion shaking when
expressed in terms of peak ground acceleration is moderate (when compared to large, nearby
shallow earthquakes) but the shaking may last several minutes. In the Pacific Northwest, deep
earthquakes typically have the second largest magnitudes, but have low to moderate ground motions because of the depth of energy release. Shallow earthquakes typically have the
smallest magnitudes in the Pacific Northwest but have the highest ground motions because the
energy release occurs so close to the earth’s surface.
3.2.1 Shallow or Crustal Earthquakes
Shallow or crustal earthquakes occur in the crust of the North American Plate and result from
north-to-south compression between Portland and Bellingham. Examples of potential shallow

Earthquake Vulnerability Assessment 15
earthquake locations would include the Seattle, Tacoma, and South Whidbey Island –
Rattlesnake Mountain Faults.
• Shallow earthquakes are the most common type of earthquakes encountered in the Puget Sound region, with very small earthquakes occurring almost daily.
• Shallow earthquakes can result in the highest shaking intensities (e.g., PGA and/or PGV) due to their shallow depth even with moderate magnitudes. Significant ground
motion and the greatest damage typically occurs in close proximity to the epicenter such
as exemplified in the 1995 Kobe or 2011 Christchurch Earthquakes.
• Because of their smaller magnitudes, shallow earthquakes are usually of more limited duration, lasting less than a minute. Aftershocks often occur with shallow crustal
earthquakes.
• Shallow earthquakes can often trigger landslides and cause liquefaction in proximity to the epicenter.
• USGS estimates that there is a 15 percent chance of an Mw6.5 or larger shallow fault earthquake occurring somewhere in the Puget Sound in the next 50 years.
3.2.2 Deep Benioff Zone Intraplate Earthquakes
Deep or intraplate (Benioff) earthquakes occur within the subducting Juan de Fuca Plate below
the North American Plate. These depths are typically on the order of 30 or more miles below the surface. The ground shaking intensities from these events are typically only moderate. The
2001 Mw6.8 Nisqually Earthquake with an epicenter approximately 30 miles deep is an example
of a deep intraplate earthquake.
• Deep earthquakes occur in the Puget Sound region with damaging events occurring at an average interval of approximately every 30 to 50 years. USGS estimates an
84 percent chance of another deep earthquake similar to the 2001 Nisqually Earthquake
occurring in the next 50 years. The three largest recent events occurred in 1949, 1965,
and 2001.
• Deep earthquakes typically result in moderate regional shaking due to their deeper depth dispersing the seismic energy over a larger area, with magnitudes typically less
than Mw7.5.
• Deep earthquakes usually have moderate durations, lasting less than 60 seconds in length. Aftershocks are rare.
• Deep earthquakes can often trigger landslides and cause liquefaction over a large region.
3.2.3 Subduction Zone Interplate Earthquakes
Subduction zone earthquakes also occur at the interface between the subducting and fixed
tectonic plate. Subduction zones occur at a number of locations in the world, and these types of earthquakes can often be the more destructive earthquakes and release significant amounts of
seismic energy and, potentially, an associated tsunami. In the Pacific Northwest, the CSZ,
shown in Figure 4, occurs off the coast of southern British Columbia, Washington, Oregon, and
Northern California. The subducting oceanic Juan de Fuca Plate is moving beneath the North

Earthquake Vulnerability Assessment 16
American Plate along an approximately 1,000-kilometer (620-mile) long front. Significant strain
builds up over time as the one plate moves below the other, eventually releasing that energy in
an often large-scale “rebound” seismic event. This rebound action can generate a large tsunami. It is estimated that it would take 5 minutes for the fault to “unzip” between southern
British Columbia and Northern California. The Seattle region would be subjected to strong
ground shaking for 3 minutes or longer during such an event.
Figure 4 Cascadia Subduction Zone
• Geologic evidence indicates the CSZ earthquakes occur at an average interval of approximately 500 years, with the last CSZ event occurring on January 26, 1700 (previous subduction zone earthquakes occurred in approximately AD 900, 750, and
400). These depths are typically on the order of miles or more below the surface.
• CSZ’s locked portion of the plate boundary between the Juan de Fuca and North American plates is in the boundary area that is less than 30 kilometers deep.
• Subduction zone earthquakes can release tremendous amounts of energy over a very wide area. They can result in very significant, long-term regional shaking due to their deeper depth dispersing the seismic energy over a larger area. Subduction events
produce the largest magnitude earthquakes historically, as large as Mw9.5 in Chile
in 1960.
• Subduction zone earthquakes may be of significant duration and cause strong ground shaking to last 3 to 5 minutes. Significant aftershocks up to Mw7 are common with
subduction zone earthquakes.
• Subduction zone earthquakes can often trigger significant landslides and liquefaction due to the prolonged nature of the shaking.

Earthquake Vulnerability Assessment 17
• A destructive tsunami hitting the Northwest Coast is likely from a CSZ event, but this tsunami would likely be greatly reduced in size to less than 1 foot by the time it reached
the lower Puget Sound region.
• USGS estimates that there is a 14 percent chance of an Mw9.0 Cascadia subduction earthquake in the next 50 years.
3.3 Earthquake Scenarios
3.3.1 Introduction
The Water Supply Forum Earthquake Team evaluated four earthquake scenarios in this initial
phase of the earthquake vulnerability assessment. These four scenarios encompass three regionally prominent shallow earthquake fault zones and the regionally important CSZ
earthquake. Deep Intraplate (Benioff) earthquakes occur approximately every 30 to 50 years
and can result in significant damage and disruption, but are not expected to affect regional
water supply as much as the scenarios modeled in this project. This observation shouldn’t preclude any further investigation of water systems damage due to deep earthquakes. Deep
earthquakes, though less severe compared to other scenarios considered in this project, are
rather more frequent, and pose their own unique set of challenges. The four earthquake
scenarios (faults) investigated include:
• CSZ
• South Whidbey Island – Rattlesnake Mountain Fault
• Seattle Fault
• Tacoma Fault
3.3.2 Cascadia Subduction Zone – 500-year Average Return Interval for Mw9.0
This earthquake scenario’s peak ground motions are presented in Figure 5. Unlike the other three shallow earthquake scenarios, the CSZ event is characterized by very widespread ground
motion from Vancouver, British Columbia, to Eureka, California, including the study region. The
PGA would be very strong (approximately 0.2g to 0.3g) in the western portion, would transition
to strong (approximately 0.1g to 0.2g) in the central portion, and would be moderate (approximately 0.05g to 0.10g) in the eastern portion of the study region. While the PGA is not
as severe as might potentially be felt in close proximity to a shallow earthquake, the duration
and widespread nature of the CSZ event is what makes it so devastating. Possibly up to 3
minutes or longer of strong ground motion (with overall shaking of up to 5 minutes) is expected, causing significant liquefaction and setting off numerous landslides throughout the region.

Earthquake Vulnerability Assessment 18
Figure 5 Cascadia Subduction Zone Scenario, Mw9.0 Peak Ground Acceleration

Earthquake Vulnerability Assessment 19
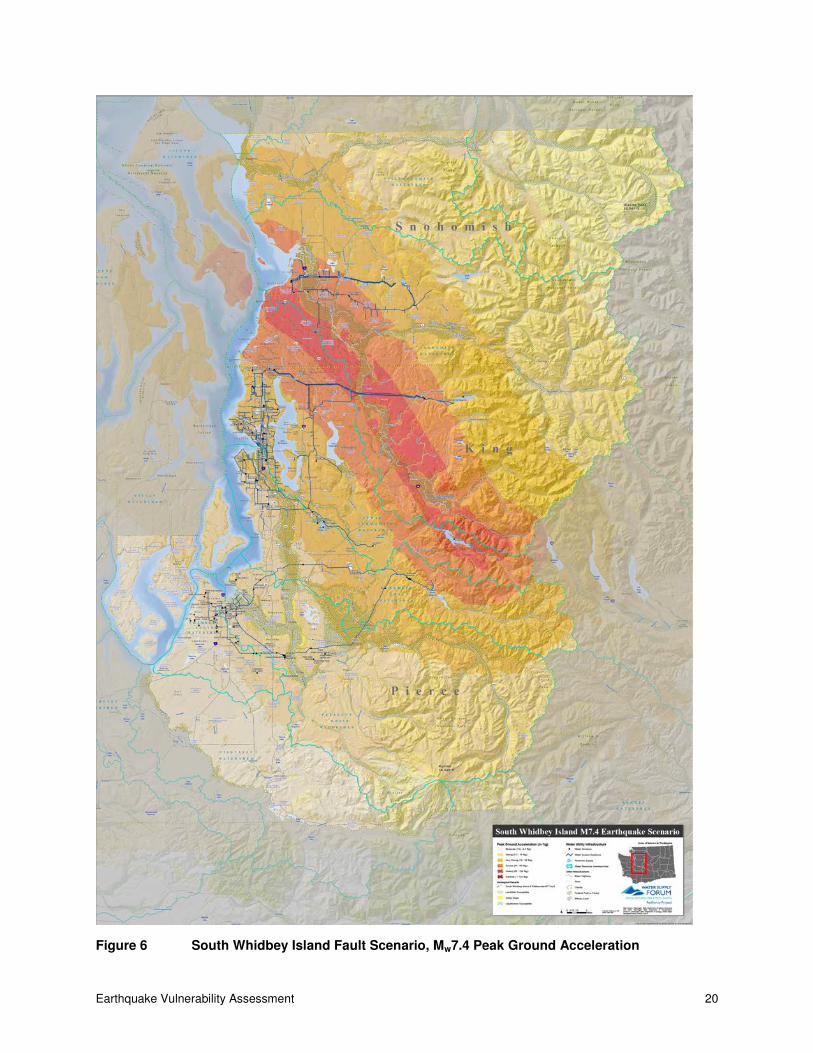
3.3.3 South Whidbey Island Fault (specially developed) – 2,700-year Average Return Interval for Mw7.4 along Fault Zone
This scenario is a specially developed scenario that looks at an emerging concept that the Rattlesnake Mountain fault in the Snoqualmie Valley is a continuation of the SWIF. This major
fault system poses the potential for significant seismic energy and disruption to water utility
systems in the region—primarily transmission water systems. This scenario is depicted in
Figure 6. The scenario evaluated an Mw7.4 magnitude event along the length of the fault from Everett to the upper portion of the Snoqualmie Valley near North Bend, Washington. PGAs
ranged from violent (0.6g to 1.2g) in proximity to the fault to severe (0.3g to 0.65g) and very
strong (0.2g to 0.3g) 3 to 6 miles from the fault. The South Whidbey Island – Rattlesnake
Mountain Scenario could result in significant disruption to regional transmission mains and infrastructure.
3.3.4 Seattle Fault Scenario – 1,000-year Average Return Interval for Mw6.7 along Fault Zone
The Seattle Fault zone is one of the major fault zones that cut across the Puget Sound Basin.
The zone runs west-to-east across Puget Sound, through Seattle, along the Interstate 90
corridor and ends near Fall City, Washington. This scenario is depicted in Figure 7. The
scenario evaluated an Mw6.7 seismic event with the epicenter near the I-90 corridor in Bellevue,
Washington. A major seismic event along the Seattle Fault is expected to result in substantial liquefaction and landslides in proximity to the fault.
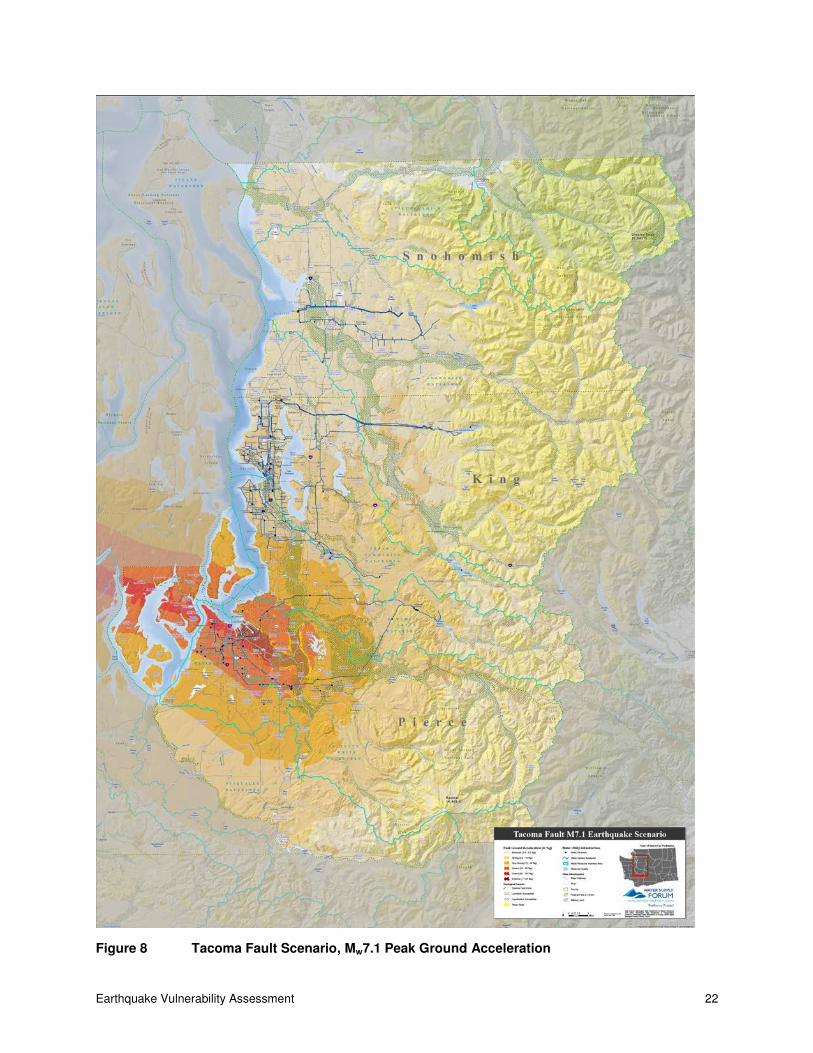
3.3.5 Tacoma Fault Scenario – 4,500-year Average Return Interval for Mw7.1 along Fault Zone
The Mw7.1 Tacoma Fault scenario is the least understood, but potentially the most damaging,
scenario for Tacoma. This scenario is depicted in Figure 8. USGS estimates a recurrence
interval of approximately 4,500 years for an Mw7.1 event somewhere in the Tacoma Fault zone.
As more studies focus on the Tacoma Fault, its alignment and recurrence will become better understood. The fault originates near the Hood Canal and runs eastward, splitting into three
strands. The published USGS scenario documents an event on the northern strand. The
scenario used in this project relocates the ground motion footprint to the southern strand. The
southernmost strand passes along the edge of Commencement Bay and terminates just inland.
Earthquake Vulnerability Assessment 20
Figure 6 South Whidbey Island Fault Scenario, Mw7.4 Peak Ground Acceleration

Earthquake Vulnerability Assessment 21
Figure 7 Seattle Fault Scenario, Mw6.7 Peak Ground Acceleration
Earthquake Vulnerability Assessment 22
Figure 8 Tacoma Fault Scenario, Mw7.1 Peak Ground Acceleration

Earthquake Vulnerability Assessment 23
3.4 Earthquake Hazards
3.4.1 Ground Motion
Ground motion intensity is often expressed in terms of PGA (used to assess structures in this
report) and PGV (used, along with PGD, to assess pipelines in this report). The PGA maps are
shown for each of the four scenarios in Figures 5 through 8. The PGV maps are shown for each
of the four scenarios in Figures 9 through 12. Peak intensity ground motion in the region is significantly higher in the Puget Sound area for the shallow fault scenarios. The fault rupture for
the subduction earthquake scenario would occur more than 100 kilometers (60 miles) away
from the Puget Sound region, while the fault ruptures for the shallow fault scenarios occur within
the Puget Sound region. However, the strong ground motions for the subduction event may last
for 3 minutes or longer, while the strong ground motions for the surface fault event will last for less than 1 minute.
It should also be noted that localized geologic and topographic conditions can cause significant amplification (and sometimes, de-amplification) of ground motions, so some areas will
experience stronger or weaker ground motions than depicted on the maps. The ground motion
intensities in the Puget Sound region from large shallow fault events will be comparable to the
ground motions that have occurred in California and Japan.
3.4.2 Permanent Ground Deformation Hazards
Linear water system facilities such as pipelines are particularly susceptible to PGD hazards.
Differential displacements along pipelines have historically caused significant damage to these pipeline systems. Vertical facilities such as reservoirs, pump stations, and treatment plants are
also often damaged if sited on soils subject to PGD.
Fault Rupture
If earthquake faults are close enough to the surface, the fault movements can be expressed on the earth’s surface. In addition to rupture along a fault plane, land subsidence or uplift, or lateral
offsets, can occur on either side of the fault. Because the Mw9.0 CSZ earthquake will occur off
the Pacific Northwest coast, surface expression of the faulting will not occur in the Puget Sound
area. For the three surface faulting scenarios, ground offset at the earth’s surface may be on the order of 2 to 3 meters (6 to 10 feet).
The surface faulting mechanisms in the Puget Sound region are very complex. Some strands of the different Puget Sound area fault zones have been identified. However, until a better
understanding of the faulting mechanisms is developed, faulting should be considered possible
anywhere within the fault zones.
Liquefaction, Lateral Spread, and Settlement
Liquefaction occurs in saturated, unconsolidated soils when ground shaking causes the pore
water pressure to exceed the confining pressure in the soil. The soil loses its shear strength and
behaves like a liquid. Buoyant objects will float and heavier objects will sink. If there is a
topographic gradient or free face such as a river embankment, the soil will spread laterally. Once a soil liquefies, it will tend to spread laterally or settle. With even slight slopes, liquefied
soils tend to move sideways downhill (lateral spreading). Ground shaking can also cause
unconsolidated soils that do not liquefy to consolidate and settle. Settling or lateral spreading

Earthquake Vulnerability Assessment 24
can cause major damage to vertical facilities, buried infrastructure such as pipes, and other
infrastructure.
Landslide
The Puget Sound region is known for significant landslide potential due to the glacial-derived
deposits that make up the majority of the lowlands. These layered unconsolidated glacial
deposits are often vulnerable to sliding as groundwater becomes perched on less permeable
layers and the pore pressure increases, releasing the slide. This is particularly the case during the winter and spring (wet times) of the year when significant precipitation can help trigger these
landslides. It is also particularly noteworthy that seismic events occurring during the wet time of
the year can be expected to trigger more landslides.
Landslides may involve block movement of soil along distinct planes or alluvial slides. In
addition to soil slides, earthquakes often result in rock and snow avalanches. In addition to
damaging facilities that are in the direct path of a landslide, landslides into drinking water reservoirs can cause turbidity and water quality issues.
Lurching
Lurching is the lateral movement of a soil block along a soil failure plain due to an earthquake’s
strong ground shaking. It is not typically thought of as being associated with liquefaction but could be associated with, for example, failure of a weak clay layer.
Tsunami and Seiche
Tsunamis are generated primarily by earthquakes that deform the seafloor and create massive
waves. Tsunamis can also be generated by volcanic events and landslides into bodies of water. Seiches are the sloshing of water in inland bodies of water, such as lakes and sounds. Tsunami
and seiches have occurred in the Puget Sound region. The most significant tsunami-susceptible
areas in the Puget Sound region are Seattle’s Harbor Island/SoDo area and the Tacoma tide flat
area. Other low areas along the Puget Sound shoreline are also susceptible to tsunamis.
Although an Mw9.0 CSZ event would generate a large tsunami along the Pacific Northwest
coast, by the time this tsunami reaches the region, it would likely be less than 1 foot high. The
more significant tsunami threat is from surface faulting in the Puget Sound area. The Tacoma, Seattle, and SWIF zones extend across Puget Sound, and the Seattle Fault across Lake
Washington, and they have caused tsunamis in the past and will likely cause tsunamis in the
future that may reach 5 meters (16 feet) in height in the most vulnerable locations. Although
some water distribution facilities could be affected by a Puget Sound tsunami, almost all significant water system facilities are outside of tsunami-susceptible areas. In the 2011 Tohoku
Earthquake, water service restoration in the tsunami-inundated areas was complicated by
saltwater intrusion into the water distribution mains.
The Seattle and SWIF rupture scenarios for this project were assumed to occur away from the
Puget Sound and would not generate significant Puget Sound tsunamis. It should be noted that
a landslide near the Tacoma Narrows caused by the 1965 Puget Sound Earthquake did cause a
minor tsunami, so faulting directly under a body of water is not always needed to generate a tsunami. The Tacoma fault scenario assumed for this project could generate a more significant
tsunami that affects near-shore areas along Puget Sound.
Earthquake Vulnerability Assessment 25
Figure 9 Cascadia Subduction Zone Scenario, Mw9.0 Peak Ground Velocity

Earthquake Vulnerability Assessment 26
Figure 10 South Whidbey Island Fault Scenario, Mw7.4 Peak Ground Velocity

Earthquake Vulnerability Assessment 27
Figure 11 Seattle Fault Scenario, Mw6.7 Peak Ground Velocity

Earthquake Vulnerability Assessment 28
Figure 12 Tacoma Fault Scenario, Mw7.1 Peak Ground Velocity

Earthquake Vulnerability Assessment 29
Seiche occurs when strong ground shaking causes inland bodies of water to oscillate and form
waves. Past Puget Sound earthquakes have caused seiches to occur in the Puget Sound, Lake
Union, Lake Washington, and undoubtedly other water bodies in the region. Under the right circumstances, seiches can result in waves that are large enough to overtop dams.
Theoretically, intake structures and facilities could also be damaged.
Tsunamis and seiches may bring widespread damage to some parts of the region; however,
tsunamis and seiches are not expected to have much impact on water system functionality, and
therefore, they are not considered in the analysis.
4.0 Transmission and Supply Facilities Analysis
4.1 Introduction and Evaluated Facilities and Pipelines
The Pacific Northwest Puget Sound area is faced with many natural hazards that may affect the
ability of water utilities to serve their customers. This section evaluates the probable effects of
earthquake hazard on critical components of the water supply system for SPU, Tacoma Water, Everett, and CWA and their ability to provide an adequate PE-LOS to their customers.
The transmission and supply facilities analysis evaluated large critical infrastructure including surface and groundwater sources, headworks, treatment plants, transmission pipelines, terminal
and major storage reservoirs, major and critical water supply pump stations, and major pipelines
that supply or interconnect neighboring utilities. The major test to determine whether an
identified facility will be evaluated is whether this facility is critical to supply potable water to the distribution system. Tables 1 to 4 list the evaluated facilities.
Table 1 Everett Public Works Facilities and Transmission Mains
Spada Reservoir and Culmback Dam Water Conveyance Tunnels 1, 2, and 3, including Portals 1–6
Chaplain Reservoir and the North and South Dams Water Transmission Lines 2, 3, 4, and 5
Sultan River Diversion Facilities Reservoirs 2, 3, and 6
Water Filtration Plant, including the Operations Building Clearview Transmission Line, Pump Station and Reservoir
Pump Stations 1 and 2 at the Water Filtration Plant
Table 2 Seattle Public Utilities Facilities and Transmission Mains
Masonry Dam Tolt Regulating Basin Dams
Landsburg Tunnel and Gate House Tolt Water Treatment Facility
Lake Youngs Outlet Dam Eastside Reservoir
Lake Youngs Cascade Dam Lake Forest Park Reservoir
Cedar Water Treatment Facility Beacon, West Seattle, Maple Leaf, and Riverton Reservoirs
Control Works Eastside and TESS Junction Pump Stations
Tolt Reservoir Intake Structure Transmission Pipeline System
Tolt Dam Boulevard Park and Riverton Wells
Lake Youngs Water Treatment Plant Landsburg Dam/Diversion

Earthquake Vulnerability Assessment 30
Table 3 Tacoma Water Facilities and Transmission Mains
Water Operations Building Hood Street Reservoir
Headworks Operations Building Indian Hill 3.5 Million Gallon Reservoir
Intake/Diversion Dam North End Reservoir
Green River Filtration Facility and all associated facilities (tanks, pump stations, etc.)
Alaska Street Reservoir
North Fork Well Field South Tacoma Pump Station
South Tacoma Wells Hood Street Hydro Pump Station
GPL Wells Raw Water Line (Tunnels 1 and 2, and Green River Crossing)
Hood Street Control Building (Hypo System) North Fork Well Field Pipeline
Hood Street Ground Water Treatment Building Pipelines 1, 2, 4, and 5
McMillan Reservoirs 1 and 2 West End Transmission Pipeline
Portland Avenue Reservoir North End Transmission Pipeline
Wells Pipeline
Table 4 Cascade Water Alliance Transmission Main
Bellevue-Issaquah Pipeline
4.2 Analysis Methodology
Risk is a function of the probability of occurrence and the associated shaking intensities, the
likelihood of failure of a facility or of the overall system, and the consequence of that failure. The consequence can be quantified in terms of the threat to people and the built environment posed
by the earthquake scenario. For the major and critical components of the water supply system,
the consequence is a function of the extent of damage to system infrastructure, the duration of
disruption of water supplies, and the economic losses resulting from loss of water supplies. Loss of life and property damage from fires following an earthquake was not considered in the
economic analysis for this project but could be considered in a future phase.
4.2.1 Facility Analysis Methodology
Facilities were analyzed using methods developed in HAZUS-MH (HAZUS) (FEMA 2015).
Alternatively, several of the utilities had recently completed seismic assessments. Results from
those assessments were incorporated using the same format used in HAZUS. In some cases, the utilities had used HAZUS methods in their assessments. HAZUS includes a series of fragility
curves relating PGA with the expected probability of failure/damage state. The damage states
are then related to the expected level of performance. Based on the damage state,
representatives from the participating utilities estimated the time it would take to restore a facility to operation either using temporary fixes/work arounds or full repair. The restoration times took
into account the damage state, available resources, and available repair crews.

Earthquake Vulnerability Assessment 31
4.2.2 Transmission System Analysis Methodology
Transmission pipelines were analyzed using the methodology developed by the ALA, Seismic Fragility Formulations for Water Supply Systems (ALA 2001). The number of failures from
permanent ground displacement is estimated as a function of the pipe material, joint type, and
diameter, and the permanent ground displacement and areal extent of permanent ground
displacement. The number of failures from wave propagation effects is estimated as a function of the pipe material, joint type and diameter, and the peak ground velocity. The pipe damage
algorithms are shown in Section 2.2. These damage algorithms were intended to be used to
estimate overall damage for large pipeline distribution networks and not damage to individual
pipelines. The actual pipeline transmission pipeline performance may vary significantly from these estimates.
A break is defined as the loss in hydraulic continuity across a pipe failure. Although leaks allow
water to escape form the pipeline, hydraulic continuity is maintained. For pipe in areas subjected to PGD, 80 percent of the pipe repairs are estimated to be breaks, and 20 percent
leaks. In areas only subjected to PGV, 20 percent are breaks and 80 percent are leaks. Repairs
of breaks take longer than leaks. In many instances, a pipeline can continue to operate with a
leak, but must be taken out of service with a break.
The estimated restoration time of any particular pipeline is a function of the number of leaks and
breaks, and the available resources and repair crews.
Restoration times cited in this report refer to restoration of the supply and transmission system.
Distribution system restoration is addressed in Section 5.0.
4.3 Results
4.3.1 Introduction
This analysis is based on previous facility studies, very approximate non-site-specific models,
and engineering judgment. This is a high-level assessment and should be used only for general
regional planning. More detailed analyses should be conducted before detailed planning decisions are implemented.
4.3.2 Everett
The City of Everett currently holds surface and groundwater rights for total instantaneous quantity (Qi) of 275 million gallons per day (MGD) and an annual quantity (Qa) of 150 MGD.
The Everett water system supplies water to most of Snohomish County (more than
560,000 people) through a network of 109 direct and indirect wholesale customers.
Major facilities and characteristics of the Everett water system include the following:
• Spada Reservoir – 50 billion gallon capacity
• Chaplain Reservoir – 4.5 billion gallon capacity
• Water Filtration Plant at Chaplain Reservoir – 132 MGD Department of Heath-approved
flow rate
• 4 main transmission lines – ranging from 36- to 52-inch diameter
• 4 pump stations
• 18 pressure zones
Earthquake Vulnerability Assessment 32
• 75 pressure reducing valves
• 15 storage facilities – ranging from 0.1 to 24 million gallons in capacity
• 95 direct wholesale customers – 31 group A systems and 64 group B systems
• 13 indirect wholesale customers
In 2015, Everett’s average day and peak day demands were 52.7 MGD and 98.4 MGD, respectively.
Mw9.0 Cascadia Subduction Zone Scenario
The Mw9.0 CSZ Scenario is expected to produce PGAs that are less than 0.2g in Everett’s
supply and transmission and distribution system areas. The CSZ scenario is unlikely to cause significant damage that results in loss of functionality to the vertical transmission system
facilities (buildings, reservoirs, and other non-pipeline structures), with the exception of
Reservoir 2, which is expected to have complete damage due to its age and current condition.
As stated under the SWIF scenario, Reservoir 2 can be bypassed within 3 days and is currently scheduled to be replaced by 2019.
The most significant impact on transmission functionality would be damage to the transmission
system pipelines. The ALA model suggests that there may be up to 15 breaks and leaks in Everett’s transmission pipelines. These breaks and leaks would be expected to occur primarily
in areas of permanent ground displacement from liquefaction and landslide.
It is expected to take up to 14 days to restore transmission system functionality.
Mw7.4 South Whidbey Island Fault Scenario
The Mw7.4 SWIF scenario is expected to produce PGAs that range from almost 0.8g at the
Clearview Water Reservoir and Everett’s Reservoir 6 to less than 0.2g for the Spada and
Chaplain Reservoirs. In many instances, the ground motions from the SWIF scenario greatly exceed the current building code design level ground motion requirements and are significantly
beyond what would reasonably be considered when facilities are designed. The strongest
ground shaking would be in the Clearview Water Reservoir area. Vertical facilities that could
possibly lose functionality, defined as being able to supply winter day demand, are:
• Clearview Water Reservoir – Although recently constructed to modern seismic standards, the ground shaking severity may cause extensive damage that could require
bypassing the reservoir for over a year.
• Everett’s Reservoir 3 – Extensive damage is expected that may result in loss of functionality of up to 14 days.
• Everett’s Reservoir 6 – Extensive damage is expected that may result in loss of functionality of up to 14 days. This reservoir can be bypassed within 3 days.
• Evergreen Pump Station – Extensive damage is expected that may result in loss of functionality of up to 14 days. This pump station is needed to supply south Everett.
• Everett’s Reservoir 2 – Complete damage is expected. This reservoir can be bypassed within 3 days. The reservoir is currently budgeted and scheduled for replacement
by 2019.

Earthquake Vulnerability Assessment 33
• Everett’s Water Filtration Plant Operations Building – Extensive damage is expected that may result in loss of functionality of up to 14 days. The building is currently being
seismically retrofitted. The work is scheduled for completion by end of 2016.
• Chaplain Reservoir and the North and South Dams – Extensive damage is expected that may result in loss of functionality of more than 1 year. The reservoir can be bypassed within 1 day.
• Everett’s Water Filtration Plant – Moderate damage is expected that may result in loss of functionality of up to 7 days. The plant can be bypassed and disinfected water can be
supplied within 3 days.
The most significant impact on transmission functionality would be damage to the transmission system pipelines. The ALA model suggests that there may be over 30 breaks and leaks in the
Clearview Transmission Line, and up to 20 breaks and leaks in Everett’s transmission pipelines.
The severity of the damage to the transmission system pipelines depends on the location and
extent of any surface expression of the faulting and on the extent of severity of liquefaction along the pipeline alignments. Because of the uncertainty in where surface rupture from faulting
may occur and the liquefaction severity, there is also a great deal of uncertainty in the
transmission pipeline damage estimates.
The Clearview Transmission Line can be bypassed within 3 days while the Everett’s
transmission pipelines would take up to 14 days to become functional.
Mw6.7 Seattle Fault Scenario
The Mw6.7 Fault Scenario is expected to produce PGAs that range from 0.08g for most of the system to 0.12g at the Clearview Water Reservoir. These small ground motions are mild and all
the vertical facilities (pump stations, reservoirs, water filtration plants, dams, etc.) are expected
to respond very well and to remain functional with very slight damage.
The most significant impact on transmission functionality would be damage to the transmission
system pipelines. The ALA model suggests that there may be up to six breaks and leaks to the
transmission system pipelines. The severity of the damage to the transmission system pipelines
depends on the location and extent of any surface expression of the faulting and on the extent of severity of liquefaction along the pipeline alignments. Because of the uncertainty in where
surface rupture from faulting may occur and the liquefaction severity, there is also a great deal
of uncertainty in the transmission pipeline damage estimates.
It is expected to take up to a week to restore transmission system functionality.
Mw7.1 Tacoma Fault Scenario
The Mw7.1 Tacoma Fault Scenario is expected to produce PGAs that are less than 0.08g throughout the Everett supply and transmission systems. No damage is expected anywhere in
the system.
4.3.3 Seattle Public Utilities
The SPU water system serves approximately 1.3 million residents. Approximately 50 percent of
these residents are served directly by SPU. The other 50 percent are served by 19 municipal
and special purpose districts, and the CWA. The average daily demand is 133 MGD.
Earthquake Vulnerability Assessment 34
The SPU water system has two primary sources
1. Cedar River Watershed
2. Tolt River Watershed
Chester Morse Lake in the Cedar River Watershed can store 13 billion gallons between
1,538 and 1,563 feet. Lake Youngs, which is between the Cedar River Watershed and the SPU service area, can store an additional 1.5 billion gallons. Cedar River water is treated at the Lake
Youngs Water Treatment Plant.
The Tolt Reservoir holds 18.3 billion gallons. The Tolt Filtration Plant is used to treat Tolt Water. The Tolt system typically provides between 30 to 40 percent of SPU’s water demand.
In addition to the Tolt and Cedar supplies, the Riverton and Boulevard Park wells can provide
up to 10 MGD for 4 months in times of drought or emergency.
Water is transported from the Cedar and Tolt watersheds via 200 miles of transmission
pipelines. The Tolt system consists primarily of welded steel mains with some concrete cylinder mains. The Cedar system consists of riveted steel, lockbar steel, welded steel, and some
concrete cylinder pipe.
Mw9.0 Cascadia Subduction Zone Scenario
The Mw9.0 CSZ scenario is expected to produce PGAs that are less than 0.3g in the SPU transmission and distribution system areas. The CSZ scenario is unlikely to cause significant
damage that results in loss of functionality to the vertical transmission system facilities.
However, the duration of strong ground shaking may cause over 40 breaks and leaks (ALA
model) to transmission system pipelines. These breaks and leaks would be expected to occur primarily in areas of permanent ground displacement from liquefaction and landslide.
Although damage to the transmission pipeline system from the CSZ event will not likely be as
severe as the damage from the Seattle or the SWIF events, the damage from the CSZ event will be more widespread. The Cedar River and Tolt River supplies may also both be affected from a
CSZ event.
Most non-pipeline transmission facilities would be expected to remain functional. Possible exceptions would be facilities that rely on commercial power and do not have backup power
such as the Boulevard Park and Riverton wells. Although the Eastside Reservoir was designed
to modern seismic standards, problems with the reservoir and the significant increase in
leakage following the 2001 Nisqually Earthquake suggest that it may need to be taken out of service to inspect following a subduction earthquake.
More significant damage could occur to transmission pipelines. These transmission pipelines
cross several areas that are susceptible to liquefaction and landslide. The performance of these transmission pipelines would depend on the severity of the permanent ground displacements,
so significant uncertainty exists regarding how some pipelines will respond. SPU is currently
conducting more detailed analyses at potentially vulnerable locations. Currently, it is estimated
that restoration of the transmission system may take 7 days.

Earthquake Vulnerability Assessment 35
Mw7.4 South Whidbey Island Fault Scenario
The Mw7.4 SWIF scenario is expected to produce PGAs that range from almost 0.8g in the
Cedar River Watershed to less than 0.2g for some of the in-city transmission system facilities. In
many instances, the ground motions from the SWIF scenario greatly exceed the current building code design level ground motion requirements and are significantly beyond what would
reasonably be considered when typical facilities are designed. The strongest ground shaking
would be in the Cedar River watershed. Those vertical facilities that could possibly lose
functionality, (not being able to supply average winter day demand) are:
• Tolt Water Filtration Plant – Although recently constructed to modern seismic standards, the ground shaking severity may cause some moderate damage that could require plant
shutdown for a few days.
• Eastside Reservoir – Some damage possible that may result in loss of functionality. Depending on the severity of the damage, this major storage facility for the East Side may not be available from 1 week to 1 month
• Dams – Those dams that may possibly be vulnerable to such large ground motions are being assessed and will likely be upgraded if needed.
The most significant impact on water transmission functionality would be damage to the
transmission system. The ALA model suggests that there may be over 50 breaks and leaks to the transmission system pipelines. The severity of the damage to the transmission system
pipelines depends on the location and extent of any surface expression of the faulting and on
the extent of severity of liquefaction along the pipeline alignments. Because of the uncertainty in
where surface rupture from faulting may occur and the liquefaction severity, there is also a great deal of uncertainty in the transmission pipeline damage estimates.
The Tolt River pipelines may be susceptible to severe damage with this scenario. Although the
Cedar River pipelines may possibly lose functionality also, the damage to the Cedar River pipelines would be relatively easier to repair. It may take more than 1 month to restore
transmission system functionality to the Tolt pipelines.
Mw6.7 Seattle Fault Scenario
The Mw6.7 Seattle Fault scenario is expected to produce PGAs that range from greater than 0.6g at the Eastside Reservoir to less than 0.1g in the Tolt Watershed. Although these ground
motions are very high, overall, the “vertical” (reservoirs, pump stations, dams, etc.) facilities are
expected to respond very well. Vertical facilities that could possibly lose functionality, defined as
being unable to supply winter day demand, are:
• Control Works – Extensive damage is possible. Loss of functionality would make it more difficult to regulate pressure in the Cedar River pipelines, but the Cedar system could
still be operated.
• Eastside Reservoir – Extensive damage possible that may result in loss of functionality. Depending on the severity of the damage, this major storage facility for the East Side may not be available for 3 to 6 months.

Earthquake Vulnerability Assessment 36
• Boulevard Park and Riverton Well Fields – Even if the well facilities remain operational, there is no backup power for these sites, and the wells, which can supply up to 10 MGD,
would not be functional until power is restored.
• Lake Youngs Cascades Dam –The Cascades dam will be analyzed in the future. Lake Youngs can be bypassed if it needs to be lowered.
The most significant impact on water transmission functionality would be damage to the
transmission system pipelines. The ALA model suggests that there may be over 50 breaks and
leaks to the transmission system pipelines. The severity of the damage to the transmission
system pipelines depends on the location and extent of any surface expression of the faulting and on the extent of severity of liquefaction along the pipeline alignments. Because of the
uncertainty in where surface rupture from faulting may occur and the liquefaction severity, there
is also a great deal of uncertainty in the transmission pipeline damage estimates.
The Cedar system is more likely than the Tolt system to suffer severe damage in the Seattle
Fault scenario. It may take up to a week to even restore partial transmission system
functionality. Although complete restoration could take longer, the transmission system could
likely provide winter day demand to all turnouts within a month or so of the event.
Mw7.1 Tacoma Fault Scenario
The Mw7.1 Tacoma Fault Scenario is expected to produce PGAs that are less than 0.2g
throughout the SPU transmission and distribution area. Significant damage is not expected to
any of the SPU transmission system vertical facilities. There may be a couple of leaks in the transmission system pipelines, but the only pipelines that would be expected to possibly lose
functionality would be Cedar River Pipeline No. 4 and maybe the West Seattle Pipeline.
However, the Boulevard Park and Riverton wells could make up for loss of the Cedar River
Pipeline No. 4 and West Seattle Pipeline.
4.3.4 Tacoma Water
Tacoma Water’s system has two primary sources:
1. Surface water supply from Green River, supplemented by North Fork Wells in East King
County – Ravensdale, Washington
2. Local in-town groundwater source (within and nearby Tacoma city limits)
The surface water supply is treated at the Green River Filtration Facility (GRFF), which is near
this source. The finished water is transported to Tacoma via two major transmission pipelines:
Pipeline 5 and Pipeline 1. Pipeline 5 is a recently installed (in 2004) fully pressurized welded
steel pipeline and is about 34 miles long. Pipeline 5 also supplies water to Regional Water Supply System partners (Kent, Covington, and Lakehaven districts) and Auburn (Tacoma
Water’s wholesale customer). Pipeline 1, which is about 26 miles in length, consists of some
sections that are over 100 years old and is made up of various materials, including riveted steel,
welded steel, and multiple sections of concrete pipes. Both Pipelines 1 and 5 travel through liquefiable zones and are thus exposed to these seismically induced geological hazards. In the
event surface water conveyance from GRFF to Tacoma has issues, the supply system can be
supplemented by in-town groundwater supply, as was the case in the 2015 drought response.
Earthquake Vulnerability Assessment 37
Tacoma Water supplies and demands are:
• Green River Supply: 150 MGD
• North Fork Wells (7 wells) Supply: 72 MGD (can be used in lieu of, but not combined
with, Green River supply)
• In-town wells: 55 MGD
• Average day demand: 55 MGD
• Peak day demand: 85 MGD
The system is spread throughout Pierce and southern King Counties and is affected by the
earthquake scenarios in different ways due to its geological location.
Mw9.0 Cascadia Subduction Zone Scenario
The Mw9.0 CSZ scenario is expected to produce PGAs that are less than 0.3g in and near Tacoma city limits; however, the PGAs are attenuated as they approach the Green River
Headworks area because it is farther away east from Tacoma. PGAs get as low as about 0.12g
in the GRFF vicinity.
However, even if the ground motions are “moderate,” the relatively long duration of this scenario
makes it a very damaging earthquake scenario. CSZ strong ground shaking is expected to last
for 2 to 3 minutes, and this duration is expected to result in widespread liquefaction damage and
damage to older buildings.
HAZUS analyses show that the following key facilities could lose functionality immediately
following an earthquake:
• Water Operations Building – Extensive damage is possible. This is categorized as an essential facility for Tacoma Water and is a designated emergency preparedness
communication and operations center. Loss of this facility severely impairs Tacoma
Water’s post-earthquake response and recovery activities.
• South Tacoma Pump Station – Extensive damage is possible. This is categorized as an essential facility for Tacoma Water. Loss of this facility severely impairs Tacoma Water’s ability to use in-town groundwater supply to meet system demands while supplies from
major transmission pipelines are unavailable.
• Hood Street Control Building – Extensive damage is possible. This is categorized as an essential facility, key for post-earthquake response and recovery operations.
Transmission pipelines are expected to suffer heavy damage. The ALA model suggests that there may be over 60 breaks and leaks in the transmission system.
It could take up to 3 weeks to make Pipeline 5 functional. Pipeline 1 is anticipated to remain out
of service for about 7 weeks.
Facilities at Green River Headworks are not expected to suffer any damage due to the ground
motion being so low; however, ability to transport water from GRFF is severely affected due to several pipeline transmission main failures between GRFF and the City. It is estimated that it
will take about 3 weeks to restore functionality to one of the major pipelines between GRFF and
the City. Primary source of supply in the meantime will be in-town groundwater supply.

Earthquake Vulnerability Assessment 38
It could take up to 30 days to restore service to 90 percent of customers and over 2 months to
restore service to all customers.
Mw7.4 South Whidbey Island Fault Scenario
The Mw7.4 SWIF scenario is expected to produce PGAs less than 0.15g in most of the Tacoma
local and nearby area and greater PGAs in the Headworks area.
HAZUS analyses show that all key facilities are expected to suffer either slight or moderate
damage and to remain functional following this event.
The ALA model suggests that there may be over a dozen breaks and leaks in the transmission system, mostly in Pipeline 1.
Key to this scenario is that in-town groundwater supply is expected to be functional.
It could take slightly over a week to restore services to all customers.
Mw6.7 Seattle Fault Scenario
The Mw6.7 Seattle Fault scenario is expected to produce PGAs well below 0.2 g throughout the Tacoma Water system.
HAZUS analyses show that all key facilities are expected to do well (slight or moderate damage)
and remain operable following this event.
The ALA model suggests that there may be over 20 breaks and leaks in the transmission
system pipelines, mostly in Pipeline 1. Distribution failures were not evaluated in this phase.
Key to this scenario is that in-town groundwater supply is expected to remain functional.
The Tacoma Water system was not analyzed for outages for the Seattle Fault scenario in its system modeling. At a high level, it can be safely assumed that since the groundwater system is
expected to remain operational, average winter day demand is expected to be met immediately
to most of the system following this earthquake event.
Mw7.1 Tacoma Fault Scenario
The Mw7.1 Tacoma Fault scenario is expected to produce very high PGAs. Because it is very
close to the surface, it is expected to cause heavy damage to the Tacoma area, and thus can
be considered the most damaging scenario for Tacoma. PGAs can be as high as 0.66g in the
Tacoma area and are attenuated to about 0.2g in the Headworks area.
The intensity of ground shaking is expected to cause heavy damage to the Tacoma Water
system.
HAZUS analyses show that the following key facilities could lose functionality:
• Water Operations Building – Complete damage is possible. This is categorized as an essential facility for Tacoma Water and is a designated emergency preparedness, communication, and operations center. This building also houses the Water Control
Center.
• South Tacoma Pump Station – Complete damage is possible. This is categorized as an essential facility for Tacoma Water. Loss of this facility severely impairs Tacoma Water’s
Earthquake Vulnerability Assessment 39
ability to use in-town groundwater supply to meet system demands while supplies from
major transmission pipelines are unavailable.
• Hood Street Control Building – Complete damage is possible. This is categorized as an essential facility for Tacoma Water for post-earthquake response and recovery
• Hood Street Pump Station Building – Complete damage is possible. This is categorized as an essential facility to provide water immediately following a major earthquake. Loss
of this facility severely impairs Tacoma Water’s ability to use in-town groundwater supply
to meet system demands while supplies from major transmission pipelines are
unavailable.
Transmission pipelines are expected to suffer heavy damage. The ALA models suggest that
there may be over 60 breaks and leaks in the transmission system.
It could take up to 2 weeks to make Pipeline 5 functional. Pipeline 1 is anticipated to remain out of service for about 7 weeks.
Facilities at the Green River Headworks are not expected to suffer any significant damage due to the ground motion being so low; however, the ability to transport water from GRFF is severely
affected due to several pipeline transmission main failures between GRFF and the City. It is
estimated that it will take about 2 weeks to restore functionality to one of the major pipelines
between GRFF and the City. Primary source of supply in the meantime will be in-town groundwater supply.
It could take up to 40 days to restore service to 90 percent of customers and over 2 months to
restore service to all customers.
4.3.5 Cascade Water Alliance
CWA owns and operates only one transmission main and no vertical water facilities (pump stations, treatment plants, reservoirs, etc.). The transmission main is the Bellevue-Issaquah
Pipeline (BIP), which runs about 5 miles from approximately SPU’s Eastgate Reservoir in
Bellevue east to Sammamish Water & Sewer Plateau District’s Well 9 Pump Station in
Sammamish. The most vulnerable stretch of the BIP is in the Lower Issaquah Creek Valley just
south of Lake Sammamish due to the moderate-to-high liquefaction potential of the soils in that area.
Mw9.0 Cascadia Subduction Earthquake Scenario
The Mw9.0 CSZ scenario is expected to produce PGAs that are between 0.16g and 0.2g in the
area of the BIP.
The ALA model suggests that there may be up to two breaks in the BIP. The estimate on breaks
is primarily in the area of liquefiable soils in the Lower Issaquah Creek Valley.
Restoration time for repairing the pipeline would be within 3 days.
Mw7.4 South Whidbey Island Fault Scenario
The Mw7.4 SWIF Scenario is expected to produce PGAs that are between 0.28g and 0.32g in the area of the BIP.

Earthquake Vulnerability Assessment 40
The ALA model suggests that there may be up to three breaks in the BIP. The estimate on
breaks is primarily in the area of liquefiable soils in the Lower Issaquah Creek Valley.
Restoration time for repairing the pipeline would be within 7 days.
Mw6.7 Seattle Fault Scenario
The Mw6.7 Seattle Fault Scenario is expected to produce PGAs that are between 0.64g and 0.68g in the area of the BIP.
The ALA model suggests that there may be up to two leaks and three breaks in the BIP. The
estimate on breaks is primarily in the area of liquefiable soils in the Lower Issaquah Creek Valley.
Restoration time for repairing the pipeline would be within 7 days.
Mw7.1 Tacoma Fault Scenario
The Mw7.1 Tacoma Fault Scenario is expected to produce PGAs that are between 0.16g and
0.2g in the area of the BIP.
The ALA model suggests that there may be up to one leak and two breaks in the BIP. The
estimate on breaks is primarily in the area of liquefiable soils in the Lower Issaquah Creek
Valley.
Restoration time for repairing the pipeline would be within 3 days.
5.0 Water Distribution Systems
5.1 Water Distribution System Performance in Past Earthquakes
In previous major earthquakes affecting similarly sized water utilities, more than
1,000 distribution pipeline breaks/leaks have typically occurred in each earthquake. Thousands
of distribution pipeline breaks were reported in the 1995 Mw6.9 Hanshin-Awaji (Kobe), 2010
Mw9.0 Chilean, February 2011 Mw6.2 Christchurch, and 2011 Mw9.0 Tohoku earthquakes. Even though the 1989 Loma Prieta Earthquake epicenter was approximately 60 miles from San
Francisco and Oakland, and the energy from the 1994 Northridge Earthquake was directed
away from central Los Angeles, over 1,000 distribution pipeline failures occurred in each of
these earthquakes. The Chilean and Tohoku earthquakes were subduction zone earthquakes, similar to the subduction zone earthquakes that occur off the Pacific Northwest coast. The
February 2011 Christchurch Earthquake was on a shallow fault in Christchurch that is
somewhat similar to the shallow faults in the Puget Sound region.
Distribution pipelines repairs have usually been the critical path to restoring at least a minimal
level of water service to all water utility customers. Repair crews are often overwhelmed by the
volume of repairs that are needed. Repair materials and equipment may also be in short supply.
Damage to transportation infrastructure can further complicate the repair process. Many distribution pipeline failures are not evident. Repairs are made, the system is disinfected, and
after the system is repressurized, undiscovered damage is identified and the process begins
again. Aftershocks and even gradual post-earthquake fault creep can create new damage.
Because the pressure often falls below critical thresholds until overall system integrity can be

Earthquake Vulnerability Assessment 41
reestablished, customers are often asked to disinfect water before it is used for potable
purposes even after service has been nominally restored. It has typically taken 30 to 60 days to
repair distribution system piping so that water service is restored to customers after major earthquakes such as the interplate subduction and shallow earthquake scenarios used in this
project. It is expected that the restoration times in the region will be similar to the restoration
times that other areas have experienced after major earthquakes.
Areas subject to PGD are particularly susceptible to pipeline damage. The 1989 Loma Prieta
Earthquake was a prime example of the role local geotechnical conditions can play in the
occurrence of pipeline damage. Although there were thousands of miles of water pipelines closer to the epicenter of the Loma Prieta Earthquake, most water system pipeline damage
occurred in liquefied soils in the East Bay or San Francisco’s Marina District. The other notable
area of high pipeline failure rates occurred where permanent ground displacement occurred in
Santa Cruz’s San Lorenzo River valley and the south of Market Street area in San Francisco.
In general, poor geotechnical conditions increase the likelihood of severe pipeline damage.
Tacoma Water and SPU have large areas of high and moderate-to-high liquefaction
susceptibility and are much more concerned with the effects of distribution pipeline damage on system operation than Everett, which has relatively fewer areas of liquefaction susceptibility.
Pipe condition also plays a role in pipeline seismic vulnerability. Corrosive soils can degrade
pipelines, so there is evidence that metallic pipelines in corrosive soils are more vulnerable than metallic pipelines in more benign soils. Other types of pipelines with degraded strength would
also be expected to be more seismically vulnerable.
Pipeline material and joint type also influence pipeline vulnerability. Rigid and brittle pipelines
such as cast iron with leaded joints, typically suffer higher failure rates than ductile pipelines.
Fortunately, distribution pipeline systems have been developed that are earthquake resistant. In Japan, ductile iron pipe with joints that are designed to resist large axial forces and that permit
1 percent axial compression or tension and up to 8 degrees of rotation, was introduced over
40 years ago. So far, there have not been any documented failures of this pipe. A few
U.S. utilities have started using this earthquake-resistant pipe. U.S. pipe manufacturers have recently developed competing products.
Butt-fused joined high-density polyethylene (HDPE) pipe appears to offer similar performance
as the Japanese earthquake-resistant ductile iron pipe. There were not any failures of butt-fused jointed HDPE pipe in the Christchurch and Tohoku earthquakes. Butt-welded steel pipe offers
similar promise. Although not quite as reliable as the Japanese earthquake-resistant ductile iron
pipe, new molecularly oriented polyvinyl chloride (PVC) pipe appears to offer good earthquake
performance.
Other types of water distribution system facilities have also suffered significant seismic damage.
Reservoirs, pump stations, and other facilities built prior to the 1970s were typically only
designed for minimal seismic loads. It was not until the 1990s that seismic codes recognized that large ground motions were possible from shallow faulting in the Puget Sound area, so even
newer facilities may be vulnerable if they are near shallow fault ruptures such as those modeled
in this report. Temporary work arounds can often be implemented if vertical facilities are
damaged, but it may be years before these facilities can be permanently replaced and pre-earthquake system reliability and redundancy restored.

Earthquake Vulnerability Assessment 42
5.2 Distribution System Seismic Vulnerability Assessment Methodology
The ALA water pipeline seismic vulnerability models used to estimate transmission pipeline
failures were also used in the distribution system analysis. A GIS overlay analysis was performed for the Everett, Tacoma Water, and SPU water distribution systems. The pipeline
systems were overlaid with the PGVs for each of the four scenarios to predict the number of
wave propagation failures in each scenario. Similarly, the pipeline systems were overlaid with
the earthquake hazard map and then the permanent ground displacements, and areal extents for each scenario were used to estimate the number of failures caused by permanent ground
displacement. The number of wave propagation failures was then added to the number of
permanent ground displacement failures to determine the total number of failures.
A workshop was held for interested water utilities in the region to show them how to use the
earthquake scenario and hazard maps to estimate water distribution system damage. The GIS
script used by SPU staff to analyze the Tacoma Water, Everett, and SPU systems was
presented to interested utilities.
The overall number of distribution system pipeline failures throughout the region was estimated
by extrapolating the available distribution system results. Based on the extrapolation, the
number of water main failures in the region for each scenario is:
• Mw9.0 CSZ earthquake – possibly as many as 5,000 to 6,000
• Mw6.7 Seattle Fault earthquake – possibly as many as 3,000
• Mw7.1 Tacoma Fault earthquake – possibly as many as 3,000
• Mw7.4 SWIF earthquake – possibly as many as 4,000
Most of these failures would occur in areas that experienced significant PGD. Repairing this
many facilities would strain resources in the region. It would likely take at least 30 to 60 days to
restore distribution system piping throughout the region in all four scenarios. Repairing or replacing failed vertical facilities such as reservoirs, tanks, pump stations, etc. would likely take
at least six months to a year and most likely longer. Distribution systems, however, would for the
most part be operable during this period.
6.0 Post-Earthquake Level of Service (PE-LOS)
PE-LOS is the measure of performance of the regional water systems following a seismic event.
At the highest level, PE-LOS goals should measure the restoration time of water delivery to customers of the regional water systems. Immediately after an earthquake, providing water for
fire suppression and to critical facilities, such as hospitals, is the most important consideration.
In order to restore economic activity and allow residents to return to normal activities, providing
treated water to customer taps as quickly as possible is the next most important consideration.. As described in Section 1.1, recent major earthquakes (e.g., Tohoku, Kobe, Christchurch, and
Northridge) have experienced water service restoration times of up to 60 days . Once
established, PE-LOS goals can be used to define the objectives of a seismic mitigation program
and provide customers with an expectation of water service delivery following an earthquake so they can plan accordingly.
Earthquake Vulnerability Assessment 43
This section describes a survey of the PE-LOS of other agencies in the region and along the
West Coast of the United States. Based on the survey, high-level parameters are recommended
for measuring PE-LOS for water supply, treatment, and delivery to customers. This study does not focus on selecting detailed parameters for measuring performance for PE-LOS for
distribution systems (e.g., water delivery to hospitals, commercial and industrial users, and
residential customers). Finally, this section provides high-level guidance on defining PE-LOS.
A complete analysis and designation of PE-LOS goals for the region and/or individual water
utilities was not performed as part of this study. Indeed, each utility faces its own unique seismic
risks, stakeholders, economic conditions, and costs to mitigate impacts, so a uniform set of PE-LOS goals may not be appropriate.
6.1 Survey of Other Agency Post-Earthquake Levels of Service
A survey of post-earthquake levels of service from agencies or professional organizations in the
United States was conducted to determine the most relevant categories for measuring
performance of water systems following a seismic event. Based on a literature search, levels of service were collected from the following organizations:
• American Water Works Association (AWWA) General Performance Goals
• Contra Costa Water District
• East Bay Municipal Utility District
• City of Everett Public Works
• Humboldt Bay Municipal Water District
• Oregon Resiliency Plan
• San Francisco Public Utilities Commission
• Washington State Resiliency Plan
The information collected from those agencies is summarized in Appendix A. While the
information gathered from utilities in the region is valuable input, two other key factors should be
recognized: customer expectations and the financial capabilities of utilities to fulfill such expectations, which play a major role in establishing PE-LOS.
The PE-LOS goals of the agencies included higher-level service levels for water supply,
treatment, and delivery as well as more detailed distribution system service levels. The higher-level PE-LOS goals for water supply, treatment, and delivery address the availability of water
from reservoirs and water treatment plants, the quality of the water or the level of treatment
(e.g., raw water, minimally disinfected, filtered), and the transmission of water to terminal
reservoirs or connection points to the distribution systems. Distribution system service levels address the availability of water to specific customer classes within the distribution system, such
as hospitals, commercial and industrial users, and residential customers.
In addition, many agencies defined levels of service for two types of earthquake events:
(1) maximum considered earthquake with a 2 percent chance of occurrence in 50 years
(2,475-year average return interval), and (2) moderate earthquake that could range from
10 percent probability of occurrence in 50 years (475-year average return interval) to 50 percent

Earthquake Vulnerability Assessment 44
probability of occurrence in 50 years (72-year average return interval). One of the surface fault
events considered in this report would be an example of a maximum considered earthquake.
The MW9.0 CSZ scenario is an example of an event with a 10 percent probability of occurrence in 50 years, while a Deep Benioff Intraplate earthquake that occurs directly under a utility might
be considered as an event with a 50 percent chance of exceedance in 50 years. The general
trend has been to use the 10 percent probability of exceedance in 50 years event as the
moderate earthquake. However, because a 50 percent chance of exceedance in 50-year event represents an event that a civil structure with a 100-year useful life is expected to experience,
this lower level event is still often considered. Generally speaking, PE-LOS goals for moderate
earthquakes called for quicker restoration times than those for the maximum earthquake.
6.2 Parameters
Water quality following an earthquake depends on both the availability of a treatment facility to
treat the water as well as the status of the distribution system. Even if treatment facilities stay
functional, pipe breaks may result in loss of pressure, and utilities will commonly advise citizens
to disinfect water before it is used for potable purposes. This study does not address the water quality impacts of distribution system leakages, since it is focused on PE-LOS goals for water
supply, treatment, and transmission. Instead, it focuses on the availability of treatment facilities
to disinfect and/or treat water.
Most agencies surveyed had at least the following categories of service levels for water supply,
treatment, and delivery after a moderate and/or maximum earthquake:
1. Water availability and restoration time to customers: The percentage of customers
for whom water is available within a specified timeframe following an earthquake. Water
availability immediately following an earthquake is critical because it will be needed for
firefighting. For this study, water availability and restoration time to customers is measured as the timeframe (i.e., days) to deliver average winter day demand to
90 percent of the customers within the service area. Average winter day demand is used
because it represents the most critical uses (i.e., drinking water, bathing and sanitation
uses) and does not include irrigation water uses that would not be critical following an earthquake.
2. Level of treatment of water entering the transmission system: The level to which
water has been treated prior to entering the transmission system. Generally, the
categories of treatment level are (1) untreated or raw water, (2) minimal disinfection
(water introduced to the water transmission system would at a minimum include chlorination), and (3) full treatment.
Based on the information collected, the post-earthquake service level categories in Table 5 are
proposed for this study.

Earthquake Vulnerability Assessment 45
Table 5 Post-Earthquake Service Level Categories
Category Criteria
Level of treatment of water entering transmission system
• Minimally disinfected water provided • Fully treated water provided
Water availability and restoration time to customers
• Timeframe (i.e., days) to deliver average winter day demand to 90 percent of customers within the service area
6.3 Guidelines for Establishing PE-LOS Goals
As described earlier, this study does not establish PE-LOS goals. PE-LOS goals should be
established only after careful and detailed understanding of the following information:
1. Expected system damage following an earthquake
2. Time to restore service to customers
3. Number of customers facing water outages, including the duration of the outages
4. Economic impact from customer outages
5. Cost to upgrade the water system to reduce the impact of customer outages
6. Regulatory requirements
7. Stakeholder input, which includes stakeholder expectations, risk acceptance, and
willingness to commit resources to reduce risk
8. PE-LOS goals established by utilities of similar size and in areas with comparable
seismic activity and by expert opinion
The survey of PE-LOS goals of other agencies revealed a variety of different PE-LOS goals
across water utilities. The results and recommendations from this study may create a more consistent framework for defining PE-LOS goals across the region. The benefits of a consistent
framework for PE-LOS goals include greater transparency for the public, establishment of a
baseline standard for water system earthquake reliability, and ease of benchmarking across PE-
LOS goals for different utilities. However, given the variability in the severity and occurrence probability of seismic hazards that each utility may be exposed to, the inherent variability of
each utility system’s seismic ruggedness or resiliency, and the cost to achieve a desired level of
post-earthquake performance, it may be appropriate for different utilities to have different PE-
LOS goals.
It is strongly advised that utilities both develop PE-LOS goals and develop a time-line to achieve
those goals.

Earthquake Vulnerability Assessment 46
7.0 System Performance and Potential Economic Impact
7.1 Estimated Post-Earthquake System Performance
The transmission and distribution facility and system performance and restoration estimates
from Sections 4.0 and 5.0 were used to estimate the performance of the regional water systems with respect to the PE-LOS categories from Table 5 in Section 6.0. PE-LOS estimates were
made for each of the four earthquake scenarios. Table 6 shows the estimated treatment level
that can be provided by the primary treatment plants. Table 7 shows the estimated timeframe
for restoring water service at average winter day demand to 90 percent of customer’s taps for the three major water providers in the region.
Table 6 Post-Earthquake Current Water Treatment Plant Performance a,c
Regional Water System
Cascadia Subduction Zone
South Whidbey Island Fault
Seattle Fault
Tacoma Fault
SPUb/CWA • Minimal disinfection within 24 hours
• Full treatment within 24 hours
• Minimal disinfection within 24 hours
• Full treatment within 24 hours (Cedar) to possibly more than 72 hours (Tolt)
• Minimal disinfection within 24 hours
• Full treatment within 24 hours (Tolt) to possibly more than 72 hours (Cedar)
• Minimal disinfection within 24 hours
• Full treatment within 24 hours (Tolt), possibly longer for Cedar.
Tacoma Water • Minimal disinfection within 72 hours
• Full treatment within 72 hours
• Minimal disinfection within 24 hours
• Full treatment within 24 hours
• Minimal disinfection within 24 hours
• Full treatment within 24 hours
• Minimal disinfection within 72 hours
• Full treatment within 72 hours
Everett Public Works
• Minimal disinfection within 24 hours
• Full treatment within 24 hours
• Minimal disinfection within 3 days
• Full treatment within 7 days
• Minimal disinfection within 24 hours
• Full treatment within 24 hours
• Minimal disinfection within 24 hours
• Full treatment within 24 hours
a The restoration times shown are for the treatment facilities. Restoration times do not take into consideration the water quality impacts of
distribution system leakages and depressurization in areas of the system that may result. b SPU’s restoration estimates are preliminary and may change after SPU’s more detailed seismic study is completed. c Minimal disinfection means that water introduced to the water transmission system would at a minimum include chlorination
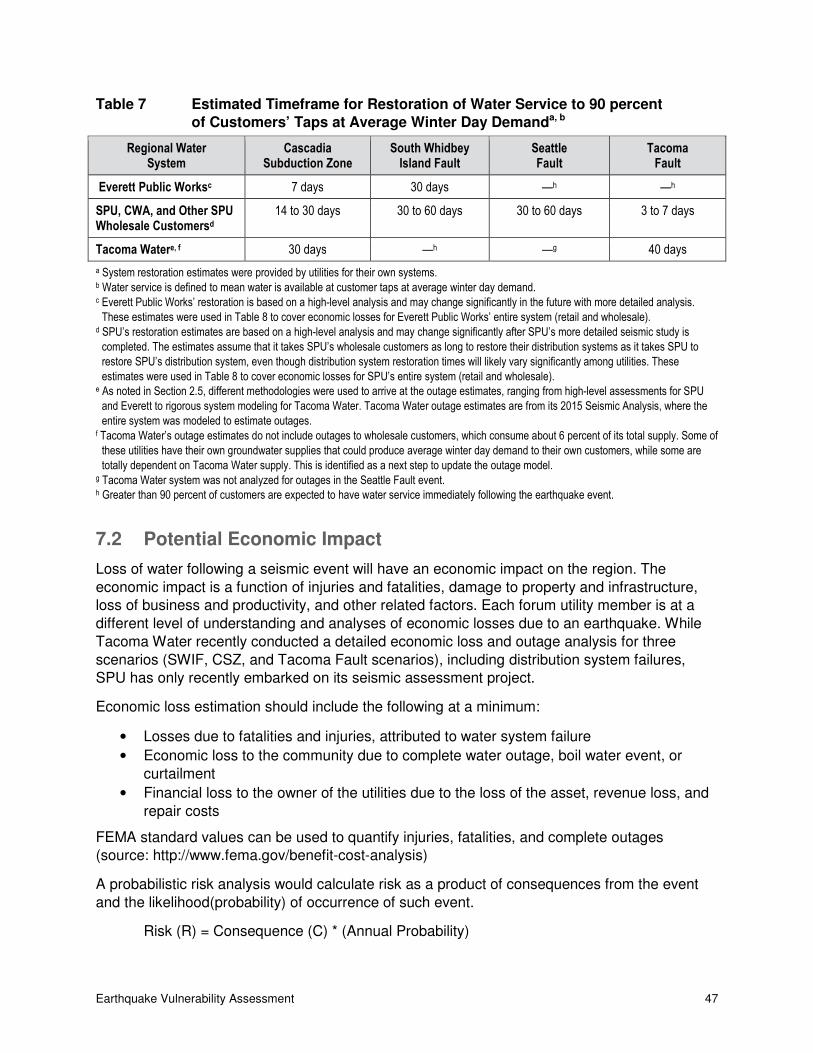
Earthquake Vulnerability Assessment 47
Table 7 Estimated Timeframe for Restoration of Water Service to 90 percent
of Customers’ Taps at Average Winter Day Demanda, b
Regional Water System
Cascadia Subduction Zone
South Whidbey Island Fault
Seattle Fault
Tacoma Fault
Everett Public Worksc 7 days 30 days —h —h
SPU, CWA, and Other SPU Wholesale Customersd
14 to 30 days 30 to 60 days 30 to 60 days 3 to 7 days
Tacoma Watere, f 30 days —h —g 40 days
a System restoration estimates were provided by utilities for their own systems. b Water service is defined to mean water is available at customer taps at average winter day demand. c Everett Public Works’ restoration is based on a high-level analysis and may change significantly in the future with more detailed analysis.
These estimates were used in Table 8 to cover economic losses for Everett Public Works’ entire system (retail and wholesale). d SPU’s restoration estimates are based on a high-level analysis and may change significantly after SPU’s more detailed seismic study is
completed. The estimates assume that it takes SPU’s wholesale customers as long to restore their distribution systems as it takes SPU to
restore SPU’s distribution system, even though distribution system restoration times will likely vary significantly among utilities. These
estimates were used in Table 8 to cover economic losses for SPU’s entire system (retail and wholesale). e As noted in Section 2.5, different methodologies were used to arrive at the outage estimates, ranging from high-level assessments for SPU
and Everett to rigorous system modeling for Tacoma Water. Tacoma Water outage estimates are from its 2015 Seismic Analysis, where the
entire system was modeled to estimate outages. f Tacoma Water’s outage estimates do not include outages to wholesale customers, which consume about 6 percent of its total supply. Some of
these utilities have their own groundwater supplies that could produce average winter day demand to their own customers, while some are
totally dependent on Tacoma Water supply. This is identified as a next step to update the outage model. g Tacoma Water system was not analyzed for outages in the Seattle Fault event. h Greater than 90 percent of customers are expected to have water service immediately following the earthquake event.
7.2 Potential Economic Impact
Loss of water following a seismic event will have an economic impact on the region. The
economic impact is a function of injuries and fatalities, damage to property and infrastructure, loss of business and productivity, and other related factors. Each forum utility member is at a
different level of understanding and analyses of economic losses due to an earthquake. While
Tacoma Water recently conducted a detailed economic loss and outage analysis for three
scenarios (SWIF, CSZ, and Tacoma Fault scenarios), including distribution system failures, SPU has only recently embarked on its seismic assessment project.
Economic loss estimation should include the following at a minimum:
• Losses due to fatalities and injuries, attributed to water system failure
• Economic loss to the community due to complete water outage, boil water event, or
curtailment
• Financial loss to the owner of the utilities due to the loss of the asset, revenue loss, and
repair costs
FEMA standard values can be used to quantify injuries, fatalities, and complete outages (source: http://www.fema.gov/benefit-cost-analysis)
A probabilistic risk analysis would calculate risk as a product of consequences from the event
and the likelihood(probability) of occurrence of such event.
Risk (R) = Consequence (C) * (Annual Probability)

Earthquake Vulnerability Assessment 48
Where R = Annual risk ($$/year)
C = Consequence ($$)
Annual Probability = 1/Return period
For this study, a simplified approach was used to calculate the economic loss to the community
due to complete water outage, based on the FEMA value of $103/person/day. Data from
Section 7.1 regarding customers without water and projected restoration times was multiplied by
$103/person/day to calculate the potential economic impact of water loss following an earthquake. Tacoma’s economic losses were not calculated for the Seattle Fault scenario.
The potential economic losses are shown in Table 8. In all cases, the numbers shown in Table 8 do not reflect economic losses due to fire damage (attributable to loss of water for firefighting)
following an earthquake. Other studies (e.g., Hetch Hetchy Water and the Bay Area Economy,
Bay Area Economic Forum, October 2002) have indicated that water-related fire damage could
increase financial losses by 50 percent following an earthquake.
Table 8 Potential Economic Losses Post-Earthquake Due to Water Lossa–e, g
Regional Water System
Cascadia Subduction Zone
South Whidbey Island Fault
Tacoma Fault
Seattle Fault
Everett 70,000,000 490,000,000 — 10,000,000
SPU/CWA 810,000,000 1,550,000,000 240,000,000 1,770,000,000
Tacoma Water 750,000,000 20,000,000 1,110,000,000 —f
Total $1,630,000,000 $2,060,000,000 $1,360,000,000 $1,780,000,000
a Economic losses are calculated based on a FEMA methodology that uses a value of $103/person/day to calculate the community impact due to a complete water outage.
b Economic losses do not consider losses due to loss of life or injuries, damage to property, losses due to boiled water or curtailment
requirements, or losses due to fire damage arising from lack of water for firefighting. When added, the loss estimates could be significantly
greater, possibly two to three times the above estimated losses depending on the severity of the scenario. c SPU’s outage and economic consequences were estimated in this study with simple, high-level, very approximate models. SPU’s outage
estimates and economic consequence estimates may change significantly after its more detailed seismic study is completed. However, there
is always significant uncertainty in estimates of this nature regardless of the amount of rigor used to make the estimates. d As noted in Section 2.5, different methodologies were used to arrive at the outages estimates, ranging from high-level assessments for SPU and Everett to a rigorous system modeling for Tacoma Water. Tacoma Water outage estimates are from its 2015 Seismic Analysis, where the
entire system was modeled to estimate outages. e Tacoma Water’s outage estimates do not include outages to wholesale customers, which consume about 6 percent of its total supply.
Tacoma Water’s outage estimates do not include outages to wholesale customers. Some of these utilities have their own groundwater
supplies that could produce average winter day demand to their own customers, while some are totally dependent on Tacoma Water supply.
This is identified as a next step to update the outage model. f Tacoma Water economic losses for the Seattle Fault scenario were not calculated. g The above estimates are Consequences of the Risk equation. Note that Risk = Consequence * Probability of occurrence. Thus, these estimates are not adjusted to account for event probability of occurrence.

Earthquake Vulnerability Assessment 49
As shown in Table 8, the potential economic losses are in the range of $1 billion to $2 billion. As
described earlier, this figure may be conservative, since it does not include losses due to water-
related fire damage and loss of life/injuries/property damage/curtailments. In addition, because this figure is based on FEMA standards for economic losses to the community due to water loss
($103/person-day), the figure can be further refined to match local economic conditions.
8.0 Mitigation
The seismic analyses in the earlier sections show that while all utilities are affected in the CSZ
scenario, one or more major utilities are relatively less affected than the others in the other three crustal fault scenarios and can provide assistance to another utility in the form of emergency
supplies or staff/material resources.
Mitigation options are expected to enhance the status-quo resiliency of the region and provide the ability to respond and recover quickly following an earthquake event, thus improving service
levels following an earthquake.
Mitigation options are presented in three categories:
1. Interutility mitigations (between utilities)
2. Intrautility mitigations (within the same utility)
3. General mitigations
8.1 Interutility Mitigations
The following interties were considered:
1. SPU-Tacoma Water west side intertie:
This intertie would allow movement of water from the Tacoma Water system to the SPU
system and vice versa. The proposed connection will be from Tacoma Water Pipeline 5, west of the liquefiable Auburn Valley, to SPU’s Cedar Pipeline #4. This intertie is found
to be mutually beneficial to SPU and Tacoma Water in all four earthquake scenarios.
The SWIF and Seattle fault scenarios would likely affect SPU significantly more than
Tacoma, so this intertie could provide SPU with an emergency supply after the Seattle Fault and SWIF events. Conversely, a Tacoma Fault event would likely affect Tacoma
more significantly than SPU, so this intertie could provide Tacoma with an emergency
water supply after a Tacoma Fault earthquake. In a CSZ earthquake, this intertie could
potentially provide emergency water to either utility depending on the damage each utility sustained. The amount of water that each agency may be able to supply the other
needs to be evaluated to more accurately estimate the potential benefit of this intertie.
2. SPU-Everett intertie:
This intertie would allow movement of water between the Everett and SPU systems. The
proposed connection will be from the Clearview Water Reservoir in Snohomish County to the Tolt East Side Supply Line (TESS) Junction in King County along the Highway 9
corridor. This connection was found to be potentially beneficial to SPU and Everett in a
CSZ scenario depending on the damage each utility sustained. The amount of water that

Earthquake Vulnerability Assessment 50
each agency may be able supply the other needs to be evaluated to more accurately
estimate the potential benefit of this intertie under such a scenario. SPU will be the
beneficiary in a Seattle Fault event and possibly in a Tacoma Fault event near Seattle. This intertie is not expected to be beneficial to either utility after a SWIF event since the
Clearview Water Reservoir is expected to collapse under such a scenario.
3. Tacoma Water-Lakehaven intertie:
Groundwater is expected to be the most reliable source in days immediately following an
earthquake event. This intertie will provide Tacoma Water additional groundwater from a neighboring utility.
4. Tacoma Water-Lakewood Intertie:
Groundwater is expected to be the most reliable source in days immediately following an
earthquake event. This intertie will provide Tacoma Water additional groundwater from a
neighboring utility.
8.2 Intrautility Mitigations
Additionally, some mitigation options are suggested for each member utility.
Everett Public Works
1. Upgrade Transmission Line 5 (TL5):
The seismic analysis found minor effects on TL5 from the CSZ, Seattle Fault, or Tacoma
Fault earthquake scenarios. Movement of the aboveground sections of TL5 on supports
would cause damage to some anchor straps. This damage is not likely to affect the ability to meet PE-LOS goals.
A SWIF scenario event was determined to cause several breaks and significant leaks
(on the order of 1,000 gallons per minute) in TL5. Upgrade of the elevated supports on Ebey Island and improvements to counter the effects of lateral soil spreading at the
transition to the Snohomish River floodplain (two locations) at Home Acres Road and at
the Pilchuck River are identified as mitigation measures to increase system resiliency in
order to achieve PE-LOS goals.
2. Upgrade Reservoir 3:
Mitigation measures to harden Reservoir 3 include seismic upgrades to the roof and to
the piping in and around the reservoir.
3. Upgrade Evergreen Pump Station:
Mitigation measures to harden the Evergreen Pump station include seismic upgrades to
the building structure and to the piping in and around the pump station.
4. Construct a new Emergency Operations Center.
5. Replace Reservoir 2:
Reservoir 2 is currently scheduled to be replaced with a new and seismically designed
reservoir by the end of 2019.

Earthquake Vulnerability Assessment 51
Seattle Public Utilities (subject to change after SPU seismic study is completed)
1. Identify seismically vulnerable areas of backbone pipelines and either upgrade and/or
develop an emergency response plan.
2. Complete terminal reservoirs’ seismic upgrades.
3. Complete vulnerability assessments of critical dams to shallow fault earthquakes.
4. Develop near-term plan to mitigate distribution pipelines damage and long-term plan to
reduce number of distribution pipelines failures.
Tacoma Water
1. Secure storage yard, purchase excavator, and repair pipe to mitigate major transmission
pipeline breaks.
2. Evaluate valving in Pipeline 5 considering potential liquefaction failures in the Auburn Valley area, in conjunction with potential intertie with SPU.
3. Mitigate vulnerabilities to Water Operations Building to enhance emergency response capability.
4. Mitigate vulnerabilities to in-town groundwater system to help meet average day winter
demand as major transmission main repairs will take 2 to 3 weeks to complete. This includes mitigating vulnerabilities to the Hood Street Pump Station Building, the Hood
Street Control Building, and to South Tacoma Pump Station.
5. Evaluate options to provide secondary water supply to the growing population at Prairie Ridge.
6. Coordinate with wholesale customers such as the Cities of Auburn and Fife to understand their seismic preparedness and response, and develop a plan to improve the
mutual resiliencies with wholesale customers including mutual response plans and
mutual aid agreements.
Cascade Water Alliance
1. Upgrade the BIP.
8.3 General Mitigations
1. Update agency emergency response plans every 5 years.
2. Seismic knowledge continues to grow rapidly. We recommend the utilities to
conduct/update their seismic vulnerability assessments continuously and no later than
every 10 years to stay reasonably current with the seismic knowledge and risks of the
time.
3. Identify essential and critical assets in accordance with current guidelines and standards
such as International Building Code, American Lifeline Alliance 2005 for buried pipelines.
Upgrade accordingly.
4. Evaluate emergency power supplies for groundwater facilities.

Earthquake Vulnerability Assessment 52
5. Acquire/store pipe repair materials for transmission pipelines.
6. Acquire/store pipe repair materials for distribution pipelines.
7. Procure (prior to the event) contracts for excavators and other emergency equipment.
8. Exercise essential groundwater wells annually.
9. Replace high-risk pipelines with seismically resilient pipelines.
10. Explore development and maintenance of groundwater supplies.
11. Consider seismic valving of pipelines in major liquefiable zones.
12. Consider seismic valving of some of the large reservoirs to prevent stored water from
being completely drained. This will ensure potable water storage following an earthquake.
13. Explore intertie options to neighboring utilities with groundwater supplies.
14. Enhance regional emergency preparedness and response planning. All four member
utilities are members of the Washington Water Agency Response Network. Emergency
preparedness and response planning could be enhanced by:
a) Developing joint stockpiles of pipeline repair materials and equipment. Examples of
materials and equipment that may be stockpiled for emergencies include pipe repair
materials, excavators, etc.
b) Increasing cooperation among area fire departments such as developing uniform
fittings at emergency water supply points, purchase of joint use emergency
equipment such as flexible pipe, tenders, etc.
c) Purchasing and sharing emergency potable water supply equipment such as
portable water storage bladders and equipment needed to transport these items to
different utilities.
d) Coordination of preparedness and response planning efforts and participation in joint
exercises that include interagency cooperation
15. Enhance Regional Emergency Response Plan. The plan should coordinate the
emergency response plans for each of the major water providers in the region. The plan
should take into consideration earthquake scenarios where one utility may be heavily impacted, but others are not. The plan should allow for sharing of resources between the
region’s utilities in such cases.
9.0 Conclusions and Recommendations
Based on the project findings, the following conclusions were reached:
1. Based on the USGS stated probabilities of an Mw9.0 CSZ scenario or an Mw6.5 or larger crustal earthquake, and assuming these are independent events, there is over a
25 percent chance of a major earthquake striking the Puget Sound area in the next
50 years.

Earthquake Vulnerability Assessment 53
2. A CSZ scenario will have significant impacts on all four major regional water utilities. The
SWIF, Tacoma Fault, and Seattle Faults (crustal earthquakes) scenarios will have more
localized damage with significant impacts on one or two regional water utilities. Following a crustal earthquake, the unaffected utilities may be available to assist the
more severely affected ones.
3. After an MW9.0 CSZ scenario, it may take up to 30 days to restore water service to
90 percent of the customers in some areas. The entire Pacific Northwest would be
affected, with the most significant water system outages occurring in SPU/CWA and
Tacoma Water service areas. Direct and indirect economic losses from water system damage alone could exceed $1.6 billion.
4. After an MW7.4 or larger SWIF scenario, it may take up to 60 days to restore water
service to 90 percent of the customers in some areas. The most significant water system outages would occur in SPU/CWA and Everett service areas. Direct and indirect
economic losses from water system damage alone could exceed $2 billion.
5. After an MW6.7 or larger Seattle Fault scenario, it may take up to 60 days to restore water service to 90 percent of customers in some areas. However, damage would
primarily affect SPU/CWA service area. Direct and indirect economic losses from water
system damage alone could exceed $1.8 billion.
6. After an MW7.1 or larger Tacoma Fault scenario, it may take up to 40 days to restore
water service to 90 percent of the customers in some areas. However, damage would
primarily affect Tacoma Water, and other water utilities such as SPU and Everett would be able to help the most affected utilities recover. Direct and indirect economic losses
from water system damage alone could exceed $1.4 billion.
7. Intrautility mitigation, consisting of infrastructure improvements and emergency preparedness and response planning, can help improve post-earthquake restoration
times, particularly for earthquake events such as the CSZ earthquake, where multiple
water systems are affected.
8. Interutility mitigation, consisting of interties, emergency preparedness and response
planning coordination, and mutual aid, can help improve post-earthquake restoration
times, particularly for crustal earthquake events such as an MW7.1 on the Tacoma Fault,
where damages are localized and primarily impact one regional water system.
Recommendations to improve water system seismic resiliency in the three-county area, which
should be prioritized in the future, are:
1. Evaluate impacts of distribution system failures, identify restoration strategy, and
estimate resulting outages from failures to the entire system.
2. Further develop mitigation options identified in this report to determine their cost and
improvements they would make in expected water system post-earthquake
performance.
3. Conduct further analysis to determine the cost effectiveness of different levels of
increased resiliency.
4. Advise utilities to develop PE-LOS goals and a schedule to reach these goals.
Earthquake Vulnerability Assessment 54
5. Encourage utilities’ customers to store emergency water supplies consistent with each
utility’s emergency water supply plan.
6. Consider the effects of other (e.g., transportation and power) infrastructure damage on
water system post-earthquake functionality and restoration.
7. Evaluate the potential for fires in the region after a major earthquake. Assess the
potential impact of water unavailability on fighting these fires. Investigate the
development of alternative supplies for firefighting, such as fire boats, auxiliary supply
systems, dry hydrants, and temporary hoses and pumps.
8. Estimate damage to all vertical (non-pipeline infrastructure such as reservoirs, pump
stations, etc.) water system facilities in the region.
9. Develop and maintain a corrosive soil layer in the individual utility GIS.
10. Evaluate methodologies that could be used to better estimate the economic impact of water system failures.
11. Increase awareness among regional water utilities so they at least consider installing
seismic-resistant pipelines when pipelines are replaced or constructed.
12. Encourage utilities to evaluate their own distribution systems to gain a better
understanding of impacts due to distribution system failures, to identify restoration strategies, and to estimate resulting outages from failures to their entire systems.
13. Work closely with wholesale customers to understand their seismic preparedness and
response to each of these earthquake events to update outage estimates.
14. Work toward developing plans to improve mutual resiliencies with wholesale customers
including mutual response plans and mutual aid agreements.
15. Continue to work with professional societies and associations such as the American
Society of Civil Engineers and AWWA to promote awareness among water utilities.
16. To the extent possible, track, participate, and drive the development of National Pipeline
Seismic Design Standards.
17. Make a case to elected officials/lawmakers to further refine the Washington Resilience Plan as necessary and make it an overarching resiliency plan across all lifeline systems
in Washington State—similar to the Oregon Resilience Plan.
18. Encourage interagency coordinated disaster response planning. Although outside of the scope of this Phase 1 report, the team recognizes that a quick recovery depends on a
coordinated effort from all lifeline sectors—transportation, power, water, and
communications. This study is primarily focused on water supply, but we strongly
recommend that as opportunity arises, efforts should be made to coordinate with other lifeline infrastructure sectors to establish pre-earthquake goals and post-earthquake
recovery strategies.
Earthquake Vulnerability Assessment 55
10.0 References
American Lifelines Alliance, Seismic Fragility Formulations for Water Systems, Volume 1, 2001.
American Lifelines Alliance, Seismic Guidelines for Water Pipelines, March 2005.
Ballantyne, Donald B., Minimizing Earthquake Damage: A Guide for Water Utilities, American
Water Works Association, 1994.
Bay Area Economic Forum, Hetch Hetchy and the Bay Area Economy, 2002.
Eidinger, John, and Davis, Craig A., Recent Earthquakes: Implications for U.S. Water Utilities, Water Research Foundation, 2012.
Federal Emergency Management Agency, HAZUS MH Technical Manual, 2015.
http://www.fema.gov/benefit-cost-analysis
Japan Ministry of Health, Labour and Welfare, The Damage Situation and Measures Taken
Against the Great East Japan Earhquake in 2016, 64th Announcement.
Miyajima, M., Performance of Earthquake Resistant Drinking Water Pipeline During the 2011
Tohoku Earthquake in Japan, Tenth U.S. National Conference on Earthquake Engineering Frontiers of Earthquake Engineering, 2014.
O’Rourke, Thomas D., et al., Earthquake Response of Underground Pipeline Networks in Christchurch, New Zealand, Earthquake Spectra, February 2014, Vol. 30, No. 1,
pp. 183–204.
Palmer, Stephen P., et al., Liquefaction Susceptibility and Site Class Maps of Washington State, Washington State Department of Natural Resources, September 2004.
Wald, David J., et al., ShakeMap Manual: Technical Manual, User’s Guide, and Software Guide,
Version 1.0, United States Geological Survey, 2006.

Earthquake Vulnerability Assessment 56
11.0 Contributors
Earthquake Team
Souheil Nasr (Earthquake Committee Chair) Everett Public Works
Principal Earthquake Committee Members/ Report Authors
Prabhat Karna Tacoma Water
Andrew Lee City of Bellevue
Bill Heubach Seattle Public Utilities
Souheil Nasr Everett Public Works
Bob Pancoast East King County Regional Water Association
Don Ballantyne (Technical Advisor) Ballantyne Consulting, LLC
Earthquake Committee Members
John Abdalkhani King County
Kristina Westbrook King County
Scott Jonas Sammamish Plateau Water and Sewer District
Jesse Peterson Alderwood Water and Sewer District
Earthquake Committee Advocate
Jim Miller Everett Public Works
Report Reviewer
Heather Pennington Tacoma Water
Contributors
Nathan Hildebrandt Seattle Public Utilities
John Edwards Seattle Public Utilities
Steve Beimborn Seattle Public Utilities
Bill Wells Seattle Public Utilities

Earthquake Vulnerability Assessment
Attachment A Post Earthquake Level of Service Goals

Earthquake Vulnerability Assessment
This page is intentionally left blank.


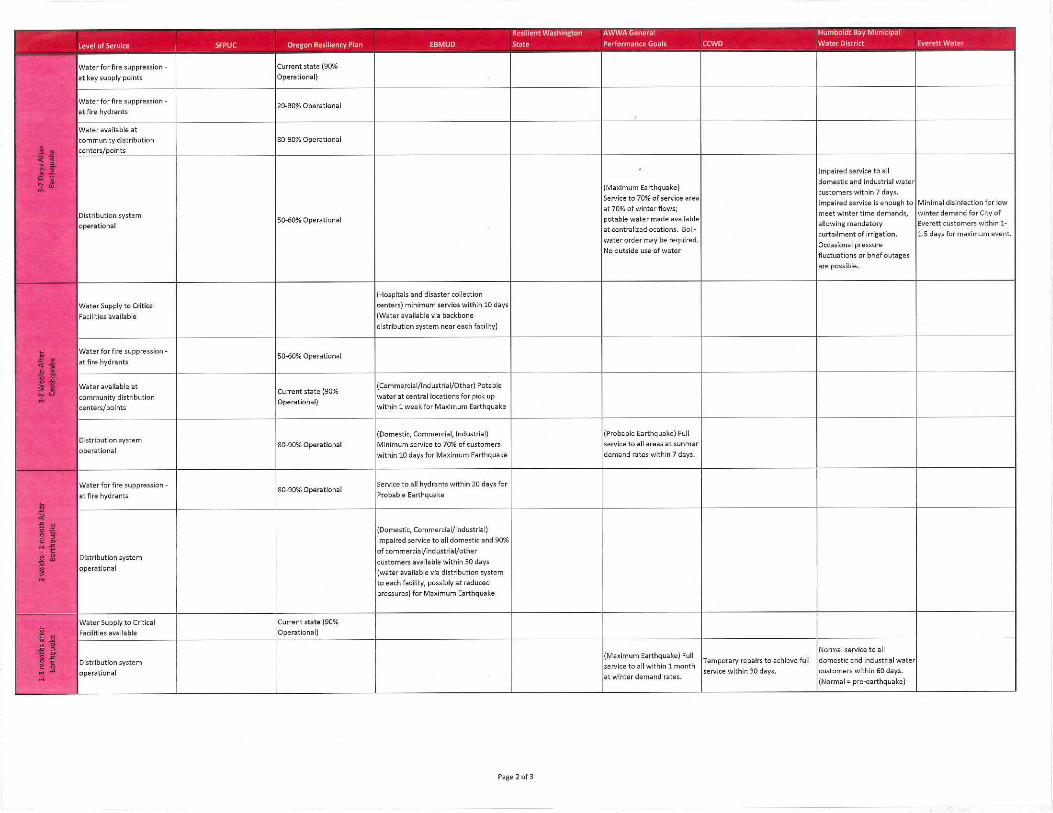

Related Documents