Water Supply and Sanitation Sector in Portugal PPPs – Private Concessions Eduardo Marques (President of the Association of Portuguese companies in the environmental sector) Lisbon, Jan 2020

Welcome message from author
This document is posted to help you gain knowledge. Please leave a comment to let me know what you think about it! Share it to your friends and learn new things together.
Transcript

Water Supply and Sanitation Sector in Portugal
PPPs – Private Concessions
Eduardo Marques
(President of the Association of Portuguese companies in the environmental sector)
Lisbon, Jan 2020
Global Index
02 OVERVIEW OF THE MUNICIPAL CONCESSION SETOR
Geografic Distribution
Main Numbers
Tenders
Economic Regulation Model
Concessions Performance
PENSAAR 2020 – PROGRESS OF PERFORMANCE INDICATORS03
01 MANAGEMENT MODELS
Key Features
02

Management Model DescriptionPrivate Sector
participationOperator
State-owned systems
Municipal or Intermunicipal owned systems
Direct management
Delegation
Concession
State
State-owned company
Multimunicipal concessionaire
• State is the operator itself (there is currently no case).
• State and municipalities participate in the capital of the concession.
• State is the owner but the entity has an independent management
(EPAL is the only example).
Direct management
Delegation
Concession
Municipal services
Municipalized services
Association of municipalities
(intermunicipalized services)
State/ Municipality partnership
Municipal owned company
Municipal concessionaire
• Services are directly managed by the Municipalities, having no
administrative and financial autonomy.
• Services have administrative and financial autonomy and are
managed by its Board of Directors but have no legal personality.• Collaborative public management body in which several
municipalities take part.
• State and municipalities participate in the capital of the company.
• One or several municipalities participate in the capital of the
company (privates can have up to 49% - PPP model).
• Concession by the Municipality to a third party, public or private,
through a concession contract.
1 – MANAGEMENT MODELS
____________________________________________________________________
Operators may adopt 3 different management models – direct management, delegation and concession – in both State-
owned systems and Municipal or Intermunicipal owned systems. The private sector only intervenes through 2 models.
Source: ERSAR.
03

Typical features of Concession Contrats
Length
Activities
Objectives
Concession fee
Performance security
Concessionaire
compensation
Financial rebalancing
25 to 50 years.
Development of networks. Manage Water supply and Wastewater collection.
Expansion investments, reinvestment (upgrades) and operation efficiency.
Annual rent.
Bank guarantee and shareholders guarantee.
Trigger events (significant deviations from Base
- Water consumption volume
‒ Investment plan
‒ Legal and regulatory changes
‒ Others
Case): Rebalancing through:
- Tariffs;
- Concession fee;
- Length of concession;
- Direct financial compensation;
- A combination of the above.
Through tariff collection to the clients.
2 – OVERVIEW OF THE MUNICIPAL CONCESSION SETOR – Key Features___________________________________________________________________________________________________________
04
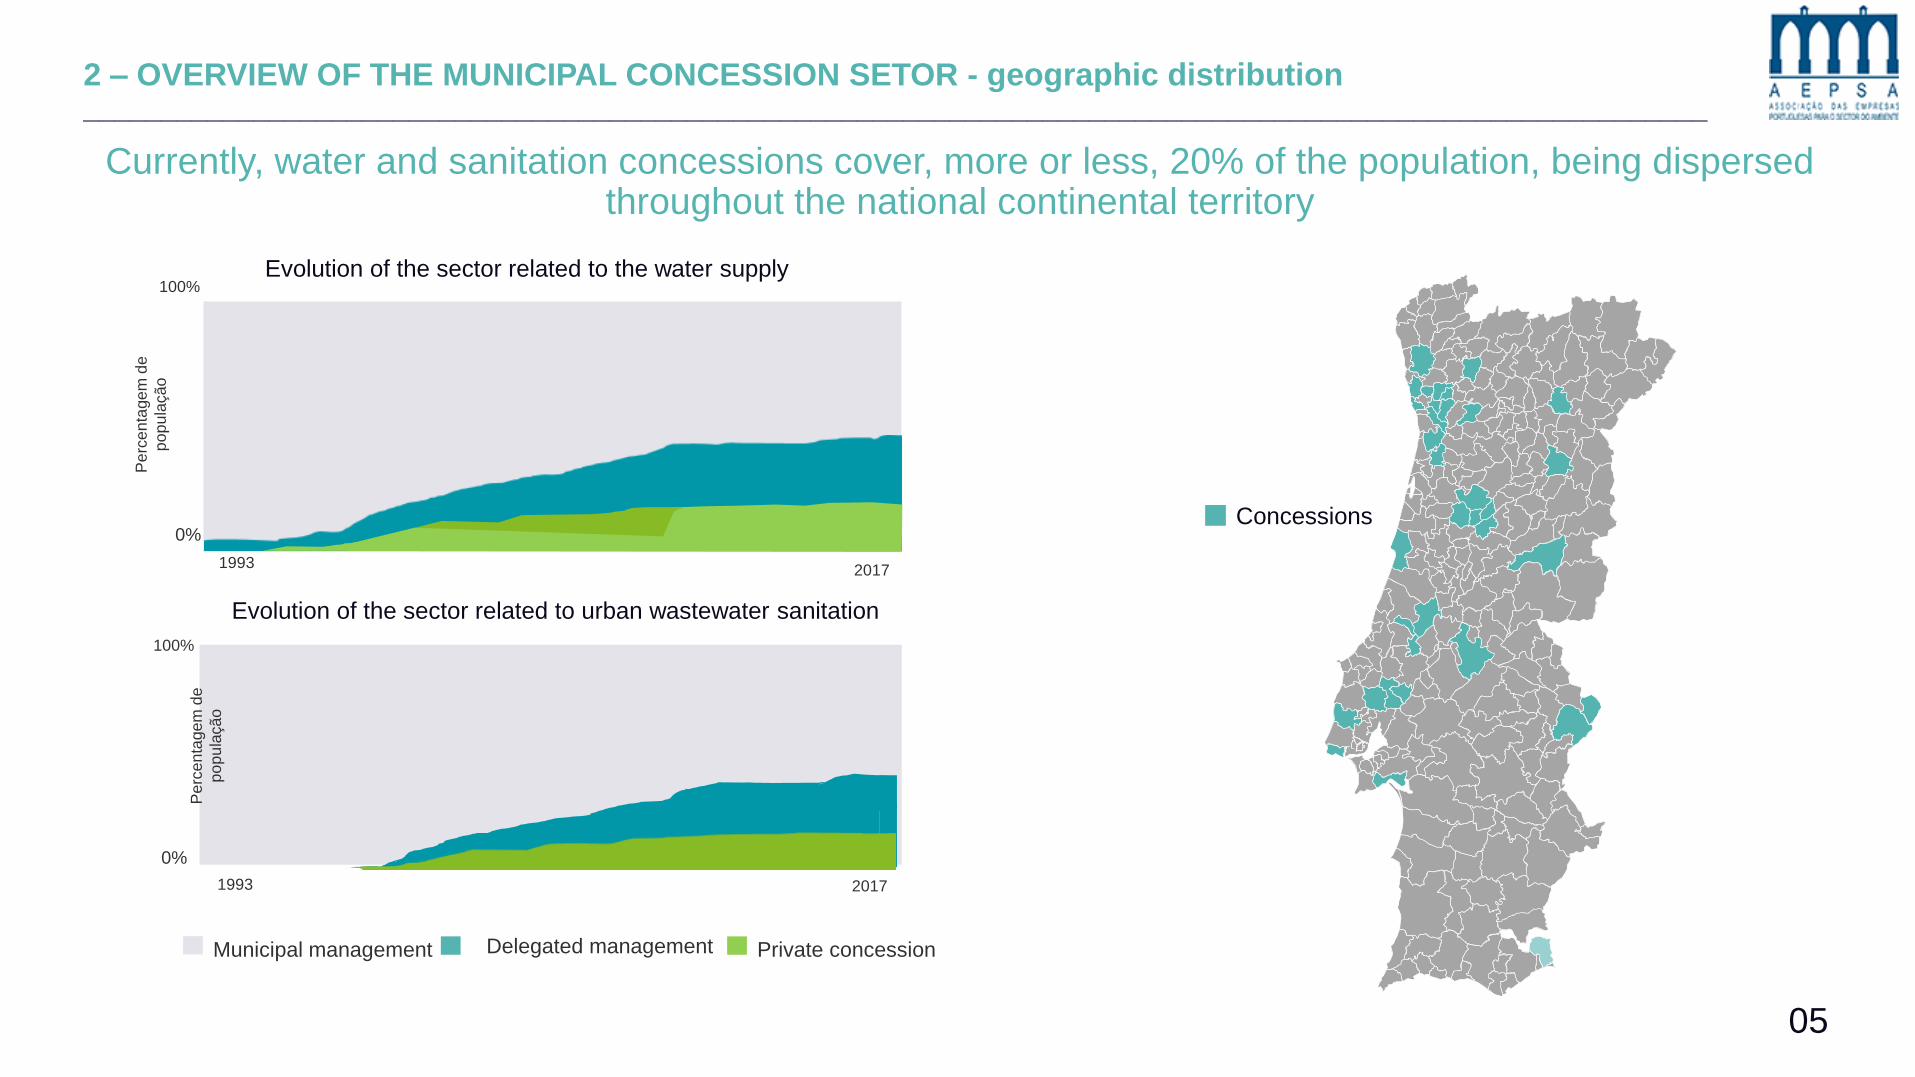
Currently, water and sanitation concessions cover, more or less, 20% of the population, being dispersed throughout the national continental territory
2 – OVERVIEW OF THE MUNICIPAL CONCESSION SETOR - geographic distribution_________________________________________________________________________________________________________
Concessions
Municipal management Delegated management Private concession
Evolution of the sector related to the water supply
Pe
rcen
tagem
de
po
pu
lação
19932017
100%
0%
Pe
rcen
tagem
de
po
pu
lação
1993 2017
0%
Evolution of the sector related to urban wastewater sanitation
100%
05
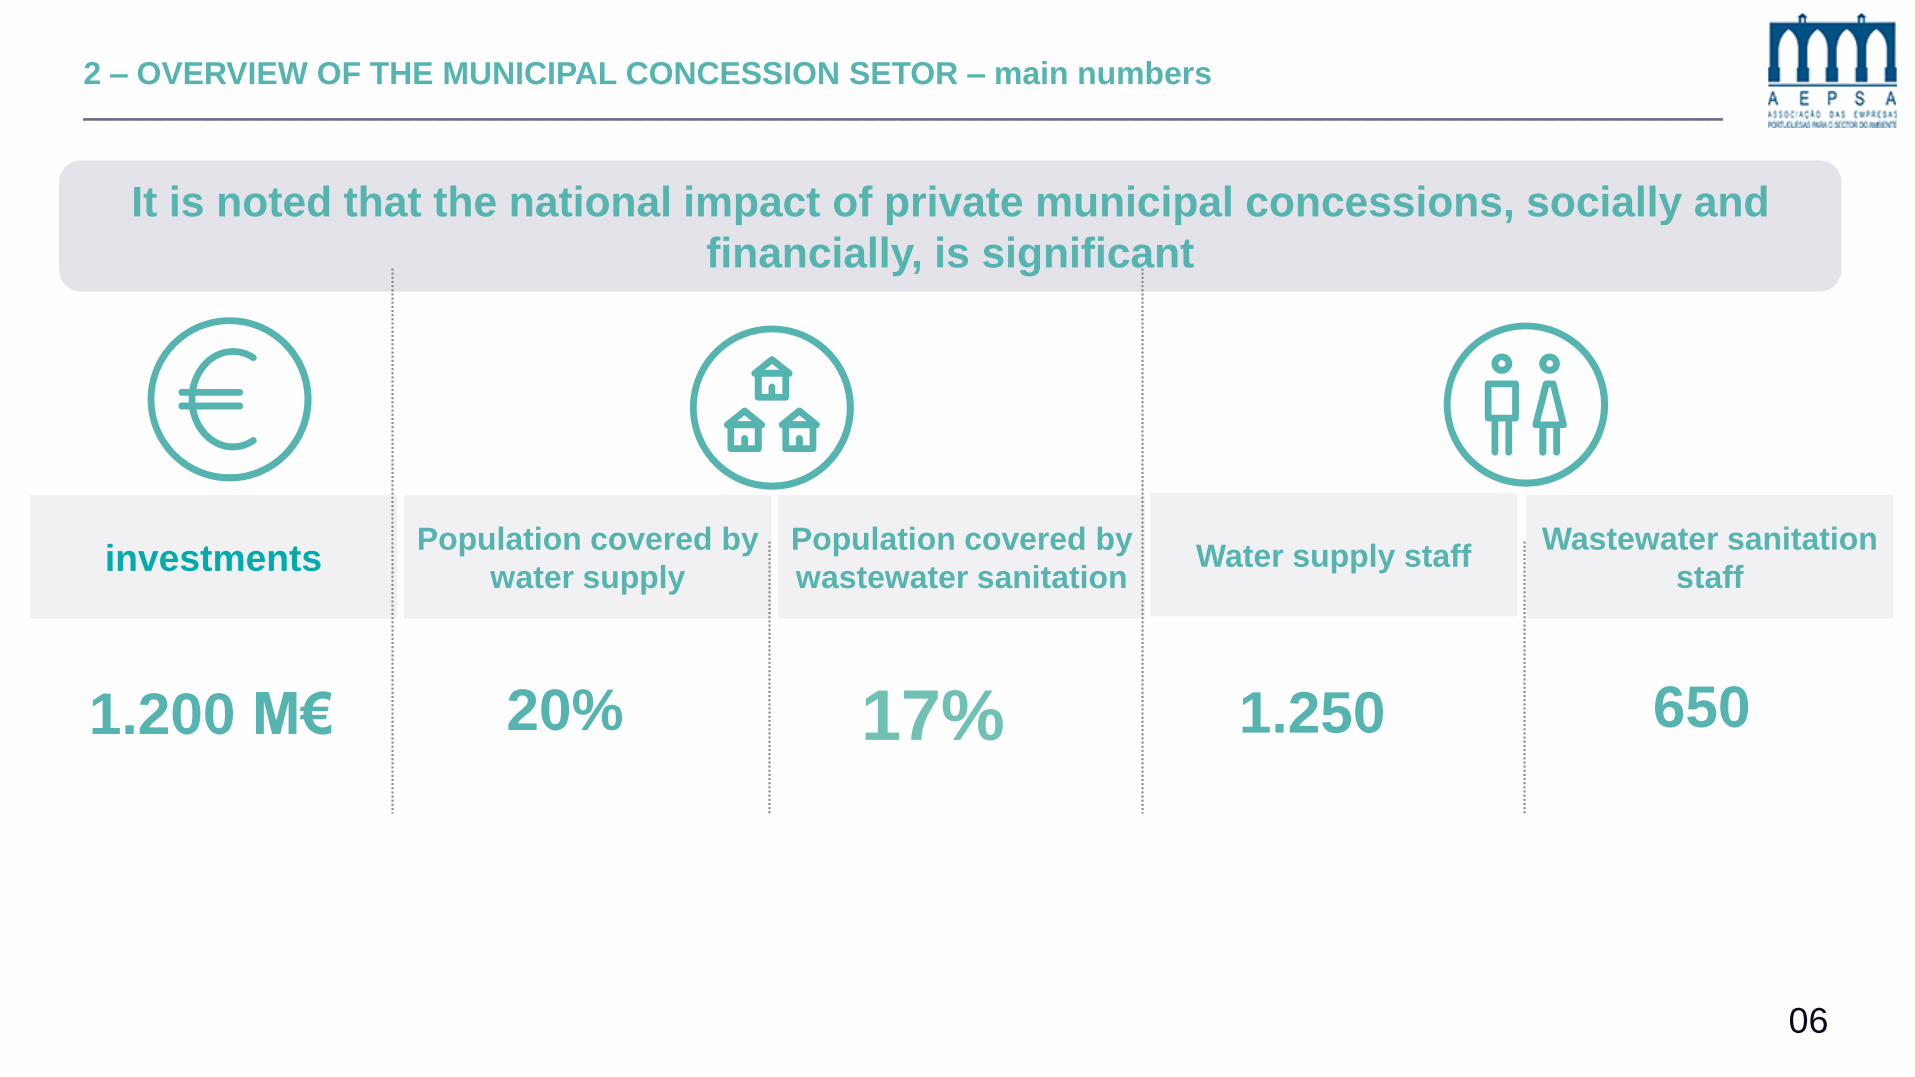
2 – OVERVIEW OF THE MUNICIPAL CONCESSION SETOR – main numbers__________________________________________________________________________________________________________
Wastewater sanitation
staffinvestments
Population covered by
water supply
Population covered by
wastewater sanitationWater supply staff
1.200 M€ 20% 65017% 1.250
It is noted that the national impact of private municipal concessions, socially and
financially, is significant
06

The Concession award procedure follows the provisions of the Public Procurement Code and counts on the involvement of several entities in their different phases
2 – OVERVIEW OF THE MUNICIPAL CONCESSION SETOR – Tenders__________________________________________________________________________________________________________
Deliberation of the
Municipal Assembly -
competent to authorize the
expenses inherent to the
contract to be celebrated
The municipality must take
into account the
recommendations of the
regulator
The decision to
award the
concession of a
municipal
service must be
preceded by a
study that
demonstrates
the financial
viability of the
concession
resulting from
the development
of the activity
through this
management
model
Decision to contractRegulater opinion on
the tenderInternational public
tender
Regulater opinion ondraft contrat
I II III IV
Contrat approval Contrat celebrationOpinion court of
Auditors
V VI VII
The tender bust be under
the provisions of the Public
Procurement Code
In addition to municipal
entities and competitors,
the concession process
also counts on the
participation of ERSAR
and the Court of Auditors
In summary, the tender process is transparent, scrutinized by several entities, attracting many entities, namely foreign
07
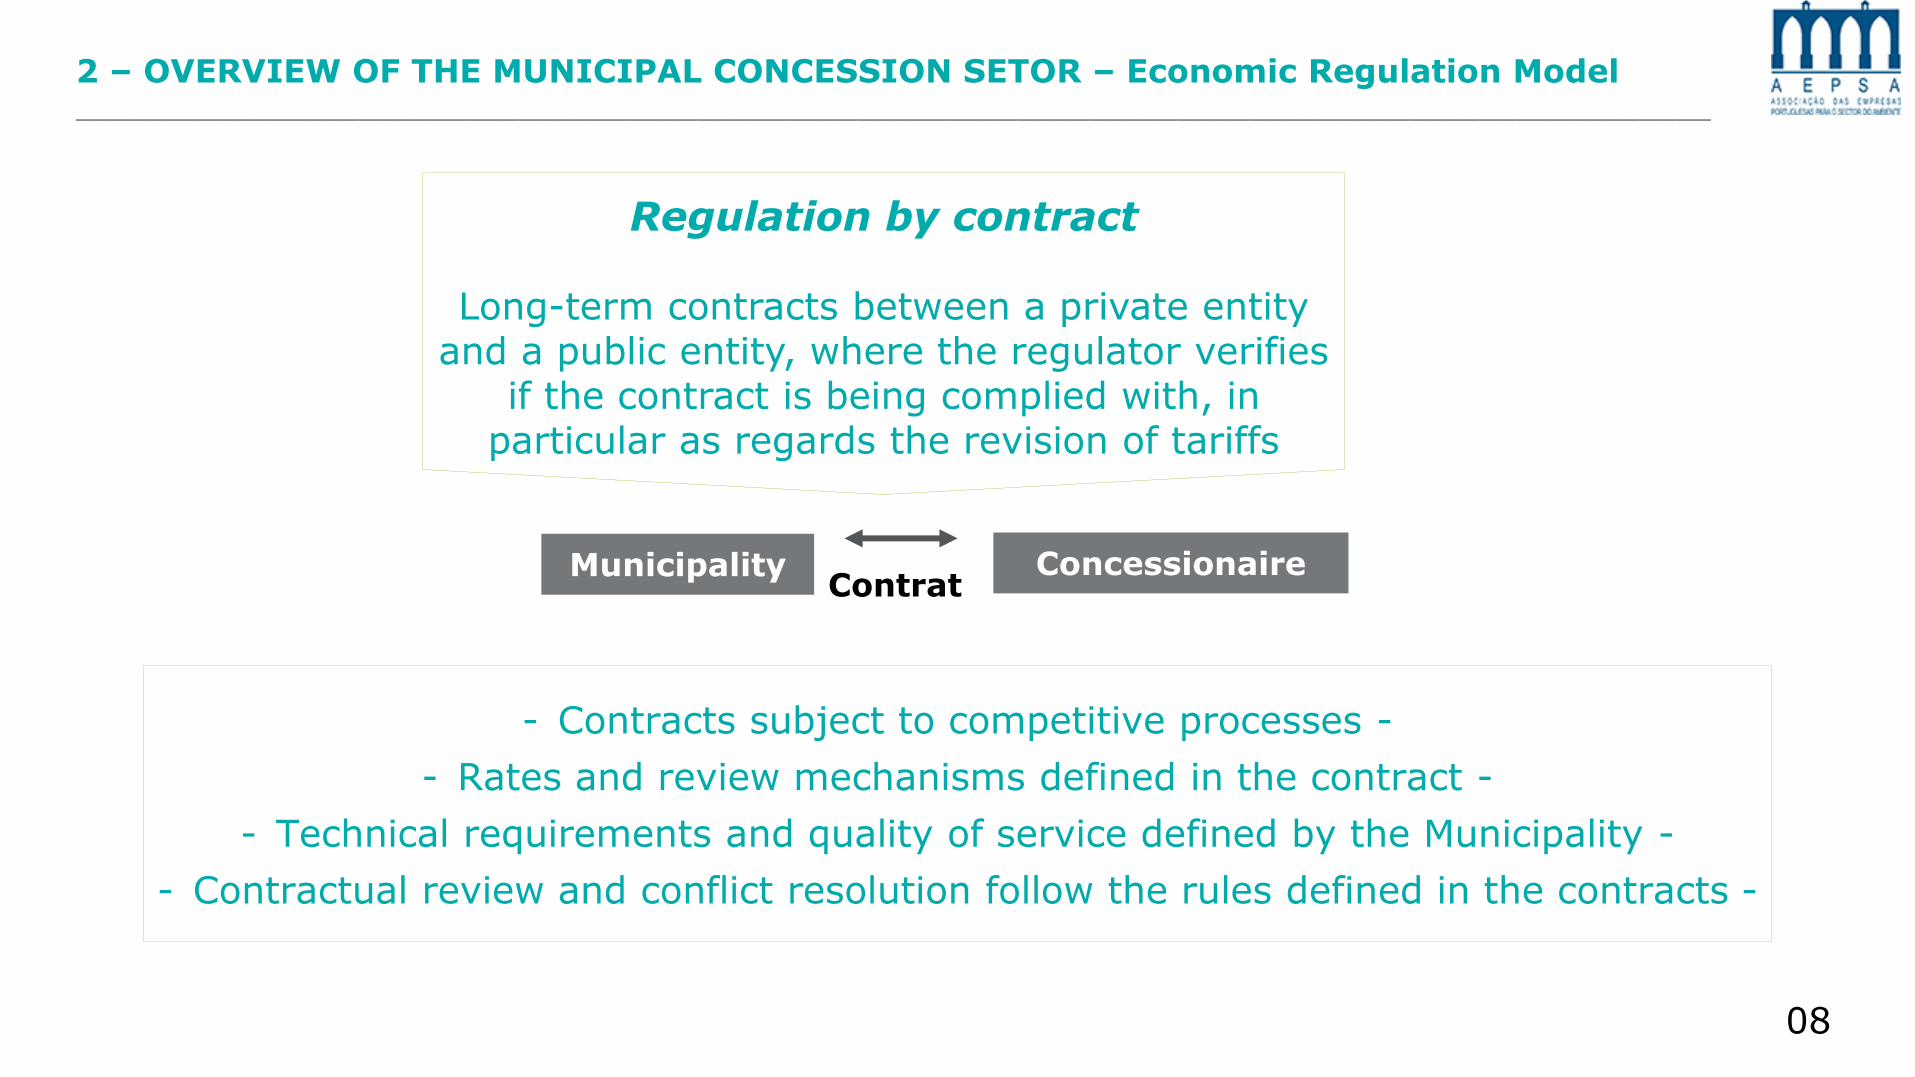
2 – OVERVIEW OF THE MUNICIPAL CONCESSION SETOR – Economic Regulation Model____________________________________________________________________________________________
Regulation by contract
Long-term contracts between a private entity and a public entity, where the regulator verifies
if the contract is being complied with, in particular as regards the revision of tariffs
Municipality ConcessionaireContrat
- Contracts subject to competitive processes -
- Rates and review mechanisms defined in the contract -
- Technical requirements and quality of service defined by the Municipality -
- Contractual review and conflict resolution follow the rules defined in the contracts -
08

The performance of the private sector is positive in relation to the established objectives, presenting values higher than the public sector in most of the categories
2– OVERVIEW OF THE MUNICIPAL CONCESSION SETOR – Concessions Performance___________________________________________________________________________________________
Performance
The private sector performs well in the various quality of service categories,
with emphasis on water quality, wastewater quality, customer service,
service failures and water losses.
The concessions have cost coverage levels above 100%
The economic accessibility of the service in private concessions is
satisfactory
09
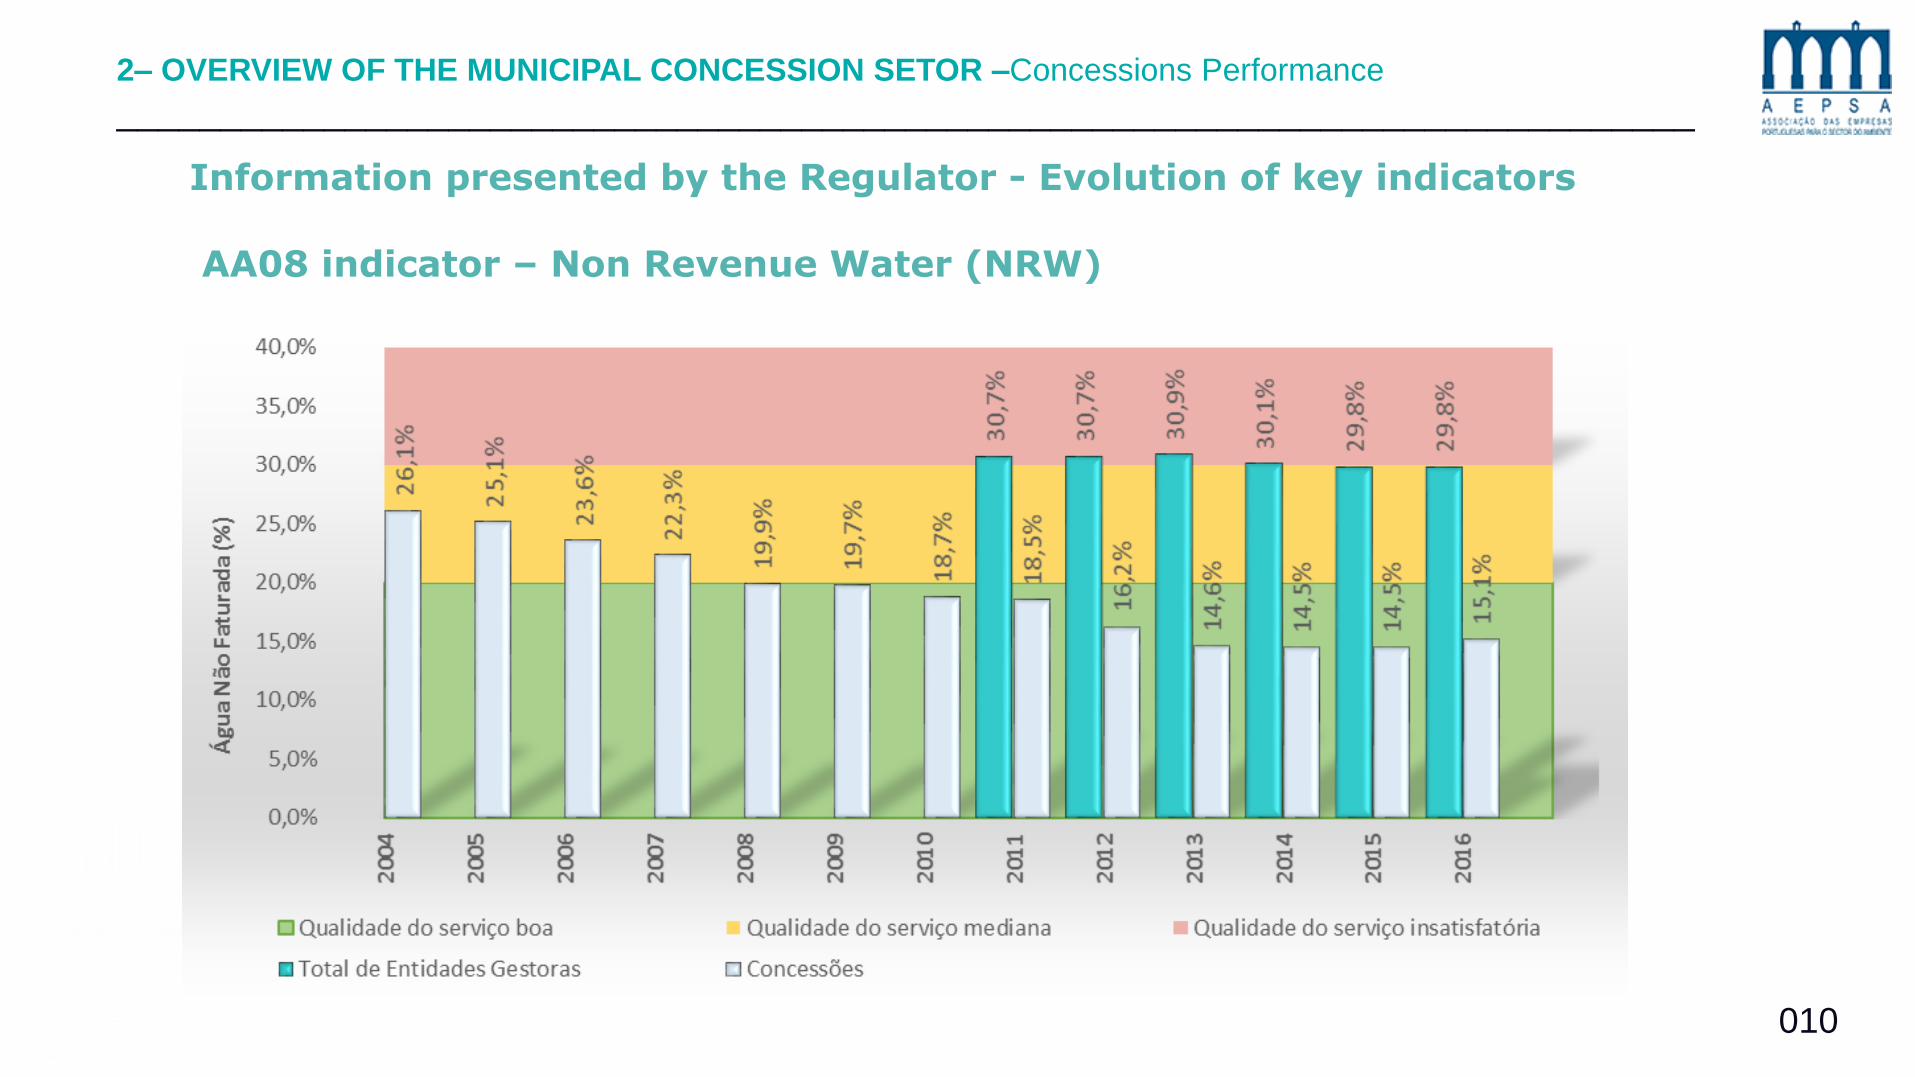
Information presented by the Regulator - Evolution of key indicators
AA08 indicator – Non Revenue Water (NRW)
2– OVERVIEW OF THE MUNICIPAL CONCESSION SETOR –Concessions Performance
____________________________________________________________________________
010

PENSAAR 2020Progress of performance indicators
Public and Private entities
3 – PENSAAR 2020 – Progress of performance indicators – Public and Private entities
____________________________________________________________________
011

Evolution of Wastewater Collection (last 7 years)
Evolution of water supply (last 7 years)
Framework
Considerations on Water Management efficiency
Objectives, scope and methodology
Analysis of indicators for Wastewater Collection. Comparison of performance of public and
private management entities - retail systems (Wastewater Collection)
Analysis of indicators for water services. Comparison of performance of public and
private management entities - retail systems (water supply)
Indicators and other elements that influence the efficiency of systems
ConclusionsOverall performance of public and private entities
Part 3 - PENSAAR 2020 Progress of performance indicators
Parcial Index
012
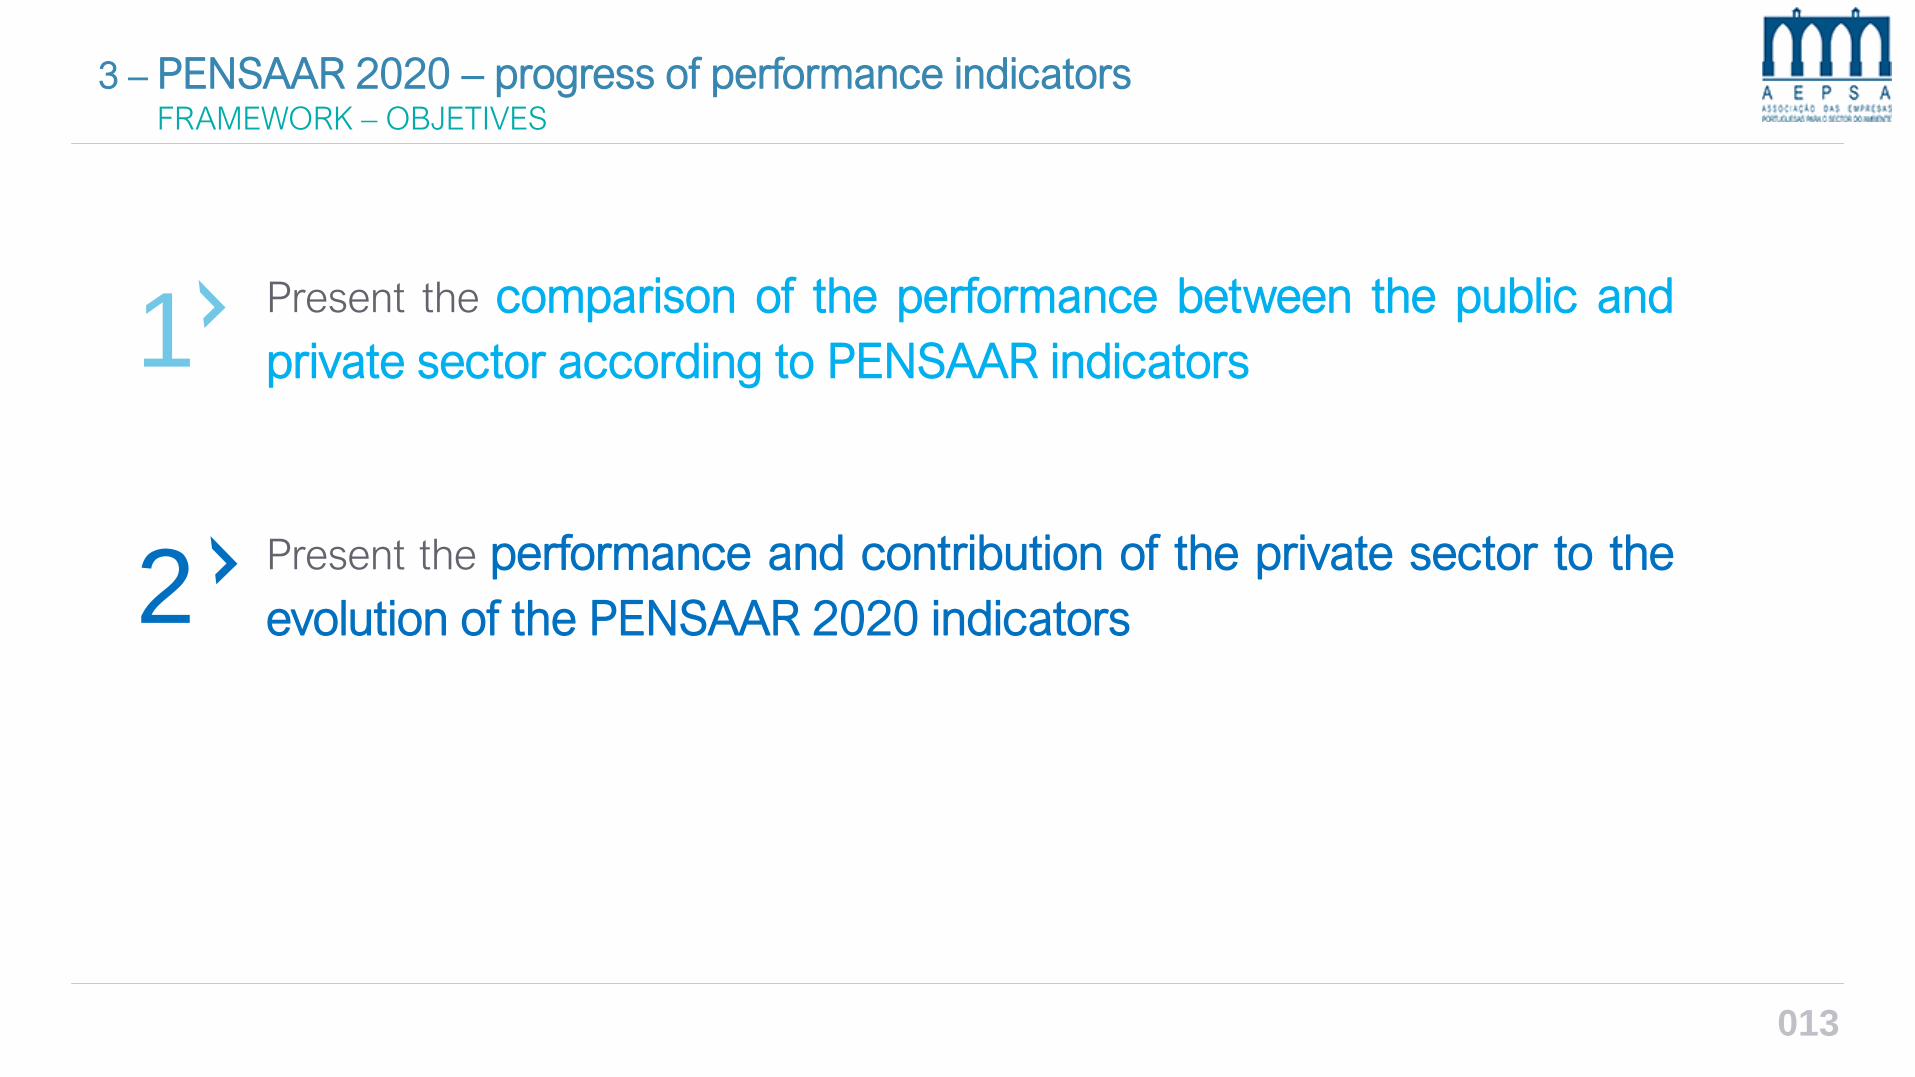
3 – PENSAAR 2020 – progress of performance indicatorsFRAMEWORK – OBJETIVES
1
2Present the performance and contribution of the private sector to the
evolution of the PENSAAR 2020 indicators
Present the comparison of the performance between the public and
private sector according to PENSAAR indicators
013
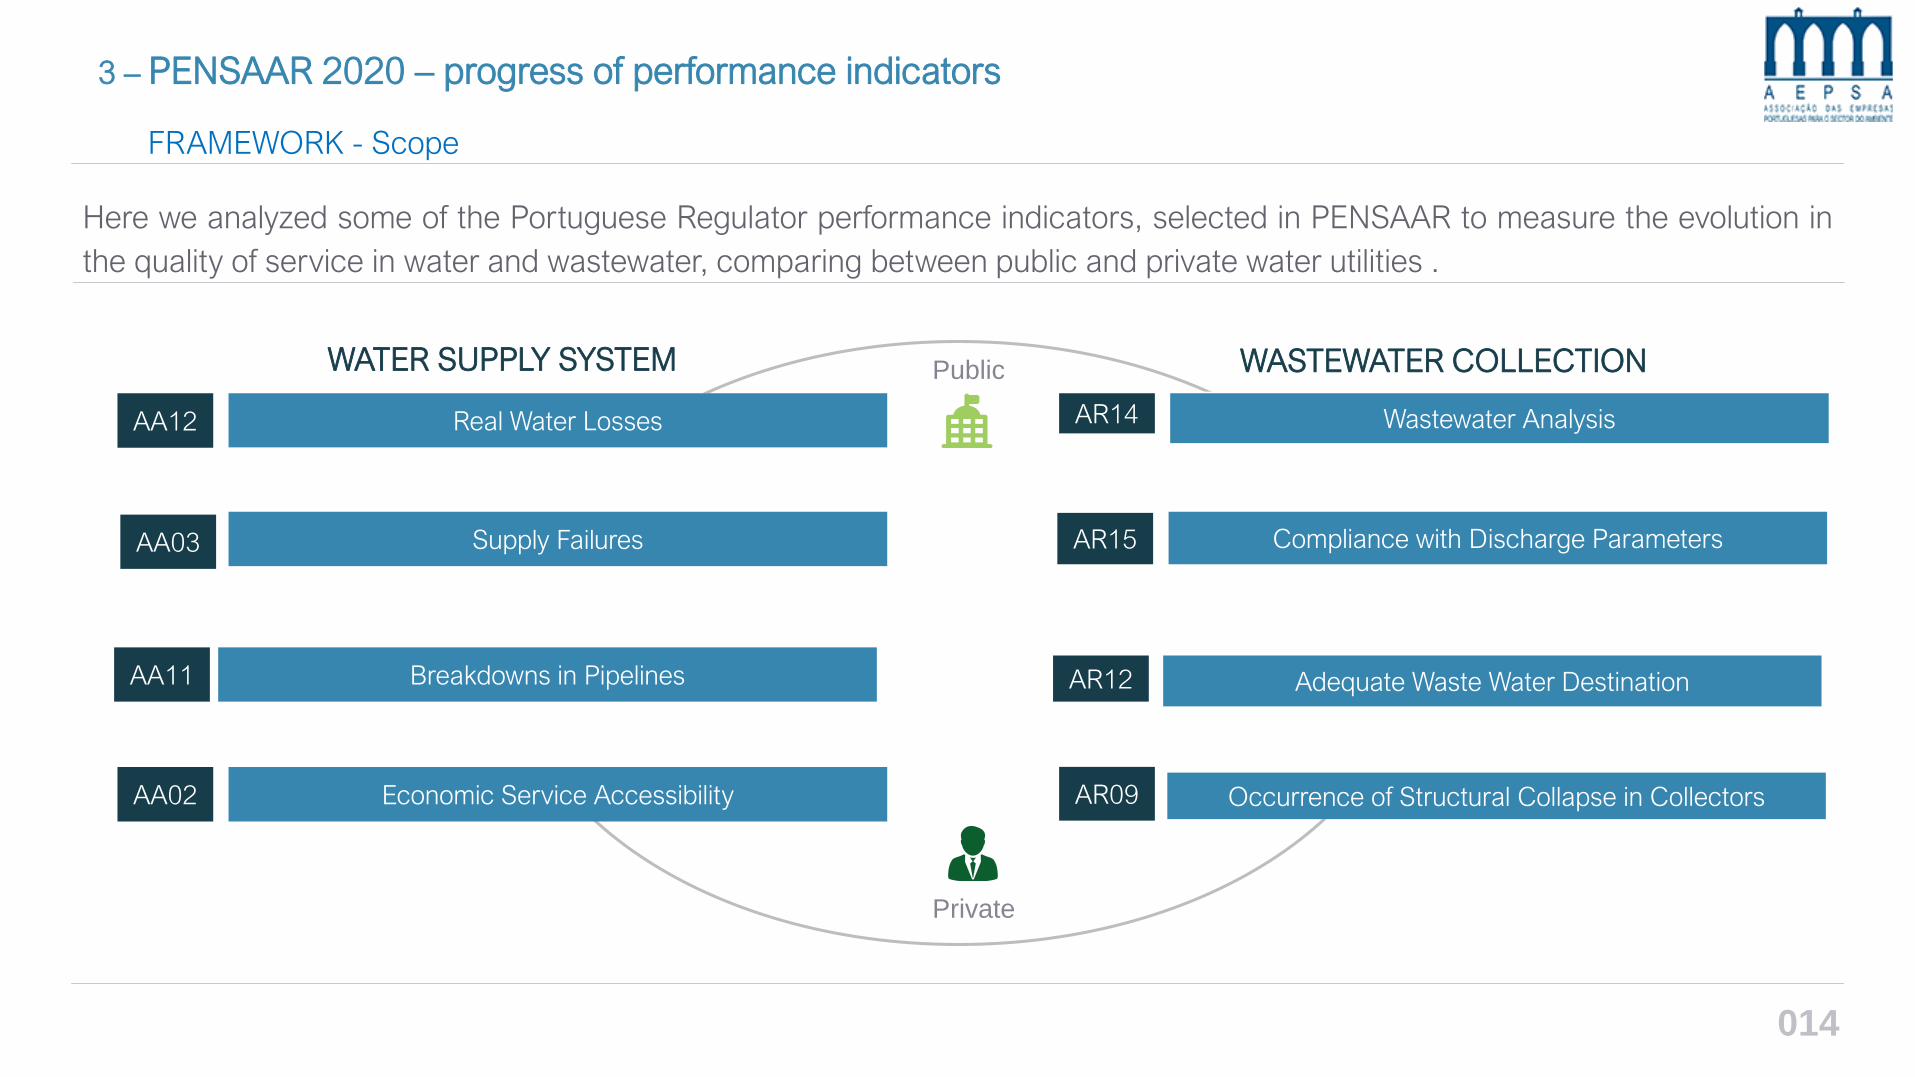
3 – PENSAAR 2020 – progress of performance indicators
FRAMEWORK - Scope
Here we analyzed some of the Portuguese Regulator performance indicators, selected in PENSAAR to measure the evolution in
the quality of service in water and wastewater, comparing between public and private water utilities .
AA12 Real Water Losses
AA03 Supply Failures
AA11 Breakdowns in Pipelines
AA02 Economic Service Accessibility
AR14 Wastewater Analysis
AR15 Compliance with Discharge Parameters
AR12 Adequate Waste Water Destination
AR09 Occurrence of Structural Collapse in Collectors
WATER SUPPLY SYSTEM WASTEWATER COLLECTION Public
Private
014

3 – PENSAAR 2020 – progress of performance indicators
FRAMEWORK - Metodology
Good
Median
Evaluation by management entities
Service quality | ERSAR
Rating by% of households
Evaluation | PENSAAR
Unsatisfactory
Public
Entity
Private
Entity
Unsatisfactory
Evaluation | Internal analysis
Rating by% of households
Satisfactory
Bulk & Retail System ONLY Retail System
FIRST TIER | RASARP indicators SECOND TIER | PENSAAR indicators THIRD TIER | PENSAAR and AEPSA analysis
SC
OP
E O
F T
HIS
PR
ES
EN
TA
TIO
N
Unsatisfactory
Satisfactory
We use the same assumptions considered by the support group responsible for the PENSAAR 2020 evaluation. This rationale allows us to make a direct
comparative study between public and private management. The scope is limited to the retail system excluding bulk water utilities (exclusively public).
015

3 – PENSAAR 2020 – progress of performance indicatorsEVOLUTION OF WATER SUPPLY SYSTEM
46% 51% 53% 67% 61% 62% 62%
2011 2012 2013 2014 2015 2016 2017
Public
Private
Un
satisf
acto
ry E
va
luatio
n
Public Sector
Private Sector 88%
51%
SATISFACTORY EVALUATION
average 2011-2017
~37%
65%
84%
93% 94% 94% 94% 94%
42% 44% 45%
62%
54% 55% 56%
RETAIL SYSTEM
• Regular growth rate over the years with a peak in 2014 to achieve a satisfactory evaluation in 2017 of 62% of
households;
• Private sector with much higher score over the years (37% on average) and above the 2020 target. Public sector
still behind and 24% below 2020 target;
• Private sector contributed to this KPI with 94% of households served by private entities with a satisfactory
evaluation;
• Excluding the contribution of the private sector this KPI would reach a poor rate of 56% of compliance in 2017.
43% 51% 53% 67% 61% 62% 62%
2011 2012 2013 2014 2015 2016 2017
ONLY PRIVATE vs PUBLIC SECTOR(Satisfactory Evaluation only)
AA12 REAL WATER LOSSES% of households covered by Management Entity with a satisfactory valuation
in the real water lossesTARGET
(2020)80%
Source: data from
PENSAAR 3rd report
016

3 – PENSAAR 2020 – progress of performance indicatorsEVOLUTION OF WATER SUPPLY SYSTEM
93%
81%
~12%
Public
Private
71% 76% 88% 88% 90% 92% 94%
2011 2012 2013 2014 2015 2016 2017
73% 81% 82% 80% 83% 86% 90%
2011 2012 2013 2014 2015 2016 2017
76%
94% 97% 95% 97% 97% 96%
72%
79% 79% 77%80%
83%89%
BULK + RETAIL
SYSTEM
Satisfactory Evaluation
average 2011-2017
Public Sector
Private Sector
• The joint assumption in this KPI of bulk + retail raises the level of compliance from to 94%. If exclusively
considered the retail performance satisfaction level would drop 4% to 94% overall;
• Private sector with regular scores, always higher than public sector (13%% on average) and close to
the 2020 target. Public sector with regular growth and getting closer to the target;
• Private sector contribution is of 96% of households covered while public sector contributes with 89%
to the same indicator.
ONLY RETAIL SYSTEM - PRIVATE vs PUBLIC SECTOR(Satisfactory Evaluation only)
AA03 SUPPLY FAILURES% of households covered by Management Entity with satisfactory evaluation
in the occurrence of supply failuresTARGET
(2020)100%
Source: data from
PENSAAR 3rd report
017

3 – PENSAAR 2020 – progress of performance indicatorsEVOLUTION OF WATER SUPPLY SYSTEM in Pipelines
90%
78%
~12%
Public
Private
69% 76% 82% 86% 86% 78% 82%
2011 2012 2013 2014 2015 2016 2017
82% 86% 88% 90% 90% 86% 88%
2011 2012 2013 2014 2015 2016 2017
83%
90% 89%
98% 96%
88% 87%
66%
73%
81%84% 84%
76%80%
BULK + RETAIL
SYSTEM
Satisfactory Evaluation
Average 2011-2017
Public Sector
Private Sector
• Both private and public sector with regular scores, but private always higher than public sector (12%% on
average). Private sector really close to the target (3% down only);
• Regular scores over the years and really close to the 2020 target. Only one down in 2016;
• Excluding bulk, the KPI drops from 88% to 82% compliance;
• For that 82% compliance rate, the private sector contributes with 87% of households covered with a
satisfactory evaluation.
ONLY RETAIL SYSTEM - PRIVATE vs PUBLIC SECTOR(Satisfactory Evaluation only)
AA11 BREAKDOWNS IN PIPELINES% of households covered by Management Entity with satisfactory evaluation
in the occurrence of Breakdowns in PipelinesTARGET
(2020)90%
Source: data from
PENSAAR 3rd report
018

3 – PENSAAR 2020 – progress of performance indicatorsEVOLUTION OF WATER SUPPLY SYSTEM
100%
100%
~0%
PublicPrivate
100% 100% 100% 100% 100% 100% 100%
2011 2012 2013 2014 2015 2016 2017
100% 100% 100% 100% 100% 100% 100%
2011 2012 2013 2014 2015 2016 2017
99%
100% 100% 100% 100% 100% 100% 100%
BULK + RETAIL SYSTEM
Satisfactory Evaluation
Average 2011-2017
Public Sector
Private Sector
• Both private and public with the maximum score of 100% over the years;
ONLY RETAIL SYSTEM - PRIVATE vs PUBLIC SECTOR(Satisfactory Evaluation only)
AA02% of households covered by Management Entity with satisfactory evaluation
of the economic accessibility of the serviceTARGET
(2020)100%ECONOMIC SERVICE ACCESSIBILITY
Source: data from
PENSAAR 3rd report
019
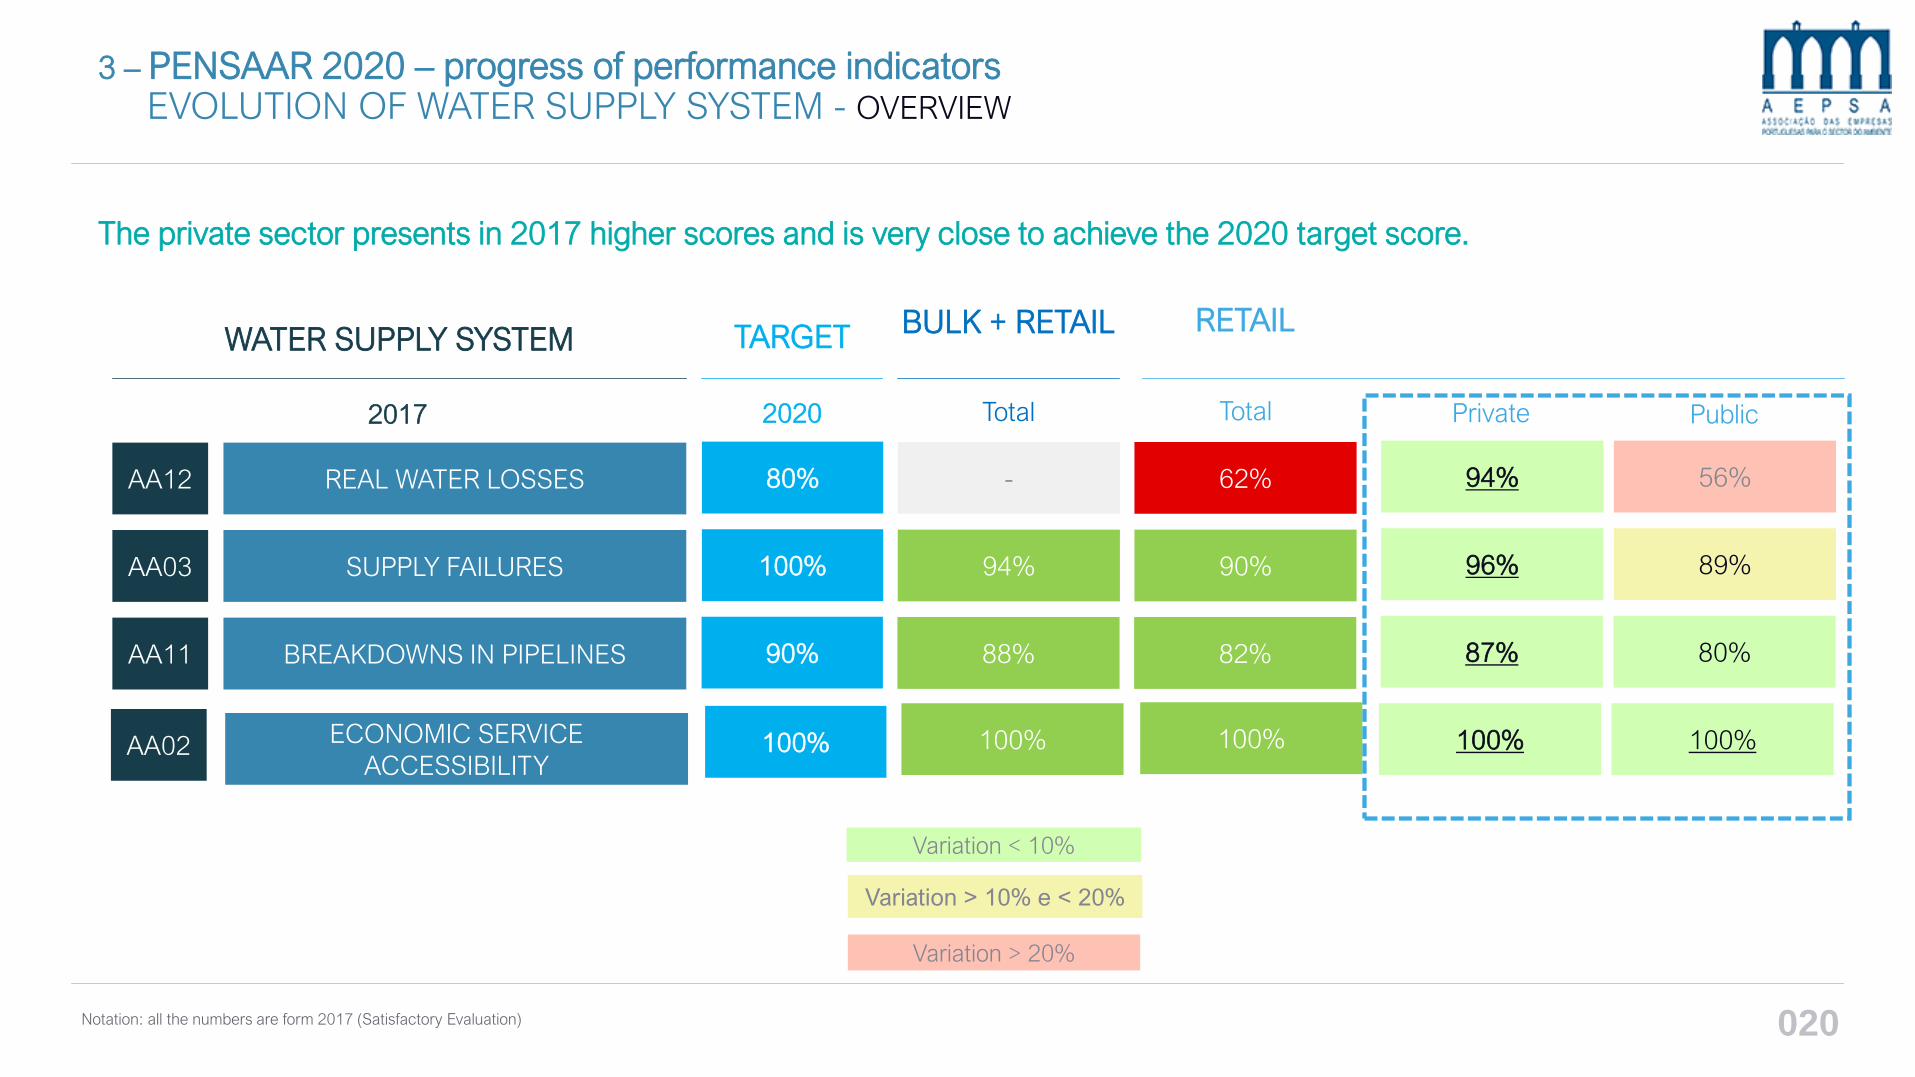
3 – PENSAAR 2020 – progress of performance indicatorsEVOLUTION OF WATER SUPPLY SYSTEM - OVERVIEW
The private sector presents in 2017 higher scores and is very close to achieve the 2020 target score.
AA12 REAL WATER LOSSES
AA03 SUPPLY FAILURES
AA11 BREAKDOWNS IN PIPELINES
AA02 ECONOMIC SERVICE
ACCESSIBILITY
WATER SUPPLY SYSTEM
- 62% 94% 56%
94% 90% 96% 89%
88% 82% 87% 80%
Variation > 20%
100% 100% 100% 100%
BULK + RETAIL RETAIL
80%
100%
90%
100%
TARGET
Notation: all the numbers are form 2017 (Satisfactory Evaluation)
2017 Total Total Private Public
Variation < 10%
2020
Variation > 10% e < 20%
020
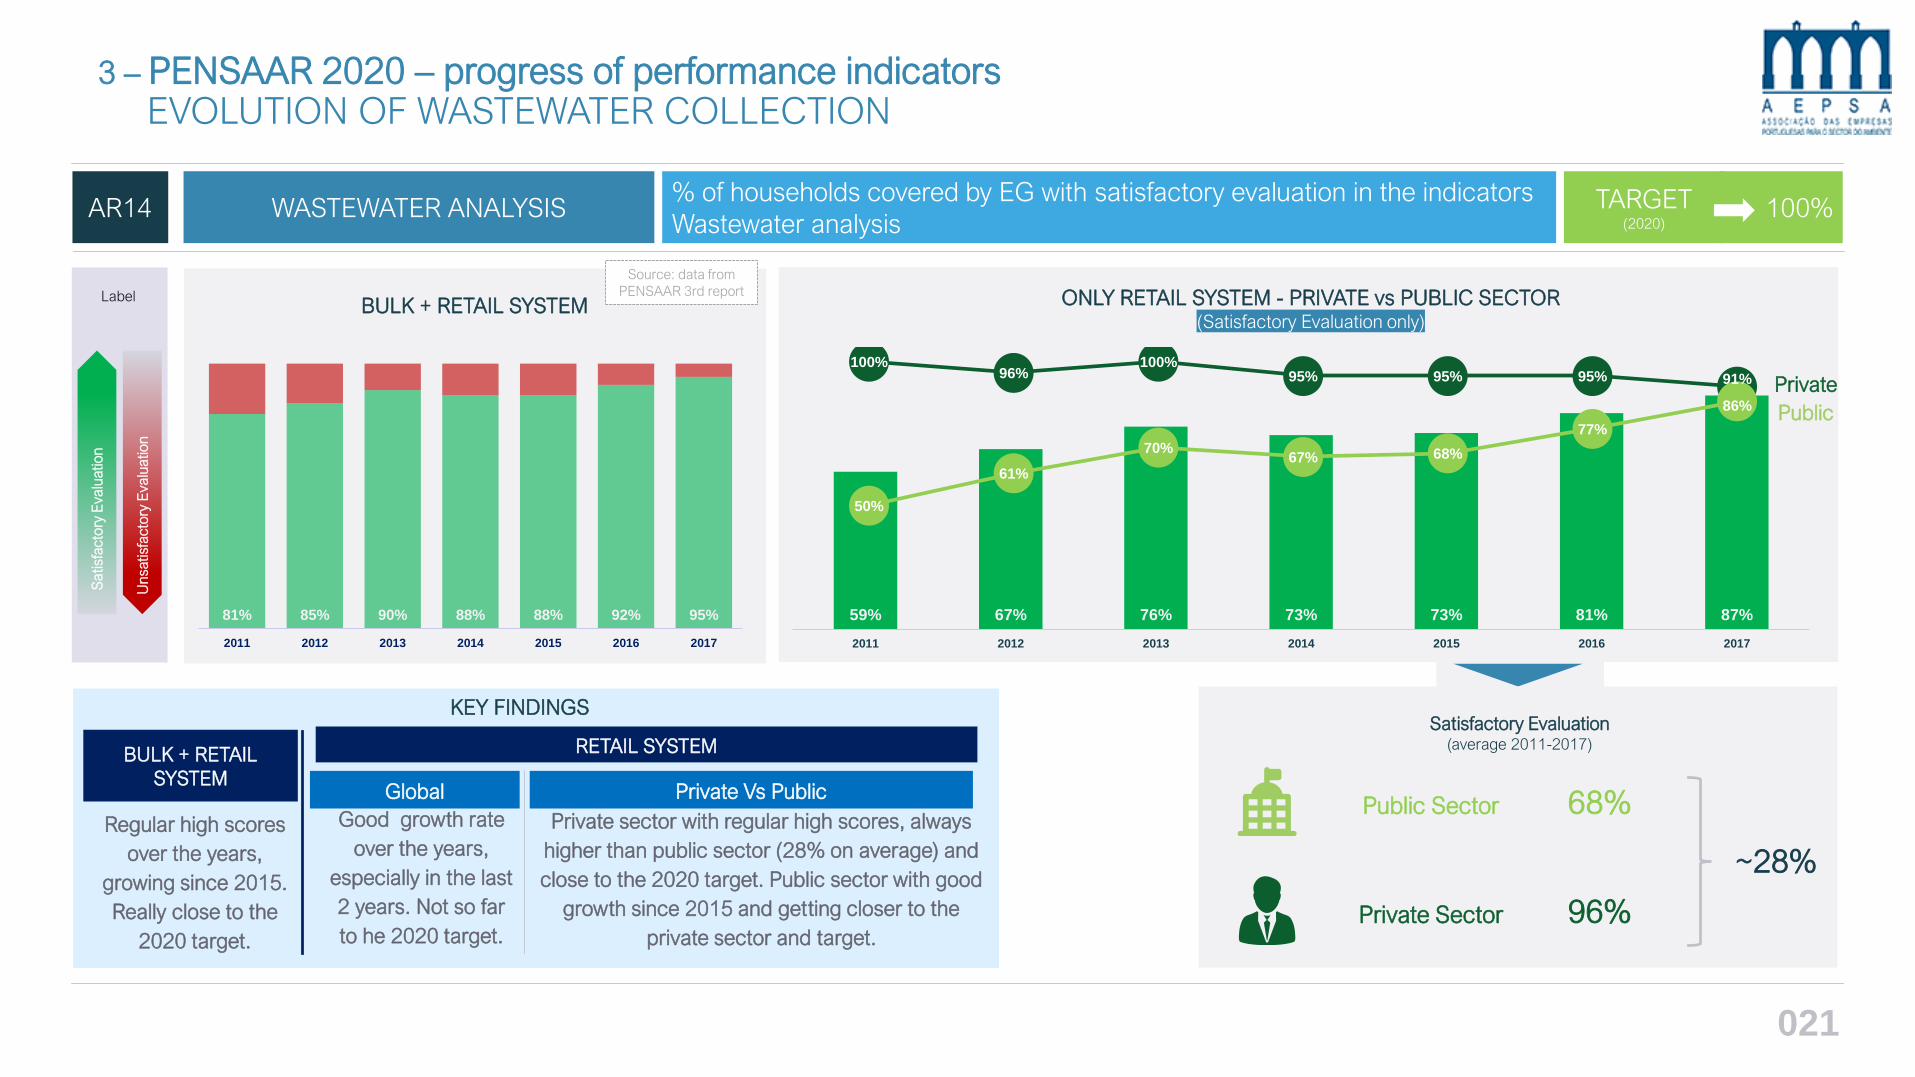
3 – PENSAAR 2020 – progress of performance indicatorsEVOLUTION OF WASTEWATER COLLECTION
AR14 WASTEWATER ANALYSIS% of households covered by EG with satisfactory evaluation in the indicators
Wastewater analysisTARGET
(2020)100%
96%
68%
~28%
Public
Private
59% 67% 76% 73% 73% 81% 87%
2011 2012 2013 2014 2015 2016 2017
81% 85% 90% 88% 88% 92% 95%
2011 2012 2013 2014 2015 2016 2017
Label
Sa
tisf
acto
ry E
va
luatio
n
Un
satisf
acto
ry E
va
luatio
n
BULK + RETAIL SYSTEM
Satisfactory Evaluation(average 2011-2017)
Public Sector
Private Sector
100%96%
100%95% 95% 95% 91%
50%
61%
70%67% 68%
77%
86%
RETAIL SYSTEM
Global Private Vs Public
KEY FINDINGS
BULK + RETAIL
SYSTEM
Regular high scores
over the years,
growing since 2015.
Really close to the
2020 target.
Good growth rate
over the years,
especially in the last
2 years. Not so far
to he 2020 target.
Private sector with regular high scores, always
higher than public sector (28% on average) and
close to the 2020 target. Public sector with good
growth since 2015 and getting closer to the
private sector and target.
Source: data from
PENSAAR 3rd report ONLY RETAIL SYSTEM - PRIVATE vs PUBLIC SECTOR(Satisfactory Evaluation only)
021

3 – PENSAAR 2020 – progress of performance indicatorsEVOLUTION OF WASTEWATER COLLECTION
AR15COMPLIANCE WITH DISCHARGE
PARAMETERS
% of households covered by EG with satisfactory evaluation in compliance
with the discharge parametersTARGET
(2020)80%
67%
26%
~41%
Public
Private
44% 26% 33% 30%
18%
39% 46%
2011 2012 2013 2014 2015 2016 2017
49% 49% 50% 56% 49% 36% 72%
2011 2012 2013 2014 2015 2016 2017
Label
Sa
tisf
acto
ry E
va
luatio
n
Un
satisf
acto
ry E
va
luatio
n
BULK + RETAIL SYSTEM
Satisfactory Evaluation(average 2011-2017)
Public Sector
Private Sector
80%
52%
60%63% 61%
72%77%
36%
21%
27%23%
10%
30%
37%
RETAIL SYSTEM
Global Private Vs Public
KEY FINDINGS
BULK + RETAIL
SYSTEM
Regular scores over
the years a high
growth in 2017,
getting very close to
the 2020 target.
Lower scores than the “bulk +
retail system”. Ups and downs
over the years but growing
since 2015. Still very far from
the 2020 target.
Private sector with much higher score over
the years (41% on average) and very close
to the 2020 target. Public sector with ups
and downs, good growth since 2015 but still
very far form 2020 target.
Source: data from
PENSAAR 3rd report ONLY RETAIL SYSTEM - PRIVATE vs PUBLIC SECTOR(Satisfactory Evaluation only)
022
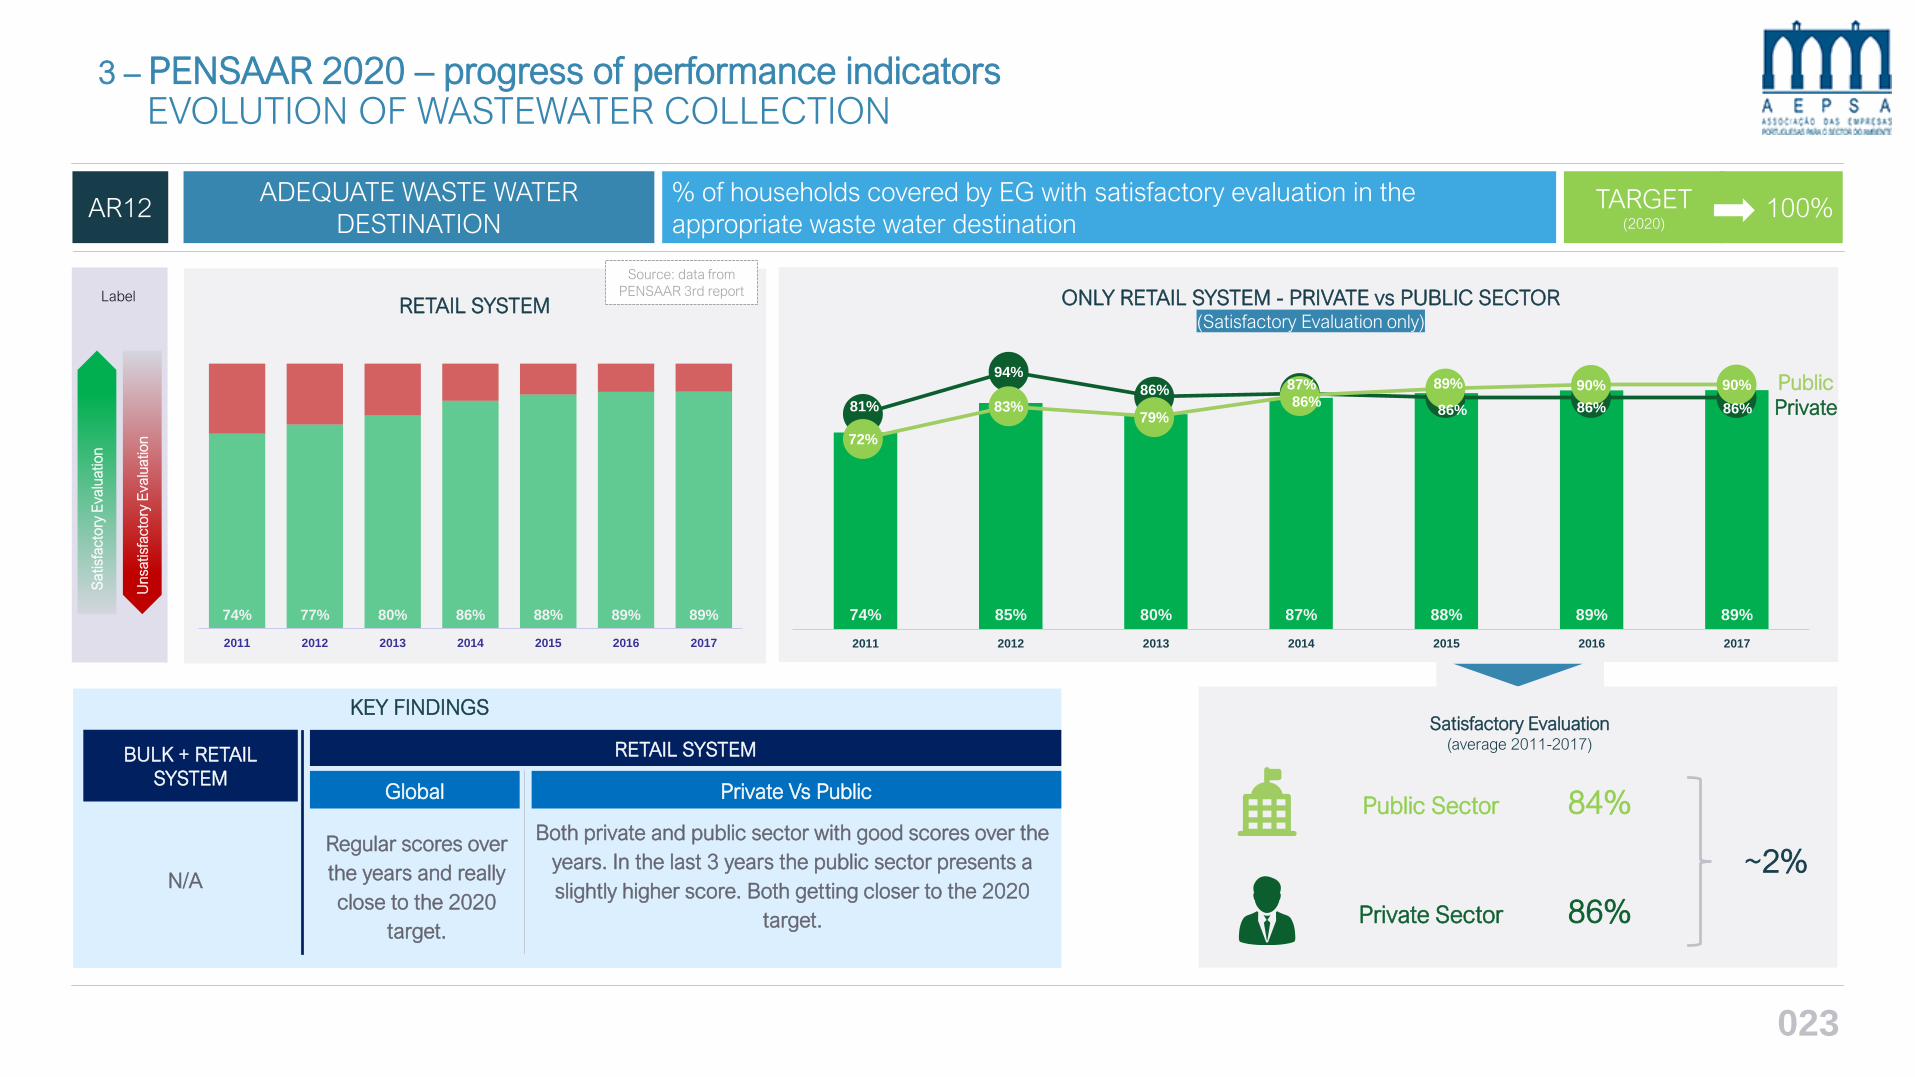
3 – PENSAAR 2020 – progress of performance indicatorsEVOLUTION OF WASTEWATER COLLECTION
AR12ADEQUATE WASTE WATER
DESTINATION
% of households covered by EG with satisfactory evaluation in the
appropriate waste water destinationTARGET
(2020)100%
86%
84%
~2%
Public
Private
74% 85% 80% 87% 88% 89% 89%
2011 2012 2013 2014 2015 2016 2017
Label
Sa
tisf
acto
ry E
va
luatio
n
Un
satisf
acto
ry E
va
luatio
n
RETAIL SYSTEM
Satisfactory Evaluation(average 2011-2017)
Public Sector
Private Sector
RETAIL SYSTEM
Global Private Vs Public
KEY FINDINGS
BULK + RETAIL
SYSTEM
81%
94%
86% 87%
86% 86% 86%
72%
83%79%
86%
89% 90% 90%
Regular scores over
the years and really
close to the 2020
target.
Both private and public sector with good scores over the
years. In the last 3 years the public sector presents a
slightly higher score. Both getting closer to the 2020
target.
N/A
74% 77% 80% 86% 88% 89% 89%
2011 2012 2013 2014 2015 2016 2017
Source: data from
PENSAAR 3rd report ONLY RETAIL SYSTEM - PRIVATE vs PUBLIC SECTOR(Satisfactory Evaluation only)
023

3 – PENSAAR 2020 – progress of performance indicatorsEVOLUTION OF WASTEWATER COLLECTION
AR09OCCURRENCE OF STRUCTURAL
COLLAPSE IN COLLECTORS% of households covered by EG with satisfactory evaluation in Occurrence of structural
collapses in collectorsTARGET
(2020)80%
91%
63%
~28%
Public
Private
61% 64% 68% 64% 75% 72% 69%
2011 2012 2013 2014 2015 2016 2017
61% 64% 66% 63% 82% 50% 73%
2011 2012 2013 2014 2015 2016 2017
Label
Sa
tisf
acto
ry E
va
luatio
n
Un
satisf
acto
ry E
va
luatio
n
BULK + RETAIL SYSTEM
Satisfactory Evaluation(average 2011-2017)
Public Sector
Private Sector
87%92% 92% 91% 90% 89%
93%
57% 59%64%
59%
72%69%
64%
RETAIL SYSTEM
Global Private Vs Public
KEY FINDINGS
BULK + RETAIL
SYSTEM
Regular scores over
the years. A big
down in 2016 but a
good recovery in
2017. Very close to
the 2020 target.
Regular scores over the
years, although in the
last 2 years the score
has been decreasing.
Not so far from the 2020
target.
Private sector with much higher score over the years
(28% on average) and above the 2020 target. Public
sector with ups and downs, decreasing since 2015.
Not so far from the 2020 target.
Source: data from
PENSAAR 3rd report ONLY RETAIL SYSTEM - PRIVATE vs PUBLIC SECTOR(Satisfactory Evaluation only)
024

3 – PENSAAR 2020 – progress of performance indicatorsEVOLUTION OF WASTEWATER COLLECTION - OVERVIEW
AR14 Wastewater Analysis
AR15 Compliance with Discharge Parameters
AR12 Adequate Waste Water Destination
AR09Occurrence of Structural Collapse in
Collectors
WASTEWATER COLLECTION
95% 87% 91% 86%
72% 46% 77% 37%
- 89% 86% 90%
73% 93% 64%
100%
80%
100%
80%
TARGET
2017 Total Total
69%
2020
Variation > 20%
BULK + RETAIL RETAIL
Notation: all the numbers are form 2017 (Satisfactory Evaluation)
Private Public
Variation < 10%
Variation > 10% e < 20%
The private sector presents in 2017 higher scores and is very close to achieve the 2020 target score.
025

3 – PENSAAR 2020 – progress of performance indicatorsCONSIDERATIONS ON WATER MANAGEMENT EFFICIENCY
There are indicators that usually are considered critical to achieve the efficiency of NRW, but when we analyze the reality, we find
that some of them don’t really have a direct impact on this specific KPI. It is clear that the element which has a bigger influence
on the NRW performance is the Management Model.
01ONE
02TWO
DIMENSIONGEOGRAPHIC
LOCATION
THERE IS NO RELATIONSHIP BETWEEN
DIMENSION AND PERFORMANCE IN
TERMS OF NRW
THE GEOGRAPHICAL LOCATION OF THE
ENTITIES DOES NOT AFFECT THEIR
PERFORMANCE
NRW/Km (m3/(Km.year))
03THREE
MANAGEMENT
MODEL
Partnership State
/ municipality
Municipal or
intermunicip
al companyState-owned
company
Multi-
municipal
concession
Private
Municipal
Concession
Service Connection KM
Municipal
services
Municipalize
d services
1 198
4 662
7 141
2 476
1 826
2 504
3 085
33
254
101
69
58
81
81
THE MUNICIPAL CONCESSION MODEL IS
THE ONE WITH THE BEST
PERFORMANCE
NRW/Service Connection
(m3/(Service Connection .year))
NR
W (
m3
/Se
rvic
eC
on
ne
ctio
n)
Households with effective service
026
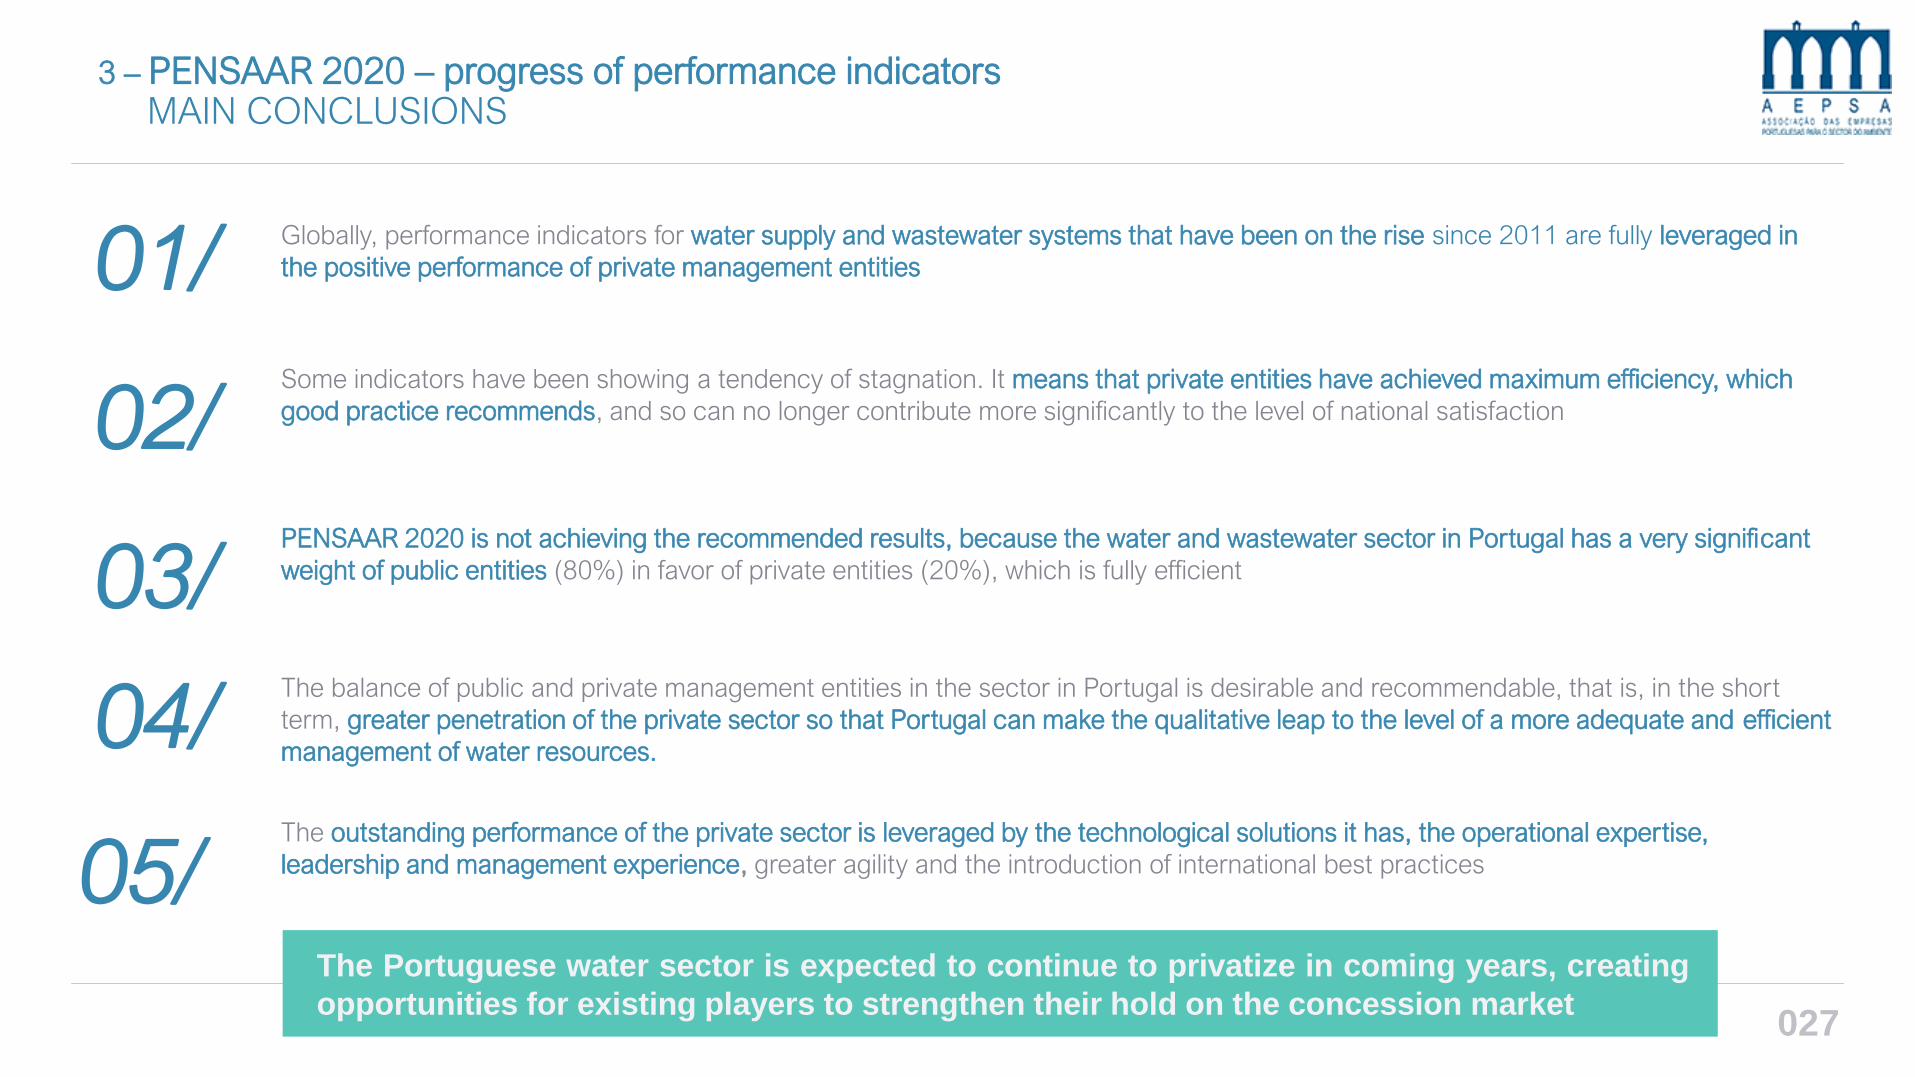
3 – PENSAAR 2020 – progress of performance indicatorsMAIN CONCLUSIONS
Globally, performance indicators for water supply and wastewater systems that have been on the rise since 2011 are fully leveraged in
the positive performance of private management entities01/
02/
03/
05/
04/The balance of public and private management entities in the sector in Portugal is desirable and recommendable, that is, in the short
term, greater penetration of the private sector so that Portugal can make the qualitative leap to the level of a more adequate and efficient
management of water resources.
Some indicators have been showing a tendency of stagnation. It means that private entities have achieved maximum efficiency, which
good practice recommends, and so can no longer contribute more significantly to the level of national satisfaction
PENSAAR 2020 is not achieving the recommended results, because the water and wastewater sector in Portugal has a very significant
weight of public entities (80%) in favor of private entities (20%), which is fully efficient
The outstanding performance of the private sector is leveraged by the technological solutions it has, the operational expertise,
leadership and management experience, greater agility and the introduction of international best practices
The Portuguese water sector is expected to continue to privatize in coming years, creating
opportunities for existing players to strengthen their hold on the concession market027
For more information,
please contact AEPSAAv. do Brasil, nº 101, Codigo Postal: 1700-066 Lisboa
Phone: +351 21 844 30 50
E-mail: [email protected]
THANK YOU!
Related Documents