An AMCOW Country Status Overview Water Supply and Sanitation in Mozambique Turning Finance into Services for 2015 and Beyond

Welcome message from author
This document is posted to help you gain knowledge. Please leave a comment to let me know what you think about it! Share it to your friends and learn new things together.
Transcript
For enquiries, contact:Water and Sanitation Program–Africa RegionThe World Bank, Upper Hill RoadP.O. Box 30577, 00100, Nairobi, KenyaTel: +(254) 20 322 6300 E-mail: [email protected] site: www.wsp.org
An AMCOW Country Status Overview
Water Supply and Sanitation in MozambiqueTurning Finance into Services for 2015 and Beyond
The first round of Country Status Overviews (CSO1) published in 2006 benchmarked the preparedness of sectors of 16 countries in Africa to meet the WSS MDGs based on their medium-term spending plans and a set of ‘success factors’ selected from regional experience. Combined with a process of national stakeholder consultation, this prompted countries to ask whether they had those ‘success factors’ in place and, if not, whether they should put them in place.
The second round of Country Status Overviews (CSO2) has built on both the method and the process developed in CSO1. The ‘success factors’ have been supplemented with additional factors drawn from country and regional analysis to develop the CSO2 scorecard. Together these reflect the essential steps, functions and results in translating finance into services through government systems—in line with Paris Principles for aid effectiveness. The data and summary assessments have been drawn from local data sources and compared with internationally reported data, and, wherever possible, the assessments have been subject to broad-based consultations with lead government agencies and country sector stakeholders, including donor institutions.
This second set of 32 Country Status Overviews (CSO2) on water supply and sanitation was commissioned by the African Ministers’ Council on Water (AMCOW). Development of the CSO2 was led by the World Bank administered Water and Sanitation Program (WSP) in collaboration with the African Development Bank (AfDB), the United Nations Children’s Fund (UNICEF), the World Bank and the World Health Organization (WHO).
This report was produced in collaboration with the Government of Mozambique and other stakeholders during 2009/10. Some sources cited may be informal documents that are not readily available.
The findings, interpretations, and conclusions expressed in this volume do not necessarily reflect the views of the collaborating institutions, their Executive Directors, or the governments they represent. The collaborating institutions do not guarantee the accuracy of the data included in this work. The boundaries, colors, denominations, and other information shown on any map in this work do not imply any judgment on the part of the collaborating institutions concerning the legal status of any territory or the endorsement or acceptance of such boundaries.
The material in this publication is copyrighted. Requests for permission to reproduce portions of it should be sent to [email protected]. The collaborating institutions encourage the dissemination of this work and will normally grant permission promptly. For more information, please visit www.amcow.net or www.wsp.org
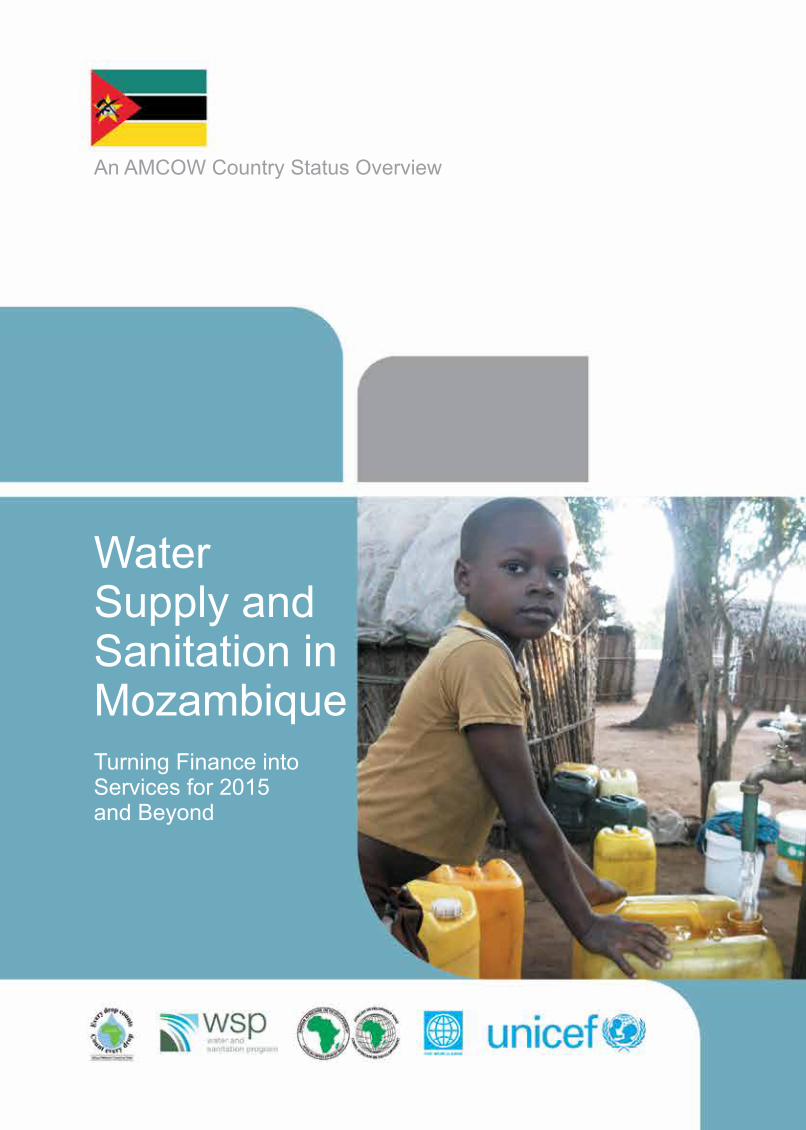
Photograph credits: Joseph Narkevic Cover photograph by Luis Macario
© 2011 Water and Sanitation Program
1
Water Supply and Sanitation in MozambiqueTurning Finance into Services for 2015 and Beyond
An AMCOW Country Status Overview
2
Strategic Overview
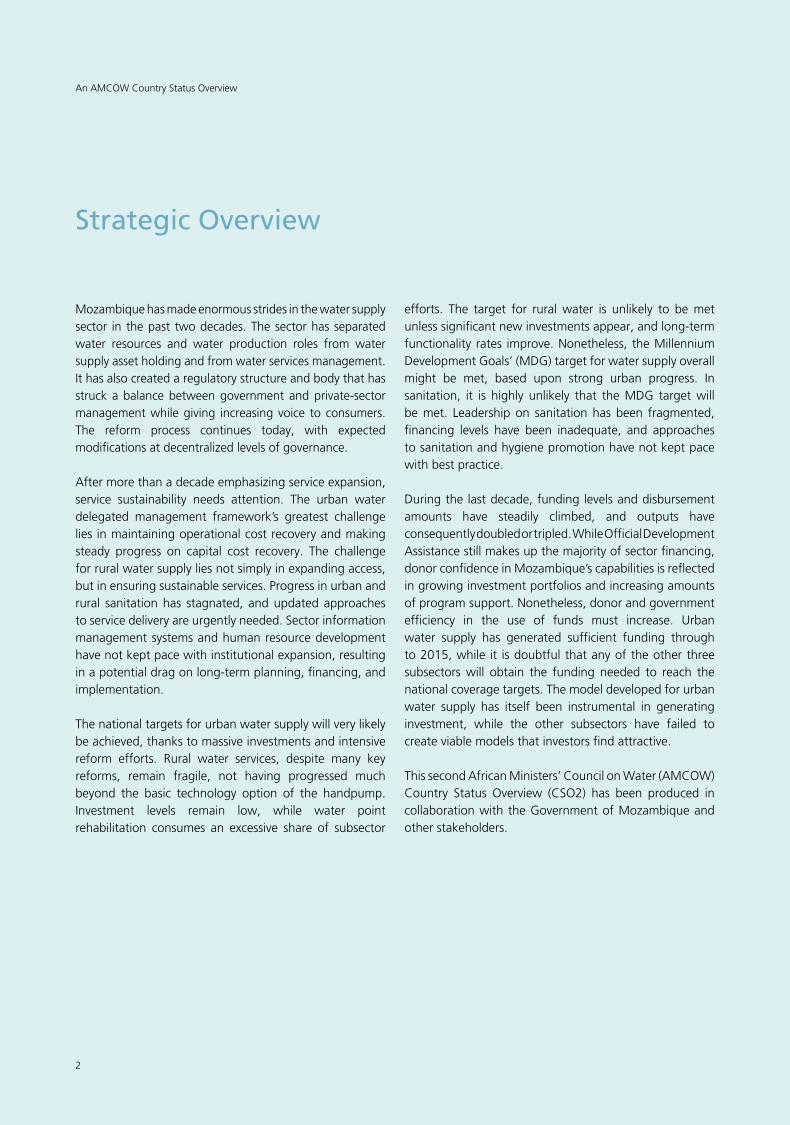
Mozambique has made enormous strides in the water supply sector in the past two decades. The sector has separated water resources and water production roles from water supply asset holding and from water services management. It has also created a regulatory structure and body that has struck a balance between government and private-sector management while giving increasing voice to consumers. The reform process continues today, with expected modifications at decentralized levels of governance.
After more than a decade emphasizing service expansion, service sustainability needs attention. The urban water delegated management framework’s greatest challenge lies in maintaining operational cost recovery and making steady progress on capital cost recovery. The challenge for rural water supply lies not simply in expanding access, but in ensuring sustainable services. Progress in urban and rural sanitation has stagnated, and updated approaches to service delivery are urgently needed. Sector information management systems and human resource development have not kept pace with institutional expansion, resulting in a potential drag on long-term planning, financing, and implementation.
The national targets for urban water supply will very likely be achieved, thanks to massive investments and intensive reform efforts. Rural water services, despite many key reforms, remain fragile, not having progressed much beyond the basic technology option of the handpump. Investment levels remain low, while water point rehabilitation consumes an excessive share of subsector
efforts. The target for rural water is unlikely to be met unless significant new investments appear, and long-term functionality rates improve. Nonetheless, the Millennium Development Goals’ (MDG) target for water supply overall might be met, based upon strong urban progress. In sanitation, it is highly unlikely that the MDG target will be met. Leadership on sanitation has been fragmented, financing levels have been inadequate, and approaches to sanitation and hygiene promotion have not kept pace with best practice.
During the last decade, funding levels and disbursement amounts have steadily climbed, and outputs have consequently doubled or tripled. While Official Development Assistance still makes up the majority of sector financing, donor confidence in Mozambique’s capabilities is reflected in growing investment portfolios and increasing amounts of program support. Nonetheless, donor and government efficiency in the use of funds must increase. Urban water supply has generated sufficient funding through to 2015, while it is doubtful that any of the other three subsectors will obtain the funding needed to reach the national coverage targets. The model developed for urban water supply has itself been instrumental in generating investment, while the other subsectors have failed to create viable models that investors find attractive.
This second African Ministers’ Council on Water (AMCOW) Country Status Overview (CSO2) has been produced in collaboration with the Government of Mozambique and other stakeholders.
An AMCOW Country Status Overview
2
3
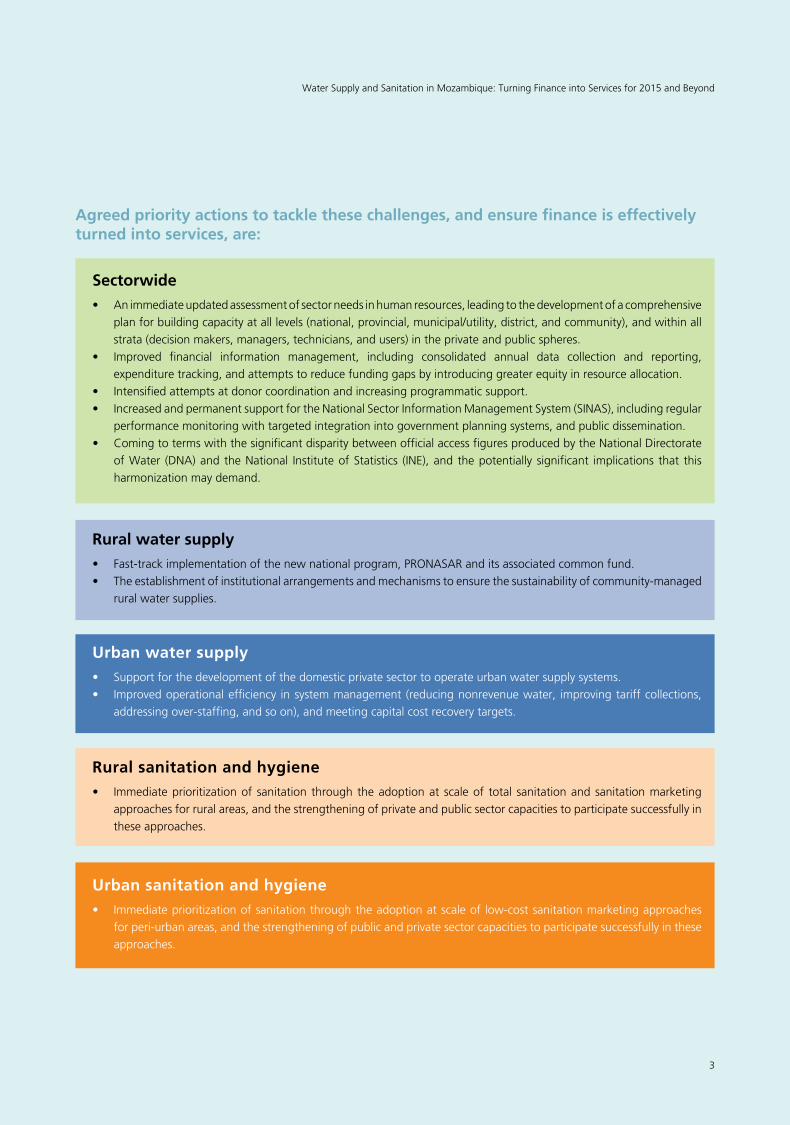
Rural water supply• Fast-trackimplementationofthenewnationalprogram,PRONASARanditsassociatedcommonfund.• Theestablishmentofinstitutionalarrangementsandmechanismstoensurethesustainabilityofcommunity-managed
rural water supplies.
Urban water supply• Supportforthedevelopmentofthedomesticprivatesectortooperateurbanwatersupplysystems.• Improvedoperationalefficiency insystemmanagement(reducingnonrevenuewater, improvingtariffcollections,
addressing over-staffing, and so on), and meeting capital cost recovery targets.
Urban sanitation and hygiene• Immediateprioritizationofsanitationthroughtheadoptionatscaleof low-costsanitationmarketingapproaches
for peri-urban areas, and the strengthening of public and private sector capacities to participate successfully in these approaches.
Rural sanitation and hygiene• Immediateprioritizationof sanitation through theadoptionat scaleof total sanitationandsanitationmarketing
approaches for rural areas, and the strengthening of private and public sector capacities to participate successfully in these approaches.
WaterSupplyandSanitationinMozambique:TurningFinanceintoServicesfor2015andBeyond
3
Sectorwide• Animmediateupdatedassessmentofsectorneedsinhumanresources,leadingtothedevelopmentofacomprehensive
plan for building capacity at all levels (national, provincial, municipal/utility, district, and community), and within all strata (decision makers, managers, technicians, and users) in the private and public spheres.
• Improved financial information management, including consolidated annual data collection and reporting,expenditure tracking, and attempts to reduce funding gaps by introducing greater equity in resource allocation.
• Intensifiedattemptsatdonorcoordinationandincreasingprogrammaticsupport.• IncreasedandpermanentsupportfortheNationalSectorInformationManagementSystem(SINAS),includingregular
performance monitoring with targeted integration into government planning systems, and public dissemination.• ComingtotermswiththesignificantdisparitybetweenofficialaccessfiguresproducedbytheNationalDirectorate
of Water (DNA) and the National Institute of Statistics (INE), and the potentially significant implications that this harmonization may demand.
Agreed priority actions to tackle these challenges, and ensure finance is effectively turned into services, are:
4
5
Acronyms and Abbreviations ........................................................................................................................... 6
1. Introduction .................................................................................................................................................... 7
2. SectorOverview:CoverageandFinanceTrends ............................................................................................... 8
3. Reform Context: Introducing the CSO2 Scorecard ......................................................................................... 12
4. InstitutionalFramework ................................................................................................................................ 14
5. FinancinganditsImplementation .................................................................................................................. 17
6. Sector Monitoring and Evaluation ................................................................................................................. 20
7. Subsector: Rural Water Supply ...................................................................................................................... 22
8. Subsector: Urban Water Supply ..................................................................................................................... 25
9. Subsector: Rural Sanitation and Hygiene ....................................................................................................... 28
10. Subsector: Urban Sanitation and Hygiene ...................................................................................................... 30
Notes and References ................................................................................................................................... 32
Contents
6
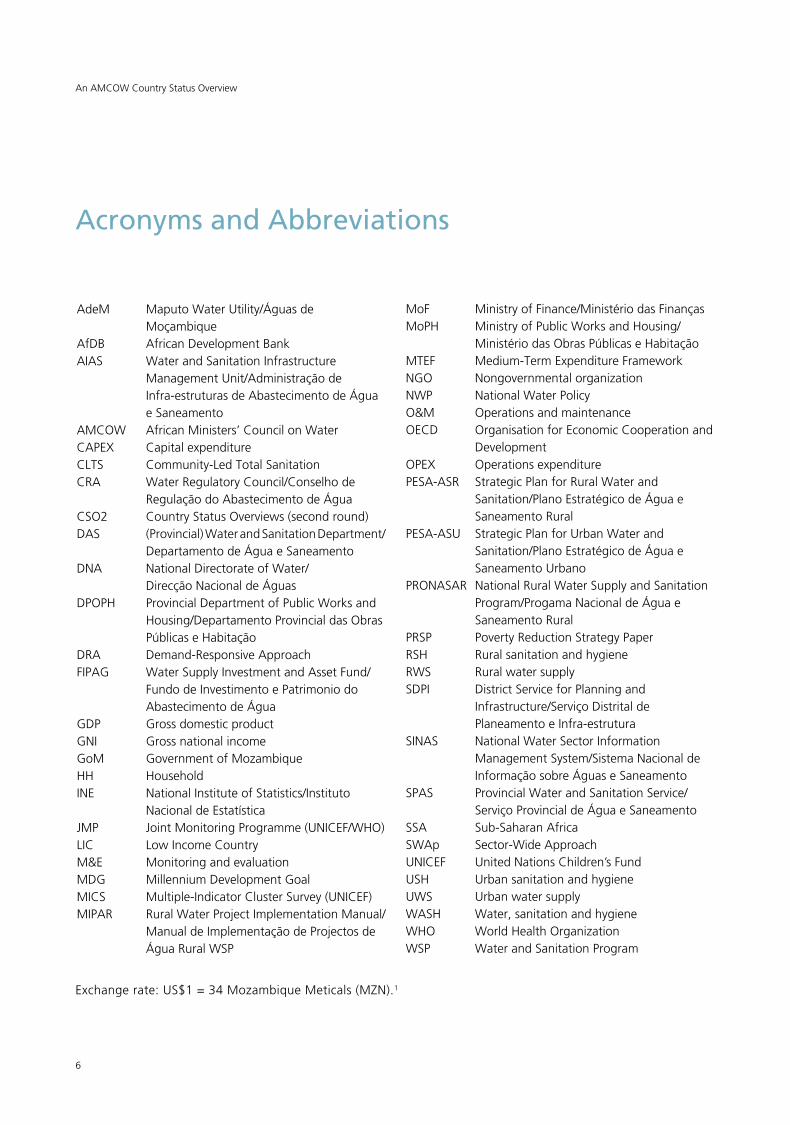
Acronyms and Abbreviations
AdeM Maputo Water Utility/Águas de Moçambique
AfDB AfricanDevelopmentBankAIAS Water and Sanitation Infrastructure
Management Unit/Administração de Infra-estruturas de Abastecimento de Água e Saneamento
AMCOW African Ministers’ Council on WaterCAPEX Capital expenditureCLTS Community-Led Total SanitationCRA Water Regulatory Council/Conselho de
Regulação do Abastecimento de ÁguaCSO2 Country Status Overviews (second round)DAS (Provincial) Water and Sanitation Department/
Departamento de Água e SaneamentoDNA National Directorate of Water/
Direcção Nacional de ÁguasDPOPH Provincial Department of Public Works and
Housing/Departamento Provincial das Obras Públicas e Habitação
DRA Demand-Responsive ApproachFIPAG WaterSupplyInvestmentandAssetFund/
FundodeInvestimentoePatrimoniodoAbastecimento de Água
GDP Gross domestic productGNI Gross national incomeGoM Government of MozambiqueHH HouseholdINE National Institute of Statistics/Instituto
Nacional de EstatísticaJMP JointMonitoringProgramme(UNICEF/WHO)LIC Low Income CountryM&E Monitoring and evaluationMDG Millennium Development GoalMICS Multiple-IndicatorClusterSurvey(UNICEF)MIPAR Rural Water Project Implementation Manual/
Manual de Implementação de Projectos de Água Rural WSP
MoF MinistryofFinance/MinistériodasFinançasMoPH Ministry of Public Works and Housing/
MinistériodasObrasPúblicaseHabitaçãoMTEF Medium-TermExpenditureFrameworkNGO Nongovernmental organizationNWP National Water PolicyO&M Operations and maintenanceOECD Organisation for Economic Cooperation and
DevelopmentOPEX Operations expenditurePESA-ASR Strategic Plan for Rural Water and
Sanitation/PlanoEstratégicodeÁguaeSaneamento Rural
PESA-ASU Strategic Plan for Urban Water and Sanitation/PlanoEstratégicodeÁguaeSaneamento Urbano
PRONASAR National Rural Water Supply and Sanitation Program/Progama Nacional de Água e Saneamento Rural
PRSP Poverty Reduction Strategy PaperRSH Rural sanitation and hygieneRWS Rural water supplySDPI District Service for Planning and
Infrastructure/Serviço Distrital de Planeamento e Infra-estrutura
SINAS National Water Sector Information Management System/Sistema Nacional de Informação sobre Águas e Saneamento
SPAS Provincial Water and Sanitation Service/Serviço Provincial de Água e Saneamento
SSA Sub-Saharan AfricaSWAp Sector-Wide ApproachUNICEF UnitedNationsChildren’sFundUSH Urban sanitation and hygieneUWS Urban water supplyWASH Water, sanitation and hygieneWHO World Health OrganizationWSP Water and Sanitation Program
Exchange rate: US$1 = 34 Mozambique Meticals (MZN).1
An AMCOW Country Status Overview
7
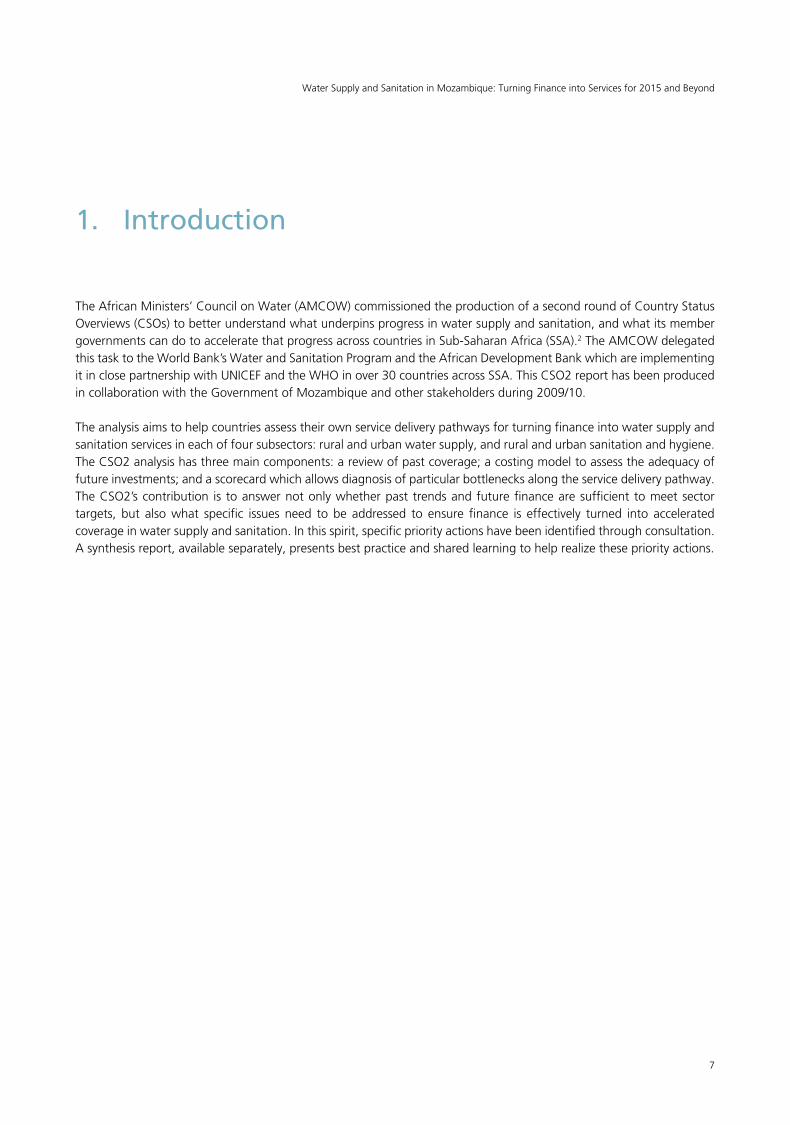
1. Introduction
The African Ministers’ Council on Water (AMCOW) commissioned the production of a second round of Country Status Overviews (CSOs) to better understand what underpins progress in water supply and sanitation, and what its member governments can do to accelerate that progress across countries in Sub-Saharan Africa (SSA).2 The AMCOW delegated thistasktotheWorldBank’sWaterandSanitationProgramandtheAfricanDevelopmentBankwhichareimplementingitinclosepartnershipwithUNICEFandtheWHOinover30countriesacrossSSA.ThisCSO2reporthasbeenproducedin collaboration with the Government of Mozambique and other stakeholders during 2009/10.
The analysis aims to help countries assess their own service delivery pathways for turning finance into water supply and sanitation services in each of four subsectors: rural and urban water supply, and rural and urban sanitation and hygiene. The CSO2 analysis has three main components: a review of past coverage; a costing model to assess the adequacy of future investments; and a scorecard which allows diagnosis of particular bottlenecks along the service delivery pathway. The CSO2’s contribution is to answer not only whether past trends and future finance are sufficient to meet sector targets, but also what specific issues need to be addressed to ensure finance is effectively turned into accelerated coverage in water supply and sanitation. In this spirit, specific priority actions have been identified through consultation. A synthesis report, available separately, presents best practice and shared learning to help realize these priority actions.
WaterSupplyandSanitationinMozambique:TurningFinanceintoServicesfor2015andBeyond
8
2. Sector Overview: Coverage and Finance Trends
Coverage: Assessing Past Progress
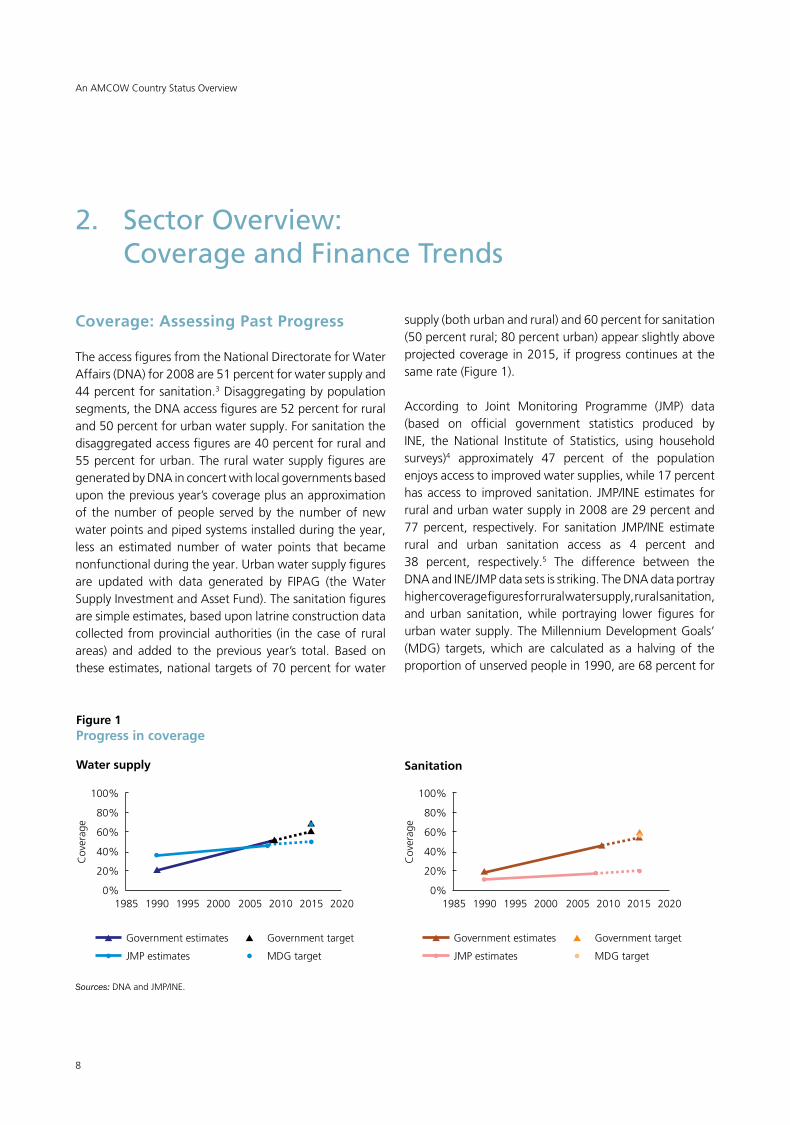
The access figures from the National Directorate for Water Affairs (DNA) for 2008 are 51 percent for water supply and 44 percent for sanitation.3 Disaggregating by population segments, the DNA access figures are 52 percent for rural and50percentforurbanwatersupply.Forsanitationthedisaggregated access figures are 40 percent for rural and 55 percent for urban. The rural water supply figures are generated by DNA in concert with local governments based upon the previous year’s coverage plus an approximation of the number of people served by the number of new water points and piped systems installed during the year, less an estimated number of water points that became nonfunctional during the year. Urban water supply figures are updated with data generated by FIPAG (theWaterSupplyInvestmentandAssetFund).Thesanitationfiguresare simple estimates, based upon latrine construction data collected from provincial authorities (in the case of rural areas) and added to the previous year’s total. Basedonthese estimates, national targets of 70 percent for water
supply (both urban and rural) and 60 percent for sanitation (50 percent rural; 80 percent urban) appear slightly above projected coverage in 2015, if progress continues at the samerate(Figure1).
According to Joint Monitoring Programme (JMP) data (based on official government statistics produced by INE, the National Institute of Statistics, using household surveys)4 approximately 47 percent of the population enjoys access to improved water supplies, while 17 percent has access to improved sanitation. JMP/INE estimates for rural and urban water supply in 2008 are 29 percent and 77percent, respectively. For sanitation JMP/INE estimaterural and urban sanitation access as 4 percent and 38 percent, respectively.5 The difference between the DNA and INE/JMP data sets is striking. The DNA data portray higher coverage figures for rural water supply, rural sanitation, and urban sanitation, while portraying lower figures for urban water supply. The Millennium Development Goals’ (MDG) targets, which are calculated as a halving of the proportion of unserved people in 1990, are 68 percent for
Sanitation
100%
80%
60%
40%
20%
0%1985 1990 1995 2000 2005 2010 2015 2020
Government estimates
JMP estimates
Government target
MDG target
Cov
erag
e
Water supply
Figure 1Progress in coverage
100%
80%
60%
40%
20%
0%1985 1990 1995 2000 2005 2010 2015 2020
Government estimates
JMP estimates
Government target
MDG target
Cov
erag
e
Sources: DNA and JMP/INE.
An AMCOW Country Status Overview
9
water supply (breaking down to approximately 63 percent rural; 87 percent urban) and 56 percent for sanitation (dividing into roughly 52 percent rural; 68 percent urban). Projecting the 1990–2008 JMP trend to 2015 indicates that, if the coverage estimates are accurate and progress is not accelerated, the water supply target will be missed by 17 percentage points, and the sanitation target by 37percentagepoints(Figure1).
The discrepancy in coverage estimates for urban water supply access figures is the result of (a) JMP reporting access for families that get their water from piped systems, though these piped systems are privately owned and operated, and currently unregulated; and (b) JMP reporting access for families that obtain their water from a neighbor’s municipal (regulated) water tap. DNA does not currently recognize either of these two options as constituting access. The discrepancy for rural water supply may reside primarily in DNA’s estimation that each installed water point provides service to 500 people, whereas survey data suggest that this number is probably closer to 300. Forruralsanitation,untilrecently,confusionexistedastowhether or not traditional latrines constituted access, or indeed the exact definition of a traditional latrine, all of which has led to questions about survey methodology for estimating sanitation access. In general, these differences have been described in Mozambique as being those that
differentiate “use” (which shows up in surveys) from “access” (as defined under national policies.) Efforts are under way to achieve improved convergence between the twosetsoffigures.Figure1reflectsboththeofficialDNAand JMP/INE statistics.
Investment Requirements: Testing the Sufficiency of Finance
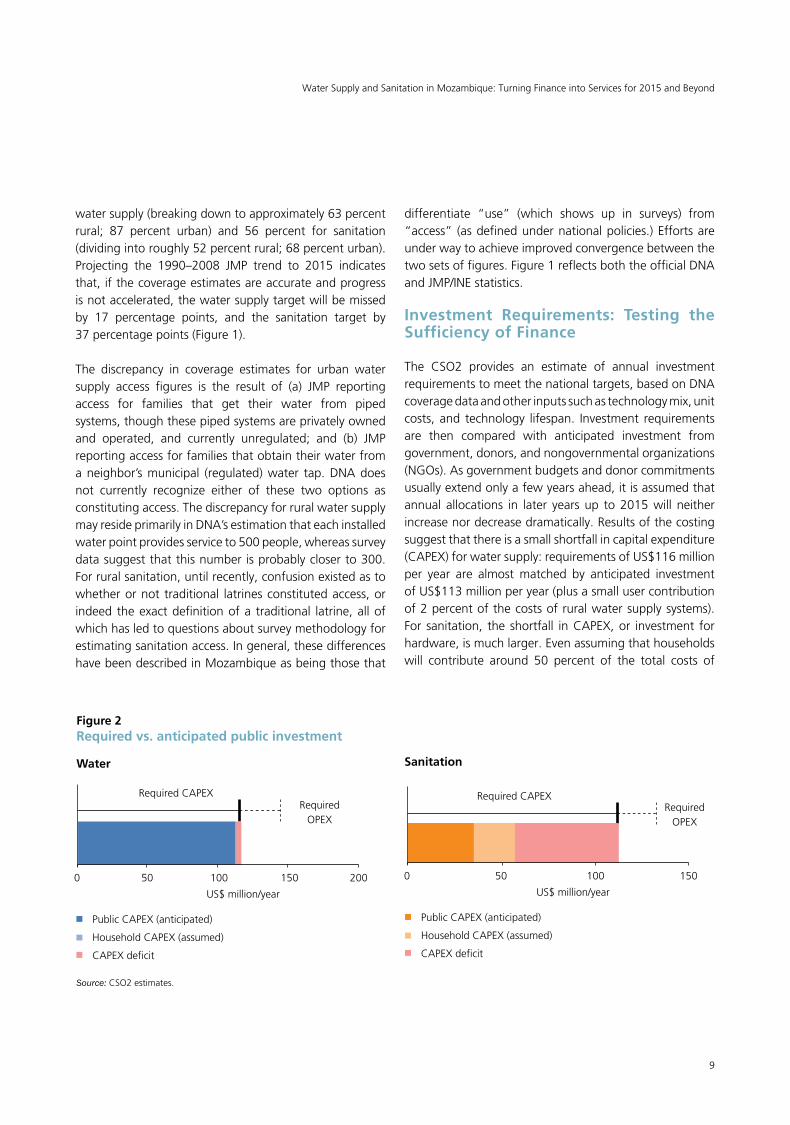
The CSO2 provides an estimate of annual investment requirements to meet the national targets, based on DNA coverage data and other inputs such as technology mix, unit costs, and technology lifespan. Investment requirements are then compared with anticipated investment from government, donors, and nongovernmental organizations (NGOs). As government budgets and donor commitments usually extend only a few years ahead, it is assumed that annual allocations in later years up to 2015 will neither increase nor decrease dramatically. Results of the costing suggest that there is a small shortfall in capital expenditure (CAPEX) for water supply: requirements of US$116 million per year are almost matched by anticipated investment of US$113 million per year (plus a small user contribution of 2 percent of the costs of rural water supply systems). For sanitation, the shortfall inCAPEX,or investment forhardware, is much larger. Even assuming that households will contribute around 50 percent of the total costs of
Sanitation
0 50 100 150
Required CAPEXRequired
OPEX
US$ million/year
Public CAPEX (anticipated)
Household CAPEX (assumed)
CAPEX deficit
Water
Figure 2Required vs. anticipated public investment
0 50 100 150 200
Required CAPEXRequired
OPEX
US$ million/year
Public CAPEX (anticipated)
Household CAPEX (assumed)
CAPEX deficit
Source: CSO2 estimates.
WaterSupplyandSanitationinMozambique:TurningFinanceintoServicesfor2015andBeyond
10
urban sanitation hardware, and around 40 percent in rural areas, anticipated public investment of US$35 million per year would only leverage a further US$22 million from households—overall less than half of the US$113 million required(Figure2).Despitetheoverallgaps,actualsectorbudgets for 2006–08 have increased by 150 percent as compared with 2003–05. Furthermore, once costingsare disaggregated to the subsector level, only urban water supply appears to have sufficient finance (Table 1). A strong institutional arrangement, a comprehensive service model design, and appropriate staffing policies have been instrumental in drawing funding into the urban water space.
Repeating the costing analysis, but substituting in JMP/INE coverage and population data, and the MDG targets, shows a similar picture: sufficient investments for urban water supply, and deficits for all other subsectors. The annual deficit is much higher in the case of rural sanitation, due to the lower estimate of current coverage according to JMP/INE (4 percent vs. 40 percent according to DNA).
The above presentation of investment gaps can, however, bemisleading.First,thereistheissueofwhetheranticipatedallocations will actually materialize as disbursements. Disbursements have increased over the 2006–08 period
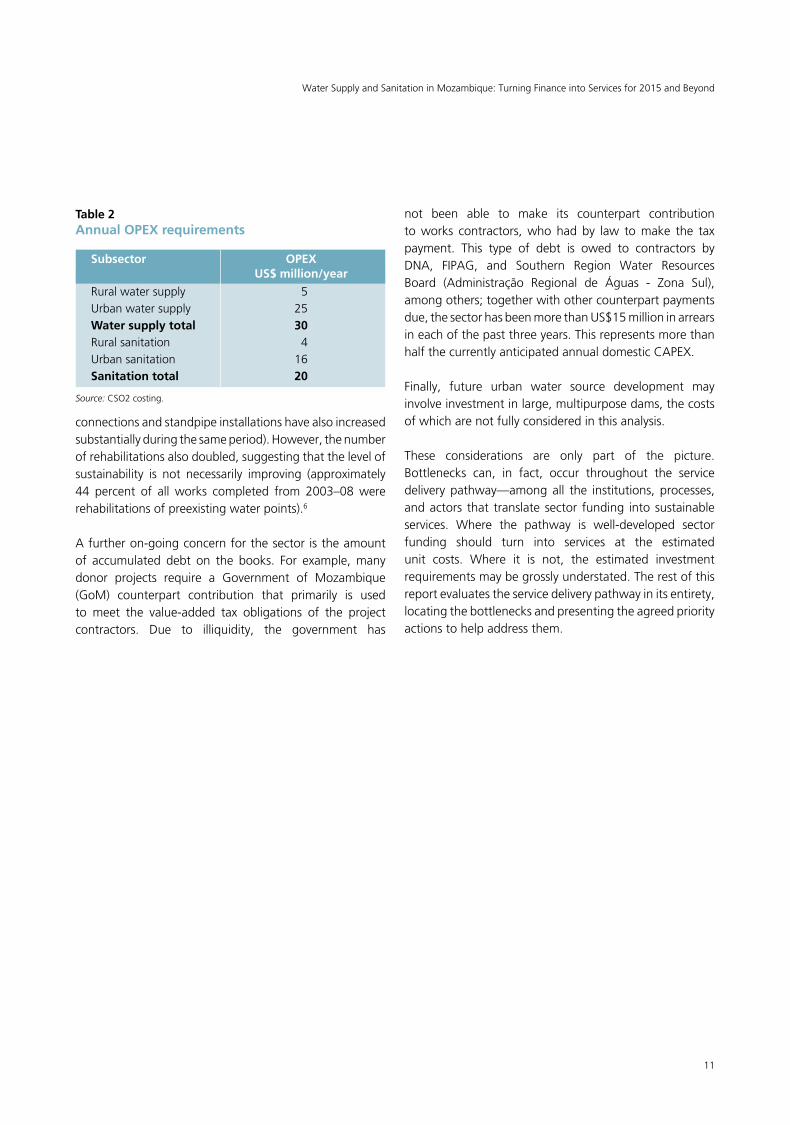
by 155 percent, though the overall rate of disbursement relative to allocations has remained relatively constant at around 60 percent. Technology choice also affects the projectedinvestmentrequirementsandgap.Forexample,it would seem that Mozambique will have a significant shortfall in funding to meet the urban share of the sanitation MDGs. This is partly attributable to the current emphasis on networked sewerage as opposed to on-site solutions or low-cost network options, which may result in very large investment levels leading to small increases in access. There is also the consideration of operations and maintenance expenditure (OPEX), which the CSO2 model estimates at some US$30 million per year for water supply, and US$20 million per year for sanitation. In theory, this is covered by cost recovery schemes; however, where mechanisms for this fail, it becomes a burden on public CAPEX budgets, for example in the form of subsidies to support utilities which cannot meet operation and maintenance (O&M) costs from their own revenues.
In addition to OPEX, major rehabilitation (factored into the CAPEX requirements) presents a considerable drain on finance that would otherwise go to new schemes. The number of new water points installed annually in rural areas doubled in 2006–08 when compared to 2003–05 (from approximately 611 to 1210; urban household
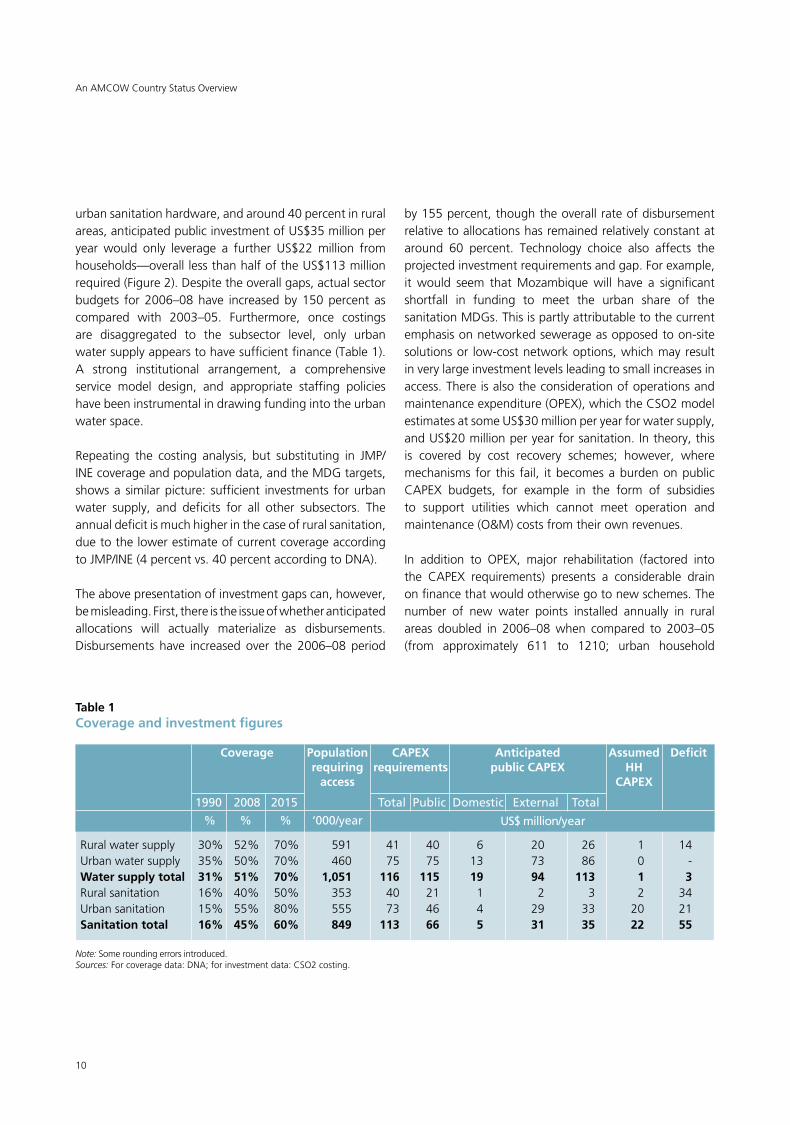
Table 1Coverage and investment figures
Coverage Population CAPEX Anticipated Assumed Deficit requiring requirements public CAPEX HH access CAPEX
1990 2008 2015 Total Public Domestic External Total
% % % ‘000/year Rural water supply 30% 52% 70% 591 41 40 6 20 26 1 14Urban water supply 35% 50% 70% 460 75 75 13 73 86 0 -Water supply total 31% 51% 70% 1,051 116 115 19 94 113 1 3Rural sanitation 16% 40% 50% 353 40 21 1 2 3 2 34Urban sanitation 15% 55% 80% 555 73 46 4 29 33 20 21Sanitation total 16% 45% 60% 849 113 66 5 31 35 22 55
An AMCOW Country Status Overview
US$ million/year
Note: Some rounding errors introduced.Sources:Forcoveragedata:DNA;forinvestmentdata:CSO2costing.
11
connections and standpipe installations have also increased substantially during the same period). However, the number of rehabilitations also doubled, suggesting that the level of sustainability is not necessarily improving (approximately 44 percent of all works completed from 2003–08 were rehabilitations of preexisting water points).6
A further on-going concern for the sector is the amount of accumulated debt on the books. For example, many donor projects require a Government of Mozambique (GoM) counterpart contribution that primarily is used to meet the value-added tax obligations of the project contractors. Due to illiquidity, the government has
Table 2Annual OPEX requirements
Subsector OPEX US$ million/year
Rural water supply 5Urban water supply 25Water supply total 30Rural sanitation 4Urban sanitation 16Sanitation total 20
not been able to make its counterpart contribution to works contractors, who had by law to make the tax payment. This type of debt is owed to contractors by DNA, FIPAG, and Southern Region Water Resources Board (Administração Regional de Águas - Zona Sul), among others; together with other counterpart payments due, the sector has been more than US$15 million in arrears in each of the past three years. This represents more than half the currently anticipated annual domestic CAPEX.
Finally, future urban water source development may involve investment in large, multipurpose dams, the costs of which are not fully considered in this analysis.
These considerations are only part of the picture. Bottlenecks can, in fact, occur throughout the service delivery pathway—among all the institutions, processes, and actors that translate sector funding into sustainable services. Where the pathway is well-developed sector funding should turn into services at the estimated unit costs. Where it is not, the estimated investment requirements may be grossly understated. The rest of this report evaluates the service delivery pathway in its entirety, locating the bottlenecks and presenting the agreed priority actions to help address them.
Source: CSO2 costing.
Water Supply and Sanitation in Mozambique: Turning Finance into Services for 2015 and Beyond
12
3. Reform Context: Introducing the CSO2 Scorecard
Mozambique won independence in 1975. However, the internal conflict of 1982–92 led to significant infrastructure failure and destruction, despite early efforts, especially in the area of sanitation, to bring improved services to the population. Modern reform takes off with the signing of the 1992 peace accords. The first milestone is approval of the National Water Policy in 1995 which introduced key reform elements such as reduced direct implementation by government, increased private sector roles, recognition of water and sanitation services as both social and economic goods, and the application of the demand-responsive approach to service provision, especially for rural areas. These principles continue to shape the sector today, and are largely responsible for the public-private partnership model developed for urban water supply, now being expanded into secondary cities and towns.
This first wave of reform was closely followed by a second, spearheaded by the Decentralization Law of 1997 which created autonomous municipal governments with locally-elected leaders. This led to the Law of Local State Organs in 2003 which extended significant powers and responsibilities to district and provincial governments, though both fiscal and political decentralization has lagged. The decentralization process is being complemented by the planned creation of Provincial Water and Sanitation Services (SPAS) and the establishment of a common fund for rural water supply and sanitation, both of which are aimed at driving decision making and investments to the lowest levels possible.
Over 85 percent of available public investment funding for the sector still comes from grants or concessional loans,7 which until now have tended to centralize investment decisions. This has also introduced some concerns about policy reform being driven from outside the government. Nonetheless, the reform process has come a long way in a very short period of time, with the urban water
supply provision model being most developed, rural water and sanitation less developed, and urban sanitation least developed.
This recent history puts the service delivery pathway in context, which can then be explored in detail using the CSO2 scorecard, an assessment tool providing a snapshot of reform progress. The CSO2 scorecard assesses the building blocks of service delivery in turn: three building blocks which relate to enabling services, three which relate to developing new services, and three which relate to sustaining services. Each building block is assessed against specific indicators and scored from 1 to 3 accordingly.8
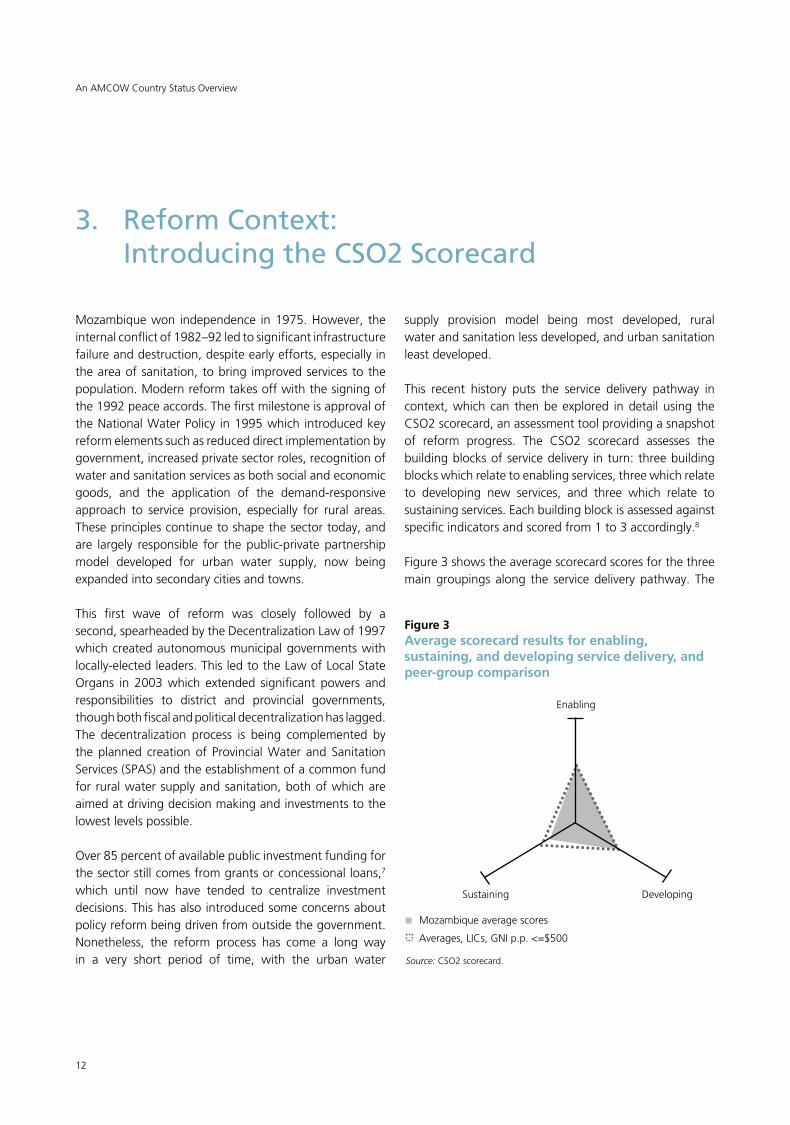
Figure3showstheaveragescorecardscoresforthethreemain groupings along the service delivery pathway. The
Figure 3Average scorecard results for enabling, sustaining, and developing service delivery, and peer-group comparison
Enabling
Sustaining Developing
Mozambique average scores
Averages, LICs, GNI p.p. <=$500
Source: CSO2 scorecard.
An AMCOW Country Status Overview
13
average scores suggest that aspects relating to enabling services (including framework policies and institutions, major sector plans and budgets) have received the most attention. However, they also confirm that reform attention to sustaining water and sanitation services on the ground has lagged. Mozambique’s average scores are comparable to, or slightly below, the average for other Low Income Countries (LICs) with a Gross National Income (GNI) per capita below US$500 (Atlas method).
Sections from ‘Institutional Frameworks’ through to‘Sector Monitoring and Evaluation’ highlight progress and challenges across three thematic areas—the institutional framework, finance, and monitoring and evaluation
WaterSupplyandSanitationinMozambique:TurningFinanceintoServicesfor2015andBeyond
Table 3Key dates in the reform of the sector in Mozambique
Year Event
1991 National Water Law
1992 FinalPeaceAccords
1995 National Water Policy 1
1997 Decentralization Law
1998 EstablishmentofFIPAGandCRA(assetholderandregulator,respectively,fordelegatedmanagementofwatersupply in major cities)
1998 Water Tariff Policy approved
2002 Creation of ASAS, first budget support instrument for the water sector
2003 Law of Local State Organs, extension of powers, responsibilities, and budget lines to districts and provinces
2004 Water Quality Regulations
2006 National Poverty Reduction Strategy II
2007 National Water Policy 2
2007 Completion of National Rural Water and Sanitation Strategic Plan
2009 Establishment of a new management model for secondary cities and towns, including Provincial Water and Sanitation Services (SPAS), a national Water and Sanitation Infrastructure Administration (AIAS), and extension of the mandate of the sector regulator (CRA)
2010 PRONASAR and common fund established for rural water and sanitation
(M&E)—benchmarking Mozambique against its peer group based on a grouping by GNI. The related indicators are extracted from the scorecard and presented in charts at the beginning of each section. The subsector results are clearly reflected in the scorecards (see sections from ‘Rural Water Supply’ through to ‘Urban Sanitation and Hygiene’) which demonstrate that the enabling building blocks generally score higher than the developing building blocks, which in turn generally score higher than the sustaining building blocks. This suggests that greater emphasis has been placed on the upstream side of service delivery, which includes policy, planning, and investment, and less on the downstream side which includes equity, maintenance, and use.
14
4. Institutional Framework
For over a decade, the strategy of the urban water subsector has been to separate water resources management and water production roles from water supply asset holding and from water services management. The reform process continues today, with expected modifications at decentralized levels of governance, by following the large urban model in the secondary cities. Rural water and sanitation and urban sanitation have undergone minor
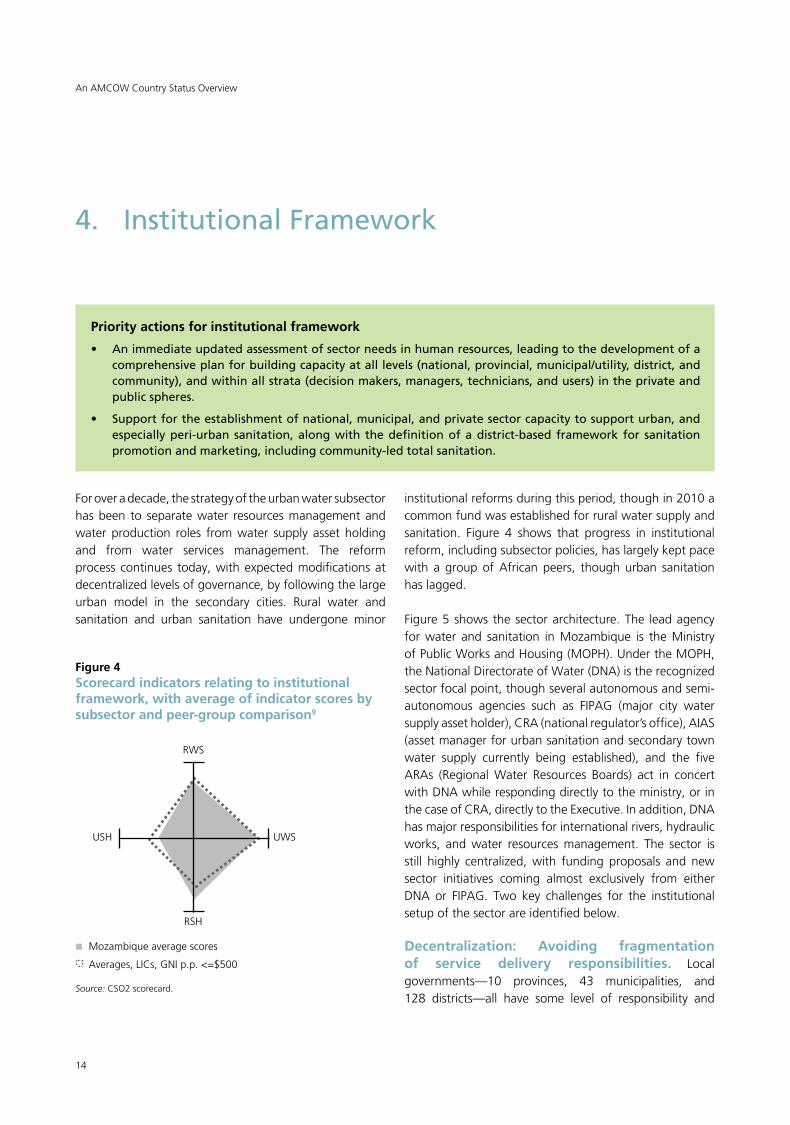
institutional reforms during this period, though in 2010 a common fund was established for rural water supply and sanitation. Figure 4 shows that progress in institutional reform, including subsector policies, has largely kept pace with a group of African peers, though urban sanitation has lagged.
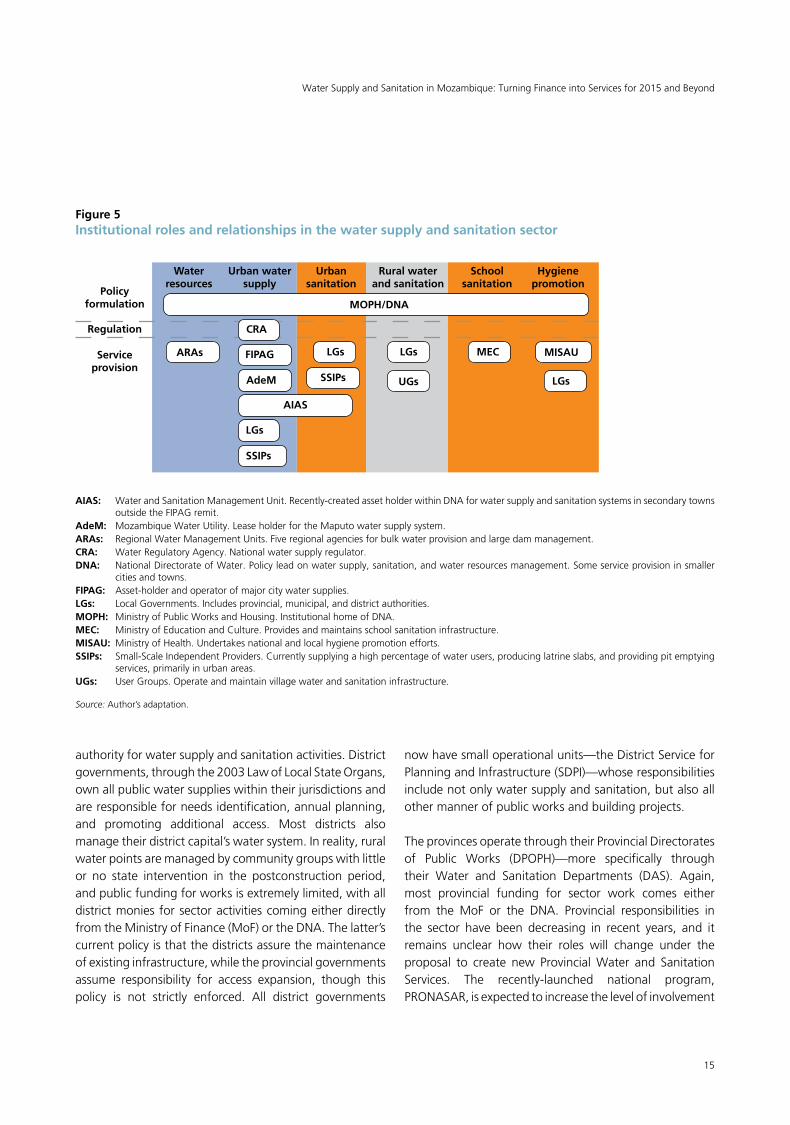
Figure 5 shows the sector architecture. The lead agency for water and sanitation in Mozambique is the Ministry of Public Works and Housing (MOPH). Under the MOPH, the National Directorate of Water (DNA) is the recognized sector focal point, though several autonomous and semi-autonomous agencies such as FIPAG (major city water supply asset holder), CRA (national regulator’s office), AIAS (asset manager for urban sanitation and secondary town water supply currently being established), and the five ARAs (Regional Water Resources Boards) act in concert with DNA while responding directly to the ministry, or in the case of CRA, directly to the Executive. In addition, DNA has major responsibilities for international rivers, hydraulic works, and water resources management. The sector is still highly centralized, with funding proposals and new sector initiatives coming almost exclusively from either DNA or FIPAG. Two key challenges for the institutional setup of the sector are identified below.
Decentralization: Avoiding fragmentation of service delivery responsibilities. Local governments—10 provinces, 43 municipalities, and 128 districts—all have some level of responsibility and
Priority actions for institutional framework
• Animmediateupdatedassessmentofsectorneedsinhumanresources,leadingtothedevelopmentofacomprehensiveplanforbuildingcapacityatalllevels(national,provincial,municipal/utility,district,andcommunity),andwithinallstrata(decisionmakers,managers,technicians,andusers)intheprivateandpublicspheres.
• Supportfortheestablishmentofnational,municipal,andprivatesectorcapacitytosupporturban,andespeciallyperi-urban sanitation,alongwith thedefinitionofadistrict-based framework for sanitationpromotionandmarketing,includingcommunity-ledtotalsanitation.
Figure 4Scorecard indicators relating to institutional framework, with average of indicator scores by subsector and peer-group comparison9
Mozambique average scores
Averages, LICs, GNI p.p. <=$500
Source: CSO2 scorecard.
An AMCOW Country Status Overview
RWS
RSH
USH UWS
15
authority for water supply and sanitation activities. District governments, through the 2003 Law of Local State Organs, own all public water supplies within their jurisdictions and are responsible for needs identification, annual planning, and promoting additional access. Most districts also manage their district capital’s water system. In reality, rural water points are managed by community groups with little or no state intervention in the postconstruction period, and public funding for works is extremely limited, with all district monies for sector activities coming either directly fromtheMinistryofFinance(MoF)ortheDNA.Thelatter’scurrent policy is that the districts assure the maintenance of existing infrastructure, while the provincial governments assume responsibility for access expansion, though this policy is not strictly enforced. All district governments
AIAS: Water and Sanitation Management Unit. Recently-created asset holder within DNA for water supply and sanitation systems in secondary towns outsidetheFIPAGremit.
AdeM: Mozambique Water Utility. Lease holder for the Maputo water supply system.ARAs: RegionalWaterManagementUnits.Fiveregionalagenciesforbulkwaterprovisionandlargedammanagement.CRA: Water Regulatory Agency. National water supply regulator.DNA: National Directorate of Water. Policy lead on water supply, sanitation, and water resources management. Some service provision in smaller
cities and towns.FIPAG: Asset-holder and operator of major city water supplies.LGs: Local Governments. Includes provincial, municipal, and district authorities.MOPH: Ministry of Public Works and Housing. Institutional home of DNA.MEC: Ministry of Education and Culture. Provides and maintains school sanitation infrastructure.MISAU: Ministry of Health. Undertakes national and local hygiene promotion efforts.SSIPs: Small-Scale Independent Providers. Currently supplying a high percentage of water users, producing latrine slabs, and providing pit emptying
services, primarily in urban areas.UGs: User Groups. Operate and maintain village water and sanitation infrastructure.
Figure 5Institutional roles and relationships in the water supply and sanitation sector
now have small operational units—the District Service for Planning and Infrastructure (SDPI)—whose responsibilities include not only water supply and sanitation, but also all other manner of public works and building projects.
The provinces operate through their Provincial Directorates of Public Works (DPOPH)—more specifically through their Water and Sanitation Departments (DAS). Again, most provincial funding for sector work comes either from theMoF or the DNA. Provincial responsibilities inthe sector have been decreasing in recent years, and it remains unclear how their roles will change under the proposal to create new Provincial Water and Sanitation Services. The recently-launched national program, PRONASAR, is expected to increase the level of involvement
Policyformulation MOPH/DNA
SSIPs
ARAs FIPAG
AdeM
LGs LGs
LGs
LGs
UGs
MEC MISAU
SSIPs
AIAS
Waterresources
Urban water supply
Urban sanitation
Rural water and sanitation
School sanitation
Hygiene promotion
Serviceprovision
Regulation CRA
Source: Author’s adaptation.
WaterSupplyandSanitationinMozambique:TurningFinanceintoServicesfor2015andBeyond
16
of both the districts and provinces in rural water supply and sanitation.
Municipal governments have exercised a very limited role in both water supply and sanitation despite their legal responsibilities. Their revenue-raising limitations have made them dependent for funding upon central government programs and institutions where local governments currently have minimal influence. Human resources are limited at all local government levels, which has had a negative impact on urban and rural sanitation, as well as rural water supplies.
Operations: Assigning responsibilities in large urban areas. The largest cities have professionally-managed water supplies through a delegated private-sector manager, though this model has experienced
difficulties in maintaining private interest. The private sector has received criticism for its track record in improving service delivery, though massive recent public investments have upgraded infrastructure significantly. Hundreds of small independent water providers exist, almost entirely in the peri-urban areas of Maputo, and their role has been growing rather than shrinking over the last decade. The issue of engaging the independent providers is currently being closely examined for ways to bring them under quality controls and regulatory oversight.
Urban and peri-urban sanitation have been excluded from the delegated management model and only recently are municipally-based management arrangements being discussed. In the absence of a well-financed and staffed institutional home for urban sanitation, relatively little has been accomplished in recent years in the subsector.
An AMCOW Country Status Overview
17
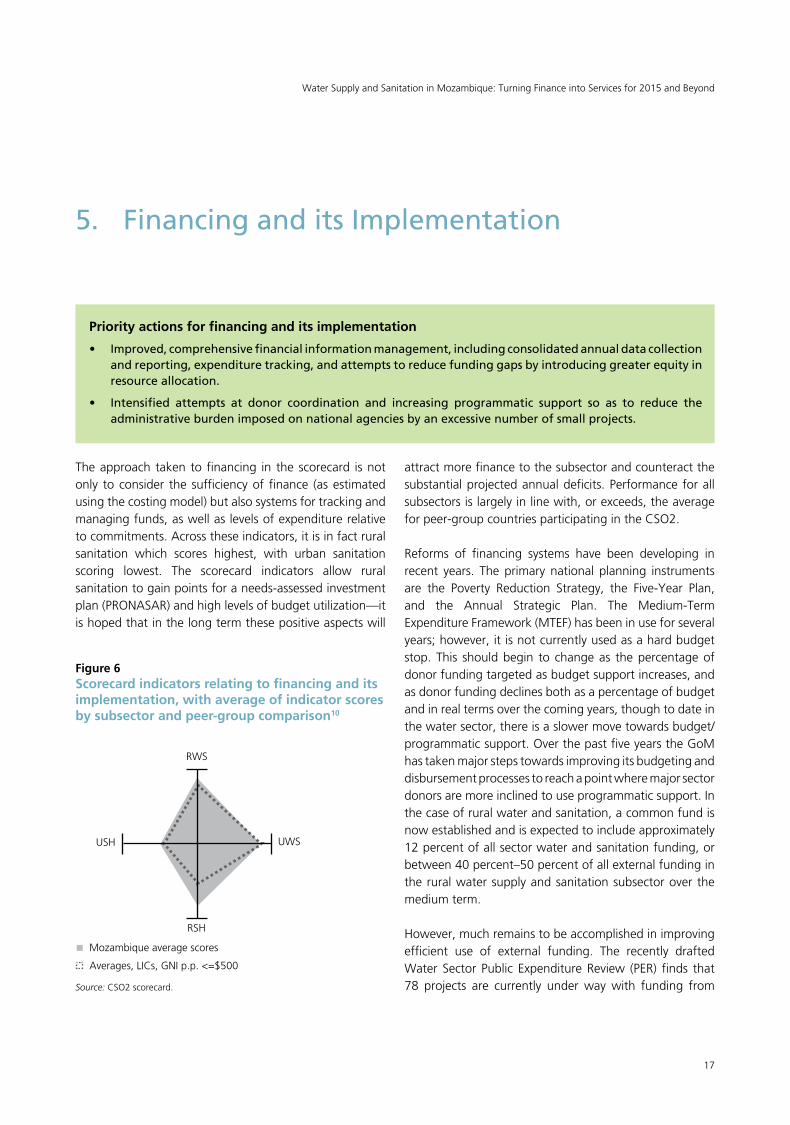
The approach taken to financing in the scorecard is not only to consider the sufficiency of finance (as estimated using the costing model) but also systems for tracking and managing funds, as well as levels of expenditure relative to commitments. Across these indicators, it is in fact rural sanitation which scores highest, with urban sanitation scoring lowest. The scorecard indicators allow rural sanitation to gain points for a needs-assessed investment plan (PRONASAR) and high levels of budget utilization—it is hoped that in the long term these positive aspects will
5. FinancinganditsImplementation
Priority actions for financing and its implementation
• Improved,comprehensivefinancialinformationmanagement,includingconsolidatedannualdatacollectionandreporting,expendituretracking,andattemptstoreducefundinggapsbyintroducinggreaterequityinresource allocation.
• Intensified attempts at donor coordination and increasing programmatic support so as to reduce theadministrativeburdenimposedonnationalagenciesbyanexcessivenumberofsmallprojects.
attract more finance to the subsector and counteract the substantial projected annual deficits. Performance for all subsectors is largely in line with, or exceeds, the average for peer-group countries participating in the CSO2.
Reforms of financing systems have been developing in recent years. The primary national planning instruments are the Poverty Reduction Strategy, the Five-Year Plan,and the Annual Strategic Plan. The Medium-Term ExpenditureFramework(MTEF)hasbeeninuseforseveralyears; however, it is not currently used as a hard budget stop. This should begin to change as the percentage of donor funding targeted as budget support increases, and as donor funding declines both as a percentage of budget and in real terms over the coming years, though to date in the water sector, there is a slower move towards budget/programmatic support. Over the past five years the GoM has taken major steps towards improving its budgeting and disbursement processes to reach a point where major sector donors are more inclined to use programmatic support. In the case of rural water and sanitation, a common fund is now established and is expected to include approximately 12 percent of all sector water and sanitation funding, or between 40 percent–50 percent of all external funding in the rural water supply and sanitation subsector over the medium term.
However, much remains to be accomplished in improving efficient use of external funding. The recently drafted Water Sector Public Expenditure Review (PER) finds that 78 projects are currently under way with funding from
Figure 6Scorecard indicators relating to financing and its implementation, with average of indicator scores by subsector and peer-group comparison10
Mozambique average scores
Averages, LICs, GNI p.p. <=$500
RWS
RSH
USH UWS
Source: CSO2 scorecard.
WaterSupplyandSanitationinMozambique:TurningFinanceintoServicesfor2015andBeyond
18
24 distinct donors among Organisation for Economic Cooperation and Development (OECD) and nonOECD partners. The majority of projects report an average investment amount of less than US$5 million.11 This high number of projects, coupled with the fact that government operational expenses have actually decreased over the last five years, suggests that while sector transaction costs remain high, the human and financial resources needed to manage so many projects are simply not available. Increased project consolidation, donor harmonization, and pooling of funds are all urgently required. Additional challenges for sector financing are described here.
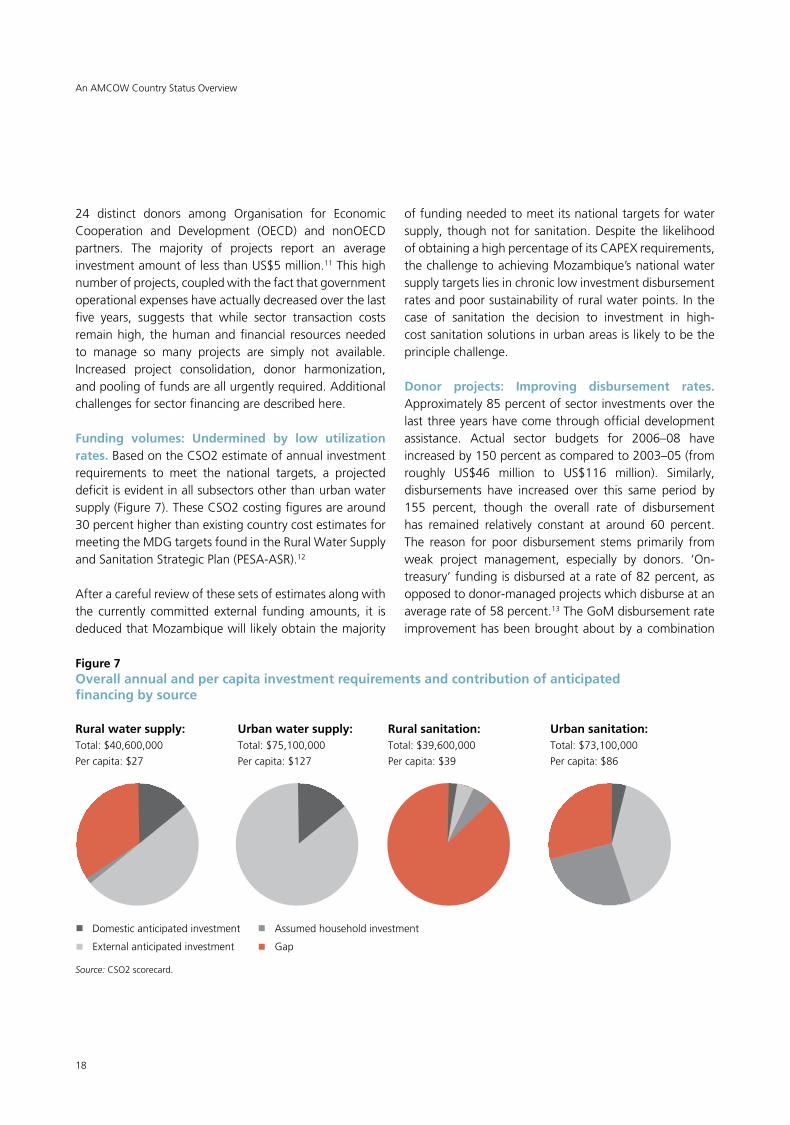
Funding volumes: Undermined by low utilization rates. BasedontheCSO2estimateofannualinvestmentrequirements to meet the national targets, a projected deficit is evident in all subsectors other than urban water supply(Figure7).TheseCSO2costingfiguresarearound30 percent higher than existing country cost estimates for meeting the MDG targets found in the Rural Water Supply and Sanitation Strategic Plan (PESA-ASR).12
After a careful review of these sets of estimates along with the currently committed external funding amounts, it is deduced that Mozambique will likely obtain the majority
of funding needed to meet its national targets for water supply, though not for sanitation. Despite the likelihood of obtaining a high percentage of its CAPEX requirements, the challenge to achieving Mozambique’s national water supply targets lies in chronic low investment disbursement rates and poor sustainability of rural water points. In the case of sanitation the decision to investment in high-cost sanitation solutions in urban areas is likely to be the principle challenge.
Donor projects: Improving disbursement rates. Approximately 85 percent of sector investments over the last three years have come through official development assistance. Actual sector budgets for 2006–08 have increased by 150 percent as compared to 2003–05 (from roughly US$46 million to US$116 million). Similarly, disbursements have increased over this same period by 155 percent, though the overall rate of disbursement has remained relatively constant at around 60 percent. The reason for poor disbursement stems primarily from weak project management, especially by donors. ‘On-treasury’ funding is disbursed at a rate of 82 percent, as opposed to donor-managed projects which disburse at an average rate of 58 percent.13 The GoM disbursement rate improvement has been brought about by a combination
Rural water supply:Total: $40,600,000
Per capita: $27
Urban water supply:Total: $75,100,000
Per capita: $127
Rural sanitation:Total: $39,600,000
Per capita: $39
Urban sanitation:Total: $73,100,000
Per capita: $86
Domestic anticipated investment
External anticipated investment
Assumed household investment
Gap
Source: CSO2 scorecard.
An AMCOW Country Status Overview
Figure 7Overall annual and per capita investment requirements and contribution of anticipated financing by source
19
of the elimination of the old ‘duodecimal’ budget allocation system, the introduction of a greatly improved state financial management system (SISTAFE), moreefficient procurement processes, more punctual donor disbursements, improved estimates of project start-up dates, and the allowance by some donors of payment of GoM counterpart contributions or tax payments using the same projects’ credits or grants.
Tracking: Improving budget comprehensiveness and clarity. The current budget structure and reporting system does permit tracking total water and sanitation budgets and expenditures, yet there are several key concerns: (a) there is still no consolidated budget or budget reporting for the sector, though the DNA has been designated by the MOPH to execute this task annually; (b) it is impossible to separate expenditures on water supply from those on sanitation for rural areas since they are reported upon jointly; (c) the sector does not estimate costs to the drinking water subsector for multipurpose dams that may have irrigation, flood-control, and drinking water components; (d) GoM
reporting does not clearly link investment amounts to specific works or types of works, which makes it difficult to generate and track unit costs, or to develop an overall cost structure for each subsector; (e) O&M costs or community contributions are not tracked or reported upon; and (f) subsidies for O&M expenses, connection fees or latrine slabs are not specifically tracked or reported. However, due to efforts by the GoM to capture under the budget system as much funding as possible, it is now likely that upwards of 95 percent of all sector funding is ‘on-budget’, though not all is actually disbursed through the single treasury account.
Recurrent spending: Investing in sector capacity. Over 97 percent of the sector’s budget goes to investments and rehabilitation, and the government’s recurrent costs for salaries and operations is almost always disbursed in full each year.14 This suggests that the sector may be under-spending on staffing and operations. It is likely that some increase in recurrent spending would improve efficiencies and investment disbursement rates.
WaterSupplyandSanitationinMozambique:TurningFinanceintoServicesfor2015andBeyond
20
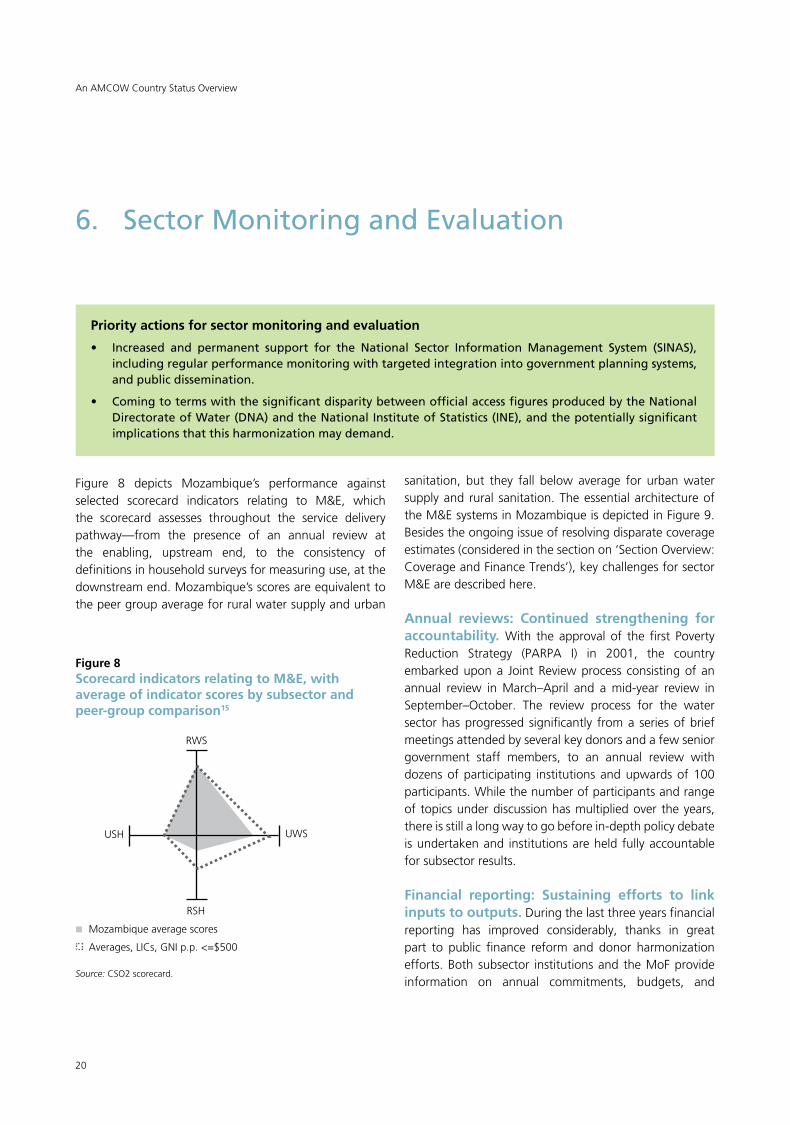
Figure 8 depicts Mozambique’s performance againstselected scorecard indicators relating to M&E, which the scorecard assesses throughout the service delivery pathway—from the presence of an annual review at the enabling, upstream end, to the consistency of definitions in household surveys for measuring use, at the downstream end. Mozambique’s scores are equivalent to the peer group average for rural water supply and urban
6. Sector Monitoring and Evaluation
Priority actions for sector monitoring and evaluation
• Increased and permanent support for the National Sector InformationManagement System (SINAS),includingregularperformancemonitoringwithtargetedintegrationintogovernmentplanningsystems,andpublicdissemination.
• ComingtotermswiththesignificantdisparitybetweenofficialaccessfiguresproducedbytheNationalDirectorateofWater(DNA)andtheNationalInstituteofStatistics(INE),andthepotentiallysignificantimplicationsthatthisharmonizationmaydemand.
sanitation, but they fall below average for urban water supply and rural sanitation. The essential architecture of theM&EsystemsinMozambiqueisdepictedinFigure9.Besidestheongoingissueofresolvingdisparatecoverageestimates (considered in the section on ‘Section Overview: CoverageandFinanceTrends’),keychallengesforsectorM&E are described here.
Annual reviews: Continued strengthening for accountability. With the approval of the first Poverty Reduction Strategy (PARPA I) in 2001, the country embarked upon a Joint Review process consisting of an annual review in March–April and a mid-year review in September–October. The review process for the water sector has progressed significantly from a series of brief meetings attended by several key donors and a few senior government staff members, to an annual review with dozens of participating institutions and upwards of 100 participants. While the number of participants and range of topics under discussion has multiplied over the years, there is still a long way to go before in-depth policy debate is undertaken and institutions are held fully accountable for subsector results.
Financial reporting: Sustaining efforts to link inputs to outputs. During the last three years financial reporting has improved considerably, thanks in great part to public finance reform and donor harmonization efforts.Bothsubsector institutionsandtheMoFprovideinformation on annual commitments, budgets, and
Figure 8Scorecard indicators relating to M&E, with average of indicator scores by subsector and peer-group comparison15
RWS
RSH
Mozambique average scores
Averages, LICs, GNI p.p. <=$500
USH UWS
Source: CSO2 scorecard.
An AMCOW Country Status Overview
21
expenditures, though there have been occasional major discrepancies between the two sources of information. Reporting has been weak, however, when trying to link disbursements to actual outputs, that is, outputs and disbursements are reported, but not in relation to one another. As a result, it is difficult to ascribe unit costs or estimate value for money.
These deficiencies spill over into the planning space. The recently-drafted water sector PER suggests that the number of different planning documents (without a comprehensive consolidated planning effort), the ability of theMoFtoabruptlychangebudgetallocationsduringthefiscal year, and the weak coordination of donor financing, all conspire to make the planning exercise inefficient and incapable of identifying and resolving key sector planning and financial constraints and inequities.16
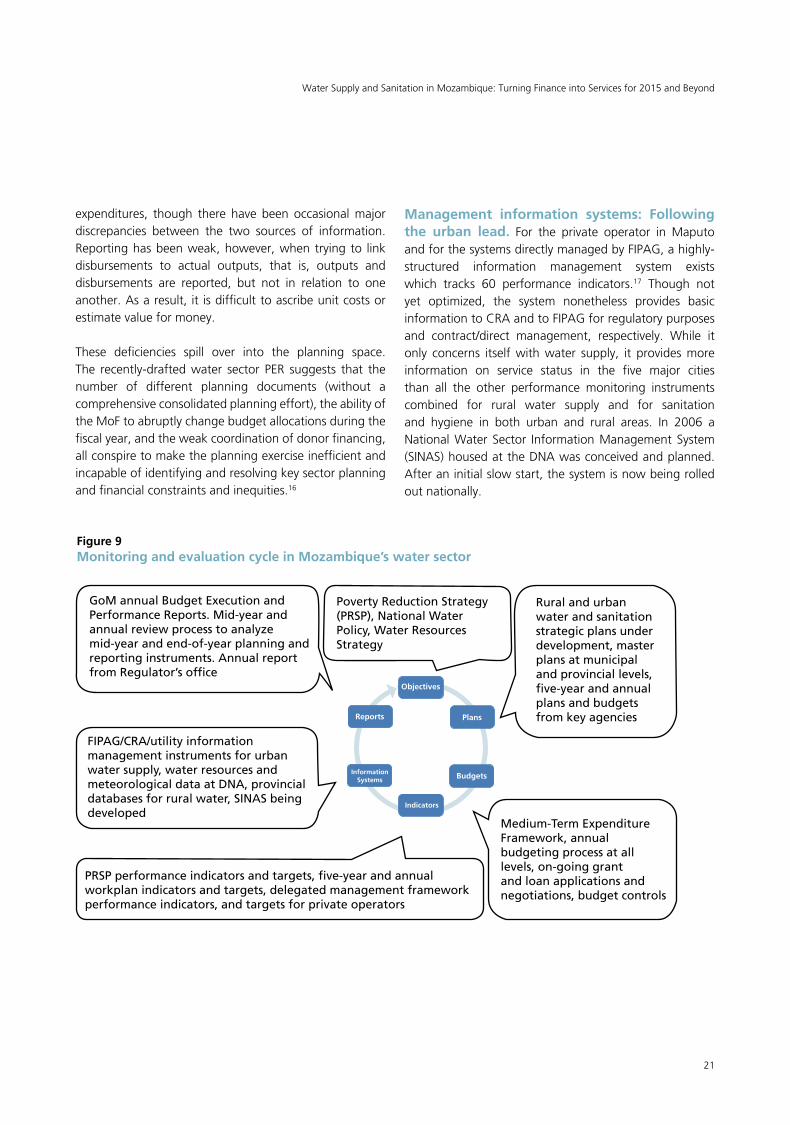
Management information systems: Following the urban lead. For the private operator inMaputoandforthesystemsdirectlymanagedbyFIPAG,ahighly-structured information management system exists which tracks 60 performance indicators.17 Though not yet optimized, the system nonetheless provides basic informationtoCRAandtoFIPAGforregulatorypurposesand contract/direct management, respectively. While it only concerns itself with water supply, it provides more information on service status in the five major cities than all the other performance monitoring instruments combined for rural water supply and for sanitation and hygiene in both urban and rural areas. In 2006 a National Water Sector Information Management System (SINAS) housed at the DNA was conceived and planned. After an initial slow start, the system is now being rolled out nationally.
Figure 9Monitoring and evaluation cycle in Mozambique’s water sector
GoM annual Budget Execution and PerformanceReports.Mid-yearandannualreviewprocesstoanalyze mid-yearandend-of-yearplanningandreportinginstruments.Annualreportfrom Regulator’s office
Poverty Reduction Strategy (PRSP),NationalWaterPolicy,WaterResourcesStrategy
Rural and urban water and sanitation strategicplansunderdevelopment,masterplansatmunicipalandprovinciallevels,five-yearandannualplansandbudgetsfrom key agencies
Medium-TermExpenditureFramework,annualbudgetingprocessatalllevels,on-goinggrantandloanapplicationsandnegotiations,budgetcontrols
FIPAG/CRA/utility information management instruments for urban watersupply,waterresourcesandmeteorologicaldataatDNA,provincialdatabasesforruralwater,SINASbeingdeveloped
PRSPperformanceindicatorsandtargets,five-yearandannualworkplanindicatorsandtargets,delegatedmanagementframeworkperformanceindicators,andtargetsforprivateoperators
Objectives
Plans
Budgets
Indicators
Information Systems
Reports
WaterSupplyandSanitationinMozambique:TurningFinanceintoServicesfor2015andBeyond
22
7. Subsector:RuralWaterSupply
Priority actions for rural water supply
• Fast-trackimplementationofPRONASARanditsassociatedcommonfund.
• Theestablishmentofinstitutionalarrangementsandmechanismstoensurethesustainabilityofcommunity-managedruralwatersupplies.
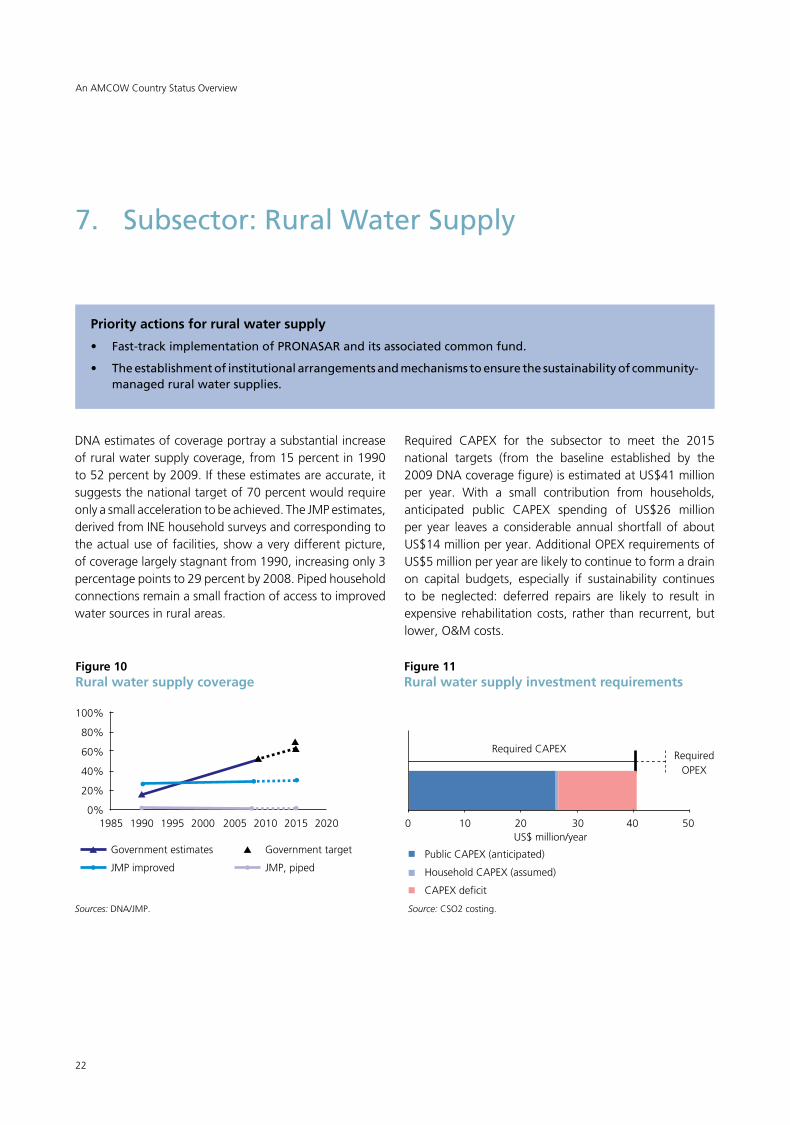
Required CAPEX for the subsector to meet the 2015 national targets (from the baseline established by the 2009 DNA coverage figure) is estimated at US$41 million per year. With a small contribution from households, anticipated public CAPEX spending of US$26 million per year leaves a considerable annual shortfall of about US$14 million per year. Additional OPEX requirements of US$5 million per year are likely to continue to form a drain on capital budgets, especially if sustainability continues to be neglected: deferred repairs are likely to result in expensive rehabilitation costs, rather than recurrent, but lower, O&M costs.
DNA estimates of coverage portray a substantial increase of rural water supply coverage, from 15 percent in 1990 to 52 percent by 2009. If these estimates are accurate, it suggests the national target of 70 percent would require only a small acceleration to be achieved. The JMP estimates, derived from INE household surveys and corresponding to the actual use of facilities, show a very different picture, of coverage largely stagnant from 1990, increasing only 3 percentage points to 29 percent by 2008. Piped household connections remain a small fraction of access to improved water sources in rural areas.
Figure 10Rural water supply coverage
100%
80%
60%
40%
20%
0%1985 1990 1995 2000 2005 2010 2015 2020
Government estimates
JMP improved
Government target
JMP, piped
Sources: DNA/JMP.
Figure 11Rural water supply investment requirements
0 10 20 30 40 50
Required CAPEXRequired
OPEX
US$ million/year
Public CAPEX (anticipated)
Household CAPEX (assumed)
CAPEX deficit
Source: CSO2 costing.
An AMCOW Country Status Overview
23
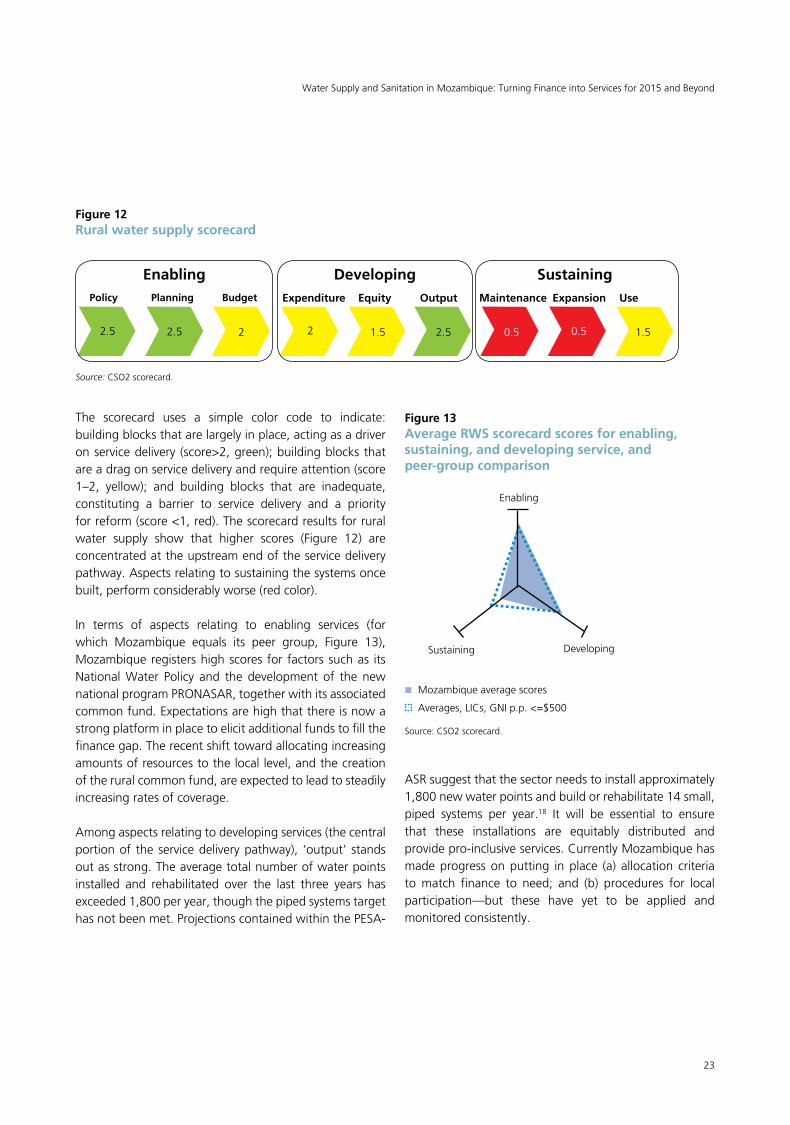
Figure 12Rural water supply scorecard
The scorecard uses a simple color code to indicate: building blocks that are largely in place, acting as a driver on service delivery (score>2, green); building blocks that are a drag on service delivery and require attention (score 1–2, yellow); and building blocks that are inadequate, constituting a barrier to service delivery and a priority for reform (score <1, red). The scorecard results for rural water supply show that higher scores (Figure 12) areconcentrated at the upstream end of the service delivery pathway. Aspects relating to sustaining the systems once built, perform considerably worse (red color).
In terms of aspects relating to enabling services (for which Mozambique equals its peer group, Figure 13),Mozambique registers high scores for factors such as its National Water Policy and the development of the new national program PRONASAR, together with its associated common fund. Expectations are high that there is now a strong platform in place to elicit additional funds to fill the finance gap. The recent shift toward allocating increasing amounts of resources to the local level, and the creation of the rural common fund, are expected to lead to steadily increasing rates of coverage.
Among aspects relating to developing services (the central portion of the service delivery pathway), ‘output’ stands out as strong. The average total number of water points installed and rehabilitated over the last three years has exceeded 1,800 per year, though the piped systems target has not been met. Projections contained within the PESA-
ASR suggest that the sector needs to install approximately 1,800 new water points and build or rehabilitate 14 small, piped systems per year.18 It will be essential to ensure that these installations are equitably distributed and provide pro-inclusive services. Currently Mozambique has made progress on putting in place (a) allocation criteria to match finance to need; and (b) procedures for local participation—but these have yet to be applied and monitored consistently.
Figure 13Average RWS scorecard scores for enabling, sustaining, and developing service, and peer-group comparison
EnablingPolicy
2.5 2.5 2 2 1.5 2.5 0.5 0.5 1.5
Planning Budget Expenditure Equity Output Maintenance Expansion Use
Developing Sustaining
Enabling
Mozambique average scores
Averages, LICs, GNI p.p. <=$500
Sustaining Developing
Source: CSO2 scorecard.
Source: CSO2 scorecard.
WaterSupplyandSanitationinMozambique:TurningFinanceintoServicesfor2015andBeyond
24
Aspects relating to sustaining services are the most problematic. A first step to enable maintenance is to regularly assess functionality of existing water points. The last inventory of rural water points was performed over 2002–03, though some provinces have managed to keep registering new water points into their database. The number of nonfunctioning water points at that time was found to be around 30 percent. Since then, with increased efforts to rehabilitate, that number has been reduced and is now estimated to hover around 20 percent. However, if the sustainability issue is not addressed the point may soon be reached where more rehabilitations are taking place each year than new water points, and progress may stall. In any case, the sector has been conscious of the functionality issue for some time, as well as the problem of maintaining up-to-date information on its water points which now number nearly 20,000 nationwide, of which an estimated 16,000 are functional.
In the case of Mozambique, over 90 percent of rural inhabitants with access receive that access from a handpump. Handpumps are consistently failing, and several factors that help understand the failure rate have
been suggested. The PESA-ASR puts forward several approaches to improve sustainable service provision, and some of these are currently being explored. Key concerns include (a) Demand-Responsive Approach (DRA) inconsistently applied; (b) spare parts not readily available; (c) user groups not supported during the postconstruction period; (d) lack of trained and equipped area mechanics; (e) community complacency and dependence upon outside actors; (f) failures in the community management model; (g) low incomes; (h) substandard initial construction quality; and (i)poor initialwaterqualityandquantity.Figure12starkly illustrates the deficiencies at the sustaining end of the service delivery pathway.
Little can be said about the estimated 5 percent of the served population receiving water supply via one of the country’s estimated 300 small, piped systems. No situational assessment has been performed, though it is widely considered that a large number is either nonfunctional or deficient, delivering water sporadically to a small proportion of potential users. Most of these systems are managed by local government, and only function if water fees are subsidized.
An AMCOW Country Status Overview
25
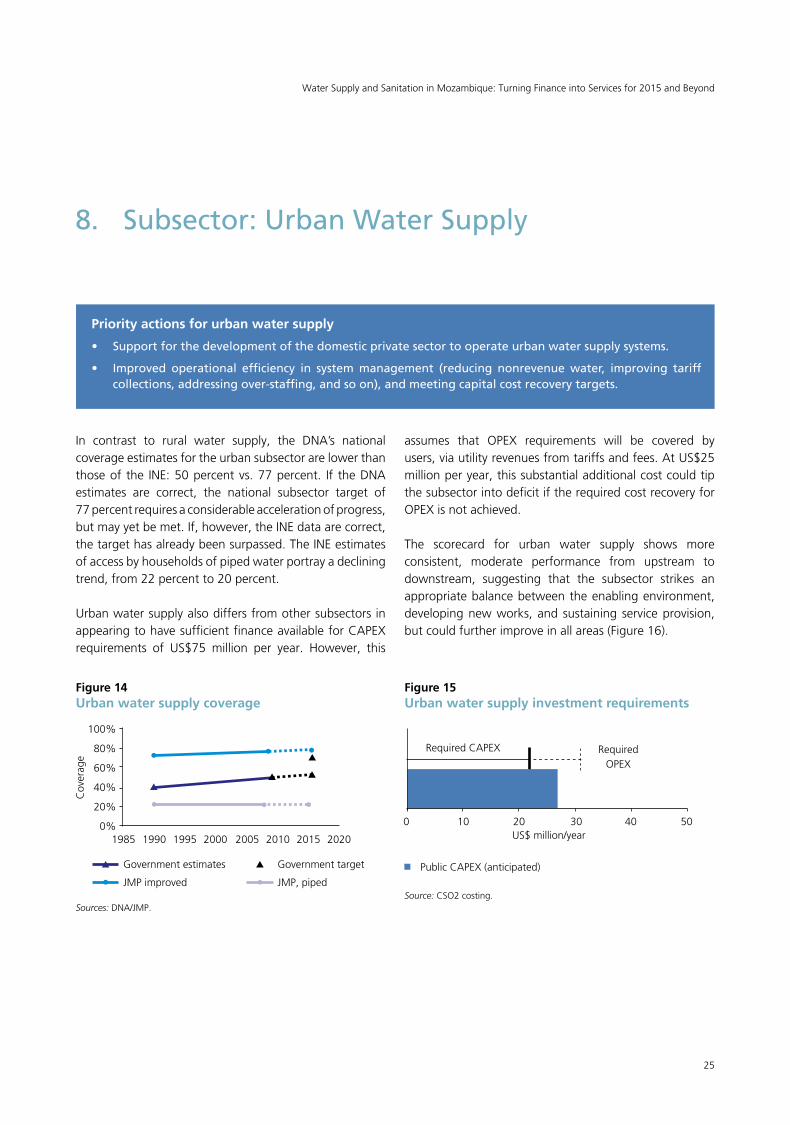
In contrast to rural water supply, the DNA’s national coverage estimates for the urban subsector are lower than those of the INE: 50 percent vs. 77 percent. If the DNA estimates are correct, the national subsector target of 77 percent requires a considerable acceleration of progress, but may yet be met. If, however, the INE data are correct, the target has already been surpassed. The INE estimates of access by households of piped water portray a declining trend, from 22 percent to 20 percent. Urban water supply also differs from other subsectors in appearing to have sufficient finance available for CAPEX requirements of US$75 million per year. However, this
8. Subsector:UrbanWaterSupply
Priority actions for urban water supply
• Supportforthedevelopmentofthedomesticprivatesectortooperateurbanwatersupplysystems.
• Improved operational efficiency in systemmanagement (reducing nonrevenuewater, improving tariffcollections,addressingover-staffing,andsoon),andmeetingcapitalcostrecoverytargets.
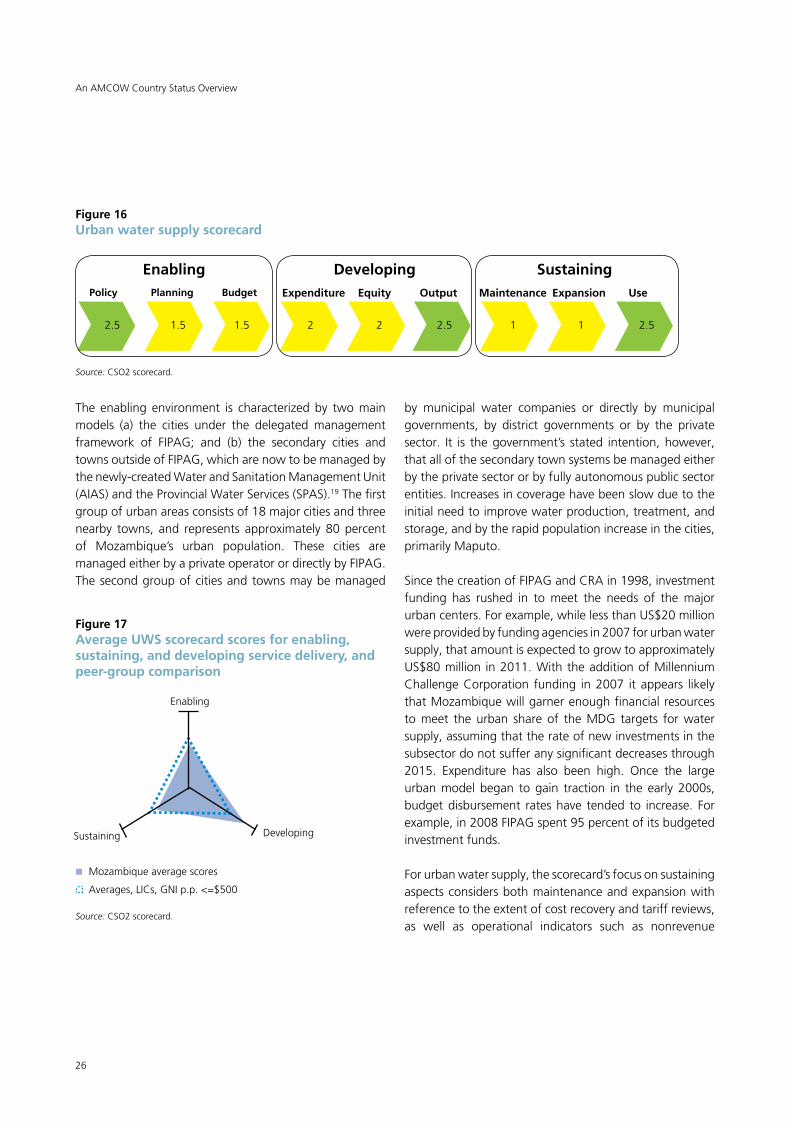
assumes that OPEX requirements will be covered by users, via utility revenues from tariffs and fees. At US$25 million per year, this substantial additional cost could tip the subsector into deficit if the required cost recovery for OPEX is not achieved. The scorecard for urban water supply shows more consistent, moderate performance from upstream to downstream, suggesting that the subsector strikes an appropriate balance between the enabling environment, developing new works, and sustaining service provision, butcouldfurtherimproveinallareas(Figure16).
Figure 14Urban water supply coverage
100%
80%
60%
40%
20%
0%1985 1990 1995 2000 2005 2010 2015 2020
Government estimates
JMP improved
Government target
JMP, piped
Sources: DNA/JMP.
Figure 15Urban water supply investment requirements
0 10 20 30 40 50
Required CAPEX Required OPEX
US$ million/year
Public CAPEX (anticipated)
Source: CSO2 costing.
WaterSupplyandSanitationinMozambique:TurningFinanceintoServicesfor2015andBeyondC
over
age
26
The enabling environment is characterized by two main models (a) the cities under the delegated management framework of FIPAG; and (b) the secondary cities andtownsoutsideofFIPAG,whicharenowtobemanagedbythe newly-created Water and Sanitation Management Unit (AIAS) and the Provincial Water Services (SPAS).19 The first group of urban areas consists of 18 major cities and three nearby towns, and represents approximately 80 percent of Mozambique’s urban population. These cities are managedeitherbyaprivateoperatorordirectlybyFIPAG.The second group of cities and towns may be managed
by municipal water companies or directly by municipal governments, by district governments or by the private sector. It is the government’s stated intention, however, that all of the secondary town systems be managed either by the private sector or by fully autonomous public sector entities. Increases in coverage have been slow due to the initial need to improve water production, treatment, and storage, and by the rapid population increase in the cities, primarily Maputo.
SincethecreationofFIPAGandCRAin1998,investmentfunding has rushed in to meet the needs of the major urbancenters.Forexample,whilelessthanUS$20millionwere provided by funding agencies in 2007 for urban water supply, that amount is expected to grow to approximately US$80 million in 2011. With the addition of Millennium Challenge Corporation funding in 2007 it appears likely that Mozambique will garner enough financial resources to meet the urban share of the MDG targets for water supply, assuming that the rate of new investments in the subsector do not suffer any significant decreases through 2015. Expenditure has also been high. Once the large urban model began to gain traction in the early 2000s, budgetdisbursement rateshave tended to increase. Forexample,in2008FIPAGspent95percentofitsbudgetedinvestment funds.
Forurbanwatersupply,thescorecard’sfocusonsustainingaspects considers both maintenance and expansion with reference to the extent of cost recovery and tariff reviews, as well as operational indicators such as nonrevenue
Figure 16Urban water supply scorecard
EnablingPolicy
2.5 1.5 1.5 2 2 2.5 1 1 2.5
Planning Budget Expenditure Equity Output Maintenance Expansion Use
Developing Sustaining
Source: CSO2 scorecard.
Figure 17Average UWS scorecard scores for enabling, sustaining, and developing service delivery, and peer-group comparison
Enabling
Mozambique average scores
Averages, LICs, GNI p.p. <=$500
Sustaining Developing
Source: CSO2 scorecard.
An AMCOW Country Status Overview
27
water. Operational performance has improved to the point where water is now available for more than 12 hours per day, and in some cities 24x7, for the first time in decades. Challenges lie ahead, however, as debt levels have increased to near unsustainable levels despite regular tariff increases, progress has been slow on increasing the number of households connected to the network, and little has yet been done to reduce the nearly 50 percent of nonrevenue water. The greatest concern is that if cost recovery through tariff collections continues to lag, it will put the debt servicing schedule in danger. However, as of2008, for thefirst time, thefive largest ‘FIPAG’citiesare on average generating 100 percent of the revenues needed to meet their operating costs,20 with some small amount available for investment.
Small-scale independent providers of water are believed to provide water to several hundred thousand people in Maputo via 37,000 house connections and a network of 325 standpipes. Even under the delegated management model their numbers have increased dramatically in recent years. According to a recent assessment by CRA of user preferences and satisfaction in Maputo, people prefer the service obtained from small-scale operators due to a mix of factors which includes more reliable supply, reduced travelandwaittimes,andeaseofpayment.CRA,FIPAG,and the Maputo Municipal Council are currently studying the best way of engaging small-scale providers in order to ensure that they provide safe water, and to determine how best to put their entrepreneurial talents to work to improve services.
WaterSupplyandSanitationinMozambique:TurningFinanceintoServicesfor2015andBeyond
28
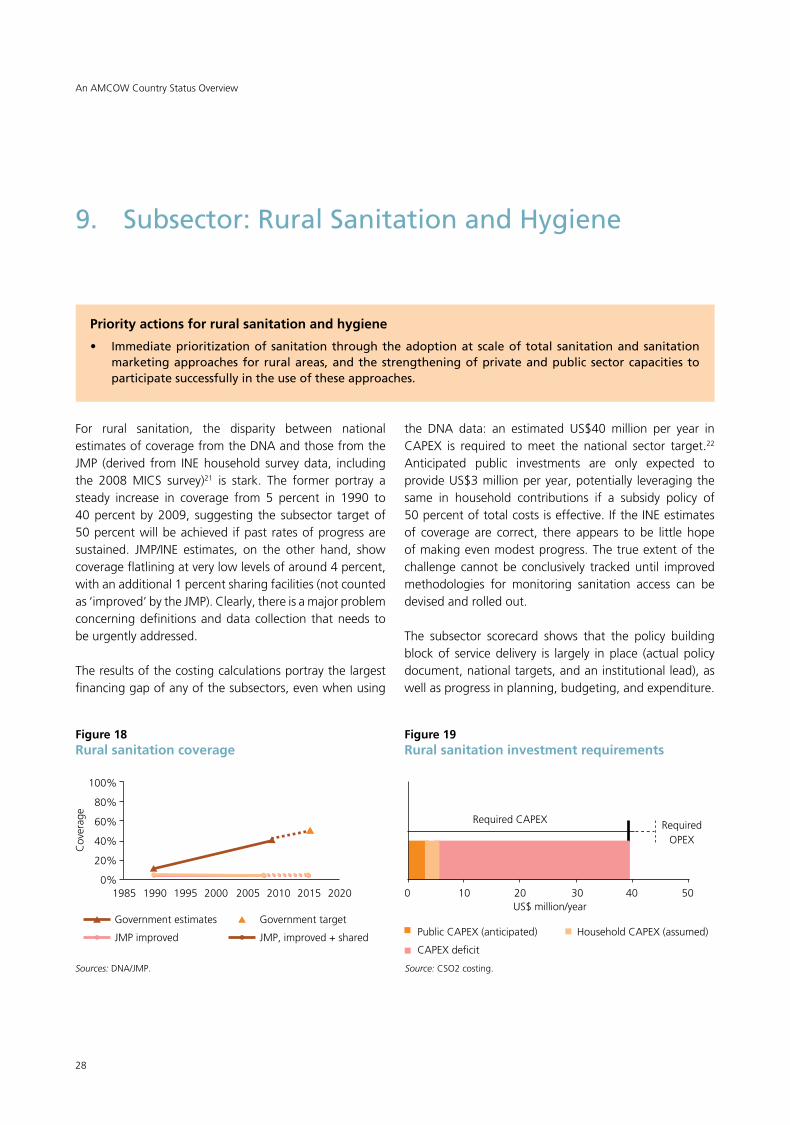
For rural sanitation, the disparity between nationalestimates of coverage from the DNA and those from the JMP (derived from INE household survey data, including the 2008 MICS survey)21 is stark. The former portray a steady increase in coverage from 5 percent in 1990 to 40 percent by 2009, suggesting the subsector target of 50 percent will be achieved if past rates of progress are sustained. JMP/INE estimates, on the other hand, show coverage flatlining at very low levels of around 4 percent, with an additional 1 percent sharing facilities (not counted as ‘improved’ by the JMP). Clearly, there is a major problem concerning definitions and data collection that needs to be urgently addressed.
The results of the costing calculations portray the largest financing gap of any of the subsectors, even when using
9. Subsector: Rural Sanitation and Hygiene
Priority actions for rural sanitation and hygiene
• Immediateprioritizationof sanitationthroughtheadoptionat scaleof total sanitationandsanitationmarketingapproaches for ruralareas,andthestrengtheningofprivateandpublic sectorcapacities toparticipatesuccessfullyintheuseoftheseapproaches.
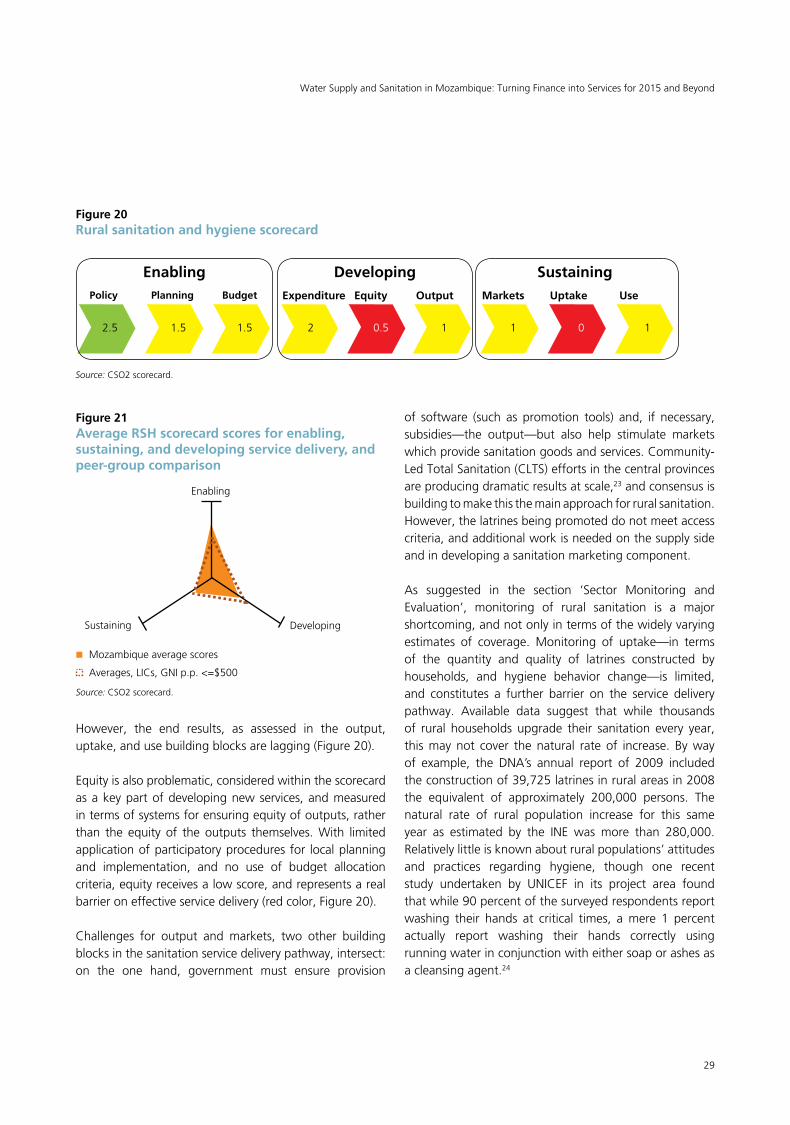
the DNA data: an estimated US$40 million per year in CAPEX is required to meet the national sector target.22 Anticipated public investments are only expected to provide US$3 million per year, potentially leveraging the same in household contributions if a subsidy policy of 50 percent of total costs is effective. If the INE estimates of coverage are correct, there appears to be little hope of making even modest progress. The true extent of the challenge cannot be conclusively tracked until improved methodologies for monitoring sanitation access can be devised and rolled out. The subsector scorecard shows that the policy building block of service delivery is largely in place (actual policy document, national targets, and an institutional lead), as well as progress in planning, budgeting, and expenditure.
Figure 19Rural sanitation investment requirements
0 10 20 30 40 50
Required CAPEX Required OPEX
US$ million/year
Public CAPEX (anticipated) Household CAPEX (assumed)
CAPEX deficit
Source: CSO2 costing.
An AMCOW Country Status Overview
Figure 18Rural sanitation coverage
100%
80%
60%
40%
20%
0%1985 1990 1995 2000 2005 2010 2015 2020
Government estimates
JMP improved
Government target
JMP, improved + shared
Sources: DNA/JMP.
Cov
erag
e
29
However, the end results, as assessed in the output, uptake, and use building blocks are lagging (Figure 20).
Equity is also problematic, considered within the scorecard as a key part of developing new services, and measured in terms of systems for ensuring equity of outputs, rather than the equity of the outputs themselves. With limited application of participatory procedures for local planning and implementation, and no use of budget allocation criteria, equity receives a low score, and represents a real barrier on effective service delivery (red color, Figure 20).
Challenges for output and markets, two other building blocks in the sanitation service delivery pathway, intersect: on the one hand, government must ensure provision
Figure 21Average RSH scorecard scores for enabling, sustaining, and developing service delivery, and peer-group comparison
of software (such as promotion tools) and, if necessary, subsidies—the output—but also help stimulate markets which provide sanitation goods and services. Community-Led Total Sanitation (CLTS) efforts in the central provinces are producing dramatic results at scale,23 and consensus is building to make this the main approach for rural sanitation. However, the latrines being promoted do not meet access criteria, and additional work is needed on the supply side and in developing a sanitation marketing component.
As suggested in the section ‘Sector Monitoring and Evaluation’, monitoring of rural sanitation is a major shortcoming, and not only in terms of the widely varying estimates of coverage. Monitoring of uptake—in terms of the quantity and quality of latrines constructed by households, and hygiene behavior change—is limited, and constitutes a further barrier on the service delivery pathway. Available data suggest that while thousands of rural households upgrade their sanitation every year, this may not cover the natural rate of increase. By way of example, the DNA’s annual report of 2009 included the construction of 39,725 latrines in rural areas in 2008 the equivalent of approximately 200,000 persons. The natural rate of rural population increase for this same year as estimated by the INE was more than 280,000. Relatively little is known about rural populations’ attitudes and practices regarding hygiene, though one recent study undertaken by UNICEF in its project area found that while 90 percent of the surveyed respondents report washing their hands at critical times, a mere 1 percent actually report washing their hands correctly using running water in conjunction with either soap or ashes as a cleansing agent.24
Figure 20Rural sanitation and hygiene scorecard
Enabling
Mozambique average scores
Averages, LICs, GNI p.p. <=$500
Sustaining Developing
Source: CSO2 scorecard.
EnablingPolicy
2.5 1.5 1.5 2 0.5 1 1 0 1
Planning Budget Expenditure Equity Output Markets Uptake Use
Developing Sustaining
Source: CSO2 scorecard.
Water Supply and Sanitation in Mozambique: Turning Finance into Services for 2015 and Beyond
30
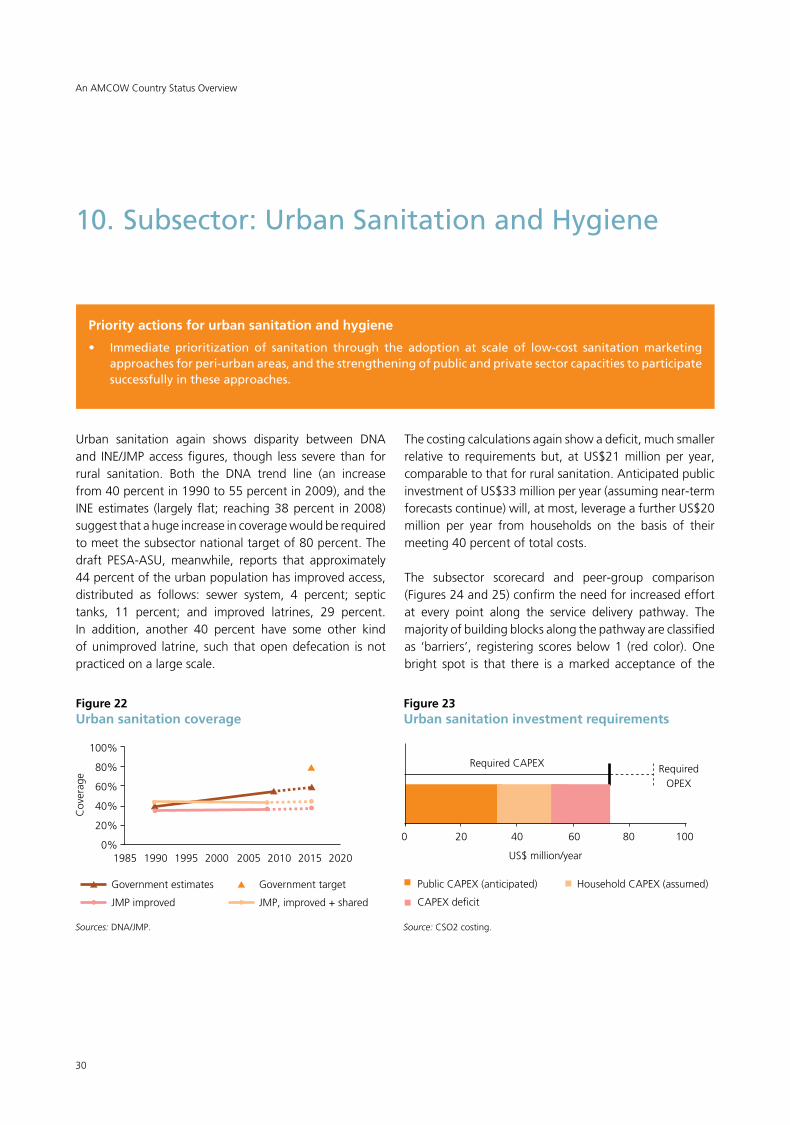
Urban sanitation again shows disparity between DNA and INE/JMP access figures, though less severe than for rural sanitation. Both the DNA trend line (an increasefrom 40 percent in 1990 to 55 percent in 2009), and the INE estimates (largely flat; reaching 38 percent in 2008) suggest that a huge increase in coverage would be required to meet the subsector national target of 80 percent. The draft PESA-ASU, meanwhile, reports that approximately 44 percent of the urban population has improved access, distributed as follows: sewer system, 4 percent; septic tanks, 11 percent; and improved latrines, 29 percent. In addition, another 40 percent have some other kind of unimproved latrine, such that open defecation is not practiced on a large scale.
10. Subsector: Urban Sanitation and Hygiene
Priority actions for urban sanitation and hygiene
• Immediate prioritization of sanitation through the adoption at scale of low-cost sanitationmarketingapproachesforperi-urbanareas,andthestrengtheningofpublicandprivatesectorcapacitiestoparticipatesuccessfullyintheseapproaches.
The costing calculations again show a deficit, much smaller relative to requirements but, at US$21 million per year, comparable to that for rural sanitation. Anticipated public investment of US$33 million per year (assuming near-term forecasts continue) will, at most, leverage a further US$20 million per year from households on the basis of their meeting 40 percent of total costs.
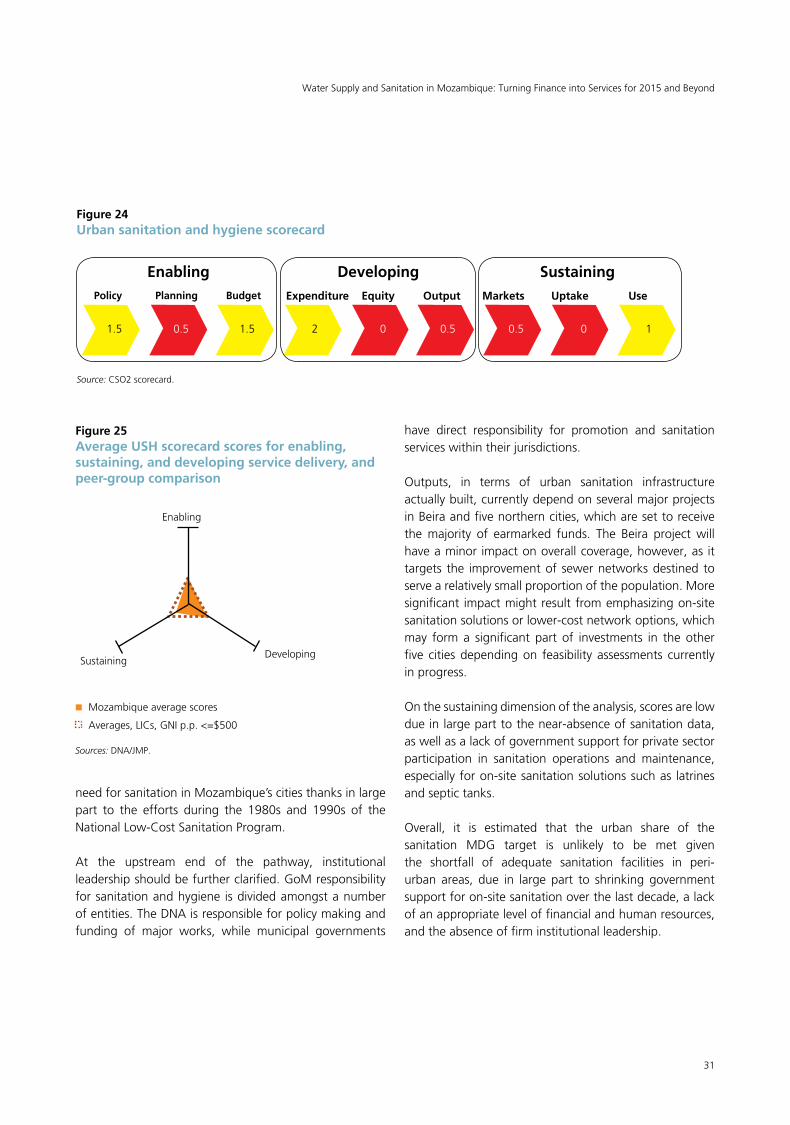
The subsector scorecard and peer-group comparison (Figures24and25)confirmtheneedforincreasedeffortat every point along the service delivery pathway. The majority of building blocks along the pathway are classified as ‘barriers’, registering scores below 1 (red color). One bright spot is that there is a marked acceptance of the
Figure 23Urban sanitation investment requirements
0 20 40 60 80 100
Required CAPEX Required OPEX
US$ million/year
Source: CSO2 costing.
An AMCOW Country Status Overview
Figure 22Urban sanitation coverage
100%
80%
60%
40%
20%
0%1985 1990 1995 2000 2005 2010 2015 2020
Government estimates
JMP improved
Government target
JMP, improved + shared
Sources: DNA/JMP.
Cov
erag
e
Public CAPEX (anticipated) Household CAPEX (assumed)
CAPEX deficit
31
need for sanitation in Mozambique’s cities thanks in large part to the efforts during the 1980s and 1990s of the National Low-Cost Sanitation Program.
At the upstream end of the pathway, institutional leadership should be further clarified. GoM responsibility for sanitation and hygiene is divided amongst a number of entities. The DNA is responsible for policy making and funding of major works, while municipal governments
have direct responsibility for promotion and sanitation services within their jurisdictions.
Outputs, in terms of urban sanitation infrastructure actually built, currently depend on several major projects in Beira and five northern cities, which are set to receive the majority of earmarked funds. The Beira project will have a minor impact on overall coverage, however, as it targets the improvement of sewer networks destined to serve a relatively small proportion of the population. More significant impact might result from emphasizing on-site sanitation solutions or lower-cost network options, which may form a significant part of investments in the other five cities depending on feasibility assessments currently in progress.
On the sustaining dimension of the analysis, scores are low due in large part to the near-absence of sanitation data, as well as a lack of government support for private sector participation in sanitation operations and maintenance, especially for on-site sanitation solutions such as latrines and septic tanks.
Overall, it is estimated that the urban share of the sanitation MDG target is unlikely to be met given the shortfall of adequate sanitation facilities in peri-urban areas, due in large part to shrinking government support for on-site sanitation over the last decade, a lack of an appropriate level of financial and human resources, and the absence of firm institutional leadership.
Figure 24Urban sanitation and hygiene scorecard
Figure 25Average USH scorecard scores for enabling, sustaining, and developing service delivery, and peer-group comparison
EnablingPolicy
1.5 0.5 1.5 2 0 0.5 0.5 0 1
Planning Budget Expenditure Equity Output Markets Uptake Use
Developing Sustaining
Enabling
Mozambique average scores
Averages, LICs, GNI p.p. <=$500
SustainingDeveloping
Sources: DNA/JMP.
Water Supply and Sanitation in Mozambique: Turning Finance into Services for 2015 and Beyond
Source: CSO2 scorecard.
32
1 GlobalEconomicMonitor,TheWorldBank.Exchangerate2010 average.
2 The first round of CSOs was carried out in 2006 covering 16 countries and is summarized in the report, ‘Getting Africa on Track to Meet the MDGs on Water and Sanitation’.
3 DirecçãoNacionaldeÁguas,MinistériodasObrasPúblicase Habitação. DNA/MOPH. 2009. Balanço do PlanoEconómico e Social 2008.
4 The most recent survey, the MICS, was completed in 2008 with the official summary report delivered in 2009 by the INE. The JMP uses linear regression of multiple household survey data points to produce its coverage estimates.
5 WHO/UNICEF Joint Monitoring Programme for WaterSupply and Sanitation. 2010. Progress on Sanitation and Drinking Water, 2010 Update.
6 DNA/MOPH. 2004, 2005, 2006, 2007, 2008, 2009. BalançodoPlanoEconómicoeSocial,2004,2005,2006,2007, 2008 and 2009.
7 World Bank. 2008. Mozambique Beating the Odds:Sustaining Inclusion in a Growing Economy; República de Moçambique. 2006 Auditoría ao Sector de Águas, Vol 1.
8 The CSO2 scorecard methodology and conceptual framework are discussed in detail in the synthesis report.
9 Scorecard indicators relating to the institutional framework section are as follows: All subsectors: targets in national development plans/PRSP; subsector policy agreed and approved (gazetted as part of national policy or as standalone policy); RWS/UWS: institutional roles defined; RSH/USH: institutional lead appointed.
10 Scorecard indicators relating to the section on financing and its implementation are as follows: All subsectors: programmatic Sector-Wide Approach; investment program based on MDG needs assessment; sufficient finance to meet MDGs (and subsidy policy in the case of sanitation); percent of official donor commitments utilized; percent of domestic commitments utilized.
11 WorldBank.2010.MozambiquePERfortheWaterSector(draft).WashingtonDC:WorldBank.
12 DNA/MOPH. 2007. Plano Estratégico de Água eSaneamento Rural—Documento Final, and its urbancounterpart, the PESA-ASU.
NotesandReferences
13 Santos, C. 2009. Análise do Relatório de Execução do Orçamento do Estado do 2008 Sector de Águas.
14 DNA/MOPH. 2008. Relatório da Execução Orçamental Ano 2007.
15 Scorecard indicators relating to the sector monitoring and evaluation section are as follows: All subsectors: annual review setting new undertakings; subsector spend identifiable in budget (UWS: inc. recurrent subsidies); budget comprehensively covers domestic/donor finance; RWS, RSH, and USH: domestic/donor expenditure reported; UWS: audited accounts and balance sheets from utilities; RWS, RSH, and USH: periodic analysis of equity criteria by CSOs and government; UWS: pro-poor plans developed and implemented by utilities; RWS/UWS: nationally consolidated reporting of output; RSH/USH: monitoring of quantity and quality of uptake relative to promotion and subsidy efforts; all subsectors: questions and choice options in household surveys consistent with MDG definitions.
16 WorldBank.2010.MozambiquePERfortheWaterSector(draft).WashingtonDC:WorldBank.
17 Hydroconseil. 2008. Evaluation and Characterization of Service Quality: Quality of Service Report.
18 DNA/MOPH. 2007. Plano Estratégico de Água eSaneamentoRural-DocumentoFinal.
19 World Bank. 2007. Project Appraisal Document, WaterServices and Institutional Support Project.
20 Mugabi, J. 2009. Water Operators Partnerships, Africa Utility Performance Assessment.
21 INE. 2009. Mozambique Multiple Indicator Cluster Survey Summary.
22 The CSO2 investment requirement estimates do not include the cost of hygiene promotion and other software activities, relative to the targets, due to the difficulty of estimating such costs on a per capita basis.
23 Godfrey, A. 2009. Preliminary Documentation and Evaluation of the Sanitation Component of the “One Million Initiative”.
24 WEConsult/UNICEF.2009.Water,SanitationandHygiene.Findingsofahouseholdsurveyconductedin18districtsofMozambique.
An AMCOW Country Status Overview
The first round of Country Status Overviews (CSO1) published in 2006 benchmarked the preparedness of sectors of 16 countries in Africa to meet the WSS MDGs based on their medium-term spending plans and a set of ‘success factors’ selected from regional experience. Combined with a process of national stakeholder consultation, this prompted countries to ask whether they had those ‘success factors’ in place and, if not, whether they should put them in place.
The second round of Country Status Overviews (CSO2) has built on both the method and the process developed in CSO1. The ‘success factors’ have been supplemented with additional factors drawn from country and regional analysis to develop the CSO2 scorecard. Together these reflect the essential steps, functions and results in translating finance into services through government systems—in line with Paris Principles for aid effectiveness. The data and summary assessments have been drawn from local data sources and compared with internationally reported data, and, wherever possible, the assessments have been subject to broad-based consultations with lead government agencies and country sector stakeholders, including donor institutions.
This second set of 32 Country Status Overviews (CSO2) on water supply and sanitation was commissioned by the African Ministers’ Council on Water (AMCOW). Development of the CSO2 was led by the World Bank administered Water and Sanitation Program (WSP) in collaboration with the African Development Bank (AfDB), the United Nations Children’s Fund (UNICEF), the World Bank and the World Health Organization (WHO).
This report was produced in collaboration with the Government of Mozambique and other stakeholders during 2009/10. Some sources cited may be informal documents that are not readily available.
The findings, interpretations, and conclusions expressed in this volume do not necessarily reflect the views of the collaborating institutions, their Executive Directors, or the governments they represent. The collaborating institutions do not guarantee the accuracy of the data included in this work. The boundaries, colors, denominations, and other information shown on any map in this work do not imply any judgment on the part of the collaborating institutions concerning the legal status of any territory or the endorsement or acceptance of such boundaries.
The material in this publication is copyrighted. Requests for permission to reproduce portions of it should be sent to [email protected]. The collaborating institutions encourage the dissemination of this work and will normally grant permission promptly. For more information, please visit www.amcow.net or www.wsp.org
Photograph credits: Joseph Narkevic Cover photograph by Luis Macario
© 2011 Water and Sanitation Program

For enquiries, contact:Water and Sanitation Program–Africa RegionThe World Bank, Upper Hill RoadP.O. Box 30577, 00100, Nairobi, KenyaTel: +(254) 20 322 6300 E-mail: [email protected] site: www.wsp.org
An AMCOW Country Status Overview
Water Supply and Sanitation in MozambiqueTurning Finance into Services for 2015 and Beyond
Related Documents