#WATEFCON 2018 Water Efficiency Conference 5-7 September 2018 University of Aveiro, Portugal Water Supply and Distribution Systems - Solving vs Mending: Following the Trail of Money Rui Silva Santos / Miguel Zilhão RSS PORTUGAL #WATEFCon 2018

Welcome message from author
This document is posted to help you gain knowledge. Please leave a comment to let me know what you think about it! Share it to your friends and learn new things together.
Transcript

#WATEFCON 2018
Water Efficiency Conference5-7 September 2018University of Aveiro, Portugal
Water Supply and
Distribution Systems -
Solving vs Mending:
Following the Trail of
Money
Rui Silva Santos / Miguel ZilhãoRSS PORTUGAL
#WATEFCon 2018

Infrastructuresare
deteriorating…
Populationis growing…
“We do not inherited the Earth from our ancestors; we borrow it from our children.”
Native American Proverb
#WATEFCon 2018
€
€
€
WaterResources
are lacking…
Money isbecoming
more expensive
…
Climate isChanging…
… andscarcer
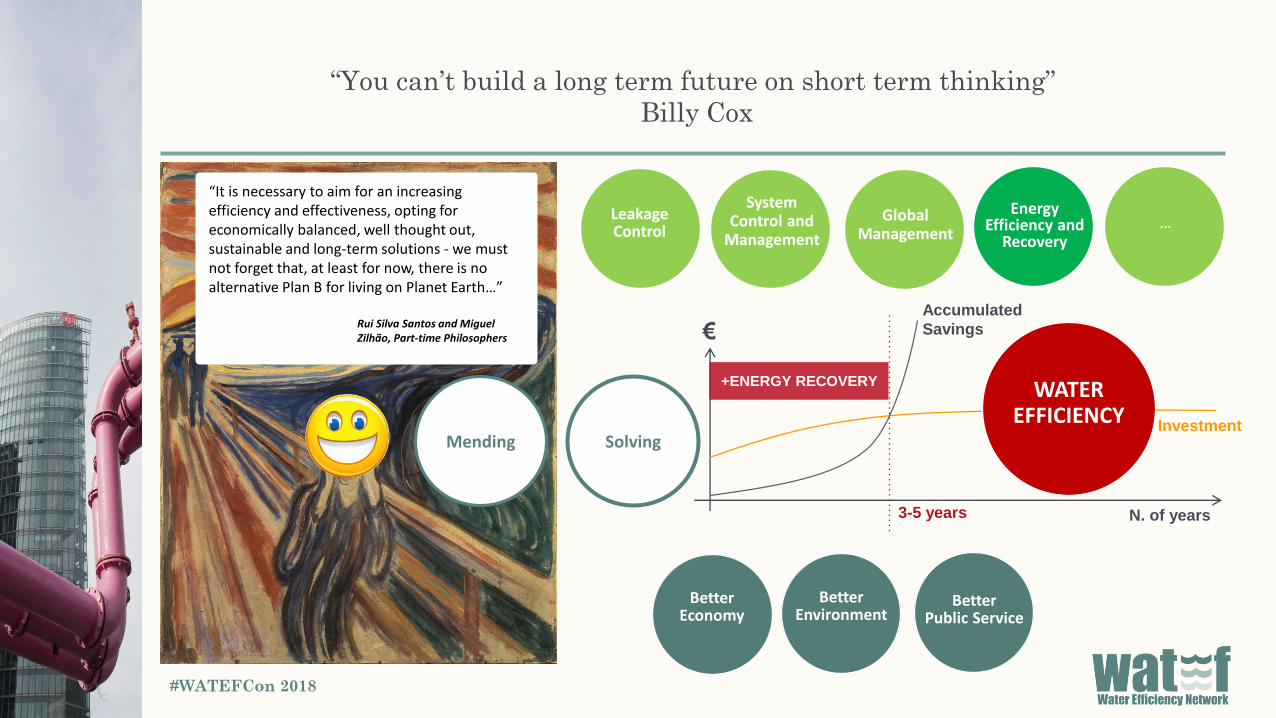
Accumulated
Savings
N. of years3-5 years
Investment
€
“You can’t build a long term future on short term thinking”
Billy Cox
#WATEFCon 2018
BetterEconomy
BetterEnvironment
BetterPublic Service
Solving
LeakageControl
Energy Efficiency and
Recovery
SystemControl and
Management
Global Management
…
WATER EFFICIENCY
Mending
“It is necessary to aim for an increasing efficiency and effectiveness, opting for economically balanced, well thought out, sustainable and long-term solutions - we must not forget that, at least for now, there is no alternative Plan B for living on Planet Earth…”
+ENERGY RECOVERY
Rui Silva Santos and Miguel Zilhão, Part-time Philosophers
o HYDRAULIC ERRORS / MALFUNCTIONING
o BAD HYDRAULIC OPERATION
o LACK OF NETWORK REHABILITION
o DMA INEXISTANCE
o LOW SYSTEM CONTROL
o REDUCED INVESTMENT
o ENVIRONMENTAL AND ECONOMIC PROBLEM
o WATER OF WATER RESOURCES
#WATEFCon 2018
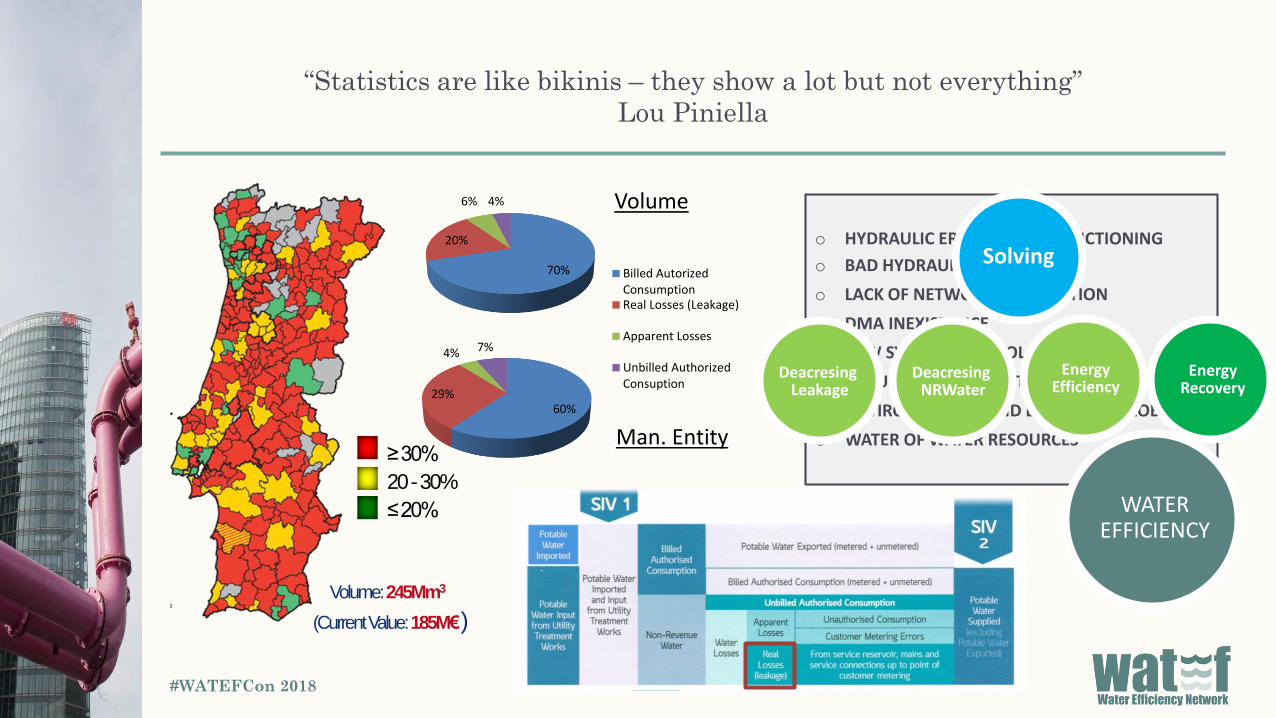
60%29%
4% 7%
70%
20%
6% 4%
Billed AutorizedConsumptionReal Losses (Leakage)
Apparent Losses
Unbilled AuthorizedConsuption
Volume
Man. Entity
Solving
DeacresingLeakage
DeacresingNRWater
Energy Recovery
WATER EFFICIENCY
Energy Efficiency
≥ 30%
20 -30%
≤ 20%
(Current Value:185M€)
Volume:245Mm3
“Statistics are like bikinis – they show a lot but not everything”
Lou Piniella
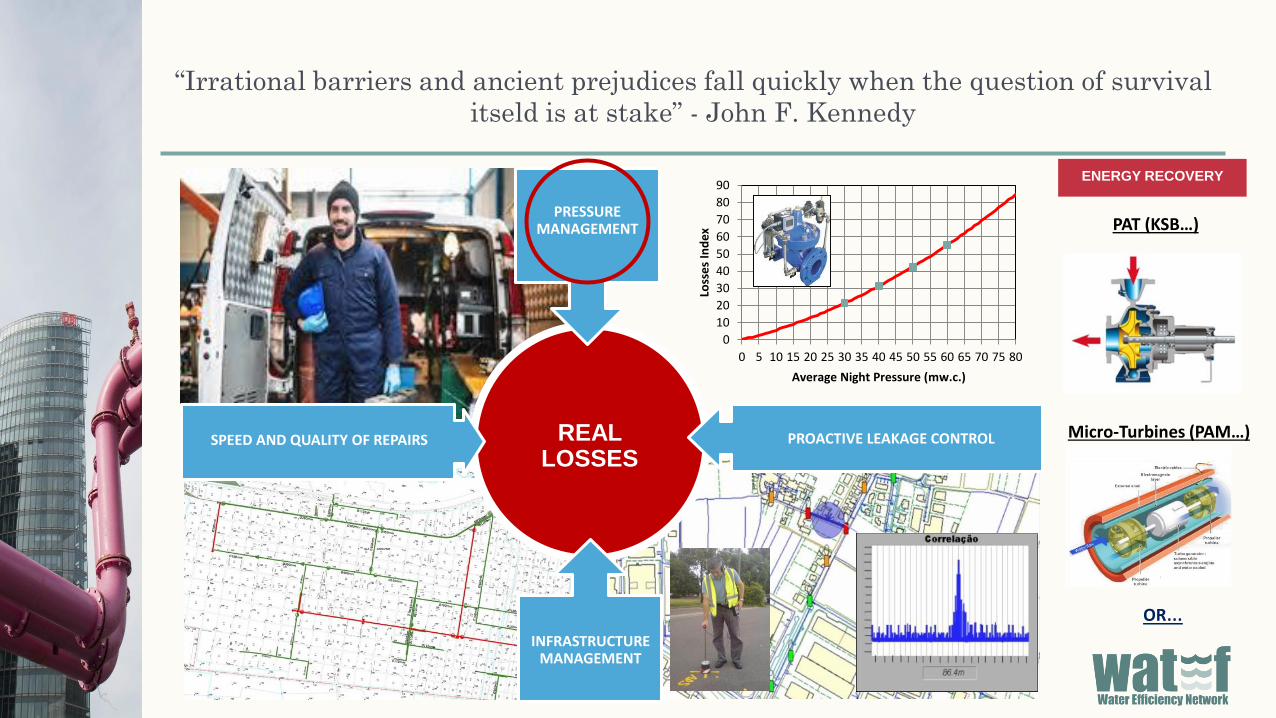
REAL LOSSES
PRESSURE MANAGEMENT
PROACTIVE LEAKAGE CONTROLSPEED AND QUALITY OF REPAIRS
INFRASTRUCTURE MANAGEMENT
0
10
20
30
40
50
60
70
80
90
0 5 10 15 20 25 30 35 40 45 50 55 60 65 70 75 80
Loss
es
Ind
ex
Average Night Pressure (mw.c.)
ENERGY RECOVERY
PAT (KSB…)
Micro-Turbines (PAM…)
OR…
“Irrational barriers and ancient prejudices fall quickly when the question of survival
itseld is at stake” - John F. Kennedy

#WATEFCon 2018
WATER SECTOR BARRIERSWATER SECTOR
BARRIERS
POLITICAL
INSUFFICIENT STAFF
AVAILABLE INFORMATION
HYDRAULIC MODELLING
CLIENT INFORMATION
SYSTEM
WATER UTILITY REGISTRATION
(GIS)
HUMAN RESOURCES
AVAILABILITY
TECHNICAL
MARKETS
SOCIAL
KNOW-HOW
ECONOMICAL > Fatalism
“In this world nothing can be said to be certain, except death and taxes”
Benjamin Franklin
MY GRANDMA IS ALWAYS DRUNKMY FATHER HITS ME IN THE FACEMY LIFE WILL ALWAYS BE LIKE THISA FATAL AND INEVITABLE DISGRACE
FOI E SERÁ SEMPRE ASSIMNÃO SEI MAIS O QUE FAÇAPOBRE, POBRE DE MIMVIVENDO NESTA DESGRAÇA!

Pmed=4,0bar
Pmed=5,5bar
Re duç ã o CMD
(m3 /dia )8 176% 14
Re duç ã o CMN
(m3 /dia )R^2= -0,05
AA0 0 9Re duç ã o
CMN/CMD Delay2 2 6 0,5 03 3 0 pp
Médias(m3/dia) (m3/hora)
CMN / CMD
(%)0
últ. 7 dias 2.383 28,4 28,6% 1 0,28408464
últ. 28 dias 2.312 27,2 28,2% D CMN
últ. 56 dias 2.252 31,5 33,5% 193 €
Ano anterior (7 dias antes de 2/5) 2.383 26,3 26,5%
Ano anterior (28 dias antes de 6/5) 2.320 27,8 28,7%
Ano anterior (56 dias antes de 11/5) 2.318 29,3 30,4% 59.964
28- 4- 15
27- 4- 15
26- 4- 15
25- 4- 15
24- 4- 15
23- 4- 15
22- 4- 15
21- 4- 15
20- 4- 15
19- 4- 15
18- 4- 15
17- 4- 15
16- 4- 15
15- 4- 15
14- 4- 15
13- 4- 15
12- 4- 15
11- 4- 15
10- 4- 15
9- 4- 15
8- 4- 15
7- 4- 15
6- 4- 15
5- 4- 15
4- 4- 15
3- 4- 15
2- 4- 15
1- 4- 15
31- 3- 15
30- 3- 15
29- 3- 15
28- 3- 15
Avarias Rede últ 7 dias (C+R) (#) CMN / CMD (%) Total avarias det. PF últ 7 dias (#)Pesq. Fugas (PF) últ 7 dias (% rede)
Ca uda l Diá rio
(m3 /dia )
Selecção DGE
PG1.1+PG1.2+PG1.3/P. Gordo - Caudal Distribuição S. João Galiza
Comprime nto
Conduta s (ml)
0%
100%
200%
300%
0
500
1.000
1.500
2.000
2.500
3.000
3.500
4.000
5-2-
14
5-3-
14
5-4-
14
5-5-
14
5-6-
14
5-7-
14
5-8-
14
5-9-
14
5-10
-14
5-11
-14
5-12
-14
5-1-
15
5-2-
15
5-3-
15
5-4-
15
5-5-
15
y = -0,059x + 889,3R² = 0,0026
0
500
1.000
1.500
1 1.001 2.001 3.001 4.001
0
2
4
6
8
10
12
14
0%
10%
20%
30%
40%
50%
60%
70%
80%
90%
100%
5-2-
14
5-3-
14
5-4-
14
5-5-
14
5-6-
14
5-7-
14
5-8-
14
5-9-
14
5-10
-14
5-11
-14
5-12
-14
5-1-
15
5-2-
15
5-3-
15
5-4-
15
5-5-
15
Re duç ã o CMD
(m3 /dia )#N/D #N/D #N/D
Re duç ã o CMN
(m3 /dia )R^2= 0,22
AA0 0 9Re duç ã o
CMN/CMD Delay2 2 6 #N/D 0C_ 10 3 4 pp
Médias(m3/dia) (m3/hora)
CMN / CMD
(%)0
últ. 7 dias 1.264 15,0 28,5% -2 0,29557391
últ. 28 dias 1.183 15,3 31,1% D CMN
últ. 56 dias 1.172 17,7 36,3% # N/D
Ano anterior (7 dias antes de 7/11) 1 0,0 0,0%
#N/D #N/D #N/D #N/D
Ano anterior (56 dias antes de 11/5) 0 0,0 0,0% 30.950
28- 4- 15
27- 4- 15
26- 4- 15
25- 4- 15
24- 4- 15
23- 4- 15
22- 4- 15
21- 4- 15
20- 4- 15
19- 4- 15
18- 4- 15
17- 4- 15
16- 4- 15
15- 4- 15
14- 4- 15
13- 4- 15
12- 4- 15
11- 4- 15
10- 4- 15
9- 4- 15
8- 4- 15
7- 4- 15
6- 4- 15
5- 4- 15
4- 4- 15
3- 4- 15
2- 4- 15
1- 4- 15
31- 3- 15
30- 3- 15
29- 3- 15
28- 3- 15
Avarias Rede últ 7 dias (C+R) (#) CMN / CMD (%) Total avarias det. PF últ 7 dias (#)Pesq. Fugas (PF) últ 7 dias (% rede)
Ca uda l Diá rio
(m3 /dia )
Selecção DGE
PG1.1+PG1.2+PG1.3/P. Gordo - Caudal Distribuição S. João Galiza
PG1.2
Comprime nto
Conduta s (ml)
0%
100%
200%
300%
0
200
400
600
800
1.000
1.200
1.400
1.600
5-2-
14
5-3-
14
5-4-
14
5-5-
14
5-6-
14
5-7-
14
5-8-
14
5-9-
14
5-10
-14
5-11
-14
5-12
-14
5-1-
15
5-2-
15
5-3-
15
5-4-
15
5-5-
15
y = 0,2415x + 134,04R² = 0,04920
200
400
600
800
1 501 1.001 1.501 2.001
0
0
0
0
0
1
1
1
1
1
1
0%
10%
20%
30%
40%
50%
60%
70%
80%
5-2-
14
5-3-
14
5-4-
14
5-5-
14
5-6-
14
5-7-
14
5-8-
14
5-9-
14
5-10
-14
5-11
-14
5-12
-14
5-1-
15
5-2-
15
5-3-
15
5-4-
15
5-5-
15
Pipe Bursts << (0…)
Nocturnal Consump. < Water Losses <
#WATEFCon 2018
“A pessimist sees the difficulty in every opportunity; an optimist sees the
opportunity in every difficulty” – Winston Churchill
In WSS
In WDS

#WATEFCon 2018
Water Supply Systems (WSS)
Water Distribution Systems (WDS)
2. How?
3. Potential
EnergyRecoveryAnalysis
1. Where?
o Pressure Restrictions (Max and Min).
o The total consumptions is divided in the network.
o Variables such as the Consumers’ Demand and the
decreasing of losses increase the complexity of the
analysis.
1. Where?o Less Pressure restrictions.
o The total consumption is turbinated.
o Constant (or zero) flow.
o In WSS it is imperative to have a regulation equipment,
being a Control Valve or a Micro-Hydropower
Technology (MHP). Why not choose the latter?
“Setting goals is the first step in turning the invisible into the visible”
Tony Robbins

MHPo NR Mode
o Fixed Optimized Rotational Speed
o Variable Rotational Speed
#WATEFCon 2018
o Non – Regulation (NR) Mode
o Electric – Regulation (ER) Mode
In WDS
MHP
MHP
o Use the Micro-HydropowerTechnology (MHP) Nominal Speed
OR
In WSS
o The ER Mode optimized witha Fixed Rotational Speed sincethe flow in WSS is constant (orzero).
2. How?
MHP
“At its heart, engineering is about using science to find creative, practical solutions”
Queen Elizabeth II
o Important to highlight that theflow is constant through time, what varies is only theoperational time

#WATEFCon 2018
In WDS
ER Cost
NR Cost
TR08B
TR07.5F
SM04.5B
TR05.5G
ER Cost
NR Cost
TR08B
TR07.5F
SM04.5B
TR05.5G
Differential Cost between implementing MHP technology and a pressure reduction equipment withall accessories.
ER Cost
NR Cost
TR08B
TR07.5F
SM04.5B
TR05.5G
ER Cost
NR Cost
4 years2 years
3. Potential
EnergyRecoveryAnalysis
𝑯𝒐𝒑𝒕 = ∆𝑧 −∆𝑧
1 +1𝑐
≈𝟐
𝟑∆𝒛
50 10 2 to 3
(𝑄 ∗ 𝐻)𝑀𝑎𝑥
(c = 0.54)
“Nothing is less productive than to make more efficient what should not be done at
all” – Peter Drucker
Q = 𝑎𝐷𝑏𝐽𝑐
∆𝐻 = 𝐽 ∗ 𝐿
𝐻 = ∆𝑧 − ∆𝐻
2 787 MWh
5 years In WSS
~ 600MWh per year

#WATEFCon 2018
0
200
400
600
800
1,000
1,200
700 1100 1500 1900 2300 2700 3100 3500
Ene
rgy
(MW
.h)
N (rpm)
100-200
80-200
65-200
65-250
150-200
0
10
20
30
40
50
60
70
2018 2020 2022 2024 2026 2028 2030 2032
Ene
rgy
(MW
.h)
Year
DifferentsPAT
MHP (PAT) SELECTION and OPTIMAL ROTATIONAL (FIXED OR VARIABLE) SPEED SOFTWARE (EXAMPLE)
# PAT N(rpm) Emax (MW.h)
1 100-200 1310 1005,0
2 80-200 1270 719,3
3 65-200 1225 440,7
4 65-250 1070 367,2
5 150-200 970 310,0
ER Mode - Fixed Optimized RotationalSpeed
NR Mode
Comparision of the Regulation Modes
ER Mode - Variable Rotational Speed
ER Mode - Fixed Rotational Speed
NR Mode
PATNR
ER - Fixed OptimizedN ER - Variable N
N (rpm)
Etot(MW.h)
N (rpm)Etot
(MW.h)N (rpm)
Etot(MW.h)
100-200 1510 971,1 1310 1005,0 Variable 1013,7
80-200 1520 668,1 1270 719,3 Variable 742,3
65-200 1525 391,3 1225 440,7 Variable 440,7
65-250 1520 64,0 1070 367,2 Variable 367,2
150-200 1520 175,0 970 310,0 Variable 346,70
10
20
30
40
50
60
70
2018 2020 2022 2024 2026 2028 2030 2032
Ene
rgy
(MW
.h)
Year
“I never guess. It is a shocking habit destructive to the logical faculty”
Arthur Conan Doyle
NR
ER - Fixed Optimized N
ER - Variable N
900.0
950.0
1000.0
1050.0
PAT 100-200 for TR08B
SHRLOC
ELECTOR
MICRO YDROPOWER
EGULATION
OWERING
PERATIONAL
OSTS
#WATEFCon 2018
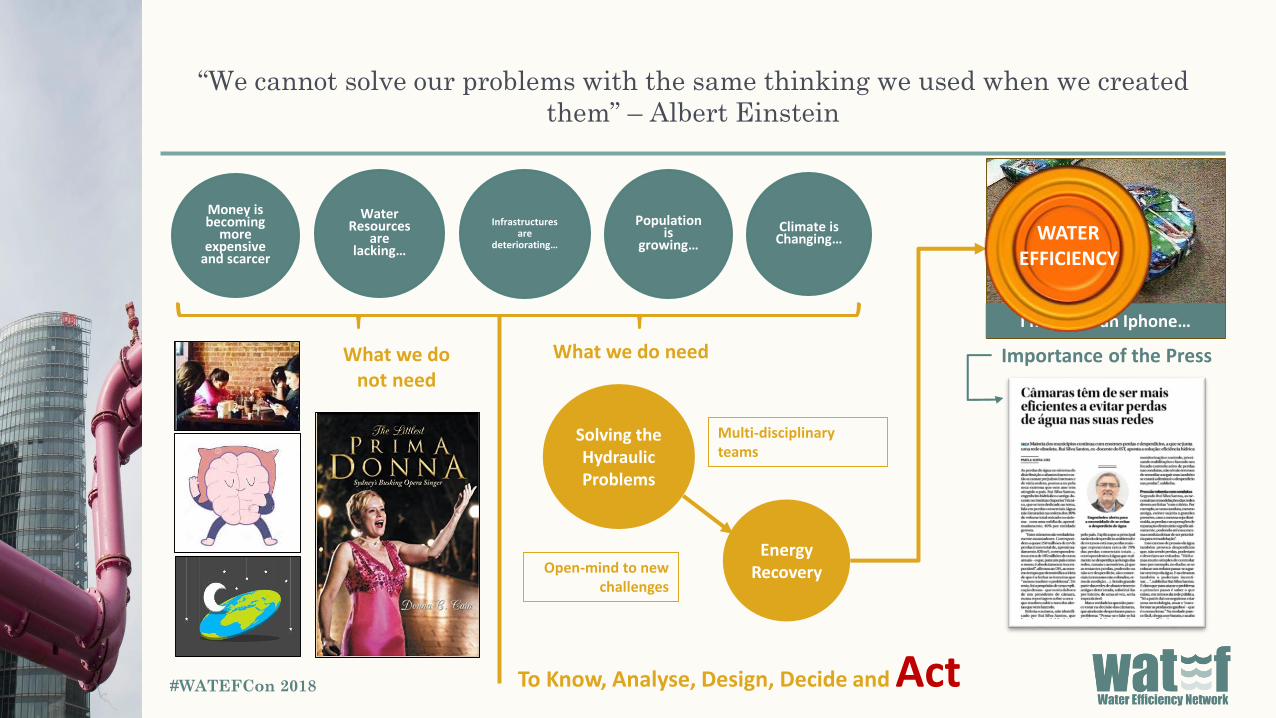
“We cannot solve our problems with the same thinking we used when we created
them” – Albert Einstein
Infrastructuresare
deteriorating…
Populationis
growing…
WaterResources
are lacking…
Money isbecoming
more expensive
and scarcer
Climate isChanging…
To Know, Analyse, Design, Decide and Act
Importance of the Press
I hope it’s an Iphone…
Solving theHydraulicProblems
EnergyRecovery
What we do not need
What we do need
Multi-disciplinaryteams
Open-mind to newchallenges
WATER EFFICIENCY

Thank you for your attention
#WATEFCon 2018
Obrigado pela vossa atenção
Rui Silva Santos
Miguel Zilhão
Related Documents