Kirk-Othmer Encyclopedia of Chemical Technology. Copyright c John Wiley & Sons, Inc. All rights reserved. WATER, SUPPLY AND DESALINATION Of the surface of the earth, 71% ( 3.60 × 10 8 km 2 ) is covered by oceans; their average depth is 6 km and their volume is 8.54 × 10 8 km 3 . Unfortunately, this huge quantity of water is not suitable for very many human uses. Water with over 1000 ppm (parts per million by weight, or mg/L) salt is usually considered unfit for human consumption, and water with over 500 ppm is considered undesirable, but in some parts of the world, people and land animals are forced to survive with much higher concentrations of salts, sometimes of over 2500 ppm. Freshwater with less than 500 ppm (or 0.05%) dissolved solids is generally considered to be potable. Rain is the source of freshwater, and its precipitation of >1.3 × 10 12 m 3 /d over the earth’s surface averages about 1.05 m (depth) per year. Extremes range from almost zero in North Chile’s desert bordering the Pacific Coast to > 25.4 m in some tropical forests and on some high slopes where the high, cold mountains condense floods from the clouds. Even rain is not pure water. Reports from the U.S. Geological Survey show that it contains 2.3–4.6 ppm of solids, or a yearly precipitation of 2.5–5 t/km 2 . Recently (ca 1997), work conducted in the United States and Europe has underscored the rather dangerous results of increased use of fossil fuels, where the SO x and NO x emissions that end up in the rain lower its pH from 5.6 (slightly acidic) for uncontaminated rain, to <pH4 for acid rains. Such acid rain has serious effects on surface waters (1). About 40 × 10 6 t of SO x and 25 × 10 6 t of NO x were emitted in the United States in 1980. There are, however, encouraging trends: the 1970 Clean Air Act has led to a gradual reduction in these emissions, bringing the SO x emissions down from the previous levels cited by 10% by 1990, and the NO x emissions down by 6%, with a consequent slight decrease in rain acidity. A part of the Clean Air Act is also intended to cap SO x emissions from major point sources at 13.5 × 10 6 t (2). Between 1994 and 1995, total SO x emissions in the U.S. decreased remarkably by 13%; and total NO x emissions by 8%. About 60% of the land area of the earth is arid or semiarid and is not generally considered habitable. Mountainous areas and the polar areas covered by ice must be subtracted from the remainder to arrive at a land area that can be counted as available for human habitation and agriculture. Of this small fraction remaining, certain preferred land areas support the expanding world population more generously; hence, increasingly large amounts of the better lands are used for living, ie, for urban areas, industries, roads, airfields, etc. Areas for living and industry usually also require much more water per unit than do farm lands. Thus, as population and industry increase and the resulting demands for water multiply, agricultural areas with adequate water tend to become smaller. The oceans hold about 97% of the earth’s water. More than 2% of the total water and over 75% of the freshwater of the world is locked up as ice in the polar caps. Of the remaining 1% of total water that is both liquid and fresh, some is groundwater at depths of 300 m and therefore impractical to obtain, and only the very small difference, possibly 0.06% of the total water of this planet, is available for human use as it cycles from sea to atmosphere to land to sea. Only recently have humans been able to regulate that cycle to their advantage, and even now (ca 1997), only infinitesimally, in some few isolated places. Wells produce groundwater, stored from previous rains. However, the fact that in recent years wells have had to be made deeper and deeper to reach water shows that groundwater is being used faster than it is being 1

Welcome message from author
This document is posted to help you gain knowledge. Please leave a comment to let me know what you think about it! Share it to your friends and learn new things together.
Transcript
Kirk-Othmer Encyclopedia of Chemical Technology.Copyright c© John Wiley & Sons, Inc. All rights reserved.
WATER, SUPPLY AND DESALINATION
Of the surface of the earth, 71% (3.60 × 10⁸ km2 ) is covered by oceans; their average depth is 6 km and theirvolume is 8.54 × 10⁸ km3 . Unfortunately, this huge quantity of water is not suitable for very many human uses.Water with over 1000 ppm (parts per million by weight, or mg/L) salt is usually considered unfit for humanconsumption, and water with over 500 ppm is considered undesirable, but in some parts of the world, peopleand land animals are forced to survive with much higher concentrations of salts, sometimes of over 2500 ppm.
Freshwater with less than 500 ppm (or 0.05%) dissolved solids is generally considered to be potable. Rainis the source of freshwater, and its precipitation of >1.3 × 10¹² m3/d over the earth’s surface averages about1.05 m (depth) per year. Extremes range from almost zero in North Chile’s desert bordering the Pacific Coastto > 25.4 m in some tropical forests and on some high slopes where the high, cold mountains condense floodsfrom the clouds.
Even rain is not pure water. Reports from the U.S. Geological Survey show that it contains 2.3–4.6 ppmof solids, or a yearly precipitation of 2.5–5 t/km2. Recently (ca 1997), work conducted in the United States andEurope has underscored the rather dangerous results of increased use of fossil fuels, where the SOx and NOxemissions that end up in the rain lower its pH from 5.6 (slightly acidic) for uncontaminated rain, to <pH4 foracid rains. Such acid rain has serious effects on surface waters (1). About 40 × 106 t of SOx and 25 × 106 t ofNOx were emitted in the United States in 1980. There are, however, encouraging trends: the 1970 Clean AirAct has led to a gradual reduction in these emissions, bringing the SOx emissions down from the previous levelscited by 10% by 1990, and the NOx emissions down by 6%, with a consequent slight decrease in rain acidity.A part of the Clean Air Act is also intended to cap SOx emissions from major point sources at 13.5 × 10⁶ t (2).Between 1994 and 1995, total SOx emissions in the U.S. decreased remarkably by 13%; and total NOx emissionsby 8%.
About 60% of the land area of the earth is arid or semiarid and is not generally considered habitable.Mountainous areas and the polar areas covered by ice must be subtracted from the remainder to arrive at a landarea that can be counted as available for human habitation and agriculture. Of this small fraction remaining,certain preferred land areas support the expanding world population more generously; hence, increasinglylarge amounts of the better lands are used for living, ie, for urban areas, industries, roads, airfields, etc. Areasfor living and industry usually also require much more water per unit than do farm lands. Thus, as populationand industry increase and the resulting demands for water multiply, agricultural areas with adequate watertend to become smaller.
The oceans hold about 97% of the earth’s water. More than 2% of the total water and over 75% of thefreshwater of the world is locked up as ice in the polar caps. Of the remaining 1% of total water that is bothliquid and fresh, some is groundwater at depths of 300 m and therefore impractical to obtain, and only thevery small difference, possibly 0.06% of the total water of this planet, is available for human use as it cyclesfrom sea to atmosphere to land to sea. Only recently have humans been able to regulate that cycle to theiradvantage, and even now (ca 1997), only infinitesimally, in some few isolated places.
Wells produce groundwater, stored from previous rains. However, the fact that in recent years wells havehad to be made deeper and deeper to reach water shows that groundwater is being used faster than it is being
1

2 WATER, SUPPLY AND DESALINATION
replenished. Water lying in deep strata for millions of years is being mined like other minerals, never to bereplaced. In Libya, oil drilling found a lake 100 m below the dry sand, hundreds of square kilometers in area,and 750 m deep (3). It has been estimated that this lake will supply irrigation of 800 km2 for 300 yr, but thepumping of this water is as final an act as the pumping of Libya’s petroleum, which probably dates from thesame lush geological era. Once pumped, neither resource can be replenished.
1. Transport of Freshwater
For centuries, containers have been used to carry freshwater, usually for longer distances than would bepractical for conduits. Trucks and railways have used tanks. Ships have carried and still do carry water halfwayaround the world in ballast tanks; tankers that otherwise would be returning empty from oil deliveries maymake the return voyage filled with freshwater as precious to the oil-rich, water-poor country as the oil is to itsmarket. Systems of dams, canals, and aqueducts were developed to carry freshwater considerable distances togrowing cities, and to irrigate agricultural lands. Records of ancient Rome indicate that 14 aqueducts, averagingover 144 km in length, carried 1.175 × 10⁶ m3/d of water from the surrounding highlands by gravity. TheRomans depended on gravity flow in open channels, apparently with little knowledge of predicting the frictionlosses in pipes, even though Pliny lists standard lead pipe in circumferences up to ca 2.5 m. The aqueducts ofIstanbul are even more dramatic. The engineers’ competence developed with increasing needs for water, andconduits became longer.
In more modern times, New York City’s water system, initiated ca 135 yr ago, stands comparison as atrue engineering marvel. Farsighted action in the late nineteenth century also gave the city extensive upstatewatershed rights. This system, with a storage capacity of 2.07 × 10⁹ m3, safely furnishes about 8.5 millionpeople with an average of 5.3 × 10⁶ m3/d of water. The system is not adequate today, but it has served wellexcept in years of serious drought. Water enters the city via two tunnels, one built in 1917 and the other in1937. The projected cost of a third tunnel was estimated at $3.5 × 10⁹ in 1981 dollars, but could end up beingas high as $5 − 6 × 10⁹ by the time the tunnel is completed, with the first two stages currently scheduledfor completion in 2010 (4). Increased population in the vicinity of the water supply reservoirs, a watershedapproximately the size of the state of Delaware and as far as 160 km from the city, is increasingly threateningthe water quality there. The city has therefore taken steps in the recent years to establish a comprehensivewatershed protection program.
The 1974 Safe Drinking Water Act put all public water supplies in the United States under Federalsupervision. For example, the 94th Congress authorized a six-state water study, the High Plains Study Council,one of several such studies conducted in past years, to develop a set of plans for increasing water supply in aregion which supplies about 15% of the nation’s wheat, corn, sorghum, and cotton, and 38% of its livestock, andwhich depends on its rapidly dwindling groundwater (the Ogallala aquifer), mindful of the Dust Bowl droughtdisaster of the 1930s (5). In 1990 it was estimated that the aquifer would be practically depleted by the year2020. It was proposed that huge amounts of water from the Missouri and Arkansas Rivers be diverted to theHigh Plains, with an estimate by the Army Corps of Engineers that it would take as long as 9 yr to design,25 yr to build, and would cost $6 − 25 × 109 in 1982 dollars. Rising energy costs, costs of construction, localobjections to Federal intervention, environmental and navigation considerations, and various other problemshave prevented this and many other large water supply programs from materializing.
The problem of bringing water to southern California continues to be one producing controversy. Theregion is essentially a desert, devoid of any significant water resources, yet its population is growing at a fastpace: in 1990 it stood at 30 million and is expected to reach 49 million in 2020, with half of the increase expectedto occur in the arid South Coast region (6). Water is transported from northern California and from the ColoradoRiver, at distances of up to about 1000 km, expected to increase to about 1600 km by the year 2000, often againstthe objections by those living around these sources. The project to build the so-called Peripheral Canal, a 67-km
WATER, SUPPLY AND DESALINATION 3
long, 120-m wide channel to carry water from the Sacramento River delta to an existing aqueduct and then tothe agriculturally productive San Joaquin Valley and thence to Southern California, was passed by California’slegislature in 1980, and then defeated in 1982 owing to political opposition from a coalition of environmentaland local urban and agricultural interests. Elevated salinity in the California Aqueduct and some other watercanals has recently revived some interest in this project.
In some places and under certain conditions, freshwater can be obtained more cheaply by desalination ofseawater than by transporting water. This is true when all the costs of extremely large monetary investmentsin dams, reservoirs, conduits, and pumps to move the water are considered. Before the rapid escalation of fuelcosts between 1973 and 1980, the cost of desalination of seawater to adequately supply southern Californiawould have been less than that of transport to the Peripheral Canal. This would have been the case even if therewere an unlimited supply of water in the mountains of northern California, a condition that does not appearto exist. It has been shown that before 1973 a seacoast town could have been supplied with 7 − 12 × 104 m3/dof freshwater more cheaply by desalination than by damming and piping water a distance of ≥160 km km(7). Indeed, the 1987–1992 drought in California has compelled the city of Santa Barbara to construct a waterdesalination plant, and a 76,000-m3/d plant is planned for the western coast of Florida (8).
Because construction costs have remained approximately constant since the mid-1980s, despite inflation,desalination has a high potential of becoming less costly with improved technology, whereas the cost of trans-porting water is not likely to decrease substantially. Desalination increases the total amount of freshwater;transportation never does. The reduction of water costs, if possible at all, will, however, be limited. Desalinationis an energy-intensive process, and no presently conceivable alternatives promise any reduction of energy costs.The cost savings obtained as a consequence of advances in desalination technology have been counterbalancedby the increase in energy costs since the oil embargo of 1973.
2. The Water Problem
Many cities of the world do not levy a separate fee on water distributed, and even in those places where wateris in shortest supply, a minimal ration may be free to everyone. The problem of wasted water and unmeteredwater adding to the overall water demand is not new. In ancient Rome, fountains were connected to the publicwater by privately installed and owned lead pipelines, many of which were unrecorded, illegal, and henceuntaxed. Frontius, the water commissioner of Emperor Nerva of Rome in AD 96, developed crude meters toincrease revenue and cut demand.
Today in the United States, three times as much water is used per capita than in 1900; with inclusionof all industrial and agricultural uses, this quantity is probably ten times as great as at the turn of thecentury. Individual usage in some southern cities, with swimming pools, lawns, air conditioners, and other localdemands, can be as much as twice the national average. Population increase multiplies the total withdrawals,particularly in cities, where they may be as much as 1.06 m3/d/person. In New York City, for example, whichdid not practice adequate water metering, per capita consumption grew from 0.69 m3/d/person in 1970 to 0.76m3/d/person in 1981. Improved metering and water conservation have reversed this trend over the recent years,and in 1995 the per capita consumption fell to 0.68 m3/d/person, about the same as in 1970 (4). Philadelphiais also able to meter or bill only a part of the supplied water, and the total per capita water consumptionhas grown from 1970 to 1990 by 30%, to about 0.9 m3/d/person, whereas the metered and billed accounts areexpected to have a consumption of only 0.35 m3/d/person (9).
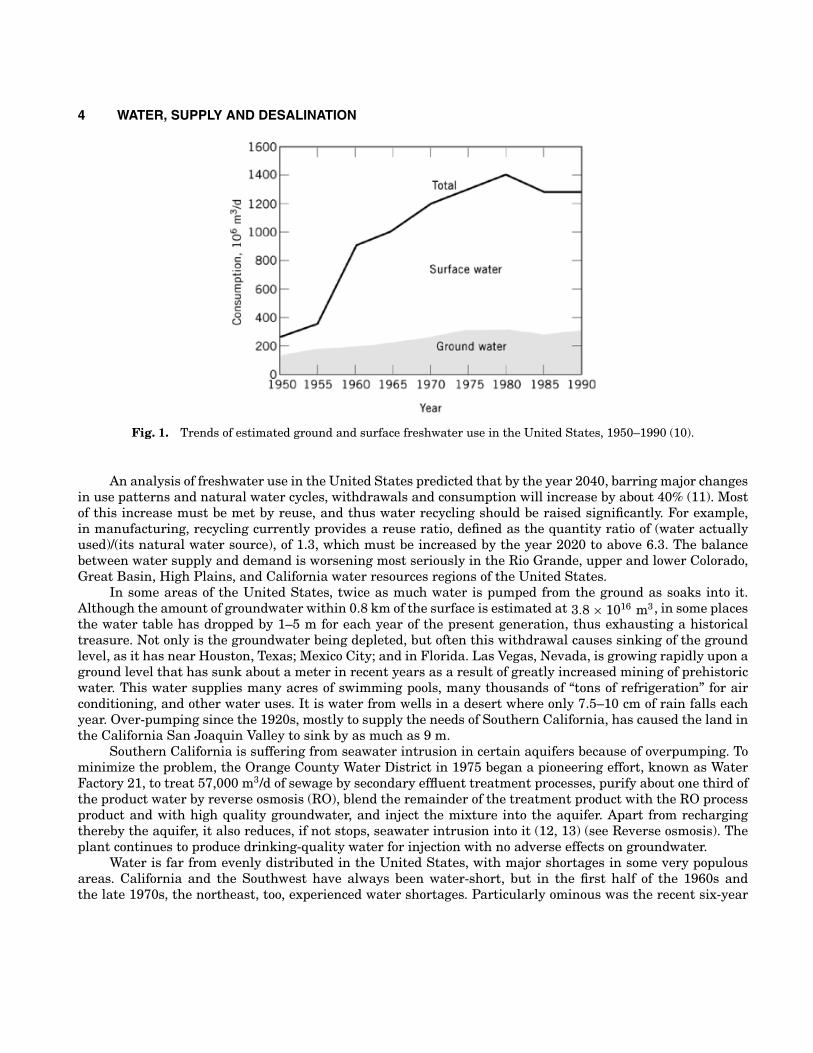
The use of ground and surface freshwater in the United States from 1950–1990 is shown in Figure 1(10). Whereas the overall increase in use had been slightly reduced and then arrested after 1980, this wasprimarily because of a reduction in use for irrigation and industry. In some part it is a result of conservationand improved efficiency, but in large part it is the result of a decline in agricultural and industrial production.Public supply continues to increase, approximately keeping pace with population growth.
4 WATER, SUPPLY AND DESALINATION
Fig. 1. Trends of estimated ground and surface freshwater use in the United States, 1950–1990 (10).
An analysis of freshwater use in the United States predicted that by the year 2040, barring major changesin use patterns and natural water cycles, withdrawals and consumption will increase by about 40% (11). Mostof this increase must be met by reuse, and thus water recycling should be raised significantly. For example,in manufacturing, recycling currently provides a reuse ratio, defined as the quantity ratio of (water actuallyused)/(its natural water source), of 1.3, which must be increased by the year 2020 to above 6.3. The balancebetween water supply and demand is worsening most seriously in the Rio Grande, upper and lower Colorado,Great Basin, High Plains, and California water resources regions of the United States.
In some areas of the United States, twice as much water is pumped from the ground as soaks into it.Although the amount of groundwater within 0.8 km of the surface is estimated at 3.8 × 10¹⁶ m3, in some placesthe water table has dropped by 1–5 m for each year of the present generation, thus exhausting a historicaltreasure. Not only is the groundwater being depleted, but often this withdrawal causes sinking of the groundlevel, as it has near Houston, Texas; Mexico City; and in Florida. Las Vegas, Nevada, is growing rapidly upon aground level that has sunk about a meter in recent years as a result of greatly increased mining of prehistoricwater. This water supplies many acres of swimming pools, many thousands of “tons of refrigeration” for airconditioning, and other water uses. It is water from wells in a desert where only 7.5–10 cm of rain falls eachyear. Over-pumping since the 1920s, mostly to supply the needs of Southern California, has caused the land inthe California San Joaquin Valley to sink by as much as 9 m.
Southern California is suffering from seawater intrusion in certain aquifers because of overpumping. Tominimize the problem, the Orange County Water District in 1975 began a pioneering effort, known as WaterFactory 21, to treat 57,000 m3/d of sewage by secondary effluent treatment processes, purify about one third ofthe product water by reverse osmosis (RO), blend the remainder of the treatment product with the RO processproduct and with high quality groundwater, and inject the mixture into the aquifer. Apart from rechargingthereby the aquifer, it also reduces, if not stops, seawater intrusion into it (12, 13) (see Reverse osmosis). Theplant continues to produce drinking-quality water for injection with no adverse effects on groundwater.
Water is far from evenly distributed in the United States, with major shortages in some very populousareas. California and the Southwest have always been water-short, but in the first half of the 1960s andthe late 1970s, the northeast, too, experienced water shortages. Particularly ominous was the recent six-year
WATER, SUPPLY AND DESALINATION 5
(1987–1992) drought in California in which the water supplies were insufficient to meet the demands, anevent that portends even worse shortages in the future, of 8.6 × 10⁹ 11.1 × 10⁹ m3/yr in drought seasons,and 4.6 × 10⁹ − 7.0 × 10⁹ m3/yr in normal seasons, by the year 2020 (6). Restrictions of water use in manystates have become virtually annual occurrences in years of low rainfall. Whereas the overall water supply inthe United States is expected to meet demand in the foreseeable future, serious imbalances are expected tocontinue and worsen owing to geographic, seasonal, and annual variations in the supplies (11).
Two out of five U.S. cities have inadequate water supplies, and at least a quarter of the U.S. populationfaces serious water shortages. Yet, half the states, having two-thirds of the industry and over half of thepopulation, have direct access to as much as they can draw of the approximately 3.3 × 10⁸ km3 of seawater.The solids content of this water, mainly salts, varies worldwide from 25,000 ppm (2.5%) in the Baltic Sea toover 45,000 ppm (4.5%) in some of the more confined gulfs of the Indian Ocean. The waters of the wide oceansare almost constant, at 35,000 ppm (3.5%). Also, many inland areas have access to large quantities of watertoo brackish to drink.
Increasing pollution of water sources worldwide is a major contributor to the climbing shortage of usablewater. A recent report of the U.S. Environmental Protection Agency (14) points out that about 40% of the U.S.rivers, lakes, and estuaries surveyed are too polluted for even basic uses such as fishing or swimming. Especiallygrim is the condition of the Great Lakes, which contain one-fifth of the world’s fresh surface water. About 97%of the Great Lakes waters were found to be substandard for designated uses, and particularly worrisome is thefact that the lakes are continuously polluted by toxic chemicals. Some of the good water in the U.S. is consideredto be “threatened,” and a projection of need for sewage treatment costing over $100 billion was made. In thiscontext it is important to note the vital importance of water-quality legislation. Along with the Clean Air Act,the Clean Water Act of 1972 is of unprecedented value in U.S. environmental protection history. Launched to“restore and maintain the chemical, physical, and biological integrity of the Nation’s waters,” it has resultedin a significant slowdown of the pollution processes and in many cases reversed the trend. Many rivers andcreeks, for example, such as the Delaware and Schuykill Rivers passing through Philadelphia, which hadowing to severe pollution lost most aquatic life and became inaccessible for recreation, are now largely restoredagain. The Delaware River, for example, became septic in the 1940s and 1950s, dissolved oxygen concentrationdropped to zero in the warmer months, and fish became extinct. The situation now, while still not perfect, ishighly improved, with herring and shad swimming upstream to spawn. The activities in support of the CleanWater act incur, however, an economic cost, and the Act is continuously threatened by interest groups whichobject to this cost and inconvenience. Many countries in the world, especially the developing ones, and thosecurrently or formerly under communist regimes, still do not have such legislation or enforcement and haveseverely polluted waters. A World Bank report issued in 1995 stated that 80 countries with 40% of the world’spopulation already have water shortages which could cripple agriculture and industry, and that about 95% ofthe world’s urban areas dump raw sewage into rivers and other water bodies, with dirty water killing 10 millionor more people every year and causing untold economical damage. The water supply and quality situation isworsening rapidly. It was estimated that the developing countries alone would need $600 − 800 × 109 for waterprojects over the next 10 years, with no identifiable available funding sources.
Some of the most attractive areas of the world, particularly islands and beaches, are almost devoid offreshwater. The biggest and one of the fastest growing of the industries of the world is tourism. It is a particularlyattractive industry to developing countries, and in some of these it may be almost the only nonagriculturalindustry. Tourism accounts for a substantial use of the available freshwater, and it may be stifled or entirelyprevented in otherwise attractive places if there is insufficient freshwater. To conserve available water supplies,some hotels might use double water systems, ie, seawater for flushing, but they still must provide on the orderof 400–600 L/d per tourist to assure a comfort to guests unaccustomed to water shortages. Production of thesequantities of water by desalination techniques has become an important expense to the hotels. Today, the costof production of desalinated water can be as high as $4.00–5.25/m3, and in some locations even higher.
6 WATER, SUPPLY AND DESALINATION
The island of Bermuda, for example, derives the largest percentage of its income of any country fromtourism, receiving over 500,000 visitors per year. It has no surface water and its ground water became increas-ingly saline as a result of excessive pumping. By law, each house there must have no less than four-fifths ofits roof area guttered for catching rainwater, and a covered tank of 100 imperial gallons (0.45 m3) capacity forevery 10 ft2 (0.9 m2) of prescribed area of catchment to store the rainwater. It is estimated that about 4000m3/d is acquired in this manner, serving as the main potable water source for the island (15). The U.S. VirginIslands has similar regulations. Vegetation is cleared from hill slopes above the natural limestone and coral,which are plastered to give drains and catchments for heavy seasonal rains. But even with all this, some waterhad to be imported until adequate desalination capacity was introduced, at this time totaling 30,000 m3/d, witha water cost of $4.76/m3 (16).
The newly acquired wealth of the countries in the Middle East has given an unexpected boost in desalina-tion for the region. Starting with nearly zero, Saudi Arabia, Kuwait, and the United Arab Emirates have overthe past three decades added plants producing about 9 × 10⁶ m3/d of freshwater, representing nearly one-halfthe worldwide desalination capacity (17). This includes the world’s largest single-site, 946,000-m3 multistageflash distillation (MSF) complex, in Al-Jubail, Saudi Arabia; the world’s largest (2,400-m3/d each) MSF units inAbu Dhabi; and the world’s largest (113,600 m3/d) reverse osmosis seawater desalination plant, in Jedda, SaudiArabia. Following the Arab Peninsula in order of desalination capacity are the United States, North Africa,the rest of the Middle East, the European Mediterranean area, Southeast Asia, the rest of Europe, and theCaribbean islands. Water desalination is increasingly used for the treatment of effluent waters for reuse, andof river and city waters to improve purity for various industrial applications such as boiler feed and ultrapurewater for the electronics industry.
In many of the developing nations, lack of water hampers the profitable exploitation of material resources(18). For example, proven mines on Egypt’s Red Sea Coast cannot be operated; others on the same coast areoperable only with desalination water for processing phosphate ores and for mining lead and zinc. The workerswere rationed 15–35 L/d of water. Fishing industries on South America’s arid Pacific Coast cannot be expandedfor lack of water to process the haul. These represent great losses in the world’s supplies of minerals and foods;there are many others. Not all freshwater shortages are in the torrid tropics; a substantial iron-ore depositin a small waterless island off the coast of Iceland needs water for workers. Needed is a desalination plantor some means of utilizing as liquid water the heavy fogs that prevail there. Offshore oil-drilling rigs aroundthe world similarly need water. Technological progress in the last decade has made readily available packagedsmall (10–400 m3/d) seawater RO and vapor-compression systems. In fact, virtually all offshore drilling rigstoday have their own seawater conversion plants. Desalination facilities, and in turn desalinated water, becomereadily available, contingent only on the availability of funds.
Cities on the lower reaches of a large river, with many cities above, use water that has been throughsewers upstream many times. On the lower Mississippi, a water inventory indicates such reuse averages 14times, with biochemical oxidation of the wastes during the flow between cities. The Rhine River, in passingthrough several countries, all of which drink from and dump into its waters, is subject to international problemsof pollution. Of considerable import here is the fact that many so-called hard contaminants present in sewageincrease almost proportionally with reuse of the water. Such materials do not ferment or oxidize under ordinarysewage treatments, and some are known carcinogens, which presents serious health problems to potable watersdrawn from these bodies.
The U.S. government spent ca $150 × 106 in fiscal 1969 on water resources research relating to artificialrainmaking, soil conservation, waste treatment, desalting, public health, and planning research. This levelof annual expenditure, large compared to the rest of the world, has in the meantime diminished (19), eventhough it was even then considered to be rather small for supporting a need estimated at >$100 × 109 for waterfacilities worldwide within 10–15 yr (20). Several government agencies conduct water research, primarily theU.S. Geological Survey, the Environmental Protection Agency, the Bureau of Reclamation, and the Department

WATER, SUPPLY AND DESALINATION 7
of Agriculture. Practically all of the reports and results of research on water in the United States are availablefrom the National Technical Information Service, U.S. Department of Commerce, Springfield, VA 22161.
2.1. Saline Water for Municipal Distribution
Only a very small amount of potable water is actually taken by people or animals internally, and it is quiteuneconomical to desalinate all municipally piped water, although all distributed water must be clear and freeof harmful bacteria. Most of the water piped to cities and industry is used for little more than to carry off smallamounts of waste materials or waste heat. In many locations, seawater can be used for most of this service.If chlorination is required, it can be accomplished by direct electrolysis of the dissolved salt (21). Arrayedagainst the obvious advantage of economy, there are several disadvantages: use of seawater requires differentdetergents; sewage treatment plants must be modified; the usual metal pipes, pumps, condensers, coolers,meters, and other equipment corrode more readily; chlorination could cause environmental pollution; and dualwater systems must be built and maintained.
Pipes, valves, fittings, and almost all other components of small equipment are now available in plasticor ceramics, which do not corrode in salt water and are less expensive than the metals now used. Syntheticdetergents are now available for use with seawater, although a final rinse with freshwater may be desired.Saltwater sewage can be treated successfully. Dual water systems using freshwater and seawater are alreadyin use on ships and in many island resort hotels. Many of these also have seawater systems for fire fighting.This trend will grow.
Some inland municipalities now distribute water with salt content exceeding 1000 ppm, water so brackishas to be unpleasant to the taste, even though it is distributed as potable water. Each home may produce orpurchase the very small requirement of freshwater for drinking and cooking. Small membrane and ion-exchangedesalinators are available; these produce the relatively few liters of potable water required (see Membranetechnology; Ion exchange). They can be purchased from and periodically serviced by service companies in manycommunities. The cost per liter of potable water produced in the home is several times as great as the cost ina central desalination plant, but the amount of desalinated water needed is only a small fraction of the totalsupply.
Home desalinators are possible only for industrialized countries with a central service organization. Theywill eventually become available on a rental/service contract basis, as is standard practice for water softenersin many communities. Although rental of water softeners is common in the United States, home membrane-system rental is not established.
Alternatively, small amounts of potable water may be delivered by truck to distribution centers or to tankson house roofs. This system exists in Kuwait, which has many filling stations from which tank-truck operatorsbuy water at $1.00/m3 for distribution at about $3.00/m3. Although much water is directly piped to residencesin Kuwait today, 12% of the people still get their water by truck. In Khartoum, Sudan, families that buy fromvendors, who deliver sacks of water by donkey, pay an average of $16 per month.
2.2. Water in Industry
Freshwater for industry can often be replaced by saline or brackish water, usually after sedimentation, filtra-tion, and chlorination (electrical or chemical), or other treatments (22). Such treatment is not necessary for thelargest user of water, the electric power industry, which in the United States passed through its heat exchang-ers in 1990 about 40% of the total supply of surface water, a quantity similar to that used for agriculture, andit was 48% of the combined fresh and saline water withdrawals (10). Single stations of 1000 MW may heat asmuch as 12 Mm3/d by as much as 10–15◦C.
The power-plant cooling water is either returned directly to its source, such as rivers, lakes, or oceans, oris recycled by circulation and consequent cooling in cooling towers. Cooling towers circulate the warmed water
8 WATER, SUPPLY AND DESALINATION
downward against a rising stream of air which removes heat by evaporating a part of the water to cool thebalance. In the United States, cooling towers are not so common as in Europe because of the large bodies ofwater available.
Construction of new power plants in the coal region of the western United States presents serious problemsin states whose laws dictate zero effluent. In these plants, cooling-tower water withdrawn from rivers cannotbe returned to them. In these situations, cooling-tower effluent is purified by distillation (vapor-compressionplants have predominated) and by a combination of distillation and membrane technology. The converted waterthen is used as boiler feedwater; the plant blowdown (effluent) is evaporated from open-air lined pools, andpool sediment is periodically buried back in the coal mine with the flue ashes.
Although 600 m3 of water is used to make a metric ton of fertilizer, 150–240 m3 to make a tonne of steel,480 m3 to make a tonne of gasoline, and 1000 m3 to make a tonne of acetate fiber, little if any is requiredchemically in any of these processes. Recycling can reduce industrial requirements by a factor of 10–50. Muchof this water, particularly that for cooling, and often that for washing, can be saline. Some petroleum refinershave used salt water to remove heat (water’s principal role in gasoline production), and some have actuallyproduced table salt by evaporation in cooling towers.
The pulp and paper industry has tried for many years to use salt water for some of the 250–400 m3 ofwater required to make a metric ton of paper (see Pulp; Paper). Here, however, salt is disadvantageous to thechemical processes, either in pulping the lignocellulose or in the recovery of values from the black liquor afterpulping, and can corrode expensive papermaking machinery. The possibility of recovering and reusing at leastpart of this water after membrane processing is under study.
The textile industry, also a large consumer of water, must always be located in areas with abundant watersupply (see Textiles–SURVEY). Before long, advances in purification of textile industry effluents are expectedto free the industry of this limitation and enable textile plants to locate in virtually any area. The great fluidreservoir of heat, the alternative to water, fresh or salt, is the atmosphere. Increasingly, industry is using aircoolers to dissipate the large quantities of heat from power plants, petroleum distillation, and other processuse. This would reduce the use of cooling water correspondingly.
Air coolers almost invariably add considerably to plant cost, but they are competitive in operating costbased on direct once-through use of water that requires no treatment. If the alternative to air coolers is theuse of water that requires substantial treatment or pumping costs, the air coolers will cost less to operate.
2.3. Water for Agriculture
Two liters of water in some form is the daily requirement of the average human, depending on many personaland external conditions. However, at least several hundred liters per day are required for the growing ofvegetables, fruits, and grain that make up the absolute minimal daily food ration for a vegetarian. About 0.48m3 is required to produce an egg, and 31 m3 to produce a kilogram of beef, based on the cereals required by theanimals. The quality of water (in particular, its salinity) is of considerable importance to agriculture. Thereare crops that can grow in water of relatively high salinity (for example, sugar beets tolerate salinity of up to5,000 ppm), but most crops cannot tolerate salinity exceeding 1000 ppm. This limit led to the treaty betweenthe United States and Mexico in which the United States agreed to limit the salinity of the lower ColoradoRiver reaching Mexico to approximately 1000 ppm, a requirement that had to be met by constructing a 276,000m3/d RO desalination plant (the largest RO plant constructed to date) in Yuma, Arizona, which would reducethe salinity of the agricultural drainage water from 3200 ppm to 250 ppm. The desalted water is then mixedwith Colorado River waters to reduce their overall salinity to the required limits (23). Originally plannedto start in 1981, various delays made it ready for starting only in 1983, a year in which unusually largewater flow in the Colorado River made desalination unnecessary. The plant ran successfully in 1991–1992,but subsequent funding problems restricted capacity to only about one-third of the total, and then stopped

WATER, SUPPLY AND DESALINATION 9
operation altogether, but the plant is available for restarting if needed. The salinity problem is being resolvedin the interim by diverting the saline waters to the marshy area of the Santa Clara Slough in Mexico.
A loaf of bread contains little of the more than a ton of water necessary to grow the wheat therein. Thewater content of vegetables comes from the 1000–2000 times their weight of it that is needed to grow them.Some of the main losses in agriculture may be reduced by agronomists and plant physiologists. Increasingly, thebalance sheet for irrigation plant technology now makes use of agronomic WUE (water-use efficiency), whichis a ratio of the amount of harvestable or economic biomass to the water consumed by evapotranspiration.Studies are being made to determine whether it is possible to supply less water to the roots, with betterabsorption there and smaller losses by transpiration through the leaves. For example, research includes tissue-culture work with protoplast fusion and recombinant DNA technologies to reduce stresses of salinity, drought,flooding, ion toxicities, nutrient deficiencies, temperature extremes, and photosynthetic efficiency. Certainly,plant structures of an entirely different type will be necessary to prevent, for example, the loss by transpirationin a field of corn on an August day, of an amount that may be equivalent to more than a centimeter of rainfall.However, the recently developed high yield grains, which use much less water than the conventional varieties,are a great aid to the developing nations.
It is possible to breed plants that have more efficient systems for utilization of water, and agriculturaltechnology can help existing crop plants by spraying impervious coatings on them. Extremely small amountsof long-chain, fatty alcohols reduce evaporation losses from quiet lakes or reservoirs to less than 5% of thenormal surface evaporation.
Waterproofing sandy soils to prevent drain-through has been successful in increasing crops as much as400% with the same rainfall. A special plow lifts the soil to allow melted asphalt to be layered in overlappingimpermeable strips 82 cm wide and 50 cm below the surface (18). Waterproofing the surface in Israel bycompacting with chemicals increases runoff to basins or fields on slopes below. In many places, barren slopeshave been coated with asphalt or concrete in layers as thin as 0.3 cm to catch rain, which is conducted to catchbasins for irrigation or other uses. In St. Thomas, U.S. Virgin Islands, such catchment basins have, however,now been abandoned in favor of desalination.
The one-seventh of the world’s crop lands that are irrigated produce one-quarter of the world’s crops.Irrigation’s main losses result directly from seepage and evaporation from the open water-carrying channelsand the soil. Only a small fraction of the water withdrawn from the irrigation ditch or pipe is absorbed by theplants. Plastic films, as ground covers through which the plants protrude, prevent some losses but at greatexpense for film and labor. Cheaper systems are necessary to assure better water utilization by plants. Otherpossible goals would be food plants with membranes capable of separating freshwater from brackish water, togive a non-salty crop. Progress has been made in both of these directions, and some plants have been developedthat accumulate salt from the ground.
Vegetables and fruits such as melons are profitably grown in four or five crops per year by hydroponics,ie, the growth of plants in large, shallow concrete tanks containing no soil but gravel and water with addednutrients. Such installations can even be found in areas known for their water scarcity such as Aruba and St.Croix (U.S. Virgin Islands) where both desalinated seawater and brackish water are used for the purpose. Muchwater is still necessary per unit weight of crops, but the largest losses of ordinary irrigation are prevented, asindeed they must be because of the comparatively high cost of the water. Such concentrated agriculture is veryexpensive in preparation of land area, but economical for water and labor requirements. Production is high inthe tropics, and hydroponics offers a major opportunity to many developing countries.
Other locations where desalinated water of either brackish or sea origin is used for agriculture are theChannel Island Guernsey, Israel, Libya, and countries in the Arabian Gulf including Saudi Arabia. The cost ofsuch agricultural use is at best marginal and at worst exorbitant, depending on the amounts of water required.

10 WATER, SUPPLY AND DESALINATION
Table 1. Residential Water Costs, U.S. $ / 1000 ft3 (28.3 m3)a
City
YearEl Paso,Texas
Albuquerque, NewMexico
Los Angeles,California
Newark, NewJersey
Boston,Massachusetts
Philadelphia,Pennsylvania
1978 3.99 4.48 4.55 7.79 8.90 8.131994 7.89 10.54 15.80 15.13 19.92 14.07
aRef. 24.
3. Economic Aspects
As shown in Table 1, residential water rates in the U.S. have gone up significantly between 1978 and 1994 (24).
According to the 1994 National Water and Wastewater Rate Survey (24), the lowest rate per 28.3 m3 ofwater in the United States was $5.40 in Saginaw, Michigan, and the highest, $44.88 in Scranton, Pennsylvania.Since the rates for wastewater were higher, by an average of $2.59, increased rapidly from a surfeit of $0.05 in1986, and since an increasing number of utilities also charge customers for stormwater runoff treatment, theactual costs to the customer are higher than those shown in Table 1.
The range of consumer prices for water in the developed countries in 1990 ranged from about $9.90in Norway to $45.28 in Greece, per 28.3 m3, or $0.35–1.60/m3. In comparison, 1993 water costs from largedesalination plants were in the $1.50–2.00/m3 range (25).
Paradoxically, even rapid lowering of demand may cause rapid cost escalation; this was the case in NewJersey during a 1981 drought when conservation caused substantial shrinking of demand and private watercompanies had to double their water prices. The continued increase of demand and reduction of supply portendreal and relentless water-cost increases in every part of the United States in the future. One possible way toassure at least adequate supplies, and possibly to moderate these cost increases, is through water reuse.
4. Desalination Development Programs and Associations
4.1. U.S. Department of the Interior: U.S. Geological Survey and the Bureau of Reclamation
The U.S. Department of the Interior (USDI), long active in many areas of water resources and management,was authorized by Congress in 1952 to organize the Office of Saline Water (OSW), later transformed intothe Office of Water Research and Technology (OWRT), for research, development, and demonstration (RD&D)to develop economical processes for desalination. In 1996 dollars, the expenditure for this purpose rose from$1.2 × 10⁶ in 1953, to a peak $130.4 × 10⁶ in 1967, remaining around the $100 × 106 level through 1973. Onefundamental principle guiding these efforts and enunciated by one President of the United States is that allscientific and engineering knowledge and skills developed in the wide reaches of this program are to be madeimmediately and freely available to every nation in the world, as a generous contribution to the betterment ofthe lives of all humankind.
This dissemination of knowledge has occurred, and desalination technology developed in the UnitedStates has resulted in a significant benefit to the world at large, even though the U.S. desalination industry hasnot always shared in the profits from the exploitation of this technology. In its effort, OSW and its successor,OWRT, supported the full range of activities, from fundamental through demonstration plants, covering alldesalination technologies. In membrane technology, it was responsible for a number of landmark discoveries,including the desalination properties of cellulose acetate RO membranes, seawater conversion with membranes,construction of spiral-wound modules, composite-film seawater membranes, and very large membrane modules.
WATER, SUPPLY AND DESALINATION 11
The early demonstration distillation plants utilizing diverse distillation techniques have also made their mark(see Hollow-fiber membranes). The results were published in more than 1,200 government reports, all in thepublic domain, and thousands of professional papers.
The training of many of today’s industrial leaders in desalination technology was supported by theseagencies.
Declaring that water desalination was a mature industry which did not require substantial governmentalsupport any longer, the federal government stopped this RD&D desalination initiative in 1972, graduallyreduced the annual expenditure for desalination to about $2 × 10⁶ and closed the OWRT in 1982, with fundingfor this purpose continuing at this annual level and diminishing somewhat, under the auspices of the U.S.Geological Survey (USGS) and the Bureau of Reclamation (BuRec).
4.2. United Nations
The U.N. Department of Economic and Social Development; U.N. Children’s Fund (UNICEF); U.N. DevelopmentProgram; U.N. Environment Program; the U.N. University; the Economic Commissions for Africa, Europe,Latin America, and the Caribbean; the Economic and Social Commissions for Asia and the Pacific and WesternAsia; the U.N. Centre for Human Settlements; the U.N. Disaster Relief Coordinator Office; the InternationalResearch and Training Institute for the Advancement of Women; and the World Food Program are all engagedin addressing water problems. The International Labor Organization, the Food and Agriculture Organizationof the U.N., UNESCO, the World Health Organization, the World Bank, the World Meteorological Organization,United Nations Industrial Development Organization, and the International Atomic Energy Agency are alsoinvolved. The wide variety of water-related activities conducted by these many organizations is coordinated bythe U.N. Intersecretariat Group for Water Resources, and a summary of them is given in Reference 26.
A milestone event was the United Nations Water Conference held in Mar del Plata, Argentina, in 1977,which dealt with the integrated planning and development of water resources, reported in the Mar del PlataAction Plan adopted by the Conference (27). The Action Plan contains a set of resolutions and recommendationson a wide spectrum of activities in the field of water resources development, covering such questions as as-sessment of water resources; water use and efficiency, including its development and use for sectoral purposes;environment, health, and pollution control; policy, planning, administration, and institutional aspects; edu-cation, training and research; natural hazards and regional and international cooperation. A major outcomeof the conference was the General Assembly Resolution 35/18, which proclaimed the period 1981–1990 theInternational Drinking Water Supply and Sanitation Decade, committing member countries of the U.N. to asubstantial improvement in the standards and levels of services in drinking water by 1990.
In 1990 the members of the Intersecretariat Group for Water Resources undertook regional assessmentsof the situation concerning key areas of the Mar del Plata Action Plan, in order to formulate a strategy for itsimplementation in the decade of the 1990s and beyond (28). Further stock-taking and planning was done atthe International Conference on Water and the Environment—Development Issues for the 21st Century, heldJanuary 26–31, 1992, in Dublin, Ireland (26).
Sound international agreements on the sharing and proper maintenance of water resources are an impor-tant condition for peaceful coexistence among nations which have geohydrological links. The World Bank’s vicepresident for Environmentally Sustained Development was quoted in 1995 to say that “many of the wars inthis century were about oil, but wars of the next century will be over water.” A good example is the negotiationson the future of water resources coordination in the course of the peace-building process between Israel andits Arab neighbors, in which the United Nations obviously has a role (29).
Details about the various U.N. water-related activities can be found in References (26–29), as well as intopical reports published by the United Nations.

12 WATER, SUPPLY AND DESALINATION
4.3. International Desalination Association
The IDA (formerly IDEA) is the major association specifically devoted to desalination. Beginning in 1976 itbegan organizing international congresses in desalination and water reuse. The proceedings of its conferenceshave been published (30). It also publishes a trade magazine (31).
4.4. American Desalination Association
The ADA, formerly the National Water Supply Improvement Association (NWSIA), is devoted to water supplyimprovement and considers desalination as a major technique. The association publishes a newsletter, ADANews.
The European Desalination Society, formed recently, is the successor of the European Federation ofChemical Engineers Working Party on Desalination and Water Technology. The latter organization has heldseven symposia in different parts of the world, and their published proceedings contain much valuable material(32).
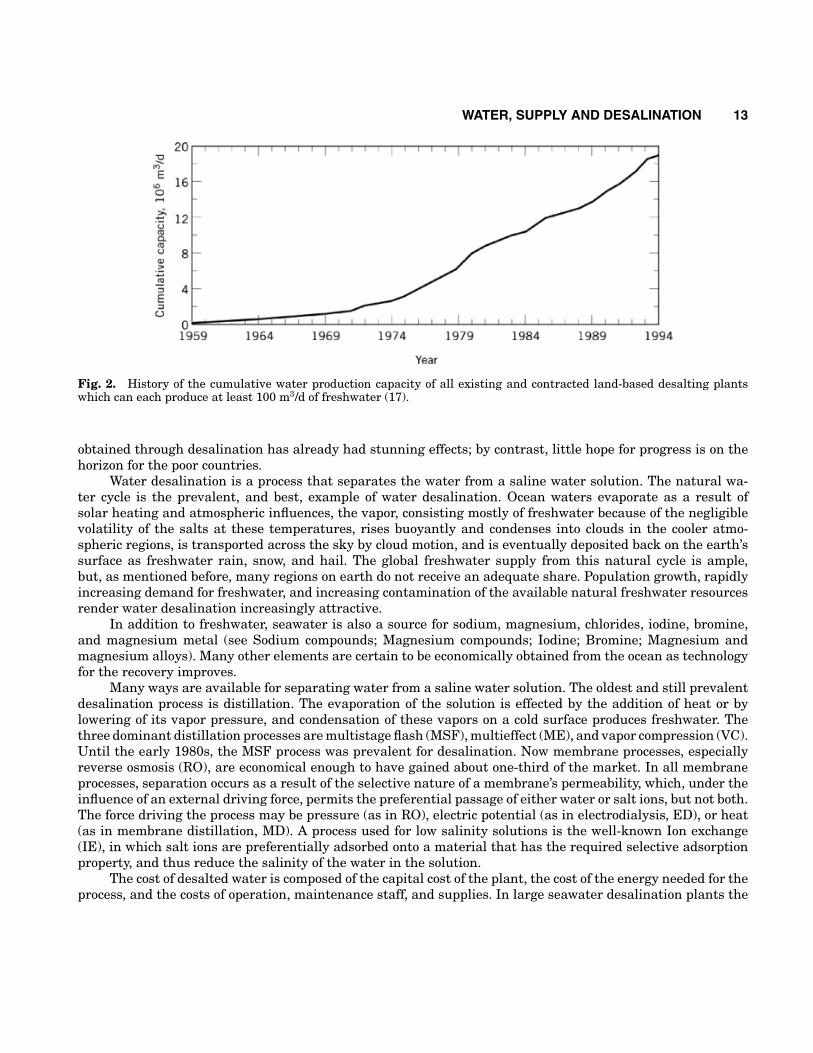
5. Desalination: Manufactured Freshwater
Desalination has been used for providing drinking water on seafaring ships since ancient times (using solar orfuel heat), and an early reference to the scientific or miraculous conversion by Moses of bitter groundwater tofresh, viz, “. . . and the Lord showed him a wood and he put it into the water and the water became sweet,” ismade in the Old Testament (33). The possibility of producing freshwater from seawater or brackish water byseparation of the salts opens a new dimension in the supply of freshwater. Areas bordering the sea would have anavailable raw material without limit or cost of transportation to the water facility. The successful realization ofdesalination by the combined effort of chemists, and chemical, mechanical, and materials engineers, as opposedto the search for and transport of existing freshwater, gives new hope for adequate water in many, but not all,cases. Figure 2 shows the remarkable growth of the cumulative contracted capacity of large desalination plantssince 1959, when large-scale, land-based desalination began. As of the end of 1994, a total of 10,300 desaltingplants having a capacity of at least 100 m3/d each, with a total capacity of 19,200,000 m3/d, have been installedor contracted worldwide (17). This output can easily satisfy the domestic and public (excluding industrial andirrigation) water needs of at least 50 million people. About two-thirds of these plants are for desalting seawater,and one-quarter for desalting brackish water. About 70% of the desalted water is for municipal use, 20% forindustrial use, and the remainder is used in the power industry, in discharge treatment, and by the military.There are more than 1700 companies and institutions involved in water desalination (34).
Cost remains the main stumbling block to desalination procedures, but freshwater is now one of thosematerials produced as it is needed. Water has significant differences from other manufactured materials, eg,the very low value of the commodity and the very large amount of the product needed. Thus, plant costs mightbe expected to be high compared to unit sales value of production, and the capital charges for the productionequipment do make up a very large percentage of costs in comparison to other production industries.
Obstacles attend this new solution of the freshwater problem, which magnify those familiar to the chem-ical engineer in purifying other cheap or worthless raw materials into valuable products by treatment withchemicals or thermal or electrical energy. These obstacles are quite different from the previous main problem ofwater supply, ie, the factor of happenstance in finding a river or lake nearby or of making a fortunate geologicalstrike.
In many places, the need for desalination is even more urgent than the production of food, which islimited by water shortages. These shortages exist both in the petroleum-rich countries and in many of theleast-developed and poorest countries of the world. In the case of the former, the improved water supply
WATER, SUPPLY AND DESALINATION 13
Fig. 2. History of the cumulative water production capacity of all existing and contracted land-based desalting plantswhich can each produce at least 100 m3/d of freshwater (17).
obtained through desalination has already had stunning effects; by contrast, little hope for progress is on thehorizon for the poor countries.
Water desalination is a process that separates the water from a saline water solution. The natural wa-ter cycle is the prevalent, and best, example of water desalination. Ocean waters evaporate as a result ofsolar heating and atmospheric influences, the vapor, consisting mostly of freshwater because of the negligiblevolatility of the salts at these temperatures, rises buoyantly and condenses into clouds in the cooler atmo-spheric regions, is transported across the sky by cloud motion, and is eventually deposited back on the earth’ssurface as freshwater rain, snow, and hail. The global freshwater supply from this natural cycle is ample,but, as mentioned before, many regions on earth do not receive an adequate share. Population growth, rapidlyincreasing demand for freshwater, and increasing contamination of the available natural freshwater resourcesrender water desalination increasingly attractive.
In addition to freshwater, seawater is also a source for sodium, magnesium, chlorides, iodine, bromine,and magnesium metal (see Sodium compounds; Magnesium compounds; Iodine; Bromine; Magnesium andmagnesium alloys). Many other elements are certain to be economically obtained from the ocean as technologyfor the recovery improves.
Many ways are available for separating water from a saline water solution. The oldest and still prevalentdesalination process is distillation. The evaporation of the solution is effected by the addition of heat or bylowering of its vapor pressure, and condensation of these vapors on a cold surface produces freshwater. Thethree dominant distillation processes are multistage flash (MSF), multieffect (ME), and vapor compression (VC).Until the early 1980s, the MSF process was prevalent for desalination. Now membrane processes, especiallyreverse osmosis (RO), are economical enough to have gained about one-third of the market. In all membraneprocesses, separation occurs as a result of the selective nature of a membrane’s permeability, which, under theinfluence of an external driving force, permits the preferential passage of either water or salt ions, but not both.The force driving the process may be pressure (as in RO), electric potential (as in electrodialysis, ED), or heat(as in membrane distillation, MD). A process used for low salinity solutions is the well-known Ion exchange(IE), in which salt ions are preferentially adsorbed onto a material that has the required selective adsorptionproperty, and thus reduce the salinity of the water in the solution.
The cost of desalted water is composed of the capital cost of the plant, the cost of the energy needed for theprocess, and the costs of operation, maintenance staff, and supplies. In large seawater desalination plants the

14 WATER, SUPPLY AND DESALINATION
cost of water is about $1.4–2/m3, dropping to less than $1/m3 for desalting brackish water. A methodology forassessing the economic viability of desalination in comparison with other water supply methods is describedin Reference 34. Desalination plants are relatively simple to operate, and progress toward advanced controlsand automation is gradually reducing operator expenses.
5.1. Minimal Energy Requirements
The relative effect of the cost of the energy on the cost of the freshwater produced depends on local conditions,and is up to one-half of the total. In attempting to reduce this cost, it is of interest to determine the minimalenergy amount thermodynamically needed for separating the water from the saline solution. The physicalbackground to this will be introduced in a simple example. Because of the negligible volatility of the salts, thevapor of an aqueous saline solution is practically pure H2O. It is well known that the vapor pressure of a salinewater solution at a constant temperature decreases as the solution salinity increases. Thus, the vapor pressureof such a solution is lower than the vapor pressure of pure water at the same temperature. Withdrawal ofthis pure water (here in vapor form) from the saline solution to a pure water product storage vessel which ismaintained at the same temperature thus requires pumping of the vapor from the vapor under lower pressureabove the saline solution to the vapor under higher pressure above the pure water. The work needed for thatvapor pumping, assuming a 100%-efficient pump (compressor) and perfectly insulated vessels, is the minimalenergy needed for separating the water from the saline solution.
The effect of salt concentration on the vapor pressure of the solution has its well-known temperatureexposition, called the boiling point elevation. Because the vapor pressure of saline solutions is lower than thatof pure water, their boiling point temperature is higher. The difference between the boiling points is calledthe boiling point elevation, which rises with the concentration, and it can thus be seen as the measure of theextra energy needed for separation, ie, here the required raising of the temperature of the solution by thisamount to attain boiling. Thermodynamically reversible separation defines the minimal energy requirementfor that process. The minimal energy of separation Wmin in such a process is the change in the Gibbs FreeEnergy between the beginning and end of the process, �G. The minimal work when the number of moles of thesolution changes from n1 to n2 is thus
Wmin =∫ n2
n1
(�G) dnW (1)
.Bromley and co-workers (36) have calculated the minimal energy of separation of water from seawater
containing 3.45 wt % salt, at 25◦C, to be 2.55 kJ/(kg fresh water) for the case of zero fresh water recovery(infinitesimal concentration change) and 2.91 kJ/(kg fresh water) for the case of 25% fresh water recovery. Wminis, however, severalfold smaller than the energy necessary for water desalination in practice.
Improved energy economy can be obtained when desalination plants are integrated with power generationplants (37, 38). If the power generation part of such a dual-purpose plant is of the Rankine (steam) type, aback-pressure or extraction turbine is typically used to supply the low pressure and temperature steam asthe heat source for the desalination plant. If the power plant is of the gas-turbine type, the turbine exhaustgas is typically used as the heat source for a boiler which provides heating steam for the desalination plant.Diesel engine reject heat, both from the engine coolant and the exhaust can also be used as the heat sourcefor desalination. Dual-purpose plants lead to important energy savings, but also to increases in capital costand complexity of operation. It is important to be able to deal effectively with possible transient mismatches inpower and water demand. Practically all of the operating distillation-type desalination plants with a capacityabove 1000 m3/d are of the dual-purpose type.
WATER, SUPPLY AND DESALINATION 15
5.2. Materials and Scaling Issues
Two aspects of the basically simple desalination process require special attention. One is the high corrosivityof seawater, especially pronounced in the higher temperature distillation processes, which requires the useof corrosion-resistant, and therefore expensive, materials. Typical materials in use are copper–nickel alloys,stainless steel, titanium, and, at lower temperatures, fiber-reinforced polymers and special concrete composi-tions (39). It is noteworthy that in quest of a lower initial cost, the use of inadequate materials of constructionin many locations combined with poor operation by virtually untrained hands led to rapid deterioration andfailure of plants long before their estimated design life. Adequate experience suggests by now how to avoidsuch failures. The other aspect is scale formation (40, 41), discussed in more detail below.
Obtaining maximum performance from a seawater distillation unit requires minimizing the detrimentaleffects of scale formation. The term scale describes deposits of calcium carbonate, magnesium hydroxide, orcalcium sulfate that can form in the brine heater and the heat-recovery condensers. The carbonates andthe hydroxide are conventionally called alkaline scales, and the sulfate, nonalkaline scale. The presence ofbicarbonate, carbonate, and hydroxide ions, the total concentration of which is referred to as the alkalinity ofthe seawater, leads to the alkaline scale formation. In seawater, the bicarbonate ions decompose to carbonateand hydroxide ions, giving most of the alkalinity.
2 HCO−3 � CO2−
3 + CO2 + H2O
H2O + CO2−3 � 2 OH− + CO2 (2)
The kinetics of the formation of the magnesium hydroxide and calcium carbonate are functions of theconcentration of the bicarbonate ions, the temperature, and the rate of release of CO2 from the solution. Attemperatures up to 82◦C, CaCO3 predominates, but as the temperature exceeds 93◦C, Mg(OH)2 becomes theprincipal scale. Thus, in seawater, there is a considerable tendency for surfaces to scale with an increase intemperature.
The interrelationship of nonalkaline scales (CaSO4, CaSO4·1/2H2O, CaSO4·2H2O) depends on tempera-ture and the concentration of CaSO4. To assure that no hemihydrate scale forms, MSF operators must runtheir plants in such a manner as to assure that the concentration of the total dissolved solids does not exceed70,000 ppm at temperatures of 120◦C. With average-salinity seawater, plants can operate at a concentrationfactor of 2, but in the Middle East where water salinity can be as high as 50,000 ppm, the concentration factorshould not exceed 1.4. Under no circumstances should the total dissolved solids exceed 70,000 ppm, ie, twicethe concentration of normal seawater at 120◦C.
A number of options for controlling scale formation are used in plant operations around the world. Oneapproach is use of mechanical means, including thermal shock. Although rare today (ca 1997), this practicecan be found in use with the few obsolete submerged tube evaporators.
Another approach, the so-called seeding technique, provides preferential sites for the nucleation of scale,which permits the heat-transfer surfaces to remain clean of scale. Extensive studies of this technique havebeen conducted, and field use was reported in the former USSR as early as the mid-1960s (42). The use ofion-exchange methods is another possible approach. For calcium, the exchange can be represented as
2 RNa + Ca2+ −→ R2Ca + 2 Na+ (3)
Magnesium can be exchanged in a similar fashion. To date, cost considerations have prevented the use of ionexchange for scale control.
16 WATER, SUPPLY AND DESALINATION
Another approach is the use of polyphosphate-based blends including proprietary chemicals. The exactmechanism of the observed effect is not completely understood. In the polyphosphate mode of operation, thepolyphosphate is dosed in quantities of 2–5 ppm; periodically, sludge resulting from phosphate treatments isremoved by acid cleaning (see Dispersants).
In another option, the hydrogen ion from added acid decomposes the bicarbonate ions.
HCO−3 + H+ −→ CO2↑ + H2O (4)
About 120 ppm of sulfuric acid must be provided for normal seawater. Control of acid dosing is critical; theamount of acid must be stoichiometric to the alkalinity expressed as CaCO3. In conjunction with acid dosing,the CO2 formed must be removed and some sodium hydroxide added to maintain ca pH 8 in the system.Alternatively, less than-stoichiometric amounts of acid can be added to retain some alkalinity in the untreatedfeed; in either case, CO2 removal is done with packed columns. Acid-dosed feed is passed through a columnwith air flow that sweeps the CO2 from the feed saturated with carbon dioxide. This is usually followed by adeaeration, during which both the air and CO2 are reduced to the levels needed to minimize, if not eliminate,corrosion. Although acid-dosing does permit higher operating temperatures, it often has had a devastatingeffect on plant life.
The option most promising today involves use of a new family of polymers, the so-called high tempera-ture scale-control chemicals. These are compounds that, added in 3–8 ppm, lead to lattice distortion and theformation of a nonadhering scale. Belgard (CIBA-GEIGY) was the first compound exemplifying this type ofMSF operation, which is now steadily displacing acid in the operation of MSF plants around the world, withimportant contribution to plant life (43) (see Dispersants).
While the ambient-temperature operation of membrane processes reduces scaling, membranes are muchmore susceptible not only to minute amounts of scaling or even dirt, but also to the presence of certainsalts and other compounds that reduce their ability to separate salt from water. To reduce corrosion, scaling,and other problems, the water to be desalted is pretreated. The pretreatment consists of filtration, and mayinclude removal of air (deaeration), removal of CO2 (decarbonation), and selective removal of scale-formingsalts (softening). It also includes the addition of chemicals that allow operation without scale deposition, orwhich retard scale deposition or cause the precipitation of scale which does not adhere to solid surfaces, andthat prevent foam formation during the desalination process.
Saline waters, including seawater, contain, besides a variety of inorganic salts, also organic materials andvarious particles. They differ in composition from site to site, and also change with time as a result of bothnatural and human causes. Design and operation of desalination plants requires good knowledge of the salinewater composition and properties (41, 44).
5.3. Desalination Plant Security
Ingestion into the plant of saline water feed which has been contaminated by undesirable components may notonly impair product water quality, but also impair or incapacitate the plant for future operation. Membrane-based desalination plants are exceptionally sensitive to such damage. One of the obvious contaminants, espe-cially in the oil-producing countries, is spilled oil. Heavy metals, detergents and other undesirable componentswhich increasingly pollute the seas and oceans must be kept out of the plant intakes. Screens, filters, and oilbooms are commonly used for protecting the plant intake. The latter have been especially appreciated duringthe Gulf War, in which the Iraqi forces intentionally dumped oil into the Gulf in order to incapacitate thedesalination plants of the Gulf countries. Contamination also arose from their firing of the Kuwaiti oil wellsand destruction of the water treatment facilities which released large amounts of sewage into the Gulf. Asdescribed in (43, 44) they have also engaged in massive destruction of the Kuwaiti desalination and powerplants.

WATER, SUPPLY AND DESALINATION 17
Because of the vulnerability of desalination plants to damage which may arise from poor regional man-agement, accidents, war, and terrorism, and the consequent severe impact on the water supply of countrieswhich primarily depend on desalination, it is vitally important (1) to design the plant with robust safeguardsagainst ingestion of undesirably contaminated saline water, (2) to ensure that regional resources’ managementprevents such contamination, (3) to provide for adequate freshwater storage, and (4) to provide adequate plantsecurity.
6. The Major Desalination Processes
The major water desalination processes that are currently in use or in advanced research stages are describedherein. Information on detailed modeling can be found in the literature cited. The major texts on waterdesalination written since the 1980s are those by Spiegler and Laird (47), Khan (48), which contains manypractical design aspects, Lior (49) on the measurements and control aspects, Heitman (40) on pretreatment andchemistry aspects, and Spiegler and El-Sayed (50), an overview primer. Extensive data sources are providedin References 39 and 51.
7. Distillation Processes
7.1. Multistage Flash Evaporation (MSF)
Almost all of the large desalination plants use the MSF process shown schematically in Figure 3. A photographof a modern operating plant is shown in Figure 4. The seawater feed is preheated by internal heat recoveryfrom condensing water vapor during passage through a series of stages, and then heated to its top temperatureby steam generated by an external heat source. The hot seawater then flows as a horizontal free-surfacestream through a series of stages, created by vertical walls which separate the vapor space of each stagefrom the others. These walls allow the vapor space of each stage to be maintained at a different pressure,which is gradually decreased along the flow path as a result of the gradually decreasing temperature inthe condenser/seawater-preheater installed above the free stream. The seawater is superheated by a few ◦Crelative to the vapor pressure in each stage it enters, and consequently evaporates in each stage along itsflow path. The latent heat of the evaporation is supplied by equivalent reduction of the sensible heat of theevaporating water, resulting in a gradual lowering of the stream temperature. The evaporation is vigorous,causing intensive bubble generation and growth with accompanying stream turbulence, a process known asflash evaporation (52–54). One of the primary advantages of the MSF process is the fact that evaporationoccurs from the saline water stream and not, as in other distillation processes such as submerged tube andmultiple-effect evaporation, on heated surfaces, where evaporation typically causes scale deposition and thusgradual impairment of heat-transfer rates. Also, the fact that the sensible heat of water is much smallerthan its latent heat of evaporation, the specific heat cp = 4.182 kJ/kg per ◦C change of water temperaturevs hfg = 2378 kJ/kg, respectively, and that the top temperature is limited by considerations of scaling andcorrosion, dictate the requirement for a very large flow rate of the evaporating stream. For example, (in thefollowing subscripts b, d, and s refer to distillate, brine, and steam, respectively) in operating between a typicaltop temperature Tb,t of 90◦C at the inlet to the evaporator and an exit temperature Tb,e of 40◦C correspondingto the ambient conditions, the overall temperature drop of the evaporating stream is 50◦C. Using these values,the heat balance between the sensible heat of the water stream, flowing at a mass flow rate mb, and the latentheat needed for generating water vapor (distillate) at a mass flow rate md is
(mb − md) cp(Tb,t − Tb,e
) ≈ mdhfg (5)

18 WATER, SUPPLY AND DESALINATION
Fig. 3. Schematic flow and temperature diagram of the multistage flash (MSF) process for a recirculation type plant.
which yields the brine-to-product mass flow ratio as
mb
md=
hfg
cp(Tb,t − Tb,e
) + 1 =2378
(4.182) (50)+ 1 = 12.37 (6)
Therefore, 12.37 kg saline water are needed in this case to produce 1 kg distillate. This high flow rate incurscorresponding pumping equipment and energy expenses, sluggish system dynamics, and, because the streamlevel depth is limited to about 0.3–0.5 m for best evaporation rates, also requires large evaporator vessels withtheir associated expense.
The generated water vapor rises through a screen (demister) placed to remove entrained saline waterdroplets. Rising further, it then condenses on the condenser tube bank, and internal heat recovery is achievedby transferring its heat of condensation to the seawater feed that is thus being preheated. This internal heatrecovery is another of the primary advantages of the MSF process. The energy performance of distillation

WATER, SUPPLY AND DESALINATION 19
Fig. 4. The 341,000-m3/d multistage flash (MSF) evaporation desalination plant Al Taweelah B in Abu Dhabi, UnitedArab Emirates. Courtesy of Italimpianti SpA. It is a dual-purpose plant, composed of six identical power and desalinationunits. The desalination units at 56,800 m3/d each are currently (1997) the largest in the world. They have 17 recovery and3 reject stages and a Performance Ratio of 8:1. The plant also produces 732 MWe of power.
plants is often evaluated by the performance ratio, PR, typically defined as
PR ≡ md
ms(7)
where m˙s is the mass flow rate of heating steam. Since the latent heat of evaporation is almost the same forthe distillate and the heating steam, PR is also the ratio of the heat energy needed for producing one unitmass of product (distillate) to the external heat actually used for that purpose. Most of the heating of the brinestream to the top temperature Tb,t is by internal heat recovery, and as seen in Figure 3, the external heat inputis only the amount of heat needed to elevate the temperature of the preheated brine from its exit from thehottest stage at Tb,2 to Tb,t.
Assuming for simplification that the temperature drop of the flashing brine, �Tb, is the same in eachstage and that the specific and latent heat of the brine remains the same throughout the plant, the relationshipbetween the number of stages, n, and the performance ratio is expressed by
PR =1
LTDTb,t−Tb,e
+ 1n
(8)
where LTD is the lowest temperature difference between the flashed vapor and the heated feedwater, in eachstage (Fig. 3). Equation 8 shows that increasing the number of stages increases the PR. This implies that moreheat is then recovered internally, which would thus require a larger condenser/brine-preheater heat-transferarea. The required heat transfer area, A, per unit mass of distillate produced for the entire heat recoverysection (composed of nrec stages), and taking average values of the overall vapor-to-feedwater heat transfer
20 WATER, SUPPLY AND DESALINATION
coefficient U and LMTD per stage, is
A =hb, fg
U (LMTD)(9)
where hb,fg is the average latent heat of evaporation of the flashing brine, LMTD, the log-mean temperaturedifference between the vapor condensing on the tubes and the heated brine flowing inside the tubes, for anaverage stage defined as
LMTD =GTD − LTD
ln GTDLTD
=
(Tb,t − Tb,2
) − LTD
ln(
Tb,t−Tb,2LTD
) (10)
where GTD is the greatest temperature difference between the flashing brine and the brine heated in thecondenser. The size of the heat transfer area per unit mass of distillate produced by the plant is
A =hfg,b
Unrec(
Tb,t − Tb,e) ln
(nrec
nrec − PR
)(11)
Examination of this equation will show that the required heat transfer area for the heat recovery section perunit mass of distillate produced, A, increases significantly when PR is increased, and decreases slightly as thenumber of heat recovery stage, nrec, is increased.
The MSF plant shown in Figure 3 is of the recirculation type, where not all of the brine stream emergingfrom the last evaporation stage is discharged from the plant, as it would have been in a once-through type ofplant. A fraction of the emerging brine is mixed with pretreated seawater and recirculated into the condenserof the heat-recovery section of the plant. Because only a fraction of the entire stream in this configuration isnew seawater, which needs to be pretreated (removal of air and CO2, ie, deaeration and decarbonation, and theaddition of chemicals that reduce scale deposition, corrosion and foaming), the overall process cost is reduced.The recirculation plant is also easier to control than the once-through type.
Whereas most of the energy exchange in the plant is internal, steady-state operation requires that energyin an amount equal to all external energy input also be discharged from the plant. Consequently, the heatsupplied in the brine heater plus any pumping energy is discharged in the heat-rejection stages section of theplant (Fig. 3). Assuming, for purposes of estimation, an equal temperature drop in each stage and that thepumping energy can be neglected relative to the heat input in the brine heater indicates that the ratio of thenumber of the heat-recovery to heat-rejection stages is approximately equal to the performance ratio PR.
Further detail about MSF desalination can be found in References (48, 55), and 56. A detailed design ofan MSF plant producing 9,500 m3/d gallons of fresh water per day was published by the U.S. government (57).
7.2. Multi-Effect Distillation (ME)
The principle of the multi-effect (ME) distillation process is that the latent heat of condensation of the vaporgenerated in one effect is used to generate vapor in the next effect, thus obtaining internal heat recoveryand good energy efficiency. Such plants have been used for many years in the salt, sugar, and other processindustries. Several ME plant configurations, most prominently the horizontal tube multi-effect (HTME) (Fig.5) and the vertical tube evaporator (VTE), shown schematically in Figure 6, are in use. In the HTME, vaporis circulated through a horizontal tube bundle, which is subjected to an external spray of somewhat coldersaline water. The vapor flowing in these spray-cooled tubes condenses, and the latent heat of condensationis transferred through the tube wall to the saline water spray striking the exterior of the tube, causing it toevaporate. The vapor generated thereby flows into the tubes in the next effect, and the process is repeatedfrom effect to effect. A low temperature multi-effect distillation plant developed to operate at an upper limit
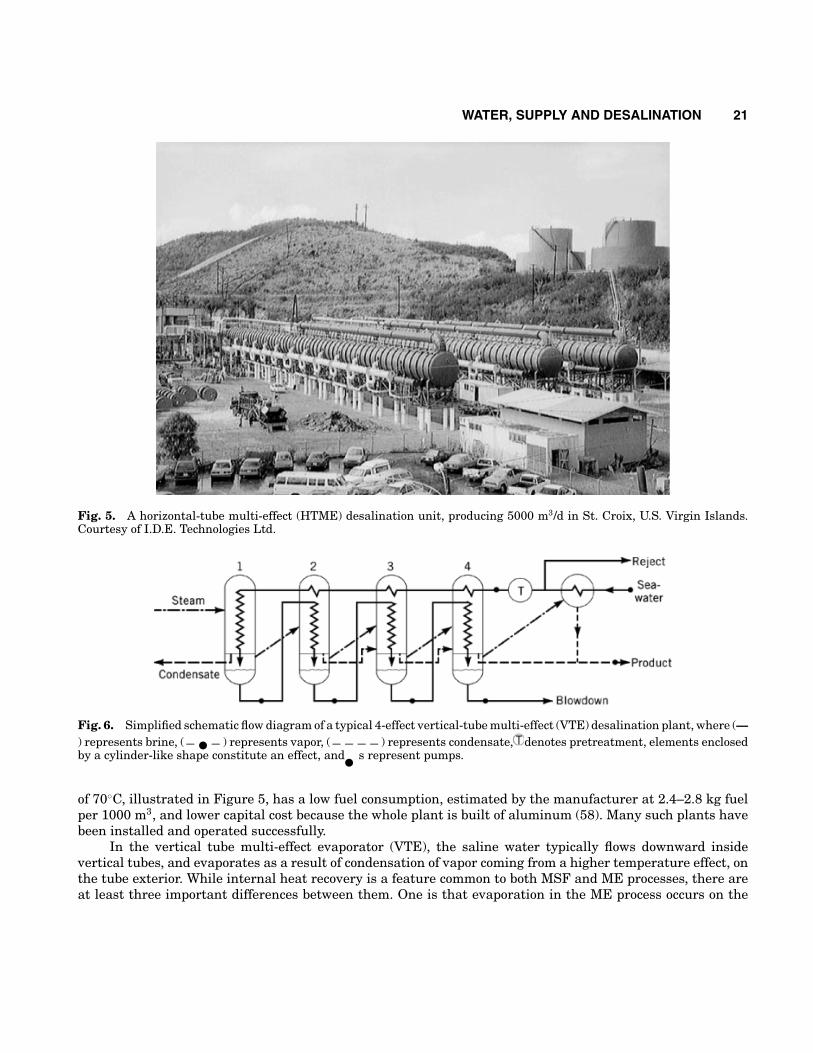
WATER, SUPPLY AND DESALINATION 21
Fig. 5. A horizontal-tube multi-effect (HTME) desalination unit, producing 5000 m3/d in St. Croix, U.S. Virgin Islands.Courtesy of I.D.E. Technologies Ltd.
Fig. 6. Simplified schematic flow diagram of a typical 4-effect vertical-tube multi-effect (VTE) desalination plant, where (—) represents brine, (− �− ) represents vapor, (− − − − ) represents condensate, denotes pretreatment, elements enclosedby a cylinder-like shape constitute an effect, and � s represent pumps.
of 70◦C, illustrated in Figure 5, has a low fuel consumption, estimated by the manufacturer at 2.4–2.8 kg fuelper 1000 m3, and lower capital cost because the whole plant is built of aluminum (58). Many such plants havebeen installed and operated successfully.
In the vertical tube multi-effect evaporator (VTE), the saline water typically flows downward insidevertical tubes, and evaporates as a result of condensation of vapor coming from a higher temperature effect, onthe tube exterior. While internal heat recovery is a feature common to both MSF and ME processes, there areat least three important differences between them. One is that evaporation in the ME process occurs on the
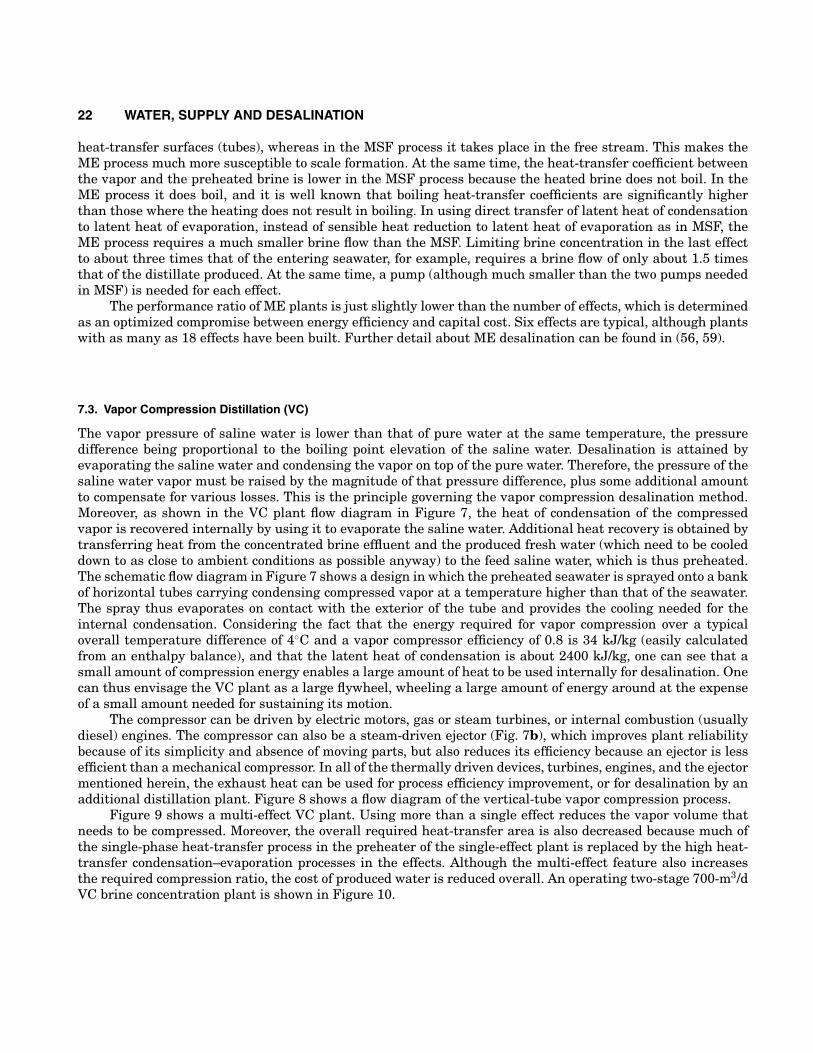
22 WATER, SUPPLY AND DESALINATION
heat-transfer surfaces (tubes), whereas in the MSF process it takes place in the free stream. This makes theME process much more susceptible to scale formation. At the same time, the heat-transfer coefficient betweenthe vapor and the preheated brine is lower in the MSF process because the heated brine does not boil. In theME process it does boil, and it is well known that boiling heat-transfer coefficients are significantly higherthan those where the heating does not result in boiling. In using direct transfer of latent heat of condensationto latent heat of evaporation, instead of sensible heat reduction to latent heat of evaporation as in MSF, theME process requires a much smaller brine flow than the MSF. Limiting brine concentration in the last effectto about three times that of the entering seawater, for example, requires a brine flow of only about 1.5 timesthat of the distillate produced. At the same time, a pump (although much smaller than the two pumps neededin MSF) is needed for each effect.
The performance ratio of ME plants is just slightly lower than the number of effects, which is determinedas an optimized compromise between energy efficiency and capital cost. Six effects are typical, although plantswith as many as 18 effects have been built. Further detail about ME desalination can be found in (56, 59).
7.3. Vapor Compression Distillation (VC)
The vapor pressure of saline water is lower than that of pure water at the same temperature, the pressuredifference being proportional to the boiling point elevation of the saline water. Desalination is attained byevaporating the saline water and condensing the vapor on top of the pure water. Therefore, the pressure of thesaline water vapor must be raised by the magnitude of that pressure difference, plus some additional amountto compensate for various losses. This is the principle governing the vapor compression desalination method.Moreover, as shown in the VC plant flow diagram in Figure 7, the heat of condensation of the compressedvapor is recovered internally by using it to evaporate the saline water. Additional heat recovery is obtained bytransferring heat from the concentrated brine effluent and the produced fresh water (which need to be cooleddown to as close to ambient conditions as possible anyway) to the feed saline water, which is thus preheated.The schematic flow diagram in Figure 7 shows a design in which the preheated seawater is sprayed onto a bankof horizontal tubes carrying condensing compressed vapor at a temperature higher than that of the seawater.The spray thus evaporates on contact with the exterior of the tube and provides the cooling needed for theinternal condensation. Considering the fact that the energy required for vapor compression over a typicaloverall temperature difference of 4◦C and a vapor compressor efficiency of 0.8 is 34 kJ/kg (easily calculatedfrom an enthalpy balance), and that the latent heat of condensation is about 2400 kJ/kg, one can see that asmall amount of compression energy enables a large amount of heat to be used internally for desalination. Onecan thus envisage the VC plant as a large flywheel, wheeling a large amount of energy around at the expenseof a small amount needed for sustaining its motion.
The compressor can be driven by electric motors, gas or steam turbines, or internal combustion (usuallydiesel) engines. The compressor can also be a steam-driven ejector (Fig. 7b), which improves plant reliabilitybecause of its simplicity and absence of moving parts, but also reduces its efficiency because an ejector is lessefficient than a mechanical compressor. In all of the thermally driven devices, turbines, engines, and the ejectormentioned herein, the exhaust heat can be used for process efficiency improvement, or for desalination by anadditional distillation plant. Figure 8 shows a flow diagram of the vertical-tube vapor compression process.
Figure 9 shows a multi-effect VC plant. Using more than a single effect reduces the vapor volume thatneeds to be compressed. Moreover, the overall required heat-transfer area is also decreased because much ofthe single-phase heat-transfer process in the preheater of the single-effect plant is replaced by the high heat-transfer condensation–evaporation processes in the effects. Although the multi-effect feature also increasesthe required compression ratio, the cost of produced water is reduced overall. An operating two-stage 700-m3/dVC brine concentration plant is shown in Figure 10.
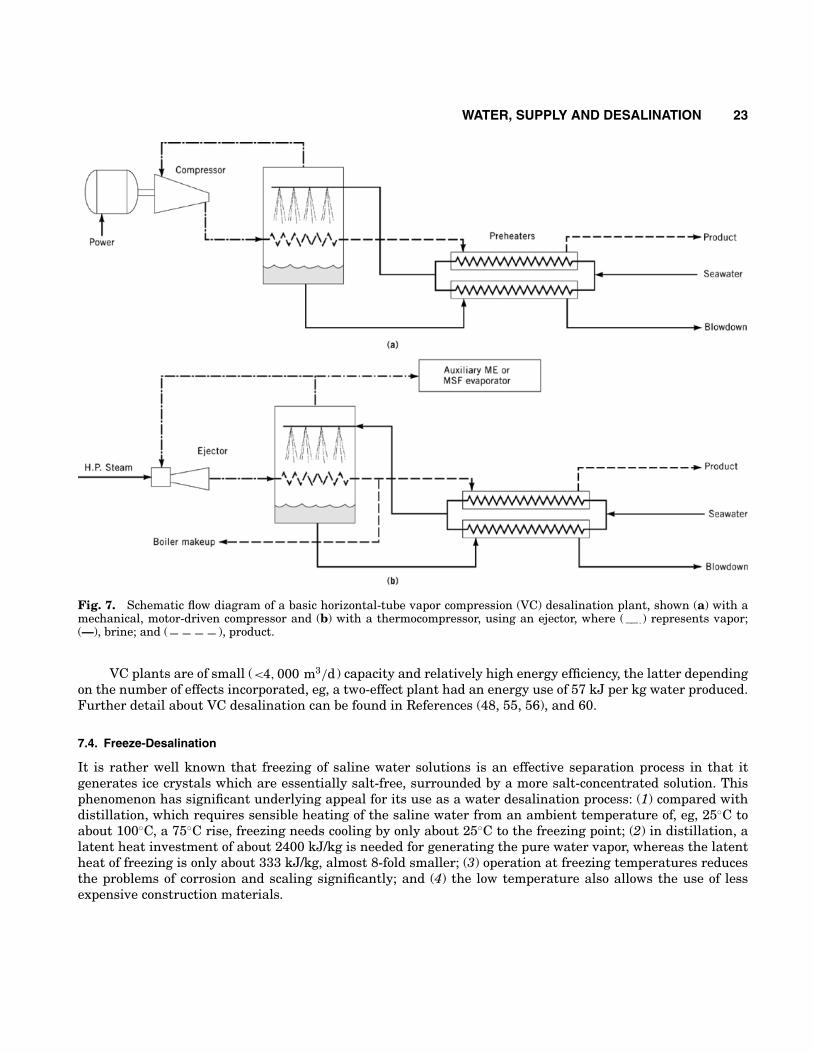
WATER, SUPPLY AND DESALINATION 23
Fig. 7. Schematic flow diagram of a basic horizontal-tube vapor compression (VC) desalination plant, shown (a) with amechanical, motor-driven compressor and (b) with a thermocompressor, using an ejector, where (−·−·) represents vapor;(—), brine; and (− − − − ), product.
VC plants are of small (<4, 000 m3/d) capacity and relatively high energy efficiency, the latter dependingon the number of effects incorporated, eg, a two-effect plant had an energy use of 57 kJ per kg water produced.Further detail about VC desalination can be found in References (48, 55, 56), and 60.
7.4. Freeze-Desalination
It is rather well known that freezing of saline water solutions is an effective separation process in that itgenerates ice crystals which are essentially salt-free, surrounded by a more salt-concentrated solution. Thisphenomenon has significant underlying appeal for its use as a water desalination process: (1) compared withdistillation, which requires sensible heating of the saline water from an ambient temperature of, eg, 25◦C toabout 100◦C, a 75◦C rise, freezing needs cooling by only about 25◦C to the freezing point; (2) in distillation, alatent heat investment of about 2400 kJ/kg is needed for generating the pure water vapor, whereas the latentheat of freezing is only about 333 kJ/kg, almost 8-fold smaller; (3) operation at freezing temperatures reducesthe problems of corrosion and scaling significantly; and (4) the low temperature also allows the use of lessexpensive construction materials.

24 WATER, SUPPLY AND DESALINATION
Fig. 8. Pictorial view (a) and flow diagram (b) for a vertical-tube vapor-compression process. Courtesy of ResourcesConservation Co.
Cooling to the freezing point can be attained by using a mechanically or thermally driven refrigerationprocess where a refrigerant is cooled down and used to withdraw heat from the saline water, a process knownas secondary refrigerant direct or indirect freezing. Another way, shown in Figure 11, is by using the wateritself as the refrigerant in the direct freezing process (61). Pretreated and deaerated seawater is precooledin a heat exchanger, where the product and blow-down brine are thus heated to ambient temperature. The

WATER, SUPPLY AND DESALINATION 25
Fig. 9. Schematic flow diagram of a multi-effect vapor-compression submerged-tube desalination plant with three effects,where (−·−· ) represents vapor; (—), brine; and (− − − − ), product.
cooled seawater then enters a vacuum chamber, ∼500 Pa , in which the pressure is below that correspondingto saturation. The seawater therefore flashes there into vapor, just like the phenomenon in a stage of a multi-stage flash evaporation plant. All of the latent heat of evaporation is obtained from the sensible heat of thesolution, thus reducing its temperature significantly and causing it to freeze into freshwater crystals. Thefreezing point of saline water is depressed to below that of freshwater to a degree proportional to the saltconcentration. The concentration in the crystallizer is about twice that of raw seawater, and the freezing pointis then about −3.8◦C. To condense the vapor, also composed of freshwater, it is compressed to a pressure thatis high enough to allow its condensation on the formed ice, ie, corresponding approximately to that at thesaturation temperature of pure water, 0◦C.
The ice crystals must be separated from the saline solution surrounding them, and washed with fresh-water. This is accomplished by a downward countercurrent flow of a small amount of freshwater through theice slurry in the washer–melter unit. Keeping that unit at about 0◦C limits the needed pressure rise by thecompressor to only about 130–260 Pa, and an auxiliary refrigerator is often used to compensate for heat gainsfrom the ambient and the compression.
In principle, freeze-desalination is perhaps the most energy-efficient desalination process, but it has notyet (ca 1997) reached commercial introduction for several reasons, such as the difficulty in developing efficientand economical compressors for vapor having the extremely high specific volume at the low process pressure,and difficulties in maintaining the vacuum system leak-free and in effecting reliable washing of the ice crystals.A review of freeze desalination processes is given in Reference 62.

26 WATER, SUPPLY AND DESALINATION
Fig. 10. A two-stage 700-m3/d VC brine concentration plant.(Courtesy of I.D.E. Technologies Ltd.)
8. Membrane Separation Processes
8.1. Reverse Osmosis (RO)
The reverse osmosis process may be introduced by comparing it to the well-known process of filtration, whichseparates particulate matter from a fluid by applying pressure to the fluid and passing it through a porousmembrane. Here particles larger than the pore size remain on the upstream side of the membrane and the fluidcleaned thereby flows to its downstream side. Semipermeable, very dense membranes that actually separatesalt molecules (ions) from the water, by similarly keeping the salt on the upstream side and allowing thepressurized pure water to flow through the membrane, were developed in the late 1950s and early 1960s. Thereverse of this process, osmosis, is well known. For example, if a membrane is placed to separate water froman aqueous salt solution, and the membrane is semipermeable (here meaning that it permits transfer of wateronly, not the salt components in the aqueous solution) the water will naturally migrate through this membraneinto the salt solution until the thermodynamic potentials are balanced. Osmosis is, for example, the majormass transport phenomenon across living cells. The driving force for this water flux is the thermodynamicpotential difference, proportional to the concentration difference between the two sides of the membrane, and

WATER, SUPPLY AND DESALINATION 27
Fig. 11. Flow diagram of the vacuum-freeze (direct) vapor-compression desalination process.
is exhibited as the so-called osmotic pressure. For typical seawater at 25◦C, the osmotic pressure is higher by2.51 MPa on the freshwater side of the membrane. If a pressure higher than the osmotic pressure is appliedto the concentrated solution side of the membrane, the water will move across the membrane in the reversedirection, from the saline solution side to the pure water one. This process is called reverse osmosis (andsometimes hyperfiltration), and is the basic principle underlying reverse-osmosis desalination.
Unlike filtration of particulates, the selective filtration of the water in reverse osmosis is not the resultof the relationship of the membrane pore size to the relative sizes of the salt and water molecules. One wayto view the process is that the very thin active surface layer of the membrane forms hydrogen bonds withwater molecules and thus makes them unavailable for dissolving salt. Salt thus cannot penetrate through thatlayer. Water molecules approaching that pure water layer are, however, transported through it by forming suchhydrogen bonds with it and in that process displacing water molecules that were previously hydrogen-bondedat these sites. The displaced water molecules then move by the forces of the hydraulic pressure differencethrough the pores of the remainder of the membrane, emerging at its other side. Several other mechanisms forexplaining and modeling RO transport exist in the literature (63–67). It is noteworthy that RO also separatessmall-molecule organic solutes from the water.
The prevalent membrane configurations used in RO plants are of the spiral-wound and hollow fiber types.The basic spiral-wound-type module (Fig. 12a) is made of two sheets placed upon each other and rolled togetherin a spiral around a cylindrical perforated tube. One of the sheets is in the form of a sandwich typically composedof five layers bonded together along three edges. The two outer layers are the semipermeable membranes. Eachof them is backed by a porous material layer for mechanical strength, and the central layer is a thicker porousmaterial layer that collects and transports the produced fresh water. The second sheet is a porous mesh spacer

28 WATER, SUPPLY AND DESALINATION
Fig. 12. A spiral-wound reverse osmosis membrane element: (a) schematic depiction; (b) cross section of a spiral-woundthin-film composite RO Filmtec membrane element (40% conversion). Courtesy of Dow Chemical Co.
through which the high-pressure saline water feed is passed in an axial direction. Product water separatesfrom the saline solution and permeates through the two adjacent semipermeable membranes into the centralproduct-water carrying layer, which conducts it spirally to the unbonded edge of the sandwich to the centralperforated tube. The semipermeable membranes are typically made from cellulose acetate, and more recentlyhave been made from composites of polyamide polymers on polysulfone support membranes. Fig. 12b shows aversion of a contemporary commercial element of that type.
Hollow-fiber modules have a configuration similar to a shell-and-tube heat exchanger, with the fiberstaking the place of the tubes. A very large number of typically 25–250 µm outside-diameter semipermeable
WATER, SUPPLY AND DESALINATION 29
Fig. 13. A hollow-fiber reverse osmosis membrane element. Courtesy of DuPont Permasep. In this twin design, thefeedwater is fed under pressure into a central distributor tube where half the water is forced out radially through the first,ie, left-hand, fiber bundle and thus desalted. The remaining portion of the feedwater flows through the interconnector toan annular feed tube of the second, ie, right-hand, fiber bundle. As in the first bundle, the pressurized feedwater is forcedout radially and desalted. The product water flows through the hollow fibers, collects at each end of the element, and exitsthere. The concentrated brine from both bundles flows through the concentric tube in the center of the second bundle andexits the element on the right.
hollow fibers (wall thickness typically 5–50 µm) are bundled together and placed in a saline water-pressurevessel. The hollow core of each fiber is sealed on one end. The pressurized saline water is brought into themodule through a central porous feed tube (Fig. 13) to circulate on the exterior surface of the fibers, and waterpermeates through the fiber wall into its hollow core, through which it flows to a permeate collection manifoldat the open end of the fiber bundle. The increasingly concentrated saline water flows radially and is dischargedat the exterior shell of the bundle. The hollow fibers are typically made of polyamide or cellulose triacetate,and offer about 20-fold more surface (separation) area per unit volume than the spiral-wound configuration.
The basic approximate equation for the separation process gives the water flux, m′′w (kg/m2/s) across an
RO membrane, in the absence of fouling, as
m′′w = Kpe Kcf
[(Pf − Pp
) − (π f − πp
)](12)
where Kpe = the water permeability constant of the membrane (in kg/m2/s·Pa), typically increasing stronglyas the temperature rises: a plant designed to operate at 20◦C may produce up to 24% more water if the watertemperature is 28◦C; Kcf = the Compaction Correction Factor (dimensionless) which corrects for the fact thatthe flux is reduced as a result of densification of the barrier layer (a phenomenon similar to creep) of themembrane, and which increases with the operating pressure and temperature. It is often calculated by therelationship
Kcf = BC (T) C (P) C (t) (13)
where B is a constant, C(T) represents the temperature dependence of the compaction correction factor for theparticular membrane of interest;C(P) represents its pressure dependence: whereas a higher pressure differenceacross the membrane is shown in equation 12 to increase the water flux, higher feed pressure, (Pf ), also tends
30 WATER, SUPPLY AND DESALINATION
to compact the membrane and thus reduce its water flux, typically according to
C (P) = Pnf (14)
where n is a negative number, and where the time dependence C(t) is represented by
Ccf = tm (15)
where t is the operating time (eg, in days) and m is a negative number depending on the membrane; P = wateror saline solution pressure (in Pa); π = osmotic pressure (in Pa); and the subscripts f and p pertain to the salinefeed water and to the desalted product water, respectively.
The required membrane area A can be estimated by
A =mp
m′′p f
(16)
where m˙p is the freshwater mass-production rate of the plant, and f (0 < f ≤ 1.0) is the area utilization factorthat corrects for the fact that the membrane surface is incompletely in contact with the saline water feedstream owing to the porous mesh and other devices, such as turbulence promoters, placed in the feed streampath; in a good design f < 0.9.
Examination of equation 12 shows that water separation rate increases with the Water PermeabilityConstant Kpe. Unfortunately, the salt flux across the membrane also does, resulting in a more salty product.An approximation for this salt flow is
ms = KKs(C f m − Cp
)(17)
where ms = salt mass transfer rate across the membrane, kg/s; K = a proportionality constant, dimensionless;Ks = the salt permeation constant, kg/s, which increases with pressure and temperature.
The salinity of the product water, Cp, can be estimated by the formula
Cp = Kcp (1 − η) C (18)
where Kcp = the concentration polarization coefficient, ≡ C f m/C , a measure of the increase of the feedwatersalinity at the membrane wall beyond that of the bulk solution; C f m = the the salt concentration at themembrane wall; C = the bulksalinity of the saline water feed, ≈ (C f + Cr)/2 , where Cr = the salt concentrationof the reject brine; and η = the salt rejection factor, ≡ (amount of salts rejected by the membrane)/(amount ofsalts in the brine feed).
The pressure to be used for reverse osmosis depends on the salinity of the feedwater, the type of membrane,and the desired product purity. It ranges from about 1.5 MPa for low feed concentrations or high flux membranes,through 2.5–4 MPa for brackish waters, and to 6–8.4 MPa for seawater desalination. In desalination of brackishor sea water, typical product water fluxes through spiral-wound membranes are about 600–800 kg/m2/d at arecovery ratio RR of 15% and an average salt rejection of 99.5%, where
RR =mp
mf
∼= 1 − C f
Cr(19)
The fluxes in hollow-fiber membranes used in seawater desalination are 20–30-fold smaller, but the overallRO system size does not increase because the hollow-fiber membranes have a much larger surface area per

WATER, SUPPLY AND DESALINATION 31
module unit volume. In use with seawater, their RR is about 12–17.5% and the salt rejection ratio is up to99.5%.
Because the concentrated reject brine is still at high pressure, it is possible to recover energy by passingthis brine through hydraulic turbines and thus reduce the overall energy consumption by up to 20%. Theenergy requirements of seawater RO desalination plants with energy recovery are about 5–9 kWh, or 18–33MJ, of mechanical or electric power per m3 fresh water produced. In comparison, the MSF desalination processrequires about 120–280 MJ of heat and about 15 MJ of mechanical/electric power (for pumping and auxiliaries)per m3. The energy requirement of the RO process is thus smaller than that of the MSF process even if theRO energy requirement is multiplied by the thermal-to-mechanical (or electrical) power conversion factor of3–4. The specific exergy (or availability, the thermodynamic potential of useful work) consumption of the MSFprocess using 120◦C steam is about 2–3-fold higher than that of the RO process, but becomes comparable inmagnitude if the steam temperature is lowered to 80◦C.
The life of membranes is affected by gradual chemical decomposition or change. For example, celluloseacetate membranes hydrolyze with time. The rate of hydrolysis has a steep minimum at a solution pH of4.5–5.0, and increases drastically with temperature.
Membranes are very susceptible to fouling by solids (soil, sand, colloids, precipitated salts and corrosionproducts, and microbial growth) and to deterioration in their selectivity caused by various species presentin the saline water. Very careful pretreatment of the feedwater is therefore necessary. It typically consistsof clarification, filtration, chlorination for destroying organic matter and microorganisms, removal of excesschlorine to prevent membrane oxidation, and dosing with additives to prevent calcium sulfate scaling andfoam formation. Periodical chemical or mechanical cleaning is also necessary. Pretreatment and cleaning aresignificant and increasing fractions of the RO plant capital and operating costs.
The plant scheme shown in Figure 14a is generally used in brackish-water conversion; that in Figure 14bis utilized in seawater-conversion plants.
Further detail about RO desalination can be found in References (60–64).
8.2. Electrodialysis
In electrodialysis (ED), the saline solution is placed between two membranes, one permeable to cations onlyand the other to anions only. A direct electrical current is passed across this system by means of two electrodes,causing the cations in the saline solution to move toward the cathode, and the anions to the anode. As shownin Figure 15, the anions can only leave one compartment in their travel to the anode, because a membraneseparating them from the anode is permeable to them. Cations are both excluded from one compartment andconcentrated in the compartment toward the cathode. This reduces the salt concentration in some compart-ments, and increases it in others. Tens to hundreds of such compartments are stacked together in practicalED plants, leading to the creation of alternating compartments of fresh and salt-concentrated water. ED is acontinuous-flow process, where saline feed is continuously fed into all compartments and the product water andconcentrated brine flow out of alternate compartments. The flow along the membranes also improves the masstransport there, and the separators between the membranes are constructed to provide good flow distributionand mixing on the membrane surfaces. Membrane sizes are often about 0.5 × 1 m, spaced about 1 mm apart.Many types of polymers are used to manufacture these ion-exchange-selective membranes, which are oftenreinforced by strong fabrics made of other polymers or glass fibers.
Since membrane fouling could quickly render the system inefficient, very careful and thorough feedwaterpretreatment similar to that described in the section on RO, is required. Some pretreatment needs, andoperational problems of scaling are diminished in the electrodialysis reversal (EDR) process, in which theelectric current flow direction is periodically (eg, 3–4 times/h) reversed, with simultaneous switching of thewater-flow connections. This also reverses the salt concentration buildup at the membrane and electrode

32 WATER, SUPPLY AND DESALINATION
Fig. 14. Reverse osmosis plant configurations. (a) A single-stage RO plant configuration with parallel membrane assem-blies, with some typical operational parameters given. (b) A multistage RO plant configuration with reject staging. Thisconfiguration is referred to as having a cascade, tapered, or pyramid configuration. Two stages are shown here; three-stageunits, with recoveries of 85–90%, are also used.
surfaces, and prevents concentrations that cause the precipitation of salts and scale deposition. A schematicand photograph of a typical ED plant are shown in Figure 16.
The voltage used for electrodialysis is about 1 V per membrane pair, and the current flux is of the order of100 A/m2 of membrane surface. The total power requirement increases with the feedwater salt concentration,

WATER, SUPPLY AND DESALINATION 33
Fig. 15. Ion movements in the electrodialysis process. Courtesy U.S. Agency for International Development. (a) Many ofthe substances which make up the total dissolved solids in brackish water are strong electrolytes. When dissolved in water,they ionize; ie, the compounds dissociate into ions which carry an electric charge. Typical of the ions in brackish waterare Cl− , Na+, HCO−
3 , Mg2+ , SO2−4 , and Ca2+. These ions tend to attract the dipolar water molecules and to be diffused, in time,
fairly evenly throughout a solution. (b) If two electrodes are placed in a solution of ions, and energized by a battery or otherdirect-current source, the current is carried through the solution by the charged particles and the ions tend to migrate tothe electrode of the opposite charge. (c) If, alternatively, fixed-charge membranes, which are selectively permeable to ions ofthe opposite charge, are placed in the path of the migrating ions, the ions are trapped between the alternate cells formed. Apositively fixed-charge (anionic) membrane allows negative ions to pass but repels positive ions. A negatively fixed-charge(cationic) membrane allows positive ions to pass, but repels negative ions. (d) If this continues, almost all the ions becometrapped in the alternate cells, which lack ions, have a lower level of dissolved constituents, and have a high resistance tocurrent flow. (e) The phenomenon illustrated above is used in electrodialysis to remove ions from incoming saline water ona continuous basis. Feedwater enters both the concentrate and product cells. Up to about half of the ions in the productcells migrate and are trapped in the concentrate cells. Two streams emerge from the device: one of concentrated brine andthe other with a much lower concentration of dissolved solids (product water).
amounting to about 10 MW per m3 product water per 1000 ppm reduction in salinity. About half this power isrequired for separation and half for pumping. Many plant flow arrangements exist, and their description canbe found, along with other details about the process, in References 68 and 69. Many ED plants, as large as15,000 m3/d, are in operation, reducing brackish water concentration typically by a factor of 3–4.
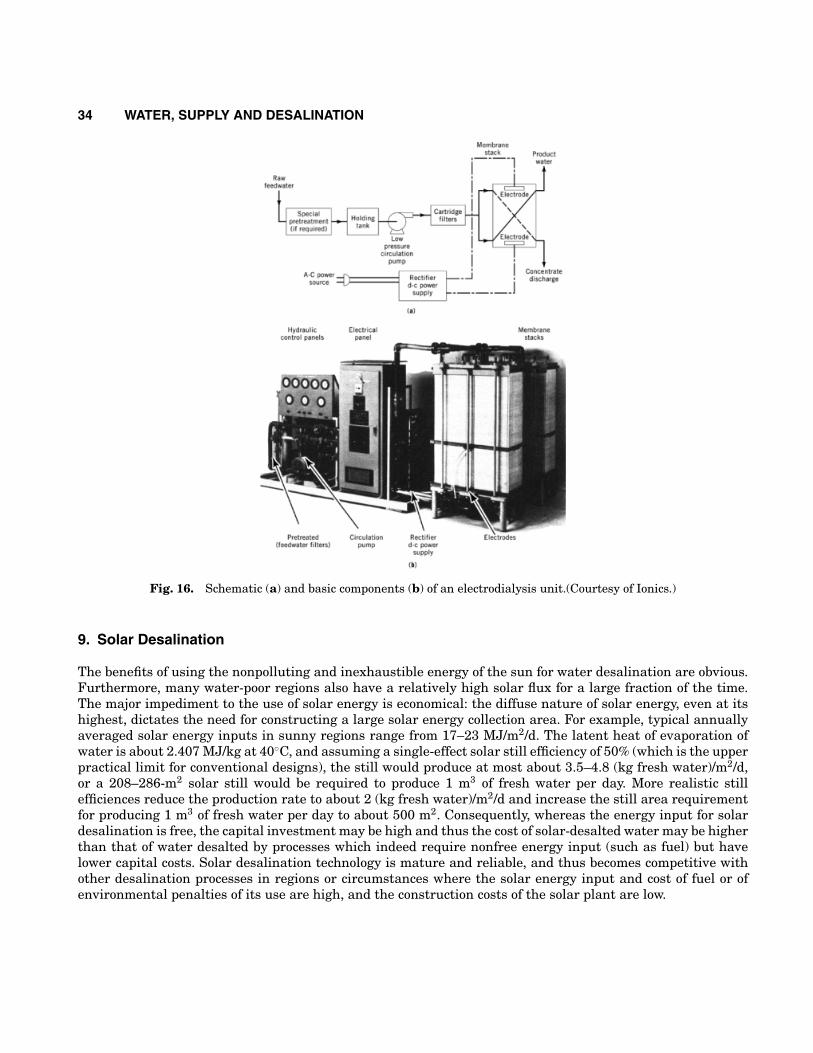
34 WATER, SUPPLY AND DESALINATION
Fig. 16. Schematic (a) and basic components (b) of an electrodialysis unit.(Courtesy of Ionics.)
9. Solar Desalination
The benefits of using the nonpolluting and inexhaustible energy of the sun for water desalination are obvious.Furthermore, many water-poor regions also have a relatively high solar flux for a large fraction of the time.The major impediment to the use of solar energy is economical: the diffuse nature of solar energy, even at itshighest, dictates the need for constructing a large solar energy collection area. For example, typical annuallyaveraged solar energy inputs in sunny regions range from 17–23 MJ/m2/d. The latent heat of evaporation ofwater is about 2.407 MJ/kg at 40◦C, and assuming a single-effect solar still efficiency of 50% (which is the upperpractical limit for conventional designs), the still would produce at most about 3.5–4.8 (kg fresh water)/m2/d,or a 208–286-m2 solar still would be required to produce 1 m3 of fresh water per day. More realistic stillefficiences reduce the production rate to about 2 (kg fresh water)/m2/d and increase the still area requirementfor producing 1 m3 of fresh water per day to about 500 m2. Consequently, whereas the energy input for solardesalination is free, the capital investment may be high and thus the cost of solar-desalted water may be higherthan that of water desalted by processes which indeed require nonfree energy input (such as fuel) but havelower capital costs. Solar desalination technology is mature and reliable, and thus becomes competitive withother desalination processes in regions or circumstances where the solar energy input and cost of fuel or ofenvironmental penalties of its use are high, and the construction costs of the solar plant are low.

WATER, SUPPLY AND DESALINATION 35
Fig. 17. A typical basin-type solar still.
A typical solar still, shown in Figure 17, consists of a saline water container in which the water is exposedto the sun and heated by it. The temperature rise to above ambient causes net evaporation of the salinewater, thus separating pure water vapor from the solution. The transparent cover of the still serves severalimportant functions: it prevents vapors from escaping the still; exposed to air at temperatures lower than theheated saline water in the basin, it serves as a condenser for the vapor; given proper inclination and geometricconfiguration, it channels the condensed fresh water to product collection troughs; it reduces heat loss fromthe warm saline water to the outside; and it prevents dirt from entering the still. However, it also must be astransparent as possible to solar radiation so that maximal heat gain by the still can be accomplished.
Because water of depths below about 2 m does not absorb much solar radiation directly, the radiation isabsorbed and converted to heat primarily in the basin floor, which thus should have high radiative absorptancein the solar radiation spectrum. It is also noteworthy that if the still is designed to have low heat losses to theambient, and if the ambient temperature drops, distillation will continue for some time even in the absence ofsolar energy input, because the saline water may remain warmer than the condensing glass surface and thuscontinue evaporating.
Solar stills of the type depicted in Figure 17, in many sizes and constructional variants, have been builtand used successfully in many countries in the world. They are simple, easy to construct, reliable, and requirevery little maintenance.
Because the heat of condensation in single-effect stills of the type shown in Figure 17 is lost to theambient, it is obvious that more energy-efficient operation would be achieved if a multi-effect design couldbe implemented, in which the heat of condensation is used to evaporate additional saline water. There areseveral problems with the design implementation of this concept. The principal one is the rather low availabletemperature driving force for separation in even a single-effect still: the condensation temperature is theambient, say at 25◦C, whereas the diurnal average temperature of the saline water in the still is around 40◦C,only 15◦C higher. Another difficulty is configurational, owing to the need for adding effects without at the sametime obstructing solar radiation incidence on the saline water. A number of such stills were built and testedsuccessfully, but are not yet (ca 1997) commercially competitive.
Solar stills integrate the desalination and solar energy collection processes. Another approach to solardesalination is to use separately a conventional desalination process and a solar energy supply system suitable

36 WATER, SUPPLY AND DESALINATION
for it. Any compatible desalination and solar energy collection processes could be used. Distillation, such asMSF or ME, can be used with heat input from solar collectors or concentrators (70) or from solar ponds (71–73).Net average solar energy conversion efficiencies of solar collectors (74, 75) are about 25%, and of solar ponds(r71–r73,r76,r77), 18%, similar to that of solar stills, but the MSF or ME plants can operate at performanceratios of 10 or more, thus basically increasing the freshwater production rate by at least tenfold, or reducingthe required solar collection area by at least tenfold for the same production rate.
Still in the R&D stage, open-cycle ocean–thermal energy conversion (OTEC) plants using surface con-densers produce desalted water (78, 79). The concept is illustrated in Figure 18. The warmer surface oceanwater is pumped into a flash evaporation vessel from which the air has been evacuated. The vapor generatedby flashing passes through a turbine and thus produces power, and is then condensed in a deaerated surfacecondenser cooled by colder (typically by about 20◦C) seawater pumped to it from the ocean depths. The con-densed vapor is freshwater, which can then be pumped out and used. In addition to requiring no fuel or otherform of nonrenewable energy, OTEC and solar pond desalination have an advantage in that thermal energystorage is naturally included in the large thermal mass of the ocean or pond, while such storage may need tobe constructed where the heat to the desalination process is supplied by solar collectors. It is noteworthy thatfresh water can be produced by the OTEC-type cycle even without power production.
Solar or wind energy can also be used for desalination processes which are driven by mechanical orelectrical power, such as VC, RO, and ED. The solar heat can be used to generate the required power by avariety of means. Figure 19 shows the flow diagram of a reverse osmosis plant in which the pumps are drivenby photovoltaic solar cells, built by the French Atomic Energy Commission at Cadarache, France (80). A similarsystem, powered by an 8-kW array of photovoltaic modules has also been installed in Jedda, Saudi Arabia (81).A wind-powered vapor compression desalination demonstration plant using a 60-kW (max) electric poweroutput wind turbine and producing up to 48 m3/d of freshwater was installed on the island of Borkum, and aprototype plant using a 300 kW (max) electric power wind turbine and producing up to 360 m3/d of freshwaterwas installed on the island of Rugen, both in the North Sea of Germany (82). The electricity produced by thewind-turbine–generator system is used to drive the VC plant compressor and to provide resistance heat to theVC system. Variable water output by the plant resulting from variations in wind velocity is accommodatedeasily by product water storage. The reported initial results have shown efficient and reliable operation.
10. Summary and Future Prospects
Rising population, standards of living, and water pollution are gradually diminishing the amounts of naturallyavailable freshwater of good quality, whereas the demand is relentlessly increasing. Manufactured water inthe form of water desalination is today making a considerable contribution to the world’s potable water supplyas well as water for industry, ranging from boiler feedwater for the power industry to ultrapure water for theelectronics industry. The process industries are also looking at desalination technology either for better processwater, or as means of conservation through recycling of wastewaters. In some industries, it is considered atechnique for recovering some process chemicals from water and lowering the cost of purification of pollutingdischarges. Some desalinated water is also used in agriculture, but only to a limited extent because of cost. Thetechnology is improving both in cost–performance and reliability, as evidenced not only by the rapid growthin worldwide desalination capacity, but also by the encouraging observation that costs of desalted water haveremained the same despite inflation.
Although desalination technologies are diverse, MSF has been for some time, and will remain well intothe next century, the main process for desalination of seawater. Inroads are being made by the multi-effectprocesses and, in particular, by the low temperature ME processes.
Important advances in the membrane field were responsible for the commercialization of seawater RO.This technique both saves energy and offers much-reduced plant construction time. Compared with distillation,

WATER, SUPPLY AND DESALINATION 37
Fig. 18. Flow schematic of an open-cycle ocean–thermal energy conversion (OTEC) and desalination plant (77), where(—) represents liquids; (− − −), vapors or gases.
RO treatment of seawater has had a meteoric success beginning in the early 1990s, and further growth isexpected. Considering brackish-water RO and EDR as well, the membrane processes have become an integraland growing part of desalination. In fact, their combined growth appears to exceed that of distillation.
The steady growth in water consumption around the world without any real growth of available waterresources is focusing increasing attention on water reuse. Desalination technology is expected to be an integralpart of all water reuse schemes. Water reuse is already receiving serious consideration ca 1997, and within thenext ten years there will be water-reuse schemes in virtually all areas of water use, ie, not only in water-scarceregions, but also in water-abundant regions such as the industrial northeast of the United States. Municipalauthorities will become intimately involved in conversion of their wastewater in the future.
Much progress has been effected in desalination technology, but all desalination processes remain energy-intensive. Although energy costs have prompted the consideration of renewable energy resources as sources fordesalination, these sources are unlikely to become significant, except in certain limited circumstances, untilthere are significant unforeseen breakthroughs in either energy conversion or desalination technologies.

38 WATER, SUPPLY AND DESALINATION
Fig. 19. Flow diagram of the experimental solar RO unit at Cadarache, France. Feedwater flow=1.38 L/s , product waterflow=0.69 L/s , energy consumption without recovery=0.89 kW−h/m3 (76).(Courtesy of Commissariat d’Energie Atomique, France.)
Despite the cost of desalination technology, it has made water available in places where it was not before.Not only has water become available in these places, but the quantities available have also opened prospectsfor industrial development. This has led to important improvements in the standard of living with prospectsfor even further improvements in countries fortunate enough to be able to meet the cost of the technology.
BIBLIOGRAPHY
“Water, Demineralization” in ECT 1st ed., Suppl. 1, pp. 908–930, by E. R. Gilliland, Massachusetts Institute of Technology;“Water Supply and Desalination” in ECT 2nd ed., Vol. 22, pp. 1–65, by D. F. Othmer, Polytechnic Institute of Brooklyn; inECT 3rd ed., Vol. 24, pp. 327–366, by R. Bakish, Bakish Materials Corp.
Cited Publications
1. A. LaBastille and T. Spiegal, Nat. Geograph., 652 (Nov. 1981).2. National Acid Precipitation Assessment Program (NAPAP), 1992 Report to Congress, NAPAP, Washington, D.C., 1992.3. Bus. Week (Feb. 22, 1969).4. R. Hurwitz, personal communication, New York City Dept. of Environmental Protection, Bureau of Water Supply, 1996;
A. O. Sulzberger, N.Y. Times (Aug. 10, 1981).5. J. Opie, Ogallala Water for a Dry Land, University of Nebraska Press, Lincoln, Neb., 1993.6. California Department of Water Resources, California Water Plan Update, Bulletin 160-93, Oct. 1994; W. S. Swain,
USGS, personal communication, U.S. Geological Survey, Sacramento, CA, 1996.7. J. Koenig, J. Am. Water Works Assoc. 51, 845 (1959).
WATER, SUPPLY AND DESALINATION 39
8. M. D. Farrell, Int. Desalin. Water Reuse Q. 6(1), 20–29 (1996).9. J. Dahme, personal communication, Philadelphia Water Dept., 1996.
10. W. B. Solley, R. R. Pierce, and H. A. Perlman, Estimated Use of Water in the United States in 1990, U.S. GeologicalSurvey Circular 1081, USGS, Denver, Colo., 1993.
11. U.S. Dept. of Agriculture Forest Service, RPA Assessment of the Forest and Rangeland Situation in the U.S., 1983, and1993 Update, Forest Resources Reports No. 26 and 27, Washington, D.C.
12. D. G. Argo, Proceedings Second Annual Conference, National Water Supply Improvement Association, 1974.13. W. R. Mills, Jr., Orange County Water District Wastewater Reclamation, Talbert Barrier and Recharge Project, Annual
Report 91-121 for the California Regional Water Quality Control Board, Santa Ana Region, 1995.14. U.S. Environmental Protection Agency (EPA), National Quality Inventory, 1994 Report to Congress, Report EPA841-R-
95-05, Washington, D.C., 1995.15. T. Gilchrist and R. I. Saunders, Int. Desalin. Water Reuse Q. 5(4), 50–54, (1995).16. A. Bruno-Vega and K. S. Thomas, Int. Desalin. Water Reuse Q. 5(2), 25–31, (1995).17. K. Wangnick, Proceedings of an IDA World Congress on Desalination and Water Science, 2, Abu Dhabi, International
Desalination Association, Topsfield, Mass., 1995, 17–26.18. Water Desalination in Developing Countries, U.N. Publication 64 11 B 5-1964, United Nations New York, 1964.19. R. L. Meeks, Federal R & D Funding by Budget Function, Fiscal years 1995–1997, Report NSF 97–301, National Science
Foundation, Arlington, Virg., 1997.20. S. F. Singer, Environ. Sci. Technol. 3, 197 (1969).21. Chem. Eng., 23 (May 3, 1982).22. W. M. Wagner and D. R. Finnegan, Chem. Eng., 71 (Feb. 7, 1983).23. F. B. Leitz and E. I. Ewoldsen, Desalination 24, 321 (1978); F. B. Leitz, personal communication, U.S. Bureau of
Reclamation, Denver, Colo., 1996.24. Ernst & Young LLP, 1994 National Water and Wastewater Rate Survey, Washington, D. C., 1994.25. C. A. Pappas, Int. Desalin. Water Reuse Q. 3(4), 34–39 (1993).26. The United Nations Organizations and Water, Briefing note, United Nations, New York, 1993.27. Report of the United Nations Water Conference, Mar del Platta, Publ. No. 77.II.A.12 United Nations, 1977.28. United Nations Committee on Natural Resources, Report of the Secretary General on Strategies and Measures for the
Implementation of the Mar del Platta Action Plan in the 1990s, 1991.29. United Nations, Proceedings of an International Symposium on Water Resources in the Middle East, University of
Illinois at Urbana-Champaign, 1993.30. Proceedings, First Desalination Congress of the American Continent, Mexico, Elsevier Publishing Co., Amsterdam, the
Netherlands, 1976; R. Bakish, ed., Proceedings, International Congress on Desalination and Water Reuse, Tokyo, Inter-national Desalination and Environmental Association, Teaneck, N.J., 1977; R. Bakish, ed., Proceedings, InternationalCongress on Desalination and Water Reuse, Nice, International Desalination and Environmental Association, Teaneck,N.J., 1979, Proceedings, International Congress on Desalination and Water Reuse Bahrain, International Desalinationand Environmental Association, Teaneck, N.J., 1981; Proceedings, First World Congress on Desalination and WaterReuse, Florence, International Desalination and Environmental Association (with EFChE), Teaneck, N.J., 1983; Pro-ceedings, Second World Congress on Desalination and Water Reuse, Bermuda, International Desalination Association,Topsfield, Mass., 1985; Proceedings, Third World Congress on Desalination and Water Reuse, Cannes, InternationalDesalination Association (with Soc. de Chimie Industrielle and Assoc. Italiana d’Ingegneria Chimica), Topsfield, Mass.,1987; Proceedings, Fourth World Congress on Desalination and Water Reuse, Kuwait, International Desalination andEnvironmental Association, Topsfield, Mass., 1989; Proceedings, IDA and WRPC World Conference on Desalination andWater Treatment, Yokohama, International Desalination Association, Topsfield, Mass., 1993; Proceedings, IDA WorldCongress on Desalination and Water Sciences, Abu Dhabi, International Desalination Association, Topsfield, Mass.,1995.
31. Int. Desalin. Water Reuse Q., Lineal Publishing Co., Boca Raton, Fla.32. A. Delyanis and E. Delyanis, eds., Proceedings, Congress by Working Party on Fresh Water from the Sea of EFCE, 1962,
1967, 1970, 1976, 1978, 1980; Proceedings, European Federation of Chemical Engineers 12th International Symposiumon Desalination and Water Reuse, Malta, 1991. Several of the IDA congresses listed below (24) were also co-sponsoredby the EFCE.
33. Exodus 15, 22–25.

40 WATER, SUPPLY AND DESALINATION
34. M. Balaban, The Desalination Directory, Balaban Research Publications, Mario Negri Sud Research Institute, SantaMaria Imbaro (Ch), Italy.
35. S. P. Kasper and N. Lior, Desalination 30, 541 (1979).36. L. A. Bromley, D. Singh, P. Ray, S. Sridhar, and S. M. Read, AIChE J. 20, 326 (1974).37. F. S. Aschner, in K. S. Spiegler and A. D. K. Laird, eds., Principles of Desalination, 2d ed., Pt. A, Academic Press, New
York, 1980, Chapt. 5, p. 193.38. F. Lennox and T. R. Stauffer, in Ref. 17, p. 27.39. P. F. George, J. A. Manning, and C. F. Schrieber, Desalination Materials Manual, U.S. Department of the Interior, Office
of Saline Water, Washington, D.C., 1975.40. J. Glater, J. L. York, and K. S. Campbell, in K. S. Spiegler and A. D. K. Laird, eds., Principles of Desalination, 2nd ed.,
Pt. B, Academic Press, New York, 1980, Chapt. 10, p. 627.41. H.-G. Heitman, Saline Water Processing, VCH Publications Inc., Weinheim, Germany, and New York, 1990.42. V. B. Chernozubov and co-workers, in V. B. Chernozubov and co-workers, Proceedings of the 1st International Symposium
on Water Desalination, Washington, D.C., Oct. 1965, p. 139.43. CIBA-Geigy Corp., The Application of Belgard EV and Belgard EVN in Sea Water Evaporators, CIBA-GEIGY pamphlet
DB 21.44. B. M. Fabuss, in Ref. 38, Pt. B, Appndx. 2, p. 765.45. F. M. A. Al-Awadi, Int. Desalin. Water Reuse Q. 4(1), 16 (1991).46. T. G. Temperley, Int. Desalin. Water Reuse Q. 4(1), 12 (1991).47. K. S. Spiegler and A. D. K. Laird, eds., Principles of Desalination, 2nd ed., Academic Press, New York, 1980.48. A. S. Khan, Desalination Processes and Multistage Flash Distillation Practice, Elsevier, Amsterdam, the Netherlands,
1986.49. N. Lior, ed., Measurements and Control in Water Desalination, Elsevier, Amsterdam, the Netherlands, 1986.50. K. S. Spiegler and Y. M. El Sayed, A Desalination Primer, Balaban Desalination Publications, Mario Negri Sud Research
Institute, Santa Maria Imbaro (Ch), Italy, 1994.51. M. W. Kellogg Co., Saline Water Data Conversion Engineering Data Book, 3rd ed., Office of Saline Water Contract No.
14-30-2639, U.S. Department of the Interior, Washington, D.C., 1975.52. N. Lior and R. Greif, Desalination 33, 269 (1980).53. O. Miyatake, T. Hashimoto, and N. Lior, Int. J. Heat Mass Transfer 35, 3245 (1992).54. O. Miyatake, T. Hashimoto, and N. Lior, Desalination 91, 51 (1993).55. Y. M. El-Sayed and R. S. Silver, in Ref. 38, Pt. A, Chapt. 2, p. 55.56. A. B. Steinbruchel and R. D. Rhinesmith, in Ref. 38, Chapt. 3, p. 111.57. Burns and Roe, Inc., Universal Design—Report and User’s Manual on Design of 2.5 Million Gallon per Day Universal
Desalting Plant, Vol. I–V, O.S.W. Contract No. 14-01-0001-955, U.S. Dept. Interior, Washington, D.C., 1969.58. A. Ophir, Desalination 84, 85 (1991).59. F. C. Standiford, in Ref. 47, Chapt. 2.2, p. 263.60. F. C. Standiford, in Ref. 47, Chapt. 2.3, p. 293.61. U.S. Pat. 2,821,304 (1958), A. Zarchin.62. B. W. Tleimat, in Ref. 38, Pt. B, Chapt. 7, p. 359.63. L. Dresner and J. S. Johnson, Jr., in Ref. 38, Pt. B, Chapt. 8, p. 401.64. P. Hoornaert, Reverse Osmosis, Pergamon Press, New York, 1984.65. S. Sourirajan and T. Matsuura, eds., Reverse Osmosis and Ultrafiltration, ACS Symposium Series 281, American
Chemical Society, Washington, D.C., 1985.66. D. Bhattacharya and M. E. Williams, in W. S. Winston Ho and K. K. Sirkar, eds., Membrane Handbook, Van Nostrand
Reinhold, New York, 1992.67. Z. Amjad, ed., Reverse Osmosis: Membrane Technology, Water Chemistry and Industrial Applications, Van Nostrand
Reinhold, New York, 1993.68. L. H. Shaffer and M. S. Mintz, in Ref. 38, Pt. A, Chapt. 6, p. 257.69. S. B. Applebaum, Demineralization by Ion Exchange, Academic Press, New York, 1968.70. D. Hoffman, Desalination 89, 115 (1992).71. S. E. Aly, Warme Stoffubertrag. 20, 263 (1986).72. B. Doron, J. Weinberg, and U. Fisher, IDA World Conference on Desalination and Water Re-Use, Washington, D.C., 1991.
WATER, SUPPLY AND DESALINATION 41
73. P. Glueckstern, Desalination 101, 11 (1995).74. A. Rabl, Active Solar Collectors and Their Applications, Oxford University Press, New York, 1985.75. N. Lior, in F. de Winter, ed., Collectors, Energy Storage, and Materials, MIT Press, Cambridge, Mass., 1991, Chapt. 4,
p. 99.76. C. E. Nielsen, in C. E. Nielsen, Solar Energy Technology Handbook, Part A, Marcel Dekker, New York, 1980, Chapt. 10,
p. 345.77. N. Lior, in G. O. G. Lof, ed., Active Solar Systems, MIT Press, Cambridge, Mass., 1993, Chapt. 17, p. 615.78. M. Rey and F. Lauro, Desalination 39, 159 (1981).79. W. H. Avery and C. Wu, Renewable Energy from the Ocean, Oxford University Press, Oxford, 1994.80. A. Maurel, Desalination 31, 489 (1979).81. W. Boesch, Desalination 41, 233 (1982).82. P. Gaiser and U. Plantikow, in Ref. 17, p. 411.
NOAM LIORUniversity of PennsylvaniaROBERT BAKISHFairleigh Dickinson University
Related Articles
Water, Pollution; Water, Properties; Reverse osmosis; Distillation; Water, sources and quality issues
Related Documents