Water Supply and Demand Bangkok 2013

Water Supply and Demand
Dec 31, 2015
Water Supply and Demand. Bangkok 2013. Water Supply. Measuring Supply. Water is expensive to move from watershed to watershed Heavy so costly to move Low valued (except for drinking water) Correct measure of supply is at watershed level- not country level Monthly pattern also matters - PowerPoint PPT Presentation
Welcome message from author
This document is posted to help you gain knowledge. Please leave a comment to let me know what you think about it! Share it to your friends and learn new things together.
Transcript
Water Supply and Demand
Bangkok 2013
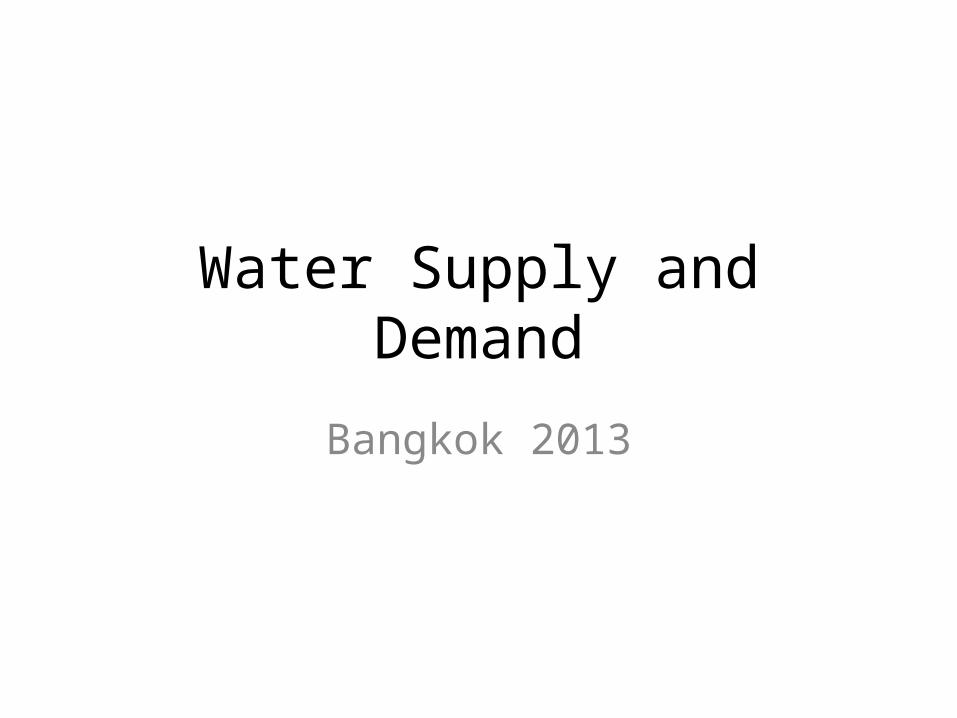
Water Supply
CountryWater supply (billion m3/yr)
Groundwater supply
Bangladesh 1206 21.12Cambodia 471.5 17.6Indonesia 1973 457.4Lao PDR 333.5 37.9Maldives 0.0000 0.0300Mongolia 32.7 6.1Nepal 210.2 20Philippines 444 180Sri Lanka 52 7.8Thailand 427.4 41.9Viet Nam 847.7 71.42
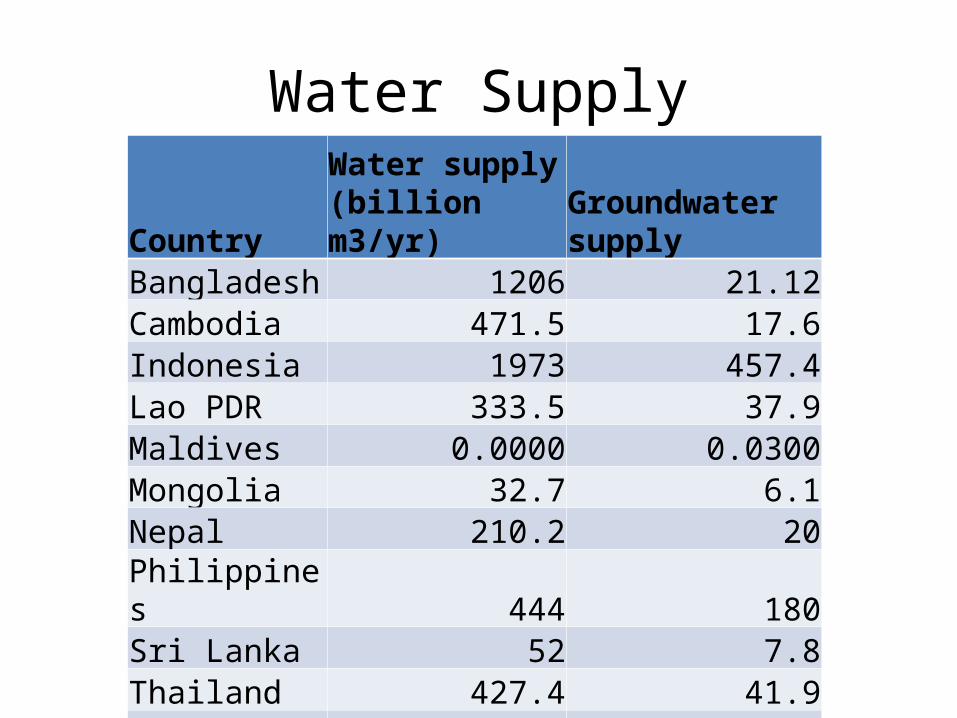
Measuring Supply
• Water is expensive to move from watershed to watershed– Heavy so costly to move– Low valued (except for drinking water)
• Correct measure of supply is at watershed level- not country level
• Monthly pattern also matters– Expensive to store across months– Requires a dam
Measuring Water Supply
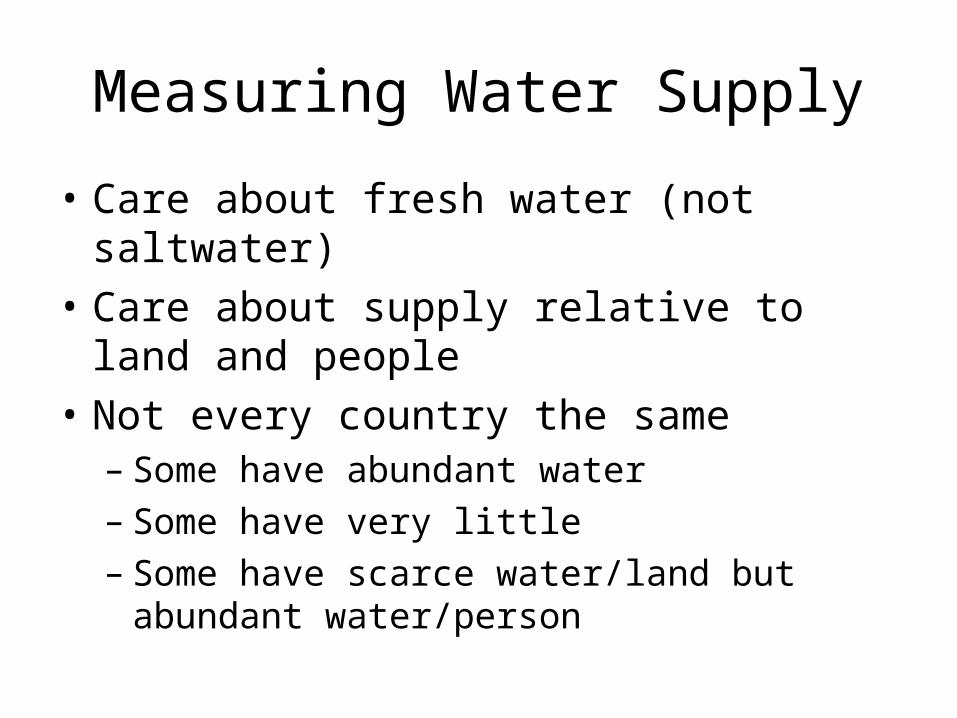
• Care about fresh water (not saltwater)• Care about supply relative to land and people• Not every country the same– Some have abundant water– Some have very little– Some have scarce water/land but abundant
water/person
Water Supply
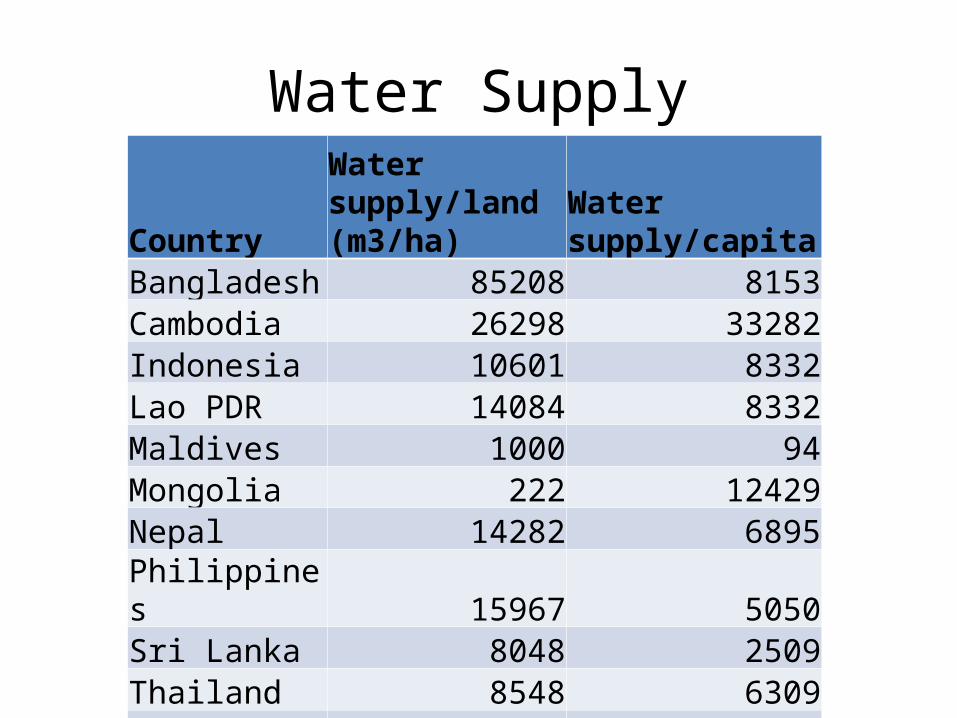
Country
Water supply/land (m3/ha)
Water supply/capita
Bangladesh 85208 8153Cambodia 26298 33282Indonesia 10601 8332Lao PDR 14084 8332Maldives 1000 94Mongolia 222 12429Nepal 14282 6895Philippines 15967 5050Sri Lanka 8048 2509Thailand 8548 6309Viet Nam 26713 9957
Measuring Demand
• Four primary users– Agriculture- largest user– Industry- second largest– Residential- highest valued

Water DemandCountry % Agriculture % Industrial % Residential
Bangladesh 87.8 2.1 10Cambodia 94 1.5 4.5Indonesia 81.9 6.5 11.6Lao PDR 91.4 4.9 3.7Maldives 0 5.1 94.9Mongolia 43.9 43.2 12.9Nepal 98.1 0.3 1.5Philippines 82.2 10 7.6Sri Lanka 87.3 6.4 6.2Thailand 90.4 4.9 3.7Viet Nam 94.8 3.7 1.5
Water Allocation
• Suppose two users: farmers and U&I• U&I more price inelastic than farmer• Suppose that farmers have more water than
efficient amount• What is loss?
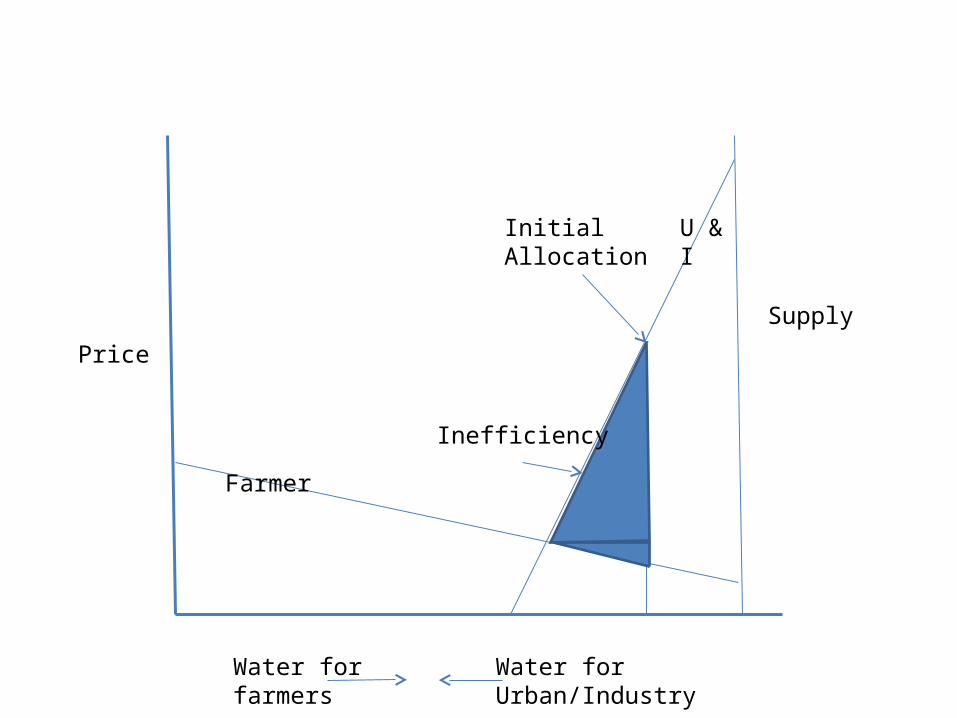
Supply
Price
Water for farmers
Water forUrban/Industry
InitialAllocation
Inefficiency
Farmer
U & I
Climate Change
• Suppose that climate change reduces water supply
• Suppose farmer water is protected• Water must come from U&I • Efficiency loss grows
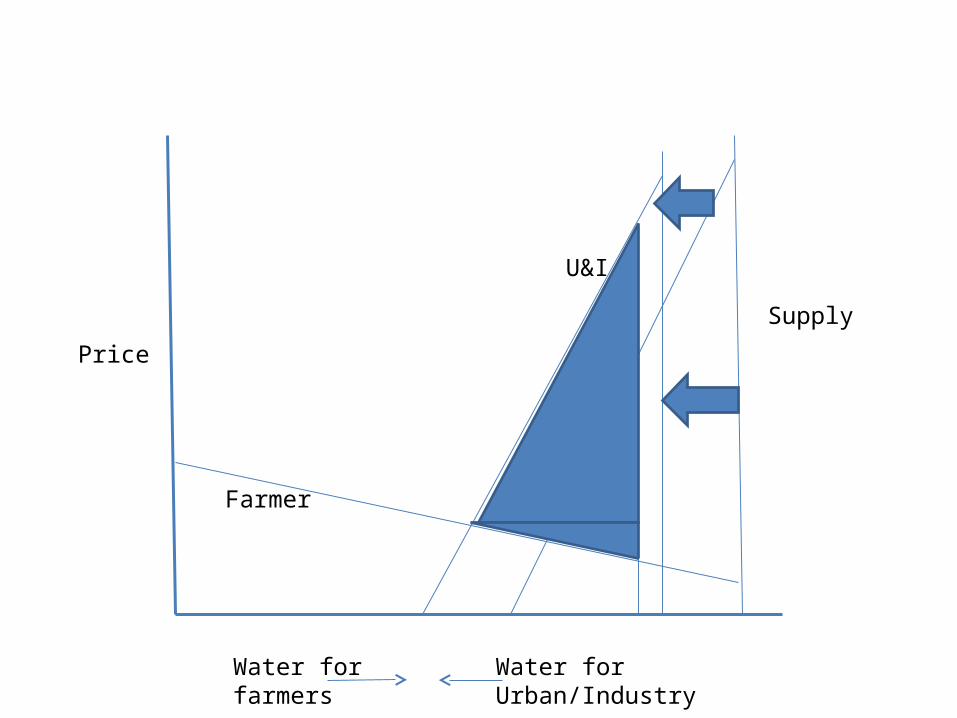
Supply
Price
Water for farmers
Water forUrban/Industry
Farmer
U&I
Climate Change
• Suppose that climate change reduces water supply
• Suppose water is reallocated from farmers to U&I
• Efficiency losses shrink • Water management objective- equate
marginal value of water across users
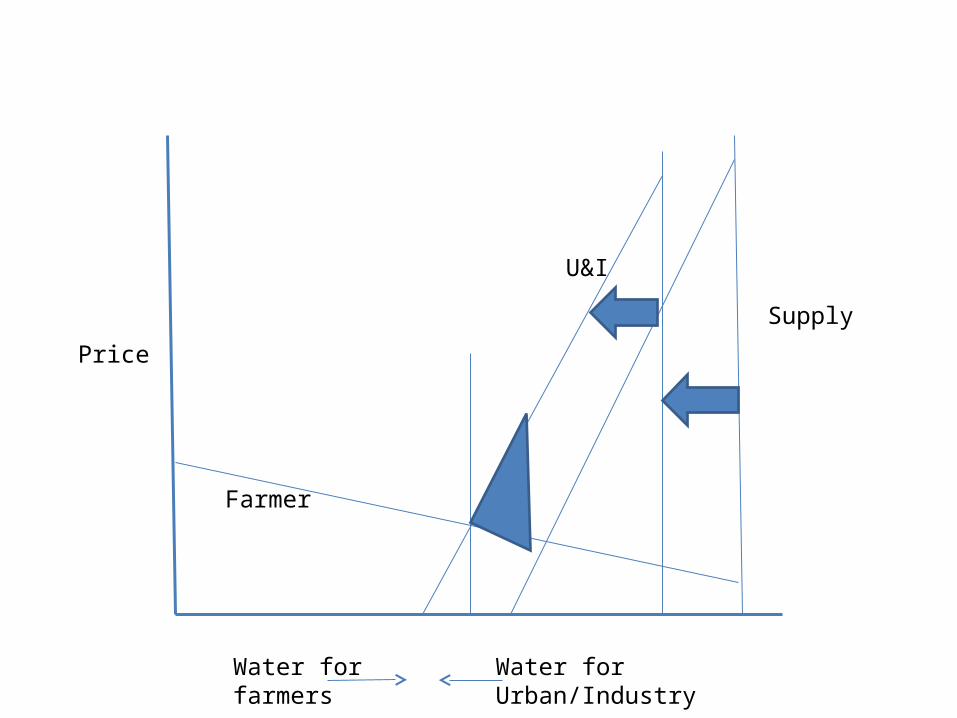
Supply
Price
Water for farmers
Water forUrban/Industry
Farmer
U&I
Related Documents