1 Water scarcity footprint of selected hydropower reservoirs Laura Scherer, Stephan Pfister Introduction After agriculture, hydropower is considered to be the next largest water consuming sector, largely due to evaporation (EV) from the reservoir surface. However, previous assessments of water footprints of hydropower were mostly based on a gross evaporation method that assigns all of the potential evaporation (PEV) of the reservoir to the water footprint of hydropower. This method does not take into account 1) that there was natural EV and transpiration before the construction of the dam, 2) how water scarce the watershed is and 3) that water scarcity is counteracted in many cases by water storage during the wet season and water release in the dry season (Buxmann et al. submitted). Additionally, the question of allocation between power production, irrigation and other reservoir purposes remains open. All this means that the water footprint of hydropower reported in previous scientific literature might be overestimating the real water consumption and the resulting impacts on water resource availability and the environment. Research objective The goal of the project is to assess the water footprint of hydropower plants with a significant contribution to the electricity supply of aluminium smelters. The dams considered in this study are compiled in Table 1 and displayed in Figure 1. In order to account for seasonal variations, the impact of the dam in terms of water scarcity footprint is calculated based on monthly water stress indices and storage effects of the reservoir. The net EV (NEV) is also calculated and multipurpose reservoirs are analysed with regards to impact allocation to purposes other than hydropower. Figure 1: Dam locations

Welcome message from author
This document is posted to help you gain knowledge. Please leave a comment to let me know what you think about it! Share it to your friends and learn new things together.
Transcript

1
Water scarcity footprint of selected hydropower reservoirs
Laura Scherer, Stephan Pfister
Introduction
After agriculture, hydropower is considered to be the next largest water consuming sector, largely
due to evaporation (EV) from the reservoir surface. However, previous assessments of water
footprints of hydropower were mostly based on a gross evaporation method that assigns all of the
potential evaporation (PEV) of the reservoir to the water footprint of hydropower. This method does
not take into account 1) that there was natural EV and transpiration before the construction of the
dam, 2) how water scarce the watershed is and 3) that water scarcity is counteracted in many cases
by water storage during the wet season and water release in the dry season (Buxmann et al.
submitted). Additionally, the question of allocation between power production, irrigation and other
reservoir purposes remains open. All this means that the water footprint of hydropower reported in
previous scientific literature might be overestimating the real water consumption and the resulting
impacts on water resource availability and the environment.
Research objective
The goal of the project is to assess the water footprint of hydropower plants with a significant
contribution to the electricity supply of aluminium smelters. The dams considered in this study are
compiled in Table 1 and displayed in Figure 1. In order to account for seasonal variations, the impact
of the dam in terms of water scarcity footprint is calculated based on monthly water stress indices
and storage effects of the reservoir. The net EV (NEV) is also calculated and multipurpose reservoirs
are analysed with regards to impact allocation to purposes other than hydropower.
Figure 1: Dam locations

2
Methodology
Dam locations, purposes and hydroelectricity generation
Dam locations were mainly obtained from the global GRanD database (Lehner et al. 2011). If the
dams were not contained in there, the global GLWD database (Lehner and Döll 2004) and the
national databases for Australia (ANCOLD 2010) and the United States (USGS 2006) were consulted.
With regards to locations, preference was given to the GLWD database as their coordinates
represent reservoir centres, while in GRanD they represent reservoir outlets. Annual electricity
generation of each dam was provided by CARMA (2015) for the year 2009. Consequently, the water
scarcity footprints were also calculated for the same year. Each dam’s database source, main
purpose, and yearly hydroelectricity generation are compiled in Table 1. The Snowy Mountains
scheme in Australia was analysed in addition to individual dams and hydropower plants comprising
this scheme (Tumut 3, Murray 1 and 2). The scheme consists of 16 reservoirs, but only 8 hydropower
plants operated in 2009. The main purpose of the scheme is the generation of hydroelectricity. Some
reservoirs are not directly connected to a plant, but to one of the other reservoirs, which are in turn
connected to plants. For the final results, the consumption of all 16 reservoirs was summed and
related to the electricity generation of the 8 hydropower plants.
Table 1: Consulted databases and characteristics of selected reservoirs for the year 2009
Dam Countries Database Main purpose Multi-purpose
Electricity (TWh)
Area/Electricity (km
2/TWh)
Cahora Bassa Mozambique, Zimbabwe GRanD Irrigation Yes 15.8 129.8 Aswan High Egypt, Sudan GRanD Irrigation Yes 7.4 728.5 Three Gorges China GRanD Hydropower Yes 79.9 10.7 Liujianxia China GRanD Hydropower Yes 6.3 18.3 Laxiwa China GRanD Hydropower No 2.1 2.1 Snowy Mountains
Australia ANCOLD Hydropower Yes 3.9 16.5
Tumut 3 Australia GRanD Hydropower No* 1.9 9.6 Murray 1 Australia GRanD Hydropower No* 0.7 0.4 Murray 2 Australia ANCOLD Hydropower No* 0.5 0.4 John Day United States GLWD Hydropower Yes 8.4 7.4 Chief Joseph United States USGS Hydropower No** 9.8 3.5 Grand Coulee United States GRanD Irrigation Yes 21.0 12.8 The Dalles United States USGS Hydropower Yes 6.1 7.9
*The reservoir belongs to the Snowy Mountains scheme. It does not serve multiple purposes, but the
entire scheme does.
**except for recreational purpose which is excluded from allocation
Gross and net evaporation method
For comparison, we calculated the water consumption (WCgross) of hydropower per unit of electricity
generated (e.g. GJ or MWh) according to the commonly used gross evaporation method:
WCgross = PEVa * SA / HGa
where PEVa is the annual potential evaporation, SA is the reservoir surface area and HGa is the annual
hydroelectricity generation. The SA of the Laxiwa dam was not given and therefore estimated by
dividing the reservoir capacity by the dam height.

3
Net water consumption (WCnet) is calculated according to the net evaporation method where PEV is
replaced by net evaporation (NEV) as the difference between PEV and actual EV and transpiration of
the surrounding land cover:
WCnet = NEVa * SA / HGa
The annual water scarcity footprints (WSFPa) are subsequently calculated by applying the annual
water stress index (WSIa) to WCnet:
WSFPa = WCnet * WSIa
Monthly reservoir water balance
Only NEV was considered in the monthly approach. When determining the outflow of the reservoir
PEV was used, but actual EV and transpiration (AET) was subtracted from the consumption. The
annual water balance of the reservoir was calculated in order to determine the annual outflow (OFa)
of the reservoir:
OFa = IFa + Pa – PEVa – SPa
where IF is the inflow, P is precipitation and SP is seepage. The reservoir inflow was obtained from
the global hydrological model WaterGAP 3 whose simulation results are provided within the
Earth2Observe project (E2O 2015) on monthly level. The river discharge of the upstream cell of a
dam was considered as inflow to the reservoir.
Precipitation data on monthly level were also taken from the Earth2Observe project and is based on
ECMWF (E2O 2015).
PEV and actual EV and transpiration were obtained from Mu et al. (2011). In case of data gaps in the
dam area, the mean value of a buffer zone around the dam was calculated. This concerns the Aswan
High dam and the Liujianxia dam for which buffer radiuses of 180 and 4 km, respectively, were
applied.
SP is treated similar to the reservoir outflow as seepage contributes to groundwater recharge and is
therefore released as runoff. Its velocity was derived from hydraulic conductivity (K) by the following
equation (Watson and Burnett 1993):
SP = K * i / n
Hydraulic conductivity was estimated based on Saxton and Rawls (2006). The required soil
parameters were given in the Harmonized World Soil Database of the FAO (Nachtergaele et al. 2012).
The additional required parameters hydraulic gradient (i) and porosity (n) were assumed to be 0.01
(Morrison 1999) and 0.4 (McWhorter and Sunada 1977), respectively.
Reservoir operation
The monthly reservoir outflow depends on the reservoir operation. We distinguished two different
operations based on the main purpose of the reservoir which is either hydropower or irrigation.
For each country, we compared the monthly fluctuations of hydropower as provided in the OECD
library (IEA 2014) with the monthly fluctuations of river discharge in WaterGAP3 aggregated to the

4
country level. The mean reduction factor of the hydrological fluctuations by hydropower production
was 1.62 for the years 2000 to 2012 (for all countries where the correlation between discharge and
hydroelectricity generation was at least 0.5) and this factor was applied for all outflows of reservoirs
where hydropower is the primary purpose, i.e. the monthly variation in mean annual runoff was
decreased by a factor of 1.62.
When irrigation was the main purpose, we assumed the fluctuations of water consumption (Pfister et
al. 2011a, WATCH 2010) to be reflected in the reservoir outflow as suggested by Hanasaki et al.
(2006). Water consumption other than irrigation was assumed to be constant throughout the year.
Although this might not be realistic, fluctuations are minor compared to irrigation and it is a common
assumption used in global models. Therefore, the fluctuations were only derived from variations in
irrigation water consumption, but consumption from other sectors was also taken into account in
order to avoid zero flows in months without any irrigation. The irrigation rasters were resampled to
0.5°, thereby matching the resolution of the WATCH data. We only considered the fluctuation in the
next five downstream cells of the dam as suggested by Döll et al. (2009).
Water scarcity footprint
The monthly consumption (CS(t)) of the reservoir was determined by its monthly water balance:
CS(t) = IF(t) + P(t) – OF(t) –SP(t) – AET(t)
The resulting consumption was then multiplied with the monthly water stress index (WSI, Pfister and
Bayer 2014) to obtain the water scarcity impact (WS):
WS(t) = CS(t) * WSI(t)
The annual WSFP based on a monthly water balance (WSFPm) is derived from the sum of all monthly
WSs over the year:
WSFPm = ∑ WSi
12i=1
HG𝑎
If the resulting WSFPm assigned to hydropower is negative, it is set to zero.
Allocation
Where reservoirs serve multiple purposes, an allocation of impacts between the different purposes
should be undertaken. Allocation was based on the ranks of the purposes of a reservoir with ratios of
2:1 or 3:2:1 depending on how many purposes a reservoir fulfils. When hydropower is the only
purpose of a reservoir, 100% of the impacts are allocated to hydropower; if it is the main purpose
67% or 50% of the impacts are allocated to it depending on the total number of purposes and if it is
the second or tertiary purpose only 33% or 17% of the impacts are allocated to it.
Avoided floodplain evaporation by Aswan High dam
The Aswan High dam has the largest water footprint according to the gross evaporation method.
However, besides the actual EV and transpiration at the location of the reservoir, when assuming the
land cover of its surroundings, downstream inundation areas resulted in additional natural EV and
transpiration that was reduced due to the flood control by the dam. This avoided evaporation of
flooded areas needs to be deducted from the NEV.

5
First, the drainage capacity of the Nile River downstream of the dam was estimated. We assumed a
river width of 1250 m, a bank height of 6.2 m, a rectangular cross section (Yamazaki et al. 2011) and a
universal flow velocity of 1 m/s (Döll et al. 2003):
Qc = w * h * q
where Qc is the drainage capacity (m3/s), w is the river width (m), h is the bank height (m) and q is the
flow velocity (m/s).
Then, the discharge exceeding the drainage capacity was determined for each month:
Qe = Q – Qc
where Qe is the discharge exceedance (m3/s) and Q is the river discharge (m3/s).
Next, the inundation area was estimated assuming a river length of 1100 km to the river mouth
(WWF 2015) and a floodplain depth of 1 m (Hassan et al. 2006):
A = Qe / q / dfp * l
where A is the inundation area (m2), dfp is the floodplain depth (m) and l is the river length (m).
The net evaporation was then determined along the flow path of the Nile downstream of the dam.
Sensitivity analysis
We investigated the effects of modifying various input parameters on the resulting WSFPm by the
following actions: i) We performed the same calculations for the year 2004 instead of 2009, which
affects the potential and actual evaporation and transpiration, the discharge, the precipitation and
the hydroelectricity generation. ii) We used a country specific flow reduction factor for the operation
of reservoirs having hydropower as their main purpose, as long as the data was available and the
correlation between discharge and hydroelectricity generation was at least 0.5. This was only valid
for the United States and therefore affects 3 out of the 12 reservoirs. iii), We considered two
alternative approaches to derive the reservoir operation for reservoirs with irrigation as their main
purpose. First, we derived the operation by reducing the variability of irrigation by 50% instead of
using a minimum flow based on the water consumption of other sectors. Second, we looked at the
monthly irrigation requirements of the whole watershed instead of only the next five downstream
cells. In this case, water consumption of other sectors was not considered. iv) Monthly water scarcity
assessments rather overestimate fluctuations, since they are mainly based on surface runoff and
neglect potential dampening effects of groundwater-surface water interactions as well as residence
times of >1 month in large watersheds (Pfister and Bayer 2014). Therefore, we reduced these
fluctuations by taking the mean of the monthly and annual WSI:
WSImean(t) = (WSI(t) + WSIa) / 2

6
Results and discussion
Water scarcity footprint
The water footprints of hydropower and the ranking between plants largely depend on the method
used for their derivation. Consequently, the conclusions that can be drawn from the results using this
novel approach for water footprint assessment of hydropower differ considerably from the
conclusions that could be drawn from the results of previous assessments. If the water consumption
of the reservoir is considered using only the gross evaporation method, the Aswan High dam appears
to have the largest impacts with over 500 Mio. m3/GJ. However, if monthly water stress and water
storage are accounted for, it provides the highest benefits in terms of alleviating water scarcity.
Another relevant insight from this study is that the Snowy Mountains scheme has a much higher
water consumption than its most important individual dams because of the large reservoir
Eucumbene, which is part of the scheme even though it is not directly connected to any hydropower
plant.
Mekonnen and Hoekstra (2012) calculated the water consumption per unit electricity generated for
35 globally distributed hydropower plants. Among their selected plants was the Cahora Bassa dam,
which was also investigated in this study. They estimated the water consumption to be 186 m3/GJ,
which is almost twice our own estimate. The difference can be explained by their assumption of a
higher PEV (8140 Mio. m3/a, compared to 5382 Mio. m3/a) and a lower annual hydroelectricity
generation (12.2 TWh, cf. Table 1). On the other hand, Zhao and Liu (2015) calculated the water
consumption of the Three Gorges dam in 2009 to be 2.5 m3/GJ, which is lower than our own
estimate. They assumed a lower PEV of only 716 Mio. m3/a (compared to 1242 Mio. m3/a).
As in the fictitious example provided by Kurt Buxmann, most reservoirs have a negative WSFP when
seasonality is taken into account, which implies that they alleviate water scarcity and benefit the
affected water consumers as shown in the fourth column of Table 2 (see also Table 4 to Table 15,
Table 17). The fifth column shows the WSFPm values allocated to the electricity production. It is
proposed to select an allocation factor of zero for negative values of WSFPm,unallocated. Some of the
impacts might, however, be underestimated, as some of the storage changes might exceed storage
capacity. Storage capacity could not be taken into account because initial storage is unknown.
The US dams Chief Joseph, John Day and The Dalles are run-of-river types (BPA et al. 2001), meaning
that the increase in reservoir surface area might be negligible and that the WSFPs are likely to be
overestimated. In this case, they could be assumed to equal zero.
The water consumption per unit of electricity generated is closely correlated to the ratio of reservoir
surface area to annual electricity production (R ≈ 1, cf. Table 1). The potential evaporation has a
lower influence (R = 0.68). For the WSFPm, the main influence cannot be easily identified, as it is a
complex system with many interactions.
Table 2: Summed monthly water scarcity footprints (m3 H2Oe / GJ) of selected reservoirs
Dam WCgross WSFPa WSFPm,unallocated WSFPm,allocated
Cahora Bassa 94.81 0.82 0.38 0.13 Aswan High 558.03 513.74 -707.79 0 Three Gorges Dam 4.32 0.05 -1.59 0 Liujianxia 9.02 7.59 4.05 2.03

7
Laxiwa 0.92 0.71 -6.28 0 Snow Mountains 27.42 3.41 -28.63 0 Tumut 3 / Talbingo 4.61 2.14 -6.15 0 Murray 1 / Geehi 0.19 0.09 -8.15 0 Murray 2 0.19 0.08 -12.75 0 John Day* 3.29 0.07 -89.53 0 Chief Joseph* 1.39 0.03 -20.38 0 Grand Coulee 4.51 0.09 -22.97 0 The Dalles* 2.76 0.06 -137.38 0
*run-of-river dams where WSFP might be assumed to equal zero
Allocation
The resulting parameters for WSFPm,allocated, i.e. the WSFP allocated to one unit of generated
hydropower (e.g. 1 GJ), are shown in the last column of Table 2. In case of negative WSPFm,unallocated,
an allocation factor of zero has been selected for the purpose of this study with a resulting
WSFPm,allocated of zero. We have chosen this conservative approach because we hesitated to assign
negative WSFP values to hydropower. This approach does not preclude other considerations which
might lead to negative WSFPs for hydropower.
Five out of twelve reservoirs provide hydropower as their only purpose. The remaining seven
reservoirs fulfil multiple purposes, thereby sharing their responsibility for impacts or benefits. The
dam with the highest impacts is Liujianxia, which provides hydropower, irrigation and flood control.
Because of this, only 50% of the total impacts were allocated to hydropower, as this functions as the
dam’s main purpose (Table 2). The only other dam with net impacts is Cahora Bassa, whose primary
purpose is irrigation. Hydropower is its secondary purpose, with flood control services being its
tertiary function. Therefore, only one third of the impacts were allocated to hydropower.
Zhao and Liu (2015) studied the allocation of impacts of the Three Gorges dam in detail and allocated
63% to hydropower, which is close to our own assumption of 50% (Table 2). However, we could not
conduct such detailed allocation analyses, as the required data was unavailable. Also the data from
the study of Zhao and Liu (2015) was obtained from Chinese documents and therefore not available
to us. However, deviations of +/- 25% are not considered critical in an LCA context.
In the case of economic allocation, assumed prices of the various functions could be 9 cents/kWh for
hydropower (Sims et al. 2003, IRENA 2012), 2 cents/m3 (FAO 2004) for irrigation, 16 cents/m3 (Zhao
and Liu 2015) for flood control and 50 cents/km/day (Dierikx and van den Berg 2010) for navigation
and the transport of commodities. While the annual hydroelectricity generation is known and the
economic value can easily be calculated, the volumes used for irrigation or flood control and the
amount of transported commodities are unknown. There are no objective ways of estimating these
values and direct data from local authorities is required.
Avoided floodplain evaporation by Aswan High dam
The avoided net evaporation from floodplains downstream of the Aswan High dam amounts to 439
Mio. m3 (Table 16). If this is subtracted from the net evaporation of the Aswan High reservoir, it
reduces to 13493 Mio. m3 (cf. Table 5) and results in a WSFPa of 498 m3 H2Oe / GJ (compared to 514
m3 H2Oe / GJ). While the derivation of the inundation area (peak of 8593 km2 in September) entails
uncertainties, it still matches reported historical irrigation areas well (8000 km2, Postel 1999). Despite
the large areas that are flooded, the overall effect on the WSFPa is small, as the evaporation from

8
floodplains only occurs during a few months of the year and therefore justifies the negligence of this
process. This is also valid for other dams.
Sensitivity analysis
The results from the sensitivity analysis are compiled in Table 3. The year under investigation had the
largest influence on the resulting WSFPm. The largest difference was obtained for the Three Gorges
dam, which only started operating in 2003 (Lehner et al. 2011). The annual electricity generation in
2004 was 75% lower than in 2009 (CARMA 2015), but in both years no net impacts are caused. For
the Laxiwa dam, no value is available for the year 2004 because operation began in 2009
(HydroWorld 2009). Its electricity generation is expected to increase in the future by a factor of 6
(CARMA 2015), so impacts or benefits per unit electricity generated will decrease. In the case of the
Grand Coulee and Chief Joseph dams the differences in annual electricity production are small, but
the change in impacts is caused by a change in the inflow pattern, which even leads to a switch from
benefits in 2009 to impacts in 2004.
The attenuation factor for the three US dams whose main purpose is hydropower (all but Grand
Coulee) was reduced compared to the universal attenuation factor otherwise applied. It only
amounted to 1.44 instead of 1.62. The weaker attenuation led to lower benefits in terms of
alleviating water scarcity.
The method of considering irrigation in the operation of reservoirs whose main purpose is irrigation
can also play a large role. The area considered, whether it is the next five downstream cells or the
entire watershed, affects the resulting WSFPm.
The chosen monthly WSI largely influences the results and the smoothing of their fluctuations
generally leads to an increase in the WSFPm. As an example, the chosen WSI has a large influence on
the results of the Aswan High dam as the dam with the highest water consumption, but also largest
benefits in terms of alleviating water consumption. When considering the mean of monthly and
annual WSI, the benefits are reduced by 86%. Nevertheless, the benefits remain high for that dam.
Table 3: Summed monthly allocated water scarcity footprints (m3 H2Oe / GJ) based on sensitivity analyses (dams with net
impacts in some scenarios are bolded)
Dam Original Year 2004 Specific
attenuation Irrigation
dampening Watershed irrigation
WSImean
Cahora Bassa 0.13 0.02 NA* 0 0 0.20 Aswan High 0 0 NA 0 0 0 Three Gorges 0 0 NA NA NA 0 Liujianxia 2.03 0 NA NA NA 2.91 Laxiwa 0 NA NA NA NA 0 Snowy Mountains 0 0 NA NA NA 0 Tumut 3 0 0 NA NA NA 0 Murray 1 0 0 NA NA NA 0 Murray 2 0 0 NA NA NA 0 John Day 0 0 0 NA NA 0 Chief Joseph 0 6.14 0 NA NA 0 Grand Coulee 0 1.71 NA 0 0 0 The Dalles 0 0 0 NA NA 0 Mean** 0.09 0.97 0.09 0.08 0.08 0.13
*Not available mostly because it only concerns reservoirs with specific main purposes or from specific
countries.

9
**Weighted by annual hydroelectricity generation considering all 12 selected dams but not the Snowy
Mountains scheme
The electricity weighted mean WSFPm for the 12 selected hydropower plants (Table 3) varies
between 0.08 m3 H2Oe / GJ (using a different algorithm for the operation of irrigation reservoirs) and
0.13 m3 H2Oe / GJ (smoothed monthly WSIs). A higher value of 0.97 m3 H2Oe / GJ was obtained for the
year 2004. The range of possible results indicates the uncertainty of the applied method.
Nevertheless, it shows that current global estimates ranging from 7 m3/GJ (Pfister et al. 2011b) to 68
m3/GJ (Mekonnen and Hoekstra 2012) are overestimating the impacts.
Conclusions
A novel approach to water footprint assessment of hydropower was used and different conclusions
can be drawn than those from previous studies. While according to the gross evaporation method,
some hydropower plants had large adverse impacts on water availability by consuming a lot of water
through lake evaporation, all plants investigated in this study have small water footprints, and most
of them cause no net impact, but rather counteract water scarcity by storing water in the wet season
and releasing it in the dry season. The electricity weighted mean WSFPm for the 12 selected
hydropower plants is estimated at 0.1 m3 H2Oe / GJ. It shows that current global estimates ranging
from 7 m3/GJ (Pfister et al. 2011b) to 68 m3/GJ (Mekonnen and Hoekstra 2012) are largely
overestimating the impacts.
Sensitivity analysis did not affect the study’s drawn conclusions; however, with different input data
some plants switch from providing benefits to causing impacts and vice versa. Out of the twelve
investigated plants, three plants in the US are of the run-of-river type and their water footprint can
be assumed to be zero because they do not have reservoirs. These plants are Chief Joseph, John Day
and The Dalles. Six plants, namely Aswan High, Three Gorges, Laxiwa and the three Australian plants
Tumut 3 and Murray 1 and 2 (as well as the Snowy Mountains scheme as a whole), do not cause any
impacts in any of the scenarios investigated in the sensitivity analysis. The remaining three plants,
Cahora Bassa, Liujianxia, and Grand Coulee, cause adverse impacts in at least one of the scenarios,
but none cause impacts in all of them.
When impacts occur, they should be allocated between the different purposes of the reservoirs.
Among the three hydropower plants that cause adverse impacts under some of the scenarios, only
the Laxiwa dam serves hydropower as single purpose. For both others, the impacts of hydropower
should be reduced compared to the total impacts of the reservoir. The allocation is challenging and
without data from local authorities, only a simple procedure based on the ranks of purposes could be
applied. However, since the differences in results between the commonly used gross evaporation
method and the novel approach are large and the impacts low, the allocation procedure is less
relevant.
While the impacts of hydropower plants on local water availability do not seem to be as severe as
previously thought, it has to be emphasised that freshwater consumption is only one of many impact
categories. In order to avoid burden shifting, other impacts should be analysed. As an example, the
homogenisation of river flows leads to reduced floodplain inundation, which threatens the rich
biodiversity of these habitats (Tockner and Stanford 2002). Furthermore, changed river

10
morphologies, temperature profiles, and land use changes caused by dams might be of
environmental relevance.
Appendix
The appendix contains monthly water balances of the individual reservoirs (Tables 4 – 15), the
derivation of net evaporation from floodplains downstream of the Aswan High dam (Table 16) and
the results tables in the unit m3 H2Oe / MWh instead of m3 H2Oe / GJ (Tables 17 – 18).
Acknowledgements
We thank Kurt Buxmann for discussions and helpful comments and Christie Walker for proofreading
the manuscript. This work was funded by the International Aluminium Institute.
References
ANCOLD (2010), Register of large dams in Australia, http://www.ancold.org.au/?page_id=24.
BPA, USBR, and USACE (2001), The Columbia River system inside story, Bonneville Power
Administration, Portland, Oregon.
Buxmann, K., A. Koehler, and D. Thylmann (submitted), Water Scarcity Footprint of Primary
Aluminium, Int J Life Cycle Assess.
CARMA (2015), CO2 emissions, energy and intensity of power plants, http://carma.org/dig.
Dierikx, M., and van den Berg, Marten (2010), Rivers of the World Atlas, 96 pp., NEA Transport
research and training, The Hague.
Döll, P., K. Fiedler, and J. Zhang (2009), Global-scale analysis of river flow alterations due to water
withdrawals and reservoirs, Hydrol. Earth Syst. Sci., 13(12), 2413–2432, doi:10.5194/hess-13-2413-
2009.
Döll, P., F. Kaspar, and B. Lehner (2003), A global hydrological model for deriving water availability
indicators: model tuning and validation, Journal of Hydrology, 270(1–2), 105–134,
doi:10.1016/S0022-1694(02)00283-4.
E2O (2015), EartH2Observe datasets, https://wci.earth2observe.eu/thredds/catalog.html.
FAO (2004), FAO GeoNetwork: Global map of monthly reference evapotranspiration,
http://www.fao.org/geonetwork/srv/en/main.home.
FAO (2004), Water Charging in Irrigated Agriculture: An Analysis of International Experience, 82 pp.,
Food and Agriculture Organization of the United Nations, Rome.
Hanasaki, N., S. Kanae, and T. Oki (2006), A reservoir operation scheme for global river routing
models, Journal of Hydrology, 327(1–2), 22–41, doi:10.1016/j.jhydrol.2005.11.011.

11
Hassan, R., R. J. Scholes, G. Marnewick, G. Petersen, E. Mungatana, G. Wahungu, A. Batchelor, M.
Thompson, M. Rountree, and C. Lo-Liyong (2006), Environmental impact assessment of the Bor
Counties’ dyke rehabilitation project, South Sudan: Integrated assessment report, 94 pp., Faculty of
Natural and Agricultural Sciences, University of Pretoria, Pretoria.
HydroWorld (2009), China commissions 4,200-MW Laxiwa hydropower station,
http://www.hydroworld.com/articles/2009/05/china-commissions.html.
IEA (2014), OECD - Monthly net electricity supply, http://www.oecd-ilibrary.org/statistics.
IRENA (2012), Renewable energy technologies: Cost analysis series, Hydropower, 34 pp.,
International Renewable Energy Agency, Bonn.
Lehner, B., C. Reidy Liermann, C. Revenga, C. Vorosmarty, B. Fekete, P. Crouzet, P. Doll, M. Endejan,
K. Frenken, J. Magome, C. Nilsson, J. C. Robertson, R. Rodel, N. Sindorf, and D. Wisser (2011), Global
Reservoir and Dam Database, Version 1 (GRanDv1): Dams, Revision 01,
http://dx.doi.org/10.7927/H4N877QK.
Lehner, B., and P. Döll (2004), Global Lakes and Wetlands Database (GLWD),
https://www.worldwildlife.org/pages/global-lakes-and-wetlands-database.
McWhorter, D. B., and D. K. Sunada (1977), Ground-water hydrology and hydraulics, 290 pp., Water
Resources Publications, Colorado.
Mekonnen, M. M., and Hoekstra, A. Y. (2012), The blue water footprint of electricity from
hydropower, Hydrol. Earth Syst. Sci., 16(1), 179–187, doi:10.5194/hess-16-179-2012.
Morrison, R. D. (1999), Environmental Forensics, 384 pp., CRC Press, Florida.
Mu, Q., M. Zhao, and S. W. Running (2011), Improvements to a MODIS global terrestrial
evapotranspiration algorithm, Remote Sensing of Environment, 115(8), 1781–1800,
doi:10.1016/j.rse.2011.02.019.
Murphy, T. (2011), How Much Dam Energy Can We Get?, http://physics.ucsd.edu/do-the-
math/2011/12/how-much-dam-energy-can-we-get/.
Nachtergaele, F., H. van Velthuizen, L. Verelst, and D. Wiberg (2012), Harmonized world soil
database: Version 1.2, FAO, Rome.
Pfister, S., and P. Bayer (2014), Monthly water stress: spatially and temporally explicit consumptive
water footprint of global crop production, Journal of Cleaner Production, 73, 52–62,
doi:10.1016/j.jclepro.2013.11.031.
Pfister, S., P. Bayer, A. Koehler, and S. Hellweg (2011a), Environmental Impacts of Water Use in
Global Crop Production: Hotspots and Trade-Offs with Land Use, Environ. Sci. Technol., 45(13), 5761–
5768, doi:10.1021/es1041755.
Pfister, S., D. Saner, and A. Koehler (2011b), The environmental relevance of freshwater consumption
in global power production, Int J Life Cycle Assess, 16(6), 580-591, doi:10.1007/s11367-011-0284-8.
Postel, S. (1999), Pillar of sand: Can the irrigation miracle last?, WW Norton & Company, New York.

12
Saxton, K. E., and W. J. Rawls (2006), Soil Water Characteristic Estimates by Texture and Organic
Matter for Hydrologic Solutions, Soil Science Society of America Journal, 70(5), 1569–1578,
doi:10.2136/sssaj2005.0117.
Sims, Ralph E. H., H.-H. Rogner, and K. Gregory (2003), Carbon emission and mitigation cost
comparisons between fossil fuel, nuclear and renewable energy resources for electricity generation,
Energy Policy, 31(13), 1315–1326, doi:10.1016/S0301-4215(02)00192-1.
Tockner, K., and J. A. Stanford (2002), Riverine flood plains: present state and future trends,
Environmental conservation, 29(03), 308–330.
USGS (2006), Major dams of the United States,
http://nationalmap.gov/small_scale/atlasftp.html#dams00x.
WATCH (2010), Sectoral water uses of the 20th century,
ftp://ftp.iiasa.ac.at/Workblock2/sectoral_water_uses/20th_century/.
Watson, I., and A. D. Burnett (1993), Hydrology: An Environmental Approach, 702 pp., CRC Press,
Florida.
WWF (2015), Nile Delta flooded savanna, http://www.worldwildlife.org/ecoregions/pa0904.
Yamazaki, D., S. Kanae, H. Kim, and T. Oki (2011), A physically based description of floodplain
inundation dynamics in a global river routing model, Water Resour. Res., 47(4),
doi:10.1029/2010WR009726.
Zhao, D., and J. Liu (2015), A new approach to assessing the water footprint of hydroelectric power
based on allocation of water footprints among reservoir ecosystem services, Water Scarcity and
Integrated Water Resources Management, 79–82(0), 40–46, doi:10.1016/j.pce.2015.03.005.
Appendix
Table 4: Water balance of Cahora Bassa dam (flows in 106 m
3, WSI dimensionless, WSFP in 10
6 m
3 H2Oe)
Month Inflow Seepage PEV NEV Outflow Consumption WSI WSFPm
Jan 16261 352 376 125 10746 5495 0.010 55 Feb 11074 318 354 118 10691 58 0.010 1 Mar 18430 352 403 181 16535 1540 0.010 16 Apr 8180 341 416 305 5955 1818 0.010 18 May 5711 352 401 342 2175 3157 0.010 32 Jun 4745 341 388 355 2970 1404 0.010 15 Jul 4271 352 389 354 5360 -1447 0.011 -15
Aug 3745 352 486 467 7214 -3836 0.011 -44 Sep 3157 341 554 545 4860 -2052 0.013 -26 Oct 3166 352 611 599 3300 -496 0.015 -8 Nov 3667 341 555 524 5200 -1808 0.014 -26 Dec 5847 352 451 312 5344 395 0.010 4
Total 88255 4148 5382 4228 80349 4228 0.011 22

13
Table 5: Water balance of Aswan High dam (flows in 106 m
3, WSI dimensionless, WSFP in 10
6 m
3 H2Oe)
Month Inflow Seepage PEV NEV Outflow Consumption WSI WSFPm
Jan 4134 1527 840 700 6810 -4342 1.00 -4342 Feb 2134 1379 931 799 6445 -5822 1.00 -5822 Mar 1393 1527 1229 1085 6457 -6734 1.00 -6734 Apr 1492 1477 1479 1442 5458 -5479 1.00 -5479 May 2620 1527 1605 1577 5707 -4638 1.00 -4638 Jun 3008 1477 1650 1648 7447 -5918 1.00 -5918 Jul 7106 1527 1579 1575 9540 -3965 0.79 -3123
Aug 32917 1527 1468 1463 10926 20461 0.22 4566 Sep 40336 1477 1292 1272 10375 28463 0.41 11739 Oct 15666 1527 1158 1077 5964 8094 0.86 6995 Nov 6956 1477 866 706 6001 -682 0.92 -630 Dec 2486 1527 749 588 6304 -5505 0.99 -5443
Total 120248 17974 14846 13932 87432 13932 0.85 -18830
Table 6: Water balance of Three Gorges Dam dam (flows in 106 m
3, WSI dimensionless, WSFP in 10
6 m
3 H2Oe)
Month Inflow Seepage PEV NEV Outflow Consumption WSI WSFPm
Jan 9625 169 58 38 18358 -8911 0.014 -129 Feb 8853 152 51 23 17883 -9168 0.020 -188 Mar 11331 169 92 58 19406 -8223 0.050 -409 Apr 30581 163 114 64 31229 -736 0.103 -76 May 32999 169 128 59 32714 214 0.137 29 Jun 42584 163 161 73 38602 3913 0.017 65 Jul 70287 169 163 54 55617 14503 0.012 169
Aug 75691 169 140 47 58937 16633 0.011 186 Sep 51504 163 127 59 44080 7296 0.011 79 Oct 31490 169 101 63 31787 -470 0.011 -5 Nov 16600 163 61 40 22642 -6178 0.012 -74 Dec 11270 169 46 26 19368 -8268 0.013 -105
Total 392815 1985 1242 605 390622 605 0.034 -457
Table 7: Water balance of Liujianxia dam (flows in 106 m
3, WSI dimensionless, WSFP in 10
6 m
3 H2Oe)
Month Inflow Seepage PEV NEV Outflow Consumption WSI WSFPm
Jan 1062 25 9 7 1231 -197 0.99 -194 Feb 948 22 11 9 1163 -239 1.00 -239 Mar 1056 25 16 14 1228 -198 1.00 -198 Apr 1087 24 21 19 1247 -183 1.00 -183 May 1318 25 24 22 1386 -89 1.00 -89 Jun 1634 24 27 24 1577 34 1.00 34 Jul 1632 25 25 22 1576 35 1.00 35
Aug 3001 25 22 18 2401 585 0.79 461 Sep 2780 24 16 12 2268 492 0.91 446 Oct 2131 25 14 12 1876 231 0.81 187 Nov 1208 24 10 8 1319 -138 0.40 -55 Dec 1152 25 9 7 1286 -161 0.70 -113
Total 19009 291 205 172 18558 172 0.88 92

14
Table 8: Water balance of Laxiwa dam (flows in 106 m
3, WSI dimensionless, WSFP in 10
6 m
3 H2Oe)
Month Inflow Seepage PEV NEV Outflow Consumption WSI WSFPm
Jan 539 1.0 0.3 0.2 735 -197 0.99 -194 Feb 464 0.9 0.4 0.3 689 -226 1.00 -226 Mar 491 1.0 0.6 0.5 706 -216 1.00 -216 Apr 666 1.0 0.7 0.7 814 -149 1.00 -149 May 648 1.0 0.8 0.7 803 -155 1.00 -155 Jun 1213 1.0 0.8 0.7 1151 61 1.00 61 Jul 1554 1.0 0.8 0.5 1361 192 1.00 192
Aug 2232 1.0 0.7 0.5 1780 452 0.79 356 Sep 1863 1.0 0.5 0.3 1552 310 0.91 281 Oct 1527 1.0 0.5 0.4 1344 181 0.81 146 Nov 791 1.0 0.4 0.3 891 -101 0.40 -40 Dec 670 1.0 0.3 0.2 816 -147 0.70 -103
Total 12658 11.7 6.9 5.3 12641 5.3 0.88 -47
Table 9: Water balance of Tumut 3 / Talbingo dam (flows in 106 m
3, WSI dimensionless, WSFP in 10
6 m
3 H2Oe)
Month Inflow Seepage PEV NEV Outflow Consumption WSI WSFPm
Jan 16 4 5 3 20 -9 1.00 -9 Feb 14 4 4 2 19 -10 1.00 -10 Mar 16 4 3 2 20 -9 1.00 -9 Apr 15 4 2 1 19 -8 1.00 -8 May 15 4 1 1 19 -9 0.93 -9 Jun 20 4 1 0 22 -5 0.08 0 Jul 63 4 1 0 44 15 0.02 0
Aug 70 4 1 1 48 19 0.02 0 Sep 71 4 2 1 48 19 0.03 1 Oct 58 4 3 2 42 12 0.06 1 Nov 42 4 4 3 33 4 0.49 2 Dec 37 4 5 3 31 1 0.99 1
Total 436 53 31 18 366 18 0.55 -41
Table 10: Water balance of Murray 1 / Geehi dam (flows in 106 m
3, WSI dimensionless, WSFP in 10
6 m
3 H2Oe)
Month Inflow Seepage PEV NEV Outflow Consumption WSI WSFPm
Jan 23 0.23 0.07 0.05 25 -2.7 1.00 -2.7 Feb 18 0.21 0.05 0.03 22 -4.4 1.00 -4.4 Mar 18 0.23 0.05 0.03 23 -4.3 1.00 -4.3 Apr 17 0.22 0.03 0.01 21 -5.0 1.00 -5.0 May 16 0.23 0.02 0.01 21 -5.1 0.93 -4.8 Jun 18 0.22 0.01 0.00 22 -4.4 0.08 -0.4 Jul 32 0.23 0.01 0.01 31 0.9 0.02 0.0
Aug 38 0.23 0.02 0.01 35 3.3 0.02 0.1 Sep 58 0.22 0.03 0.02 47 11.0 0.03 0.3 Oct 58 0.23 0.04 0.03 47 11.2 0.06 0.7 Nov 31 0.22 0.07 0.05 30 0.5 0.49 0.2 Dec 28 0.23 0.07 0.05 29 -0.5 0.99 -0.5
Total 356 2.68 0.49 0.30 353 0.3 0.55 -20.8

15
Table 11: Water balance of Murray 2 dam (flows in 106 m
3, WSI dimensionless, WSFP in 10
6 m
3 H2Oe)
Month Inflow Seepage PEV NEV Outflow Consumption WSI WSFPm
Jan 23 0.02 0.05 0.03 25 -2.7 1.00 -2.7 Feb 18 0.02 0.04 0.02 22 -4.4 1.00 -4.4 Mar 18 0.02 0.03 0.02 23 -4.3 1.00 -4.3 Apr 17 0.02 0.02 0.01 22 -4.9 1.00 -4.9 May 16 0.02 0.01 0.01 21 -5.1 0.93 -4.7 Jun 18 0.02 0.01 0.00 23 -4.3 0.08 -0.4 Jul 32 0.02 0.01 0.00 31 0.9 0.02 0.0
Aug 38 0.02 0.01 0.01 35 3.2 0.02 0.1 Sep 58 0.02 0.02 0.01 47 10.8 0.03 0.3 Oct 58 0.02 0.03 0.01 47 11.0 0.06 0.7 Nov 31 0.02 0.04 0.02 30 0.4 0.49 0.2 Dec 28 0.02 0.05 0.03 29 -0.5 0.99 -0.5
Total 356 0.26 0.31 0.17 355 0.17 0.55 -20.7
Table 12: Water balance of John Day dam (flows in 106 m
3, WSI dimensionless, WSFP in 10
6 m
3 H2Oe)
Month Inflow Seepage PEV NEV Outflow Consumption WSI WSFPm
Jan 12192 14 2 1 11845 334 0.01 4 Feb 8394 13 3 2 9503 -1121 0.01 -12 Mar 16081 14 5 4 14243 1825 0.01 19 Apr 18516 13 9 7 15744 2758 0.01 29 May 18842 14 13 11 15945 2884 0.02 49 Jun 15214 13 14 13 13709 1492 0.04 64 Jul 7495 14 16 16 8949 -1468 0.22 -322
Aug 8961 14 14 14 9853 -906 0.51 -463 Sep 4931 13 11 11 7369 -2451 0.80 -1958 Oct 8656 14 6 5 9665 -1023 0.10 -100 Nov 8744 13 4 2 9719 -988 0.01 -10 Dec 8063 14 2 1 9299 -1249 0.01 -13
Total 136089 164 100 86 135844 86 0.15 -2714
Table 13: Water balance of Chief Joseph dam (flows in 106 m
3, WSI dimensionless, WSFP in 10
6 m
3 H2Oe)
Month Inflow Seepage PEV NEV Outflow Consumption WSI WSFPm
Jan 4682 8 1 0 5512 -838 0.01 -9 Feb 4034 7 1 0 5113 -1086 0.01 -11 Mar 6508 8 3 2 6638 -139 0.01 -1 Apr 9934 8 4 4 8751 1175 0.01 12 May 13294 8 6 6 10823 2463 0.02 42 Jun 11122 8 7 7 9483 1631 0.04 70 Jul 7732 8 9 8 7393 331 0.22 72
Aug 6714 8 7 7 6765 -59 0.51 -30 Sep 4306 8 6 6 5280 -982 0.80 -785 Oct 5321 8 3 2 5906 -593 0.10 -58 Nov 4881 8 1 0 5635 -762 0.01 -8 Dec 4001 8 1 0 5093 -1099 0.01 -11
Total 82529 97 49 41 82393 41 0.15 -717

16
Table 14: Water balance of Grand Coulee dam (flows in 106 m
3, WSI dimensionless, WSFP in 10
6 m
3 H2Oe)
Month Inflow Seepage PEV NEV Outflow Consumption WSI WSFPm
Jan 4566 411 3 0 403 3753 0.01 39 Feb 3997 372 6 1 1479 2146 0.01 23 Mar 6423 411 16 8 2772 3239 0.01 33 Apr 9785 398 31 24 6265 3118 0.01 33 May 13098 411 46 34 13778 -1097 0.02 -19 Jun 10994 398 55 41 17176 -6588 0.04 -283 Jul 7637 411 63 55 21488 -14262 0.22 -3125
Aug 6654 411 56 50 5858 385 0.51 197 Sep 4264 398 41 36 2440 1423 0.80 1137 Oct 5291 411 14 9 3247 1643 0.10 161 Nov 4796 398 6 2 974 3428 0.01 36 Dec 3908 411 3 1 432 3073 0.01 32
Total 81413 4844 341 262 76313 262 0.15 -1735
Table 15: Water balance of The Dalles dam (flows in 106 m
3, WSI dimensionless, WSFP in 10
6 m
3 H2Oe)
Month Inflow Seepage PEV NEV Outflow Consumption WSI WSFPm
Jan 13455 56 1 0 12797 607 0.01 6 Feb 9144 50 2 1 10147 -1051 0.01 -11 Mar 17630 56 3 1 15363 2213 0.01 23 Apr 19489 54 5 4 16506 2930 0.01 31 May 19519 56 8 6 16525 2940 0.02 50 Jun 15563 54 9 7 14093 1416 0.04 61 Jul 7601 56 11 10 9198 -1654 0.22 -362
Aug 9077 56 9 8 10106 -1084 0.51 -554 Sep 4994 54 7 6 7596 -2655 0.80 -2122 Oct 8742 56 3 2 9900 -1211 0.10 -118 Nov 9010 54 2 1 10064 -1104 0.01 -12 Dec 8503 56 1 0 9753 -1301 0.01 -14
Total 142727 656 61 46 142047 46 0.15 -3022
Table 16: Derivation of net evaporation from floodplains downstream of the Aswan High dam
Month Discharge
(m3/s) Excess* (m3/s)
Area (km2)
PEV (106 m3)
NEV (106 m3)
Jan 1547 0 0 0 0 Feb 885 0 0 0 0 Mar 520 0 0 0 0 Apr 577 0 0 0 0 May 980 0 0 0 0 Jun 1165 0 0 0 0 Jul 2676 0 0 0 0
Aug 12314 4564 5020 544 403 Sep 15562 7812 8593 216 36 Oct 5859 0 0 0 0 Nov 2697 0 0 0 0 Dec 930 0 0 0 0
Total - - - 759 439
17
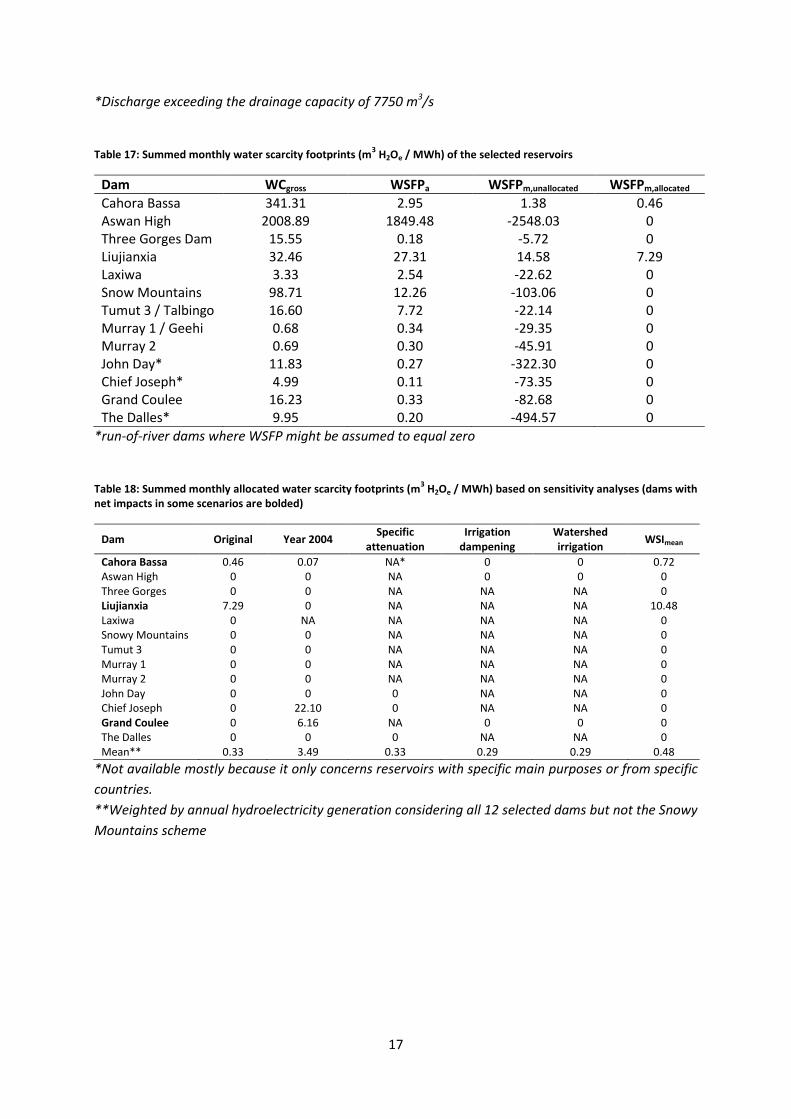
*Discharge exceeding the drainage capacity of 7750 m3/s
Table 17: Summed monthly water scarcity footprints (m3 H2Oe / MWh) of the selected reservoirs
Dam WCgross WSFPa WSFPm,unallocated WSFPm,allocated
Cahora Bassa 341.31 2.95 1.38 0.46 Aswan High 2008.89 1849.48 -2548.03 0 Three Gorges Dam 15.55 0.18 -5.72 0 Liujianxia 32.46 27.31 14.58 7.29 Laxiwa 3.33 2.54 -22.62 0 Snow Mountains 98.71 12.26 -103.06 0 Tumut 3 / Talbingo 16.60 7.72 -22.14 0 Murray 1 / Geehi 0.68 0.34 -29.35 0 Murray 2 0.69 0.30 -45.91 0 John Day* 11.83 0.27 -322.30 0 Chief Joseph* 4.99 0.11 -73.35 0 Grand Coulee 16.23 0.33 -82.68 0 The Dalles* 9.95 0.20 -494.57 0
*run-of-river dams where WSFP might be assumed to equal zero
Table 18: Summed monthly allocated water scarcity footprints (m3 H2Oe / MWh) based on sensitivity analyses (dams with
net impacts in some scenarios are bolded)
Dam Original Year 2004 Specific
attenuation Irrigation
dampening Watershed irrigation
WSImean
Cahora Bassa 0.46 0.07 NA* 0 0 0.72 Aswan High 0 0 NA 0 0 0 Three Gorges 0 0 NA NA NA 0 Liujianxia 7.29 0 NA NA NA 10.48 Laxiwa 0 NA NA NA NA 0 Snowy Mountains 0 0 NA NA NA 0 Tumut 3 0 0 NA NA NA 0 Murray 1 0 0 NA NA NA 0 Murray 2 0 0 NA NA NA 0 John Day 0 0 0 NA NA 0 Chief Joseph 0 22.10 0 NA NA 0 Grand Coulee 0 6.16 NA 0 0 0 The Dalles 0 0 0 NA NA 0 Mean** 0.33 3.49 0.33 0.29 0.29 0.48
*Not available mostly because it only concerns reservoirs with specific main purposes or from specific
countries.
**Weighted by annual hydroelectricity generation considering all 12 selected dams but not the Snowy
Mountains scheme
Related Documents


![Boosting hydropower output of mega cascade reservoirs ...folk.uio.no/chongyux/papers_SCI/Appl-Energy_1.pdf · timization using GA [27], PSO [28] and DE [29] is less than ten while](https://static.cupdf.com/doc/110x72/5f703ef0f99aa954395b07f1/boosting-hydropower-output-of-mega-cascade-reservoirs-folkuionochongyuxpaperssciappl-energy1pdf.jpg)