Water Recycling of Bojongsoang WWTP Beneficiary: supply water for non domestic demands (agriculture , fisheries and industrial) in Bandung City and surrounding area. Estimated Project Cost: Rp 11,01 Billion (or equivalent with 1.23 Million US $) Project Location: Bandung City and surrounding area Project Scope: Consist of 2 system options : 1. Wetland (20 L/s) and Physical Chemistry (80 L/s), or 2. Physical Chemistry (100 L/s) 51

Welcome message from author
This document is posted to help you gain knowledge. Please leave a comment to let me know what you think about it! Share it to your friends and learn new things together.
Transcript

Water Recycling of Bojongsoang WWTP Beneficiary: supply water for
non domestic demands(agriculture , fisheries andindustrial) in Bandung Cityand surrounding area.
Estimated Project Cost: Rp11,01 Billion (or equivalentwith 1.23 Million US $)
Project Location: BandungCity and surrounding area
Project Scope:
Consist of 2 system options :
1. Wetland (20 L/s) andPhysical Chemistry (80L/s), or
2. Physical Chemistry (100L/s)
51

OVERVIEW OF THEWATER SERVICES INDUSTRY
IN MALAYSIA
BYBY
MDM. NOR ‘AINI ABDUL WAHABMDM. NOR ‘AINI ABDUL WAHABDEPUTY SECRETARYDEPUTY SECRETARY--GENERALGENERAL
(GREEN TECHNOLOGY AND WATER)(GREEN TECHNOLOGY AND WATER)MINISTRY OF ENERGY, GREEN TECHNOLOGY AND WATER,MINISTRY OF ENERGY, GREEN TECHNOLOGY AND WATER,
MALAYSIAMALAYSIA
14 FEBRUARY 201114 FEBRUARY 2011

OUTLINE OF PRESENTATION
2
1 BACKGROUND
2 AREAS OF CONCERN
3 THE WAY FORWARD

BACKGROUND
ROLE OF KETTHA FOR THE WATER SECTOR
ECONOMIC TRANFORMATION PLAN
MALAYSIA DEVELOPMENT PLAN
MINISTRY‘S STRATEGIC PLAN 2010 – 2015FOR THE WATER SECTOR
3

4
ROLE OF KETTHA (MINISTRY OF ENERGY,GREEN TECHNOLOGY AND WATER)
Formulation and implementation of national water policy.
Planning and developing strategic directions.
Formulating licensing and supervising policy and framework.
Planning, evaluating and monitoring development projects.
Create a regulatory system that is dynamic and progressive.
Ensure a suitable environment for the development of thewater service industry

ECONOMIC TRANSFORMATIONPROGRAMME
KEY PERFORMANCE INDICATORS
MALAYSIA DEVELOPMENT PLANS
KETTHA’S STRATEGIC PLAN 2010-2015
5

6
WATER SERVICES INDUSTRY ROADMAP
8th Plan Period
(2001-2005)
Stabilization
9th Plan Period
(2006-2010)
Consolidation
10th Plan Period
(2011-2015)
Towards Efficiency
Privatisation andcorporatization of statewater authorities
Planning forrestructuring of waterservices industry
-amendments to FederalConstitution
Operationalisation ofSPAN
Enforcement of WSIA2006
Transfer of water relatedassets to PAAB atnegotiated value anddevelopment of newwater infrastructure
Service providersbecome asset light andfocus on efficiency andeffectiveness
Tariff setting mechanismto allow full cost recoveryto be fully phased in by2013
Integration of watersupply and sewerageservices
Initial efforts towardsintroduction of integratedwater and seweragetariffs

7
WATER MANAGEMENT IN MALAYSIA –PRE-AMENDMENTS TO THE FEDERAL
CONSTITUTION

8
WATER MANAGEMENT IN MALAYSIA –POST-AMENDMENTS TO THE FEDERAL
CONSTITUTION

9
MANAGEMENT OF SEWERAGE SERVICESIN MALAYSIA

10
PRINCIPAL ROLE OF FEDERAL ANDSTATE GOVERNMENTS
Body Area ofresponsibility
Description
FederalGovernment
Policy matters Development of a holistic waterpolicy for the country by settingpolicy directions.
State Government Water resourcesmatters
Manage existing water basins withthe view of protecting the quality ofraw water and identifying new waterbasins when required.
National WaterResourcesCouncil (NWRC)
Governance matters Ensures coordination with thevarious State Governments in themanagement of the water resources.
SuruhanjayaPerkhidmatan AirNegara (SPAN)
Regulatory matters Regulate the whole water industrybased on the policy directions setout by the Federal Government.Promote an efficiency driven regime

11
INTRODUCING REGULATORY REGIME
WATER SERVICESINDUSTRY ACT 2006
(WSIA)
NATIONAL WATERSERVICES
COMMISSION
PAAB – PENGURUSANASET AIR BERHAD -
(WATER MANAGEMENTAGENCY)
INDAH WATERKONSORTIUM
BERHAD
12
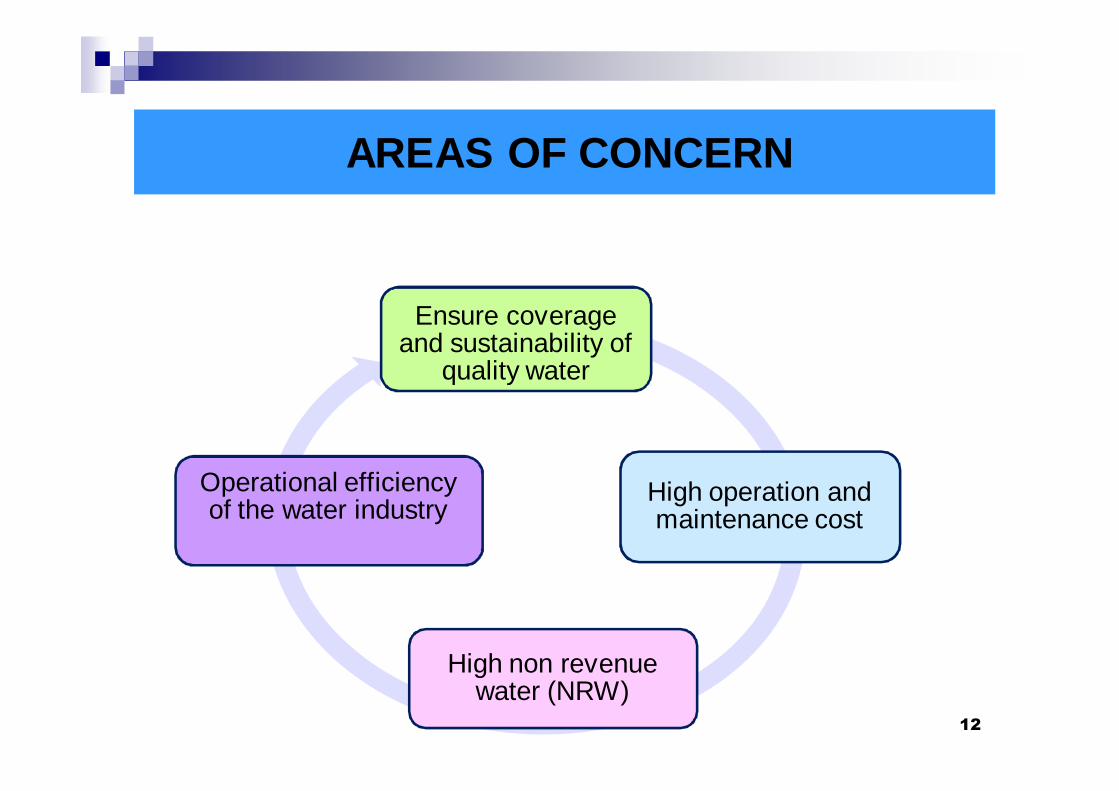
AREAS OF CONCERN
Ensure coverageand sustainability of
quality water
High operation andmaintenance cost
High non revenuewater (NRW)
Operational efficiencyof the water industry

13
THE WAY FORWARD
ETP
Regionalization oftreatment plants
Operation andmaintenance
Waste to wealth
Non Revenue Water
Green fees
Consumer

To create a holistic and viablewater services industry with theproficiency to deliver an efficientand excellent water and sewerageservice
14

15
Thank you

SEWERAGE MANAGEMENT
IN MALAYSIA
Presentation to PPP Council for Overseas Water Infrastructure

Year
Technology
1950-s 1970-s 1980-s 1990-s 2000
Primitive / Primary Treatment Partial / Full Secondary Treatment
1960-s
Pour Flush Septic Tank Imhoff Tank OP/AL Activated Sludge/
Biological Filters
Fully
Mechanised
Plants
(Address Public Health) (Address River Pollution) (Address Environment)
Future Tertiary
Treatment
Prior to 1950-s
Early Days in
Malaya
Evolution of Sewerage Systems in Malaysia
The sewerage technology in Malaysia has improved significantly within a span of over 5 decades2
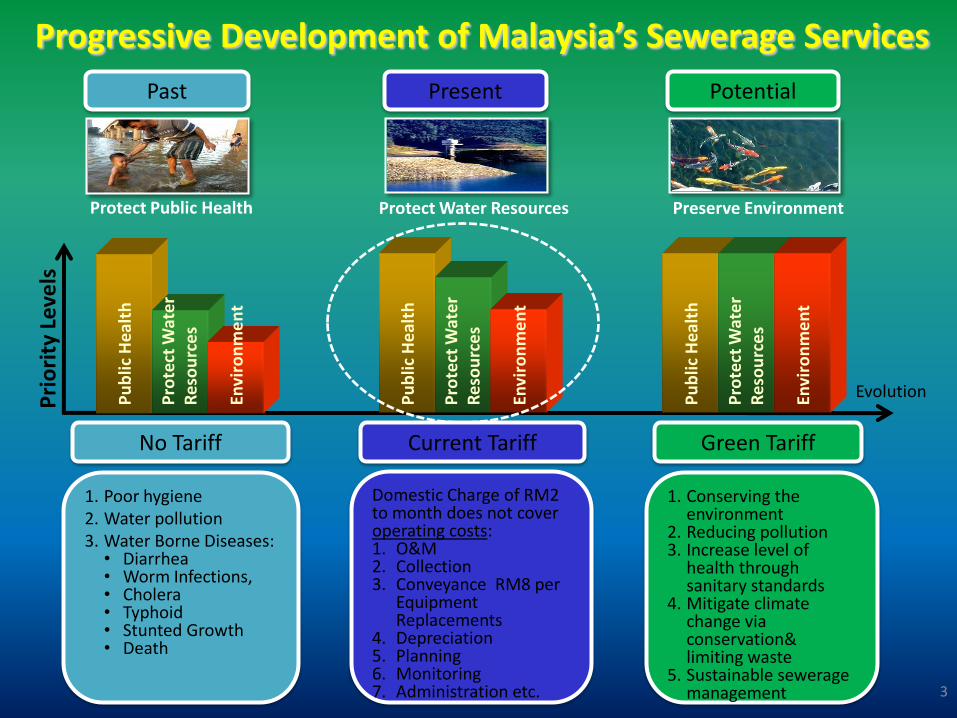
Domestic Charge of RM2 to month does not cover operating costs:1. O&M2. Collection3. Conveyance RM8 per
Equipment Replacements
4. Depreciation5. Planning6. Monitoring7. Administration etc.
1. Poor hygiene2. Water pollution3. Water Borne Diseases:
• Diarrhea• Worm Infections, • Cholera• Typhoid• Stunted Growth• Death
1. Conserving the environment
2. Reducing pollution3. Increase level of
health through sanitary standards
4. Mitigate climate change via conservation& limiting waste
5. Sustainable sewerage management
No Tariff Current Tariff Green Tariff
Pri
ori
ty L
eve
ls
Evolution
Protect Public Health Protect Water Resources Preserve Environment
Past Present Potential
Progressive Development of Malaysia’s Sewerage Services
Pu
blic
He
alth
Pro
tect
Wat
er
Re
sou
rce
s
Envi
ron
me
nt
Pu
blic
He
alth
Pro
tect
Wat
er
Re
sou
rce
s
Envi
ron
me
nt
Pu
blic
He
alth
Pro
tect
Wat
er
Re
sou
rce
s
Envi
ron
me
nt
3

Sewerage Management in Malaysia
4

Governance Structure for Sewerage Services
Ministry of FinanceMinistry of Natural
Resources & Environment
Ministry of Energy, Green Technology &
Water
Regulator of
Effluent standards
Regulator of Sewerage Services
• 100% Equity• Govt. Support Loan & Subsidy
1. Sewerage Services2. Operator in 88 Local
Authority Areas. 3. Sewerage Services Billing &
Collection. 4. Undertakes Refurbishment/
Upgrading Projects Funded by Govt.
Policy & Control of National Sewerage Agenda
5

Areas of IWK Coverage and Resources
* Exclusive of 2.96 million population utilising primitive (pour flush) systems
PADANG
TERAP
SIK
YAN
BALING
KULIM
BANDARBAHARU
DAERAH
HULU
PERAK
SELAMA
KERIAN
LARUT&
MATANG
KUALA KANGSAR
KINTAMANJUNG
PERAKTENGAH
BATANGPADANG
HILIR PERAK
GUA
MUSANG
KUALA
KRAI
JELI
TANAHMERAH
MACHANG
PASIRPUTEH
BACHOKPASIR MAS
TUMPA
KOTA BHARU
BESUT
SETIU
TERENGGANU
HULU
TERENGGANU
DUNGUN
LIPIS
KEMAMANJERANTUT
RAUB
BENTUNG
TEMERLUH
MARAN
KUANTAN
PEKAN
ROMPIN
SEGAMAT
MUAR
KANGAR
KUALAMUDA
SUNGAIPETANI
JOHOR
PORTDICKSON
SELANGORKUALA
SELANGOR
BATU PAHAT
JOHOR BHARU
KOTA
ALORGAJAH
JASIN
MELAKA
TENGAH
TAMPIN
JEMPOLKUALA
PILAH
JELEBU
SEREMBAN
REMBAU
SABAKBERNAM
KUALALANGAT
SEPANG
HULUSELANGOR
HULULANGAT
PETALING
THAILAND
MARANG
MELAKA
N.SEMBILAN
PINANGPULAU
PAHANG
TERENGGANU
SINGAPURA
PONTIAN
MERSING
PERAKKELANTAN
KEDAH
PERLIS
PASU
PENDANG
KUBANG
KOTA
SETAR
TINGGI
CAMERONHIGHLANDS
KUALA
Skudai
Melaka
K.Terengganu
Alor Setar
Kuantan
Kluang
Langkawi
Penang
S.Prai
Ipoh
Taiping
Shah Alam
Langat
Kuala Lumpur
Seremban
Gombak
Klang
Labuan
•IWK TOTAL OPERATIONAL AREA AND POPULATION
SERVED (As at December 2010)
AREA
(Sq. Km)
% POPULATION
EQUIVALENT
(PE)
%
IWK 68,505.88 51.8 19,134,331 71.7
NON-IWK 63,769.54 48.2 7,361,729 28.3
TOTAL 132,275.42 100.0 26,695,297 100.0
1. No. of Unit Office: 182. No. of Reporting Center: 483. No. of Laboratory facility: 34. No. of Certification Office: 115. No. of Regional Planning Office: 46. No. of Staff: 2,7337. No. of Vehicle owned: 5598. No of Local Authorities Served: 88
6

COMMUNAL SEPTIC TANK
0.4 mil PE (2%)
IMHOFF TANK
0.55 mil PE(2%)
OXIDATION PONDS
1.67 mil PE (7%)
MECHANICAL PLANTS WITH
MEDIA0.8 mil PE
(3%)
MECHANICAL PLANT
WITHOUT MEDIA
15.69 mil PE (61%)
NETWORK PUMP
STATIONS3.97 mil PE
(15%)
AERATED LAGOON
2.67 mil PE (10%)
Individual Septic Tanks
Communal Septic Tanks & Imhoff Tanks
4,374 no.
Mechanical plants
4,439 no.
Oxidation Pond
425 no.
Aerated Lagoon
163 no.
Pump Stations
790 no.
Pipe Network
14,739 km
COMMUNAL SEPTIC TANK,
3,633 (36%)
IMHOFF TANK,
741 (7%)
OXIDATION PONDS, 425
(4%)
MECHANICAL PLANTS WITH
MEDIA, 215 (2%)
MECHANICAL PLANT
WITHOUT MEDIA, 4,224
(41%)
NETWORK PUMP
STATIONS, 790 (8%)
AERATED LAGOON, 163
(2%)
Types of Treatment Plants
Population Equivalent Catered By Treatment Plants
Total Connected Population Equivalent Served by IWK is 18.7 million (excluding CSTs & NPSs).
Approx. 1.2 mil Individual Septic Tanks and Population Equivalent Served by IWK is 6.1 mil.
IWK’s Assets and Population Equivalent Served
7

0
1,000
2,000
3,000
4,000
5,000
6,000
1998 1999 2000 2001 2002 2003 2004 2005 2006 2007 2008 2009 2010
Year
Nu
mb
er o
f p
lan
ts
0
5
10
15
20
25
Po
pu
lati
on
Eq
uiv
alen
t (m
illio
n)
Number of plants
Population Equivalentserved
• Lack of investment in building large/regional STPs by the Government has resulted in the proliferations of small plants in new developments by developers.
• On the average about 300 STPs are built by developers & handed over to IWK to operate and maintain each year. (83% of which are STPs less than 5,000 PE)
Sewage Treatment Plants Growth
8
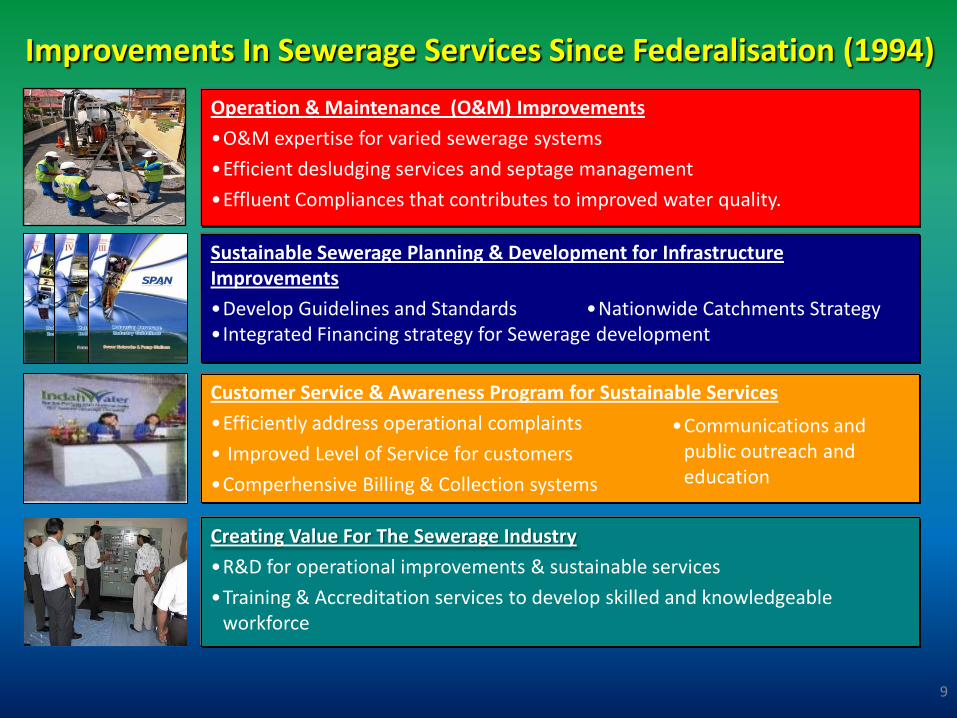
Operation & Maintenance (O&M) Improvements
•O&M expertise for varied sewerage systems
•Efficient desludging services and septage management
•Effluent Compliances that contributes to improved water quality.
Creating Value For The Sewerage Industry
•R&D for operational improvements & sustainable services
•Training & Accreditation services to develop skilled and knowledgeable workforce
Customer Service & Awareness Program for Sustainable Services
•Efficiently address operational complaints
• Improved Level of Service for customers
•Comperhensive Billing & Collection systems
•Communications and public outreach and education
Sustainable Sewerage Planning & Development for Infrastructure Improvements
•Develop Guidelines and Standards•Integrated Financing strategy for Sewerage development
•Nationwide Catchments Strategy
Improvements In Sewerage Services Since Federalisation (1994)
9

Financial ManagementDistribution
Business Performance
Asset Maintenance
1. Material Cost2. Spare Parts3. Inventory Parts4. Parts Purchase
1. Fleet2. Equipment3. Fault Report4. Scheduling5. Manpower6. Work Order7. Preventive
Maintenance
1. Cash Flow2. Consolidated
Accounts3. Budget Control4. Fixed Assets5. A/C Receivables6. A/C Payables7. General Ledger8. Utility Payables
1. Receiving2. Inventory3. Purchase
Requisition4. Purchase
Order
An integrated Financial, Asset, Laboratory, Customer Operations Enquiry & DesludgingManagement Systems to provide operational efficiency
Key Performance Indicators (KPI)
1. Online Purchase Requisition Approval
2. Budget Allocation & Utilization
3. Financial Authority Limit
Laboratory Mgt SystemsQuality Measurement
Customer Mgt Systems Enquiry, Request & Complaints
Total Asset Management System
10

11
Capacity Building for Urban Environmental Company URENCO
Halong City, Vietnam
REGIONAL WATER AND SANITATION WORKSHOP AND TRAINING -
Developing Comprehensive SeptageManagement Programs in Asia
Twinning partnership with PerusahanDaerah Air Minuman (PDAM) Tirtanadi,
Medan, Indonesia
Waterlinks Forum at Bangkok Study visit by NGO bodies from various city of Philippines
Date Visit: 14 December 2006
Technical visit from Vietnam Coastal City Environmental Sanitation Project
Date Visit: 5 – 7 October 2009
15th African Water Association Congress at Kampala
Date: 15 – 18 March 2010
Study Visit from TAIZ Water & Sanitation Local Corporation, Yemen
Date Visit: 22-26 January 2007
Study visit from Oman Wastewater Services Company
Date Visit: 10-12 September 2007
Technical Study Visit by Iranian Delegates
Date Visit: 13 November 2009
Technical visit by Philippine Department of Environment and Natural Resources
Southern Mindanao on 20th – 21st July 2010
Diagnostic visit to Jemshedpur Utilities & Services Company Limited, India on
7th – 10th December 2010
Workshop for Philippine Multiple-Recipient Water Operator Partnership on 9th – 11th
November 2010
Twinning Partnership with MayniladWater Services, Philippines on January-
August 2010
Twinning Partnership with Hai PhongDrainage and Sewerage Company
(SADCO), Vietnam on Mac 2010-Sept 2010
Capacity Building Initiative at International Level

Total Priority CAPEX Required FY 2011 to 2013
12

30 NosSludge treatment facilities
26 NosRegional sewerage facilities
1,300 kmSewer rehabilitation
4,600 STPsRefurbishment and upgrading of
STPs to Cat 1 Stds.
DescriptionItem
Refurbishment and
upgrading of plants
to meet new
Category 1
standards;
Sludge treatment
facilities;
Sewer rehabilitation
program;
Regionalistation and
rationalisation in
priority areas;
Focus on Operational
Enhancements and
Compliance to Standards
Phase 1 – Priority Needs Capital Expenditure Plan
13

836,470 propertiesConversion of pour flush to ISTs
63 NosSludge treatment facilities
244,034 propertiesSullage Connection
552,244
properties
Backlog connection (incl. sewer
reticulation)
178 NosRegional sewerage facilities
1,319 kmSewer rehabilitation
7,141 STPsInfrastructure upgrading and
rationalisation
DescriptionItem Refurbishment and
upgrading of plants
to meet new
Category 1
standards;
Rationalisation and
regionalisation of
plants;
Sewer rehabilitation
program and
connection of
premises to network;
Develop new plants
and sludge
treatment facilities
and land acquisition;
Convert pour flush
to ISTs
Increase sullage
connection to sewer
network
Meets all objectives for the
Sewerage Industry
Long Term Needs Capital Expenditure Plan
14

Sewerage CAPEX Fundings Sources
Current major CAPEX Fundings:
• Malaysia Plan
• Funds via Government-to-Government arrangement
Potential Sources of Financial for CAPEX
* Malaysia Plan
* Government Grant
* Bond
* Sabah Credit Corporation
* Public Private Partnership /
Private Finance Initiative
15

Water Services Industry Act
2006(WSIA Act 655) and
National Water Services
Commission Act (SPAN Act
654) recently gazetted for
enforcement
New integrated regulator for
water and wastewater
services (“SPAN”) was
officially announced in
February 07
SPAN WSIA
WSIA offers resolution to critical issues for the
sewerage industry such as billings &
collection, refusal for individual septic tank
desludging service and maintenance of
private sewage treatment plants.
NEW ENACTMENTS
Progressing Towards
New Water
&
Sewerage Regime
Moving Forward
16
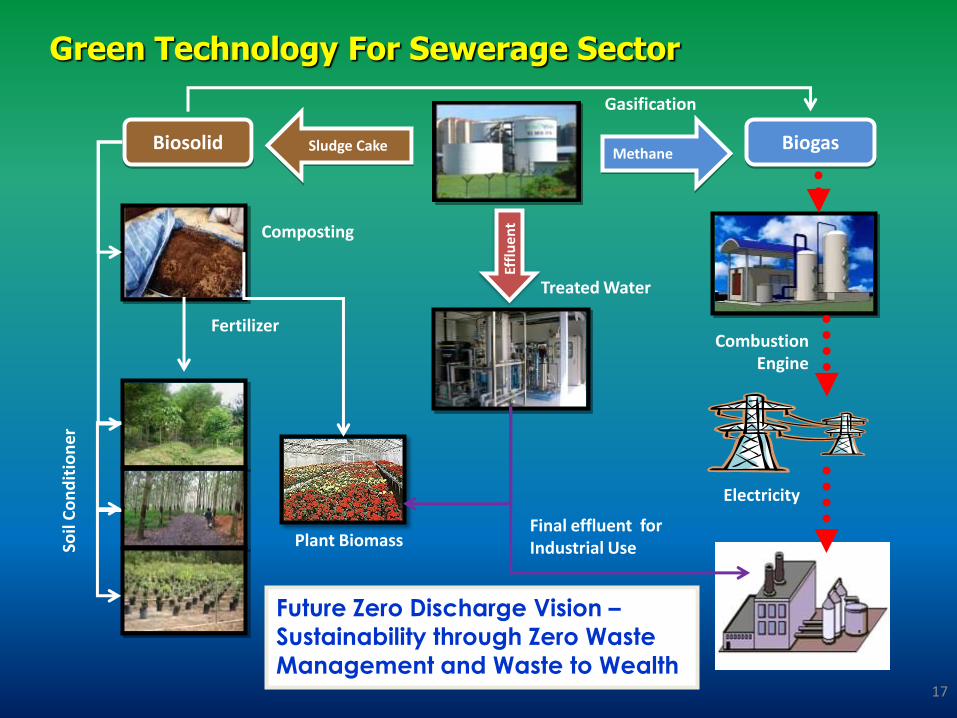
Green Technology For Sewerage Sector
Biosolid
Plant BiomassFinal effluent for Industrial Use
Methane
Combustion Engine
Electricity
Composting
Fertilizer
Soil
Co
nd
itio
ne
r
Effl
uen
t
Sludge Cake
Gasification
Biogas
Treated Water
Future Zero Discharge Vision –
Sustainability through Zero Waste
Management and Waste to Wealth17

To ensure a sustainable future, R&D initiatives will need to look
beyond:
Research & Development For Green Technology
Opportunities of Joint Efforts and Assistance In R&D For Green Technology Towards A Sustainable Future
Independent Efforts Across Institutional Domains
Collaborative Approaches & Network Alliances
Traditional & Institutionalized
Experimental & Innovative Approaches Towards Commercialization
Bench Scale Field Trials and Progressive uptake
Fundamental Research
Applied Research
Meeting Regulatory Requirements
Improved & Cost-efficient Treatment Process
Sewage Treatment& Sludge Disposal
Recovery of Resources, such as Energy, Water and Nutrient for Reuse
18

Improve Network & Alliances:
Policy to promote partnerships & knowledge sharing.
Guidelines & Code of Practice with Model collaborative contracts.
Establish routes & forms for dissemination. Government
Academia
Private
Industry
Public
Organizations
Optimize Resources:
Dedicated funds for the wastewater sector ‘s priority areas.
Government subsidies for Pilot Projects in reuse.
Industry to provide test beds
Institutions to provide quality laboratory and analytical facilities.
Research Commission:
Prioritize R&D areas for the sector.
Manage dedicated funds, review proposals and award.
Manage dissemination routes and function as database depository.
Reward system for generation of IPs and Product commercialization.
Promote Niche Expertise:
Academia to lead in Fundamental and Nationwide research.
Industry to actively promote applied, experimental and innovative activities.
Public sector inputs on socio-economics.
Strategizing R&D Initiatives
19

Moving Towards 1 Water for 1 Malaysia
WATER
RESOURCE
MANAGEMENT
RIVER BASIN
MANAGEMENT
WATER SUPPLY & SEWERAGE
WATER & SANITATION
20

THANK YOU
For further enquiries kindly contact:
DATUK IR ABDUL KADIR MOHD DINChief Executive Officer
Indah Water Konsortium Sdn BhdEmail: [email protected]
www.iwk.com.my
21

DEVELOPING NEW WATERSOURCES FOR METRO MANILA
A Presentation for the
PPP Council for Overseas Water Infrastructure
by Ramon Alikpala, Chairman
Metropolitan Waterworks and Sewerage System (MWSS)

The Metropolitan Waterworksand Sewerage System (MWSS)
The largest waterprivatization project in theworld
Services water supply andsewerage requirements ofapproximately 15 millionpeople

MWSS Priorities for Next 6 Years
1. Development of New Water Sources
2. Development of Replacement Source for Irrigation
Related Documents