Ajith Joseph, K., N.Nandini Menon and Shadananan Nair, K.S. JULY, 2011 TECHNICAL REPORT ON WATER QUALITY MONITORING AND LOW COST PURIFICATION STRATEGIES FOR INLAND WATERWAYS OF LOW-LYING AREAS NERCI Technical Report No.7, July, 2011 DOI: 10.13140/2.1.3206.5920

Welcome message from author
This document is posted to help you gain knowledge. Please leave a comment to let me know what you think about it! Share it to your friends and learn new things together.
Transcript
Ajith Joseph, K., N.Nandini Menon and Shadananan Nair, K.S.
JULY, 2011
TECHNICAL REPORT ON
WATER QUALITY MONITORING AND LOW COST PURIFICATION STRATEGIES FOR INLAND
WATERWAYS OF LOW-LYING AREAS
NERCI Technical Report No.7, July, 2011
DOI: 10.13140/2.1.3206.5920
Ajith J.K. et al., 2011. NERCI Technical Report No.7, 90pp. 2011
Project # (Office use)
Project title: Water quality monitoring and low cost purification strategies for inland waterways of low-lying areas
Country India/Kerala/Kottayam
Selected year August, 2007 – December 2009 Implementing organisation:
Nansen Environmental Research Centre (India)
Partner organisations:
Centre for Earth Research and Environment Management
NetRes The Energy Resources Institute (TERI)
Project duration: August/2007- December/2009 - (28 months)
TABLE OF CONTENTS
PREFACE……………………………………………………………………………………………………………3
LOCATION MAP………………………………………………………………………………………………...4
ACRONYMS………………………………………………………………………………………………………..5
REFERENCE (Apndx.1) ……………………………………………………………………………….……. 81
PICTURES (Apndx.2)…………………………………………………………………………………….…….85
1. Outline of the evaluation study
1.1 Project background ...................................................................................5
1.2 Project Overview ........................................................................................9
1.3. Study Objectives ......................................................................................10
1.4. Scope of Work...........................................................................................10
1.5. Study Period..............................................................................................10
2. Methodology
2.1 Evaluation questions..................................................................................11
2.2 Methodology .............................................................................................11
1
Ajith J.K. et al., 2011. NERCI Technical Report No.7, 90pp. 2011
2.3. Schedule of the Study ..............................................................................12
3. Results
3.1. Project Implementation..............................................................................13
3.1.1. Planned and Actual Input ......................................................................13
3.1.2. Planned and Actual Activities ............................................................... .13
3.2. Relevance .................................................................................................14
3.2.1 Priority of the targeted issues ………………………………………………..14
3.2.2 Needs of target groups ...…………………………………………………….14
3.2.3. Relevance of Project scope, expected outcome …………………………..15
3.3. Effectiveness ...............................................................................................15
Attribution of outputs on the project objective
3.4. Self-reliance of the Project .........................................................................16
3.5. Participation............................................................................................. ..16
Analysis of Factors Attributable to Project Results............................................16
3.6. Conclusions............................................................................................. ..17
Recommendations……………………………………………………………………19
Lessons learned................................................................................................20
4. Recommendations To The Implementing Organisation (By Netres) .....21
Annex 1.Baseline information of the study region.............................................24
Annex 2.Identification and selection of low cost water purification material......59
Annex 3 Biowall construction to control bank erosion.......................................60
Annex 4. Phytoremediation……………………………........................................63
2
Ajith J.K. et al., 2011. NERCI Technical Report No.7, 90pp. 2011
Annex 5. Awareness campaign…………………………………………………… 66
Annex 6. Geospatial analysis………………………………………………………..71
Annex 7 Biodiversity Studies…………………………………………………………79
Preface
The Asia-Pacific Forum for Environment and Development (APFED) Showcase Facility is a joint activity
of the UNEP, acting as the Showcase Facility Secretariat and the Institute for Global Environmental
Strategies (IGES). The Showcase facility aims to demonstrate, through the implementation of
showcase projects, innovative practices for sustainable development in the Asia and Pacific region.
Following a call for proposals by APFED secretariat in 2007, Nansen Environmental Research Centre
(India), a non-profit research centre based in Cochin (Kochi) in partnership with Centre for Earth
Research and Environment Management, Cochin submitted this project proposal entitled “Water
quality monitoring and low cost purification strategies for inland waterways of low-lying areas” and
was approved for funding. This project is aimed at improving the water quality of canals connected
to the Meenachil River in Arpookara Panchayat, Kottaym District, one of the major rivers in the low
lying areas of upper Kuttanad in Kerala State, southwest coast of India, through the implementation
of low cost purification strategies suitable to the region. The showcase panel of APFED selected this
proposal for implementation through APFED NetRes, TERI - New Delhi, India providing strategic
advice and recommendations in facilitating the development and implementation of policies,
programs and activities in pursuit of environmental management and sustainable development.
Through adoption and implementation of low cost purification strategies of phytoremediation and
bio-wall construction and installation of wind induced aerator system in the study region, the project
was successful in improving the water quality of canals, in conserving the biodiversity in the rivers,
canals and wetlands of the study region, in controlling the growth of weeds, mosses and shrubs in
the water body, in bringing about better waste management and reducing bacterial pollution, in
protecting the river banks by natural water weeds and herbs and in increasing the living standard of
poor fishermen by increased catch and utilisable water from clean environment.
3
Ajith J.K. et al., 2011. NERCI Technical Report No.7, 90pp. 2011
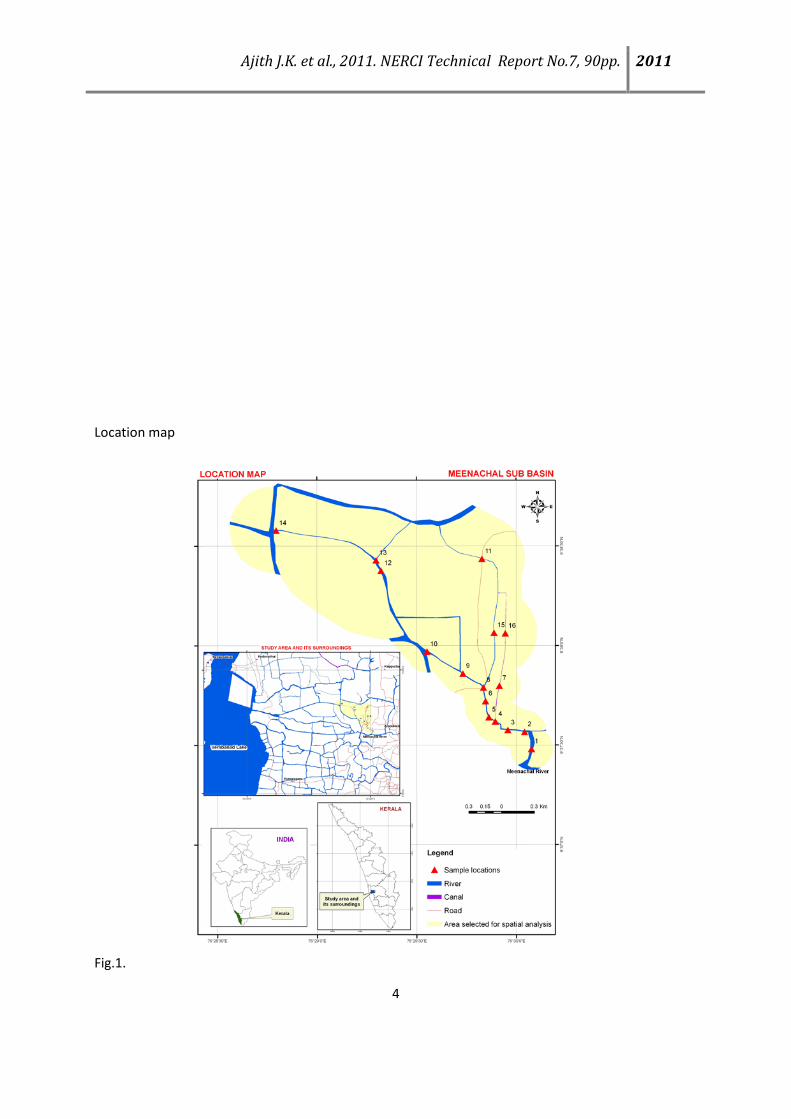
Location map
Fig.1.
4
Ajith J.K. et al., 2011. NERCI Technical Report No.7, 90pp. 2011
Acronyms:
APFED: Asia Pacific Forum for Environmental Development
BOD: biological oxygen demand
CEREM: Centre for Earth Research and Environment Management
COD: chemical oxygen demand
CPCB: Central Pollution Control Board
CSC: Coconut shell charcoal
DO: Dissolved oxygen
IGES: Institute for Global Environmental Strategies
K: Potassium
Na: Sodium
NERCI: Nansen Environmental Research Center India
NERSC: Nansen Environmental and Remote Sensing Centre
NGO: Non-Governmental Organization
SHG: Self Help Groups
TERI: The Energy Resources Institute
VS: Vetiver system
5
Ajith J.K. et al., 2011. NERCI Technical Report No.7, 90pp. 2011
1. OUTLINE OF THE EVALUATION STUDY
1.1. Project Background
Kuttanad is a fertile tract of land replenished by silt brought by the river systems, spread over
Pathanamthitta, Kottayam and Alappuzha districts. It is a low-lying area with backwaters, canals and
stream networks extending over 874 sq. km.The area was found to be highly suited for rice
cultivation from early days. However, reclaiming land from floodwaters was a hazardous task.
Reclamation of land for cultivation and flood control used to be undertaken by private farmers, with
assistance from the State (Pillai and Panikar, 1965). Over a period Kuttanad became the rice bowl of
the State with a predominantly rice-centric economy.
Almost all the modern State interventions in Kuttanad were oriented towards achieving a single
objective - to boost rice production. The earlier ones were aimed at intensifying cultivation by
conversion from single crop to double crop rice. Studies identified two preconditions for achieving
this goal in the region.
(i) Speedy drainage of the flood waters during the north-east monsoon, and
(ii) Prevention of saline water incursion into the Vembanad Lake during summer.
Two engineering structures were suggested for these purposes:
(i) A spillway at Thottappally meant to drain off flood waters, and
(ii) A regulator of Thanneermukkom to check the incursion of saline water.
The spillway, reported to have been designed after detailed hydrographic and hydrological studies, is
draining only less than one-third of the desired capacity (Kannan, 1979). The Thanneermukkom
Regulator, 1402m-long, located at about 22.5 km north of Alappuzha has also proved itself to be a
disaster. However, these developmental activities have reduced the risks of natural hazards like
flood and saline water intrusion for Punja crop and helped extension of area under cultivation. Now
the entire Kuttanad area is under high-yielding varieties (HYV) of rice. Owing to the elimination of the
risks from natural hazards, the discipline observed in earlier times in respect of agricultural practices
during seasons of rice cultivation has disappeared. With the use of HYV seeds having only low
resistance to pests and diseases, high seed rate, non-judicious fertiliser application and plant
protection measures, the incidence of pests and diseases and consequent crop losses have become
quite common (Aravindakshan, 1990)
Series of submersible bunds and roads constructed by the State government as part of the
developmental programmes fragmented the wetland ecosystem into tiny units and disrupted the
natural hydrological balance. Effective draining of the toxicity developed by the fertiliser-pesticide
residue became impossible and the system deteriorated (Kannan, 1979). Physiographically, the major
6
Ajith J.K. et al., 2011. NERCI Technical Report No.7, 90pp. 2011
portion of the area that forms a basin remains water-logged for most of the year. Achencoil, Pamba,
Manimala and Meenachil rivers discharge their water and sediments into the basin lake. In Kuttanad,
the relatively elevated formations, which are essentially depressions skirted by dry lands, are found
mostly in Upper Kuttanad and amount to 11,000 ha.
Monitoring of Indian water resources done by CPCB (2007) indicates that organic pollution, as
indicated by BOD and Coliform counts, continue to be the major water quality issues in our country.
According to Scheffer et al. (2001), the quality of water required to maintain ecosystem health is
largely a function of natural background conditions. Some aquatic ecosystems are able to resist large
changes in water quality without any detectable effects on ecosystem composition and function,
whereas other ecosystems are sensitive to small changes in the physical and chemical make up of the
water body and this can lead to degradation of ecosystem services and loss of biological diversity.
They have demonstrated that in many shallow European lakes, the gradual enrichment of the surface
water with plant nutrients has resulted in shifts from systems that once were dominated by rooted
aquatic plants to systems that are now dominated by algae suspended in the water column.
Guidelines for the protection of aquatic life are difficult to set than the drinking water quality
standards, largely because aquatic ecosystems vary enormously in their composition both spatially
and temporally, and because ecosystem boundaries rarely coincide with territorial ones. Therefore,
there is a movement among the scientific and regulatory research community to identify natural
background conditions for chemicals that are not toxic to humans or animals and to use these as
guidelines for the protection of aquatic life (Robertson et al., 2006; Dodds and Oakes, 2004; Wickham
et al., 2005).
Organic matter is important in the cycling of nutrients, carbon and energy between producers and
consumers and back again in aquatic ecosystems. The decomposition of organic matter by bacteria
and fungi in aquatic ecosystems, inefficient grazing by zooplankton, and waste excretion by aquatic
animals, release stored energy, carbon, and nutrients, thereby making these newly available to
primary producers and bacteria for metabolism. External subsidies of organic matter that enter
aquatic ecosystems from a drainage basin through point sources such as effluent outfalls, or non-
point sources such as runoff from agricultural areas, can enhance microbial respiration and
invertebrate production of aquatic ecosystems (Carr and Neary,2006).
Climate change, the evolution of new waterborne pathogens, and the development and use of new
chemicals for industrial, agricultural, household, medical, and personal use have raised concern as
they have the potential to alter both the availability and the quality of water (IPCC, 1995; WHO, 7
Ajith J.K. et al., 2011. NERCI Technical Report No.7, 90pp. 2011
2003; Kolpin et al., 2002). All of these activities have costs in terms of water quality and the health
and integrity of aquatic ecosystems (Meybeck, 2004).
In the case of the Periyar River, alkalinity downstream of a rare earth metals processing plant
declined significantly in the early 1980s; this decline was accompanied by an increase in the overall
variability of pH. Water quality at that monitoring station also tended to have much higher hardness,
conductivity, chloride, sulphate and nitrate concentrations than a baseline, upstream monitoring
station (Carr and Neary, 2006).
E. coli indicates the presence of only faecal contaminants, while total or faecal coliform tests may
give positive results for non-faecal, naturally occurring bacterial species (Hill, 2003). Although many
cities have advanced wastewater treatment facilities that effectively reduce microbial contaminant
loads to near zero values, there remains a very large proportion of the world’s population, primarily
in developing countries, without access to improved sanitation facilities, where wastewaters are
discharged directly to the environment without treatment. In fact, an estimated 2.6 billion people
lacked access to improved sanitation facilities in 2002 (WHO/Unicef, 2005). A study of the physico-
chemical parameters of the minor water bodies around Kottayam by Abraham and Madanakumar
(2001) revealed that only 6.94% of them were fairly clear enough to be used for domestic purpose.
The rest were polluted in one form or the other.
Minor water bodies are characterised by relatively quiet waters and abundant vegetation. Large numbers of micro and macro organisms dwell in these water bodies. The richness of the fauna is dependent mainly on the presence of respiratory gases, the amount of sunlight penetration and turbidity.
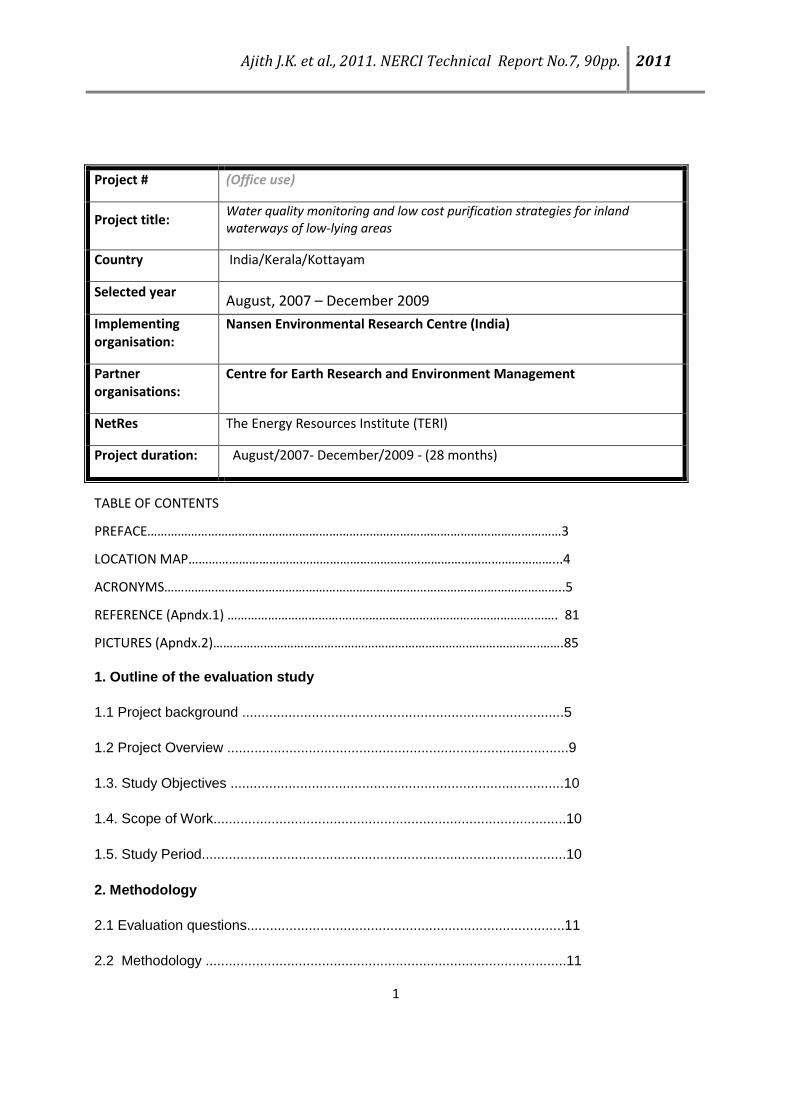
The proposed project was aimed at improving the water quality of the study region, (Fig.1),
canals of Meenachil river in the upper Kuttanad (connecting Karippel to Maniaparambu, which
lies between 9°37'23” and 9°38'42” N latitude and 76° 28'33” and 76° 30'6” E longitude),
Arpookara Panchayat, Kottayam District, connected to the river Meenachil in central Kerala,
southwest coast of India through implementation of low cost purification strategies. The
drainage areas of this river basin is about 1250 sq.km with a length of 78km, has a steep
gradient, is fast flowing and is normally fed by the Indian monsoon rains. This river finally
debouches into the Arabian Sea through one of the largest backwater systems in the west coast
of India, called Vembanad lake, after traversing through quite a number of small canals and
distributaries. The annual average discharge is about 1190 million m3. But the percentage of
annual discharge during the lean season is only 13%. This chain of canals support inland
8
Ajith J.K. et al., 2011. NERCI Technical Report No.7, 90pp. 2011
navigation and other activities of the rural people in this region whose major occupation is
agriculture and fishing. In the late 1970s, a barrage was constructed across the Vembanad lake
to obstruct salt water intrusion into the paddy fields so as to augment rice cultivation. There
started many associated environmental and water quality problems as well in the downstream
reach of this river canals (Aravindakshan, 1990; Bijoy, 2008, Gregory, 2003, Padmakumar, 2007).
The environmental condition of the region deteriorated further due to the development of new
roads across the distributor channels clogging the water bodies, increased severity of floods
during peak monsoon rainy seasons and water logging in the areas. But in dry seasons, the
water level of the entire canal lowered, resulting in no water movements and obstructing canal
navigations. This further accelerated the incidence of water borne diseases and its occurrence in
the region and is many fold in recent years. Bacteriological pollution and anaerobic conditions
are the major problems of its kind in the region caused by uncontrolled solid waste dumping and
open space human lavatories directly into the canals at certain under developed areas within
the region. Similarly, spreading of freshwater weeds like Salvinia which hinders inland navigation
and affecting water transport in the region is also another problem to be tackled. Lack of civic
sense, poor living standards and unawareness of ecosystem conservation practises are some of
the reasons for this decrease in water quality in the region. So an improved control and
maintenance of the water quality of this region which is envisaged in this project would be a
model for implementing similar controlling measures in other water environments of the coastal
regions of India thereby reducing pollution in water bodies.
1.2. Project Overview
The project is being carried out around the canals of Arpookara Panchayat, Kottayam District,
connected to the river Meenachil in central Kerala, southwest coast of India.
Bacteriological pollution and anaerobic conditions in the region due to uncontrolled solid waste
dumping affect the availability of reliable water and the life of hundreds of people who are
depending on the canal for their livelihood. The project is aimed at improving the water quality
through implementation of low cost purification strategies for the best practices that are to be
adopted in the study region.
9
Ajith J.K. et al., 2011. NERCI Technical Report No.7, 90pp. 2011
The project tenure was from August, 2007 to December 2009 and a Project Kick off meeting was
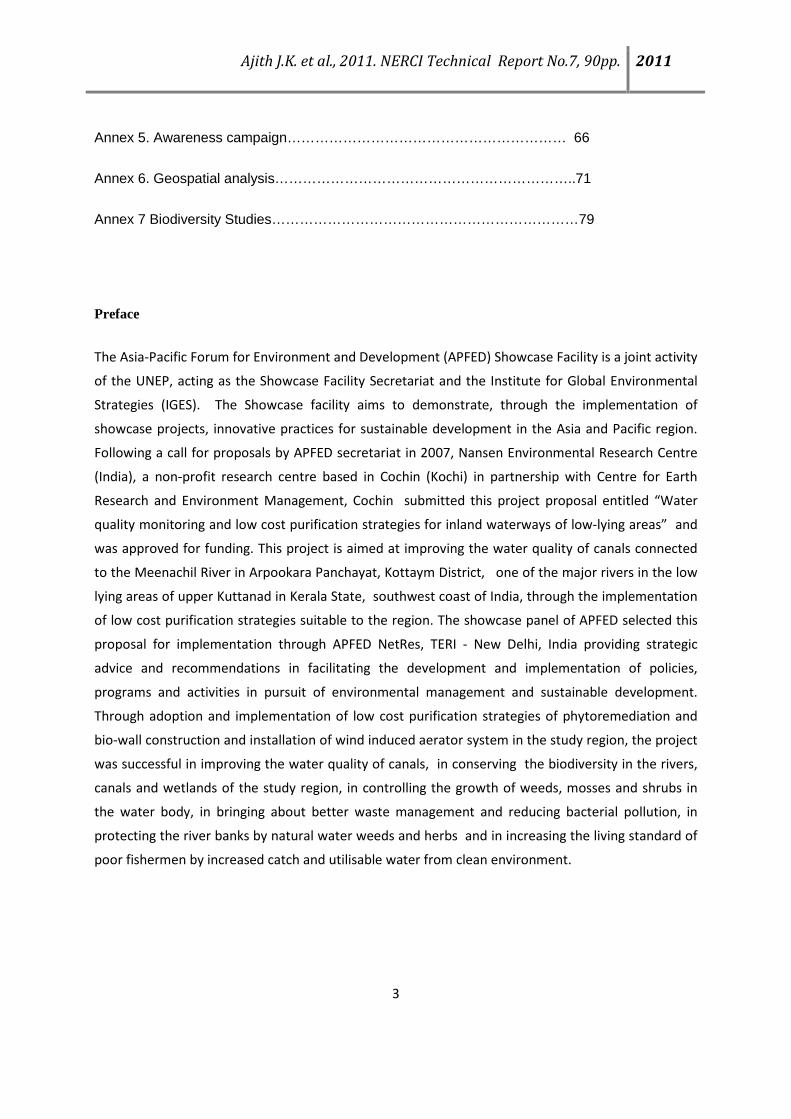
organised at Cochin in mid August, 2007. The first workshop and awareness campaign was organised
on the next day with the participation of stakeholders (Women Group, SHG, Grama Panchayat
authorities, Scientists, Grama Vikas Kendra and Policy makers, etc.) in October 2007.
A review on the water quality and the current activities in the project site and the surrounding areas
were made for the initial phase period (August and September 2007). Simultaneously baseline
studies on water quality of the study region was conducted from October 2007 – September 2008,
for the physico-chemical analysis covering three seasons viz., Post monsoon (Oct-Jan), Pre monsoon
(Feb-May) and monsoon (June- Sept)) by fixing sixteen different stations in the study region to decide
baseline indicators and to identify hotspots in the region.
For the conduct of awareness campaign and workshop, a database of contact points was prepared
covering representatives from academic/government bodies & policy makers and local communities,
after identifying stake-holders. From November 2007 – May 2008, proper identification and selection
of low cost water purification materials for the study region was done.
A second workshop was organized in the study region on various aspects of maintaining water
quality and different measures to manage solid waste like vermicompost preparation, utilisation of
Salvinia as substratum for mushroom cultivation and other usable products thereby reducing its
menace in the water body. The selection of pilot plot to implement the water purification methods
was done based on the initial baseline study on water quality and other environmental conditions
and from lab scale basis to pilot scale for future upscaling work.
Fabrication of bags for storing water purification materials was done during the period August 2008 -
January, 2009. Proper herbs and plants for planting along selected river banks to control bank
erosion was carried out during this period.
Proper measures to control aquatic pollution and water weeds were also suggested. Measures were
taken to clear water logging by desilting in selected identified regions in the canal to provide smooth
flow of water in lean season.
A wind induced aerator system at low cost was fabricated and tested in one of the project sites and
steps have been taken to permanently install this system at project site.
10
Ajith J.K. et al., 2011. NERCI Technical Report No.7, 90pp. 2011
1.3. Study Objectives
The overall objective of the project is:
To improve the water quality of the selected canals of the study region through monitoring and
adoption of low cost water purification strategies in general but not limited to the following sub
objectives like:
• Identification and selection of low cost water purification materials like coconut shells and
herbs from natural resources available in the region.
• To identify natural herbs that have the sediment holding capacity to control bank erosion
during flooding which would limit the transport of suspended sediments into the canals
which in turn would impair light transparency and clogging of fish gills.
• To make a feasibility study on the effectiveness of these natural materials to improve the
water quality and erosion control measures.
• To make a demonstration of the identified low cost practises for water quality and
navigational improvement
1.4. Scope of Work
The pollution control measures implemented through this project has helped in improving the
water quality of the canals of the Meenachil river in the study region in general and the
downstream reaches in particular where the rural communities depend on this water source for
their daily requirements. This type of eco-friendly approach has not been implemented
anywhere to the best of our knowledge as the resources like coconut shells, natural herbs and
riparian flora tested during the project period for water purification and canal bank erosion
control are readily available in the tropical environments. It is not only economically viable but
also suitable for adoption in similar conditions.
1.5. Study Period
August,2007- December,2009
2. METHODOLOGY 11
Ajith J.K. et al., 2011. NERCI Technical Report No.7, 90pp. 2011
2.1. Evaluation Questions
An agreement between the participating institutes including their obligations with respect to the
project were laid down before the start of the project. Accordingly, the components of study were
addressed in the form of questions. Periodical in house monitoring assessed how far each question
has been answered. This in fact helped in the smooth conduct of the project and attending to all the
major issues.
1) How many representative stations have to be fixed to have a proper coverage of the study area?
2) What is the present status of the water quality of the study area?
3) What are the criteria to be analysed to develop a database regarding the water quality of the area?
4) What are the low cost water purification methods that can be adopted in the present case?
5) Is there any improvement in the water quality after implementation of the water purification method?
6) Is there any improvement in the biodiversity status of the area after implementation of the purification measures?
7) What are the herbs that are locally available that can be used to control bank erosion?
8) How can the local people be educated about the need to conserve the water quality and make them aware of the need for clean, flowing water?
2.2. Methodology
Baseline studies were conducted on water quality of the study region, Meenachil river canals
and adjoining water bodies to prepare a review on the present water quality and current practises.-
low cost water purification materials were identified by selecting coconut shells and herbs from
natural resources available from the region to control deterioration in water quality. A pilot plot to
implement the water purification methods and to control river bank erosion was identified.
Awareness campaigns and workshops were organised for local people by educating them on
how to maintain environment, sustainable utilization of local resources, improved water quality etc.
Measures were initiated to clear water logging by desilting in selected regions of the canal thereby
reducing mosquito breeding ground and improving navigation in the canals. Routine water sampling
was conducted for physico-chemical analysis. For that water samples were collected from the 16
locations from the river canal in pre monsoon, monsoon and post monsoon seasons. The parameters
estimated were COD, BOD, DO, pH, salinity, hardness, suspended sediments, Na, K, nutrients –
12
Ajith J.K. et al., 2011. NERCI Technical Report No.7, 90pp. 2011
nitrite, nitrate and phosphate, chl. a, b, c; and total coliforms. All these physical, chemical and
biological parameters were analysed using standard techniques and the results are discussed (Annex.
1). The drainage and base map of the area was digitized and geo-referenced using ArcGIS 9.1. The
locations and the data were then input into the drainage map. Using 3D analysis tool, a grid map was
prepared which gave the spatial distribution of the chemical and biochemical data. From the grid, the
polygons were evolved specifying the range of international water quality standards. The suitability
zone maps for life existence during all the 3 seasons were prepared (Annex.1.1) for the following
parameters such as DO, BOD, COD, Total Coliform, and pH. Fish stock and other faunal composition
were assessed after the project implementation to study the effectiveness of the project.
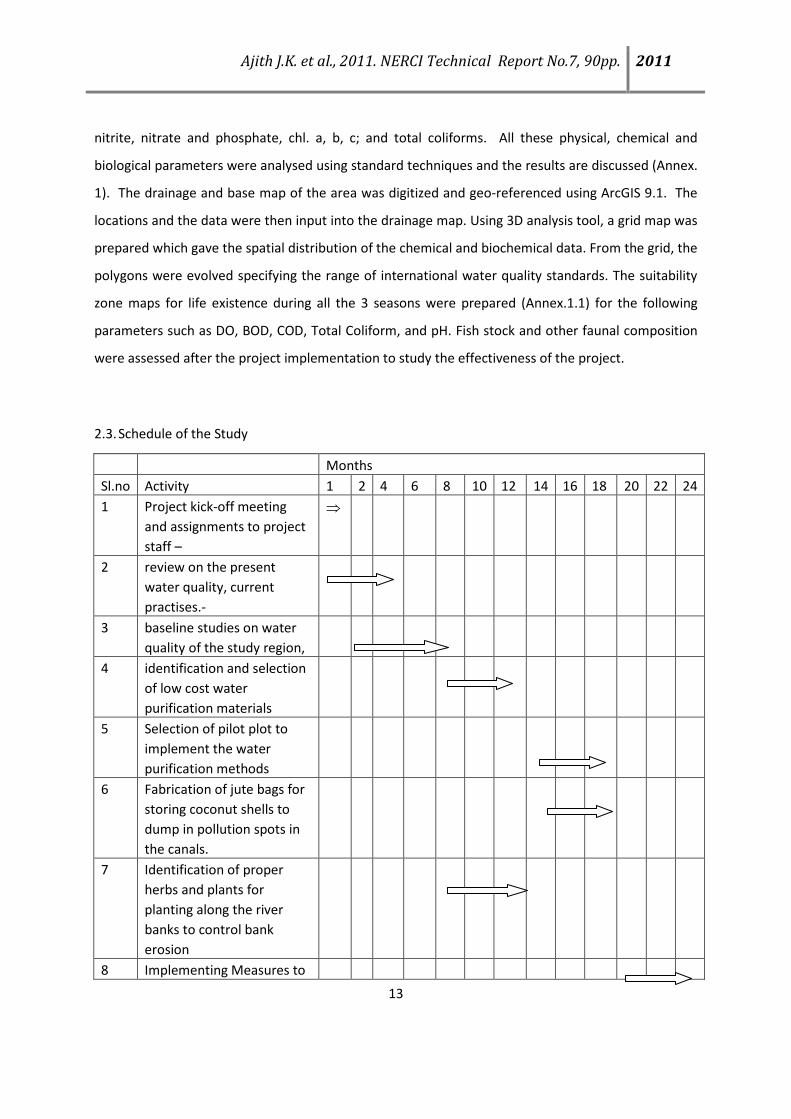
2.3. Schedule of the Study
Months Sl.no Activity 1 2 4 6 8 10 12 14 16 18 20 22 24 1 Project kick-off meeting
and assignments to project staff –
⇒
2 review on the present water quality, current practises.-
3 baseline studies on water quality of the study region,
4 identification and selection of low cost water purification materials
5 Selection of pilot plot to implement the water purification methods
6 Fabrication of jute bags for storing coconut shells to dump in pollution spots in the canals.
7 Identification of proper herbs and plants for planting along the river banks to control bank erosion
8 Implementing Measures to
13
Ajith J.K. et al., 2011. NERCI Technical Report No.7, 90pp. 2011
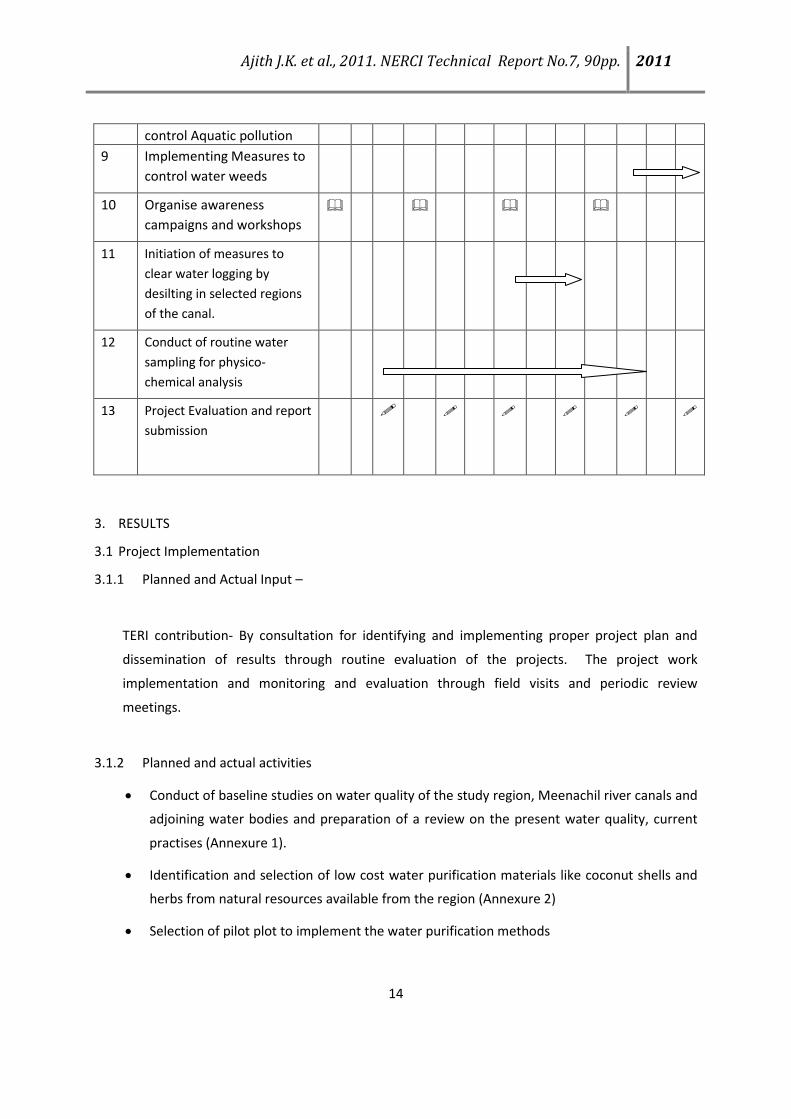
control Aquatic pollution 9 Implementing Measures to
control water weeds
10 Organise awareness campaigns and workshops
11 Initiation of measures to clear water logging by desilting in selected regions of the canal.
12 Conduct of routine water sampling for physico-chemical analysis
13 Project Evaluation and report submission
3. RESULTS
3.1 Project Implementation
3.1.1 Planned and Actual Input –
TERI contribution- By consultation for identifying and implementing proper project plan and
dissemination of results through routine evaluation of the projects. The project work
implementation and monitoring and evaluation through field visits and periodic review
meetings.
3.1.2 Planned and actual activities
• Conduct of baseline studies on water quality of the study region, Meenachil river canals and
adjoining water bodies and preparation of a review on the present water quality, current
practises (Annexure 1).
• Identification and selection of low cost water purification materials like coconut shells and
herbs from natural resources available from the region (Annexure 2)
• Selection of pilot plot to implement the water purification methods
14
Ajith J.K. et al., 2011. NERCI Technical Report No.7, 90pp. 2011
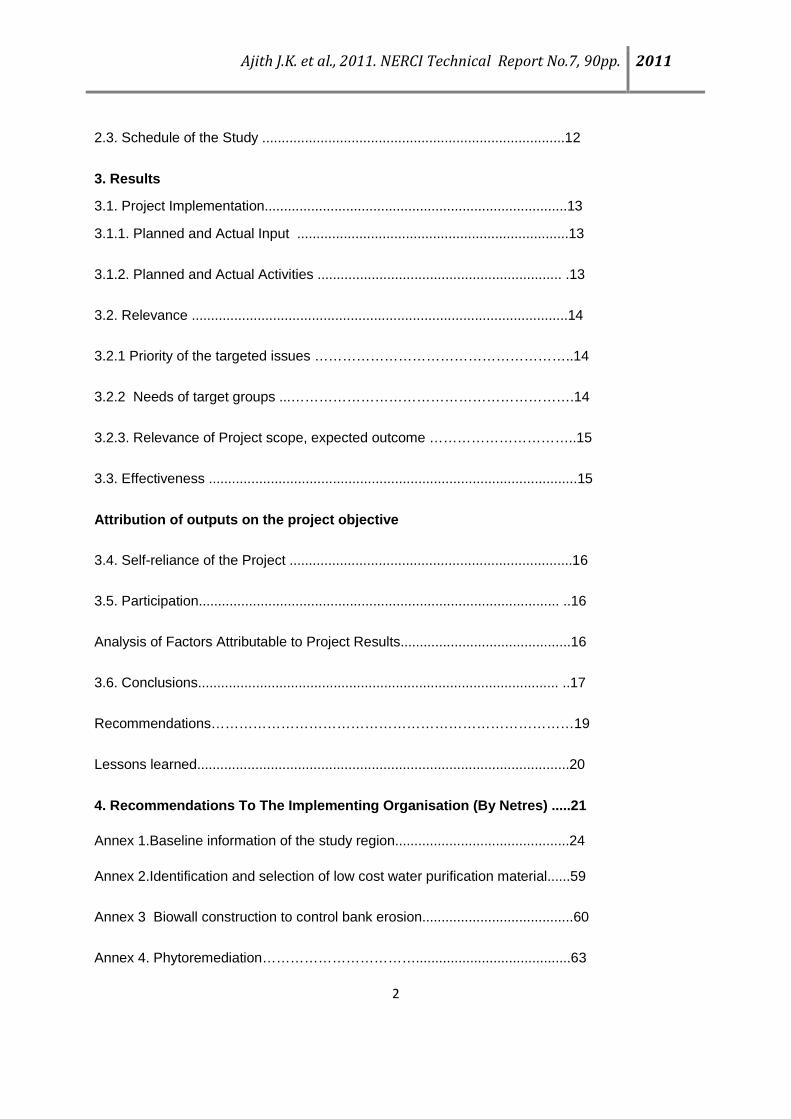
• Fabrication of jute bags for storing coconut charcoals to dump in pollution spots in the
canals. A controlled mechanism for storing coconut charcoals from shells to treat the
pollutants in the water medium
• Identification of proper herbs and plants- “Neerkoova” for planting along the river banks to
control bank erosion (Annexure 3).
• Measures to control pollution,- improved use of biofertilizers, riparian vegetation and
phytoremediation (Annexure 4)
• Measures to control water weeds like Salvinia which are hindrance to inland navigation
• Organise awareness campaigns and workshops through implementation of display boards,
policy guidelines (Annexure 5)
• Initiation of measures to clear water logging by desilting in selected regions of the canal.
• Conduct of routine water sampling for physico-chemical analysis (Annexure 6) and
• Assessment of fish stock and other freshwater organisms after the project implementation
to study the effectiveness of the project (Annexure 7)
3.2 Relevance
3.2.1 Priority of the Targeted Issues
The priority of the targeted issues in connection with the water quality of the study region are water
logging, decreasing water quality and bank erosion. Stagnation of water was given top priority as it
led to reduced DO, increased BOD and COD, increase in bacterial pollution etc. Dumping of solid
wastes plus the proliferation of Salvinia were also issues related to stagnation.
3.2.2 Needs of Target Group / Target Area
The local community in the vicinity of the study area depends on the water in the canal for most of
their daily activities like water transportation, irrigation, washing, bathing etc. Due to pollution
problems and water stagnation, the water quality deteriorated and was unfit for use. The need of
the local population was to decrease the pollution and stagnation so that the water could be made
usable and the fish catch of the region be retained to the earlier level. People also wanted the canals
to be made navigable.
15
Ajith J.K. et al., 2011. NERCI Technical Report No.7, 90pp. 2011
3.2.3 Relevance of Project Scope, Expected Outcome and Approach
The key activities implemented in this project could improve the present water quality of the
canals of the Meenachil river in the study region and also in the downstream reaches which
would be more sustainable to use for the rural communities in the region. The proposed project
approach has not been implemented anywhere to best of our knowledge as the resources like
coconut shells, natural herbs and products mentioned in the proposal for water purification are
available in the Asia-Pacific region (Srilanka, Thailand, Malaysia, Indonesia to name few
countries) untapped which is ecofriendly and hence this techno-feasibility study can be
transferred to these regions of interest.
3.3 Effectiveness
Achievement of the Project Objective
A physical model (wind induced aerator system) for water purification was implemented which
would be transferred to other sites which are remote and have no access to electricity supply
but can utilise wind energy. The water quality improvement through adoption of
phytoremediation techniques using Vetiver system from post and pre analyses of the samples
have showcased the effectiveness of this project.
The river bank erosion at selected sites of the canal banks could be controlled by riparian
vegetation and bio-wall construction and reduce the availability of suspended sediment load in
the waterbody.
Education of local people on how to maintain environment, sustainable utilization of local
resources, improved water quality etc.
Improvement in biodiversity of the region.
Attribution of Outputs on the Project Objective
Information on the gravity of the water quality problem and identification of hotspots in the study
region which require more attention in terms of planning and implementation.
Ecofriendly natural resources to avoid deterioration in water quality. 16
Ajith J.K. et al., 2011. NERCI Technical Report No.7, 90pp. 2011
Alternate use of waterweeds and its menace will be controlled, reducing water logging and mosquito
control, improved navigation in canals.
3.4 Self-reliance of the Project
Through adoption and implementation of low cost purification strategies like phytoremediation,
riparian vegetation planting, bio-wall construction, self help groups and Family units which are
very active in this rural area in connection with various rural development and self employment
programmes can promote these techniques in the region as a whole. NGOs can also be involved
in educating people living in the region on different aspects of human behaviour and the need
for adopting better practises envisaged in the project.
The women’s group can reach out into the rural communities to create awareness among the
housewifes and maids on how to manage solidwastes without impairing the water
environments. They can collect the natural products like coconut shells and other forms of herbs
from the region and make available the material for the project pilot plan.
3.5 Participation
The major stakeholders participating in this project are Self Help Groups (SHG), NGOs, family
units in the rural areas, Women’s group and fishermen and local communities, volunteers and
student groups.
SHGs and family units have been active in these rural areas in connection with various rural
development and self employment programmes under the national development council of
Govt. of India in association with State departments. So the best practices identified and
developed through this project can be easily implemented in this region with their active
participation. NGOs can also be involved in educating people living in the region on different
aspects of human behaviour and the need for adopting better practises envisaged in the project.
Fishermen and local communities are the direct beneficiaries and stakeholders of this project as
they can provide the positive and negative impact of this project implementation.
The student groups and volunteers can conduct awareness campaigns on water quality
improvements and distribute small pamphlets on the do’s and don’ts for the public at large in
this region in order to have a sustainable development of the region.
Analysis of Factors Attributable to Project Results
17
Ajith J.K. et al., 2011. NERCI Technical Report No.7, 90pp. 2011
1. Post analysis of water quality of canals after the project implementation
2. Check for the increased biodiversity in the rivers, canals and wetlands of the study region.
3. Identification of Controlled growth of weeds, mosses and shrubs in the water body and its
area coverage.
4. Self assessment of the waste management in the study region and analysis of reduction in
bacterial pollution
5. A field investigation of river banks for natural water weeds and herbs to see the reduction in
suspended material increasing primary productivity through improved photosynthesis at
selected plots in the study region.
3.6 CONCLUSIONS
The loss of drainage facilities and water logging had led to the increased run off, soil erosion, and
frequent floods and droughts in the study area. This also increased concentration of pollutants in the
water, like the pesticide and nutrient residues, proliferation of aquatic weeds, siltation etc. which in
turn had resulted in the loss of biodiversity and frequent occurrence of water borne diseases in the
area before the project implementation.
Water quality analyses of the area have been extremely informative. The water quality results have
shown that
1. 7 out of 16 stations of the study area have high COD values. This high COD can be attributed
to the untreated heavy organic load entering in to the waters from the nearby regions.
2. Hardness was found to be a problem only during post monsoon season. During monsoon,
the entire study area became filled with soft water.
3. BOD analysis shows that the study area is moderately polluted even during monsoon season,
with the peak values obtained during post-monsoon season.
4. The pH for all stations during the post monsoon, premonsoon and monsoon seasons was
found to be around 6.00, which indicates that the water was slightly acidic. The location of
the stations and its vicinity to the anthropogenic activity like rubber treatment, farming etc
play an important role in this. 18
Ajith J.K. et al., 2011. NERCI Technical Report No.7, 90pp. 2011
5. DO levels reach a minimum during post monsoon season. The low DO may be the
consequence of the obstruction in water flow due to closure of bund in that season. During
monsoon and pre-monsoon, the oxygen levels rise above 2 mg/l, which is the minimum
amount of oxygen required for sustenance of life. However, the DO levels seldom go above
4 mg/l, the recommended DO value for inland surface waters by CPCB, in non-monsoon
months.
6. Suspended solids were within the permissible limits for inland streams.
7. Total coliform was found to be within the acceptable standards during the post monsoon and
premonsoon seasons. But during the monsoon season, stations 3, 12 and 16 showed an
increase in the total coliform compared to the advisable safe limits. Station 3 and 12 are sites
of pronounced human activities like bathing, washing, cleaning etc. Further, many houses
have their drainage outlets opening into the stream at these stations. Station 16 is
considered as the waste dumping area of the local residents.
8. Salinity of the study area always remained fresh water itself.
9. During all the seasons, the sodium level of water was low compared to the desirable range of
100 mg/l. During pre-monsoon season, the Na+ level of water in stations 11 and 13 was high
compared to the maximum tolerance limit of 60% for irrigation purposes. A high
concentration of Na+ in irrigation water also reduces the soil permeability, thus affecting the
growth and yield of crops.
10. The major nutrients, nitrate, phosphate and nitrite was high during monsoon as the showers
bring nutrients from allochthonous sources elevating the nutrient concentrations in the
water. Among the various nutrient components, nitrate concentration was the highest.
Through adoption and implementation of low cost purification strategies and conduct of series of
awareness programmes and other sub objectives of the proposed project, we were able to achieve:
1. Improved water quality of canals, surface and groundwater
2. Preservation of biodiversity in the rivers, canals and wetlands of the study region.
4. Controlled growth of weeds, mosses and shrubs in the water body 19
Ajith J.K. et al., 2011. NERCI Technical Report No.7, 90pp. 2011
5. A better waste management and reduction in bacterial pollution
6. Protection of selected river banks by natural water weeds and herbs as a model for
implementing to other locations in the study region.
7. Increase the living standard of poor fishermen by increased catch and utilisable water for
clean environment.
RECOMMENDATIONS
Due to the almost flat nature of the river basin it is very much difficult to manage the river. The
following steps has to be taken to rejuvenate the river
1. Restrict the waste disposal including plastic waste. Waste management at the localized
level has to be continued with bio-fertilizer generation.
2. Restrict the use of chemical fertilizers and raise awareness among the people on the
importance of bio fertilizer to retain the healthy soil.
3. Make water harvesting pits on the side of the river especially near to unsuitable areas of
life existence
4. The pumping of river water to the pits through local self government’s support is to be
encouraged and this helps not only to remove the waste water but also inject pure water
to underground water and river canals to augment flow conditions.
5. Steps have to be taken for the construction of a new bypass canal from the distribution
point of the Meenachil river to the study region at Station no. 1 by installing “Petti-Para”
water suction and distribution system during lean season to augment water flow in the
canals. This can be supported with periodic maintenance dredging or desilting of the
canal mouth leading to the main river upstream of Stn.1.
20
Ajith J.K. et al., 2011. NERCI Technical Report No.7, 90pp. 2011
6. Awareness programs has to be continued to bring people’s attention about the ill effects
of polluting river.
7. Restricting the reclamation and built up area generation only on the eroded banks of the
canals.
8. Planting of economically viable trees on lateritic terrain to promote lateritization and
clay generation and it reduces the ill effects of pollutants mainly on the sides of
unsuitable zone
9. Slope stabilization measures to be taken especially by contour bunding wherever there
are sloping terrains on the side of the river.
10. Planting of riparian vegetation and promotion of bio-wall construction using available
local resources.
LESSONS LEARNED
Phytoremediation using Vetiver system- One of the main advantages of Phytoremediation is
that of its relatively low cost compared to other remedial methods. Phytoremediation also offers a
permanent in situ remediation rather than simply translocation of the problem. The best example of
phytoremediation is using Vetiver system. The Vetiver System (VS) is a new phyto -technology based
on the use of Vetiver grass for a wide range of applications. VS were, first developed by the World
Bank for soil and water conservation and now being used in over 100 countries. Vetiver grass belongs
to the family ‘Poaceae’ and the genus Vetiver contains more that 16 species, among that Vetiver
zizanoides L. is best suited for phytoremediation. This grass grows up to 2m above the ground with
erect and stiff leaves. It has very extensive root system which grows more than 2m. Root system of
Vetiver is used for bio remediation or cleaning up of contaminated soils and cleaning up of water,
with high capacity of removing N and P in polluted water. Vetiver also cleans up blue green algae
within 4days. This grass shows unique physiological characteristics by having wide range of tolerance 21
Ajith J.K. et al., 2011. NERCI Technical Report No.7, 90pp. 2011
to drought and flood, acidity-alkalinity and salinity, heavy metals and various ecological types and
conditions. Its pH tolerance varies from 2.5 to 11. Vetiver grows incredibly fast, so it can be used to
absorb pollutants in the soil & water. Vetiver ability to sequester deadly chemicals from our
environment and transform them safely into plants makes it truly remarkable.
Biowall construction to control bank erosion
It is learned that natural plants like “Neerkoova” which belongs to the family of Aroidae (Araceae)
angiosperm family , rhizone so highly poisonous having potential anti-venom properties, tolerant to
high acidic soils., have the sediment holding capacity to control bank erosion during flooding which
can limit the transport of suspended sediments into the canals that impair light transparency and
clogging of fish gills. So planting of these natural shrubs which was a traditional methods in this
region is a viable alternative and appropriate practice of protecting bank erosion which is eco friendly
in nature as it promote the sustainable utilization of local resources.
Aerators that work on wind power:
Such aerators are environment-friendly and efficient in enhancing oxygen content, there by
maintaining a healthy environment for aquatic organisms.
4 RECOMMENDATIONS TO THE IMPLEMENTING ORGANISATION (by NetRes)
Observations of NetRes Institute (TERI)
The overall objective of the project was:
To improve the water quality of the selected canals of the study region through
monitoring and adoption of low cost water purification strategies in general but not
limited to the following sub objectives like:
Identification and selection of low cost water purification materials like coconut shells and herbs from natural resources available in the region.
22

Ajith J.K. et al., 2011. NERCI Technical Report No.7, 90pp. 2011
To identify natural herbs that have the sediment holding capacity to control bank erosion during flooding which would limit the transport of suspended sediments into the canals which in turn would impair light transparency and clogging of fish gills.
To make a feasibility study on the effectiveness of these natural materials to improve the water quality and erosion control measures.
To make a demonstration of the identified low cost practices for water quality and navigational improvement
Initially during the project, to set up baseline environmental conditions, seasonal
water quality monitoring of the river system in the study area was planned and
implemented. The results of this monitoring establish the extent of pollution and also
the need to control/remediate the pollution in identified stretches of the water body.
From the evaluation of report findings of observations obtained from the GIS spatial
analysis and field investigations it was clear that 10.01% of the total area of the
selected river portion is falling in the unsuitable zone and rest is in moderately suitable
zone.
From the field observation it was established that waste disposal is/was the main
cause of pollution. The plastic waste disposal and almost flat nature of the terrain will
decelerate the self purifying capacity of the river.
A buffer zone of 500 m is generated around the unsuitable zone and overlaid on the
landuse map. From the overlay analysis it was is shown that the buffer zone falls
mainly on the settlement with mixed crop, rubber and mixed crop. This shows that
the source of pollutants is mainly concentrated in this region. The absence of
unsuitable zone near to paddy region indicates the power of clay in paddy fields to
reduce the adverse effect of pollutants. So it is very much understood that the
clayey and clayey lateritic terrains are important to purify the river and point towards
the importance of rejuvenation of clayey and lateritic terrains. This can only be
achieved by planting trees especially on the tropical lateritic terrains.
23
Ajith J.K. et al., 2011. NERCI Technical Report No.7, 90pp. 2011
Use of low cost, submerged coconut charcoal system for removing pollutants have
been demonstrated effectively in selected location of river water system. This
provides clean solution for long-term maintenance of the water quality.
Another notable feature of the project was development of wind induced aerator
system for use in the water body in the areas where power supply either is not there
or is erratic. These aerators would soon be implemented at other sites which are
remote and have no access to electricity supply but can utilise wind energy. The
water quality improvement through adoption of phytoremediation techniques using
Vetiver system from post and pre analyses of the samples has also showcased the
effectiveness of this project.
For controlling the erosion of river bank, use of riparian vegetation and bio-wall
construction has been successfully demonstrated in the project. This also reduced
silting of the water body.
Education of local people on how to maintain environment, sustainable utilization of
local resources, improved water quality etc. Improvement in biodiversity of the
region was also observed.
NetRes Institute’s (TERI’s) Recommendations
The project “Water Quality Monitoring and Low Cost Purification Strategies for Inland
Waterways of Low Lying Areas” during its implementation has been able to meet
and achieve all its objectives set out at the proposal stage. The project also led to
development of wind based aerator system which certainly would be useful for use
in areas where power supply is either not there or is erratic.
TERI recommends successful closure of the project.
ANNEX
Annex 1: Baseline information on water quality of the study region
24
Ajith J.K. et al., 2011. NERCI Technical Report No.7, 90pp. 2011
Annex 2: Identification and selection of low cost water purification materials
Annex3: Bio-wall construction to control bank erosion
Annex 4: Phytoremediation techniques
Annex 5: Awareness campaigns
Annex 6: Geospatial analysis of water quality of the study region
Annex 7: Biodiversity improvement
Appendix 4:Summary
Appendix 5:Bibliography
Annexure 1- Baseline information on water quality of the study region
3.1.2.1 Physico – chemical characteristics of the water body
Water quality analyses helped to identify the hot spots within the study region that requires
attention in the context of water quality improvement. The region closer to downstream
stretches of the canal is environmentally critical in terms of BOD, COD and hardness. The
presence of salt water during January in almost all the stations have been noticed but it is
within the prescribed limits of WHO standards for irrigation and life support for freshwater
organisms (WHO, 2004). But all the stations are deprived of sufficient amount of dissolved
oxygen.
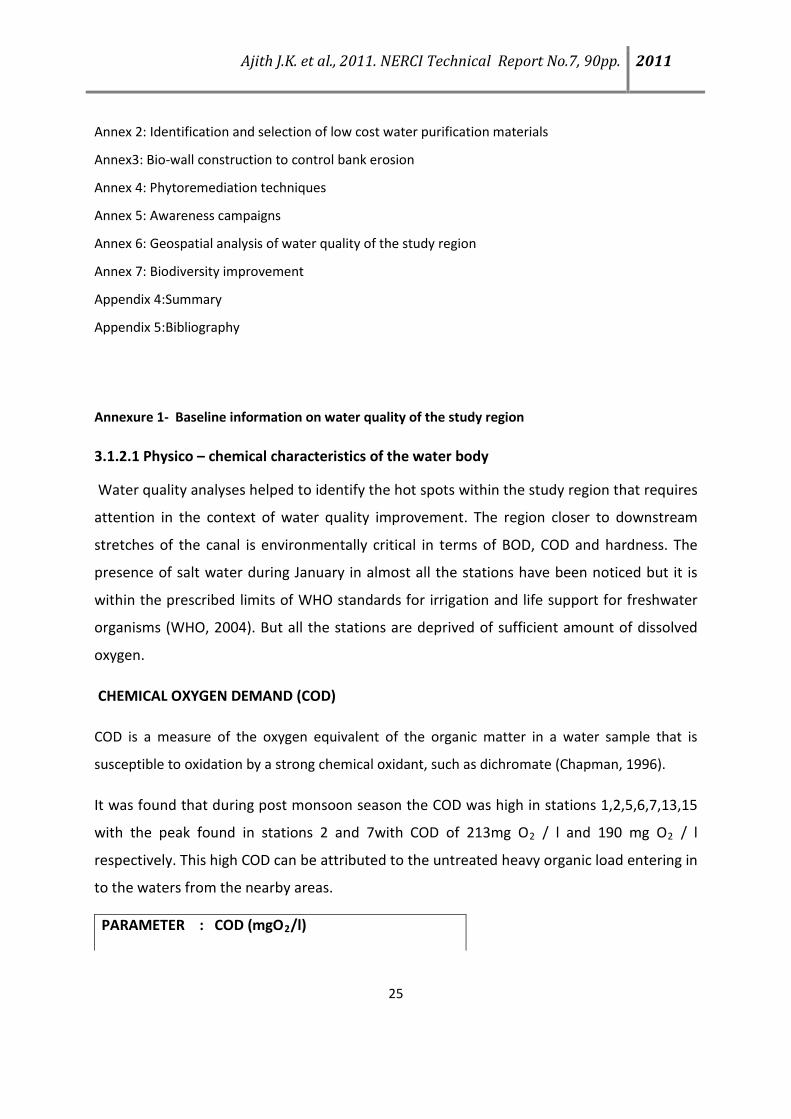
CHEMICAL OXYGEN DEMAND (COD)
COD is a measure of the oxygen equivalent of the organic matter in a water sample that is
susceptible to oxidation by a strong chemical oxidant, such as dichromate (Chapman, 1996).
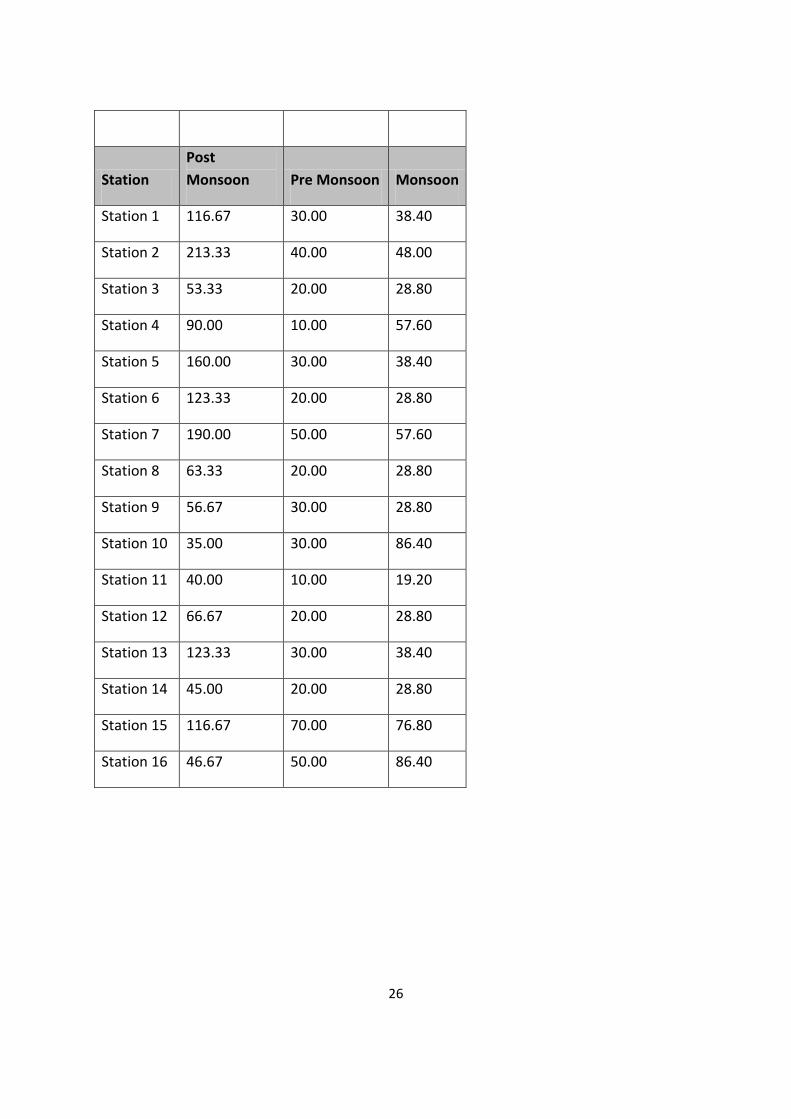
It was found that during post monsoon season the COD was high in stations 1,2,5,6,7,13,15
with the peak found in stations 2 and 7with COD of 213mg O2 / l and 190 mg O2 / l
respectively. This high COD can be attributed to the untreated heavy organic load entering in
to the waters from the nearby areas.
PARAMETER : COD (mgO2/l)
25
Station Post Monsoon Pre Monsoon Monsoon
Station 1 116.67 30.00 38.40
Station 2 213.33 40.00 48.00
Station 3 53.33 20.00 28.80
Station 4 90.00 10.00 57.60
Station 5 160.00 30.00 38.40
Station 6 123.33 20.00 28.80
Station 7 190.00 50.00 57.60
Station 8 63.33 20.00 28.80
Station 9 56.67 30.00 28.80
Station 10 35.00 30.00 86.40
Station 11 40.00 10.00 19.20
Station 12 66.67 20.00 28.80
Station 13 123.33 30.00 38.40
Station 14 45.00 20.00 28.80
Station 15 116.67 70.00 76.80
Station 16 46.67 50.00 86.40
26
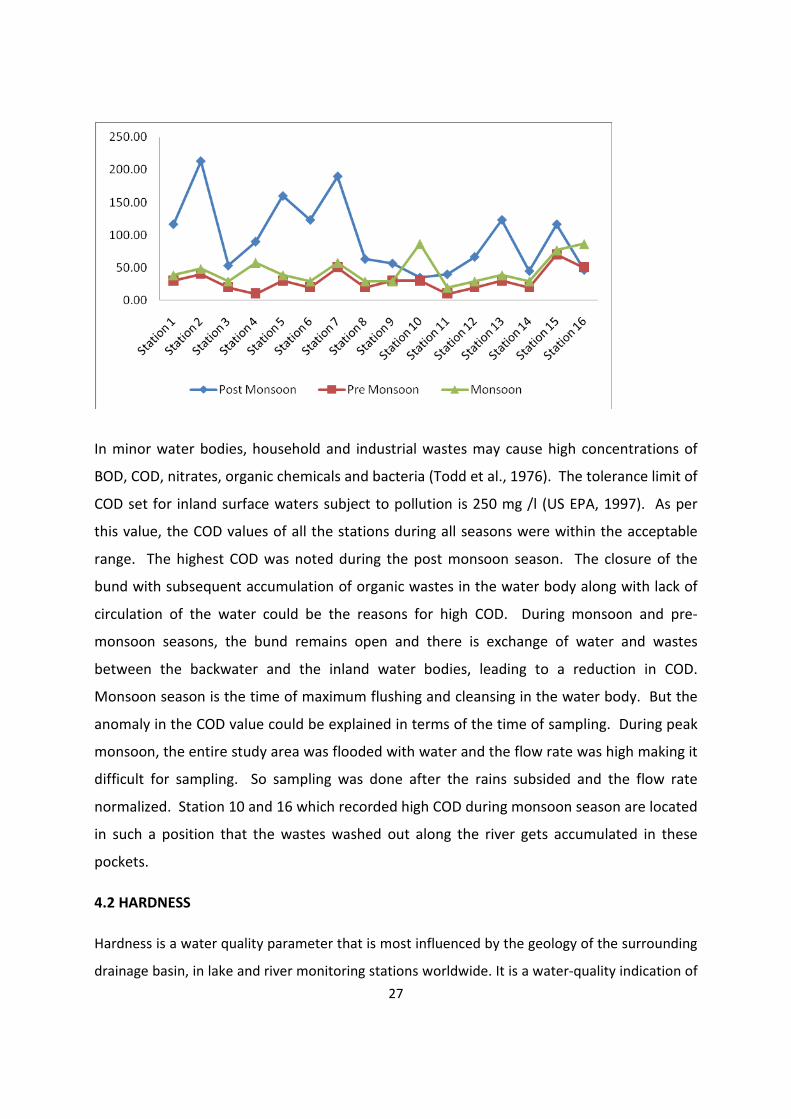
In minor water bodies, household and industrial wastes may cause high concentrations of
BOD, COD, nitrates, organic chemicals and bacteria (Todd et al., 1976). The tolerance limit of
COD set for inland surface waters subject to pollution is 250 mg /l (US EPA, 1997). As per
this value, the COD values of all the stations during all seasons were within the acceptable
range. The highest COD was noted during the post monsoon season. The closure of the
bund with subsequent accumulation of organic wastes in the water body along with lack of
circulation of the water could be the reasons for high COD. During monsoon and pre-
monsoon seasons, the bund remains open and there is exchange of water and wastes
between the backwater and the inland water bodies, leading to a reduction in COD.
Monsoon season is the time of maximum flushing and cleansing in the water body. But the
anomaly in the COD value could be explained in terms of the time of sampling. During peak
monsoon, the entire study area was flooded with water and the flow rate was high making it
difficult for sampling. So sampling was done after the rains subsided and the flow rate
normalized. Station 10 and 16 which recorded high COD during monsoon season are located
in such a position that the wastes washed out along the river gets accumulated in these
pockets.
4.2 HARDNESS
Hardness is a water quality parameter that is most influenced by the geology of the surrounding
drainage basin, in lake and river monitoring stations worldwide. It is a water-quality indication of 27
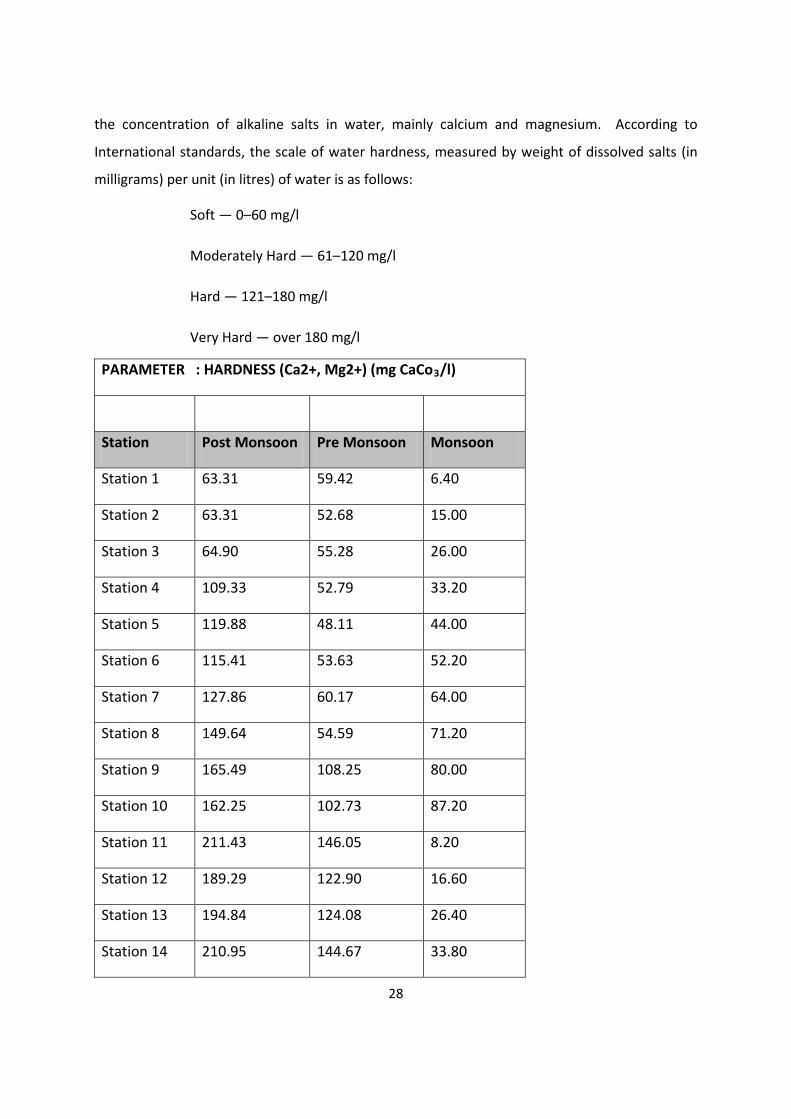
the concentration of alkaline salts in water, mainly calcium and magnesium. According to
International standards, the scale of water hardness, measured by weight of dissolved salts (in
milligrams) per unit (in litres) of water is as follows:
Soft — 0–60 mg/l
Moderately Hard — 61–120 mg/l
Hard — 121–180 mg/l
Very Hard — over 180 mg/l
PARAMETER : HARDNESS (Ca2+, Mg2+) (mg CaCo3/l)
Station Post Monsoon Pre Monsoon Monsoon
Station 1 63.31 59.42 6.40
Station 2 63.31 52.68 15.00
Station 3 64.90 55.28 26.00
Station 4 109.33 52.79 33.20
Station 5 119.88 48.11 44.00
Station 6 115.41 53.63 52.20
Station 7 127.86 60.17 64.00
Station 8 149.64 54.59 71.20
Station 9 165.49 108.25 80.00
Station 10 162.25 102.73 87.20
Station 11 211.43 146.05 8.20
Station 12 189.29 122.90 16.60
Station 13 194.84 124.08 26.40
Station 14 210.95 144.67 33.80
28
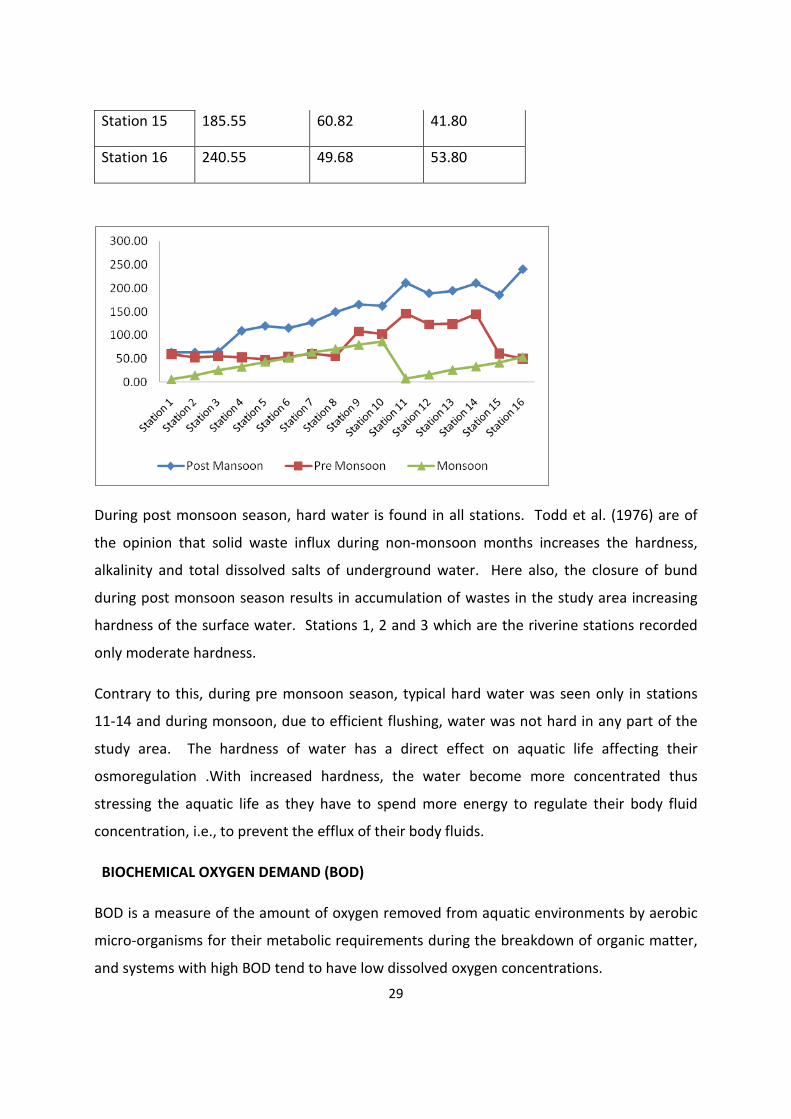
Station 15 185.55 60.82 41.80
Station 16 240.55 49.68 53.80
During post monsoon season, hard water is found in all stations. Todd et al. (1976) are of
the opinion that solid waste influx during non-monsoon months increases the hardness,
alkalinity and total dissolved salts of underground water. Here also, the closure of bund
during post monsoon season results in accumulation of wastes in the study area increasing
hardness of the surface water. Stations 1, 2 and 3 which are the riverine stations recorded
only moderate hardness.
Contrary to this, during pre monsoon season, typical hard water was seen only in stations
11-14 and during monsoon, due to efficient flushing, water was not hard in any part of the
study area. The hardness of water has a direct effect on aquatic life affecting their
osmoregulation .With increased hardness, the water become more concentrated thus
stressing the aquatic life as they have to spend more energy to regulate their body fluid
concentration, i.e., to prevent the efflux of their body fluids.
BIOCHEMICAL OXYGEN DEMAND (BOD)
BOD is a measure of the amount of oxygen removed from aquatic environments by aerobic
micro-organisms for their metabolic requirements during the breakdown of organic matter,
and systems with high BOD tend to have low dissolved oxygen concentrations. 29
Microbial consumption of oxygen, measured as BOD, tends to increase with water temperature.
Higher water temperatures affect plant life by increasing growth rates, resulting in a shorter
lifespan and species overabundance (i.e., algal blooms). Increases in algae and macrophyte
abundance further reduce oxygen saturation in the water column. The loss of oxygen-sensitive
but highly valued trophy species like trout and the aesthetic degradation caused by ‘weedy’
receiving waters can impact the use of the system as a recreational resource (Taylor and Helwig,
1995).
PARAMETER : BOD (mg O2 / l)
Station Post Monsoon Pre Monsoon Monsoon
Station 1 49.53 2.53 3.80
Station 2 57.50 2.74 7.49
Station 3 29.09 2.53 9.30
Station 4 14.64 5.61 8.70
Station 5 38.97 6.17 12.91
Station 6 44.58 1.93 11.65
Station 7 26.97 3.51 7.68
Station 8 24.24 2.29 14.71
Station 9 30.64 14.31 14.85
Station 10 5.61 17.04
Station 11 19.97 3.83 10.47
Station 12 32.30 2.46 10.89
Station 13 74.40 38.68 8.79
Station 14 31.21 2.20 13.07
Station 15 27.73 6.12 8.35
30
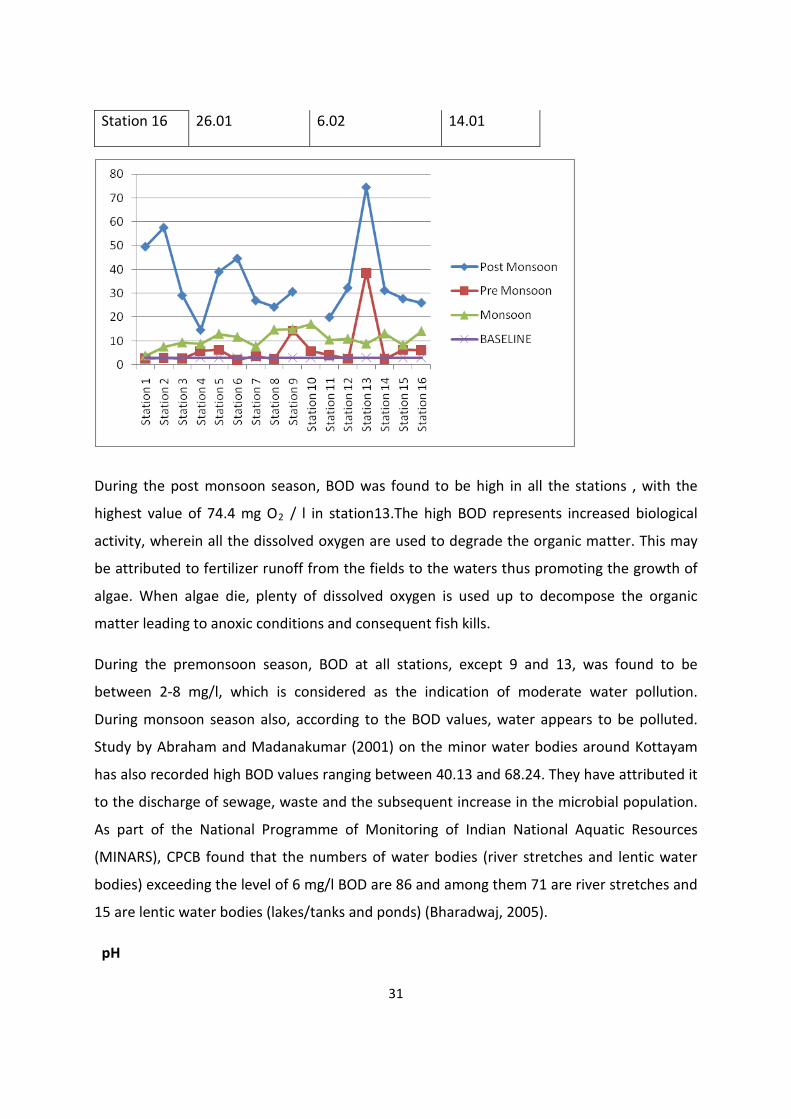
Station 16 26.01 6.02 14.01
During the post monsoon season, BOD was found to be high in all the stations , with the
highest value of 74.4 mg O2 / l in station13.The high BOD represents increased biological
activity, wherein all the dissolved oxygen are used to degrade the organic matter. This may
be attributed to fertilizer runoff from the fields to the waters thus promoting the growth of
algae. When algae die, plenty of dissolved oxygen is used up to decompose the organic
matter leading to anoxic conditions and consequent fish kills.
During the premonsoon season, BOD at all stations, except 9 and 13, was found to be
between 2-8 mg/l, which is considered as the indication of moderate water pollution.
During monsoon season also, according to the BOD values, water appears to be polluted.
Study by Abraham and Madanakumar (2001) on the minor water bodies around Kottayam
has also recorded high BOD values ranging between 40.13 and 68.24. They have attributed it
to the discharge of sewage, waste and the subsequent increase in the microbial population.
As part of the National Programme of Monitoring of Indian National Aquatic Resources
(MINARS), CPCB found that the numbers of water bodies (river stretches and lentic water
bodies) exceeding the level of 6 mg/l BOD are 86 and among them 71 are river stretches and
15 are lentic water bodies (lakes/tanks and ponds) (Bharadwaj, 2005).
pH
31
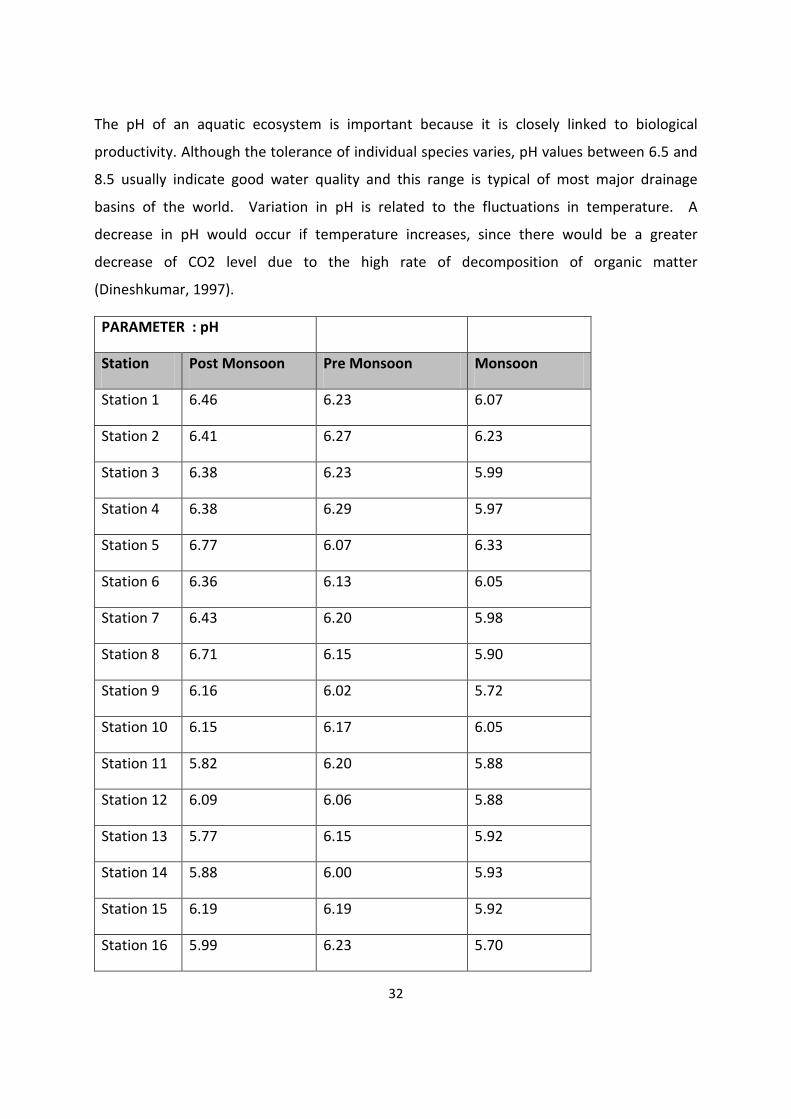
The pH of an aquatic ecosystem is important because it is closely linked to biological
productivity. Although the tolerance of individual species varies, pH values between 6.5 and
8.5 usually indicate good water quality and this range is typical of most major drainage
basins of the world. Variation in pH is related to the fluctuations in temperature. A
decrease in pH would occur if temperature increases, since there would be a greater
decrease of CO2 level due to the high rate of decomposition of organic matter
(Dineshkumar, 1997).
PARAMETER : pH
Station Post Monsoon Pre Monsoon Monsoon
Station 1 6.46 6.23 6.07
Station 2 6.41 6.27 6.23
Station 3 6.38 6.23 5.99
Station 4 6.38 6.29 5.97
Station 5 6.77 6.07 6.33
Station 6 6.36 6.13 6.05
Station 7 6.43 6.20 5.98
Station 8 6.71 6.15 5.90
Station 9 6.16 6.02 5.72
Station 10 6.15 6.17 6.05
Station 11 5.82 6.20 5.88
Station 12 6.09 6.06 5.88
Station 13 5.77 6.15 5.92
Station 14 5.88 6.00 5.93
Station 15 6.19 6.19 5.92
Station 16 5.99 6.23 5.70
32
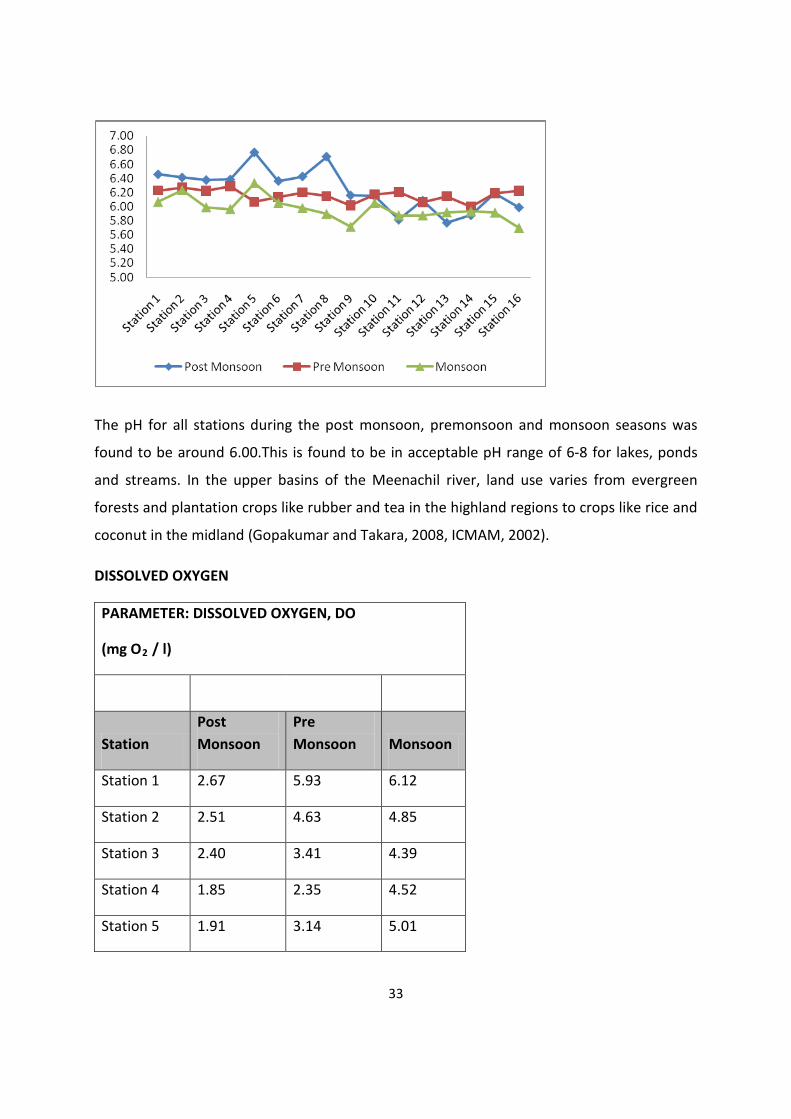
The pH for all stations during the post monsoon, premonsoon and monsoon seasons was
found to be around 6.00.This is found to be in acceptable pH range of 6-8 for lakes, ponds
and streams. In the upper basins of the Meenachil river, land use varies from evergreen
forests and plantation crops like rubber and tea in the highland regions to crops like rice and
coconut in the midland (Gopakumar and Takara, 2008, ICMAM, 2002).
DISSOLVED OXYGEN
PARAMETER: DISSOLVED OXYGEN, DO
(mg O2 / l)
Station Post Monsoon
Pre Monsoon Monsoon
Station 1 2.67 5.93 6.12
Station 2 2.51 4.63 4.85
Station 3 2.40 3.41 4.39
Station 4 1.85 2.35 4.52
Station 5 1.91 3.14 5.01
33
Station 6 2.18 3.17 5.17
Station 7 1.58 3.04 5.03
Station 8 1.85 3.46 5.01
Station 9 2.34 2.68 4.69
Station 10 2.07 2.92 4.37
Station 11 1.69 3.11 4.70
Station 12 2.12 4.12 4.71
Station 13 1.90 3.53 4.37
Station 14 2.18 3.04 4.10
Station 15 2.02 2.55 4.52
Station 16 2.07 4.05 1.88
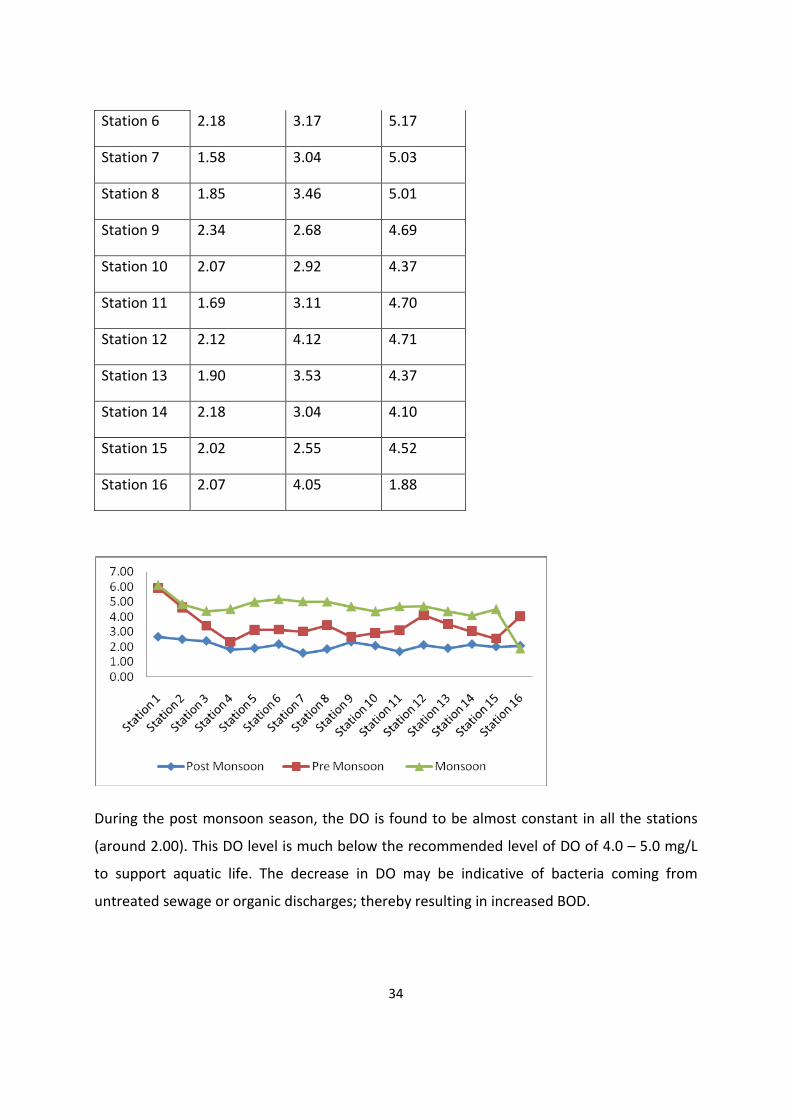
During the post monsoon season, the DO is found to be almost constant in all the stations
(around 2.00). This DO level is much below the recommended level of DO of 4.0 – 5.0 mg/L
to support aquatic life. The decrease in DO may be indicative of bacteria coming from
untreated sewage or organic discharges; thereby resulting in increased BOD.
34
During the premonsoon season, the DO level is highly variable among the stations studied.
Except for stations 4, 9, 10, 15 all other stations have a minimal DO level to support aquatic
life.
During the monsoon season, the DO level is found to be within acceptable standards to
support life for all stations except for station16.
PARAMETER : SUSPENDED SEDIMENTS (TSS) (mg/l)
Station Post Monsoon Pre Monsoon Monsoon
Station 1 2.18
Station 2 5.41
Station 3 1.60
Station 4 1.66
Station 5 6.51
Station 6 1.51
Station 7 3.52
Station 8 3.19
Station 9 8.35
Station 10 6.18
Station 11 6.70
Station 12 3.70
Station 13 5.84
Station 14 3.58
Station 15 7.06
Station 16 3.97
35
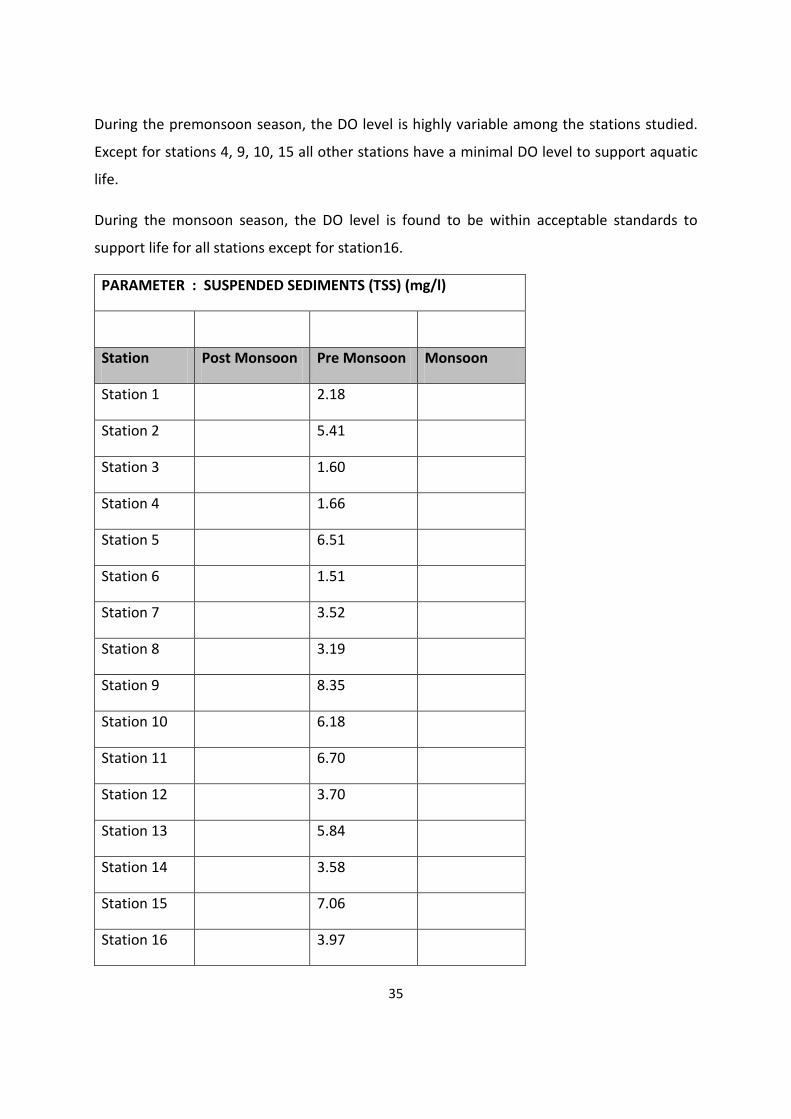
During the pre monsoon season, suspended sediments were measured for all stations in
terms of total suspended solid concentration (mg per litre of water).It was found that
suspended sediments was very low for all stations , compared to 25-80 mg/L which is the
average TSS concentration for moderate water quality.
PARAMETER : TOTAL Coliforms
(MPN index / 100 ml)
Station Post Monsoon Pre Monsoon Monsoon
Station 1 747.67 780.00 28.00
Station 2 181.00 413.25 240.00
Station 3 337.67 803.33 1100.00
Station 4 191.00 177.75 240.00
Station 5 106.00 155.10 240.00
Station 6 254.33 379.00 93.00
Station 7 69.67 174.50 210.00
Station 8 350.00 521.33 43.00
Station 9 571.50 564.00
Station 10 141.50 93.00 93.00
Station 11 237.00 587.50 210.00
Station 12 211.00 240.00 1100.00
Station 13 188.00 600.00 150.00
Station 14 253.33 116.50 460.00
Station 15 84.00 225.00 240.00
Station 16 39.50 82.50 1100.00
36
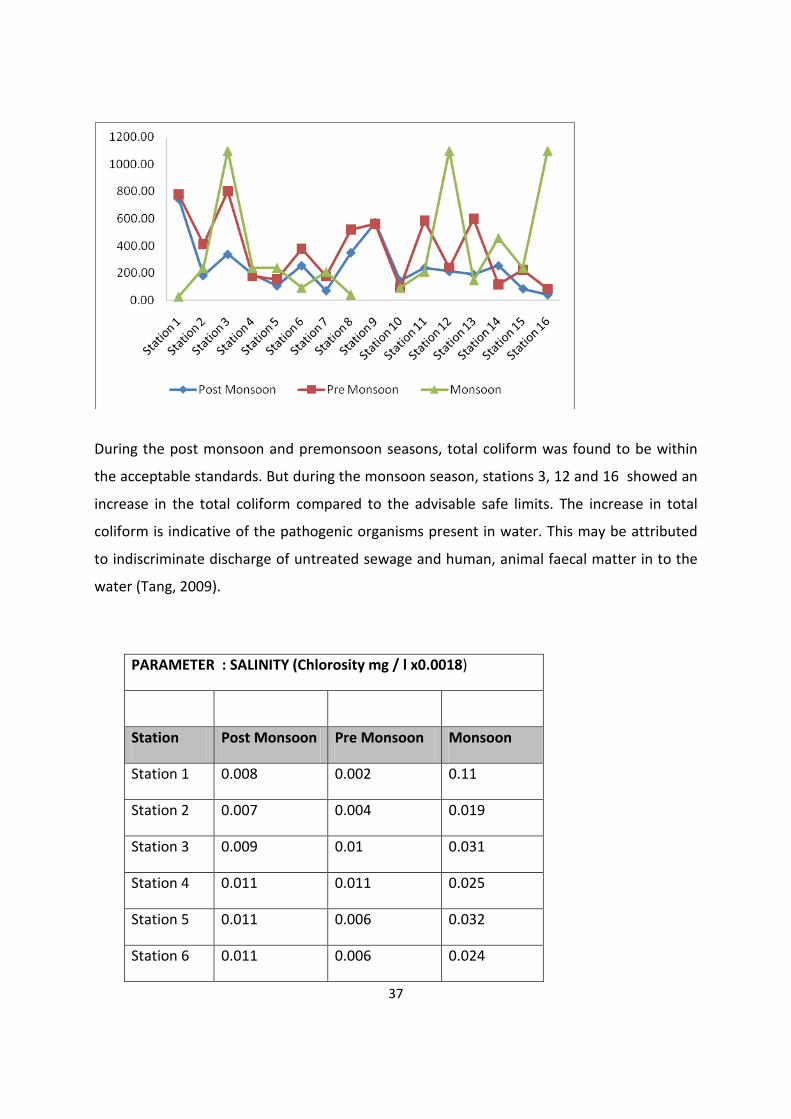
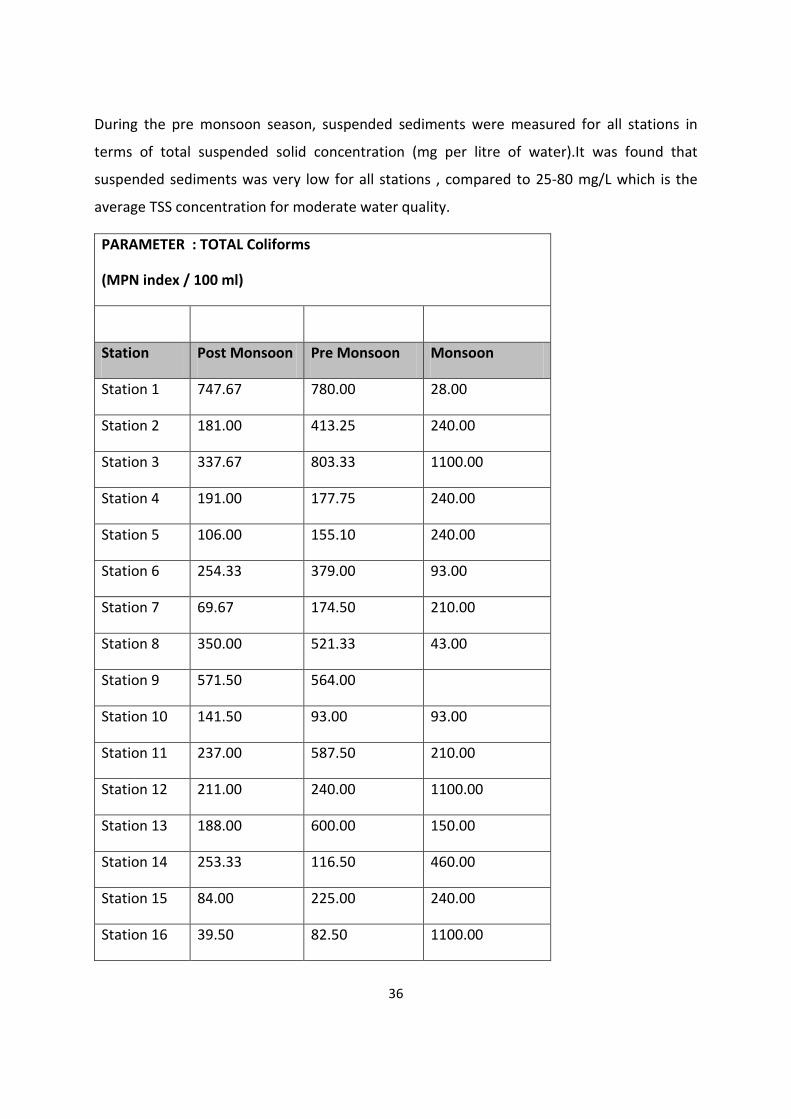
During the post monsoon and premonsoon seasons, total coliform was found to be within
the acceptable standards. But during the monsoon season, stations 3, 12 and 16 showed an
increase in the total coliform compared to the advisable safe limits. The increase in total
coliform is indicative of the pathogenic organisms present in water. This may be attributed
to indiscriminate discharge of untreated sewage and human, animal faecal matter in to the
water (Tang, 2009).
PARAMETER : SALINITY (Chlorosity mg / l x0.0018)
Station Post Monsoon Pre Monsoon Monsoon
Station 1 0.008 0.002 0.11
Station 2 0.007 0.004 0.019
Station 3 0.009 0.01 0.031
Station 4 0.011 0.011 0.025
Station 5 0.011 0.006 0.032
Station 6 0.011 0.006 0.024
37
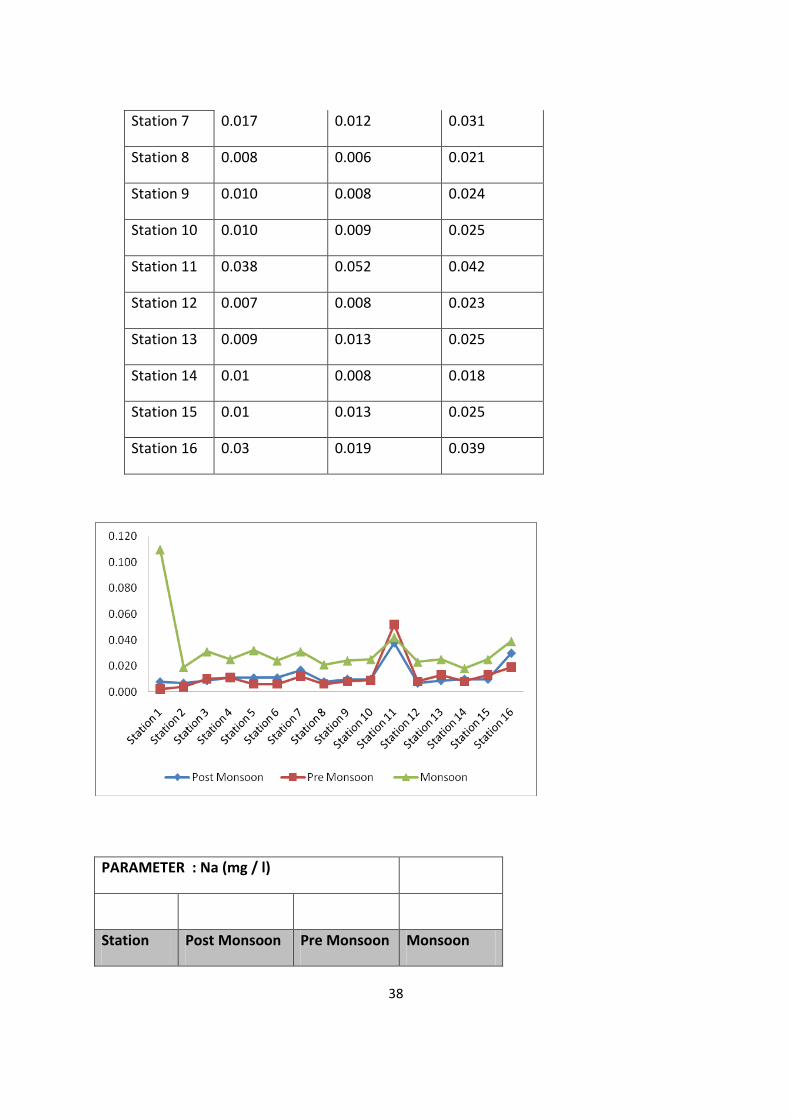
Station 7 0.017 0.012 0.031
Station 8 0.008 0.006 0.021
Station 9 0.010 0.008 0.024
Station 10 0.010 0.009 0.025
Station 11 0.038 0.052 0.042
Station 12 0.007 0.008 0.023
Station 13 0.009 0.013 0.025
Station 14 0.01 0.008 0.018
Station 15 0.01 0.013 0.025
Station 16 0.03 0.019 0.039
PARAMETER : Na (mg / l)
Station Post Monsoon Pre Monsoon Monsoon
38
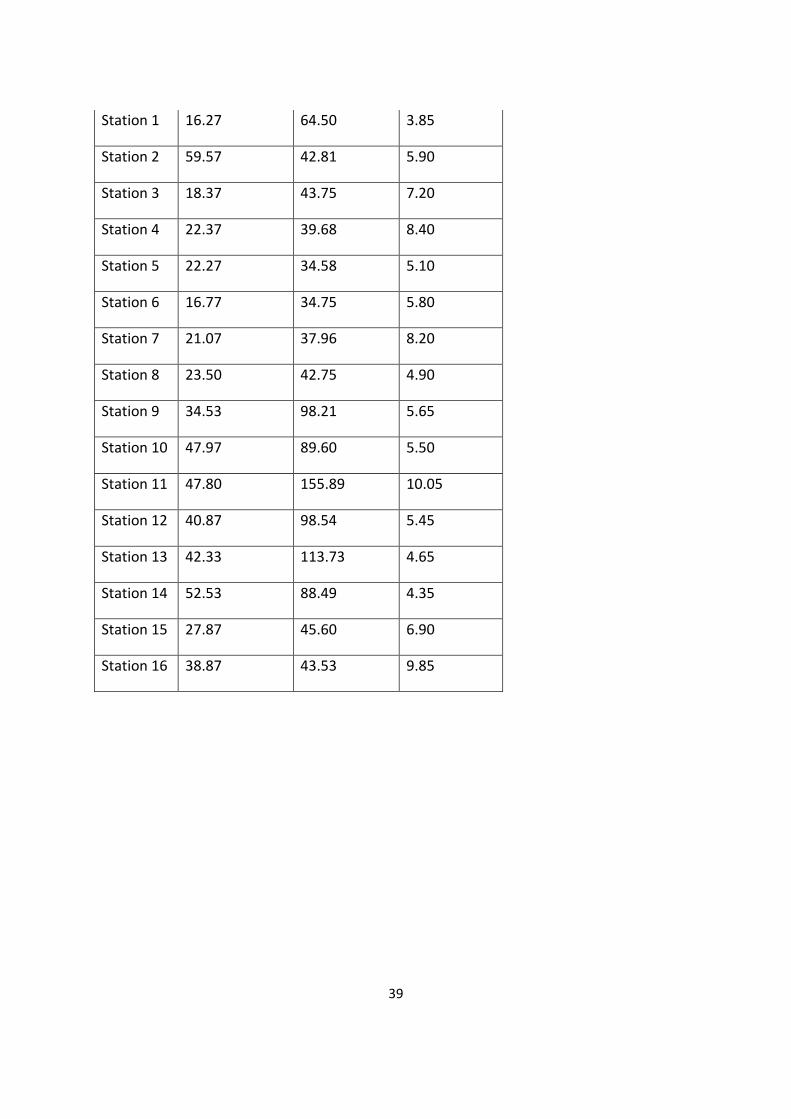
Station 1 16.27 64.50 3.85
Station 2 59.57 42.81 5.90
Station 3 18.37 43.75 7.20
Station 4 22.37 39.68 8.40
Station 5 22.27 34.58 5.10
Station 6 16.77 34.75 5.80
Station 7 21.07 37.96 8.20
Station 8 23.50 42.75 4.90
Station 9 34.53 98.21 5.65
Station 10 47.97 89.60 5.50
Station 11 47.80 155.89 10.05
Station 12 40.87 98.54 5.45
Station 13 42.33 113.73 4.65
Station 14 52.53 88.49 4.35
Station 15 27.87 45.60 6.90
Station 16 38.87 43.53 9.85
39
During all the seasons, the sodium level of water was low compared to the desirable range
of 200 mg/l for drinking purposes. Since the percentage of sodium in water also determines
the suitability of water for irrigation, it was found that the Na+ level of water in stations 11
and 13 was high compared to the maximum tolerance limit of 60% for irrigation purposes.
The high Na % may be due to the sewage contribution from the neighbouring industries.
PARAMETER : K (mg / l)
Station Post Monsoon
Pre Monsoon Monsoon
Station 1 2.20 5.00 1.05
Station 2 2.13 3.60 1.25
Station 3 2.23 3.70 1.70
Station 4 2.40 3.45 1.55
Station 5 2.97 3.23 1.15
Station 6 2.20 3.28 0.75
40
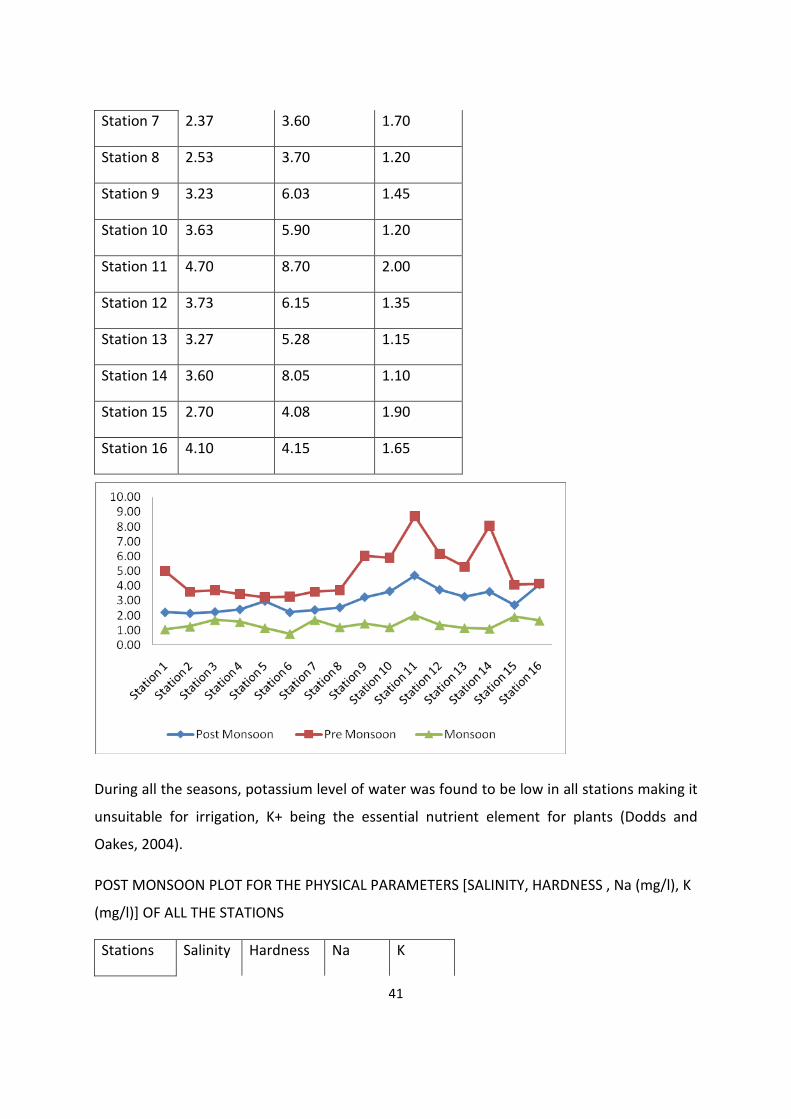
Station 7 2.37 3.60 1.70
Station 8 2.53 3.70 1.20
Station 9 3.23 6.03 1.45
Station 10 3.63 5.90 1.20
Station 11 4.70 8.70 2.00
Station 12 3.73 6.15 1.35
Station 13 3.27 5.28 1.15
Station 14 3.60 8.05 1.10
Station 15 2.70 4.08 1.90
Station 16 4.10 4.15 1.65
During all the seasons, potassium level of water was found to be low in all stations making it
unsuitable for irrigation, K+ being the essential nutrient element for plants (Dodds and
Oakes, 2004).
POST MONSOON PLOT FOR THE PHYSICAL PARAMETERS [SALINITY, HARDNESS , Na (mg/l), K
(mg/l)] OF ALL THE STATIONS
Stations Salinity Hardness Na K
41
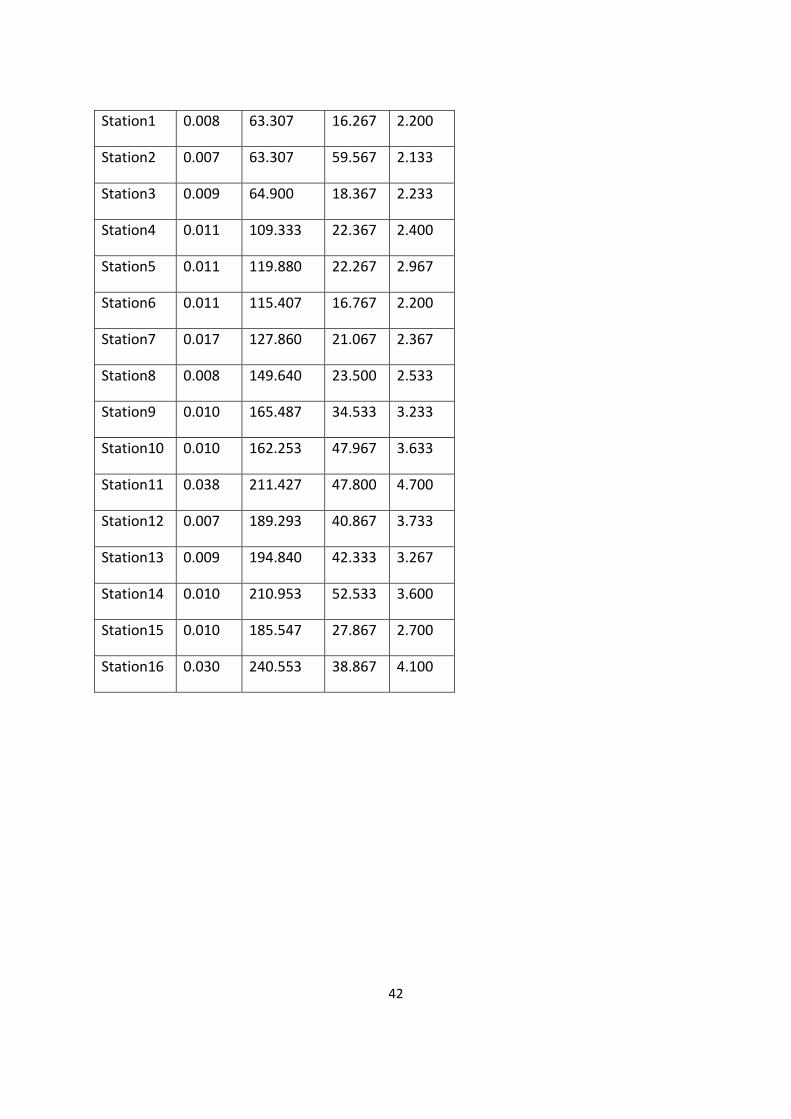
Station1 0.008 63.307 16.267 2.200
Station2 0.007 63.307 59.567 2.133
Station3 0.009 64.900 18.367 2.233
Station4 0.011 109.333 22.367 2.400
Station5 0.011 119.880 22.267 2.967
Station6 0.011 115.407 16.767 2.200
Station7 0.017 127.860 21.067 2.367
Station8 0.008 149.640 23.500 2.533
Station9 0.010 165.487 34.533 3.233
Station10 0.010 162.253 47.967 3.633
Station11 0.038 211.427 47.800 4.700
Station12 0.007 189.293 40.867 3.733
Station13 0.009 194.840 42.333 3.267
Station14 0.010 210.953 52.533 3.600
Station15 0.010 185.547 27.867 2.700
Station16 0.030 240.553 38.867 4.100
42
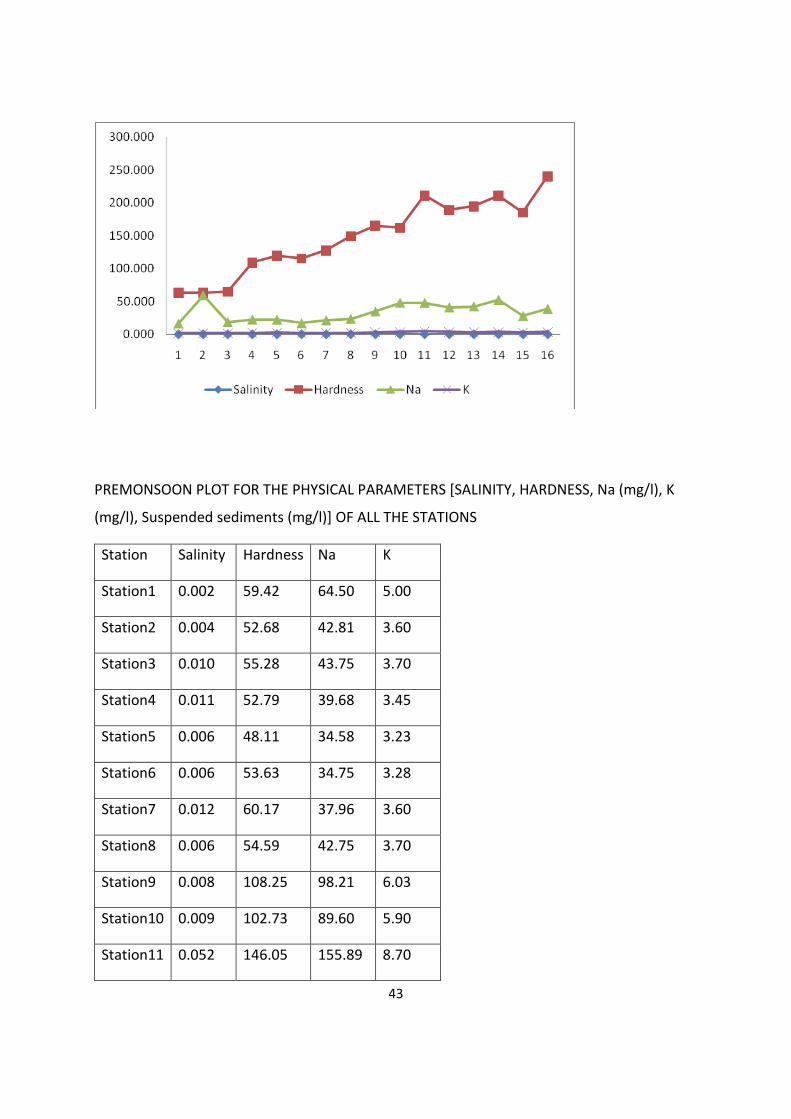
PREMONSOON PLOT FOR THE PHYSICAL PARAMETERS [SALINITY, HARDNESS, Na (mg/l), K
(mg/l), Suspended sediments (mg/l)] OF ALL THE STATIONS
Station Salinity Hardness Na K
Station1 0.002 59.42 64.50 5.00
Station2 0.004 52.68 42.81 3.60
Station3 0.010 55.28 43.75 3.70
Station4 0.011 52.79 39.68 3.45
Station5 0.006 48.11 34.58 3.23
Station6 0.006 53.63 34.75 3.28
Station7 0.012 60.17 37.96 3.60
Station8 0.006 54.59 42.75 3.70
Station9 0.008 108.25 98.21 6.03
Station10 0.009 102.73 89.60 5.90
Station11 0.052 146.05 155.89 8.70
43
Station12 0.008 122.90 98.54 6.15
Station13 0.013 124.08 113.73 5.28
Station14 0.008 144.67 88.49 8.05
Station15 0.013 60.82 45.60 4.08
Station16 0.019 49.68 43.53 4.15
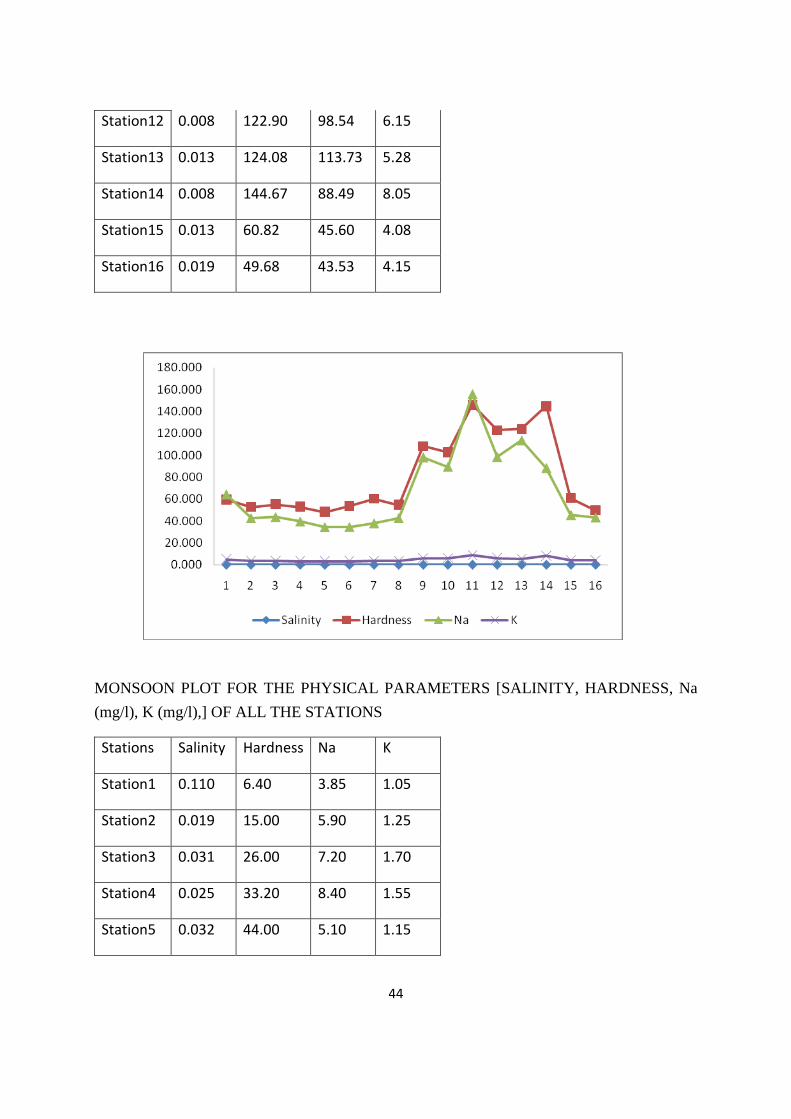
MONSOON PLOT FOR THE PHYSICAL PARAMETERS [SALINITY, HARDNESS, Na (mg/l), K (mg/l),] OF ALL THE STATIONS
Stations Salinity Hardness Na K
Station1 0.110 6.40 3.85 1.05
Station2 0.019 15.00 5.90 1.25
Station3 0.031 26.00 7.20 1.70
Station4 0.025 33.20 8.40 1.55
Station5 0.032 44.00 5.10 1.15
44
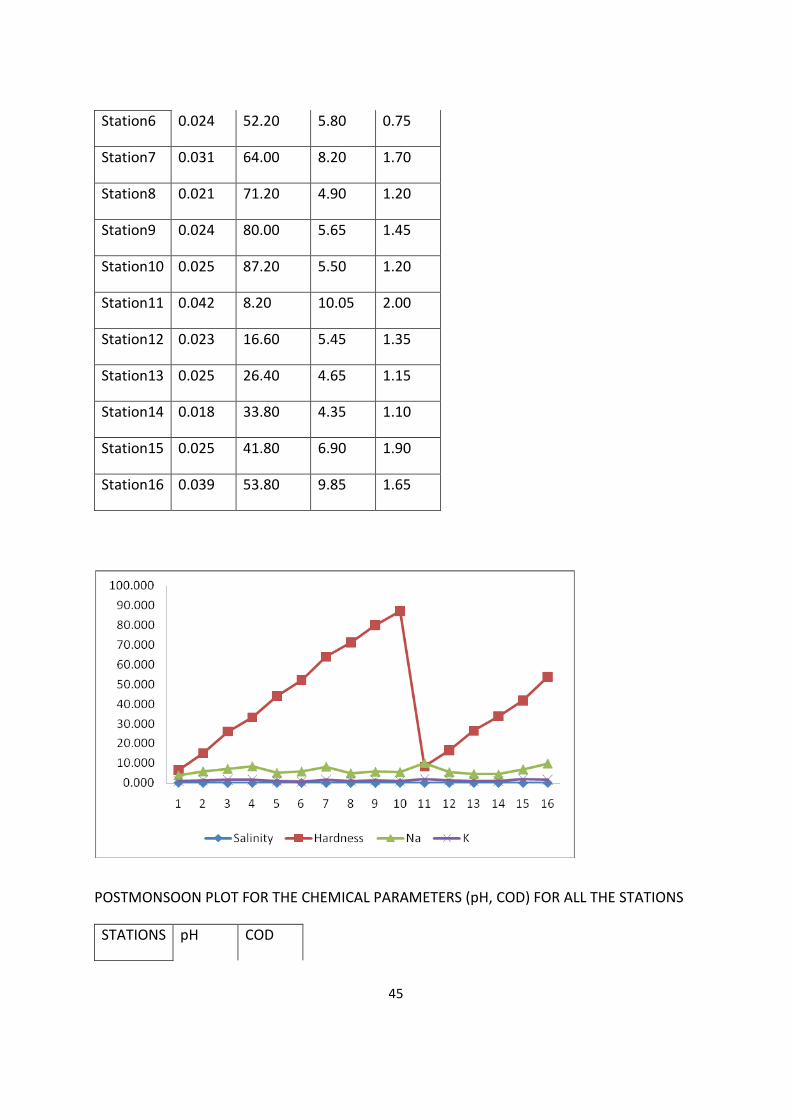
Station6 0.024 52.20 5.80 0.75
Station7 0.031 64.00 8.20 1.70
Station8 0.021 71.20 4.90 1.20
Station9 0.024 80.00 5.65 1.45
Station10 0.025 87.20 5.50 1.20
Station11 0.042 8.20 10.05 2.00
Station12 0.023 16.60 5.45 1.35
Station13 0.025 26.40 4.65 1.15
Station14 0.018 33.80 4.35 1.10
Station15 0.025 41.80 6.90 1.90
Station16 0.039 53.80 9.85 1.65
POSTMONSOON PLOT FOR THE CHEMICAL PARAMETERS (pH, COD) FOR ALL THE STATIONS
STATIONS pH COD
45
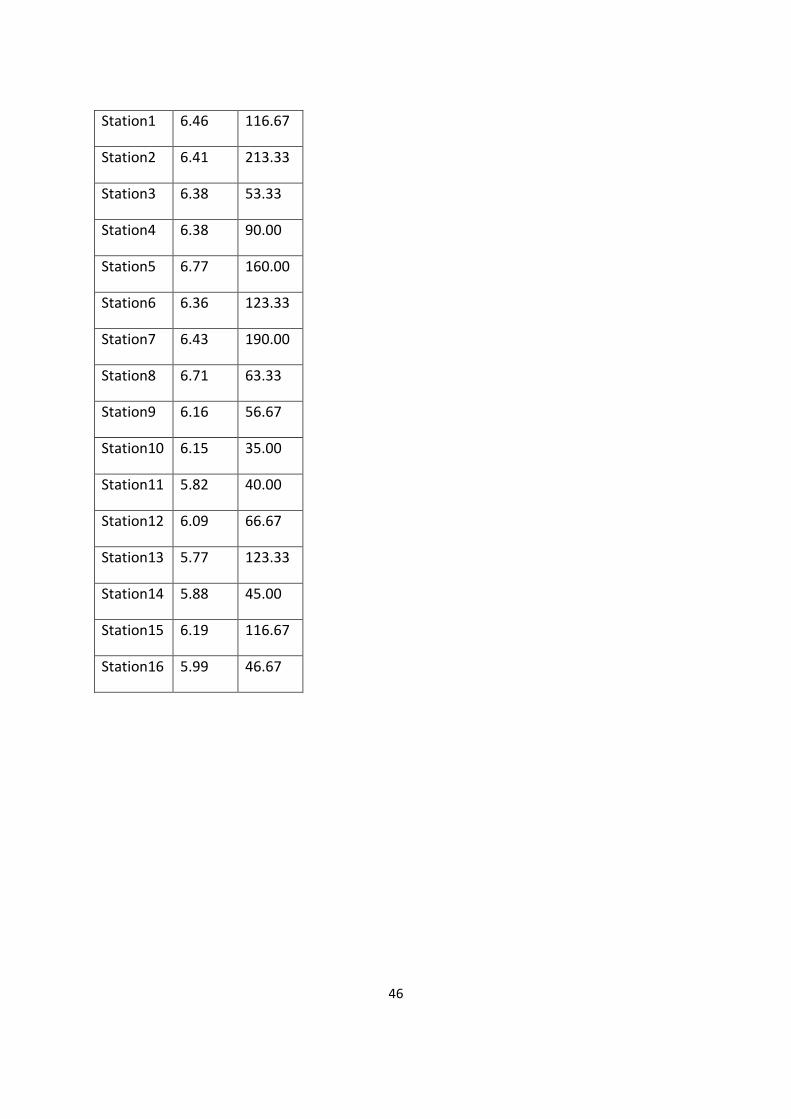
Station1 6.46 116.67
Station2 6.41 213.33
Station3 6.38 53.33
Station4 6.38 90.00
Station5 6.77 160.00
Station6 6.36 123.33
Station7 6.43 190.00
Station8 6.71 63.33
Station9 6.16 56.67
Station10 6.15 35.00
Station11 5.82 40.00
Station12 6.09 66.67
Station13 5.77 123.33
Station14 5.88 45.00
Station15 6.19 116.67
Station16 5.99 46.67
46
During the post monsoon season,
• pH is found to be in the acceptable range for all stations for a desirable water quality. • COD is found to be very high in stations 2, 5, 7 and 13 that can be accounted to the
untreated organic load entering the water from nearby places.
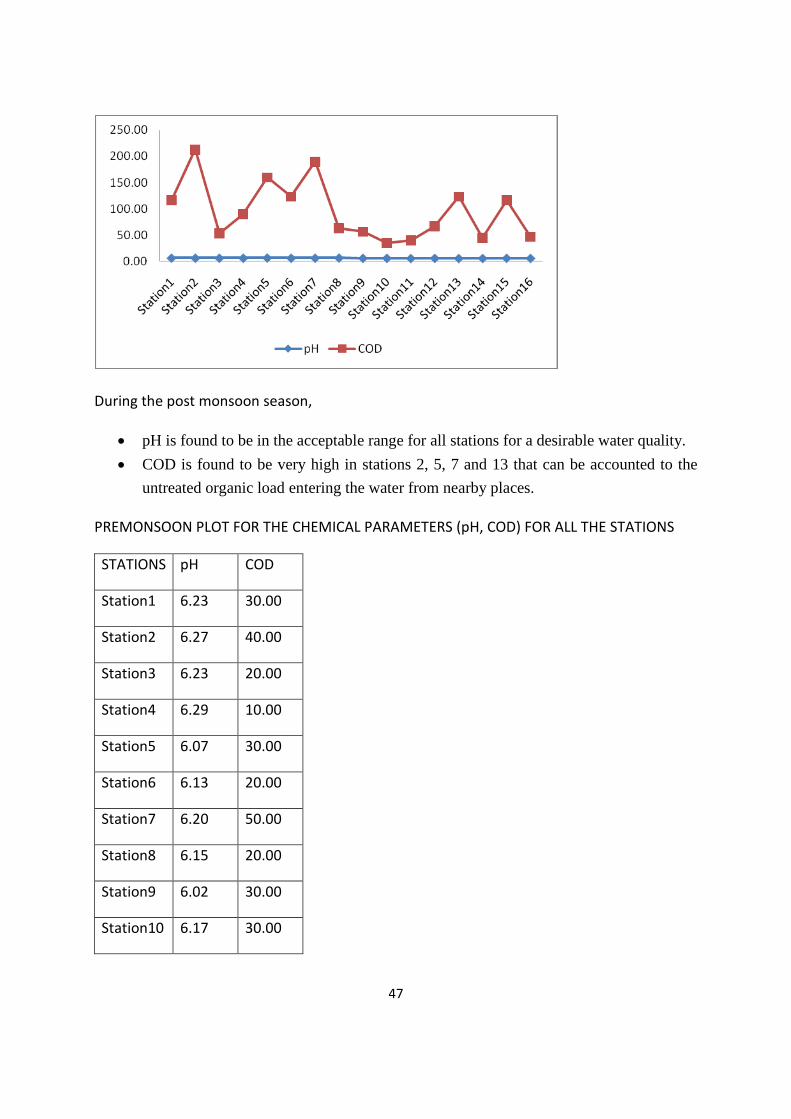
PREMONSOON PLOT FOR THE CHEMICAL PARAMETERS (pH, COD) FOR ALL THE STATIONS
STATIONS pH COD
Station1 6.23 30.00
Station2 6.27 40.00
Station3 6.23 20.00
Station4 6.29 10.00
Station5 6.07 30.00
Station6 6.13 20.00
Station7 6.20 50.00
Station8 6.15 20.00
Station9 6.02 30.00
Station10 6.17 30.00
47
Station11 6.20 10.00
Station12 6.06 20.00
Station13 6.15 30.00
Station14 6.00 20.00
Station15 6.19 70.00
Station16 6.23 50.00
During premonsoon season,
• pH is found to be in the neutral range for all stations indicating neither acidic or alkaline water.
• COD is in a desirable range in all stations indicating the availability of water dissolved oxygen in these stations.
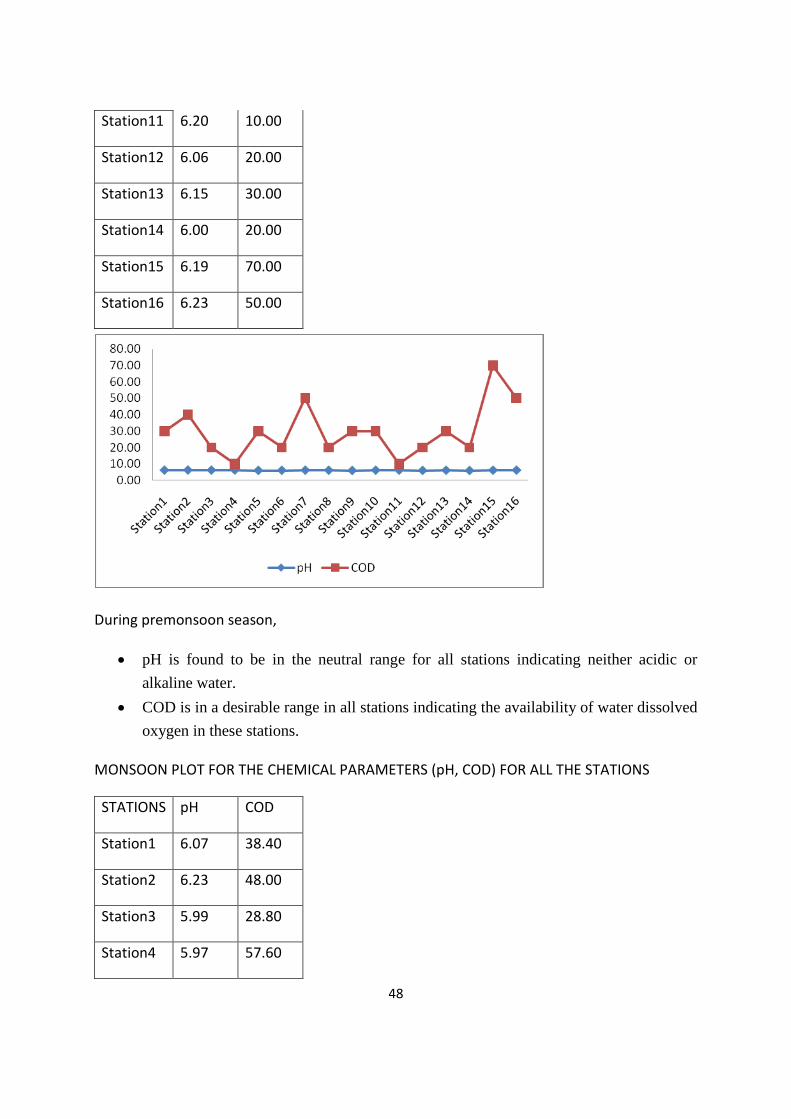
MONSOON PLOT FOR THE CHEMICAL PARAMETERS (pH, COD) FOR ALL THE STATIONS
STATIONS pH COD
Station1 6.07 38.40
Station2 6.23 48.00
Station3 5.99 28.80
Station4 5.97 57.60
48
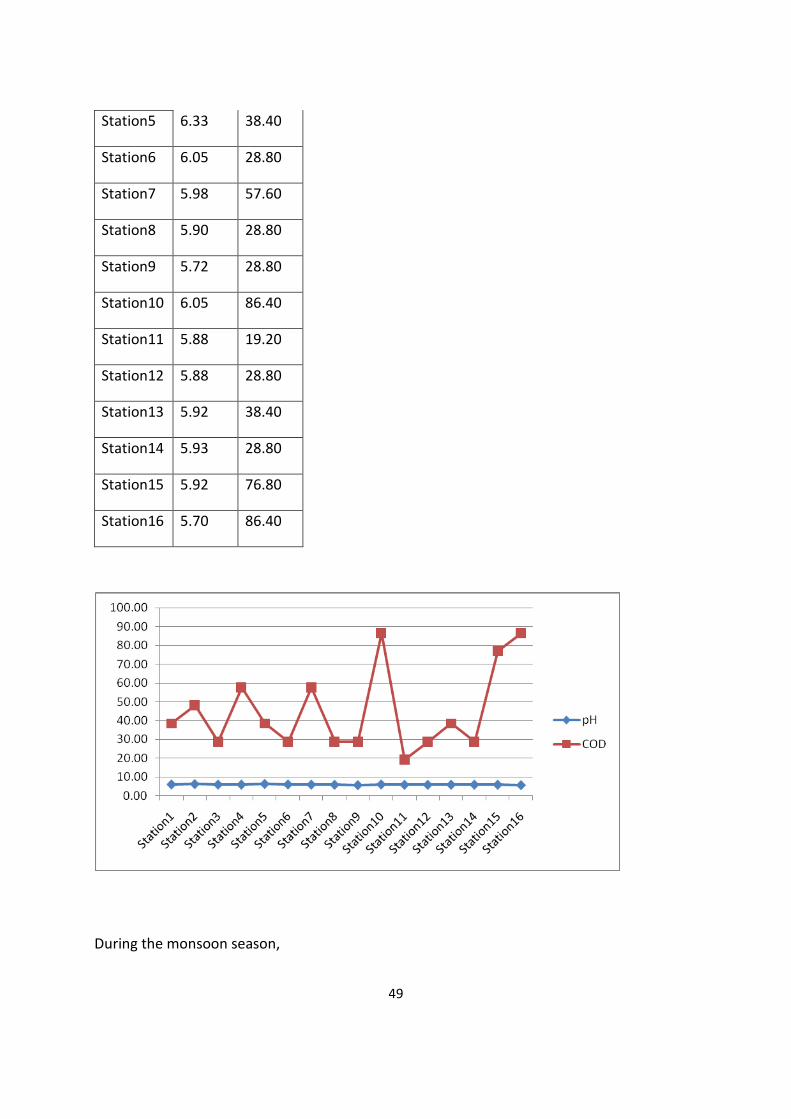
Station5 6.33 38.40
Station6 6.05 28.80
Station7 5.98 57.60
Station8 5.90 28.80
Station9 5.72 28.80
Station10 6.05 86.40
Station11 5.88 19.20
Station12 5.88 28.80
Station13 5.92 38.40
Station14 5.93 28.80
Station15 5.92 76.80
Station16 5.70 86.40
During the monsoon season,
49
• pH is found to be in the neutral range maintaining the water quality standards. • COD is more or less the same in all stations compared to the premonsoon season
except for station 10 where there is a sudden rise in the COD level from 30 mg O2 / l to 86.40 mg O2 /l. This may be either due to discharge of untreated sewage or fertilizer runoff from the fields adding to the organic load of the water.
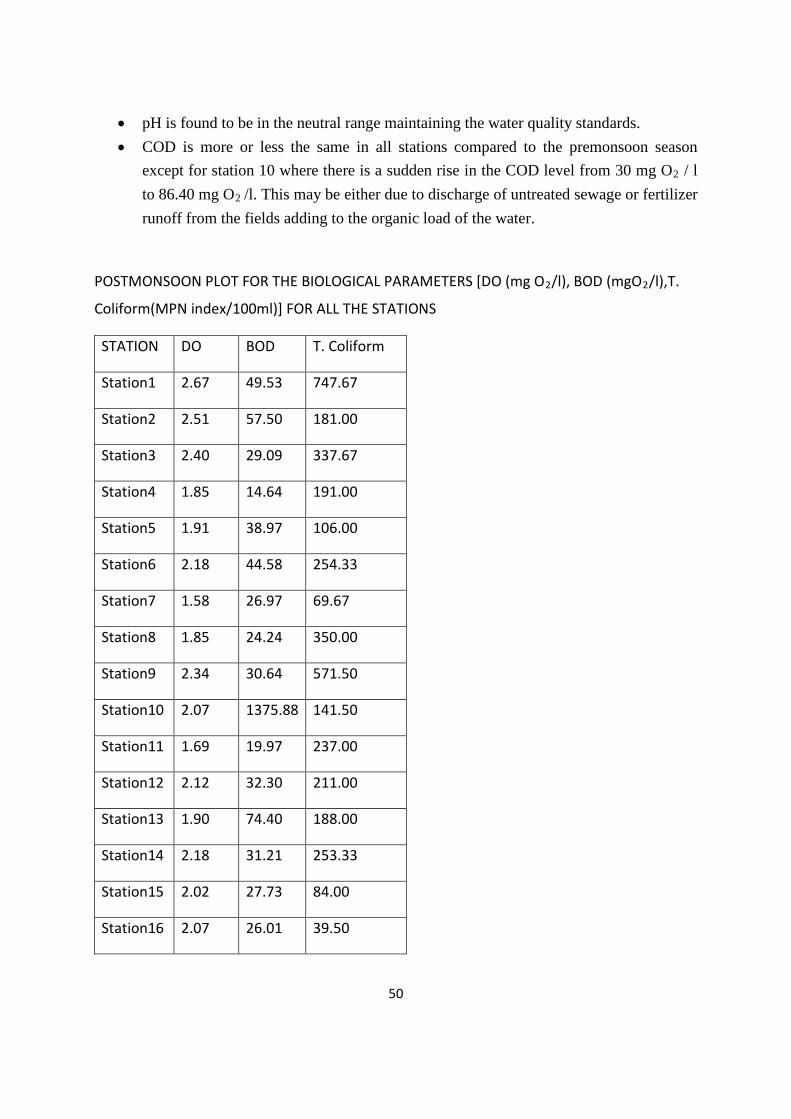
POSTMONSOON PLOT FOR THE BIOLOGICAL PARAMETERS [DO (mg O2/l), BOD (mgO2/l),T.
Coliform(MPN index/100ml)] FOR ALL THE STATIONS
STATION DO BOD T. Coliform
Station1 2.67 49.53 747.67
Station2 2.51 57.50 181.00
Station3 2.40 29.09 337.67
Station4 1.85 14.64 191.00
Station5 1.91 38.97 106.00
Station6 2.18 44.58 254.33
Station7 1.58 26.97 69.67
Station8 1.85 24.24 350.00
Station9 2.34 30.64 571.50
Station10 2.07 1375.88 141.50
Station11 1.69 19.97 237.00
Station12 2.12 32.30 211.00
Station13 1.90 74.40 188.00
Station14 2.18 31.21 253.33
Station15 2.02 27.73 84.00
Station16 2.07 26.01 39.50
50
During the post monsoon season,
• DO is found to be very low than the acceptable DO in all stations indicating highly polluted water.
• In relation to the low DO, BOD is high with the peak BOD found in station10 indicating severely polluted water.
• Total Coli form for all stations was well within the acceptable standards.
PREMONSOON PLOT FOR THE BIOLOGICAL PARAMETERS [DO (mg O2/l), BOD (mgO2/l),T.
Coliform (MPN index/100ml)] FOR ALL THE STATIONS
STATION DO BOD T. Coliform
Station1 5.93 2.53 780.00
Station2 4.63 2.74 413.25
Station3 3.41 2.53 803.33
Station4 2.35 5.61 177.75
Station5 3.14 6.17 155.10
Station6 3.17 1.93 379.00
Station7 3.04 3.51 174.50
Station8 3.46 2.29 521.33
51
Station9 2.68 14.31 564.00
Station10 2.92 5.61 93.00
Station11 3.11 3.83 587.50
Station12 4.12 2.46 240.00
Station13 3.53 38.68 600.00
Station14 3.04 2.20 116.50
Station15 2.55 6.12 225.00
Station16 4.05 6.02 82.50
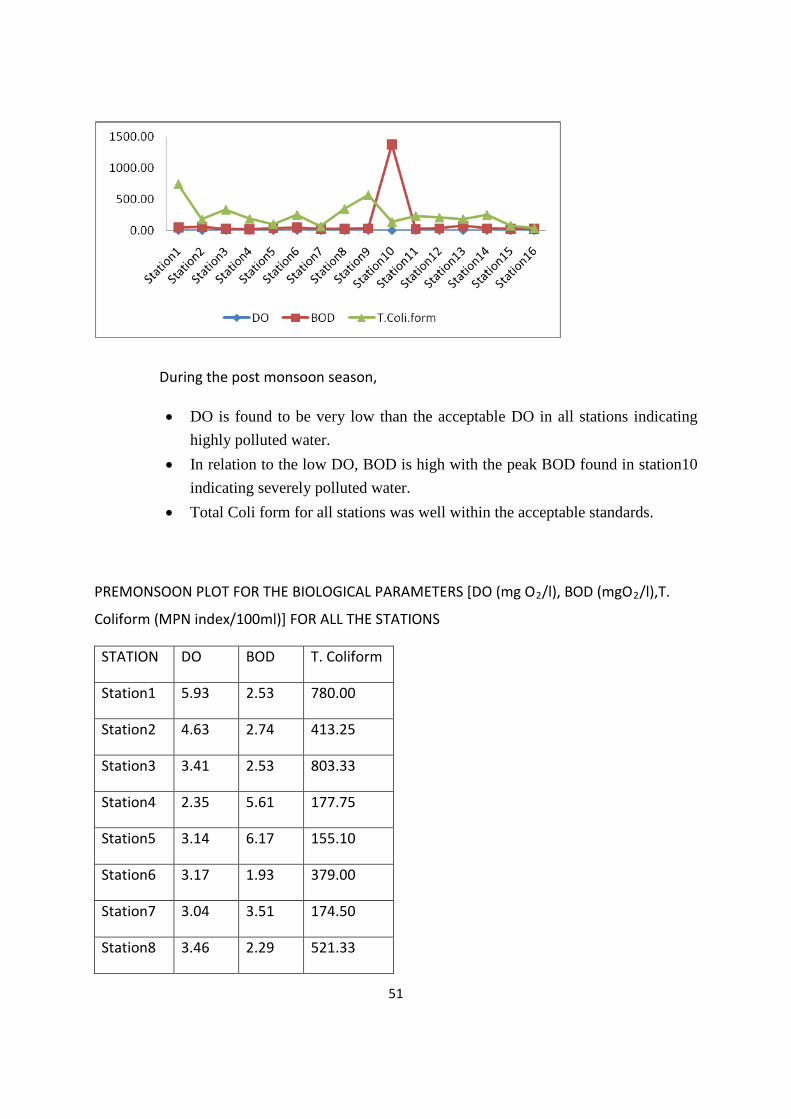
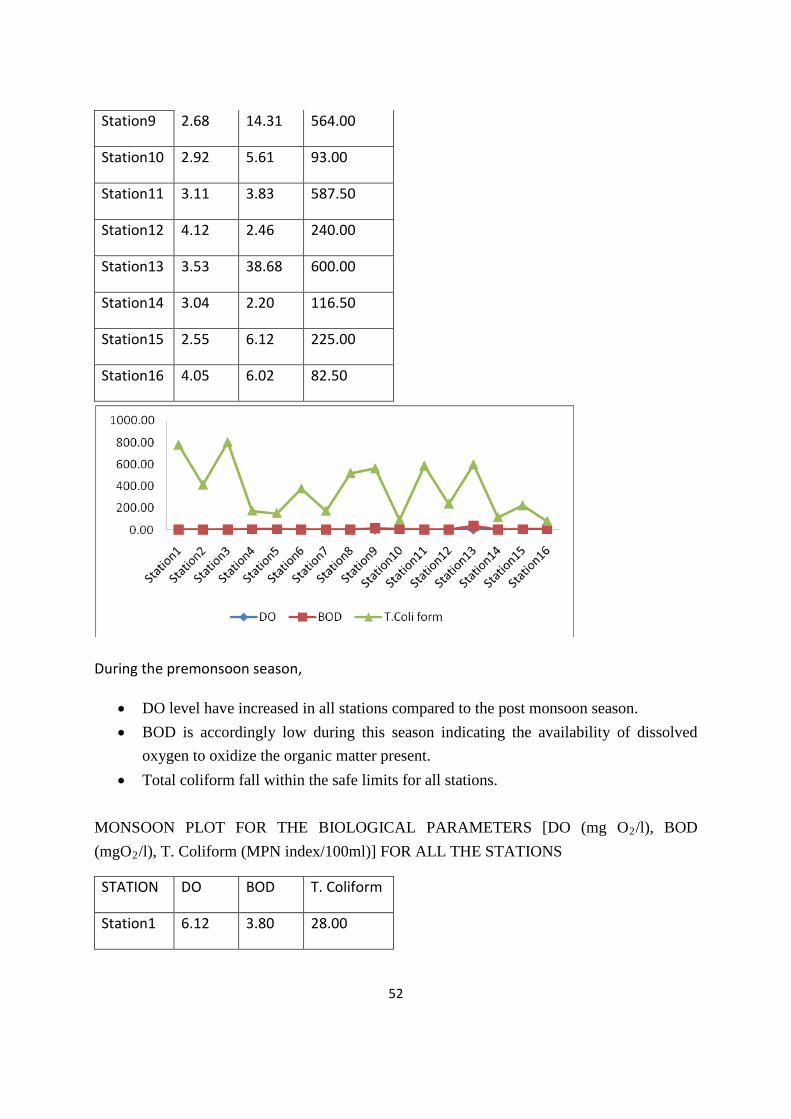
During the premonsoon season,
• DO level have increased in all stations compared to the post monsoon season. • BOD is accordingly low during this season indicating the availability of dissolved
oxygen to oxidize the organic matter present. • Total coliform fall within the safe limits for all stations.
MONSOON PLOT FOR THE BIOLOGICAL PARAMETERS [DO (mg O2/l), BOD (mgO2/l), T. Coliform (MPN index/100ml)] FOR ALL THE STATIONS
STATION DO BOD T. Coliform
Station1 6.12 3.80 28.00
52
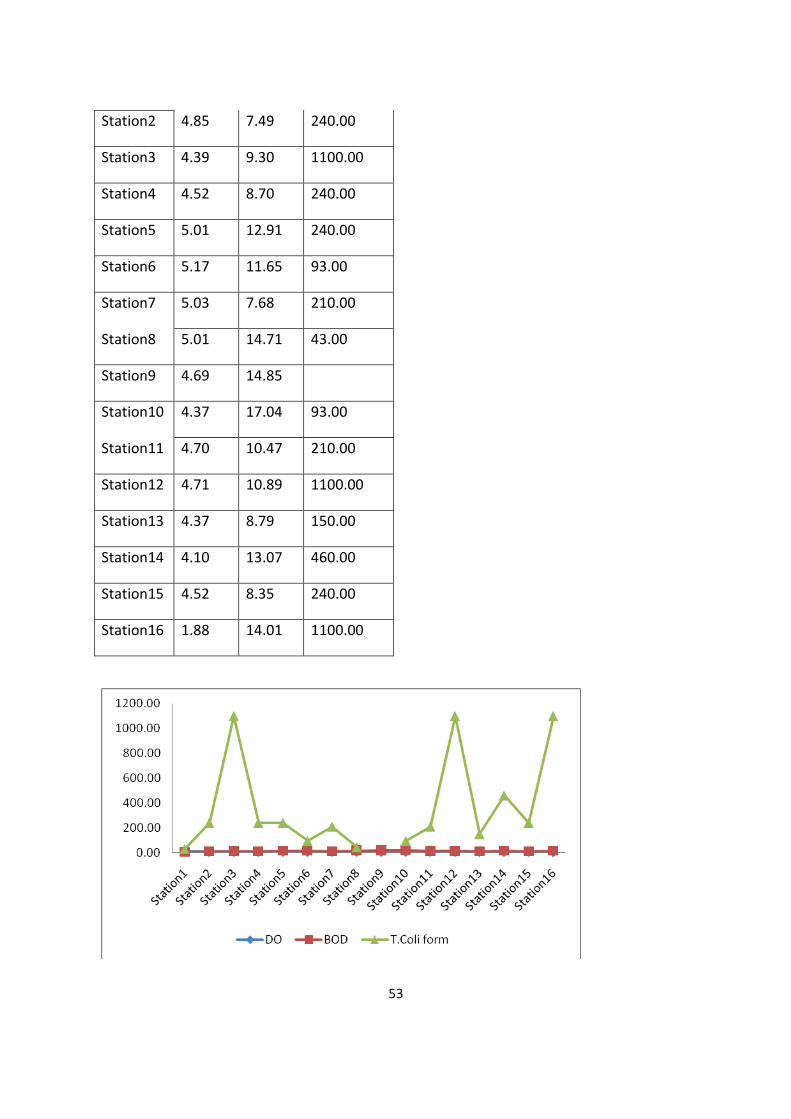
Station2 4.85 7.49 240.00
Station3 4.39 9.30 1100.00
Station4 4.52 8.70 240.00
Station5 5.01 12.91 240.00
Station6 5.17 11.65 93.00
Station7 5.03 7.68 210.00
Station8 5.01 14.71 43.00
Station9 4.69 14.85
Station10 4.37 17.04 93.00
Station11 4.70 10.47 210.00
Station12 4.71 10.89 1100.00
Station13 4.37 8.79 150.00
Station14 4.10 13.07 460.00
Station15 4.52 8.35 240.00
Station16 1.88 14.01 1100.00
53
During the monsoon season • DO was found to be low in all stations. • Owing to the low DO level of the water, there was a corresponding rise in the BOD. • Total coliform was found to be high in stations 3, 12 and 16 making the water unfit for
drinking or any other domestic purposes.
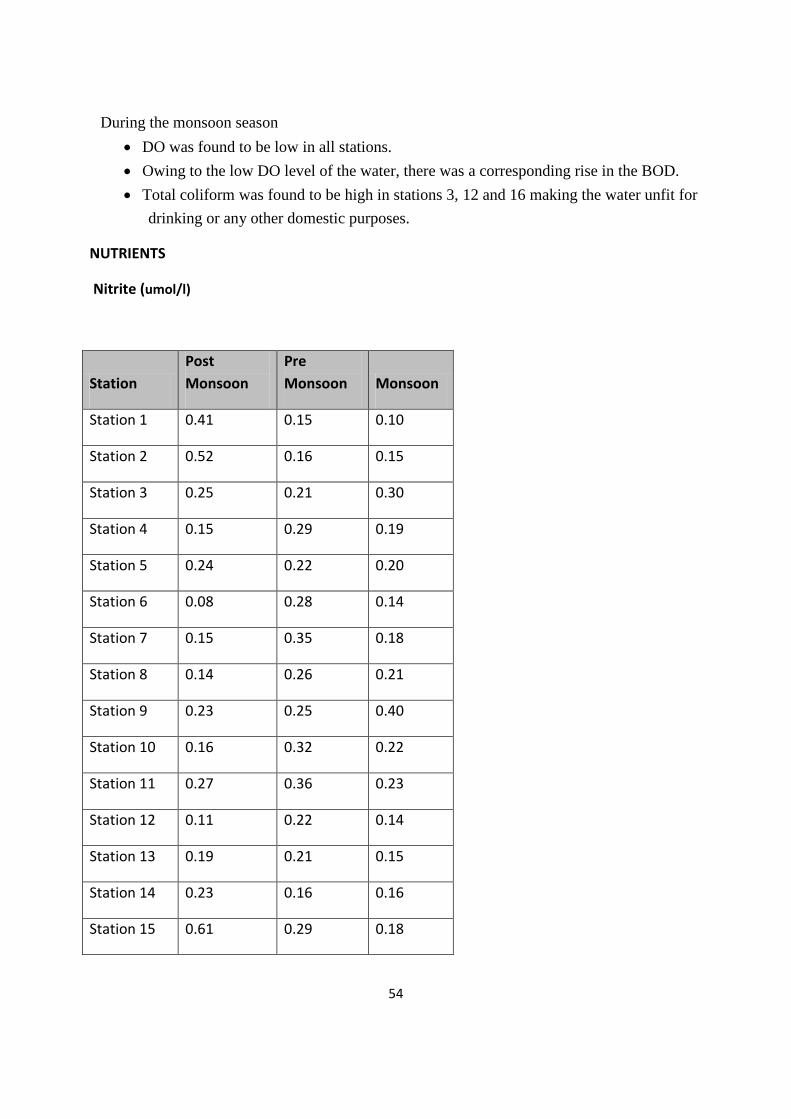
NUTRIENTS
Nitrite (umol/l)
Station Post Monsoon
Pre Monsoon Monsoon
Station 1 0.41 0.15 0.10
Station 2 0.52 0.16 0.15
Station 3 0.25 0.21 0.30
Station 4 0.15 0.29 0.19
Station 5 0.24 0.22 0.20
Station 6 0.08 0.28 0.14
Station 7 0.15 0.35 0.18
Station 8 0.14 0.26 0.21
Station 9 0.23 0.25 0.40
Station 10 0.16 0.32 0.22
Station 11 0.27 0.36 0.23
Station 12 0.11 0.22 0.14
Station 13 0.19 0.21 0.15
Station 14 0.23 0.16 0.16
Station 15 0.61 0.29 0.18
54
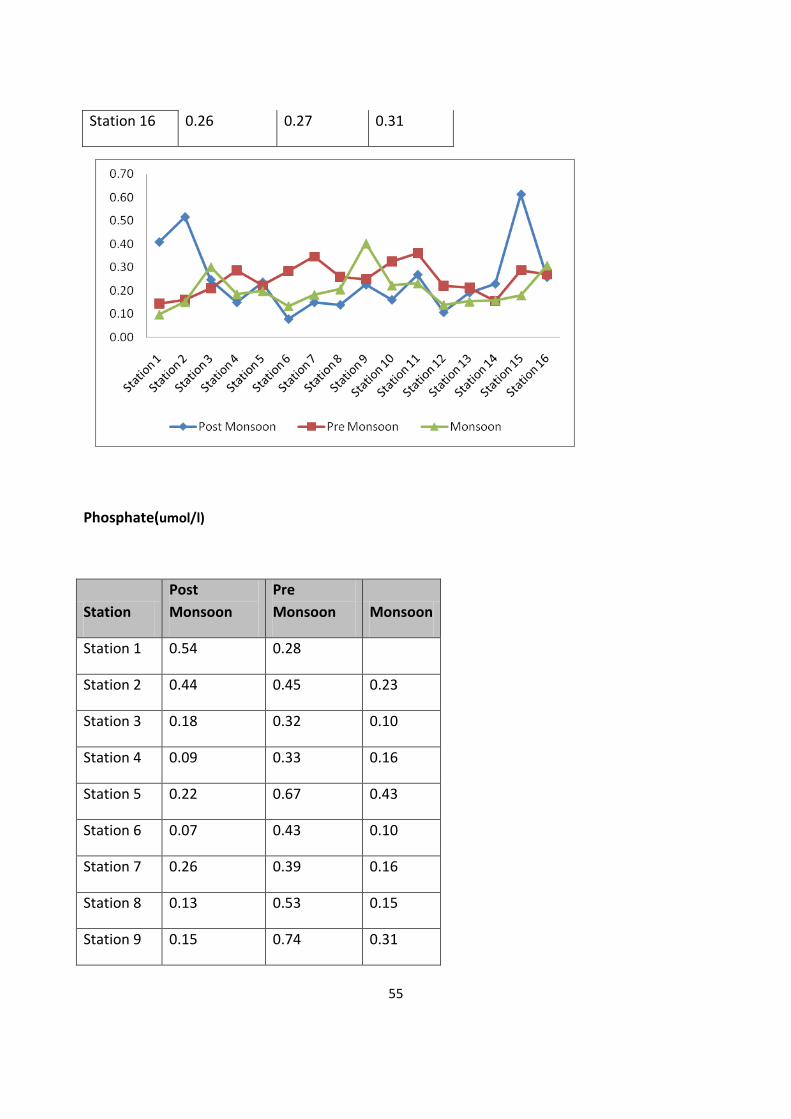
Station 16 0.26 0.27 0.31
Phosphate(umol/l)
Station Post Monsoon
Pre Monsoon Monsoon
Station 1 0.54 0.28
Station 2 0.44 0.45 0.23
Station 3 0.18 0.32 0.10
Station 4 0.09 0.33 0.16
Station 5 0.22 0.67 0.43
Station 6 0.07 0.43 0.10
Station 7 0.26 0.39 0.16
Station 8 0.13 0.53 0.15
Station 9 0.15 0.74 0.31
55
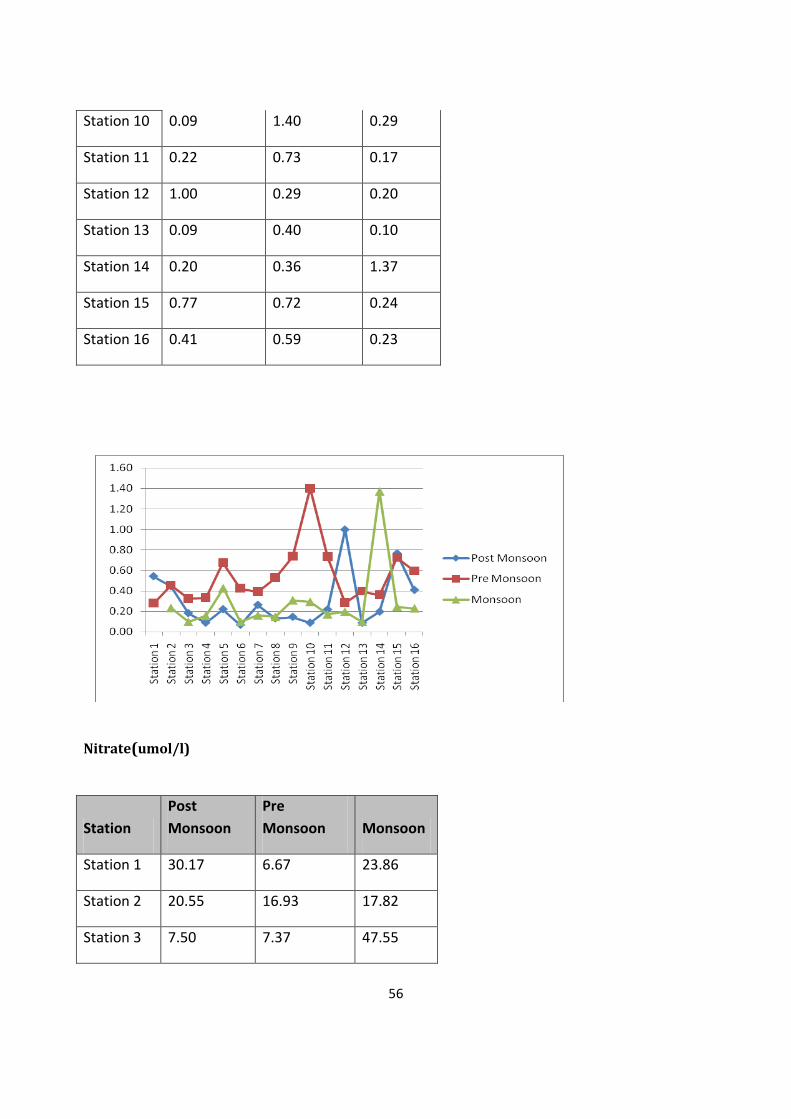
Station 10 0.09 1.40 0.29
Station 11 0.22 0.73 0.17
Station 12 1.00 0.29 0.20
Station 13 0.09 0.40 0.10
Station 14 0.20 0.36 1.37
Station 15 0.77 0.72 0.24
Station 16 0.41 0.59 0.23
Nitrate(umol/l)
Station Post Monsoon
Pre Monsoon Monsoon
Station 1 30.17 6.67 23.86
Station 2 20.55 16.93 17.82
Station 3 7.50 7.37 47.55
56
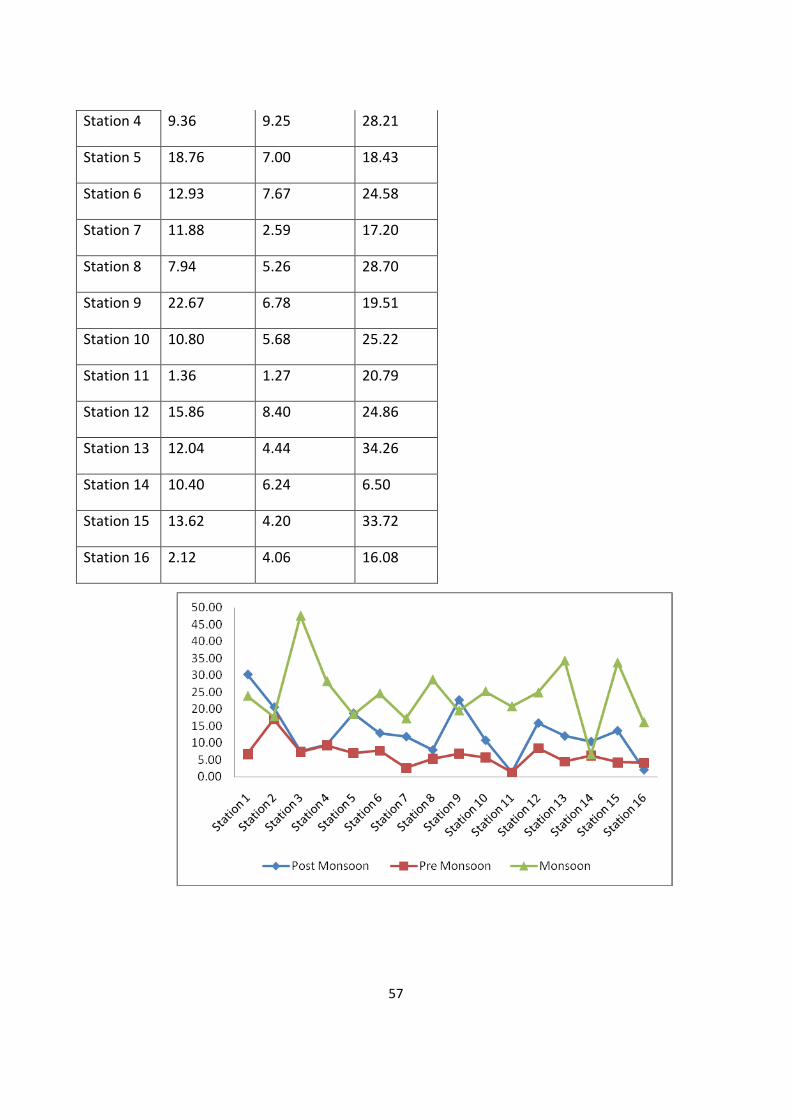
Station 4 9.36 9.25 28.21
Station 5 18.76 7.00 18.43
Station 6 12.93 7.67 24.58
Station 7 11.88 2.59 17.20
Station 8 7.94 5.26 28.70
Station 9 22.67 6.78 19.51
Station 10 10.80 5.68 25.22
Station 11 1.36 1.27 20.79
Station 12 15.86 8.40 24.86
Station 13 12.04 4.44 34.26
Station 14 10.40 6.24 6.50
Station 15 13.62 4.20 33.72
Station 16 2.12 4.06 16.08
57
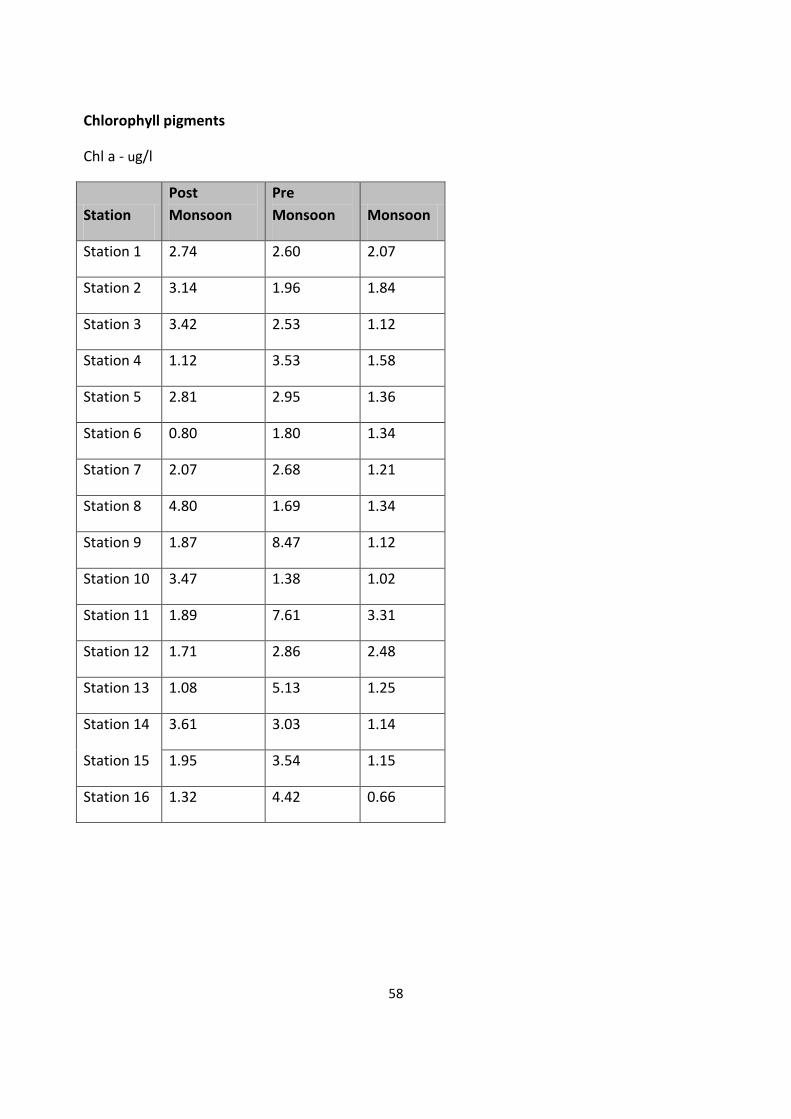
Chlorophyll pigments
Chl a - ug/l
Station Post Monsoon
Pre Monsoon Monsoon
Station 1 2.74 2.60 2.07
Station 2 3.14 1.96 1.84
Station 3 3.42 2.53 1.12
Station 4 1.12 3.53 1.58
Station 5 2.81 2.95 1.36
Station 6 0.80 1.80 1.34
Station 7 2.07 2.68 1.21
Station 8 4.80 1.69 1.34
Station 9 1.87 8.47 1.12
Station 10 3.47 1.38 1.02
Station 11 1.89 7.61 3.31
Station 12 1.71 2.86 2.48
Station 13 1.08 5.13 1.25
Station 14 3.61 3.03 1.14
Station 15 1.95 3.54 1.15
Station 16 1.32 4.42 0.66
58
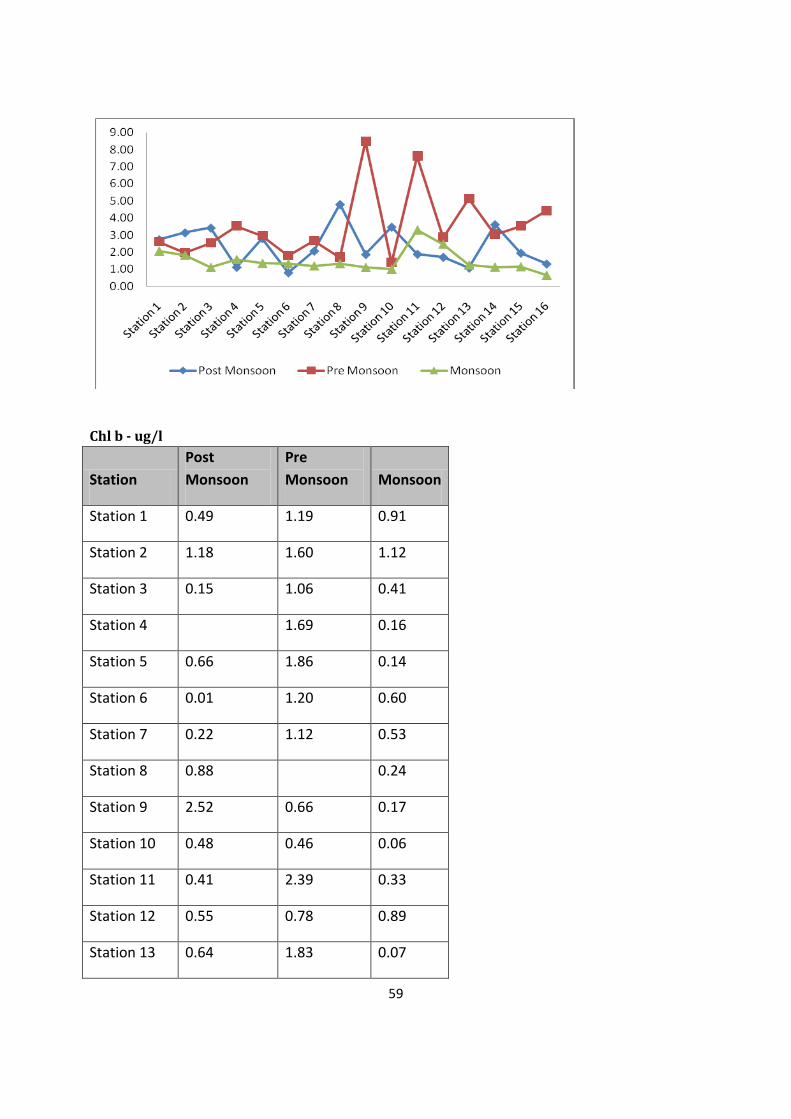
Chl b - ug/l
Station Post Monsoon
Pre Monsoon Monsoon
Station 1 0.49 1.19 0.91
Station 2 1.18 1.60 1.12
Station 3 0.15 1.06 0.41
Station 4 1.69 0.16
Station 5 0.66 1.86 0.14
Station 6 0.01 1.20 0.60
Station 7 0.22 1.12 0.53
Station 8 0.88 0.24
Station 9 2.52 0.66 0.17
Station 10 0.48 0.46 0.06
Station 11 0.41 2.39 0.33
Station 12 0.55 0.78 0.89
Station 13 0.64 1.83 0.07
59
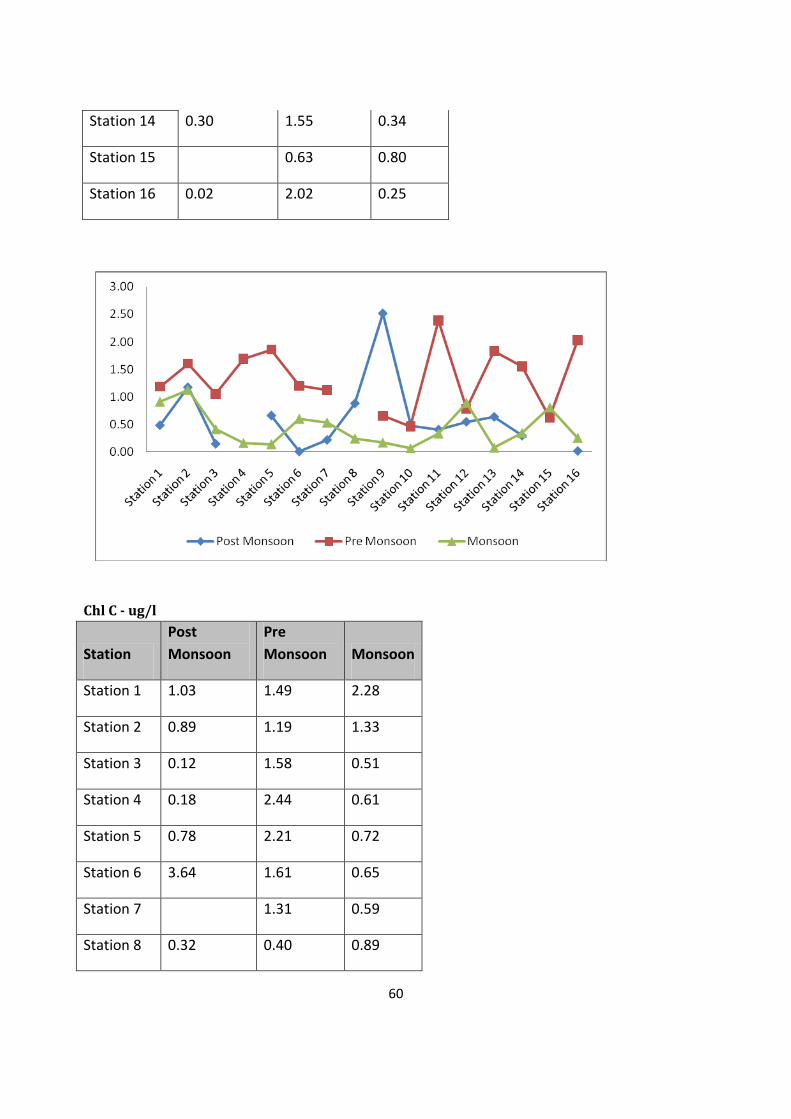
Station 14 0.30 1.55 0.34
Station 15 0.63 0.80
Station 16 0.02 2.02 0.25
Chl C - ug/l
Station Post Monsoon
Pre Monsoon Monsoon
Station 1 1.03 1.49 2.28
Station 2 0.89 1.19 1.33
Station 3 0.12 1.58 0.51
Station 4 0.18 2.44 0.61
Station 5 0.78 2.21 0.72
Station 6 3.64 1.61 0.65
Station 7 1.31 0.59
Station 8 0.32 0.40 0.89
60
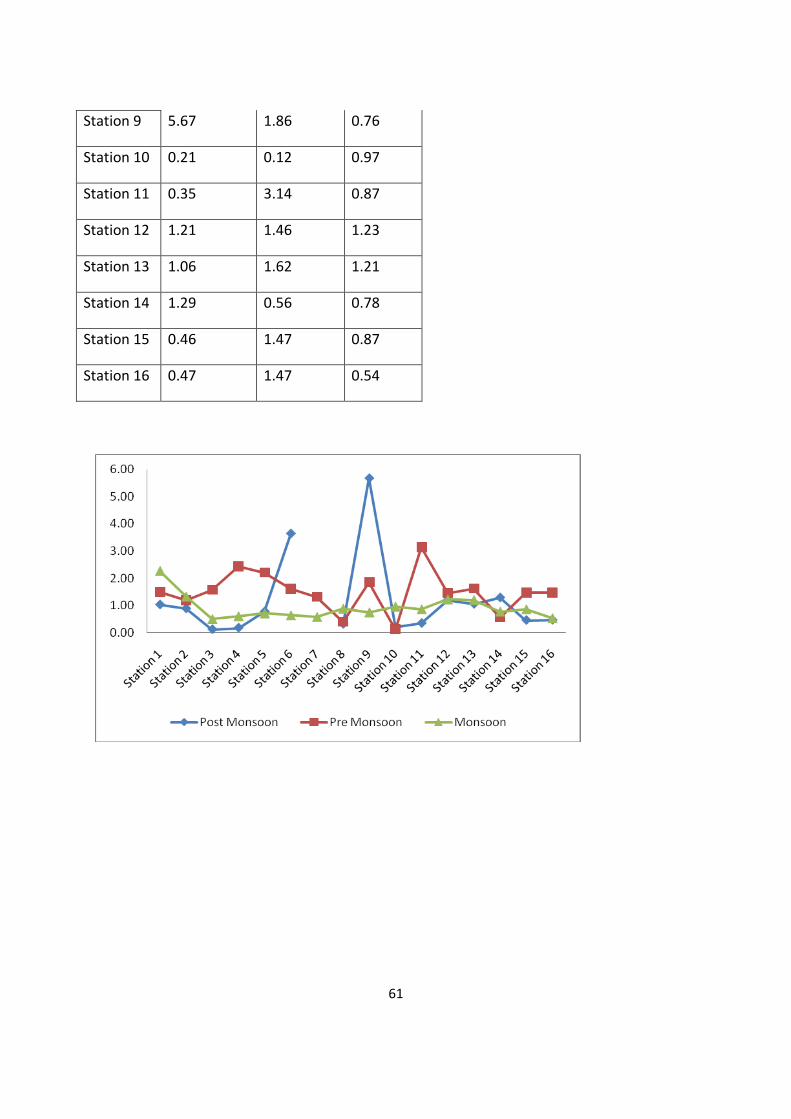
Station 9 5.67 1.86 0.76
Station 10 0.21 0.12 0.97
Station 11 0.35 3.14 0.87
Station 12 1.21 1.46 1.23
Station 13 1.06 1.62 1.21
Station 14 1.29 0.56 0.78
Station 15 0.46 1.47 0.87
Station 16 0.47 1.47 0.54
61
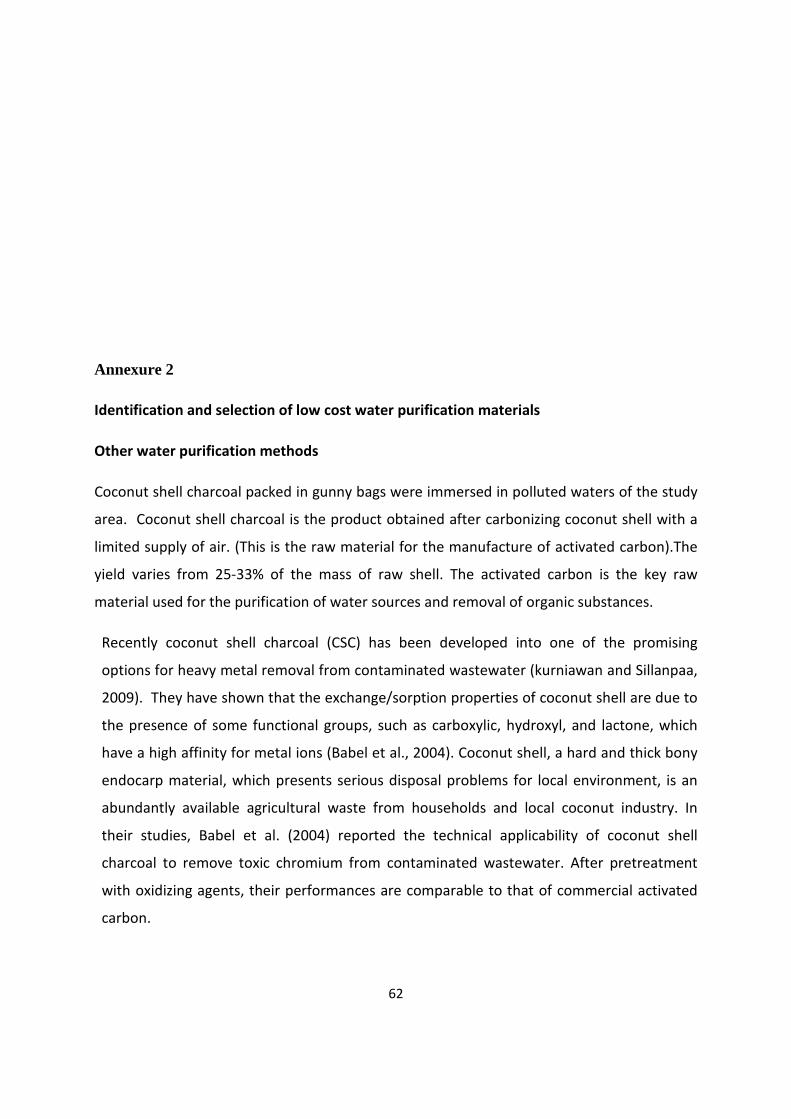
Annexure 2
Identification and selection of low cost water purification materials
Other water purification methods
Coconut shell charcoal packed in gunny bags were immersed in polluted waters of the study
area. Coconut shell charcoal is the product obtained after carbonizing coconut shell with a
limited supply of air. (This is the raw material for the manufacture of activated carbon).The
yield varies from 25-33% of the mass of raw shell. The activated carbon is the key raw
material used for the purification of water sources and removal of organic substances.
Recently coconut shell charcoal (CSC) has been developed into one of the promising
options for heavy metal removal from contaminated wastewater (kurniawan and Sillanpaa,
2009). They have shown that the exchange/sorption properties of coconut shell are due to
the presence of some functional groups, such as carboxylic, hydroxyl, and lactone, which
have a high affinity for metal ions (Babel et al., 2004). Coconut shell, a hard and thick bony
endocarp material, which presents serious disposal problems for local environment, is an
abundantly available agricultural waste from households and local coconut industry. In
their studies, Babel et al. (2004) reported the technical applicability of coconut shell
charcoal to remove toxic chromium from contaminated wastewater. After pretreatment
with oxidizing agents, their performances are comparable to that of commercial activated
carbon.
62
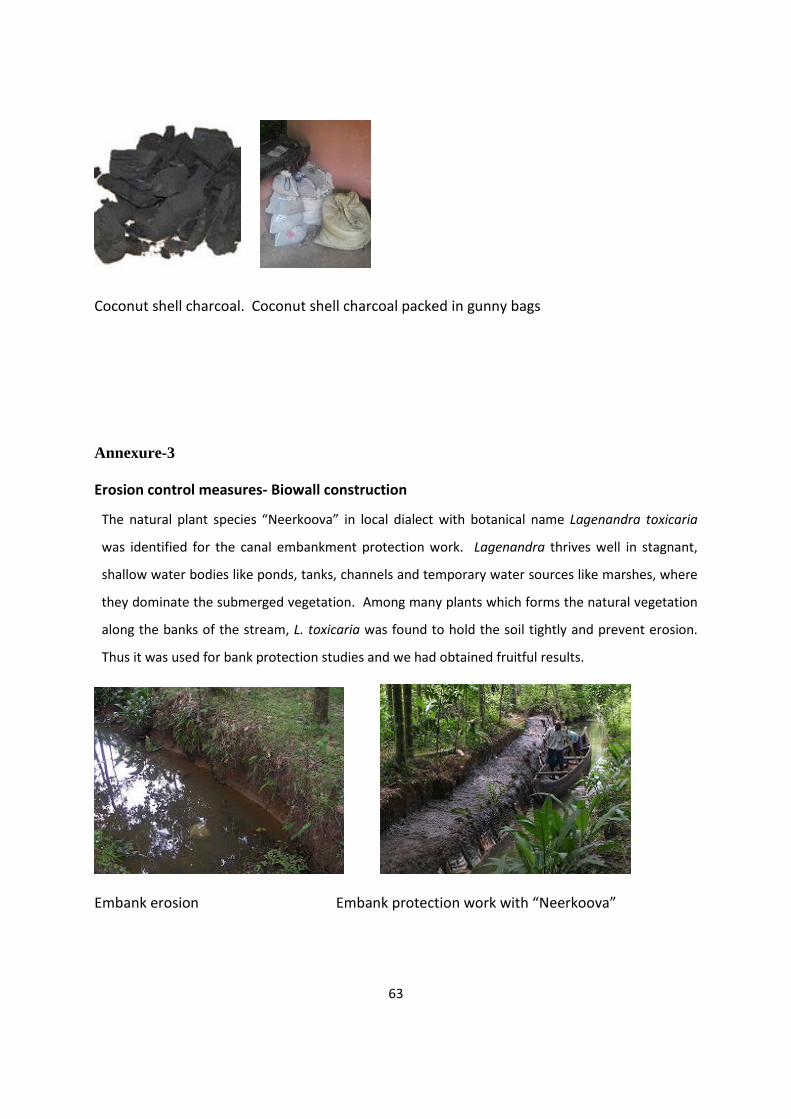
Coconut shell charcoal. Coconut shell charcoal packed in gunny bags
Annexure-3
Erosion control measures- Biowall construction
The natural plant species “Neerkoova” in local dialect with botanical name Lagenandra toxicaria
was identified for the canal embankment protection work. Lagenandra thrives well in stagnant,
shallow water bodies like ponds, tanks, channels and temporary water sources like marshes, where
they dominate the submerged vegetation. Among many plants which forms the natural vegetation
along the banks of the stream, L. toxicaria was found to hold the soil tightly and prevent erosion.
Thus it was used for bank protection studies and we had obtained fruitful results.
Embank erosion Embank protection work with “Neerkoova”
63
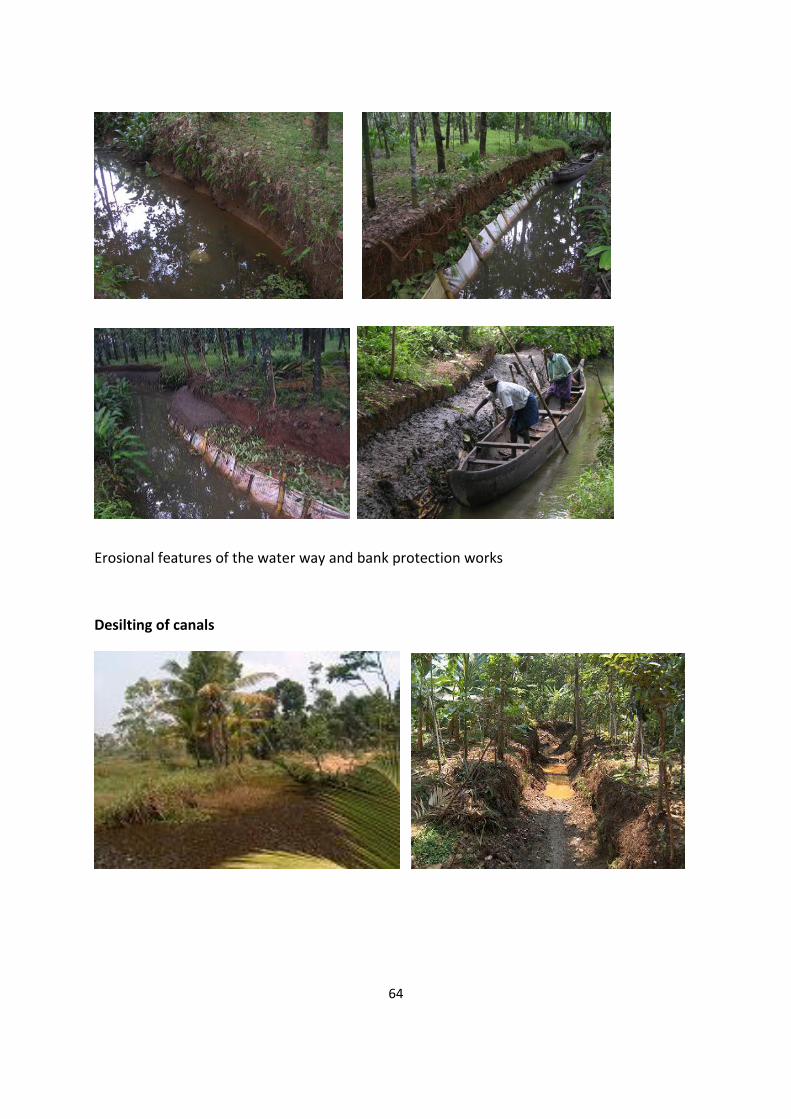
Erosional features of the water way and bank protection works
Desilting of canals
64
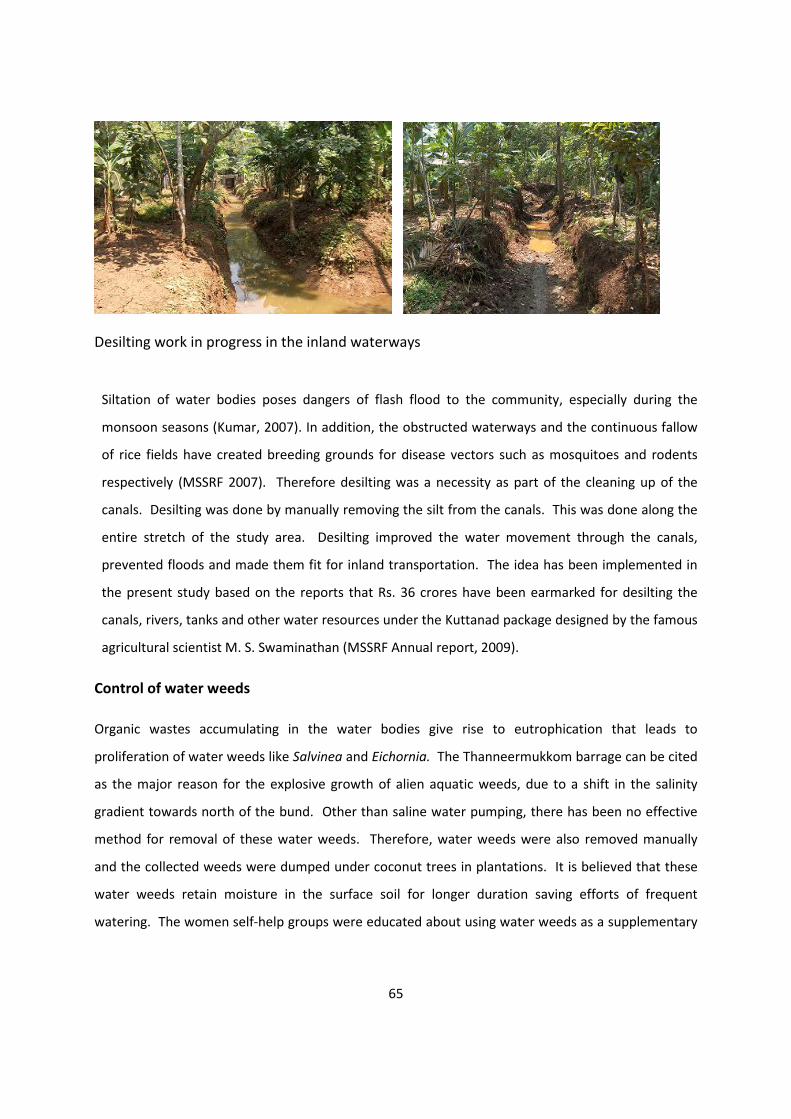
Desilting work in progress in the inland waterways
Siltation of water bodies poses dangers of flash flood to the community, especially during the
monsoon seasons (Kumar, 2007). In addition, the obstructed waterways and the continuous fallow
of rice fields have created breeding grounds for disease vectors such as mosquitoes and rodents
respectively (MSSRF 2007). Therefore desilting was a necessity as part of the cleaning up of the
canals. Desilting was done by manually removing the silt from the canals. This was done along the
entire stretch of the study area. Desilting improved the water movement through the canals,
prevented floods and made them fit for inland transportation. The idea has been implemented in
the present study based on the reports that Rs. 36 crores have been earmarked for desilting the
canals, rivers, tanks and other water resources under the Kuttanad package designed by the famous
agricultural scientist M. S. Swaminathan (MSSRF Annual report, 2009).
Control of water weeds
Organic wastes accumulating in the water bodies give rise to eutrophication that leads to
proliferation of water weeds like Salvinea and Eichornia. The Thanneermukkom barrage can be cited
as the major reason for the explosive growth of alien aquatic weeds, due to a shift in the salinity
gradient towards north of the bund. Other than saline water pumping, there has been no effective
method for removal of these water weeds. Therefore, water weeds were also removed manually
and the collected weeds were dumped under coconut trees in plantations. It is believed that these
water weeds retain moisture in the surface soil for longer duration saving efforts of frequent
watering. The women self-help groups were educated about using water weeds as a supplementary
65
substrate in addition to hay for the cultivation of mushrooms, but the study remained at the
experimental level itself.
Annexure 4 Phytoremediation
Phytoremediation was tried as a low cost method for water purification. Phytoremediation is the use
of living green plants for in situ risk reduction and/or removal of contaminants from contaminated
soil, water, sediments, and air. One of the main advantages of Phytoremediation is that of its
relatively low cost compared to other remedial methods. Vetiver System was first developed by the
World Bank for soil and water conservation and now being used in over 100 countries. In this study
also, Vetiver grass was cultivated and transplanted into the polluted canals. This was selected on the
basis of the review on Vetiver system ecotechnology for water quality improvement and
66
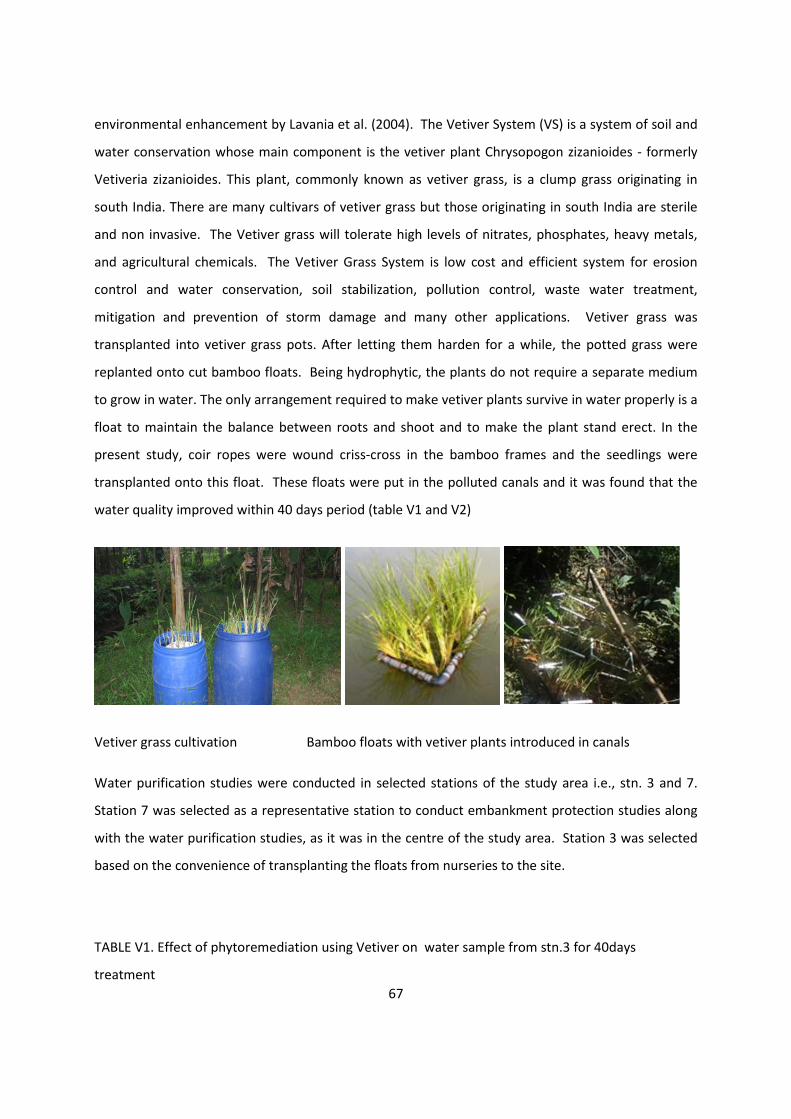
environmental enhancement by Lavania et al. (2004). The Vetiver System (VS) is a system of soil and
water conservation whose main component is the vetiver plant Chrysopogon zizanioides - formerly
Vetiveria zizanioides. This plant, commonly known as vetiver grass, is a clump grass originating in
south India. There are many cultivars of vetiver grass but those originating in south India are sterile
and non invasive. The Vetiver grass will tolerate high levels of nitrates, phosphates, heavy metals,
and agricultural chemicals. The Vetiver Grass System is low cost and efficient system for erosion
control and water conservation, soil stabilization, pollution control, waste water treatment,
mitigation and prevention of storm damage and many other applications. Vetiver grass was
transplanted into vetiver grass pots. After letting them harden for a while, the potted grass were
replanted onto cut bamboo floats. Being hydrophytic, the plants do not require a separate medium
to grow in water. The only arrangement required to make vetiver plants survive in water properly is a
float to maintain the balance between roots and shoot and to make the plant stand erect. In the
present study, coir ropes were wound criss-cross in the bamboo frames and the seedlings were
transplanted onto this float. These floats were put in the polluted canals and it was found that the
water quality improved within 40 days period (table V1 and V2)
Vetiver grass cultivation Bamboo floats with vetiver plants introduced in canals
Water purification studies were conducted in selected stations of the study area i.e., stn. 3 and 7.
Station 7 was selected as a representative station to conduct embankment protection studies along
with the water purification studies, as it was in the centre of the study area. Station 3 was selected
based on the convenience of transplanting the floats from nurseries to the site.
TABLE V1. Effect of phytoremediation using Vetiver on water sample from stn.3 for 40days
treatment 67
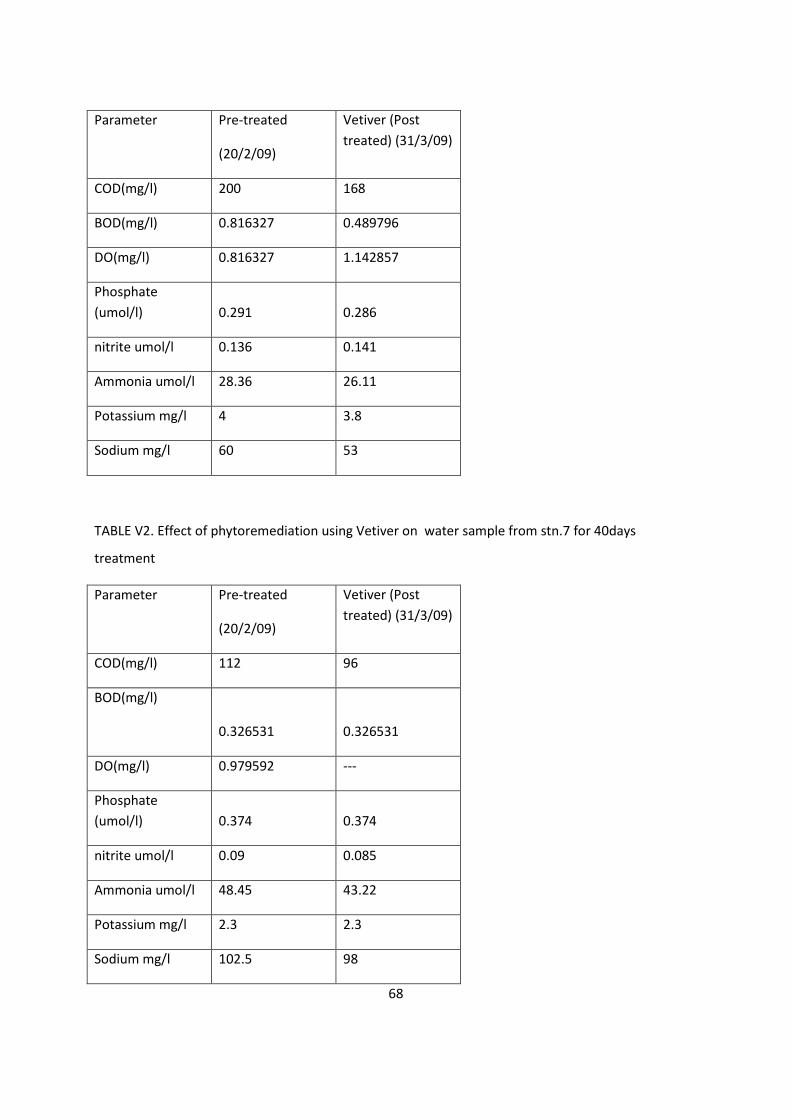
Parameter Pre-treated
(20/2/09)
Vetiver (Post treated) (31/3/09)
COD(mg/l) 200 168
BOD(mg/l) 0.816327 0.489796
DO(mg/l) 0.816327 1.142857
Phosphate (umol/l) 0.291 0.286
nitrite umol/l 0.136 0.141
Ammonia umol/l 28.36 26.11
Potassium mg/l 4 3.8
Sodium mg/l 60 53
TABLE V2. Effect of phytoremediation using Vetiver on water sample from stn.7 for 40days
treatment
Parameter Pre-treated
(20/2/09)
Vetiver (Post treated) (31/3/09)
COD(mg/l) 112 96
BOD(mg/l)
0.326531
0.326531
DO(mg/l) 0.979592 ---
Phosphate (umol/l) 0.374 0.374
nitrite umol/l 0.09 0.085
Ammonia umol/l 48.45 43.22
Potassium mg/l 2.3 2.3
Sodium mg/l 102.5 98
68

Annexure 5
Awareness campaigns
Total of 4 awareness campaigns were conducted in the study area against the indiscriminate
dumping of wastes and highlighting the need to protect the water.
69
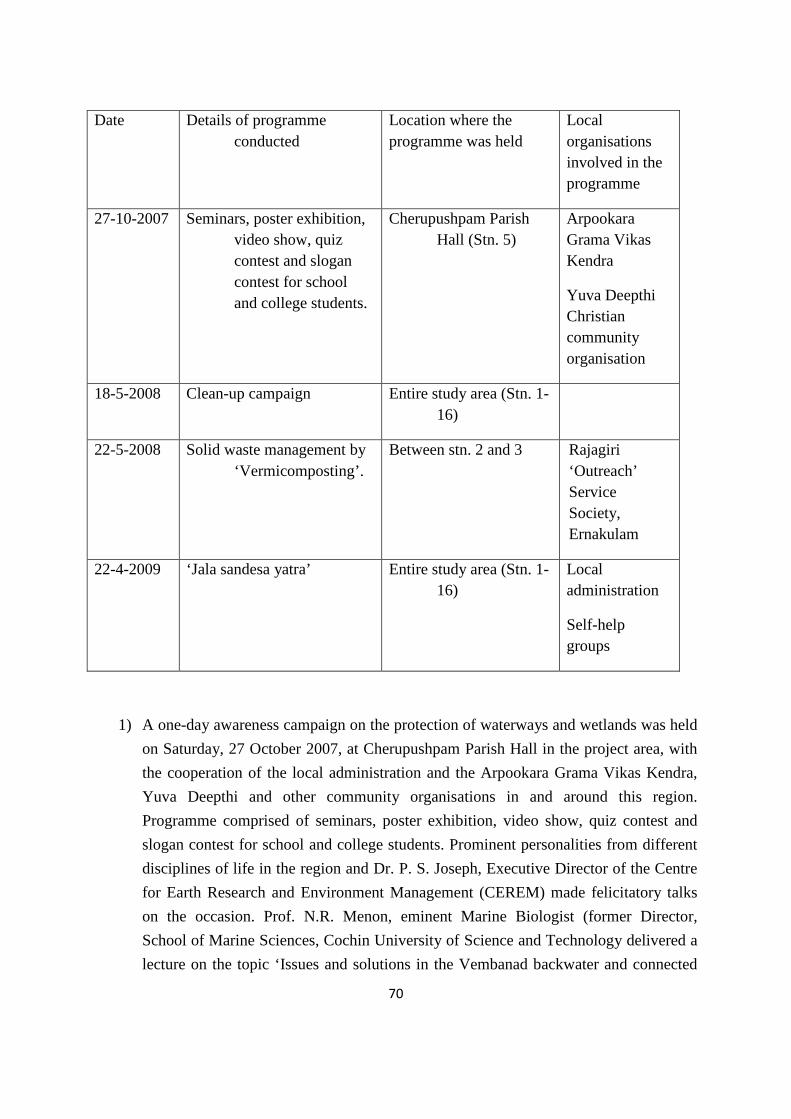
Date Details of programme conducted
Location where the programme was held
Local organisations involved in the programme
27-10-2007 Seminars, poster exhibition, video show, quiz contest and slogan contest for school and college students.
Cherupushpam Parish Hall (Stn. 5)
Arpookara Grama Vikas Kendra
Yuva Deepthi Christian community organisation
18-5-2008 Clean-up campaign Entire study area (Stn. 1-16)
22-5-2008 Solid waste management by ‘Vermicomposting’.
Between stn. 2 and 3 Rajagiri ‘Outreach’ Service Society, Ernakulam
22-4-2009 ‘Jala sandesa yatra’ Entire study area (Stn. 1-16)
Local administration
Self-help groups
1) A one-day awareness campaign on the protection of waterways and wetlands was held on Saturday, 27 October 2007, at Cherupushpam Parish Hall in the project area, with the cooperation of the local administration and the Arpookara Grama Vikas Kendra, Yuva Deepthi and other community organisations in and around this region. Programme comprised of seminars, poster exhibition, video show, quiz contest and slogan contest for school and college students. Prominent personalities from different disciplines of life in the region and Dr. P. S. Joseph, Executive Director of the Centre for Earth Research and Environment Management (CEREM) made felicitatory talks on the occasion. Prof. N.R. Menon, eminent Marine Biologist (former Director, School of Marine Sciences, Cochin University of Science and Technology delivered a lecture on the topic ‘Issues and solutions in the Vembanad backwater and connected
70
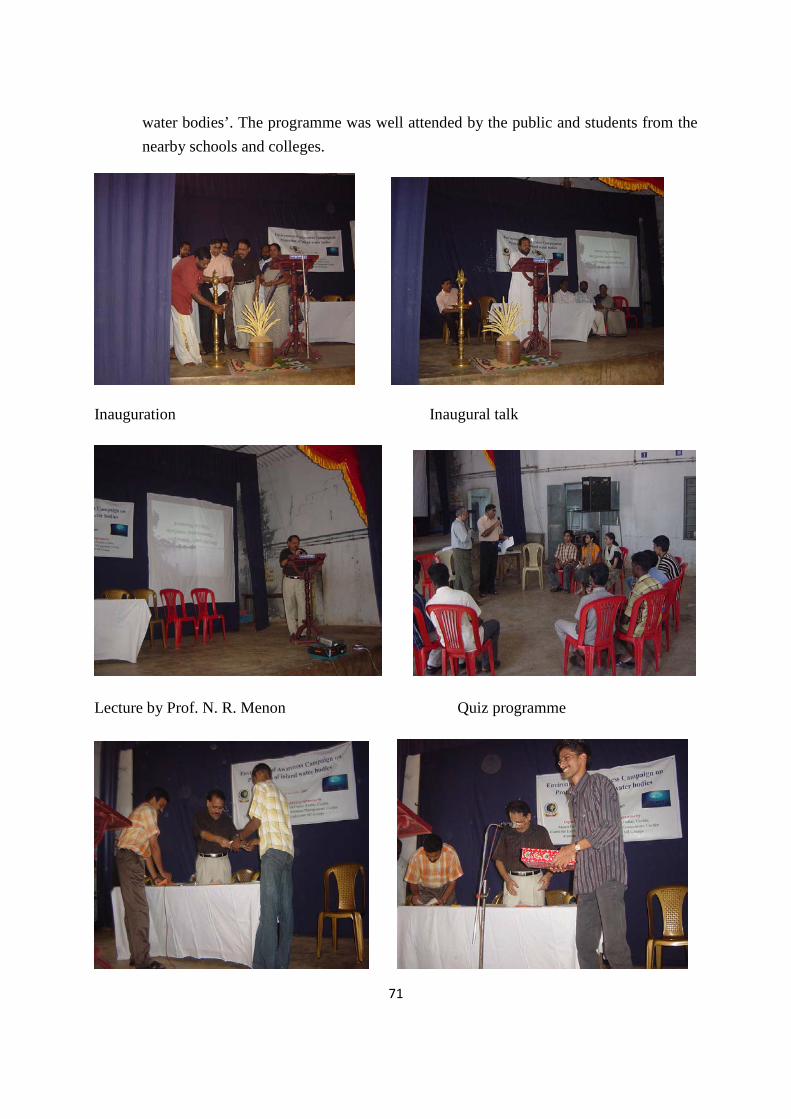
water bodies’. The programme was well attended by the public and students from the nearby schools and colleges.
Inauguration Inaugural talk
Lecture by Prof. N. R. Menon Quiz programme
71
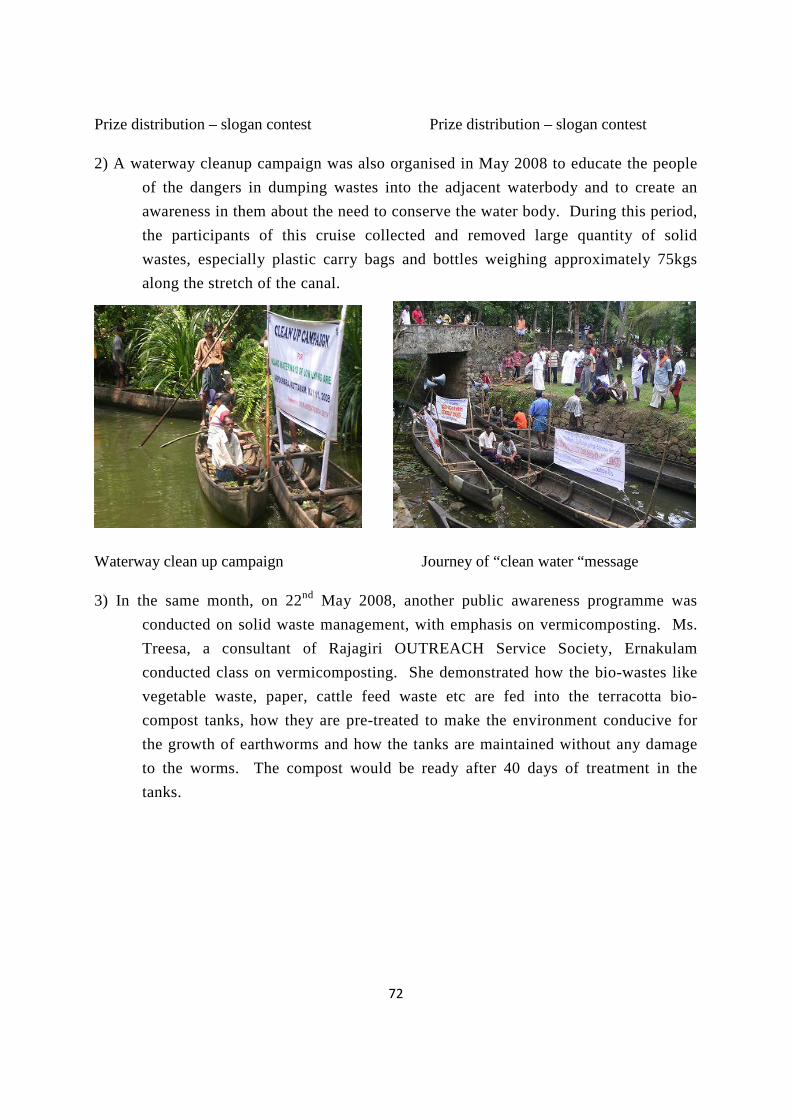
Prize distribution – slogan contest Prize distribution – slogan contest
2) A waterway cleanup campaign was also organised in May 2008 to educate the people of the dangers in dumping wastes into the adjacent waterbody and to create an awareness in them about the need to conserve the water body. During this period, the participants of this cruise collected and removed large quantity of solid wastes, especially plastic carry bags and bottles weighing approximately 75kgs along the stretch of the canal.
Waterway clean up campaign Journey of “clean water “message
3) In the same month, on 22nd May 2008, another public awareness programme was conducted on solid waste management, with emphasis on vermicomposting. Ms. Treesa, a consultant of Rajagiri OUTREACH Service Society, Ernakulam conducted class on vermicomposting. She demonstrated how the bio-wastes like vegetable waste, paper, cattle feed waste etc are fed into the terracotta bio-compost tanks, how they are pre-treated to make the environment conducive for the growth of earthworms and how the tanks are maintained without any damage to the worms. The compost would be ready after 40 days of treatment in the tanks.
72
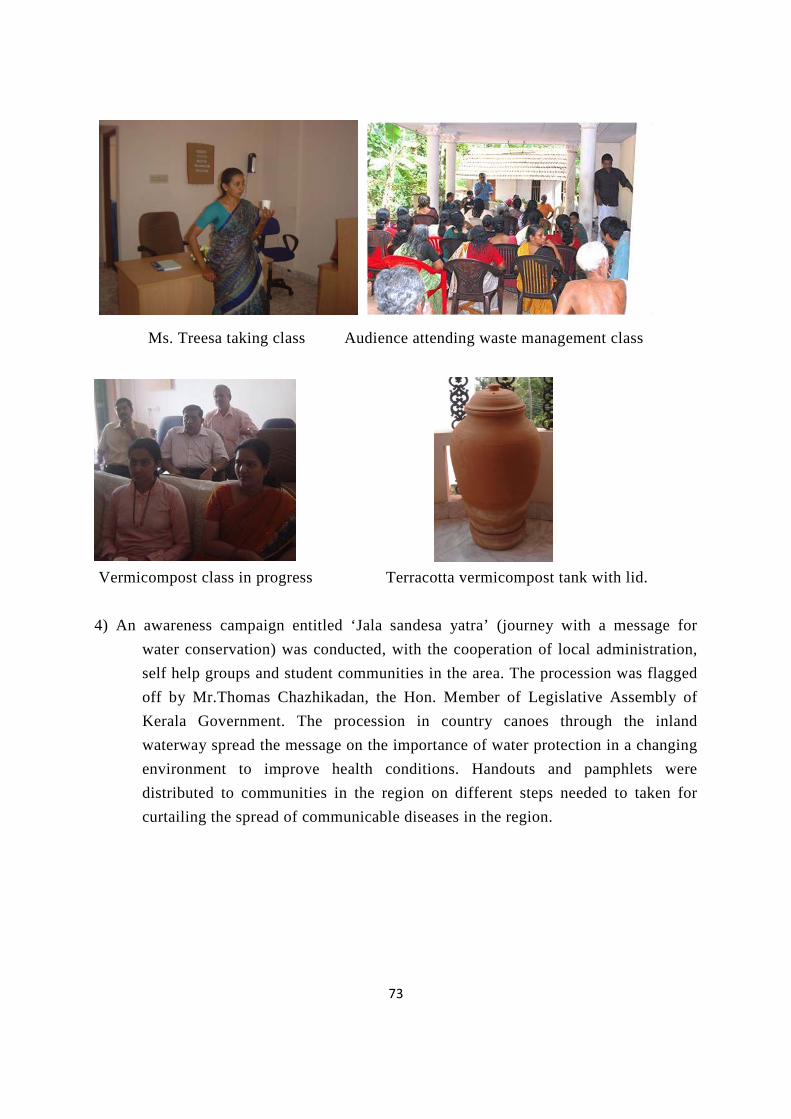
Ms. Treesa taking class Audience attending waste management class
Vermicompost class in progress Terracotta vermicompost tank with lid. 4) An awareness campaign entitled ‘Jala sandesa yatra’ (journey with a message for
water conservation) was conducted, with the cooperation of local administration, self help groups and student communities in the area. The procession was flagged off by Mr.Thomas Chazhikadan, the Hon. Member of Legislative Assembly of Kerala Government. The procession in country canoes through the inland waterway spread the message on the importance of water protection in a changing environment to improve health conditions. Handouts and pamphlets were distributed to communities in the region on different steps needed to taken for curtailing the spread of communicable diseases in the region.
73
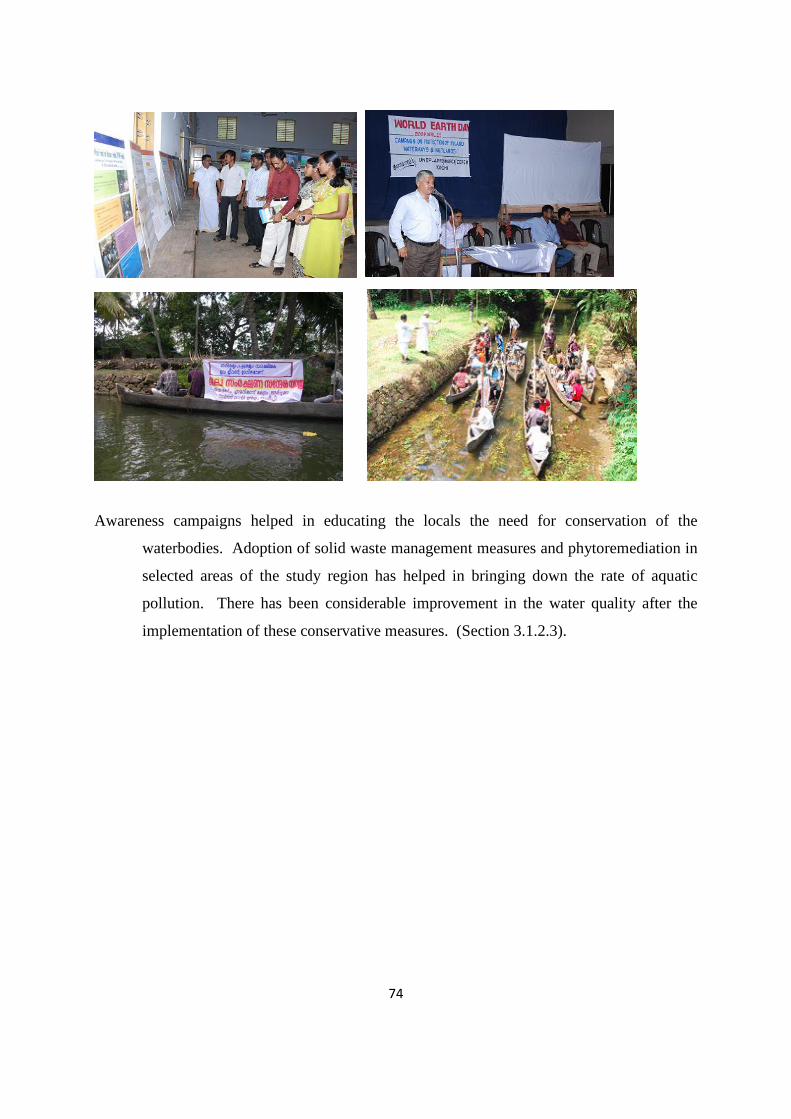
Awareness campaigns helped in educating the locals the need for conservation of the
waterbodies. Adoption of solid waste management measures and phytoremediation in
selected areas of the study region has helped in bringing down the rate of aquatic
pollution. There has been considerable improvement in the water quality after the
implementation of these conservative measures. (Section 3.1.2.3).
74
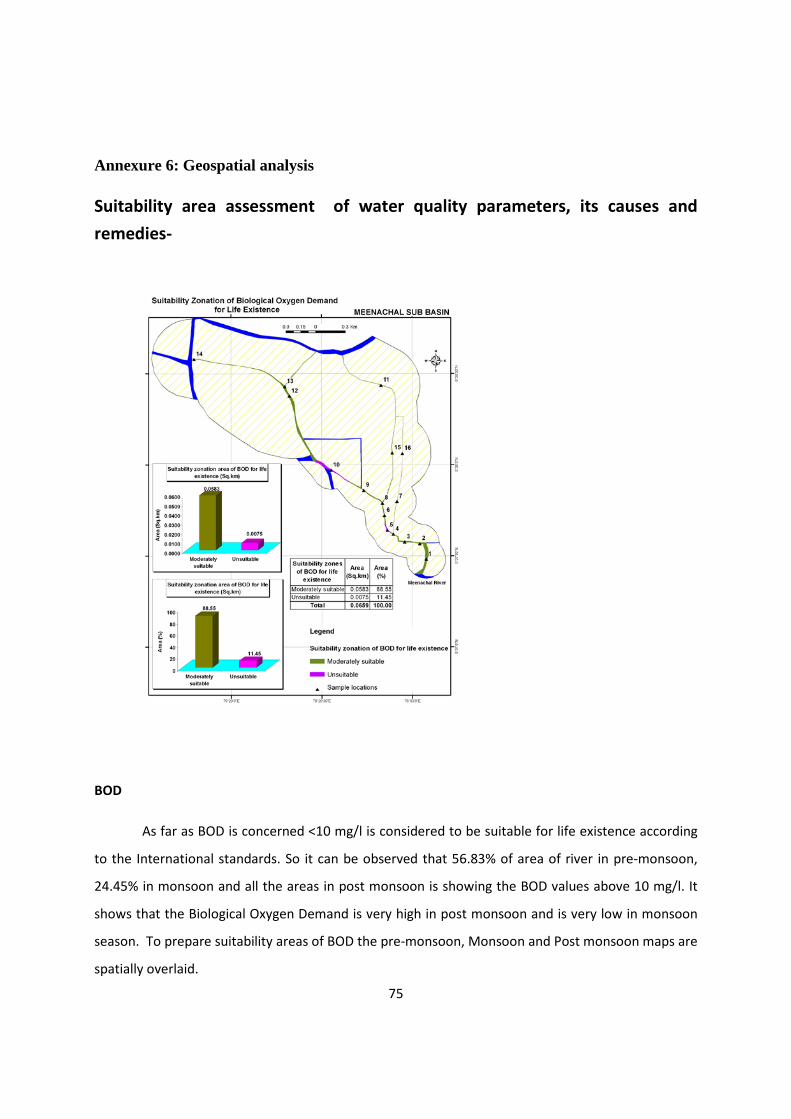
Annexure 6: Geospatial analysis
Suitability area assessment of water quality parameters, its causes and remedies-
BOD
As far as BOD is concerned <10 mg/l is considered to be suitable for life existence according
to the International standards. So it can be observed that 56.83% of area of river in pre-monsoon,
24.45% in monsoon and all the areas in post monsoon is showing the BOD values above 10 mg/l. It
shows that the Biological Oxygen Demand is very high in post monsoon and is very low in monsoon
season. To prepare suitability areas of BOD the pre-monsoon, Monsoon and Post monsoon maps are
spatially overlaid.
75
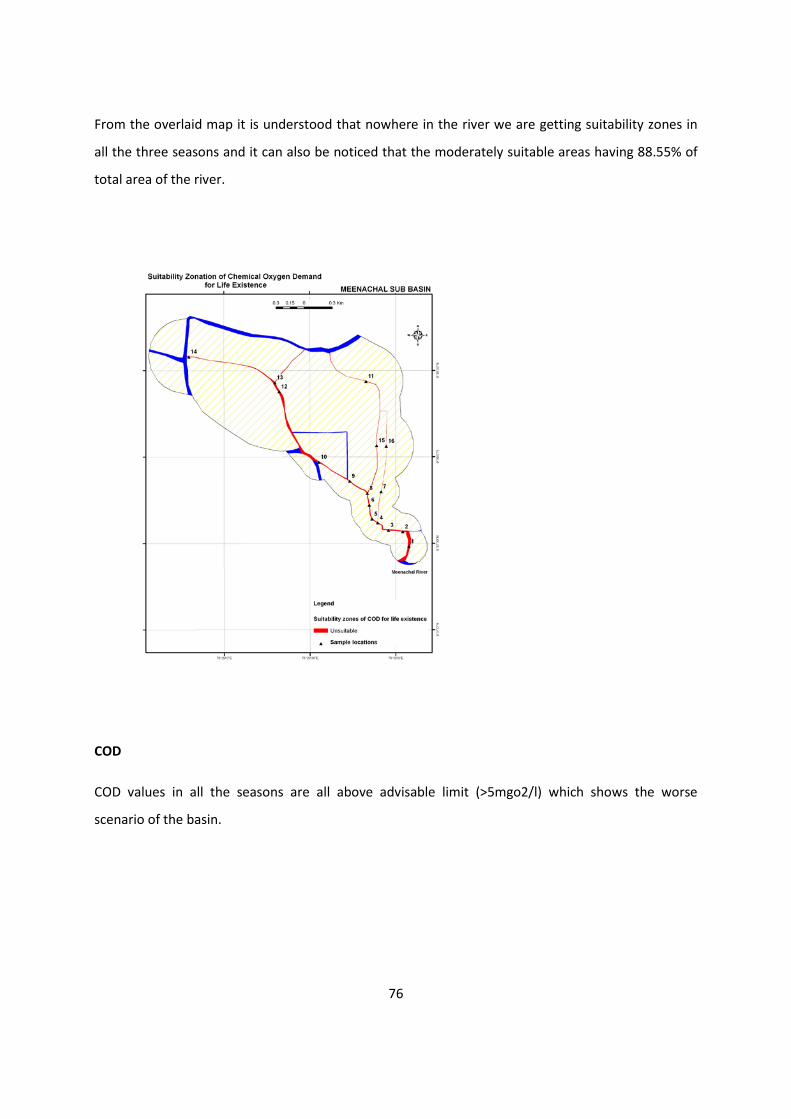
From the overlaid map it is understood that nowhere in the river we are getting suitability zones in
all the three seasons and it can also be noticed that the moderately suitable areas having 88.55% of
total area of the river.
COD
COD values in all the seasons are all above advisable limit (>5mgo2/l) which shows the worse
scenario of the basin.
76
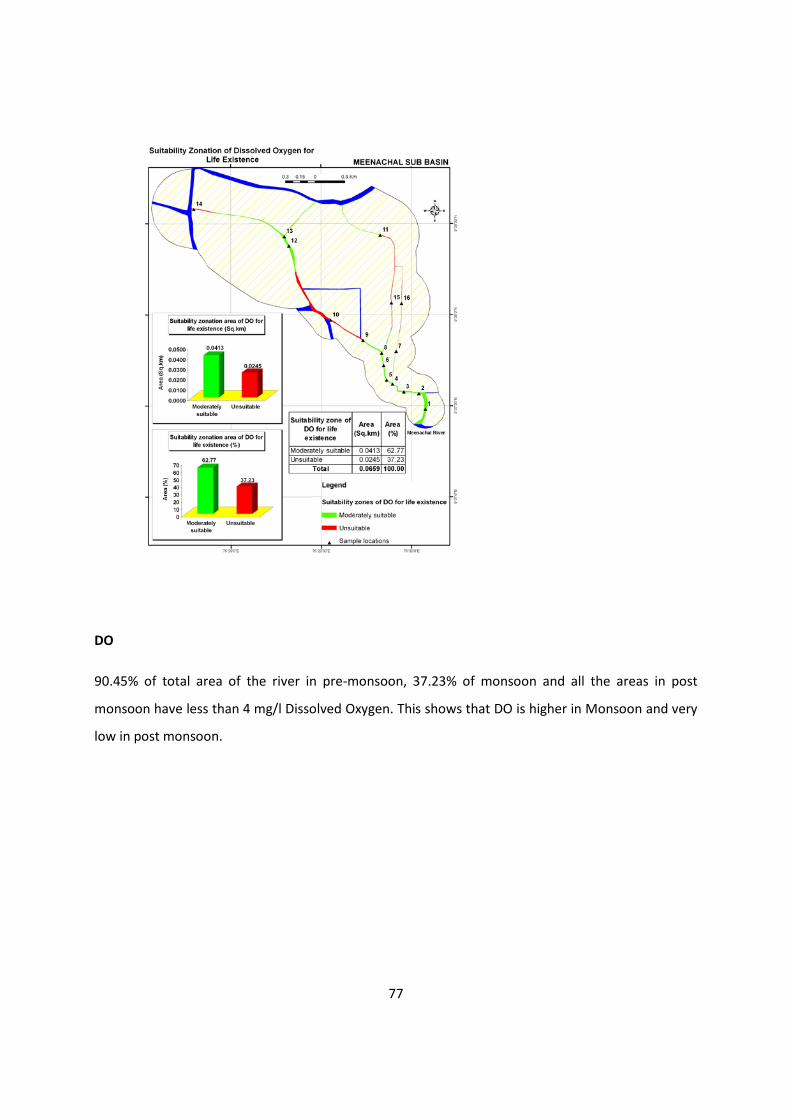
DO
90.45% of total area of the river in pre-monsoon, 37.23% of monsoon and all the areas in post
monsoon have less than 4 mg/l Dissolved Oxygen. This shows that DO is higher in Monsoon and very
low in post monsoon.
77
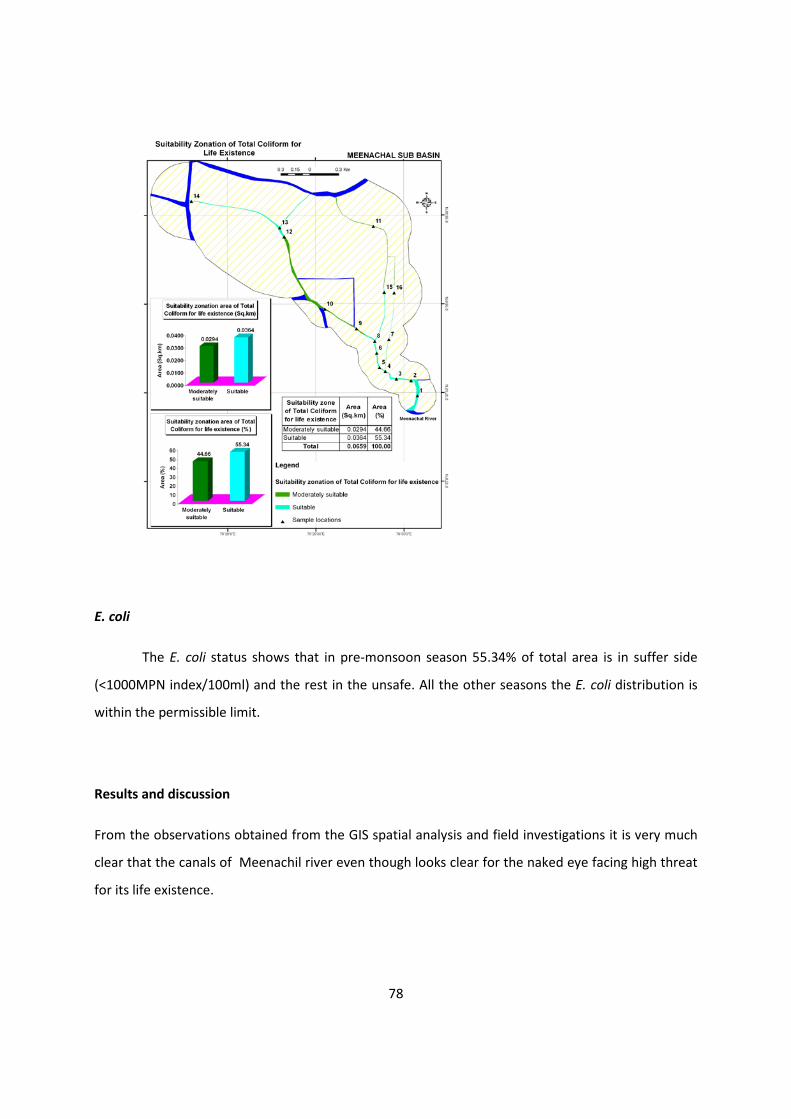
E. coli
The E. coli status shows that in pre-monsoon season 55.34% of total area is in suffer side
(<1000MPN index/100ml) and the rest in the unsafe. All the other seasons the E. coli distribution is
within the permissible limit.
Results and discussion
From the observations obtained from the GIS spatial analysis and field investigations it is very much
clear that the canals of Meenachil river even though looks clear for the naked eye facing high threat
for its life existence.
78
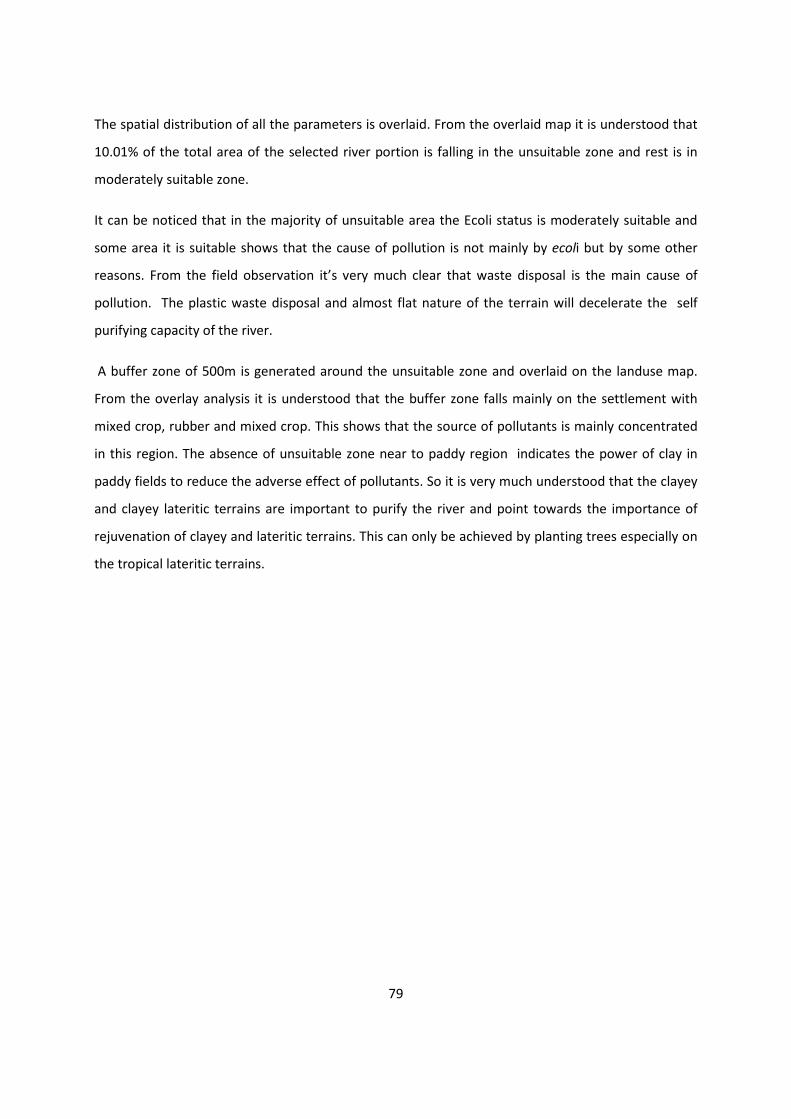
The spatial distribution of all the parameters is overlaid. From the overlaid map it is understood that
10.01% of the total area of the selected river portion is falling in the unsuitable zone and rest is in
moderately suitable zone.
It can be noticed that in the majority of unsuitable area the Ecoli status is moderately suitable and
some area it is suitable shows that the cause of pollution is not mainly by ecoli but by some other
reasons. From the field observation it’s very much clear that waste disposal is the main cause of
pollution. The plastic waste disposal and almost flat nature of the terrain will decelerate the self
purifying capacity of the river.
A buffer zone of 500m is generated around the unsuitable zone and overlaid on the landuse map.
From the overlay analysis it is understood that the buffer zone falls mainly on the settlement with
mixed crop, rubber and mixed crop. This shows that the source of pollutants is mainly concentrated
in this region. The absence of unsuitable zone near to paddy region indicates the power of clay in
paddy fields to reduce the adverse effect of pollutants. So it is very much understood that the clayey
and clayey lateritic terrains are important to purify the river and point towards the importance of
rejuvenation of clayey and lateritic terrains. This can only be achieved by planting trees especially on
the tropical lateritic terrains.
79
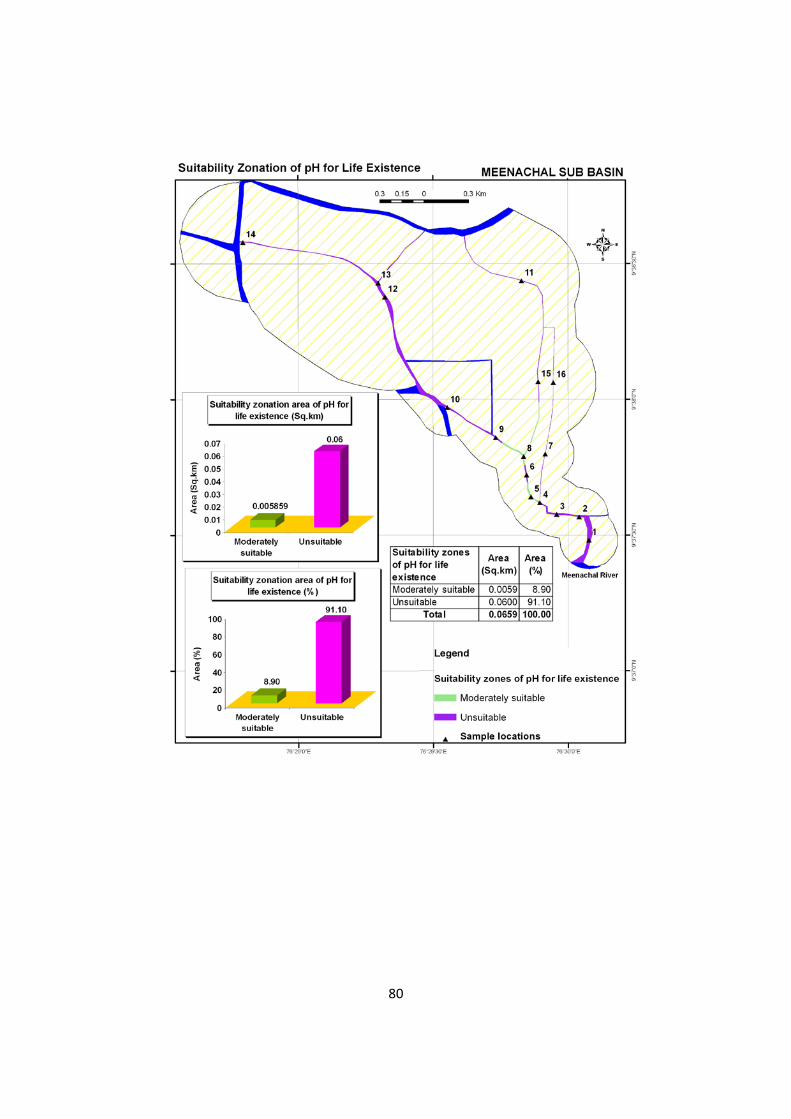
80
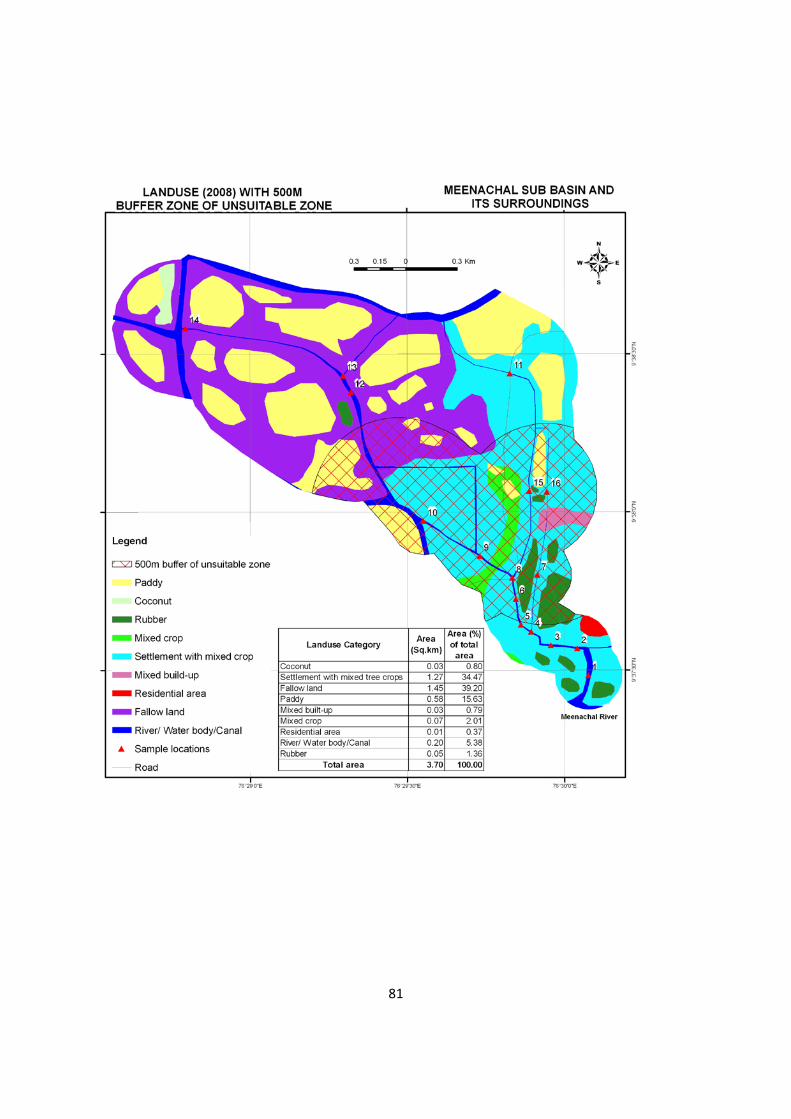
81
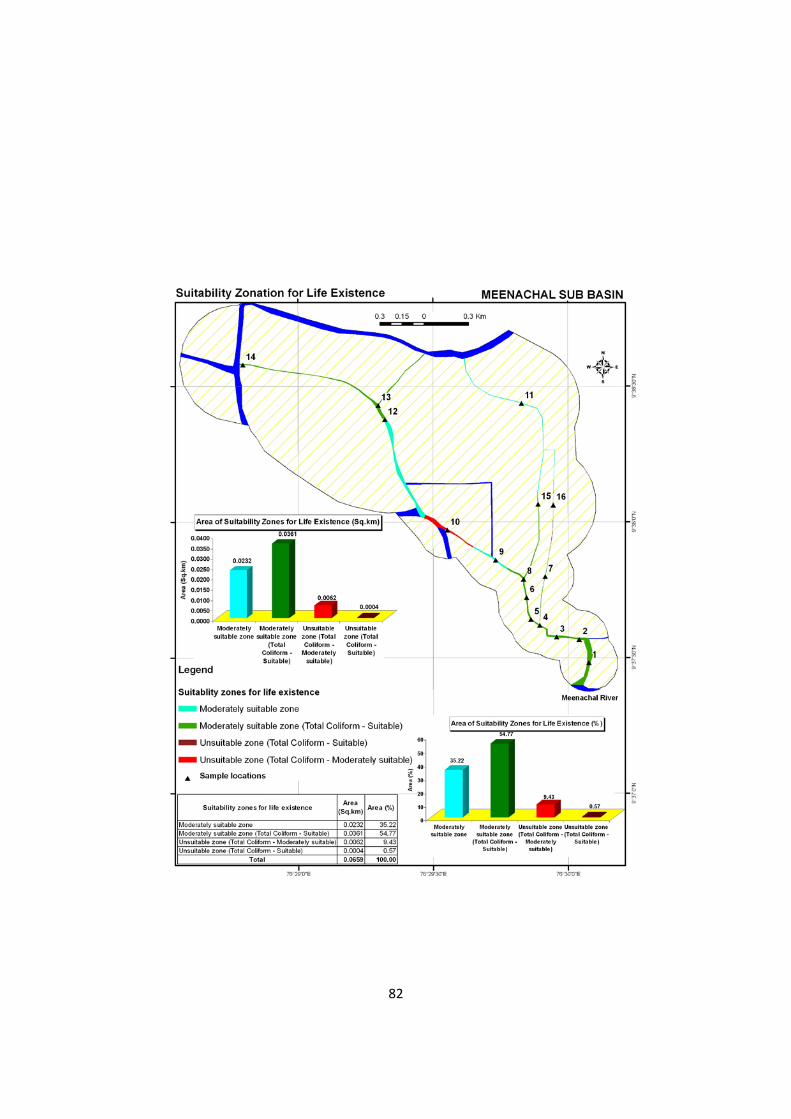
82
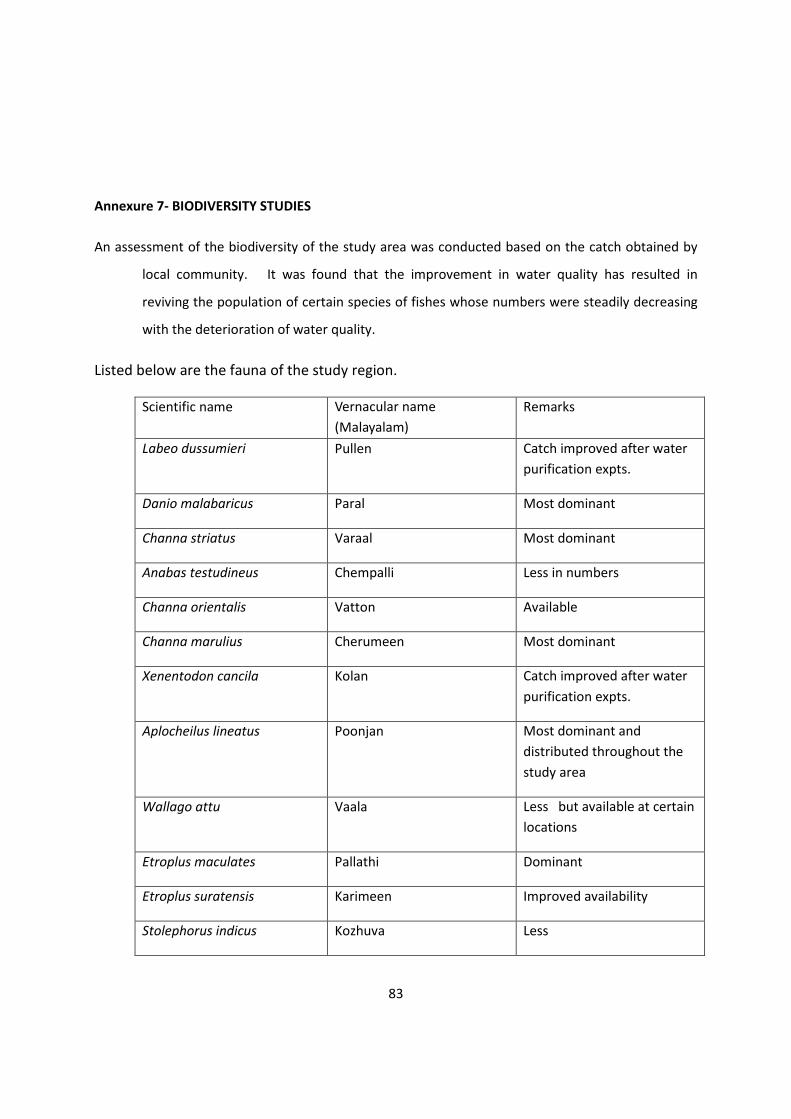
Annexure 7- BIODIVERSITY STUDIES
An assessment of the biodiversity of the study area was conducted based on the catch obtained by
local community. It was found that the improvement in water quality has resulted in
reviving the population of certain species of fishes whose numbers were steadily decreasing
with the deterioration of water quality.
Listed below are the fauna of the study region.
Scientific name Vernacular name (Malayalam)
Remarks
Labeo dussumieri Pullen Catch improved after water purification expts.
Danio malabaricus Paral Most dominant
Channa striatus Varaal Most dominant
Anabas testudineus Chempalli Less in numbers
Channa orientalis Vatton Available
Channa marulius Cherumeen Most dominant
Xenentodon cancila Kolan Catch improved after water purification expts.
Aplocheilus lineatus Poonjan Most dominant and distributed throughout the study area
Wallago attu Vaala Less but available at certain locations
Etroplus maculates Pallathi Dominant
Etroplus suratensis Karimeen Improved availability
Stolephorus indicus Kozhuva Less
83
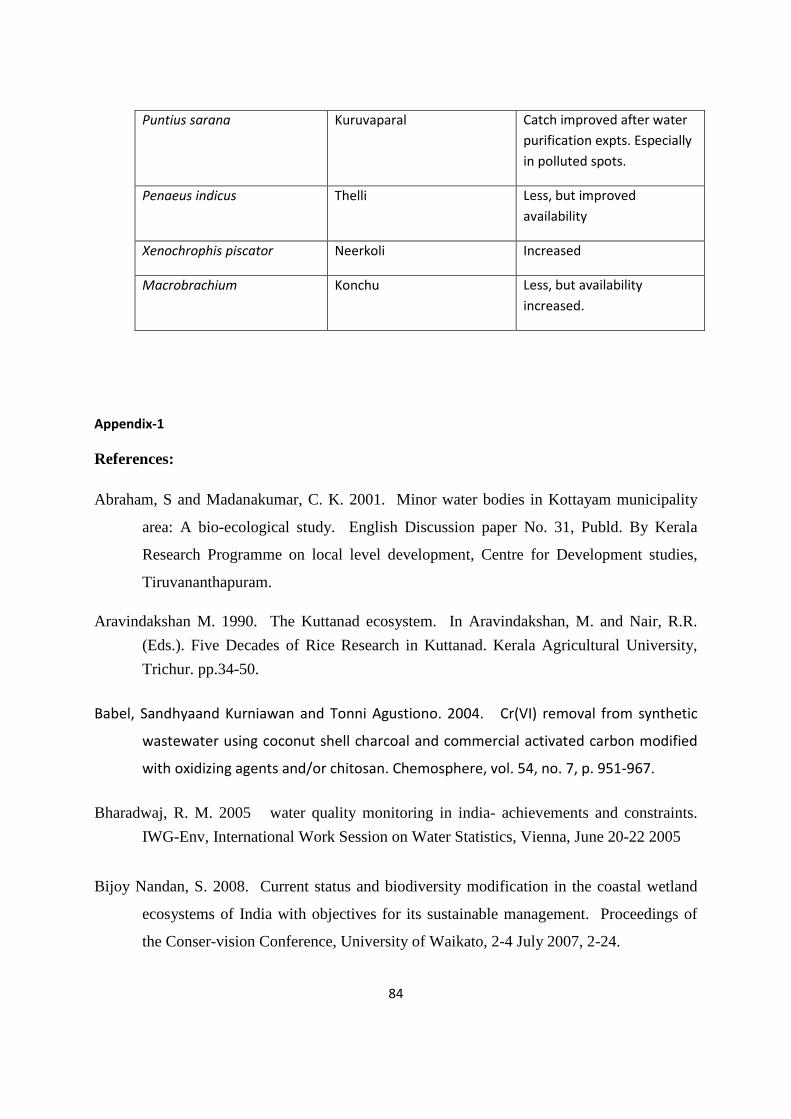
Puntius sarana Kuruvaparal Catch improved after water purification expts. Especially in polluted spots.
Penaeus indicus Thelli Less, but improved availability
Xenochrophis piscator Neerkoli Increased
Macrobrachium Konchu Less, but availability increased.
Appendix-1
References:
Abraham, S and Madanakumar, C. K. 2001. Minor water bodies in Kottayam municipality
area: A bio-ecological study. English Discussion paper No. 31, Publd. By Kerala
Research Programme on local level development, Centre for Development studies,
Tiruvananthapuram.
Aravindakshan M. 1990. The Kuttanad ecosystem. In Aravindakshan, M. and Nair, R.R. (Eds.). Five Decades of Rice Research in Kuttanad. Kerala Agricultural University, Trichur. pp.34-50.
Babel, Sandhyaand Kurniawan and Tonni Agustiono. 2004. Cr(VI) removal from synthetic
wastewater using coconut shell charcoal and commercial activated carbon modified
with oxidizing agents and/or chitosan. Chemosphere, vol. 54, no. 7, p. 951-967.
Bharadwaj, R. M. 2005 water quality monitoring in india- achievements and constraints. IWG-Env, International Work Session on Water Statistics, Vienna, June 20-22 2005
Bijoy Nandan, S. 2008. Current status and biodiversity modification in the coastal wetland
ecosystems of India with objectives for its sustainable management. Proceedings of
the Conser-vision Conference, University of Waikato, 2-4 July 2007, 2-24.
84
Carr, G. M. And Neary J. P. 2006 UNEP GEMS/Water Programme. 2006. Water quality for
ecosystem and human health. Burlington, Canada. http://www.gemswater.org/
Chapman, D. (ed.) 1996. “Water Quality Assessments: A Guide to the Use of Biota, Sediments
and Water.” Environmental Monitoring. Second Edition. UNESCO, WHO, and UNEP.
E&FN Spon, London UK.
CPCB, 2008. Status of water quality in India 2007 - Monitoring of Indian Aquatic Resources Series: MINARS/ 29 /2008-2009. 127 pp.
Dinesh Kumar, P. K. 1997Cochin backwaters: A sad story of manipulation. Ambio 26:249–
260.
Dodds, WK and Oakes, RM. 2004. “A technique for establishing reference nutrient concentrations across watersheds affected by humans.” Limnology and Oceanography Methods 2:333-341.
Gopakumar, R and Takara, K. 2008 Hydrologic Characterization of the Vembanad Wetlands of Kerala, Proceedings of International conference “Uncertainties in Water Resource
Management: causes, technologies and consequences” /WRM-Mon2008, IHP Technical Documents in Hydrology No.1 UNESCO Office, Jakarta 2008 p. 20-33.
Gregory, H. 2003. Morbidity in Kuttanad. Kuttanad Development Problems & Prospects: Selected Papers of the Seminar on Kuttanad Development on January 29, 2003. Published by Aloysian Study Center on Kuttanad.
Hill, V.R. 2003. “Prospects for pathogen reductions in livestock wastewaters: a review.” Critical
Reviews in Environmental Science and Technology 30:187-235.
ICMAM report 2002 Critical habitat information system for Cochin backwaters – Kerala. Ed.
By T. Shunmugaraj and Tune Usha, 31 pp.
IPCC (Intergovernmental Panel on Climate Change). 1995. IPCC Second Assessment: Climate
Change 1995. Intergovernmental Panel on Climate Change.
http://www.ipcc.ch/pub/sa(E).pdf (last accessed July 4, 2006).
85
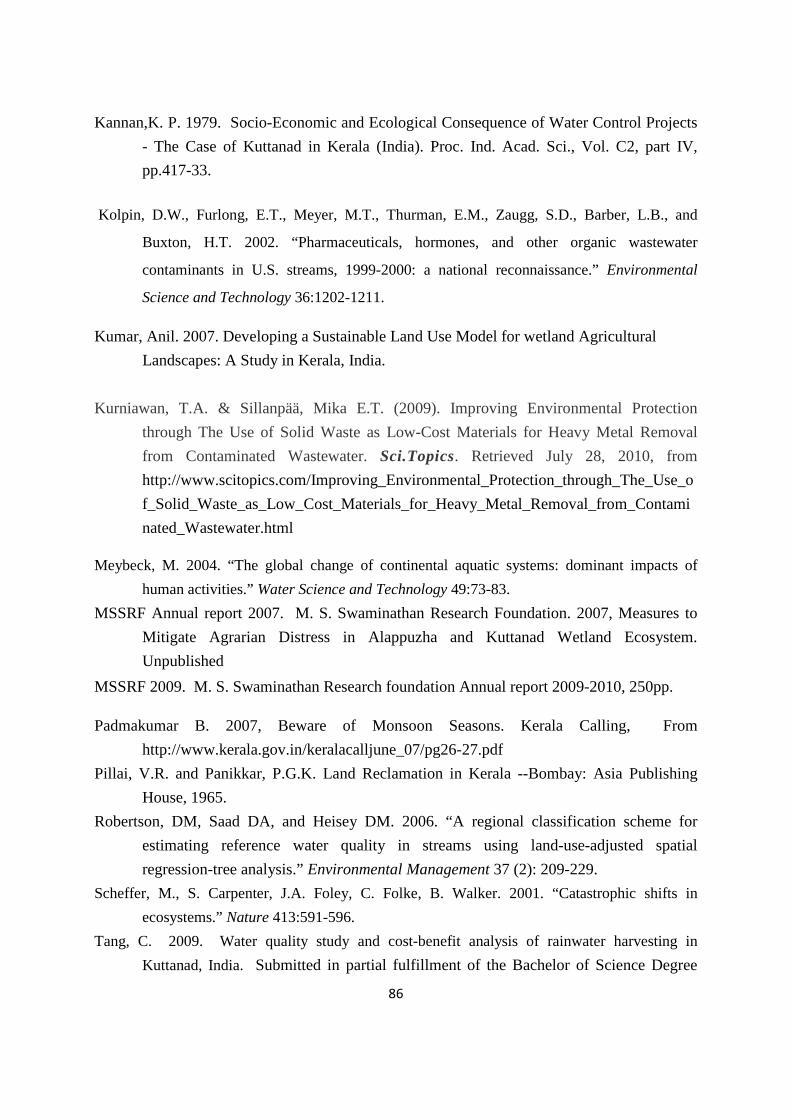
Kannan,K. P. 1979. Socio-Economic and Ecological Consequence of Water Control Projects - The Case of Kuttanad in Kerala (India). Proc. Ind. Acad. Sci., Vol. C2, part IV, pp.417-33.
Kolpin, D.W., Furlong, E.T., Meyer, M.T., Thurman, E.M., Zaugg, S.D., Barber, L.B., and
Buxton, H.T. 2002. “Pharmaceuticals, hormones, and other organic wastewater
contaminants in U.S. streams, 1999-2000: a national reconnaissance.” Environmental
Science and Technology 36:1202-1211.
Kumar, Anil. 2007. Developing a Sustainable Land Use Model for wetland Agricultural Landscapes: A Study in Kerala, India. Kurniawan, T.A. & Sillanpää, Mika E.T. (2009). Improving Environmental Protection
through The Use of Solid Waste as Low-Cost Materials for Heavy Metal Removal from Contaminated Wastewater. Sci.Topics. Retrieved July 28, 2010, from http://www.scitopics.com/Improving_Environmental_Protection_through_The_Use_of_Solid_Waste_as_Low_Cost_Materials_for_Heavy_Metal_Removal_from_Contaminated_Wastewater.html
Meybeck, M. 2004. “The global change of continental aquatic systems: dominant impacts of human activities.” Water Science and Technology 49:73-83.
MSSRF Annual report 2007. M. S. Swaminathan Research Foundation. 2007, Measures to Mitigate Agrarian Distress in Alappuzha and Kuttanad Wetland Ecosystem. Unpublished
MSSRF 2009. M. S. Swaminathan Research foundation Annual report 2009-2010, 250pp.
Padmakumar B. 2007, Beware of Monsoon Seasons. Kerala Calling, From http://www.kerala.gov.in/keralacalljune_07/pg26-27.pdf
Pillai, V.R. and Panikkar, P.G.K. Land Reclamation in Kerala --Bombay: Asia Publishing House, 1965.
Robertson, DM, Saad DA, and Heisey DM. 2006. “A regional classification scheme for estimating reference water quality in streams using land-use-adjusted spatial regression-tree analysis.” Environmental Management 37 (2): 209-229.
Scheffer, M., S. Carpenter, J.A. Foley, C. Folke, B. Walker. 2001. “Catastrophic shifts in ecosystems.” Nature 413:591-596.
Tang, C. 2009. Water quality study and cost-benefit analysis of rainwater harvesting in Kuttanad, India. Submitted in partial fulfillment of the Bachelor of Science Degree
86
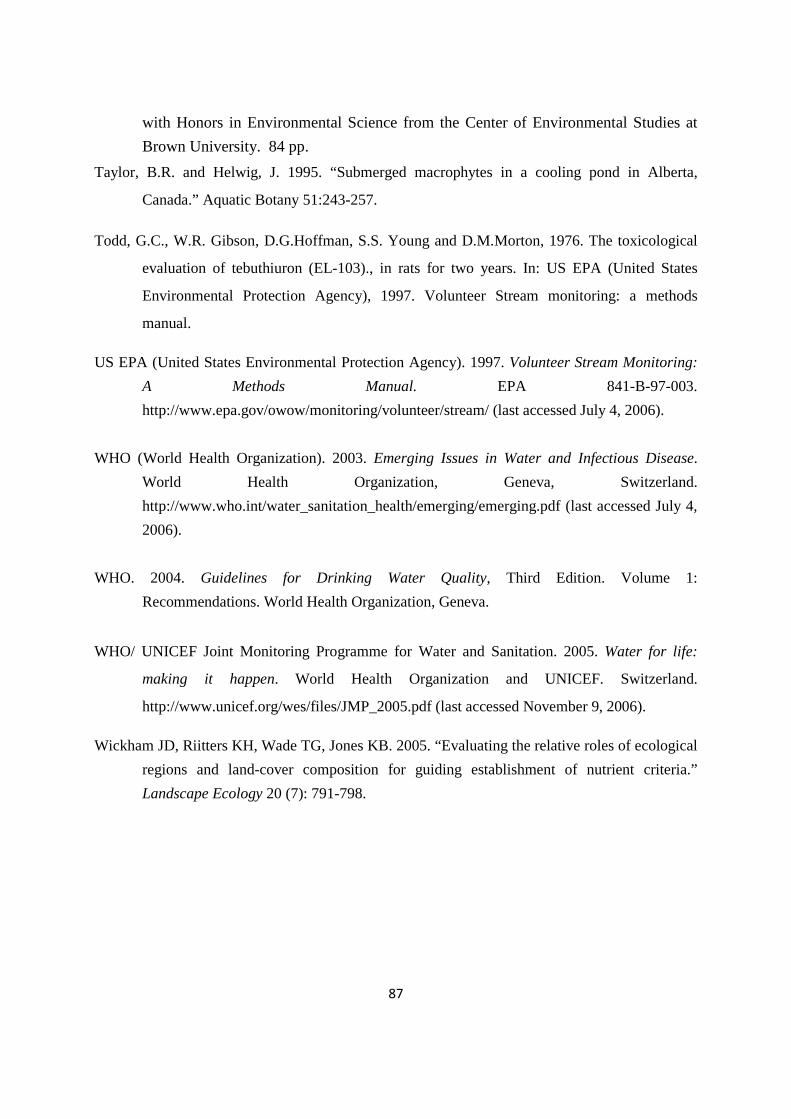
with Honors in Environmental Science from the Center of Environmental Studies at Brown University. 84 pp.
Taylor, B.R. and Helwig, J. 1995. “Submerged macrophytes in a cooling pond in Alberta,
Canada.” Aquatic Botany 51:243-257.
Todd, G.C., W.R. Gibson, D.G.Hoffman, S.S. Young and D.M.Morton, 1976. The toxicological
evaluation of tebuthiuron (EL-103)., in rats for two years. In: US EPA (United States
Environmental Protection Agency), 1997. Volunteer Stream monitoring: a methods
manual.
US EPA (United States Environmental Protection Agency). 1997. Volunteer Stream Monitoring: A Methods Manual. EPA 841-B-97-003. http://www.epa.gov/owow/monitoring/volunteer/stream/ (last accessed July 4, 2006).
WHO (World Health Organization). 2003. Emerging Issues in Water and Infectious Disease.
World Health Organization, Geneva, Switzerland. http://www.who.int/water_sanitation_health/emerging/emerging.pdf (last accessed July 4, 2006).
WHO. 2004. Guidelines for Drinking Water Quality, Third Edition. Volume 1:
Recommendations. World Health Organization, Geneva.
WHO/ UNICEF Joint Monitoring Programme for Water and Sanitation. 2005. Water for life:
making it happen. World Health Organization and UNICEF. Switzerland.
http://www.unicef.org/wes/files/JMP_2005.pdf (last accessed November 9, 2006).
Wickham JD, Riitters KH, Wade TG, Jones KB. 2005. “Evaluating the relative roles of ecological regions and land-cover composition for guiding establishment of nutrient criteria.” Landscape Ecology 20 (7): 791-798.
87
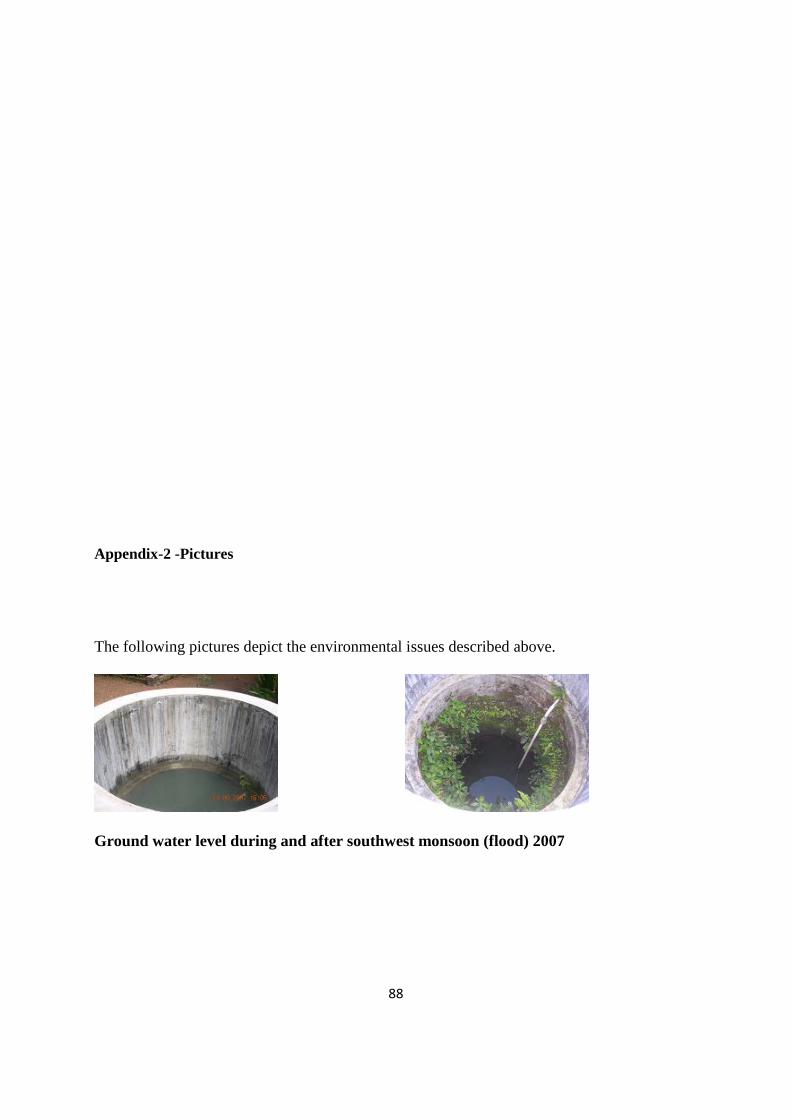
Appendix-2 -Pictures
The following pictures depict the environmental issues described above.
Ground water level during and after southwest monsoon (flood) 2007
88
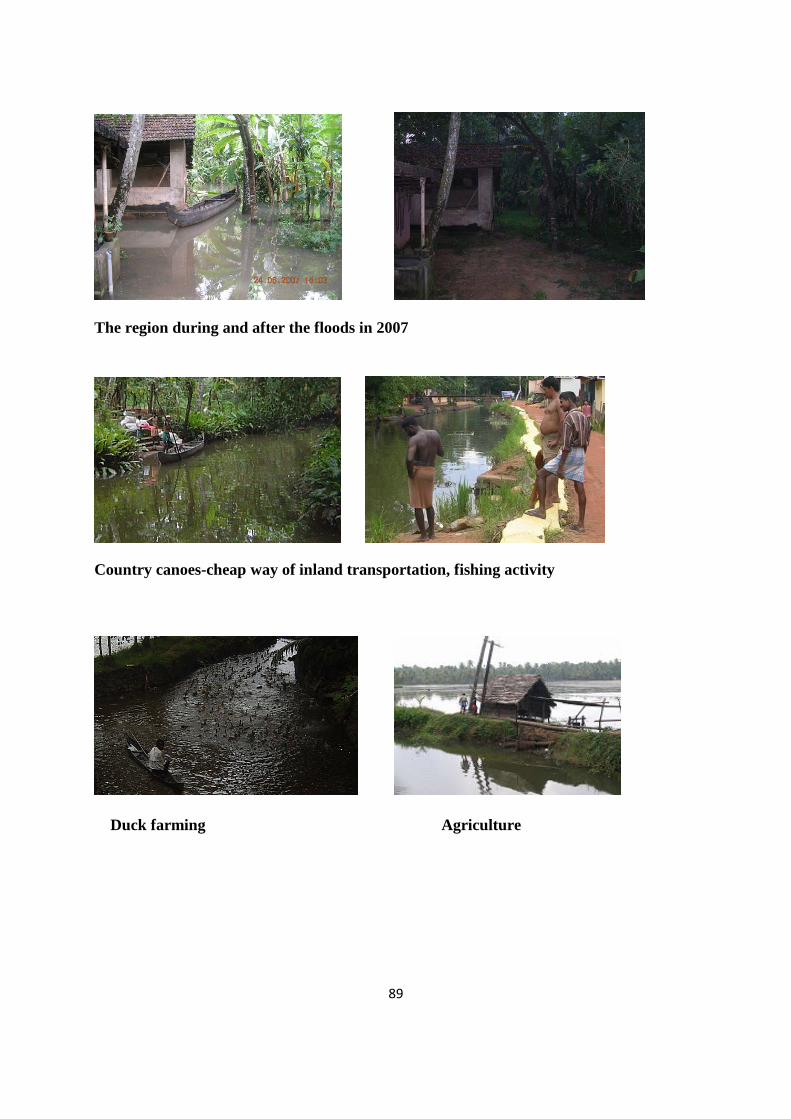
The region during and after the floods in 2007
Country canoes-cheap way of inland transportation, fishing activity
Duck farming Agriculture
89
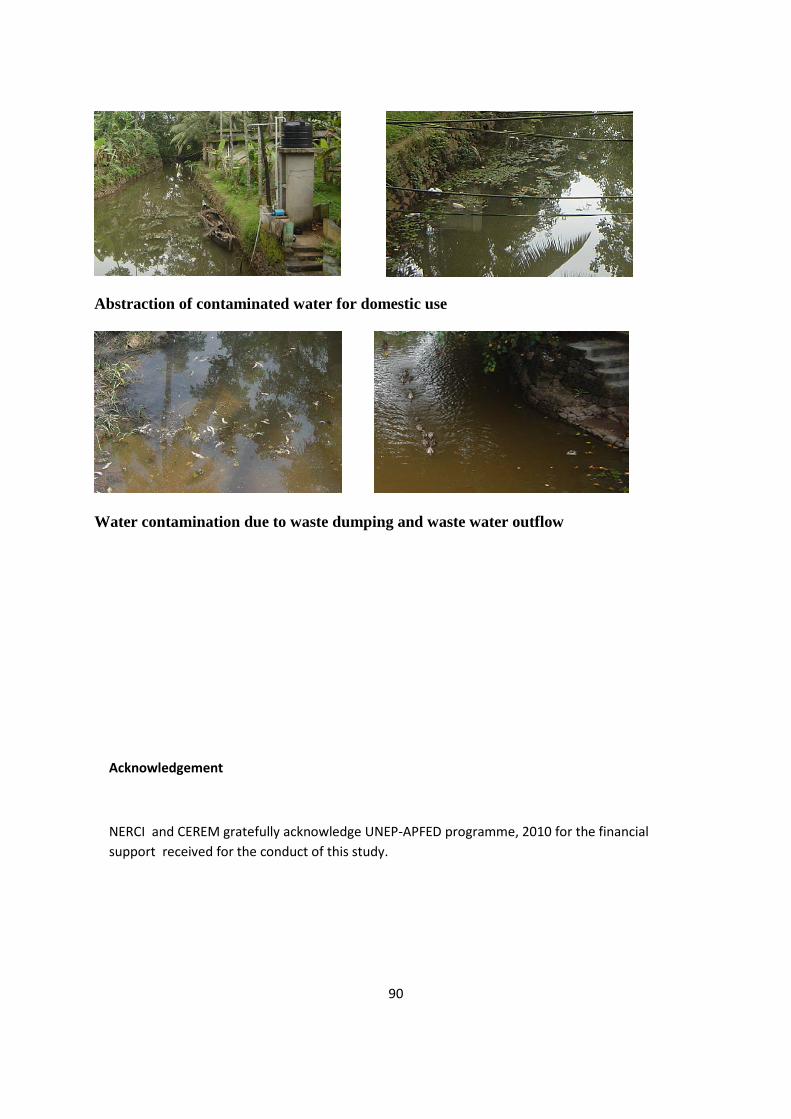
Abstraction of contaminated water for domestic use
Water contamination due to waste dumping and waste water outflow
Acknowledgement
NERCI and CEREM gratefully acknowledge UNEP-APFED programme, 2010 for the financial support received for the conduct of this study.
90
Related Documents