1 Water Quality Conditions in the Cahaba River and Likely Pollutant Sources Robert E. Pitt, Ph.D., P.E., DEE Department of Civil and Environmental Engineering University of Alabama at Birmingham August 9, 2000 Introduction .................................................................................................................................................................................... 2 Water Quality Criteria .................................................................................................................................................................... 3 Water Quality Criteria for the Protection of Fish and Wildlife ............................................................................................ 6 Dissolved Oxygen ................................................................................................................................................................. 6 Bacteria ................................................................................................................................................................................... 9 Hardness ................................................................................................................................................................................. 9 Ammonia ............................................................................................................................................................................... 10 Nitrates .................................................................................................................................................................................. 13 pH .......................................................................................................................................................................................... 14 Phosphate............................................................................................................................................................................. 16 Dissolved Solids, Conductivity, and Chlorides .............................................................................................................. 18 Temperature ......................................................................................................................................................................... 19 Suspended Solids and Turbidity ...................................................................................................................................... 23 Heavy Metals ....................................................................................................................................................................... 25 Water Quality Criteria for the Protection of Human Health............................................................................................... 26 Bacteria ................................................................................................................................................................................. 26 Hardness............................................................................................................................................................................... 27 Nitrates .................................................................................................................................................................................. 27 Dissolved Solids, Conductivity, and Chlorides .............................................................................................................. 28 Toxic Organics ..................................................................................................................................................................... 29 Heavy Metals ....................................................................................................................................................................... 29 Historical Observed Concentrations of Pollutants in the Cahaba River (1970-1990) ......................................................... 30 Upper Cahaba River Water Quality Conditions .................................................................................................................. 30 Temperature ......................................................................................................................................................................... 31 pH .......................................................................................................................................................................................... 34 Hardness............................................................................................................................................................................... 35 Dissolved Oxygen and Biochemical Oxygen Demand................................................................................................... 35 Turbidity and Suspended Solids ...................................................................................................................................... 38 Total Dissolved Solids, Chlorides, and Conductivity ................................................................................................... 39 Fecal Coliform Bacteria ....................................................................................................................................................... 39 Nitrate Nitrogen ................................................................................................................................................................... 40 Ammonia and Kjeldahl Nitrogen....................................................................................................................................... 40 Phosphate............................................................................................................................................................................. 42 Arsenic .................................................................................................................................................................................. 43 Cadmium............................................................................................................................................................................... 43 Chromium .............................................................................................................................................................................. 44

Welcome message from author
This document is posted to help you gain knowledge. Please leave a comment to let me know what you think about it! Share it to your friends and learn new things together.
Transcript
1
Water Quality Conditions in the Cahaba River and Likely Pollutant Sources
Robert E. Pitt, Ph.D., P.E., DEE Department of Civil and Environmental Engineering
University of Alabama at Birmingham
August 9, 2000
Introduction .................................................................................................................................................................................... 2 Water Quality Criteria .................................................................................................................................................................... 3
Water Quality Criteria for the Protection of Fish and Wildlife............................................................................................ 6 Dissolved Oxygen................................................................................................................................................................. 6 Bacteria ................................................................................................................................................................................... 9 Hardness................................................................................................................................................................................. 9 Ammonia............................................................................................................................................................................... 10 Nitrates.................................................................................................................................................................................. 13 pH.......................................................................................................................................................................................... 14 Phosphate............................................................................................................................................................................. 16 Dissolved Solids, Conductivity, and Chlorides.............................................................................................................. 18 Temperature ......................................................................................................................................................................... 19 Suspended Solids and Turbidity ...................................................................................................................................... 23 Heavy Metals ....................................................................................................................................................................... 25
Water Quality Criteria for the Protection of Human Health............................................................................................... 26 Bacteria ................................................................................................................................................................................. 26 Hardness............................................................................................................................................................................... 27 Nitrates.................................................................................................................................................................................. 27 Dissolved Solids, Conductivity, and Chlorides.............................................................................................................. 28 Toxic Organics ..................................................................................................................................................................... 29 Heavy Metals ....................................................................................................................................................................... 29
Historical Observed Concentrations of Pollutants in the Cahaba River (1970-1990)......................................................... 30 Upper Cahaba River Water Quality Conditions.................................................................................................................. 30
Temperature ......................................................................................................................................................................... 31 pH.......................................................................................................................................................................................... 34 Hardness............................................................................................................................................................................... 35 Dissolved Oxygen and Biochemical Oxygen Demand................................................................................................... 35 Turbidity and Suspended Solids ...................................................................................................................................... 38 Total Dissolved Solids, Chlorides, and Conductivity ................................................................................................... 39 Fecal Coliform Bacteria ....................................................................................................................................................... 39 Nitrate Nitrogen................................................................................................................................................................... 40 Ammonia and Kjeldahl Nitrogen....................................................................................................................................... 40 Phosphate............................................................................................................................................................................. 42 Arsenic.................................................................................................................................................................................. 43 Cadmium............................................................................................................................................................................... 43 Chromium.............................................................................................................................................................................. 44
2
Copper................................................................................................................................................................................... 44 Iron ........................................................................................................................................................................................ 45 Lead....................................................................................................................................................................................... 45 Mercury ................................................................................................................................................................................ 47 Zinc........................................................................................................................................................................................ 47 Organic Toxicants ............................................................................................................................................................... 48
Water Quality Conditions at Mid-Watershed Locations in the Cahaba River............................................................... 48 Recent Water Quality Conditions Observed in the Upper Cahaba River............................................................................ 54
Methodology............................................................................................................................................................................ 55 Results ....................................................................................................................................................................................... 56
Nutrients ............................................................................................................................................................................... 62 Pesticides.............................................................................................................................................................................. 65 Turbidity............................................................................................................................................................................... 69
Allowable Wastewater Discharges ........................................................................................................................................... 70 Critical Low Flows in the Cahaba River................................................................................................................................ 70 Water Quality During Critical Low Flow Conditions.......................................................................................................... 71 Allowable Discharge Limits.................................................................................................................................................... 72
Preliminary Assessment of Water Pollutant Sources in the Cahaba River Basin .............................................................. 73 Sources of Pollutants in the Upper Cahaba River............................................................................................................... 73 Evaluation of Sources Affecting Lower Reaches of the Cahaba River........................................................................... 74
Conclusions .................................................................................................................................................................................. 78 Pollutant Sources ..................................................................................................................................................................... 78 Upper-Reach Cahaba River Conditions................................................................................................................................ 85 Mid-Reach Cahaba River Conditions ................................................................................................................................... 85 Overall........................................................................................................................................................................................ 86
References ..................................................................................................................................................................................... 86
Introduction This report summaries preliminary assessments of the historical water quality conditions, as related to applicable water quality standards, found in the Cahaba River. This assessment focuses on pollutants (especially toxicants) observed along the upper and middle reaches of the Cahaba River. Additional work is needed to evaluate water quality conditions in the other portions of the river, to better estimate the magnitude of some of the likely pollutant sources of the problem pollutants, and to update the evaluation using more recent data. This report was originally prepared for the Alabama Department of Environmental Management (ADEM) Commission’s Cahaba River Work Group in 1990 and for Torchmark Corp. in 1994. Most of the water quality data were obtained from the U.S. EPA’s STORET computer system for 1970 through 1990 directly from the EPA’s Atlanta office. The majority of the STORET data was submitted by the Alabama Department of Environmental Management (ADEM), the U.S. Geological Survey (USGS), the Birmingham Water Works Board (BWWB), and the Geological Survey of Alabama. Additional data that were not submitted to STORET were obtained directly from the Birmingham Water Works Board. A great deal of time was spent in conducting quality assurance evaluations on the data to eliminate obvious erroneous data before statistical analyses and to locate and plot the sampling locations on 7 1/2 minute USGS quadrangle maps. Much of the analyses in this report focuses on water quality conditions in the upper Cahaba River watershed above the Highway 280 crossing. This portion of the watershed is the major water supply for the Birmingham, AL, area and is under heavy development pressure. However, no data pertaining to the Little Cahaba River is included. About 1500 samples were included in the initial data collection for the upper portion of the watershed. However, many of the sample data obtained were from areas outside of the area of interest, had apparent mistakes that were not capable of being clarified, or were duplicates (especially between STORET and BWWB). It took a great deal of time to do an adequate quality assurance review of the data. The final data set had 857 unique samples collected between March
3
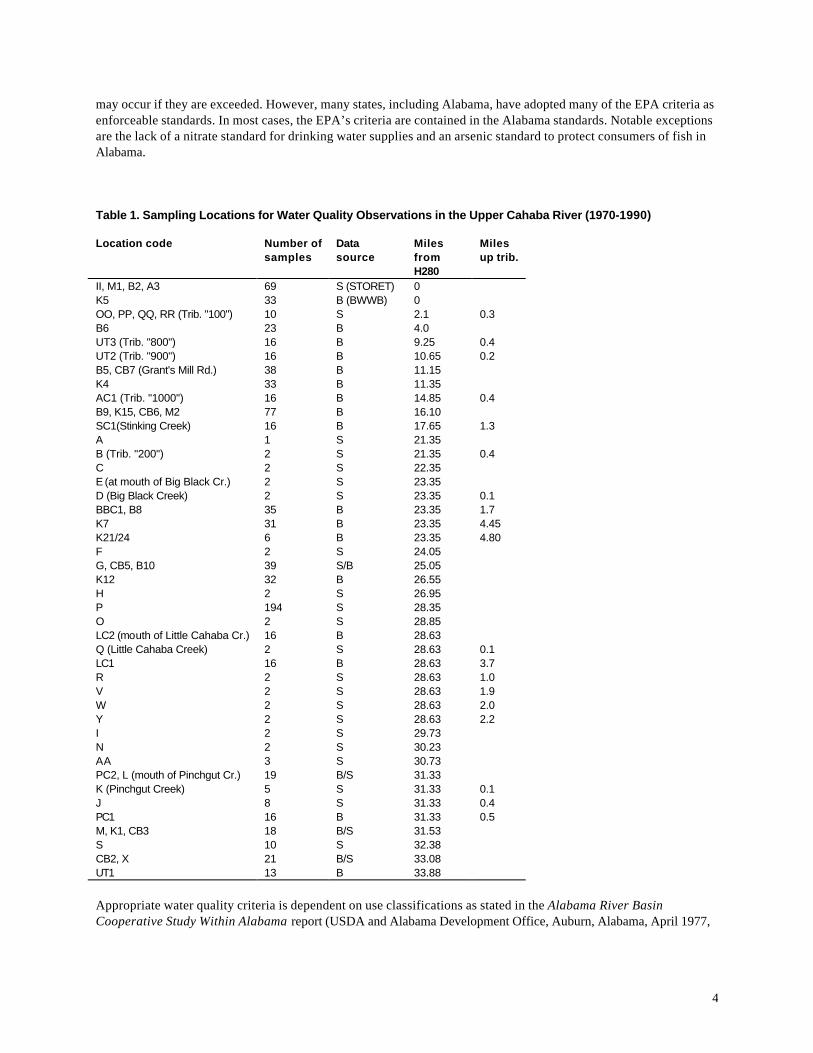
11, 1970 and July 25, 1990. Most of samples were obtained in the mid to late 1980s. Only the BWWB pump station location had samples as old as 1970. Sampling from the other locations did not start until about 1975. Also, many of the sampling locations were only represented by a few samples obtained over a short sampling period. However, representative samples for a relatively long period were available for a number of key locations. The most common measurements were performed on about 500 samples, while a few of the parameters of interest were only available for about 150 samples. More than 40 sampling locations were represented along the complete length of the river in the area upstream of the Highway 280 crossing in the Cahaba River watershed. Probably the most important collection of data was obtained from the BWWB pump station. The pump station data was influenced by flows from the Little Cahaba River, even though no monitoring data from the Little Cahaba River was directly included in this data review. A few of the sampling locations had most of the data, including the BWWB pump station (102 samples), at 16 miles upstream of the pump station (77 samples), and at 28 miles upstream of the pump station (194 samples). Six other locations had between 25 and 40 samples and 14 other locations had between 10 and 25 samples. The remaining locations had fewer than 10 samples each. Table 1 lists the sample location codes, as shown on the maps and data files, their source, and location along the river, for sampling locations that had data that was used in these analyses. A number of other sampling locations were also identified, but had no useful data for these analyses (usually only infrequent flow information). The river miles is the distance upstream from the BWWB pump station, and if the sample is on a tributary, the distance upstream along the tributary from the Cahaba River is also shown. Many of the tributaries were not named on the USGS maps and were therefore given arbitrary numbers, as shown. These sampling locations were geographically divided into five areas, each having enough samples for statistical comparisons: • Area 1 was the BWWB pump station, having 102 samples. • Area 2 was above the pump station to 14 miles upstream, having 136 samples. Also contains unnamed
tributaries 100, 800, and 900. • Area 3 was from 14 to 20 miles upstream, having 109 samples. Also contains unnamed tributary 1000
and Stinking Creek. • Area 4 was 20 to 23.5 miles upstream, having 82 samples. Also contains unnamed tributary 200 and Big Black Creek, a major tributary. • Area 5 was above 23.5 miles upstream, having 430 samples. Also contains No. and So. Forks of Little
Cahaba Creek and Pinchgut Creek. Area 5 was also subdivided to examine the uppermost Cahaba River data separately from both forks of the Little Cahaba Creek and Pinchgut Creek. Further analyses were conducted using EPA’s STORET data for two locations further downstream along the Cahaba River (West Blocton and Centreville). Most of these data were obtained by the State of Alabama (especially ADEM) and submitted to the EPA. These data were compared to the water quality criteria associated with the protection of fish and wildlife and also for the protection of human health associated with the consumption of fish. These downstream locations had long-term data collected during the same 1980 – 1990 time frame as the upper Cahaba River data, and were used to examine the consistency of the problems observed upstream, and to roughly calculate allowable discharges to the river.
Water Quality Criteria The EPA (1986) has published guidelines for how their criteria are to be applied: “criteria present scientific data and guidance of the environmental effects of pollutants which can be useful to derive regulatory requirements based on consideration of water quality impacts.” Being criteria, they are not legal standards but are indicative of problems that
4
may occur if they are exceeded. However, many states, including Alabama, have adopted many of the EPA criteria as enforceable standards. In most cases, the EPA’s criteria are contained in the Alabama standards. Notable exceptions are the lack of a nitrate standard for drinking water supplies and an arsenic standard to protect consumers of fish in Alabama. Table 1. Sampling Locations for Water Quality Observations in the Upper Cahaba River (1970-1990) Location code
Number of samples
Data source
Miles from H280
Miles up trib.
II, M1, B2, A3 69 S (STORET) 0 K5 33 B (BWWB) 0 OO, PP, QQ, RR (Trib. "100") 10 S 2.1 0.3 B6 23 B 4.0 UT3 (Trib. "800") 16 B 9.25 0.4 UT2 (Trib. "900") 16 B 10.65 0.2 B5, CB7 (Grant's Mill Rd.) 38 B 11.15 K4 33 B 11.35 AC1 (Trib. "1000") 16 B 14.85 0.4 B9, K15, CB6, M2 77 B 16.10 SC1(Stinking Creek) 16 B 17.65 1.3 A 1 S 21.35 B (Trib. "200") 2 S 21.35 0.4 C 2 S 22.35 E (at mouth of Big Black Cr.) 2 S 23.35 D (Big Black Creek) 2 S 23.35 0.1 BBC1, B8 35 B 23.35 1.7 K7 31 B 23.35 4.45 K21/24 6 B 23.35 4.80 F 2 S 24.05 G, CB5, B10 39 S/B 25.05 K12 32 B 26.55 H 2 S 26.95 P 194 S 28.35 O 2 S 28.85 LC2 (mouth of Little Cahaba Cr.) 16 B 28.63 Q (Little Cahaba Creek) 2 S 28.63 0.1 LC1 16 B 28.63 3.7 R 2 S 28.63 1.0 V 2 S 28.63 1.9 W 2 S 28.63 2.0 Y 2 S 28.63 2.2 I 2 S 29.73 N 2 S 30.23 AA 3 S 30.73 PC2, L (mouth of Pinchgut Cr.) 19 B/S 31.33 K (Pinchgut Creek) 5 S 31.33 0.1 J 8 S 31.33 0.4 PC1 16 B 31.33 0.5 M, K1, CB3 18 B/S 31.53 S 10 S 32.38 CB2, X 21 B/S 33.08 UT1 13 B 33.88 Appropriate water quality criteria is dependent on use classifications as stated in the Alabama River Basin Cooperative Study Within Alabama report (USDA and Alabama Development Office, Auburn, Alabama, April 1977,
5
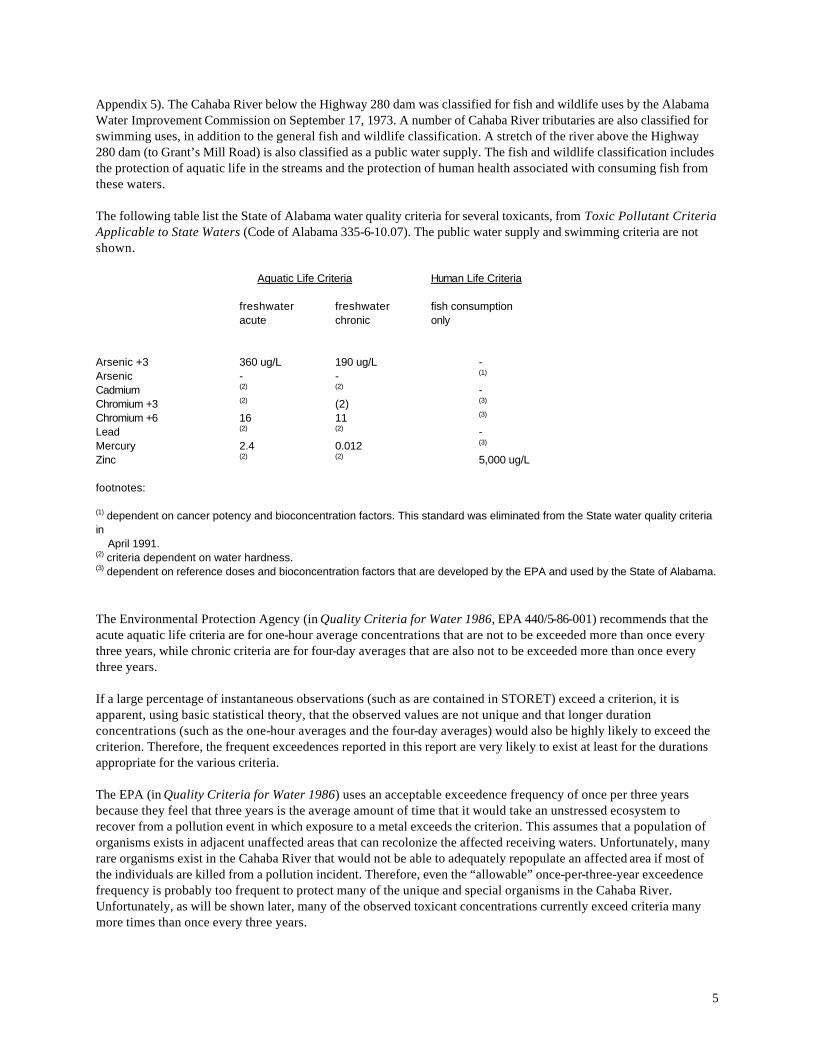
Appendix 5). The Cahaba River below the Highway 280 dam was classified for fish and wildlife uses by the Alabama Water Improvement Commission on September 17, 1973. A number of Cahaba River tributaries are also classified for swimming uses, in addition to the general fish and wildlife classification. A stretch of the river above the Highway 280 dam (to Grant’s Mill Road) is also classified as a public water supply. The fish and wildlife classification includes the protection of aquatic life in the streams and the protection of human health associated with consuming fish from these waters. The following table list the State of Alabama water quality criteria for several toxicants, from Toxic Pollutant Criteria Applicable to State Waters (Code of Alabama 335-6-10.07). The public water supply and swimming criteria are not shown. Aquatic Life Criteria Human Life Criteria freshwater freshwater fish consumption acute chronic only Arsenic +3 360 ug/L 190 ug/L - Arsenic - - (1) Cadmium (2) (2) - Chromium +3 (2) (2) (3) Chromium +6 16 11 (3) Lead (2) (2) - Mercury 2.4 0.012 (3) Zinc (2) (2) 5,000 ug/L footnotes: (1) dependent on cancer potency and bioconcentration factors. This standard was eliminated from the State water quality criteria in April 1991. (2) criteria dependent on water hardness. (3) dependent on reference doses and bioconcentration factors that are developed by the EPA and used by the State of Alabama. The Environmental Protection Agency (in Quality Criteria for Water 1986, EPA 440/5-86-001) recommends that the acute aquatic life criteria are for one-hour average concentrations that are not to be exceeded more than once every three years, while chronic criteria are for four-day averages that are also not to be exceeded more than once every three years. If a large percentage of instantaneous observations (such as are contained in STORET) exceed a criterion, it is apparent, using basic statistical theory, that the observed values are not unique and that longer duration concentrations (such as the one-hour averages and the four-day averages) would also be highly likely to exceed the criterion. Therefore, the frequent exceedences reported in this report are very likely to exist at least for the durations appropriate for the various criteria. The EPA (in Quality Criteria for Water 1986) uses an acceptable exceedence frequency of once per three years because they feel that three years is the average amount of time that it would take an unstressed ecosystem to recover from a pollution event in which exposure to a metal exceeds the criterion. This assumes that a population of organisms exists in adjacent unaffected areas that can recolonize the affected receiving waters. Unfortunately, many rare organisms exist in the Cahaba River that would not be able to adequately repopulate an affected area if most of the individuals are killed from a pollution incident. Therefore, even the “allowable” once-per-three-year exceedence frequency is probably too frequent to protect many of the unique and special organisms in the Cahaba River. Unfortunately, as will be shown later, many of the observed toxicant concentrations currently exceed criteria many more times than once every three years.
6
The EPA (also in Water Quality Criteria) recommends that total recoverable forms of the metals be compared to the criteria because acid soluble methods have not been approved. Most of the metal data presented in this analysis is for the filterable forms of the metals. The EPA recommended total recoverable metal forms will be greater in concentration than the filterable metal forms used in these analyses. Therefore, if the filterable metal forms exceed the criteria, it can be assumed that the total recoverable metal forms will also exceed the criteria by even larger amounts and at higher frequencies.
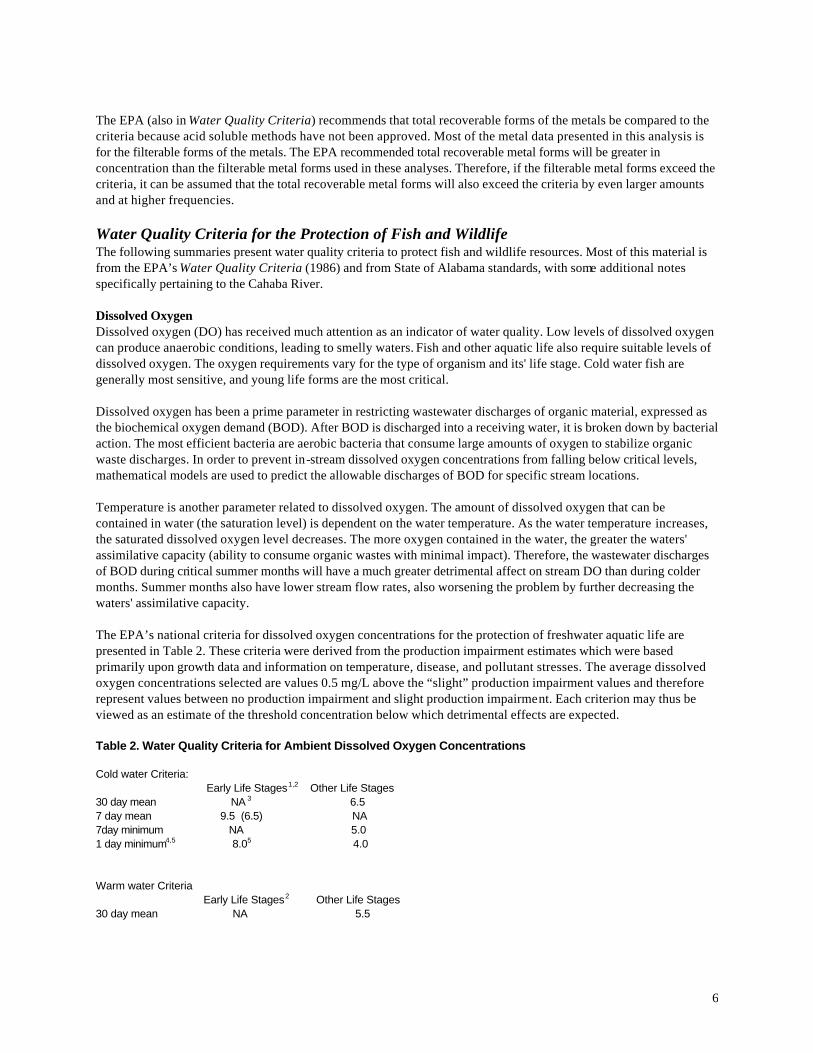
Water Quality Criteria for the Protection of Fish and Wildlife The following summaries present water quality criteria to protect fish and wildlife resources. Most of this material is from the EPA’s Water Quality Criteria (1986) and from State of Alabama standards, with some additional notes specifically pertaining to the Cahaba River. Dissolved Oxygen Dissolved oxygen (DO) has received much attention as an indicator of water quality. Low levels of dissolved oxygen can produce anaerobic conditions, leading to smelly waters. Fish and other aquatic life also require suitable levels of dissolved oxygen. The oxygen requirements vary for the type of organism and its' life stage. Cold water fish are generally most sensitive, and young life forms are the most critical. Dissolved oxygen has been a prime parameter in restricting wastewater discharges of organic material, expressed as the biochemical oxygen demand (BOD). After BOD is discharged into a receiving water, it is broken down by bacterial action. The most efficient bacteria are aerobic bacteria that consume large amounts of oxygen to stabilize organic waste discharges. In order to prevent in-stream dissolved oxygen concentrations from falling below critical levels, mathematical models are used to predict the allowable discharges of BOD for specific stream locations. Temperature is another parameter related to dissolved oxygen. The amount of dissolved oxygen that can be contained in water (the saturation level) is dependent on the water temperature. As the water temperature increases, the saturated dissolved oxygen level decreases. The more oxygen contained in the water, the greater the waters' assimilative capacity (ability to consume organic wastes with minimal impact). Therefore, the wastewater discharges of BOD during critical summer months will have a much greater detrimental affect on stream DO than during colder months. Summer months also have lower stream flow rates, also worsening the problem by further decreasing the waters' assimilative capacity. The EPA’s national criteria for dissolved oxygen concentrations for the protection of freshwater aquatic life are presented in Table 2. These criteria were derived from the production impairment estimates which were based primarily upon growth data and information on temperature, disease, and pollutant stresses. The average dissolved oxygen concentrations selected are values 0.5 mg/L above the “slight” production impairment values and therefore represent values between no production impairment and slight production impairment. Each criterion may thus be viewed as an estimate of the threshold concentration below which detrimental effects are expected. Table 2. Water Quality Criteria for Ambient Dissolved Oxygen Concentrations Cold water Criteria: Early Life Stages1,2 Other Life Stages 30 day mean NA 3 6.5 7 day mean 9.5 (6.5) NA 7day minimum NA 5.0 1 day minimum4,5 8.05 4.0 Warm water Criteria Early Life Stages2 Other Life Stages 30 day mean NA 5.5
7
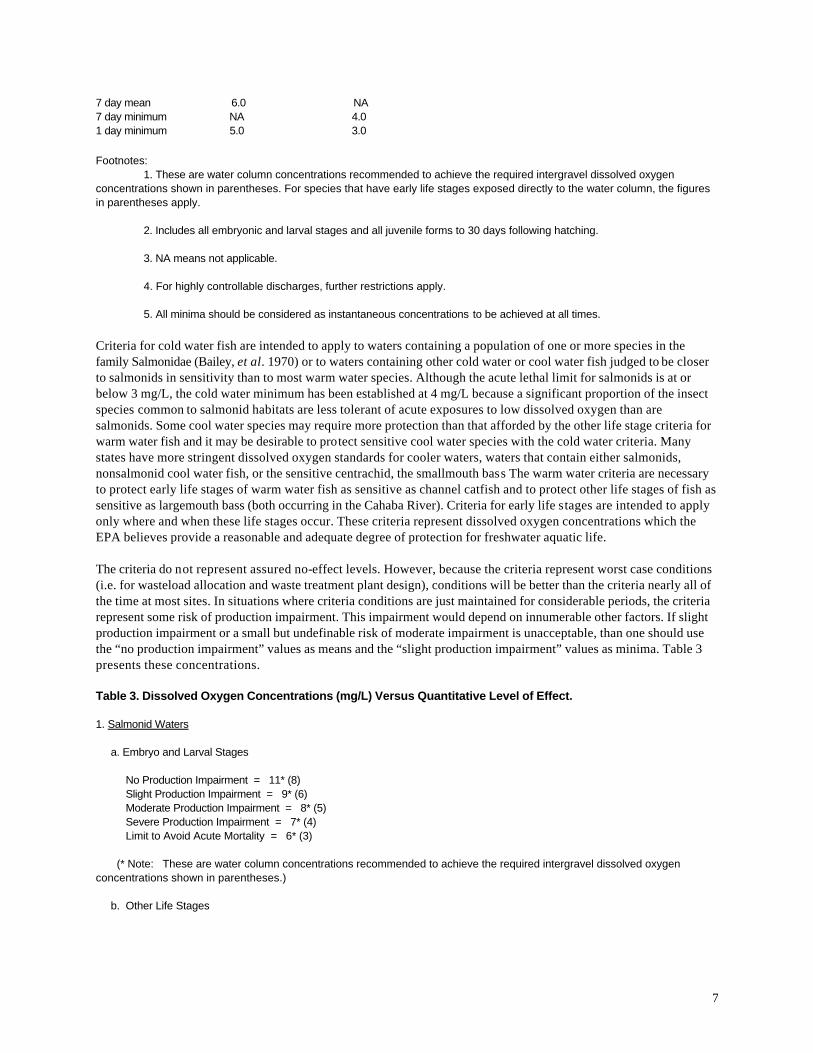
7 day mean 6.0 NA 7 day minimum NA 4.0 1 day minimum 5.0 3.0 Footnotes: 1. These are water column concentrations recommended to achieve the required intergravel dissolved oxygen concentrations shown in parentheses. For species that have early life stages exposed directly to the water column, the figures in parentheses apply. 2. Includes all embryonic and larval stages and all juvenile forms to 30 days following hatching. 3. NA means not applicable. 4. For highly controllable discharges, further restrictions apply. 5. All minima should be considered as instantaneous concentrations to be achieved at all times. Criteria for cold water fish are intended to apply to waters containing a population of one or more species in the family Salmonidae (Bailey, et al. 1970) or to waters containing other cold water or cool water fish judged to be closer to salmonids in sensitivity than to most warm water species. Although the acute lethal limit for salmonids is at or below 3 mg/L, the cold water minimum has been established at 4 mg/L because a significant proportion of the insect species common to salmonid habitats are less tolerant of acute exposures to low dissolved oxygen than are salmonids. Some cool water species may require more protection than that afforded by the other life stage criteria for warm water fish and it may be desirable to protect sensitive cool water species with the cold water criteria. Many states have more stringent dissolved oxygen standards for cooler waters, waters that contain either salmonids, nonsalmonid cool water fish, or the sensitive centrachid, the smallmouth bass The warm water criteria are necessary to protect early life stages of warm water fish as sensitive as channel catfish and to protect other life stages of fish as sensitive as largemouth bass (both occurring in the Cahaba River). Criteria for early life stages are intended to apply only where and when these life stages occur. These criteria represent dissolved oxygen concentrations which the EPA believes provide a reasonable and adequate degree of protection for freshwater aquatic life. The criteria do not represent assured no-effect levels. However, because the criteria represent worst case conditions (i.e. for wasteload allocation and waste treatment plant design), conditions will be better than the criteria nearly all of the time at most sites. In situations where criteria conditions are just maintained for considerable periods, the criteria represent some risk of production impairment. This impairment would depend on innumerable other factors. If slight production impairment or a small but undefinable risk of moderate impairment is unacceptable, than one should use the “no production impairment” values as means and the “slight production impairment” values as minima. Table 3 presents these concentrations. Table 3. Dissolved Oxygen Concentrations (mg/L) Versus Quantitative Level of Effect. 1. Salmonid Waters a. Embryo and Larval Stages No Production Impairment = 11* (8) Slight Production Impairment = 9* (6) Moderate Production Impairment = 8* (5) Severe Production Impairment = 7* (4) Limit to Avoid Acute Mortality = 6* (3) (* Note: These are water column concentrations recommended to achieve the required intergravel dissolved oxygen concentrations shown in parentheses.) b. Other Life Stages
8
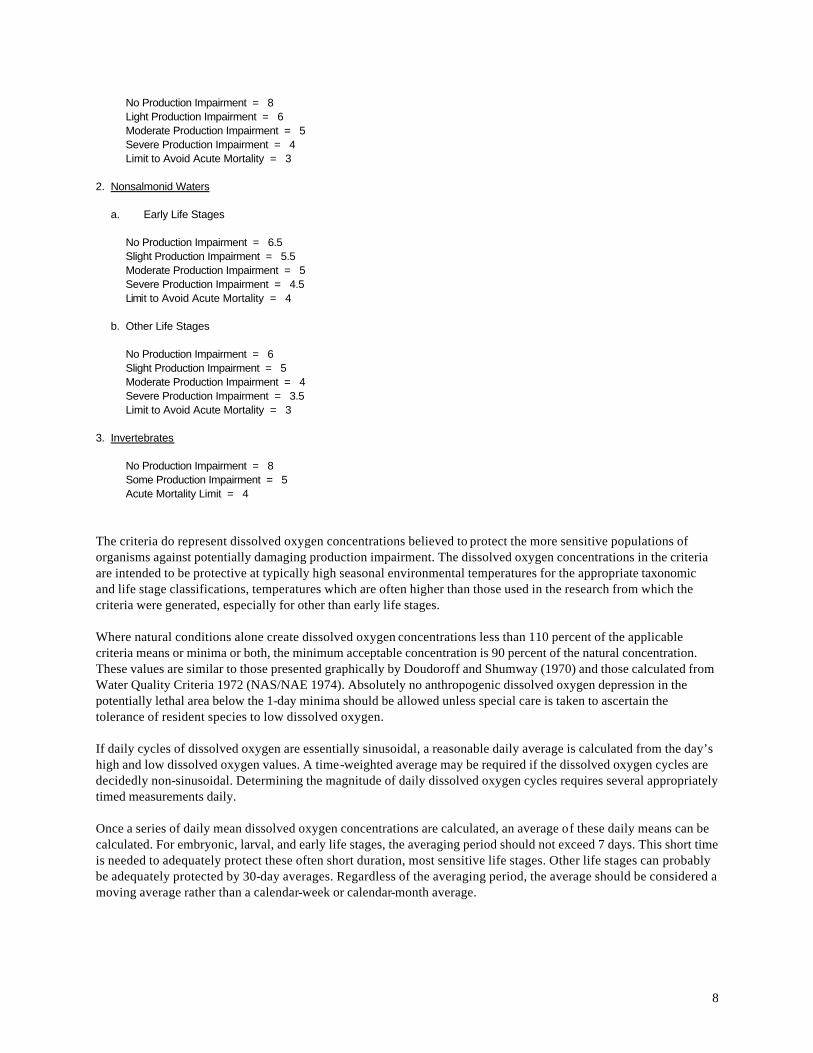
No Production Impairment = 8 Light Production Impairment = 6 Moderate Production Impairment = 5 Severe Production Impairment = 4 Limit to Avoid Acute Mortality = 3 2. Nonsalmonid Waters a. Early Life Stages No Production Impairment = 6.5 Slight Production Impairment = 5.5 Moderate Production Impairment = 5 Severe Production Impairment = 4.5 Limit to Avoid Acute Mortality = 4 b. Other Life Stages No Production Impairment = 6 Slight Production Impairment = 5 Moderate Production Impairment = 4 Severe Production Impairment = 3.5 Limit to Avoid Acute Mortality = 3 3. Invertebrates No Production Impairment = 8 Some Production Impairment = 5 Acute Mortality Limit = 4 The criteria do represent dissolved oxygen concentrations believed to protect the more sensitive populations of organisms against potentially damaging production impairment. The dissolved oxygen concentrations in the criteria are intended to be protective at typically high seasonal environmental temperatures for the appropriate taxonomic and life stage classifications, temperatures which are often higher than those used in the research from which the criteria were generated, especially for other than early life stages. Where natural conditions alone create dissolved oxygen concentrations less than 110 percent of the applicable criteria means or minima or both, the minimum acceptable concentration is 90 percent of the natural concentration. These values are similar to those presented graphically by Doudoroff and Shumway (1970) and those calculated from Water Quality Criteria 1972 (NAS/NAE 1974). Absolutely no anthropogenic dissolved oxygen depression in the potentially lethal area below the 1-day minima should be allowed unless special care is taken to ascertain the tolerance of resident species to low dissolved oxygen. If daily cycles of dissolved oxygen are essentially sinusoidal, a reasonable daily average is calculated from the day’s high and low dissolved oxygen values. A time-weighted average may be required if the dissolved oxygen cycles are decidedly non-sinusoidal. Determining the magnitude of daily dissolved oxygen cycles requires several appropriately timed measurements daily. Once a series of daily mean dissolved oxygen concentrations are calculated, an average of these daily means can be calculated. For embryonic, larval, and early life stages, the averaging period should not exceed 7 days. This short time is needed to adequately protect these often short duration, most sensitive life stages. Other life stages can probably be adequately protected by 30-day averages. Regardless of the averaging period, the average should be considered a moving average rather than a calendar-week or calendar-month average.
9
A daily minimum has been included to make certain that no acute mortality of sensitive species occurs as a result of lack of oxygen. Because repeated exposure to dissolved oxygen concentrations at or near the acute lethal threshold will be stressful and because stress can indirectly produce mortality or other adverse effects (e.g., through disease), the criteria are designed to prevent significant episodes of continuous or regularly recurring exposures to dissolved oxygen concentrations at or near the lethal threshold. This protection has been achieved by setting the daily minimum for early life stages at the subacute lethality threshold, by the use of a 7-day averaging period for early life stages, by stipulating a 7-day mean minimum value for other life stages, and by recommending additional limits for controllable discharges. The previous EPA criteria for dissolved oxygen published in Quality Criteria for Water (USEPA 1976) was a minimum of 5 mg/L (usually applied as a 7Q10, the 7-day averaged minimum that occurs once every ten years) which is similar to the current criterion minimum except for other life stages of warm water fish which now allows a 7-day mean minimum of 4 mg/L. The new criteria are similar to those contained in the 1968 “Green Book” of the Federal Water Pollution Control Federation (FWPCA 1968). The State of Alabama water quality criteria for dissolved oxygen is the same for fish and wildlife, and public water supply uses, the designated beneficial uses for the Upper Cahaba River: “(i) For a diversified warm water biota, including game fish, daily dissolved oxygen concentrations shall not be less than 5 mg/L at all times; except under extreme conditions due to natural causes, it may range between 5 mg/L and 4 mg/L, provided that the water quality is favorable in all other parameters. The normal seasonal and daily fluctuations shall be maintained above these levels. In no event shall the dissolved oxygen level be less than 4 mg/L due to discharges from existing hydroelectric impoundments. All new hydroelectric generation units to existing impoundments, shall be designed so that the discharge will contain at least 5 mg/L dissolved oxygen where practicable and technologically possible. The Environmental Protection Agency, in cooperation with the State of Alabama and parties responsible for impoundments, shall develop a program to improve the design of existing facilities. (ii) In coastal waters, surface dissolved oxygen concentrations shall not be less than 5 mg/L, except where natural phenomena cause the value to be depressed. (iii) In estuaries and tidal tributaries, dissolved oxygen concentrations shall not be less than 5 mg/L, except in dystrophic water or where natural phenomena cause the value to be depressed. (iv) In the application of dissolved oxygen criteria referred to above, dissolved oxygen shall be measured at a depth of 5 feet in waters 10 feet or greater in depth; and for those waters less than 10 feet in depth, dissolved oxygen criteria will be applied at mid-depth.” Bacteria The Alabama standard for fish and wildlife are similar to the standard for a public water supply, shown in the following section, except part (i) has different limits: “Bacteria of the fecal coliform group shall not exceed a geometric mean of 1,000/100 mL on a monthly average value; nor exceed a maximum of 2,000/100 mL in any sample.” Part (ii) is the same for both water beneficial uses. Hardness This discussion on the effects of hardness is a summary from the U.S. EPA’s Quality Criteria for Water, 1986 (EPA 1986). These criteria have been previously published by the EPA (Quality Criteria for Water, July 1976, PB-263943). The water quality criteria guidance documents do not constitute a national standard, but do reflect the scientific knowledge concerning the effects of these pollutants on receiving waters. Water hardness is caused by the divalent metallic ions (having charges of +2) dissolved in water. In fresh water, these are primarily calcium and magnesium, although other metals such as iron, strontium and manganese also contribute to the hardness content, but usually to a much lesser degree. Hardness commonly is reported as an equivalent concentration of calcium carbonate (CaCO3).
10
Concerns about water hardness originated because hard water requires more soap to form a lather and because hard water causes scale in hot water systems. Modern use of synthetic detergents has eliminated the concern of hard water in laundries, but it is still of primary concern for many industrial water users. Many households use water softeners to reduce scale formation in hot water systems and for water taste reasons. A commonly used classification for hardness is as follows (Sawyer 1960): Hardness concentration, mg/L as CaCO3 Description 0-75 soft 75 - 150 moderately hard 150 - 300 hard 300 and up very hard Natural sources of hardness principally are limestones which are dissolved by percolating rainwater. Groundwaters are therefore generally harder than surface waters. Industrial sources include the inorganic chemical industry and discharges from operating and abandoned mines. Hardness in fresh water frequently is distinguished in carbonate and non-carbonate fractions. The carbonate fraction is chemically equivalent to the bicarbonates present in water. Since bicarbonates generally are measured as alkalinity, the carbonate hardness is equal to the alkalinity. The effects of hardness on freshwater fish and other aquatic life appear to be related to the ions causing the hardness rather than by hardness as a general indicator. Both the NTAC (1968) and NAS (1974) panels have recommended against the use of the term hardness and suggested the use of the concentrations of the specific ions instead. This procedure should avoid confusion in future studies, but is not helpful in evaluating previous studies. For most existing data, it is difficult to determine whether toxicity of various metal ions is reduced because of the formation of metallic hydroxides and carbonates caused by the associated increases in alkalinity, or because of an antagonistic effect of one of the principal cations contributing to hardness, e.g., calcium, or a combination of both effects. Stiff (1971) presented an example that if cupric ions were the toxic form of copper whereas copper carbonate complexes were relatively nontoxic, then the observed difference in toxicity of copper between hard and soft waters can be explained by the difference in alkalinity rather than hardness. Recent laboratory work (Engineering Foundation 1991) has also shown that alkalinity is more related to heavy metal toxicity than water hardness. As noted previously, however, carbonate hardness and alkalinity are the same. Doudoroff and Katz (1953), in their review of the literature on toxicity, presented data showing that increasing calcium in particular reduced the toxicity of other heavy metals. Under usual conditions in fresh water and assuming that other bivalent metals behave similarly to copper, it is reasonable to assume that both effects occur simultaneously and explain the observed reduction of toxicity of metals in waters containing carbonate hardness. The amount of reduced toxicity related to hardness, as measured by a 40-hour LC5O for rainbow trout, has been estimated to be about four times for copper and zinc when the hardness was increased from 10 to 100 mg/L as CaCO3 (NAS 1974). As shown in later discussions for specific heavy metals, many of the heavy metal criteria are dependent on water hardness. The allowable concentrations of cadmium, chromium, lead, and zinc to protect fish and other aquatic life, are much less in soft waters than in hard waters, for example. Ammonia This discussion on the effects of ammonia on aquatic life is a summary from the U.S. EPA’s Quality Criteria for Water, 1986 (EPA 1986). The criteria were published in the Federal Register (50 F.R. 30784, July 29, 1985). The ammonia criteria are only for the protection of aquatic life, as no criteria have been developed for the protection of human health (consumption of contaminated fish or drinking water). The water quality criteria is for general guidance only and do not constitute formal water quality standards. However, the criteria reflect the scientific knowledge concerning the effects of the pollutants and are recommended EPA acceptable limits for aquatic life. All concentrations used in this EPA report are expressed as un-ionized ammonia (NH3) because NH3, not the ammonium ion (NH4
+), has been demonstrated to be the principal toxic form of ammonia. The amount of the total ammonia (usually expressed as NH3, but is really a mixture of ionized and un-ionized ammonia forms) that is un-ionized is a function of pH. At low pH values, most of the ammonia is ionized (the ammonium ion, NH4
+), while at high
11
pH values, most of the ammonia is un-ionized. Therefore, ammonia at high pH values creates more of a problem than similar total ammonia concentrations at low pH values. The Cahaba River watershed ammonia data reviewed is total ammonia, expressed as NH3. The un-ionized ammonia concentrations can be calculated, if the pH values are known. The data used in deriving the EPA criteria are predominantly from flow-through tests in which ammonia concentrations were measured. Ammonia was reported to be acutely toxic to freshwater organisms at concentrations (uncorrected for pH) ranging from 0.53 to 22.8 mg/L NH3 for 19 invertebrate species representing 14 families and 16 genera and from 0.083 to 4.60 mg/L NH3 for 29 fish species from 9 families and 18 genera. Among fish species, reported 96-hour LC5O values ranged from 0.083 to 1.09 mg/L for salmonids (not expected to be present in the Cahaba River) and from 0.14 to 4.60 mg/L NH3 for nonsalmonids. Reported data from chronic tests on ammonia with two freshwater invertebrate species, both daphnids, showed effects at concentrations (uncorrected for pH) ranging from 0.304 to 1.2 mg/L NH3, and with nine freshwater fish species, from five families and seven genera, ranging from 0.0017 to 0.612 mg/L NH3. Concentrations of ammonia acutely toxic to fishes may cause loss of equilibrium, hyper-excitability, increased breathing, cardiac output and oxygen uptake, and, in extreme cases, convulsions, coma, and death. At lower concentrations, ammonia has many effects on fishes, including a reduction in hatching success, reduction in growth rate and morphological development, and pathologic changes in tissues of gills, livers, and kidneys. Several factors have been shown to modify acute NH3 toxicity in fresh water. Some factors alter the concentration of un-ionized ammonia in the water by affecting the aqueous ammonia equilibrium, and some factors affect the toxicity of un-ionized ammonia itself, either ameliorating or exacerbating the effects of ammonia. Factors that have been shown to affect ammonia toxicity include dissolved oxygen concentration, temperature, pH, previous acclimation to ammonia, fluctuating or intermittent exposures, carbon dioxide concentration, salinity, and the presence of other toxicants. The most well-studied of these is pH; the acute toxicity of NH3 has been shown to increase as pH decreases. However, the percentage of the total ammonia that is un-ionized decreases with decreasing pH. Sufficient data exist from toxicity tests conducted at different pH values to formulate a relationship to describe the pH-dependent acute NH3 toxicity. The very limited amount of data regarding effects of pH on chronic NH3 toxicity also indicates increasing NH3 toxicity with decreasing pH, but the data are insufficient to derive a broadly applicable toxicity/pH relationship. Data on temperature effects on acute NH3 toxicity are limited and somewhat variable, but indications are that NH3 toxicity to fish is greater as temperature decreases. There is no information available regarding temperature effects on chronic NH3 toxicity. Examination of pH and temperature-corrected acute NH3 toxicity values among species and genera of freshwater organisms showed that invertebrates are generally more tolerant than fishes, a notable exception being the fingernail clam. There is no clear trend among groups of fish; the several most sensitive tested species and genera include representatives from diverse families (Salmonidae, Cyprinidae, Percidae, and Centrarchidae). Available chronic toxicity data for freshwater organisms also indicate invertebrates (cladocerans, one insect species) to be more tolerant than fishes, again with the exception of the fingernail clam. When corrected for the presumed effects of temperature and pH, there is also no clear trend among groups of fish for chronic toxicity values. The most sensitive species, including representatives from five families (Salmonidae, Cyprinidae, Ictaluridae, Centrarchidae, and Catostomidae), have chronic values ranging by not much more than a factor or two. Available data indicate that differences in sensitivities between warm and coldwater families of aquatic organisms are inadequate to warrant discrimination in the national ammonia criterion between bodies of water with "warm" and "coldwater" fishes; rather, effects of organism sensitivities on the criterion are most appropriately handled by site-specific criteria derivation procedures. Data for concentrations of NH3 toxic to freshwater phytoplankton and vascular plants, although limited, indicate that freshwater plant species are appreciably more tolerant to NH3 than are invertebrates or fishes. The ammonia criterion appropriate for the protection of aquatic animals will therefore in all likelihood be sufficiently protective of plant life.
12
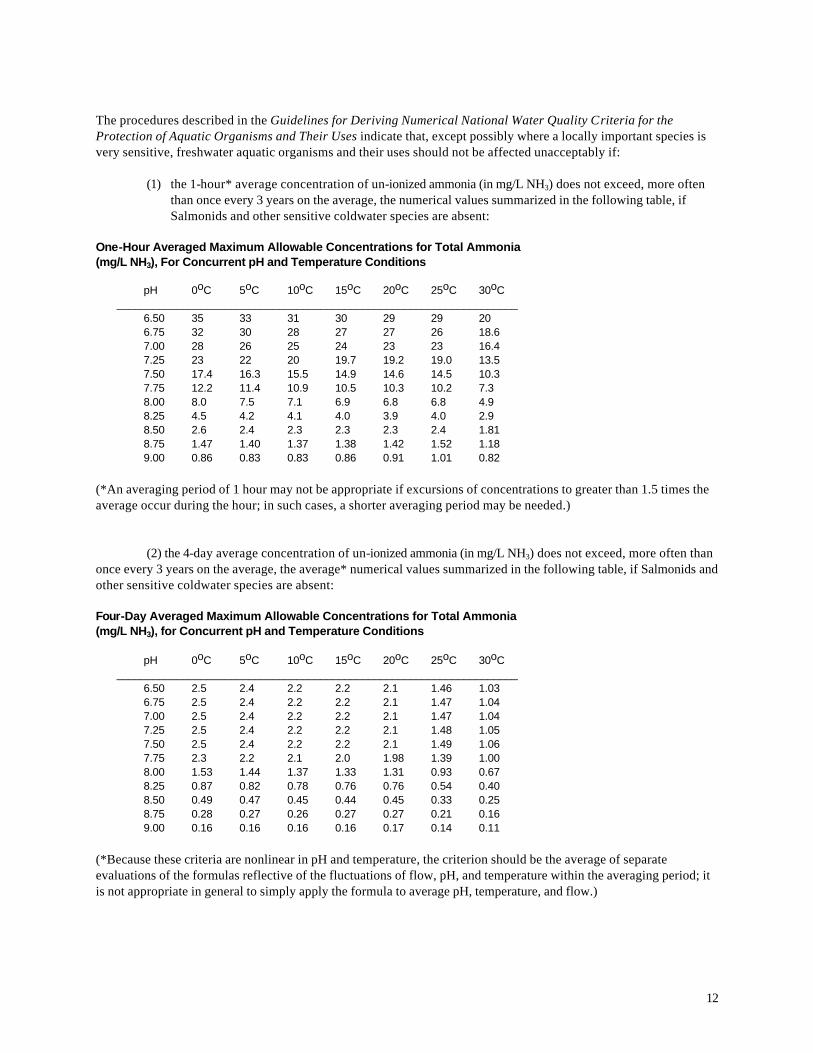
The procedures described in the Guidelines for Deriving Numerical National Water Quality Criteria for the Protection of Aquatic Organisms and Their Uses indicate that, except possibly where a locally important species is very sensitive, freshwater aquatic organisms and their uses should not be affected unacceptably if:
(1) the 1-hour* average concentration of un-ionized ammonia (in mg/L NH3) does not exceed, more often than once every 3 years on the average, the numerical values summarized in the following table, if Salmonids and other sensitive coldwater species are absent:
One-Hour Averaged Maximum Allowable Concentrations for Total Ammonia (mg/L NH3), For Concurrent pH and Temperature Conditions pH 0oC 5oC 10oC 15oC 20oC 25oC 30oC ___________________________________________________________________ 6.50 35 33 31 30 29 29 20 6.75 32 30 28 27 27 26 18.6 7.00 28 26 25 24 23 23 16.4 7.25 23 22 20 19.7 19.2 19.0 13.5 7.50 17.4 16.3 15.5 14.9 14.6 14.5 10.3 7.75 12.2 11.4 10.9 10.5 10.3 10.2 7.3 8.00 8.0 7.5 7.1 6.9 6.8 6.8 4.9 8.25 4.5 4.2 4.1 4.0 3.9 4.0 2.9 8.50 2.6 2.4 2.3 2.3 2.3 2.4 1.81 8.75 1.47 1.40 1.37 1.38 1.42 1.52 1.18 9.00 0.86 0.83 0.83 0.86 0.91 1.01 0.82 (*An averaging period of 1 hour may not be appropriate if excursions of concentrations to greater than 1.5 times the average occur during the hour; in such cases, a shorter averaging period may be needed.) (2) the 4-day average concentration of un-ionized ammonia (in mg/L NH3) does not exceed, more often than once every 3 years on the average, the average* numerical values summarized in the following table, if Salmonids and other sensitive coldwater species are absent: Four-Day Averaged Maximum Allowable Concentrations for Total Ammonia (mg/L NH3), for Concurrent pH and Temperature Conditions pH 0oC 5oC 10oC 15oC 20oC 25oC 30oC ___________________________________________________________________ 6.50 2.5 2.4 2.2 2.2 2.1 1.46 1.03 6.75 2.5 2.4 2.2 2.2 2.1 1.47 1.04 7.00 2.5 2.4 2.2 2.2 2.1 1.47 1.04 7.25 2.5 2.4 2.2 2.2 2.1 1.48 1.05 7.50 2.5 2.4 2.2 2.2 2.1 1.49 1.06 7.75 2.3 2.2 2.1 2.0 1.98 1.39 1.00 8.00 1.53 1.44 1.37 1.33 1.31 0.93 0.67 8.25 0.87 0.82 0.78 0.76 0.76 0.54 0.40 8.50 0.49 0.47 0.45 0.44 0.45 0.33 0.25 8.75 0.28 0.27 0.26 0.27 0.27 0.21 0.16 9.00 0.16 0.16 0.16 0.16 0.17 0.14 0.11 (*Because these criteria are nonlinear in pH and temperature, the criterion should be the average of separate evaluations of the formulas reflective of the fluctuations of flow, pH, and temperature within the averaging period; it is not appropriate in general to simply apply the formula to average pH, temperature, and flow.)
13
The extremes for temperature (0 and 30oC) and pH (6.5 and 9) given in the above summary tables are absolute. It is not permissible with current data to conduct any extrapolations beyond these limits. In particular, there is reason to believe that appropriate criteria at pH > 9 will be lower than the plateau between pH 8 and 9 shown above. Total ammonia concentrations equivalent to critical un-ionized ammonia concentrations are shown in these tables for receiving waters where salmonids and other sensitive coldwater species are absent, as expected for the Cahaba River. Reported EPA ammonia criteria values for salmonids and coldwater species are the same for temperatures up to 15oC. For warmer conditions, the total ammonia criteria are about 25% less. The recommended exceedence frequency of 3 years is the EPA’s best scientific judgment of the average amount of time it will take an unstressed system to recover from a pollution event in which exposure to ammonia exceeds the criterion. A stressed system, for example, one in which several outfalls occur in a limited area, would be expected to require more time for recovery. The resilience of ecosystems and their ability to recover differ greatly, however, and site-specific criteria may be established if adequate justification is provided. Nitrates This discussion on the effects of nitrates on aquatic life and human health is a summary from the U.S. EPA’s Quality Criteria for Water, 1986 (EPA 1986). These criteria have been previously published by the EPA (Quality Criteria for Water, July 1976, PB-263943). These water quality criteria guidance documents do not constitute a national standard. However, the discussion reflects the scientific knowledge concerning the effects of nitrates on the designated water uses in the Cahaba River watershed. Two gases (molecular nitrogen and nitrous oxide) and five forms of nongaseous, combined nitrogen (amino and amide groups, ammonium, nitrite, and nitrate) are important in the nitrogen cycle. The amino and amide groups are found in soil organic matter and as constituents of plant and animal protein. The ammonium ion either is released from proteinaceous organic matter and urea, or is synthesized in industrial processes involving atmospheric nitrogen fixation. The nitrite ion is formed from the nitrate or the ammonium ions by certain microorganisms found in soil, water, sewage, and the digestive tract. The nitrate ion is formed by the complete oxidation of ammonium ions by soil or water microorganisms; nitrite is an intermediate product of this nitrification process. In oxygenated natural water systems, nitrite is rapidly oxidized to nitrate. Growing plants assimilate nitrate or ammonium ions and convert them to protein. A process known as denitrification takes place when nitrate containing soils become anaerobic and the conversion to nitrite, molecular nitrogen, or nitrous oxide occurs. Ammonium ions may also be produced in some circumstances. Among the major point sources of nitrogen entering water bodies are municipal and industrial wastewaters, septic tanks, and feed lot discharges. Nonpoint sources of nitrogen include farm-site fertilizer and animal wastes, lawn fertilizer, sanitary landfill leachatte, atmospheric fallout, nitric oxide and nitrite discharges from automobile exhausts and other combustion processes, and losses from natural sources such as mineralization of soil organic matter (NAS 1972). Water reuse systems in some fish hatcheries employ a nitrification process for ammonia reduction; this may result in exposure of the hatchery fish to elevated levels of nitrite (Russo, et al. 1974). For fingerling rainbow trout, Salmo gairdneri, the respective 96-hour and 7-day LC5O toxicity values were 1,360 and 1,060 mg/L nitrate nitrogen in fresh water (Westin 1974). Trama (1954) reported that the 96-hour LC5O for bluegills, Lepomis macrochirus, at 20oC was 2,000 mg/L nitrate nitrogen (sodium nitrate) and 420 mg/L nitrate nitrogen (potassium nitrate). Knepp and Arkin (1973) observed that largemouth bass, Micropterus salmoides and channel catfish, Ictalurus punctatus, could be maintained at concentrations up to 400 mg/L nitrate without significant effect upon their growth and feeding activities. Nitrite forms of nitrogen were found to be much more toxic than nitrate forms. As an example, the 96-hour and 7-day LC5O values for chinook salmon were found to be 0.9 and 0.7 mg/ L nitrite nitrogen in fresh water (Westin 1974). Smith and Williams (1974) tested the effects of nitrite nitrogen and observed that yearling rainbow trout, Salmo gairdneri, suffered a 55 percent mortality after 24 hours at 0.55 mg/L; fingerling rainbow trout suffered a 50 percent mortality after 24 hours of exposure at 1.6 mg/L; and chinook salmon, Oncorhynchus tshawytscha, suffered a 40

14
percent mortality within 24 hours at 0.5 mg/L. There were no mortalities among rainbow trout exposed to 0.15 mg/L nitrite nitrogen for 48 hours. These data indicate that salmonids are more sensitive to nitrite toxicity than are other fish species, e.g., minnows, Phoxinus laevis, that suffered a 50 percent mortality within 1.5 hours of exposure to 2,030 mg/L nitrite nitrogen, but required 14 days of exposure for mortality to occur at 10 mg/L (Klingler 1957), and carp, Cyprinus carpio, when rais ed in a water reuse system, tolerated up to 1.8 mg/L nitrite nitrogen (Saeki 1965). The EPA concluded that (1) levels of nitrate nitrogen at or below 90 mg/L would have no adverse effects on warmwater fish (Knepp and Arkin 1973); (2) nitrite nitrogen at or below 5 mg/L should be protective of most warmwater fish (McCoy 1972); and (3) nitrite nitrogen at or below 0.06 mg/L should be protective of salmonid fishes (Russo, et al. 1974; Russo and Thurston 1975). These levels either are not known to occur or would be unlikely to occur in natural surface waters. Recognizing that concentrations of nitrate or nitrite that would exhibit toxic effects on warm- or coldwater fish could rarely occur in nature, restrictive criteria are not recommended. pH This discussion on the effects of pH is a summary from the U.S. EPA’s Quality Criteria for Water, 1986 (EPA 1986). These criteria have been previously published by the EPA (Quality Criteria for Water, July 1976, PB-263943). The water quality criteria guidance documents do not constitute a national standard, but do reflect the scientific knowledge concerning the effects of these pollutants on receiving waters. State of Alabama pH standards are also discussed. pH is a measure of the hydrogen ion activity in a water sample. It is mathematically related to hydrogen ion activity according to the expression: pH = -log10 (H
+) , where H+ is the hydrogen ion activity, expressed in moles/L. The pH of natural waters is a measure of the acid-base equilibrium achieved by the various dissolved compounds, salts, and gases. The principal chemical system controlling pH in natural waters is the carbonate system which is composed of atmospheric carbon dioxide (CO2) and resulting carbonic acid (H2CO3), bicarbonate ions (HCO3
-) and carbonate ions (CO3
2-) The interactions and kinetics of this system have been described by Stumm and Morgan (1970). pH is an important factor in the chemical and biological reactions in natural waters. The degree of dissociation of weak acids or bases is affected by changes in pH. This effect is important because the toxicity of many compounds is affected by the degree of dissociation. One such example is for hydrogen cyanide. Cyanide toxicity to fish increases as the pH is lowered because the chemical equilibrium is shifted towards an increased concentration of a more toxic form of cyanide. Similar results have also been shown for hydrogen sulfide (H2S) (Jones 1964). Conversely, rapid increases in pH can cause increased NH3 concentrations that are also toxic. Ammonia has been shown to be 10 times as toxic at pH 8.0 as at pH 7.0 (EIFAC 1969). The solubility of metal compounds contained in bottom sediments, or as suspended material, also is affected by pH. For example, laboratory equilibrium studies under anaerobic conditions indicated that pH was an important parameter involved in releasing manganese from bottom sediments (Delfino and Lee 1971). Knowledge of pH in the raw water used for public water supplies is important because without adjustment to a suitable level, such waters may be corrosive and adversely affect treatment processes, especially coagulation and chlorination. Coagulation, used for removal of colloidal color and turbidity through the use of aluminum or iron salts, generally has an optimum pH range of 5.0 to 6.5 (Sawyer 1960). The effect of pH on chlorine in water principally concerns the equilibrium between hypochlorous acid (HOCl) and the hypochlorite ion (OCI-) according to the reaction: HOCI = H+ + OCI-
High hydrogen ion concentrations (low pH) would therefore cause much more HOCl to be present, than at high pH values. Butterfield (1984) has shown that chlorine disinfection is more effective at values less than pH 7 (favoring
15
HOCl, the more effective disinfectant). Water is therefore adjusted to a pH of between 6.5 and 7 before most water treatment processes. Corrosion of plant equipment and piping in the distribution system can lead to expensive replacement as well as the introduction of metal ions such as copper, lead, zinc, and cadmium. Langelier (1936) developed a method to calculate and control water corrosive activity that employs calcium carbonate saturation theory and predicts whether the water would tend to dissolve metal piping, or deposit a protective layer of calcium carbonate on the metal. Generally, this level is above pH 7 and frequently approaches pH 8.3, the point of maximum bicarbonate/carbonate buffering. Since pH is relatively easily adjusted prior to, and during, water treatment, a rather wide range is acceptable for waters serving as a source of public water supply. A range of pH from 5.0 to 9.0 would provide a water treatable by typical (coagulation, sedimentation, filtration , and chlorination) treatment plant processes. As the range is extended, the cost of pH adjusting chemicals increases. A review of the effects of pH on fresh water fish has been published by the European Inland Fisheries Advisory Commission (1969). The commission concluded: There is no definite pH range within which a fishery is unharmed and outside which it is damaged, but rather, there is a gradual deterioration as the pH values are further removed from the normal range. The pH range which is not directly lethal to fish is 5 to 9; however, the toxicity of several common pollutants is markedly affected by pH changes within this range, and increasing acidity or alkalinity may make these poisons more toxic. Also, an acid discharge may liberate sufficient CO2 from bicarbonate in the water either to be directly toxic, or to cause the pH range of 5 to 6 to become lethal. Mount (1973) performed bioassays on the fathead minnow, Pimephales promelas, for a 13-month, one generation time period to determine chronic pH effects. Tests were run at pH levels of 4.5, 5.2, 5.9, 6.6, and a control of 7.5. At the two lowest pH values (4.5 and 5.2) behavior was abnormal and the fish were deformed. At pH values less than 6.6, egg production and hatchability were reduced when compared with the control. It was concluded that a pH of 6.6 was marginal for vital life functions. Bell (1971) performed bioassays with nymphs of caddisflies (two species) stoneflies (four species), dragonflies (two species), and mayflies (one species). All are important fish food organisms. The 30-day TL5O pH values ranged from 2.5 to 5.4, with the caddisflies being the most tolerant and the mayflies being the least tolerant. The pH values at which 50 percent of the organisms emerged ranged from 4.0 to 6.6 with increasing percentage emergence occurring with the increasing pH values. Based on present evidence, a pH range of 6.5 to 9.0 appears to provide adequate protection for the life of freshwater fish and bottom dwelling invertebrates. Outside of this range, fish suffer adverse physiological effects increasing in severity as the degree of deviation increases until lethal levels are reached: pH Range Effect on Fish 5.0 - 6.0 Unlikely to be harmful to any species unless either the concentration of free CO2 is greater than 20 ppm, or the
water contains iron salts which are precipitated as ferric hydroxide, the toxicity of which is not known. 6.0 - 6.5 Unlikely to be harmful to fish unless free CO2 is present in excess of 100 ppm. 6.5 - 9.0 Harmless to fish, although the toxicity of other poisons may be affected by changes within this range. source: EIFAC 1969 The EPA recommended water quality criteria for pH therefore restricts pH values to be in the range of 5 to 9 for domestic water supplies (welfare), and within the range of 6.5 to 9.0 for freshwater aquatic life protection. The State of

16
Alabama's fresh water pH standards for public water supplies and aquatic life are: “Sewage, industrial wastes or other wastes shall not cause the pH to deviate more than one unit from the normal or natural pH, nor be less than 6.0, nor greater than 8.5.” Phosphate This discussion on the effects of phosphate on aquatic life and human health is a summary from the U.S. EPA’s Quality Criteria for Water, 1986 (EPA 1986). These criteria have been previously published by the EPA (Quality Criteria for Water, July 1976, PB-263943). The phosphate observations for the Cahaba River study area are for total forms of the nutrient. These water quality criteria guidance documents do not constitute a national standard. However, the discussion reflects the scientific knowledge concerning the effects of phosphates on the designated water uses in the Cahaba River watershed. Phosphorus in the elemental form is very toxic (having an EPA marine life criteria of 0.10 µg/L) and is subject to bioaccumulation in much the same way as mercury. Phosphate forms of phosphorus are a major nutrient required for plant nutrition. In excessive concentrations, phosphates can stimulate plant growth. Excessive growths of aquatic plants (eutrophication) often interfere with water uses and are nuisances to man. Generally, phosphates are not the only cause of eutrophication, but there is substantiating evidence that frequently it is the key element of all of the elements required by freshwater plants (generally, it is present in the least amount relative to need). Therefore, an increase in phosphorus allows use of other already present nutrients for plant growth. In addition, of all of the elements required for plant growth in the water environment, phosphorus is the most easily controlled by man. However, in most parts of the Cahaba River basin, nitrogen compounds are likely the most critical nutrients because of the relatively large amounts of treated sewage, which is especially high in phosphates, in relation to other pollution sources. Phosphates enter waterways from several different sources. The human body excretes about one pound per year of phosphorus compounds. The use of phosphate detergents increases the per capita contribution to about 3.5 pounds per year of phosphorus compounds. Some industries, such as potato processing, have wastewaters high in phosphates. Many non-point sources (crop, forest, idle, and urban lands) contribute varying amounts of phosphorus compounds to watercourses. This drainage may be surface runoff of rainfall, effluent from agricultural tile lines, or return flow from irrigation. Cattle feedlots, birds, tree leaves, and fallout from the atmosphere all are contributing sources. Evidence indicates that: (1) high phosphorus compound concentrations are associated with accelerated eutrophication of waters, when other growth-promoting factors are present; (2) aquatic plant problems develop in reservoirs and other standing waters at phosphorus values lower than those critical in flowing streams; (3) reservoirs and lakes collect phosphates from influent streams and store a portion of them within consolidated sediments, thus serving as a phosphate sink; and (4) phosphorus concentrations critical to noxious plant growth vary and nuisance growths may result from a particular concentration of phosphate in one geographical area but not in another. The amount or percentage of inflowing nutrients that may be retained by a lake or reservoir is variable and will depend upon: (1) the nutrient loading to the lake or reservoir; (2) the volume of the euphotic zone; (3) the extent of biological activities; (4) the detention time within a lake basin or the time available for biological activities; and (5) the discharge from the lake. Once nutrients are discharged into an aquatic ecosystem, their removal is tedious and expensive. Phosphates are used by algae and higher aquatic plants and may be stored in excess of use within the plant cells. With decomposition of the plant cell, some phosphorus may be released immediately through bacterial action for recycling within the biotic community, while the remainder may be deposited with sediments. Much of the material that combines with the consolidated sediments within the lake bottom is bound permanently and will not be recycled into the system. Although a total phosphorus criterion to control nuisance aquatic growths is not presented, the EPA believes that the following rationale to support such a criterion, which currently is evolving, should be considered.
17
Total phosphate concentrations in excess of 100 µg/L (expressed as total phosphorus) may interfere with coagulation in water treatment plants. When such concentrations exceed 25 µg/L at the time of the spring turnover on a volume-weighted basis in lakes or reservoirs, they may occasionally stimulate excessive or nuisance growths of algae and other aquatic plants. Algal growths cause undesirable tastes and odors to water, interfere with water treatment, become aesthetically unpleasant, and alter the chemistry of the water supply. They contribute to eutrophication. To prevent the development of biological nuisances and to control accelerated or cultural eutrophication, total phosphates as phosphorus (P) should not exceed 50 µg/L in any stream at the point where it enters any lake or reservoir, nor 25 µg/L within the lake or reservoir. A desired goal for the prevention of plant nuisances in streams or other flowing waters not discharging directly to lakes or impoundments is 100 µg/L total P (Mackenthun 1973). Most relatively uncontaminated lake districts are known to have surface waters that contain from 10 to 30 µg/L total phosphorus as P (Hutchinson, 1957). The majority of the Nation’s eutrophication problems are associated with lakes or reservoirs and currently there are more data to support the establishment of a limiting phosphorus level in those waters than in streams or rivers that do not directly impact such water. There are natural conditions, also, that would dictate the consideration of either a more or less stringent phosphorus level. Eutrophication problems may occur in waters where the phosphorus concentration is less than that indicated above and, obviously, such waters would need more stringent nutrient limits. Likewise, there are those waters within the Nation where phosphorus is not now a limiting nutrient and where the need for phosphorus limits is substantially diminished. It is evident that a portion of that phosphorus that enters a stream or other flowing waterway eventually will reach a receiving lake or estuary either as a component of the fluid mass, as bed load sediments that are carried downstream, or as floating organic materials that may drift just above the stream’s bed or float on its water’s surface. Superimposed on the loading from the inflowing waterway, a lake or estuary may receive additional phosphorus as fallout from the atmosphere or as a direct introduction from shoreline areas. Another method to control the inflow of nutrients, particularly phosphates, into a lake is that of prescribing an annual loading to the receiving water. Vollenweider (1973) suggests total phosphorus (P) loadings, in grams per square meter of surface area per year, that will be a critical level for eutrophic conditions within the receiving waterway for a particular water volume. The mean depth of the lake in meters is divided by the hydraulic detention time in years. Vollenweider’s data suggest a range of loading values that should result in oligotrophic lake water quality: Oligotrophic or Eutrophic Mean Depth/Hydraulic Permissible or Critical Detention Time Loading Loading (meters/year) (grams/meter/year) (grams/meter/year) 0.5 0.07 0.14 1.0 0.10 0.20 2.5 0.16 0.32 5.0 0.22 0.45 7.5 0.27 0.55 10.0 0.32 0.63 25.0 0.50 1.00 50.0 0.71 1.41 75.0 0.87 1.73 100.0 1.00 2.00 There may be waterways where higher concentrations, or loadings, of total phosphorus do not produce eutrophication, as well as those waterways where lower concentrations or loadings of total phosphorus may be associated with populations of nuisance organisms. Waters now containing less than the specified amounts of phosphorus should not be degraded by the introduction of additional phosphates

18
It should be recognized that a number of specific exceptions can occur to reduce the threat of phosphorus as a contributor to lake eutrophication:
1. Naturally occurring phenomena may limit the development of plant nuisances. 2. Technological or cost effective limitations may help control introduced pollutants. 3. Waters may be highly laden with natural silts or colors which reduce the penetration of sunlight needed for plant photosynthesis. 4. Some waters physical features of steep banks, great depth, and substantial flows contribute to a history of no plant problems. 5. Waters may be managed primarily for waterfowl or other wildlife. 6. In some waters, nutrients other than phosphorus (such as nitrogen) is limiting to plant growth; the level and nature of such limiting nutrient would not be expected to increase to an extent that would influence eutrophication. 7. In some waters, phosphorus control cannot be sufficiently effective under present technology to make phosphorus the limiting nutrient.
Dissolved Solids, Conductivity, and Chlorides This discussion on the effects of total dissolved solids, chlorides, and conductivity on aquatic life and human health is a summary from the U.S. EPA’s Quality Criteria for Water, 1986 (EPA 1986). These criteria have been previously published by the EPA (Quality Criteria for Water, July 1976, PB-263943). The water quality criteria guidance documents do not constitute a national standard, but do reflect the scientific knowledge concerning the effects of these pollutants on receiving waters. Total dissolved solids, chlorides, and conductivity observations are typically used to indicate the magnitude of dissolved minerals in the water. The term total dissolved solids (or dissolved solids) is generally associated with freshwater and refers to the inorganic salts, small amounts of organic matter, and dissolved materials in the water (Sawyer 1960). Salinity is an oceanographic term, and although not precisely equivalent to the total dissolved salt content, it is related (Capurro 1970). Chlorides (not chlorine) are directly related to salinity because of the constant relationship between the major salts in sea water. Conductivity is a measure of the electrical conductivity of water and is also generally related to total dissolved solids, chlorides, or salinity. The principal inorganic anions (negatively charged ions) dissolved in fresh water include the carbonates, chlorides, sulfates, and nitrates (principally in groundwaters); the principal cations (positively charged ions) are sodium, potassium, calcium, and magnesium. All species of fish and other aquatic life must tolerate a range of dissolved solids concentrations in order to survive under natural conditions. Studies in Saskatchewan found that several common freshwater species survived 10,000 mg/L dissolved solids, that whitefish and pikeperch survived 15,000 mg/L, but only the stickleback survived 20,000 mg/L dissolved solids. It was concluded that lakes with dissolved solids in excess of 15,000 mg/L were unsuitable for most freshwater fishes (Rawson and Moore 1944). The 1968 NTAC Report also recommended maintaining osmotic pressure levels of less than that caused by a 15,000 mg/L solution of sodium chloride. Indirect effects of excess dissolved solids are primarily the elimination of desirable food plants and other habitat-forming plants. Rapid salinity changes cause plasmolysis of tender leaves and stems because of changes in osmotic pressure. The 1968 NTAC Report recommended the following limits in salinity variation from natural to protect wildlife habitats: Natural Salinity Variation Permitted (parts per thousand) (parts per thousand) 0 to 3.5 (freshwater) 1 3.5 to 13.5 (brackish water) 2
19
13.5 to 35 (seawater) 4 The State of Alabama has used a chloride criteria of 230 mg/L to protect aquatic life in the Cahaba River. Temperature This discussion on the effects of temperature is a summary from the U.S. EPA’s Quality Criteria for Water, 1986 (EPA 1986). These criteria have been previously published by the EPA (Quality Criteria for Water, July 1976, PB-263943). The water quality criteria guidance documents do not constitute a national standard, but do reflect the scientific knowledge concerning the effects of these pollutants on receiving waters. State of Alabama temperature standards are also discussed. Water temperature affects many beneficial uses, including industrial and domestic water supplies and recreation. The effects of temperature on aquatic life are of the most concern, however, and the water quality criteria were developed to protect the most sensitive aquatic organisms from stress associated with elevated temperatures. Since essentially all of the aquatic organisms are cold blooded, the temperature of the water regulates their metabolism and their ability to survive and reproduce. Temperature, therefore, is an important physical parameter which to some extent regulates many of the beneficial uses of water. The Federal Water Pollution Control Administration in 1967 called temperature “a catalyst, a depressant, an activator, a restrictor, a stimulator, a controller, a killer, one of the most important and most influential water quality characteristics to life in water.” The suitability of water for total body immersion is greatly affected by temperature. In temperate climates, dangers from exposure to low temperatures is more prevalent than exposure to elevated water temperatures. Depending on the amount of activity by the swimmer, comfortable temperatures range from 20o C to 30o C. Short durations of lower and higher temperatures can be tolerated by most individuals. For example, for a 30-minute period, temperatures of 10o C or 35o C can be tolerated without harm by most individuals (NAS 1974). Temperature also affects the self-purification phenomenon in water bodies and therefore the aesthetic and sanitary qualities that exist. Increased temperatures accelerate the biodegradation of organic material both in the overlying water and in bottom deposits which makes increased demands on the dissolved oxygen resources of a given system. The typical situation is exacerbated by the fact that oxygen becomes less soluble as water temperature increases. Thus, greater demands are exerted on an increasingly scarce resource which may lead to total oxygen depletion and obnoxious septic conditions. Temperature changes in water bodies can alter the existing aquatic community. The dominance of various phytoplankton groups in specific temperature ranges has been shown. For example, from 20o C to 25o C, diatoms predominated; green algae predominated from 30o C; to 35o C and blue-greens predominated above 35o C (Cairns 1956). Likewise, changes from a coldwater fishery to a warm-water fishery can occur because temperature may be directly lethal to adults or fry, or cause a reduction of activity, or limit their reproduction (Brett 1969). Upper and lower limits for temperature have been established for many aquatic organisms. Considerably more data exist for upper, as opposed to lower limits. Tabulations of lethal temperatures for fish and other organisms are available (Jones 1964; FWPCA 1967; NAS 1974). Factors such as diet, activity, age, general health, osmotic stress, and even weather contribute to the lethality of temperature. The aquatic species and exposure time are considered the critical factors (Parker and Krenkel 1969). The effects of sublethal temperatures on metabolism, respiration, behavior, distribution and migration, feeding rate, growth, and reproduction have been summarized by De Sylva (1969). Another study has illustrated that inside the tolerance zone, there is a more restrictive temperature range in which normal activity and growth occur and yet an even more restrictive zone in which normal reproduction will be occur (Brett 1960).
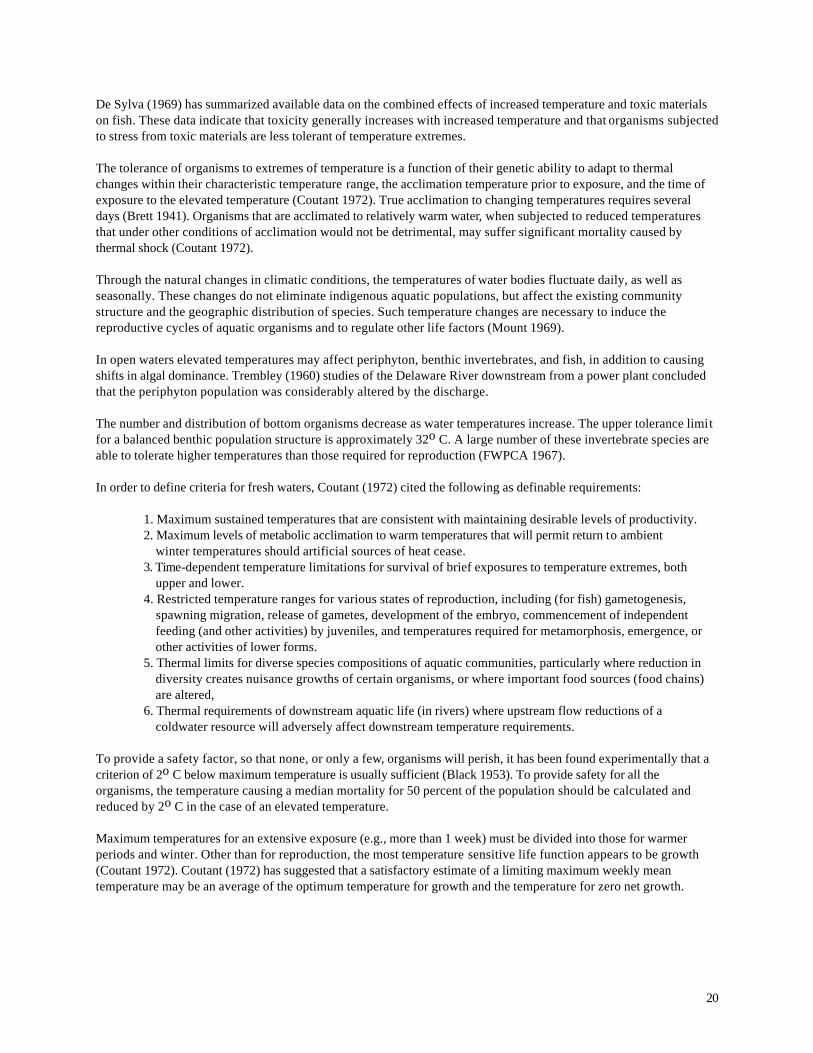
20
De Sylva (1969) has summarized available data on the combined effects of increased temperature and toxic materials on fish. These data indicate that toxicity generally increases with increased temperature and that organisms subjected to stress from toxic materials are less tolerant of temperature extremes. The tolerance of organisms to extremes of temperature is a function of their genetic ability to adapt to thermal changes within their characteristic temperature range, the acclimation temperature prior to exposure, and the time of exposure to the elevated temperature (Coutant 1972). True acclimation to changing temperatures requires several days (Brett 1941). Organisms that are acclimated to relatively warm water, when subjected to reduced temperatures that under other conditions of acclimation would not be detrimental, may suffer significant mortality caused by thermal shock (Coutant 1972). Through the natural changes in climatic conditions, the temperatures of water bodies fluctuate daily, as well as seasonally. These changes do not eliminate indigenous aquatic populations, but affect the existing community structure and the geographic distribution of species. Such temperature changes are necessary to induce the reproductive cycles of aquatic organisms and to regulate other life factors (Mount 1969). In open waters elevated temperatures may affect periphyton, benthic invertebrates, and fish, in addition to causing shifts in algal dominance. Trembley (1960) studies of the Delaware River downstream from a power plant concluded that the periphyton population was considerably altered by the discharge. The number and distribution of bottom organisms decrease as water temperatures increase. The upper tolerance limit for a balanced benthic population structure is approximately 32o C. A large number of these invertebrate species are able to tolerate higher temperatures than those required for reproduction (FWPCA 1967). In order to define criteria for fresh waters, Coutant (1972) cited the following as definable requirements:
1. Maximum sustained temperatures that are consistent with maintaining desirable levels of productivity. 2. Maximum levels of metabolic acclimation to warm temperatures that will permit return to ambient winter temperatures should artificial sources of heat cease. 3. Time-dependent temperature limitations for survival of brief exposures to temperature extremes, both upper and lower. 4. Restricted temperature ranges for various states of reproduction, including (for fish) gametogenesis, spawning migration, release of gametes, development of the embryo, commencement of independent feeding (and other activities) by juveniles, and temperatures required for metamorphosis, emergence, or other activities of lower forms. 5. Thermal limits for diverse species compositions of aquatic communities, particularly where reduction in diversity creates nuisance growths of certain organisms, or where important food sources (food chains) are altered, 6. Thermal requirements of downstream aquatic life (in rivers) where upstream flow reductions of a coldwater resource will adversely affect downstream temperature requirements.
To provide a safety factor, so that none, or only a few, organisms will perish, it has been found experimentally that a criterion of 2o C below maximum temperature is usually sufficient (Black 1953). To provide safety for all the organisms, the temperature causing a median mortality for 50 percent of the population should be calculated and reduced by 2o C in the case of an elevated temperature. Maximum temperatures for an extensive exposure (e.g., more than 1 week) must be divided into those for warmer periods and winter. Other than for reproduction, the most temperature sensitive life function appears to be growth (Coutant 1972). Coutant (1972) has suggested that a satisfactory estimate of a limiting maximum weekly mean temperature may be an average of the optimum temperature for growth and the temperature for zero net growth.
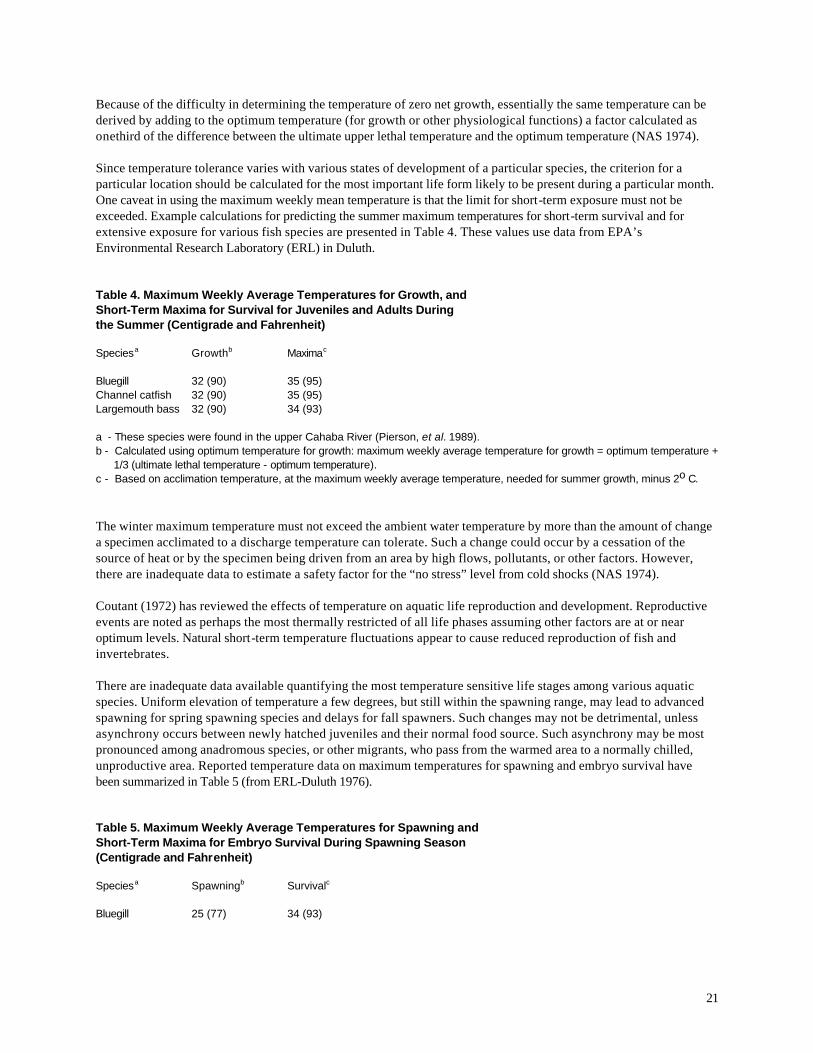
21
Because of the difficulty in determining the temperature of zero net growth, essentially the same temperature can be derived by adding to the optimum temperature (for growth or other physiological functions) a factor calculated as onethird of the difference between the ultimate upper lethal temperature and the optimum temperature (NAS 1974). Since temperature tolerance varies with various states of development of a particular species, the criterion for a particular location should be calculated for the most important life form likely to be present during a particular month. One caveat in using the maximum weekly mean temperature is that the limit for short-term exposure must not be exceeded. Example calculations for predicting the summer maximum temperatures for short-term survival and for extensive exposure for various fish species are presented in Table 4. These values use data from EPA’s Environmental Research Laboratory (ERL) in Duluth. Table 4. Maximum Weekly Average Temperatures for Growth, and Short-Term Maxima for Survival for Juveniles and Adults During the Summer (Centigrade and Fahrenheit) Speciesa Growthb Maximac Bluegill 32 (90) 35 (95) Channel catfish 32 (90) 35 (95) Largemouth bass 32 (90) 34 (93) a - These species were found in the upper Cahaba River (Pierson, et al. 1989). b - Calculated using optimum temperature for growth: maximum weekly average temperature for growth = optimum temperature + 1/3 (ultimate lethal temperature - optimum temperature). c - Based on acclimation temperature, at the maximum weekly average temperature, needed for summer growth, minus 2o C. The winter maximum temperature must not exceed the ambient water temperature by more than the amount of change a specimen acclimated to a discharge temperature can tolerate. Such a change could occur by a cessation of the source of heat or by the specimen being driven from an area by high flows, pollutants, or other factors. However, there are inadequate data to estimate a safety factor for the “no stress” level from cold shocks (NAS 1974). Coutant (1972) has reviewed the effects of temperature on aquatic life reproduction and development. Reproductive events are noted as perhaps the most thermally restricted of all life phases assuming other factors are at or near optimum levels. Natural short-term temperature fluctuations appear to cause reduced reproduction of fish and invertebrates. There are inadequate data available quantifying the most temperature sensitive life stages among various aquatic species. Uniform elevation of temperature a few degrees, but still within the spawning range, may lead to advanced spawning for spring spawning species and delays for fall spawners. Such changes may not be detrimental, unless asynchrony occurs between newly hatched juveniles and their normal food source. Such asynchrony may be most pronounced among anadromous species, or other migrants, who pass from the warmed area to a normally chilled, unproductive area. Reported temperature data on maximum temperatures for spawning and embryo survival have been summarized in Table 5 (from ERL-Duluth 1976). Table 5. Maximum Weekly Average Temperatures for Spawning and Short-Term Maxima for Embryo Survival During Spawning Season (Centigrade and Fahrenheit) Speciesa Spawningb Survivalc Bluegill 25 (77) 34 (93)
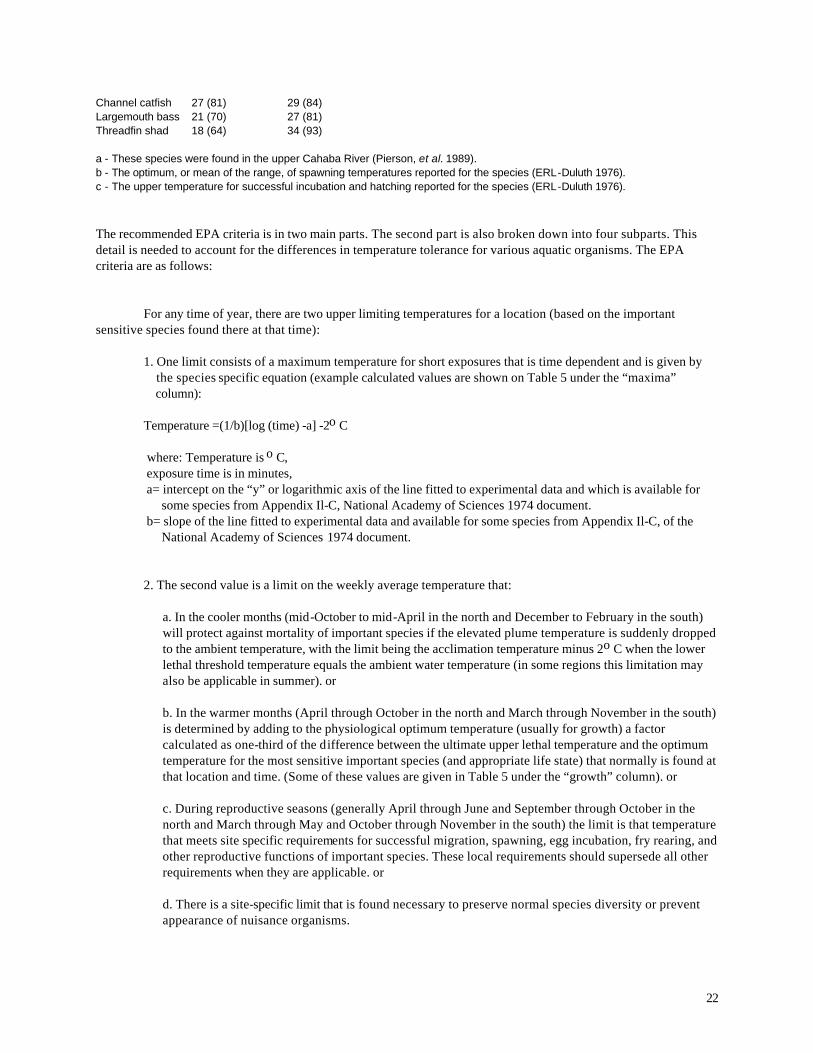
22
Channel catfish 27 (81) 29 (84) Largemouth bass 21 (70) 27 (81) Threadfin shad 18 (64) 34 (93) a - These species were found in the upper Cahaba River (Pierson, et al. 1989). b - The optimum, or mean of the range, of spawning temperatures reported for the species (ERL-Duluth 1976). c - The upper temperature for successful incubation and hatching reported for the species (ERL-Duluth 1976). The recommended EPA criteria is in two main parts. The second part is also broken down into four subparts. This detail is needed to account for the differences in temperature tolerance for various aquatic organisms. The EPA criteria are as follows: For any time of year, there are two upper limiting temperatures for a location (based on the important sensitive species found there at that time): 1. One limit consists of a maximum temperature for short exposures that is time dependent and is given by
the species specific equation (example calculated values are shown on Table 5 under the “maxima” column):
Temperature =(1/b)[log (time) -a] -2o C where: Temperature is o C,
exposure time is in minutes, a= intercept on the “y” or logarithmic axis of the line fitted to experimental data and which is available for
some species from Appendix Il-C, National Academy of Sciences 1974 document. b= slope of the line fitted to experimental data and available for some species from Appendix Il-C, of the
National Academy of Sciences 1974 document. 2. The second value is a limit on the weekly average temperature that:
a. In the cooler months (mid-October to mid-April in the north and December to February in the south) will protect against mortality of important species if the elevated plume temperature is suddenly dropped to the ambient temperature, with the limit being the acclimation temperature minus 2o C when the lower lethal threshold temperature equals the ambient water temperature (in some regions this limitation may also be applicable in summer). or b. In the warmer months (April through October in the north and March through November in the south) is determined by adding to the physiological optimum temperature (usually for growth) a factor calculated as one-third of the difference between the ultimate upper lethal temperature and the optimum temperature for the most sensitive important species (and appropriate life state) that normally is found at that location and time. (Some of these values are given in Table 5 under the “growth” column). or c. During reproductive seasons (generally April through June and September through October in the north and March through May and October through November in the south) the limit is that temperature that meets site specific requirements for successful migration, spawning, egg incubation, fry rearing, and other reproductive functions of important species. These local requirements should supersede all other requirements when they are applicable. or d. There is a site-specific limit that is found necessary to preserve normal species diversity or prevent appearance of nuisance organisms.
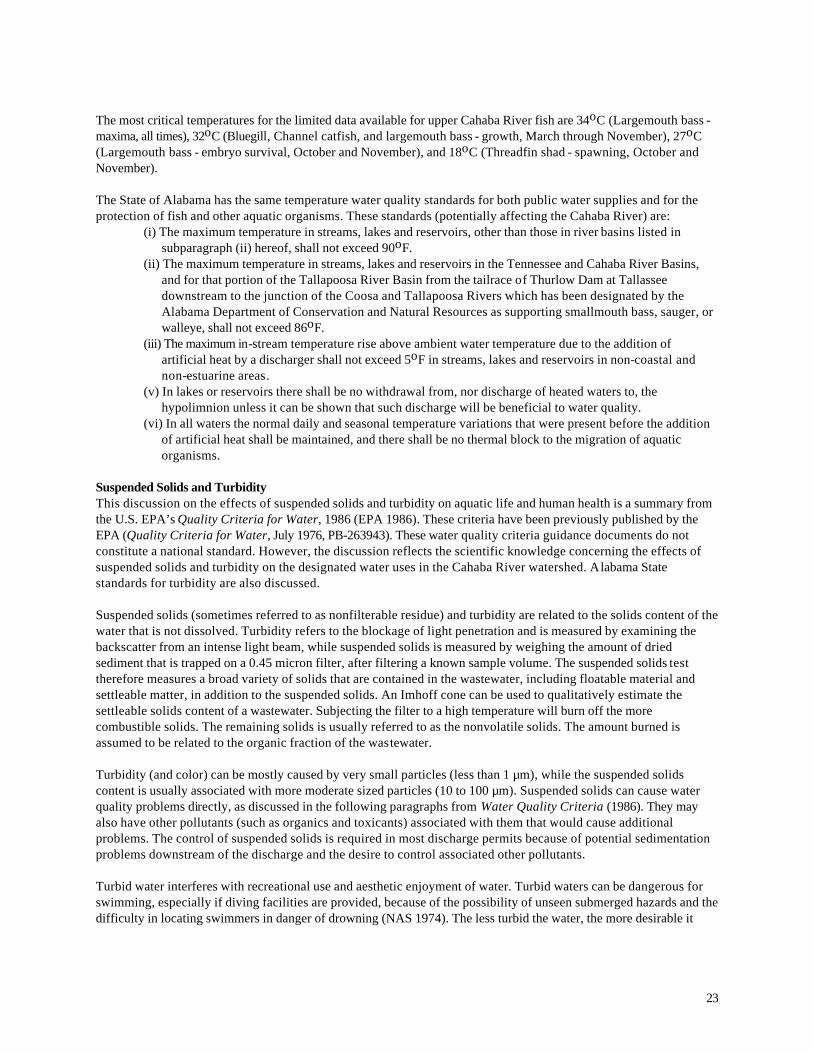
23
The most critical temperatures for the limited data available for upper Cahaba River fish are 34oC (Largemouth bass - maxima, all times), 32oC (Bluegill, Channel catfish, and largemouth bass - growth, March through November), 27oC (Largemouth bass - embryo survival, October and November), and 18oC (Threadfin shad - spawning, October and November). The State of Alabama has the same temperature water quality standards for both public water supplies and for the protection of fish and other aquatic organisms. These standards (potentially affecting the Cahaba River) are: (i) The maximum temperature in streams, lakes and reservoirs, other than those in river basins listed in
subparagraph (ii) hereof, shall not exceed 90oF. (ii) The maximum temperature in streams, lakes and reservoirs in the Tennessee and Cahaba River Basins,
and for that portion of the Tallapoosa River Basin from the tailrace of Thurlow Dam at Tallassee downstream to the junction of the Coosa and Tallapoosa Rivers which has been designated by the Alabama Department of Conservation and Natural Resources as supporting smallmouth bass, sauger, or walleye, shall not exceed 86oF.
(iii) The maximum in-stream temperature rise above ambient water temperature due to the addition of artificial heat by a discharger shall not exceed 5oF in streams, lakes and reservoirs in non-coastal and non-estuarine areas.
(v) In lakes or reservoirs there shall be no withdrawal from, nor discharge of heated waters to, the hypolimnion unless it can be shown that such discharge will be beneficial to water quality.
(vi) In all waters the normal daily and seasonal temperature variations that were present before the addition of artificial heat shall be maintained, and there shall be no thermal block to the migration of aquatic organisms.
Suspended Solids and Turbidity This discussion on the effects of suspended solids and turbidity on aquatic life and human health is a summary from the U.S. EPA’s Quality Criteria for Water, 1986 (EPA 1986). These criteria have been previously published by the EPA (Quality Criteria for Water, July 1976, PB-263943). These water quality criteria guidance documents do not constitute a national standard. However, the discussion reflects the scientific knowledge concerning the effects of suspended solids and turbidity on the designated water uses in the Cahaba River watershed. Alabama State standards for turbidity are also discussed. Suspended solids (sometimes referred to as nonfilterable residue) and turbidity are related to the solids content of the water that is not dissolved. Turbidity refers to the blockage of light penetration and is measured by examining the backscatter from an intense light beam, while suspended solids is measured by weighing the amount of dried sediment that is trapped on a 0.45 micron filter, after filtering a known sample volume. The suspended solids test therefore measures a broad variety of solids that are contained in the wastewater, including floatable material and settleable matter, in addition to the suspended solids. An Imhoff cone can be used to qualitatively estimate the settleable solids content of a wastewater. Subjecting the filter to a high temperature will burn off the more combustible solids. The remaining solids is usually referred to as the nonvolatile solids. The amount burned is assumed to be related to the organic fraction of the wastewater. Turbidity (and color) can be mostly caused by very small particles (less than 1 µm), while the suspended solids content is usually associated with more moderate sized particles (10 to 100 µm). Suspended solids can cause water quality problems directly, as discussed in the following paragraphs from Water Quality Criteria (1986). They may also have other pollutants (such as organics and toxicants) associated with them that would cause additional problems. The control of suspended solids is required in most discharge permits because of potential sedimentation problems downstream of the discharge and the desire to control associated other pollutants. Turbid water interferes with recreational use and aesthetic enjoyment of water. Turbid waters can be dangerous for swimming, especially if diving facilities are provided, because of the possibility of unseen submerged hazards and the difficulty in locating swimmers in danger of drowning (NAS 1974). The less turbid the water, the more desirable it
24
becomes for swimming and other water contact sports. Other recreational pursuits, such as boating and fishing, will be adequately protected by suspended solids criteria developed for protection of fish and other aquatic life. Fish and other aquatic life requirements concerning suspended solids can be divided into those whose effect occurs in the water column and those whose effect occurs following sedimentation to the bottom of the water body. Noted effects are similar for both fresh and marine waters. The effects of suspended solids on fish have been reviewed by the European Inland Fisheries Advisory Commission (EIFAC 1965). This review in 1965 identified four effects on the fish and fish food populations, namely: (1) By acting directly on the fish swimming in water in which solids are suspended, and either killing them or reducing their growth rate, resistance to disease, etc.; (2) by preventing the successful development of fish eggs and larvae; (3) by modifying natural movements and migrations of fish; and (4) by reducing the abundance of food available to the fish. Settleable materials which blanket the bottom of water bodies damage the invertebrate populations, block gravel spawning beds, and if organic, remove dissolved oxygen from overlying waters (EIFAC 1965; Edberg and Hofsten 1973). In a study downstream from the discharge of a rock quarry where inert suspended solids were increased to 80 mg/L, the density of macroinvertebrates decreased by 60 percent while in areas of sediment accumulation, benthic invertebrate populations also decreased by 60 percent regardless of the suspended solid concentrations (Gammon 1970). Similar effects have been reported downstream from an area which was intensively logged. Major increases in stream suspended solids (25 mg/L upstream versus 390 mg/L downstream) caused smothering of bottom invertebrates, reducing organism density to only 7.3 per square foot versus 25.5 per square foot upstream (Tebo 1955). Deposition of organic materials to the bottom sediments can cause imbalances in stream biota by increasing bottom animal density (principally worms), and diversity is reduced as pollution-sensitive forms disappear (Mackenthun 1973). Algae, likewise, flourish in such nutrient-rich areas, although forms may become less desirable (Tarzwell and Gaufin 1953). Plankton and inorganic suspended materials reduce light penetration into the water body, reducing the depth of the photic zone. This reduces primary production and decreases fish food. The NAS committee in 1974 recommended that the depth of light penetration not be reduced by more than 10 percent (NAS 1974). Additionally, the near surface waters are heated because of the greater heat absorbency of the particulate material which tends to stabilize the water column and prevents vertical mixing (NAS 1974). Such mixing reductions decrease the dispersion of dissolved oxygen and nutrients to lower portions of the water body. Increased temperatures also reduce the capacity of the stream to contain dissolved oxygen. Suspended inorganic material in water also sorbs organic materials, such as pesticides. Following this sorption process, subsequent sedimentation may remove these materials from the water column into the sediments (NAS 1974). However, the sedimentation of these polluted sediments can cause dramatic changes in the benthic microorganism populations, which in turn affect other aquatic life forms. More recent research associated with the effects of polluted sediments in urban streams is summarized by Pitt (1991). The EPA water quality criterion for freshwater fish and other aquatic life are essentially that proposed by the National Academy of Sciences and the Great Lakes Water Quality Board: “Settleable and suspended solids should not reduce the depth of the compensation point for photosynthetic activity by more than 10 percent from the seasonally established norm for aquatic life.” The state of Alabama water quality criterion for turbidity is the same for all designated uses: “There shall be no turbidity of other than natural origin that will cause substantial visible contrast with the natural appearance of waters or interfere with any beneficial uses which they serve. Furthermore, in no case
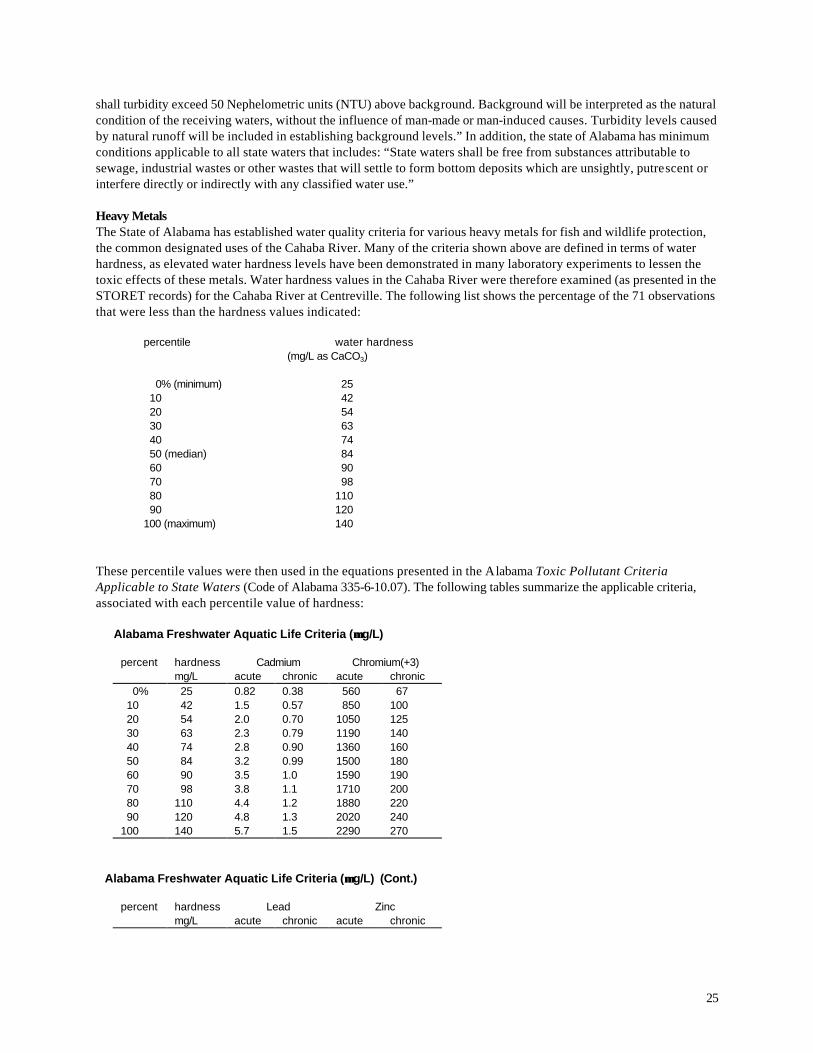
25
shall turbidity exceed 50 Nephelometric units (NTU) above background. Background will be interpreted as the natural condition of the receiving waters, without the influence of man-made or man-induced causes. Turbidity levels caused by natural runoff will be included in establishing background levels.” In addition, the state of Alabama has minimum conditions applicable to all state waters that includes: “State waters shall be free from substances attributable to sewage, industrial wastes or other wastes that will settle to form bottom deposits which are unsightly, putrescent or interfere directly or indirectly with any classified water use.” Heavy Metals The State of Alabama has established water quality criteria for various heavy metals for fish and wildlife protection, the common designated uses of the Cahaba River. Many of the criteria shown above are defined in terms of water hardness, as elevated water hardness levels have been demonstrated in many laboratory experiments to lessen the toxic effects of these metals. Water hardness values in the Cahaba River were therefore examined (as presented in the STORET records) for the Cahaba River at Centreville. The following list shows the percentage of the 71 observations that were less than the hardness values indicated: percentile water hardness (mg/L as CaCO3) 0% (minimum) 25 10 42 20 54 30 63 40 74 50 (median) 84 60 90 70 98 80 110 90 120 100 (maximum) 140 These percentile values were then used in the equations presented in the Alabama Toxic Pollutant Criteria Applicable to State Waters (Code of Alabama 335-6-10.07). The following tables summarize the applicable criteria, associated with each percentile value of hardness: Alabama Freshwater Aquatic Life Criteria (µµ g/L)
percent hardness Cadmium Chromium(+3) mg/L acute chronic acute chronic 0% 25 0.82 0.38 560 67 10 42 1.5 0.57 850 100 20 54 2.0 0.70 1050 125 30 63 2.3 0.79 1190 140 40 74 2.8 0.90 1360 160 50 84 3.2 0.99 1500 180 60 90 3.5 1.0 1590 190 70 98 3.8 1.1 1710 200 80 110 4.4 1.2 1880 220 90 120 4.8 1.3 2020 240 100 140 5.7 1.5 2290 270
Alabama Freshwater Aquatic Life Criteria (µµ g/L) (Cont.)
percent hardness Lead Zinc mg/L acute chronic acute chronic
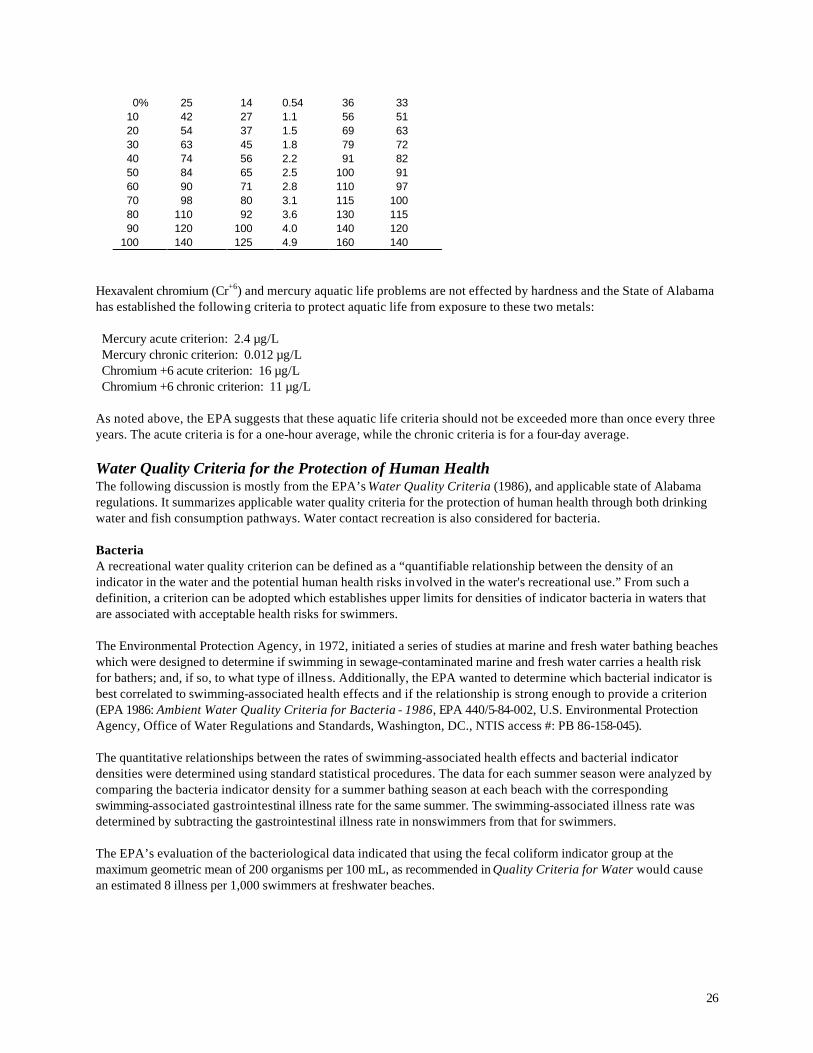
26
0% 25 14 0.54 36 33 10 42 27 1.1 56 51 20 54 37 1.5 69 63 30 63 45 1.8 79 72 40 74 56 2.2 91 82 50 84 65 2.5 100 91 60 90 71 2.8 110 97 70 98 80 3.1 115 100 80 110 92 3.6 130 115 90 120 100 4.0 140 120 100 140 125 4.9 160 140
Hexavalent chromium (Cr+6) and mercury aquatic life problems are not effected by hardness and the State of Alabama has established the following criteria to protect aquatic life from exposure to these two metals: Mercury acute criterion: 2.4 µg/L Mercury chronic criterion: 0.012 µg/L Chromium +6 acute criterion: 16 µg/L Chromium +6 chronic criterion: 11 µg/L As noted above, the EPA suggests that these aquatic life criteria should not be exceeded more than once every three years. The acute criteria is for a one-hour average, while the chronic criteria is for a four-day average.
Water Quality Criteria for the Protection of Human Health The following discussion is mostly from the EPA’s Water Quality Criteria (1986), and applicable state of Alabama regulations. It summarizes applicable water quality criteria for the protection of human health through both drinking water and fish consumption pathways. Water contact recreation is also considered for bacteria. Bacteria A recreational water quality criterion can be defined as a “quantifiable relationship between the density of an indicator in the water and the potential human health risks involved in the water's recreational use.” From such a definition, a criterion can be adopted which establishes upper limits for densities of indicator bacteria in waters that are associated with acceptable health risks for swimmers. The Environmental Protection Agency, in 1972, initiated a series of studies at marine and fresh water bathing beaches which were designed to determine if swimming in sewage-contaminated marine and fresh water carries a health risk for bathers; and, if so, to what type of illness. Additionally, the EPA wanted to determine which bacterial indicator is best correlated to swimming-associated health effects and if the relationship is strong enough to provide a criterion (EPA 1986: Ambient Water Quality Criteria for Bacteria - 1986, EPA 440/5-84-002, U.S. Environmental Protection Agency, Office of Water Regulations and Standards, Washington, DC., NTIS access #: PB 86-158-045). The quantitative relationships between the rates of swimming-associated health effects and bacterial indicator densities were determined using standard statistical procedures. The data for each summer season were analyzed by comparing the bacteria indicator density for a summer bathing season at each beach with the corresponding swimming-associated gastrointestinal illness rate for the same summer. The swimming-associated illness rate was determined by subtracting the gastrointestinal illness rate in nonswimmers from that for swimmers. The EPA’s evaluation of the bacteriological data indicated that using the fecal coliform indicator group at the maximum geometric mean of 200 organisms per 100 mL, as recommended in Quality Criteria for Water would cause an estimated 8 illness per 1,000 swimmers at freshwater beaches.
27
Newer criteria, using E. coli and enterococci bacteria analyses, were developed using these currently accepted illness rates. These bacteria are assumed to be more specifically related to poorly treated human sewage than the fecal coliform bacteria indicator. The equations developed by Dufour (1983: Health Effects Criteria for Fresh Recreational Waters, EPA-600/1-84-004, U.S. Environmental Protection Agency, Cincinnati, OH.) were used to calculate new indicator densities corresponding to the accepted gastrointestinal illness rates. The EPA did not recommend changing the stringency of its bacterial criteria for recreational waters. Such a change did not appear warranted until more information, based on greater experience with the new indicators, can be obtained. The EPA and the State Agencies will then evaluate the impacts of change in terms of beach closures and other restricted uses. It should be noted that these indicators only relate to gastrointestinal illness, and not other problems associated with waters contaminated with other bacterial or viral pathogens. Common swimming beach problems associated with contamination by nonpoint water pollution sources include skin and ear infections caused by Psuedomonas aeruginosa and Shigella. The Alabama standards for fecal coliforms vary for public water supplies and for the protection of fish and wildlife. The public water supply standards are as follows: (i) Bacteria of the fecal coliform group shall not exceed a geometric mean of 2,000/100 mL; nor exceed a maximum of 4,000/100 mL in any sample. The geometric mean shall be calculated from no less than five samples collected at a given station over a 30-day period at intervals not less than 24 hours. The membrane filter counting procedure will be preferred, but the multiple tube technique (five-tube) is acceptable. (ii) For incidental water contact and recreation during June through September, the bacterial quality of water is acceptable when a sanitary survey by the controlling health authorities reveals no source of dangerous pollution and when the geometric mean fecal coliform organism density does not exceed 100/100 mL in coastal waters and 200/100 mL in other waters. When the geometric mean fecal coliform organism density exceeds these levels, the bacterial water quality shall be considered acceptable only if a second detailed sanitary survey and evaluation discloses no significant public health risk in the use of such waters. Waters in the immediate vicinity of discharges of sewage or other wastes likely to contain bacteria harmful to humans, regardless of the degree of treatment afforded these wastes, are not acceptable for swimming or other whole body water-contact sports. Hardness The determination of hardness in raw waters subsequently treated and used for domestic water supplies is useful as a parameter to characterize the total dissolved solids present and for calculating chemical dosages for water softening. Because hardness concentrations in water have not been proven to be health related, the final level of hardness to be achieved by water treatment principally is a function of economics. Since water hardness can be removed with treatment by such processes as lime-soda softening and ion exchange systems, a water quality criterion for raw waters used as a public water supply is not given by the EPA. Nitrates In quantities normally found in food or feed, nitrates become toxic only under conditions in which they are, or may be, reduced to nitrites. Otherwise, at “reasonable” concentrations, nitrates are rapidly excreted in the urine. High intake of nitrates constitutes a hazard primarily to warmblooded animals under conditions that are favorable to reduction to nitrite. Under certain circumstances, nitrate can be reduced to nitrite in the gastrointestinal tract which then reaches the bloodstream and reacts directly with hemoglobin to produce methemoglobin, consequently impairing oxygen transport. The reaction of nitrite with hemoglobin can be hazardous in infants under three months of age. Serious and occasionally fatal poisonings in infants have occurred following ingestion of untreated well waters shown to contain nitrate at concentrations greater than 10 mg/L nitrate nitrogen (N) (NAS 1974). High nitrate concentrations frequently are found in shallow farm and rural community wells, often as the result of inadequate protection from barnyard drainage or from septic tanks (USPHS 1961; Stewart, et al. 1967). Increased concentrations of nitrates also have been
28
found in streams from farm tile drainage in areas of intense fertilization and farm crop production (Harmeson, et al. 1971). Approximately 2,000 cases of infant methemoglobinemia have been reported in Europe and North America since 1945; 7 to 8 percent of the affected infants died (Walton 1951; Sattelmacher 1962). Many infants have drunk water in which the nitrate nitrogen content was greater than 10 mg/L without developing methemoglobinemia. Many public water supplies in the United States contain levels that routinely exceed this amount, but only one U.S. case of infant methemoglobinemia associated with a public water supply has ever been reported (Virgil, et al. 1965). The differences in susceptibility to methemoglobinemia are not yet understood, but appear to be related to a combination of factors including nitrate concentration, enteric bacteria, and the lower acidity characteristic of the digestive systems of very young mammals. Methemoglobinemia systems and other toxic effects were observed when high nitrate well waters containing pathogenic bacteria were fed to laboratory mammals (Wolff, et al. 1972). Conventional water treatment has no significant effect on nitrate removal from water (NAS 1974). Because of the potential risk of methemoglobinemia to bottlefed infants, and in view of the absence of substantiated physiological effects at nitrate concentrations below 10 mg/L nitrate nitrogen, this level is the criterion for domestic water supplies. Waters with nitrite nitrogen concentrations over 1 mg/L should not be used for infant feeding. Waters with a significant nitrite concentration usually would be heavily polluted and probably bacteriologically unacceptable. Dissolved Solids, Conductivity, and Chlorides Excess dissolved solids are objectionable in drinking water because of possible physiological effects, unpalatable mineral tastes, and higher costs because of corrosion or the necessity for additional treatment. The physiological effects directly related to dissolved solids include laxative effects principally from sodium sulfate and magnesium sulfate and the adverse effect of sodium on certain patients afflicted with cardiac disease and women with toxemia associated with pregnancy. One study was made using data collected from wells in North Dakota. Results from a questionnaire showed that with wells in which sulfates ranged from 1,000 to 1,500 mg/L, 62 percent of the respondents indicated laxative effects associated with consumption of the water. However, nearly one-quarter of the respondents to the questionnaire reported difficulties when concentrations ranged from 200 to 500 mg /L (Moore 1952). To protect transients to an area, a sulfate level of 250 mg/L should afford reasonable protection from laxative effects. As indicated, sodium frequently is the principal component of dissolved solids. Persons on restricted sodium diets may have an intake restricted from 500 to 1,000 mg/day (National Research Council 1954). The portion ingested in water must be compensated by reduced levels in food ingested so that the total does not exceed the allowable intake. Using certain assumptions of water intake (e.g., 2 liters of water consumed per day) and the sodium content of food, it has been calculated that for very restricted sodium diets, 20 mg/L sodium in water would be the maximum, while for moderately restricted diets, 270 mg/L sodium would be the maximum. Specific sodium levels for entire water supplies have not been recommended by the EPA, but various restricted sodium intakes are recommended because: (1) the general population is not adversely affected by sodium, but various restricted sodium intakes are recommended by physicians for a significant portion of the population, and (2) 270 mg/L of sodium is representative of mineralized waters that may be aesthetically unacceptable, but many domestic water supplies exceed this level. Treatment for removal of sodium in water supplies is also costly (NAS 1974). A study based on consumer surveys in 29 California water systems was made to measure the taste threshold of dissolved salts in water (Bruvold, et al. 1969). Systems were selected to eliminate possible interferences from other taste-causing substances besides dissolved salts. The study revealed that consumers rated waters with 320 to 400 mg/L dissolved solids as “excellent” while those with 1,300 mg/L dissolved solids were “unacceptable.” A “good” rating was registered for dissolved solids less than 650 to 750 mg/L. The 1962 U.S. Public Health Service Drinking Water Standards recommended a maximum dissolved solids concentration of 500 mg/L, unless more suitable supplies were unavailable.

29
Specific constituents included in the dissolved solids in water may cause mineral tastes at lower concentrations than other constituents. Chloride ions have frequently been cited as having a low taste threshold in water. Data from Ricter and MacLean (1939) on a taste panel of 53 adults indicated that 61 mg/L NaCl was the median level for detecting a difference from distilled water. At a median concentration of 395 mg/L chloride, a salty taste was identified. Lockhart, et al. (1955) when evaluating the effect of chlorides on water used for brewing coffee, found threshold taste concentrations for chloride ranging from 210 mg/L to 310 mg/L, depending on the associated cation. These data indicate that a level of 250 mg/L chlorides is a reasonable maximum level to protect consumers of drinking water. The causation of corrosion and encrustation of metallic surfaces by water containing dissolved solids is well known. By using water with 1,750 mg/L dissolved solids as compared with 250 mg/L, service life was reduced from 70 percent for toilet flushing mechanisms to 30 percent for washing equipment. Such increased corrosion was calculated in 1968 to cost the consumer an additional $0.50 per 1,000 gallons used. The EPA criteria for chlorides and sulfates in domestic water supplies is 250 mg/L to protect human welfare. Toxic Organics Ten of the compounds identified during sampling in the upper Cahaba River reaches have Alabama state standards for the protection of human health, including five compounds that are recognized carcinogens. The following table lists these compounds, and the calculated limits: Water and Fish Consumption Fish Consumption Only Non-carcinogens: 2-chlorophenol 0.12 mg/L 0.40 mg/L Diethyl phthalate 23 118 Dimethyl phthalate 313 2900 Di-n-butly phthalate 3 12 Isophorone 7 490 Carcinogens: Benzo(ghi)perylene (PAH) 0.03 µg/L 0.31 µg/L Benzo(k)fluoranthene (PAH) 0.03 0.31 3,3 Dichloro-benzidine 0.39 0.77 Hexachlorobutadiene 4.5 500 N-nitrosodiphenylamine 50 160 Heavy Metals Alabama has also established toxic pollutant criteria for human health protection. These criteria are for carcinogens and non-carcinogens and are established for the consumption of both water and fish and for the consumption of fish only. The equations presented by the state of Alabama to calculate these criteria require that a reference dose and a bioconcentration factor be known for mercury and chromium. A cancer potency factor and a bioconcentration factor is also needed for arsenic, a recognized carcinogen. A risk level of 10-5 was initially given by the State of Alabama for arsenic causing cancers. This assumes one increased cancer case per 100,000 people associated with this pollutant and fish consumption. The reference doses and bioconcentration factors are now given by the State in their water quality criteria (Chapter 335-6-10, Appendix A). The state removed the arsenic criterion for human health protection in April 1991 and therefore do not include the cancer potency and bioconcentration factors for arsenic. These values are given by the EPA for 10-5, 10-6, and 10-7 risk levels (in Quality Criteria for Water 1986). The following list shows these criteria for human health criteria protection for fish consumption only: Arsenic: 0.175 µg/L (calculated using pg. 39, EPA 1986 values for 10-5 risk levels) Chromium(+3): 3433 mg/L (calculated using pg. 95, EPA 1986 and Alabama values) Mercury: 0.146 µg/L (calculated using pg. 177, EPA 1986 and Alabama values)
30
Specific numeric criteria have also been established by Alabama for the protection of human health caused by the consumption of fish alone for zinc (5 mg/L). Fish consumption related human health criteria have not been established for cadmium and lead by the State of Alabama.
Historical Observed Concentrations of Pollutants in the Cahaba River (1970-1990) Upper Cahaba River Water Quality Conditions Data from 858 samples collected in the upper Cahaba River watershed, except for the Little Cahaba River, were evaluated. This data was evaluated to identify current and likely water quality problems in this area of the Cahaba River watershed. The data was obtained from the EPA’s STORET data system and from the Birmingham Water Works Board (BWWB) files and covered the time from 1970 through 1990. The final 858 samples selected for evaluation were derived from more than 1500 samples in the original files. Many samples were eliminated because of mislabeling of the sampling location and for other quality assurance problems. Therefore, the samples evaluated best represent the water quality conditions in the upper Cahaba River. This report evaluates each water pollution parameter in relationship to existing EPA water quality criteria, Alabama water quality standards, and other information. Of special interest was identifying trends in water quality problems (both in time and location) that could be used to identify water pollution sources. Typically, different values apply to various beneficial uses of the water bodies. Alabama water uses are listed in the Water Use Classifications for Interstate and Intrastate Waters (ADEM) Code of Alabama Chapter 335-6-11. The Cahaba River is a designated public water supply from the small Highway 280 dam upstream to Grant’s Mill Road. All of the watershed also has fish and wildlife as a designated beneficial use. In addition, swimming is a recognized activity in the watershed during the months of June through September. The EPA water quality criteria and the Alabama standards also have separate toxicant criteria for the protection of human health through the consumption of fish and water, or the consumption of fish alone. The fish and water consumption criteria are only applied in areas that are a drinking water supply, while the consumption of fish criteria apply for areas having recreational or commercial fishing activities. Available water quality data were examined for many upper Cahaba River watershed locations, as described above, in order to demonstrate the geographical extent of any existing water quality problems in the upper reaches of the Cahaba River. It must be realized that the data examined likely do not represent all flow conditions. STORET data generally only contains information from standard long-term monitoring efforts that are mostly obtained during dry weather. Periodic special studies, such as the EPA’s Nationwide Urban Runoff Program (NURP) (EPA 1983), may contain wet weather sampling and submit data to a special STORET data file. Unfortunately, STORET generally doesn’t contain any information concerning rain history so it is not possible to separate data according to wet or dry conditions. The poor flow information in the STORET files reviewed also did not allow separate wet and dry weather data analyses. It usually rains every three to five days (but only for several hours each time) in the Birmingham area. It therefore only rains for a few percent of the hours of the year. However, rains also will effect the river for some time after the rain stops. The amount of many pollutants occurring in the river during wet weather (maybe affecting about ten percent of the time) can dramatically affect the annual mass loadings of many pollutants. Again, this wet weather data is probably under-represented in the data files available. Table 6 summarizes the water quality in the upper Cahaba River, as monitored at many locations, as contained in the EPA’s STORET and the Birmingham Water Works Board data files for the period of 1970 through 1990. Table 6. Water Quality Summary for the Upper Cahaba River (1970-1990) Constituent and units (mg/L, unless noted)
number of obs.
mean median stand. dev.
min. max.
Temperature (oC) 520 17.5 18 6.8 0.2 31
31
Turbidity (NTU) 449 14 8.1 19 nd 5 pH 545 7.5 7.5 0.6 5.2 11.9 Hardness (as CaCO3) 237 74 71 31 6.0 194 Dissolved oxygen 486 8.6 8.3 2.1 2.4 14 BOD5 463 1.4 0.9 1.5 nd 12.4 Total dissolved solids 37 108 104 36 8 212 Total suspended solids 236 7.9 5 9.5 nd 96 Specific conductivity (µmhos/cm) 368 321 178 647 55 5000 Chlorides 102 10 4 20 nd 130 Fecal coliform bacteria (#/100 mL) 184 234 42 1440 nd 19,400 Nitrate nitrogen 232 1.1 0.66 1.3 0.07 9.8 Ammonia nitrogen 69 0.56 0.17 2.4 nd 16 Phosphates (as P) 470 0.27 0.09 0.72 nd 10.3 Arsenic (µg/L) 77 <5 <10 9.6 nd 60 Cadmium (µg /L) 76 <10 <5 22 nd 70 Chromium (µg /L) 178 <7.5 <5 23 nd 138 Copper (µg /L) 150 <0.8 <5 69 nd 530 Iron 456 0.29 0.14 0.59 nd 7.9 Lead (µg /L) 349 25 <1 72 nd 90 Mercury (µg /L) 172 0.32 <0.5 2.5 nd 15 Zinc (µg /L) 151 27 <10 125 nd 870 note: “nd” is not detected. The detection limits vary greatly for each constituent and changed with time as new procedures were used. The following paragraphs briefly summarize the findings associated with evaluating each water pollution parameter for the upper Cahaba River watershed data. Temperature The most critical temperatures for the limited data available for upper Cahaba River fish are 34oC (Largemouth bass - maxima, all times), 32oC (Bluegill, Channel catfish, and largemouth bass - growth, March through November), 27oC (Largemouth bass - embryo survival, October and November), and 18oC (Threadfin shad - spawning, October and November). More than 520 samples were analyzed for temperature in the upper Cahaba River watershed from 1970 through 1990. The overall range observed was 0.2oC (32oF) to 31oC (88oF), while the average was 17.4oC (64oF). The grouped box plot (Figure 1) shows very little variation in observed temperatures along the watershed, except for a tributary in the upper watershed area that only contained relatively warm samples collected during August of 1987.
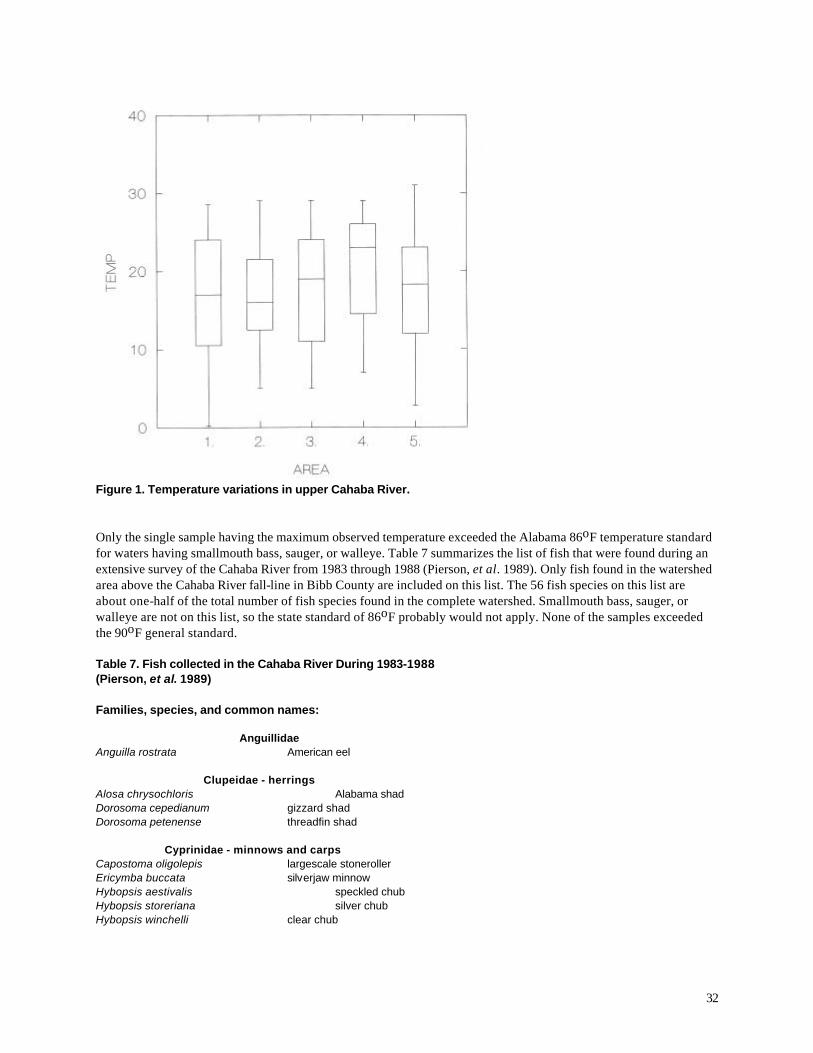
32
Figure 1. Temperature variations in upper Cahaba River. Only the single sample having the maximum observed temperature exceeded the Alabama 86oF temperature standard for waters having smallmouth bass, sauger, or walleye. Table 7 summarizes the list of fish that were found during an extensive survey of the Cahaba River from 1983 through 1988 (Pierson, et al. 1989). Only fish found in the watershed area above the Cahaba River fall-line in Bibb County are included on this list. The 56 fish species on this list are about one-half of the total number of fish species found in the complete watershed. Smallmouth bass, sauger, or walleye are not on this list, so the state standard of 86oF probably would not apply. None of the samples exceeded the 90oF general standard. Table 7. Fish collected in the Cahaba River During 1983-1988 (Pierson, et al. 1989) Families, species, and common names: Anguillidae Anguilla rostrata American eel Clupeidae - herrings Alosa chrysochloris Alabama shad Dorosoma cepedianum gizzard shad Dorosoma petenense threadfin shad Cyprinidae - minnows and carps Capostoma oligolepis largescale stoneroller Ericymba buccata silverjaw minnow Hybopsis aestivalis speckled chub Hybopsis storeriana silver chub Hybopsis winchelli clear chub
33
Notropis baileyi rough shiner Notropis bellus pretty shiner Notropis callistius Alabama shiner Notropis chrysocephalus striped shiner Notropis stilbius silverstripe shiner Notropis texanus weed shiner Notropis trichroistius tricolor shiner Notropis uranoscopus skygazer shiner Notropis venustus blacktail shiner Notropis volucellus mimic shiner Notropis sp.cf. longirostris Notropis sp.cf. volucellus Phenacobius catostomus riffle minnow Pimephales virgilax bullhead minnow Catostomidae - suckers Carpiodes velifer highfin carpsucker Erimyzon oblongus creek chubsucker Hypentelium etowanum Alabama hog sucker Moxostoma duquesnei black redhorse Moxostoma erythrurum golden redhorse Ictaluridae - freshwater catfishes Ictalurus punctatus channel catfish Noturus leptacanthus speckled madtom Noturus munitus frecklebelly madtom Cyprinodontidae - killifishes Fundulus olivaceus blackspotted topminnow Poeciliidae - livebearers Gambusia affinis mosquitofish Centrarchidae - sunfishes Ambloplites ariommus shadow bass Lepomis cyanellus green sunfish Lepomis macrochirus bluegill Lepomis megalotis longear sunfish Lepomis microlophus redear sunfish Lepomis punctatus spotted sunfish Micropterus coosae redeye sunfish Micropterus salmoides largemouth bass Percidae - perches Ammocrypta beani naked sand darter Ammocrypta meridiana southern sand darter Etheostoma histrio harlequin darter Etheostoma jordani greenbreast darter Etheostoma rupestre rock darter Etheostoma stigmaeum speckled darter Etheostoma (Ulocentra) sp. Percina aurolineata goldline darter Percina lenticula f reckled darter Percina nigrofasciata blackbanded darter Percina shumardi river darter Percina vigil saddleback darter Percina sp. cf. caprodes Percina sp. cf. copelandi Cottidae - sculpins
34
Cottus carolinae banded sculpin The only EPA criteria that were exceeded were the spawning season criteria, applicable for October and November. 82 of the 521 samples were collected during these two months and 25, or 30 percent, of the samples exceeded the critical 18oC criteria for threadfin shad. These were generally evenly spread over the length of the river sections, except none of the temperatures from the BWWB pump station location exceeded this spawning season criteria. Unfortunately, EPA critical temperatures were only available for three to four of the 56 fish species likely to be in the river section of interest. It is possible that some of the other fish present would have more restrictive temperature criteria than the treadfin shad. None of the temperature values exceeded the state general 90oF standard, and only one of 521 values exceeded the smallmouth bass 86oF State of Alabama standard. However, about one-third of the temperatures obtained during the October and November spawning season exceeded the EPA critical value for threadfin shad. Other fish may also be adversely affected during this critical time period, but temperature criteria are not available from EPA. Therefore, it is assumed that temperature is generally not of major concern, especially considering the high natural water temperatures in the area, except during critical spawning times. Care must be taken not to raise water temperatures by removing stream shading or by careless detention pond use that can significantly raise water temperatures. pH The EPA recommended water quality criteria for pH restricts pH values to be in the range of 5 to 9 for domestic water supplies (welfare), and within the range of 6.5 to 9.0 for freshwater aquatic life protection. The State of Alabama’s fresh water pH standards for public water supplies and aquatic life are: “Sewage, industrial wastes or other wastes shall not cause the pH to deviate more than one unit from the normal or natural pH, nor be less than 6.0, nor greater than 8.5.” Almost 550 pH observations were made in the upper Cahaba River watershed from 1970 through 1990, as shown in the grouped box plots in Figure 2. The overall observed pH range was 5.2 to 11.9, and the average pH value was 7.5. The values were compared to the above listed EPA criteria and Alabama standards. Few pH problems were noted, except for an unnamed tributary located about 2.1 miles upstream of the BWWB pumping station. Six of the eight samples exceeded all of the standards due to their high pH values (9.7 to 11.9). This tributary is likely affected by an old landfill. The average pH values were very similar for all river reaches, but the ranges increased in an upstream direction, excepting the above mentioned tributary. Almost all of the samples were in the range of 6.5 to 8.5 and therefore within the range of the criteria and standards. However, about two percent of the pH observations were in violation of the standards. About half of the violations were associated with the high pH values from the tributary, but most other violations were because of pH values that were too low. The low values (between pH 5 and 6) were mostly from a location about 28 miles upstream of the pumping station that had a lot of sampling activity. Except for the local source problem in the tributary, pH does not appear to be a major problem in the upper watershed.
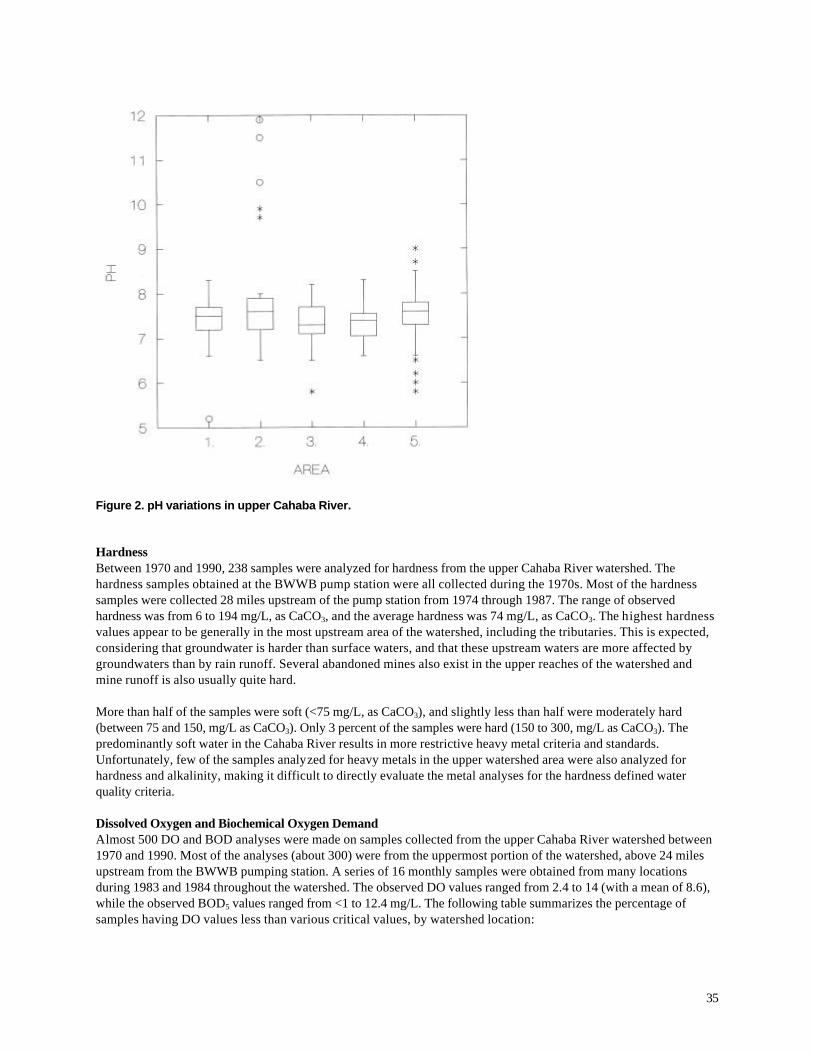
35
Figure 2. pH variations in upper Cahaba River. Hardness Between 1970 and 1990, 238 samples were analyzed for hardness from the upper Cahaba River watershed. The hardness samples obtained at the BWWB pump station were all collected during the 1970s. Most of the hardness samples were collected 28 miles upstream of the pump station from 1974 through 1987. The range of observed hardness was from 6 to 194 mg/L, as CaCO3, and the average hardness was 74 mg/L, as CaCO3. The highest hardness values appear to be generally in the most upstream area of the watershed, including the tributaries. This is expected, considering that groundwater is harder than surface waters, and that these upstream waters are more affected by groundwaters than by rain runoff. Several abandoned mines also exist in the upper reaches of the watershed and mine runoff is also usually quite hard. More than half of the samples were soft (<75 mg/L, as CaCO3), and slightly less than half were moderately hard (between 75 and 150, mg/L as CaCO3). Only 3 percent of the samples were hard (150 to 300, mg/L as CaCO3). The predominantly soft water in the Cahaba River results in more restrictive heavy metal criteria and standards. Unfortunately, few of the samples analyzed for heavy metals in the upper watershed area were also analyzed for hardness and alkalinity, making it difficult to directly evaluate the metal analyses for the hardness defined water quality criteria. Dissolved Oxygen and Biochemical Oxygen Demand Almost 500 DO and BOD analyses were made on samples collected from the upper Cahaba River watershed between 1970 and 1990. Most of the analyses (about 300) were from the uppermost portion of the watershed, above 24 miles upstream from the BWWB pumping station. A series of 16 monthly samples were obtained from many locations during 1983 and 1984 throughout the watershed. The observed DO values ranged from 2.4 to 14 (with a mean of 8.6), while the observed BOD5 values ranged from <1 to 12.4 mg/L. The following table summarizes the percentage of samples having DO values less than various critical values, by watershed location:
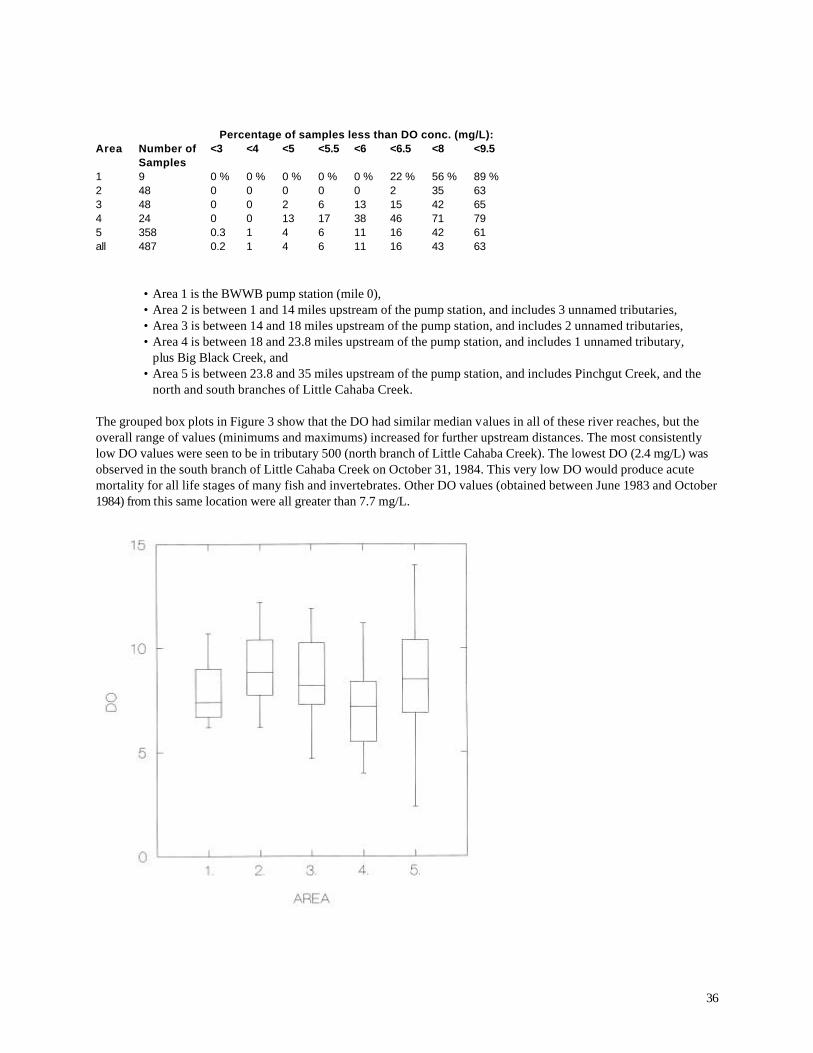
36
Percentage of samples less than DO conc. (mg/L): Area Number of
Samples <3 <4 <5 <5.5 <6 <6.5 <8 <9.5
1 9 0 % 0 % 0 % 0 % 0 % 22 % 56 % 89 % 2 48 0 0 0 0 0 2 35 63 3 48 0 0 2 6 13 15 42 65 4 24 0 0 13 17 38 46 71 79 5 358 0.3 1 4 6 11 16 42 61 all 487 0.2 1 4 6 11 16 43 63 • Area 1 is the BWWB pump station (mile 0), • Area 2 is between 1 and 14 miles upstream of the pump station, and includes 3 unnamed tributaries, • Area 3 is between 14 and 18 miles upstream of the pump station, and includes 2 unnamed tributaries, • Area 4 is between 18 and 23.8 miles upstream of the pump station, and includes 1 unnamed tributary,
plus Big Black Creek, and • Area 5 is between 23.8 and 35 miles upstream of the pump station, and includes Pinchgut Creek, and the
north and south branches of Little Cahaba Creek. The grouped box plots in Figure 3 show that the DO had similar median values in all of these river reaches, but the overall range of values (minimums and maximums) increased for further upstream distances. The most consistently low DO values were seen to be in tributary 500 (north branch of Little Cahaba Creek). The lowest DO (2.4 mg/L) was observed in the south branch of Little Cahaba Creek on October 31, 1984. This very low DO would produce acute mortality for all life stages of many fish and invertebrates. Other DO values (obtained between June 1983 and October 1984) from this same location were all greater than 7.7 mg/L.
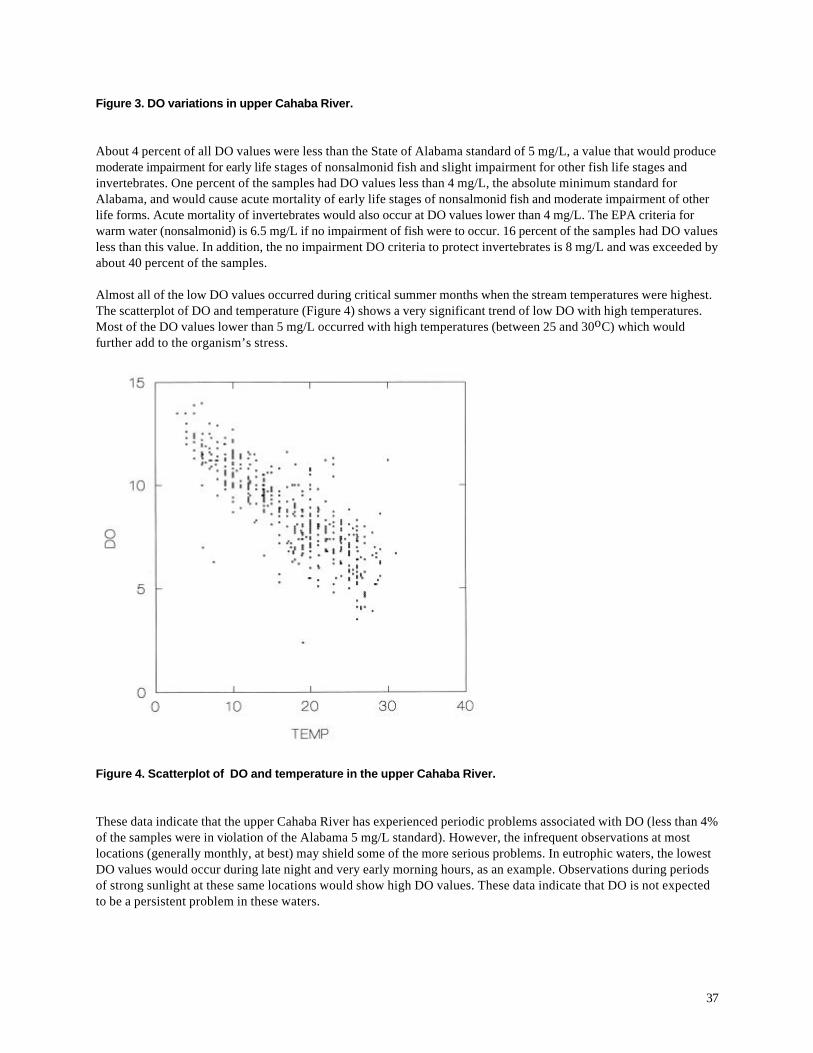
37
Figure 3. DO variations in upper Cahaba River. About 4 percent of all DO values were less than the State of Alabama standard of 5 mg/L, a value that would produce moderate impairment for early life stages of nonsalmonid fish and slight impairment for other fish life stages and invertebrates. One percent of the samples had DO values less than 4 mg/L, the absolute minimum standard for Alabama, and would cause acute mortality of early life stages of nonsalmonid fish and moderate impairment of other life forms. Acute mortality of invertebrates would also occur at DO values lower than 4 mg/L. The EPA criteria for warm water (nonsalmonid) is 6.5 mg/L if no impairment of fish were to occur. 16 percent of the samples had DO values less than this value. In addition, the no impairment DO criteria to protect invertebrates is 8 mg/L and was exceeded by about 40 percent of the samples. Almost all of the low DO values occurred during critical summer months when the stream temperatures were highest. The scatterplot of DO and temperature (Figure 4) shows a very significant trend of low DO with high temperatures. Most of the DO values lower than 5 mg/L occurred with high temperatures (between 25 and 30oC) which would further add to the organism’s stress.
Figure 4. Scatterplot of DO and temperature in the upper Cahaba River. These data indicate that the upper Cahaba River has experienced periodic problems associated with DO (less than 4% of the samples were in violation of the Alabama 5 mg/L standard). However, the infrequent observations at most locations (generally monthly, at best) may shield some of the more serious problems. In eutrophic waters, the lowest DO values would occur during late night and very early morning hours, as an example. Observations during periods of strong sunlight at these same locations would show high DO values. These data indicate that DO is not expected to be a persistent problem in these waters.
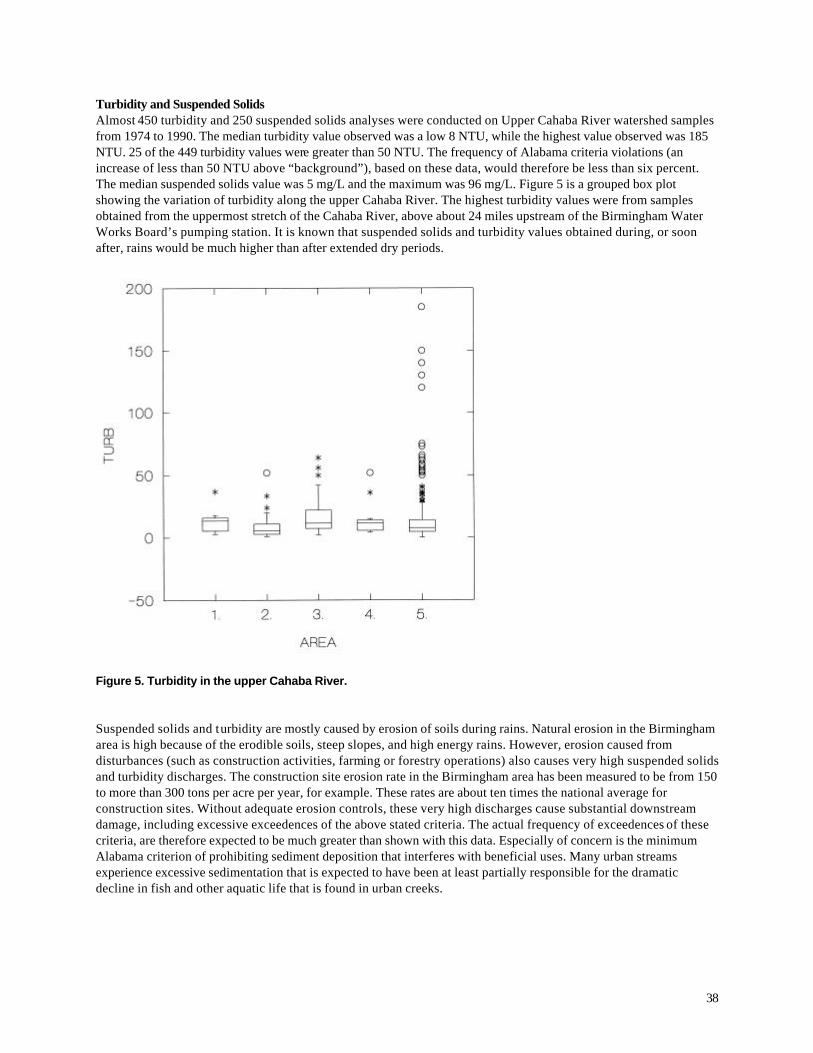
38
Turbidity and Suspended Solids Almost 450 turbidity and 250 suspended solids analyses were conducted on Upper Cahaba River watershed samples from 1974 to 1990. The median turbidity value observed was a low 8 NTU, while the highest value observed was 185 NTU. 25 of the 449 turbidity values were greater than 50 NTU. The frequency of Alabama criteria violations (an increase of less than 50 NTU above “background”), based on these data, would therefore be less than six percent. The median suspended solids value was 5 mg/L and the maximum was 96 mg/L. Figure 5 is a grouped box plot showing the variation of turbidity along the upper Cahaba River. The highest turbidity values were from samples obtained from the uppermost stretch of the Cahaba River, above about 24 miles upstream of the Birmingham Water Works Board’s pumping station. It is known that suspended solids and turbidity values obtained during, or soon after, rains would be much higher than after extended dry periods.
Figure 5. Turbidity in the upper Cahaba River. Suspended solids and turbidity are mostly caused by erosion of soils during rains. Natural erosion in the Birmingham area is high because of the erodible soils, steep slopes, and high energy rains. However, erosion caused from disturbances (such as construction activities, farming or forestry operations) also causes very high suspended solids and turbidity discharges. The construction site erosion rate in the Birmingham area has been measured to be from 150 to more than 300 tons per acre per year, for example. These rates are about ten times the national average for construction sites. Without adequate erosion controls, these very high discharges cause substantial downstream damage, including excessive exceedences of the above stated criteria. The actual frequency of exceedences of these criteria, are therefore expected to be much greater than shown with this data. Especially of concern is the minimum Alabama criterion of prohibiting sediment deposition that interferes with beneficial uses. Many urban streams experience excessive sedimentation that is expected to have been at least partially responsible for the dramatic decline in fish and other aquatic life that is found in urban creeks.
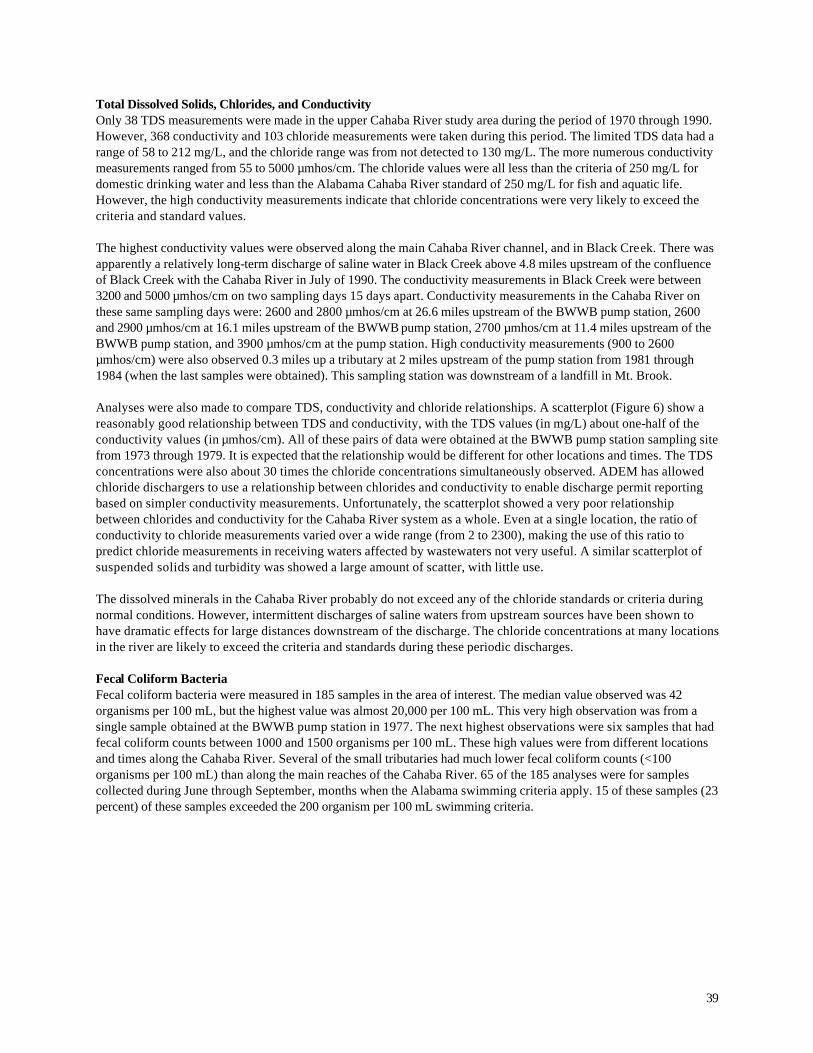
39
Total Dissolved Solids, Chlorides, and Conductivity Only 38 TDS measurements were made in the upper Cahaba River study area during the period of 1970 through 1990. However, 368 conductivity and 103 chloride measurements were taken during this period. The limited TDS data had a range of 58 to 212 mg/L, and the chloride range was from not detected to 130 mg/L. The more numerous conductivity measurements ranged from 55 to 5000 µmhos/cm. The chloride values were all less than the criteria of 250 mg/L for domestic drinking water and less than the Alabama Cahaba River standard of 250 mg/L for fish and aquatic life. However, the high conductivity measurements indicate that chloride concentrations were very likely to exceed the criteria and standard values. The highest conductivity values were observed along the main Cahaba River channel, and in Black Creek. There was apparently a relatively long-term discharge of saline water in Black Creek above 4.8 miles upstream of the confluence of Black Creek with the Cahaba River in July of 1990. The conductivity measurements in Black Creek were between 3200 and 5000 µmhos/cm on two sampling days 15 days apart. Conductivity measurements in the Cahaba River on these same sampling days were: 2600 and 2800 µmhos/cm at 26.6 miles upstream of the BWWB pump station, 2600 and 2900 µmhos/cm at 16.1 miles upstream of the BWWB pump station, 2700 µmhos/cm at 11.4 miles upstream of the BWWB pump station, and 3900 µmhos/cm at the pump station. High conductivity measurements (900 to 2600 µmhos/cm) were also observed 0.3 miles up a tributary at 2 miles upstream of the pump station from 1981 through 1984 (when the last samples were obtained). This sampling station was downstream of a landfill in Mt. Brook. Analyses were also made to compare TDS, conductivity and chloride relationships. A scatterplot (Figure 6) show a reasonably good relationship between TDS and conductivity, with the TDS values (in mg/L) about one-half of the conductivity values (in µmhos/cm). All of these pairs of data were obtained at the BWWB pump station sampling site from 1973 through 1979. It is expected that the relationship would be different for other locations and times. The TDS concentrations were also about 30 times the chloride concentrations simultaneously observed. ADEM has allowed chloride dischargers to use a relationship between chlorides and conductivity to enable discharge permit reporting based on simpler conductivity measurements. Unfortunately, the scatterplot showed a very poor relationship between chlorides and conductivity for the Cahaba River system as a whole. Even at a single location, the ratio of conductivity to chloride measurements varied over a wide range (from 2 to 2300), making the use of this ratio to predict chloride measurements in receiving waters affected by wastewaters not very useful. A similar scatterplot of suspended solids and turbidity was showed a large amount of scatter, with little use. The dissolved minerals in the Cahaba River probably do not exceed any of the chloride standards or criteria during normal conditions. However, intermittent discharges of saline waters from upstream sources have been shown to have dramatic effects for large distances downstream of the discharge. The chloride concentrations at many locations in the river are likely to exceed the criteria and standards during these periodic discharges. Fecal Coliform Bacteria Fecal coliform bacteria were measured in 185 samples in the area of interest. The median value observed was 42 organisms per 100 mL, but the highest value was almost 20,000 per 100 mL. This very high observation was from a single sample obtained at the BWWB pump station in 1977. The next highest observations were six samples that had fecal coliform counts between 1000 and 1500 organisms per 100 mL. These high values were from different locations and times along the Cahaba River. Several of the small tributaries had much lower fecal coliform counts (<100 organisms per 100 mL) than along the main reaches of the Cahaba River. 65 of the 185 analyses were for samples collected during June through September, months when the Alabama swimming criteria apply. 15 of these samples (23 percent) of these samples exceeded the 200 organism per 100 mL swimming criteria.

40
Figure 6. Scatterplot relating conductivity and TDS in samples from the upper Cahaba River. It is not uncommon for urban runoff to have fecal coliform counts of between 10,000 and 100,000 organisms per 100 mL which could contaminate large amounts of receiving waters. However, fecal coliforms in urban runoff are probably a poor indicator of gastrointestinal disease. Unfortunately, pathogens that cause skin and ear infections can be very common in urban runoff. Sampling close to runoff events will likely have much greater bacterial densities than after long dry periods. Discharges of poorly treated sanitary sewage and SSOs (sanitary sewer overflows) are also known to have occurred in the Cahaba River during this monitoring period. Bacteria potentially affecting water contact recreation are likely a problem in the Cahaba River area, especially considering the pathogens that are not well indicated by fecal coliforms. Nitrate Nitrogen Nitrate nitrogen concentrations were obtained from 233 samples from the upper Cahaba River area from 1970 through 1990. The maximum concentration observed was 9.8 mg/L, while the median concentration observed was about 0.7 mg/L. Therefore, all nitrate concentrations were below the 10 mg/L critical value for a public water supply, although five samples had concentrations greater than 5 mg/L. The nitrate concentrations do not appear to vary greatly with time or location, based on these data, as shown in Figure 7. With increased ammonia discharges into the river, probably associated with urbanization, the frequency of high nitrate concentrations will increase, with some eventual criteria exceedences. Ammonia and Kjeldahl Nitrogen The observed total ammonia concentrations from Cahaba River watershed samples ranged from <0.2 mg/L to 16 mg/L. The median concentration was 0.17 mg/L. As shown on the attached grouped box plot (Figure 8), all 69 observations reported (from March 1977 to August 1987) were less than 1 mg/L, except for two values that were very high (13.1 and 16 mg/L). These two high values were observed in a tributary (upper Little Cahaba River, about 28 miles above the Cahaba River pump station, between Big Black Creek and Pinchgut Creek). A series of samples were taken along this tributary on August 11, 12, and 13, 1987 to investigate high ammonia concentrations,
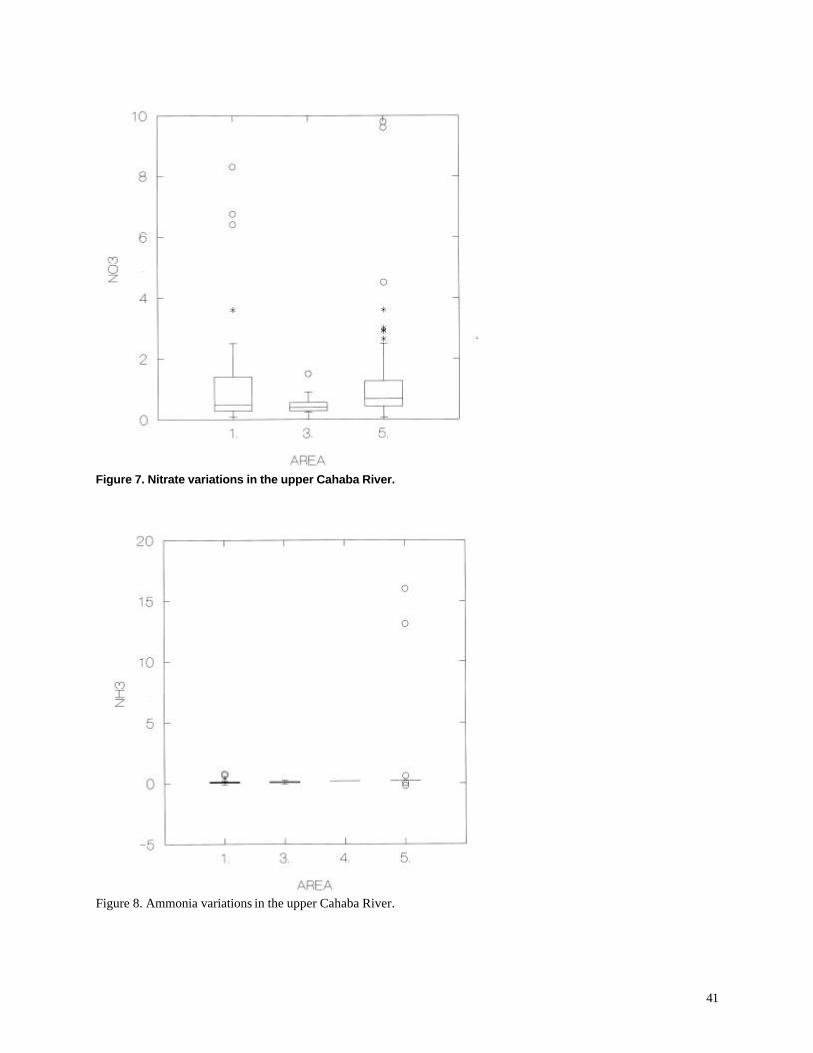
41
Figure 7. Nitrate variations in the upper Cahaba River.
Figure 8. Ammonia variations in the upper Cahaba River.
42
apparently associated with a chicken manure discharge problem. The data indicate that these high ammonia concentrations were only present very close to the most upstream site sampled. Samples taken downstream on these days were all less than 1 mg/L ammonia. High ammonia concentrations were present on both days that this upstream site was sampled. The ammonia data and criteria summary shows that the applicable ammonia criteria (based on concurrent pH and temperature conditions) were only exceeded twice (for the two highest concentrations, discussed above). These violations were very large (12.6 and 15.2 times the criteria) and existed for at least two days and therefore could be expected to have caused a severe water pollution incident (though limited in area). However, most of the observed concentrations were between 0.1 and 0.6 of the criteria. Most of the river system is nitrogen limited and dominated by point sources (sanitary sewage discharges). Current ammonia limitations on treated sewage discharges consider this problem, but additional ammonia loadings are inevitable with increased urban runoff. Any additional nitrogen discharges could significantly worsen the critical nutrient enrichment (eutrophication) conditions in the river. Phosphate Concentrations of phosphate forms of phosphorus were obtained from 471 samples, more than for any other analyses, except for temperature and pH. Most of the observed concentrations were between 0.05 and 1 mg/L, with several near or larger than 5 mg/L. All locations had similar concentrations, except for the North Fork of the Little Cahaba Creek (about 28 miles above the BWWB pump station). The concentrations in this creek reach were much greater than elsewhere, ranging from 1 to 10 mg/L. These samples were all obtained on August 11 through 13, 1987. These same samples also had the highest ammonia concentrations observed and were obtained during the investigation of an apparent excessive chicken manure discharge. Therefore, the typical range of total phosphate in the upper Cahaba River system is 0.05 to 1 mg/L (as P). Almost all of the phosphate observations from the main reaches of the Cahaba River were excessive when compared to the EPA recommended values to prevent eutrophication. Most of the tributary phosphate concentration values were less (with the exception noted above). The highest concentrations were generally found below about mile 28 from the pump station. Because of the persistence (in time) and wide spread nature of these relatively high concentrations, it is expected that eutrophication is a significant threat to the Cahaba River water quality, especially during summer months when the flows are less and in the presence of sunlight. Eutrophication is dependent on the excessive presence of all required nutrients. Algae requires phosphorus, nitrogen and carbon, along with many minor nutrients that are not generally limited. Carbon is also plentiful through organic matter (both natural and man-caused) and is rarely a limiting factor. Therefore, most determinations of eutrophication require simultaneous analyses of available nitrogen and phosphorus compounds. If the N/P ratio is less than 10, the river is assumed to be nitrogen limited (relatively rare in U.S. waters) and is point source dominated (especially by sanitary sewage discharges). If the N/P ratio is more than 10, the river is assumed to be phosphorus limited (much more common) and is nonpoint source dominated (such as by agriculture and urban runoff). Ammonia nitrogen (as N) and phosphates (as P) were simultaneously monitored in 16 Cahaba River samples at 21 to 32 miles above the pump station, and in 10 tributary samples. All of the simultaneous ammonia and phosphate observations were obtained during August 12 through 14, 1987, apparently as part of the chicken manure discharge investigation. During this short investigation, the N/P ratio was 10, or greater, in Black Creek and in another tributary slightly downstream of Black Creek. This implies that most of the river system was nitrogen limited and dominated by point sources, except for the local area noted. The average ammonia nitrogen concentration is about 0.15 mg/L and the phosphate concentration is about 0.1 mg/L over a long period of time in the main Cahaba River near the pump station. The resulting N/P ratio is expected to be about 1.5, signifying nitrogen limiting conditions and significant influences from sanitary sewage discharges. Ammonia nitrogen concentrations of 0.15 mg/L could result in chlorophyll concentrations of about 15 ug/L, which is
43
greater than the commonly accepted value of 10 ug/L for eutrophic conditions (if a lake). The 0.1 mg/L phosphate concentration could produce chlorophyll concentrations of 100 ug/L, which would be ten times the eutrophic limit. Therefore, any additional nitrogen discharges could significantly worsen the currently marginal conditions in the river and in downstream waters. Future nitrogen discharges are likely from increased nonpoint water discharges, especially associated with landscaping fertilizers. As noted previously, this is an unusual condition, as most waters are phosphorus limited, leading to severe restrictions on the use of phosphorus fertilizers and detergents. The Cahaba River received more sanitary sewage discharges than would be expected based on the amount of urban development in its’ watershed during this monitoring period. Ammonia limitations on the treated sewage discharges consider this problem, but additional ammonia loadings are inevitable with increased urban runoff. Arsenic The 78 reported filtered arsenic concentrations observed above the Cahaba River pump station operated by the BWWB ranged from <10 µg/L to a high of 60 µg /L. Most of the reported concentrations were below the detection limit (mostly 10 µg /L) and none of the observed arsenic concentrations exceeded the fish and wildlife criteria (190 µg /L was the lowest aquatic life criterion). However, many of the observations exceeded the EPA human health criteria. Only one sample (obtained at the BWWB pump station in 1979) exceeded the revised Alabama standard to protect human health. Unfortunately, the EPA human health standards were much less than the detection limits. Therefore, observed arsenic concentrations reported to be less than the detection limits do not imply that the EPA criteria were not exceeded. In fact, all of the reported concentrations greatly exceeded the EPA criteria, by 5 to more than 2500 times. Most of the arsenic observations were obtained at the pump station. Arsenic was also measured at 16, 28, and 32 miles upstream of the pump station, but only one of these 29 upper river samples had detectable concentrations. It is likely that arsenic concentrations are between 1 and 10 µg /L over much of the watershed study area. Based on the EPA guidance, these data imply that a significant increase in cancer may be associated with arsenic in the public drinking water supply. These criteria assume standard water treatment. Additional treatment to remove arsenic is not being used by the BWWB. Because of the linear relationship assumed between arsenic concentrations and increased cancer incidence, a 45 times exceedence of the 10-5 risk standard (associated with a total arsenic concentration of 1 µg/L) results in a 4.5X10⁻⁴ risk. Similarly, a 450 times exceedence of the 10-5 risk standard (associated with a total arsenic concentration of 10 µg/L) results in a 4.5X10⁻³ risk. With a million people being served by this water supply, 450 to 4,500 additional cancer cases may occur over each generation having a lifetime exposure drinking this water and eating fish from the river. If only fish are eaten, and the water is not consumed, then the increased cancer incidence would decrease to about 60 to 600. Therefore, most of the risk is associated with water consumption, by far the most common exposure route for arsenic. Cadmium Only 7 of the 77 cadmium observations from 1970 to 1990 in the upper Cahaba River area had detectable concentrations. The detection limits varied from 1 to 100 µg/L, while the observed concentrations ranged from 1 to 70 µg/L. It is difficult to compare the criteria with the observations, because most of the applicable cadmium criteria were much less than the detection limits. The observed values occurred in 1970, 1972, 1973, 1979, and 1990, at the pumping station and in Black Creek. The available criteria for freshwater aquatic life is dependent on concurrent hardness concentrations. About 1/3 of the cadmium observations did not have associated hardness values, and aquatic life criteria could not be calculated for these values. Chronic freshwater cadmium standards ranged from 0.24 µg/L (associated with a hardness value of only 14 mg/L as CaCO3) to 1.33 µg/L (associated with the maximum hardness value of 125 mg/L as CaCO3). Most all of these criteria were therefore much less than the detection limits of the analyses used. Two of the three detectable cadmium concentrations that had hardness values exceeded their associated chronic criteria by 1.8 and 107 times.
44
Similar problems with detection limits and the lack of hardness values affected the acute criteria comparisons. One of the three available values exceeded the associated criteria (by 38 times). All of the cadmium concentrations that exceeded the aquatic life criteria were from the pumping station location. The human health criterion associated with public water supplies (10 µg/L) is not dependent on hardness. Four of the seven detectable cadmium concentrations exceeded this human health criterion. The exceedences ranged from 1.2 to 7 times the criterion. Two of these exceedences were observed at the pumping station (a public water supply) and two were observed in Black Creek (a tributary to a public water supply, even though it does not have a public water supply designated use). It is expected that most of the cadmium concentrations would have exceeded the chronic aquatic life criteria, if the detection limits were appropriate and if complete hardness data were available. Many concentrations would probably have also exceeded the acute aquatic life criteria and the human health criterion, for similar reasons. Chromium Chromium data were obtained from 179 samples from the upper Cahaba River area. Most of the observations were below the detection limits of the analyses procedures used (generally from 2 to 10 µg/L). These samples were obtained from all areas of the study area and from 1970 through 1990. The maximum recorded concentrations were all found in the upper reaches of the Cahaba River (above 28 miles from the BWWB pumping station). The chromium concentrations in this reach were from 25 to 138 µg/L. The chromium concentrations downstream from this reach and from the tributaries were all 10 µg/L, or less. T he chromium observations were for filterable portions of the metal, but were not distinguished as to their valence state. The Cr+6 state is much more toxic than Cr+3, but is usually found in much smaller quantities. It is assumed that almost all of the chromium detected was as Cr+3. The EPA freshwater aquatic life criteria and Alabama standard for Cr+3 are dependent on concurrent water hardness values. Most of the chromium observations do not have associated hardness values. However, it is unlikely that Cr+3 causes an aquatic life problem, even at the highest recorded concentration of 138 µg/L. The lowest Cr+3 standard, associated with the lowest observed hardness value, was 41 µg/L which would be very rare. Typical 4-day chronic Cr+3 standards are between 100 and 200 µg/L. Only two of the 179 samples were 100 µg/L, or greater. Most of the detection limits were much less than these criteria and standards and were appropriate for these analyses. Acute Cr+3 standards were much greater, being about 1500 to 2500 µg/L, much greater than any chromium observations. The EPA’s Cr+6 aquatic life criteria are much more critical than for Cr+3. These are 16 µg/L for the acute 1-hr criterion and 11 µg/L for the chronic 4-day criterion. If all of the observed chromium was Cr+6 (highly unlikely), then these criteria would be exceeded by 1.6 to 12 times for three observations (out of 179), all located in the upper reach of the Cahaba River. The EPA’s human health criterion for Cr+3 was 3433 µg/L, which is much greater than any observed chromium concentration. The Cr+6 EPA human health criterion was 50 µg/L which may be periodically exceeded in the upper reach of the Cahaba River, if the chromium observations were all Cr+6 (very unlikely) and if the reach had a designated use as a public water supply (even though it is a tributary to one). It is therefore unlikely that chromium causes an aquatic life or human health problem in these waters. Copper Copper observations were well distributed throughout the upper Cahaba River area and from 1970 through 1990.The maximum copper concentration observed in the 151 samples available for the Cahaba River study area was 530 µg/L. Like chromium, the largest observed concentrations were from the upper reach of the Cahaba River, at about 28 miles upstream of the BWWB pump station. The highest concentrations were found at this area during 1974 through 1976. Copper concentrations since that time have generally been below the detection limits (an unfortunate high detection limit of 50 to 100 µg/L, due to the older available equipment). Other copper observations at lower reaches of the Cahaba River, near the pump station, ranged from 2 to 15 µg/L during this mid 1970s time period. Since 1983, the
45
detection limits have been substantially reduced to about 5 µg/L and more recent copper observations have been less than this limit. No copper observations from tributary samples (all from 1983 and 1984) were greater than the 5 µg/L detection limit. Again, most of the samples were not analyzed for hardness, making it impossible to calculate an appropriate standard for many of the observations. The most critical aquatic life standards occur during low hardness conditions. The lowest hardness recorded was 23 mg/L as CaCO3, with an associated chronic 4-day copper criterion of 3.37 µg/L. The acute 1-hr copper criterion for this critical hardness condition was 4.44 µg/L. Most of the chronic standards calculated were in the range of 5 to 14 µg/L and the acute standards in the range of 8 to 20 µg/L. The last copper observations that exceeded any of these standards and criteria were from 1977. Two copper values of 14 and 50 µg/L (but without concurrent hardness values) were obtained in 1983 and 1984, indicating the potential for infrequent standard violations. The human health criterion of 1,000 ug/L copper was only approached by the series of older samples previously described. These highest copper observations were still only 10 to 50 percent of this criterion. The largest observed concentrations of copper were found in the upper reach of the Cahaba River. The human health criterion is not likely exceeded in the area of the watershed studied. However, infrequent violations of the EPA aquatic life criteria may occur. Iron Iron was frequently monitored (457 observations were reported) in the upper Cahaba River area during the period from 1970 to 1990, probably because of its importance in areas having coal mining activity. The maximum iron concentration was 7.9 mg/L, while the median concentration was 0.14 mg/L. Seven high values were greater than 2 mg/L. As shown on the grouped box plot (Figure 9), the highest iron concentrations were found at the most upstream reach of the Cahaba River and the highest values at the different locations decreased in the downstream direction. The highest concentration of iron recorded was from a tributary (Pinchgut Creek) and was obtained in 1983. Other iron analyses in Pinchgut Creek (only sampled in 1983 and 1984) were all 0.12 to 1.35 mg/L (a typical range for iron elsewhere). The EPA aquatic life 1-hour acute criterion of 1.0 mg/L was exceeded infrequently in the Cahaba River, from the pumping station to about 28 miles upstream. Five of 279 reported samples exceeded the criterion in this downstream reach during the period 1970 through 1990. The exceedences were less than two times the standard in this river reach. The frequency and magnitude of exceedences increased in the upper river reach, to about four times the criterion. Fifteen of 65 samples exceeded this criterion in the upstream reach, implying frequent criterion violations that would be greater than the once per three years suggested maximum exceedence frequency for aquatic life criterion. The EPA human health (welfare) criterion was more frequently exceeded in all samples, compared to the aquatic life standard. In the lower reaches of the Cahaba River (from the pumping station to 28 miles upstream), the iron concentrations were up to four times the criterion and 48 of 279 samples exceeded the criterion. At the 28 mile location, three samples had iron concentrations more than ten times the human health (welfare) criterion. In the upper river reach, 37 of the 65 samples exceeded this criterion. These upper reaches do not have a designated use as a public water supply, but they are tributaries to the public water supply. The EPA aquatic life 1-hour acute criterion was exceeded infrequently in the Cahaba River. However, the EPA human health (welfare) criterion was frequently exceeded. There are no Alabama state standards for iron. Lead More samples (350) were analyzed for lead in the upper Cahaba River area than for any other heavy metal during the 1970 to 1990 period. The maximum observed concentration was 90 µg/L, but many of the samples had lead concentrations below the detection limits (usually 10 or 50 µg/L). As with most of the metals, the highest concentrations were associated with samples obtained from the upper reach of the Cahaba River (at 25 and 34 miles
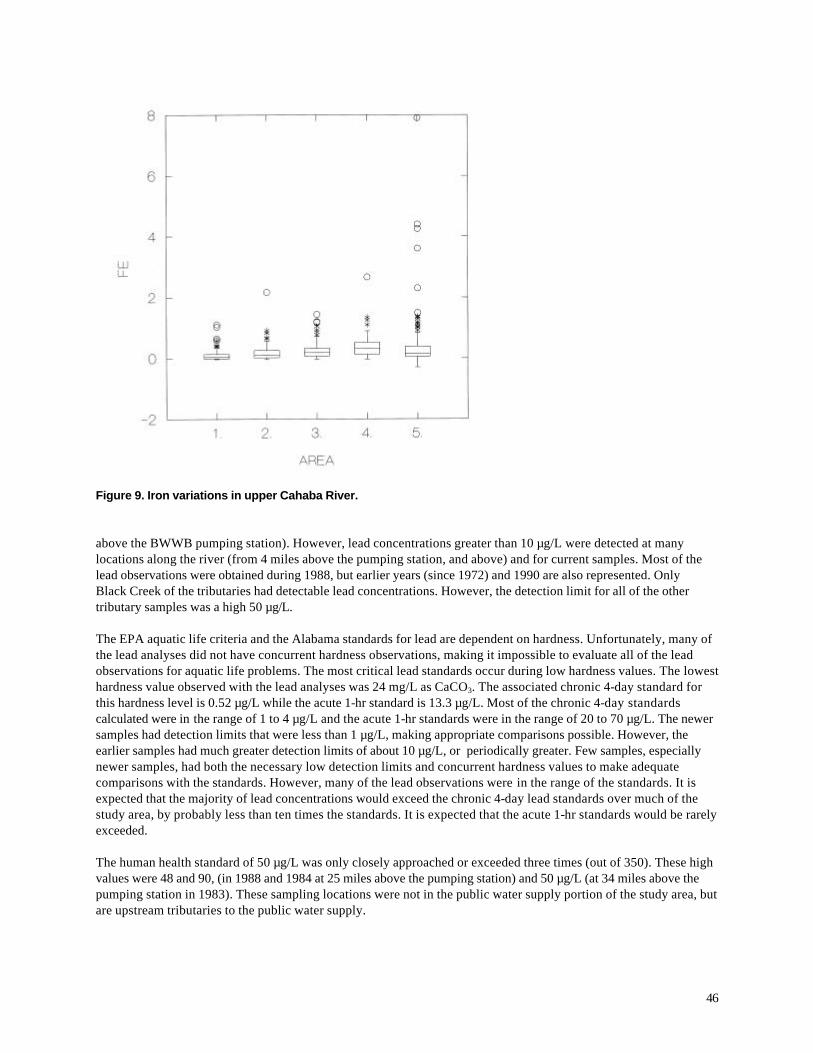
46
Figure 9. Iron variations in upper Cahaba River. above the BWWB pumping station). However, lead concentrations greater than 10 µg/L were detected at many locations along the river (from 4 miles above the pumping station, and above) and for current samples. Most of the lead observations were obtained during 1988, but earlier years (since 1972) and 1990 are also represented. Only Black Creek of the tributaries had detectable lead concentrations. However, the detection limit for all of the other tributary samples was a high 50 µg/L. The EPA aquatic life criteria and the Alabama standards for lead are dependent on hardness. Unfortunately, many of the lead analyses did not have concurrent hardness observations, making it impossible to evaluate all of the lead observations for aquatic life problems. The most critical lead standards occur during low hardness values. The lowest hardness value observed with the lead analyses was 24 mg/L as CaCO3. The associated chronic 4-day standard for this hardness level is 0.52 µg/L while the acute 1-hr standard is 13.3 µg/L. Most of the chronic 4-day standards calculated were in the range of 1 to 4 µg/L and the acute 1-hr standards were in the range of 20 to 70 µg/L. The newer samples had detection limits that were less than 1 µg/L, making appropriate comparisons possible. However, the earlier samples had much greater detection limits of about 10 µg/L, or periodically greater. Few samples, especially newer samples, had both the necessary low detection limits and concurrent hardness values to make adequate comparisons with the standards. However, many of the lead observations were in the range of the standards. It is expected that the majority of lead concentrations would exceed the chronic 4-day lead standards over much of the study area, by probably less than ten times the standards. It is expected that the acute 1-hr standards would be rarely exceeded. The human health standard of 50 µg/L was only closely approached or exceeded three times (out of 350). These high values were 48 and 90, (in 1988 and 1984 at 25 miles above the pumping station) and 50 µg/L (at 34 miles above the pumping station in 1983). These sampling locations were not in the public water supply portion of the study area, but are upstream tributaries to the public water supply.

47
Mercury The highest mercury concentration reported from the 173 samples obtained from the upper Cahaba River area during the period from 1970 to 1990 was 15 µg/L. About ten other samples had mercury concentrations greater than 5 µg/L. Many of these high mercury observations were obtained from samples from the upper reach of the Cahaba River, as shown in Figure 10, but some were also from two unnamed tributaries located about 10 miles upstream of the BWWB pumping station. Few reported mercury analyses have been conducted since 1984, except for a relatively continuous series of mercury analyses from a location 28 miles upstream of the pump station.
Figure 10. Mercury variations in upper Cahaba River. The detection limit for the mercury analyses was generally 1 µg/L, substantially greater than the chronic aquatic life standard and criterion of 0.012 µg/L and greater than the EPA human health criteria of 0.144 and 0.146 µg/L. Therefore, an undetected mercury concentration does not mean that the sample did not reflect deleterious conditions. The 1 µg/L detection limit was less than the acute aquatic life standard of 2.4 µg/L. All of the detected mercury observations (about half of the samples) greatly exceeded the chronic aquatic life standard. Typical exceedences were 50 to several hundred times the standard. Fifteen of the 173 sample analyses also exceeded the acute aquatic life standard, but by smaller amounts (by 1 to 5 times). All of the detected mercury observations also exceeded the human health criteria, by up to 100 times. Zinc The highest zinc concentration observed in the 151 samples obtained from the upper Cahaba River area during the period from 1970 to 1990 was 870 µg/L. The most recent zinc data reported was obtained in 1984. Probability analyses indicated that three samples exceeded 500 µg/L. Two of these (800 and 870 µg/L) were located in the upper Cahaba River reach at 28 miles above the BWWB pumping station. These high observations were obtained in 1974 and 1975. More recent zinc observations in that area were all less than 100 µg/L. Two high samples (530 and 430 µg/L) were
48
obtained at the pumping station in 1977 and 1978. No reported zinc data are available for the pump station since 1979. Most zinc concentrations are in the range of 10 to 100 µg/L. This is also the range of the detection limits used, so there are a large number of samples having concentrations below the detection limits. Zinc criteria and standards are also dependent on concurrent hardness values. Only a few of the sampling locations had hardness observations (the pump station from 1970 through 1979, 28 miles upstream of the pump station for 1974 through 1977, and for a single analysis at 32 miles upstream of the pump station in 1980. This lack of associated hardness data makes it difficult to compare the zinc observations with the Alabama aquatic life standard and the EPA “never to be exceeded” aquatic life criteria. The EPA 1-day criteria is not associated with hardness (47 µg/L) and is seen to have been frequently exceeded by up to 10 times, depending on location. The other aquatic life criteria and standards were periodically exceeded, but the data are quite old and probably are not indicative of current conditions. The EPA’s human health criteria (5,000 µg/L) was never approached. As noted above, the highest zinc concentrations reported were less than 1,000 µg/L. Organic Toxicants No data were available for organic priority pollutants in the data bases or files investigated for this report. Therefore, six samples were collected at various Cahaba River locations in March of 1991 and analyzed for organic priority pollutants. The locations sampled included: Riverrun, Grant’s Mill Rd., Riverview Rd., County 10 (CVCC), Trussville Park, and at Old Springville Rd. These locations were all along the main channel of the Cahaba River. The organics having the highest concentrations were found at all sampling locations, while those only found at trace concentrations were generally only found at one or two locations. The phthalate esters were the most abundant and common organic pollutants found. These are plasticizers and are commonly found in runoff from urban areas, from sewage treatment plants, and from specific industries. None of the non-carcinogens are likely present in quantities in excess of the Alabama standards. However, the carcinogens have much mo re stringent limits, especially the PAHs, and are likely to be exceeded if detected (except possibly N-nitrosodiphenylamine). However, only trace amounts of the carcinogens were detected and at only a few locations. PAHs are unfortunately relatively common in urban runoff, treated sewage, and some industrial wastes. They are mostly produced by the combustion of fossil fuels (including gasoline). Phthalate esters, though relatively common in the samples, are not expected to exceed any of the applicable standards. However, many of the organic carcinogens detected, especially the PAHs, are expected to exceed the fish and water consumption standards and the fish consumption only standards at several locations in the watershed area studied. Like arsenic, another carcinogen, these data indicate the need to more fully monitor these important human health pollutants.
Water Quality Conditions at Mid-Watershed Locations in the Cahaba River Data were examined for two mid-watershed locations in order to demonstrate the general nature of the existing receiving water problems in the Cahaba River. The stations were selected based on the availability of data and potential upstream pollutant sources. The concentrations of dissolved arsenic, cadmium, lead, mercury, and zinc in the Cahaba River at these locations frequently exceed the fresh water aquatic life criteria and the human health criteria for the consumption of fish. These data indicate that these problems are not localized. The following table summarizes Cahaba River water quality, as monitored at the West Blocton and Centreville stations, as recorded in the EPA’s STORET data file for the period of 1970 through 1989: West Blocton Station:
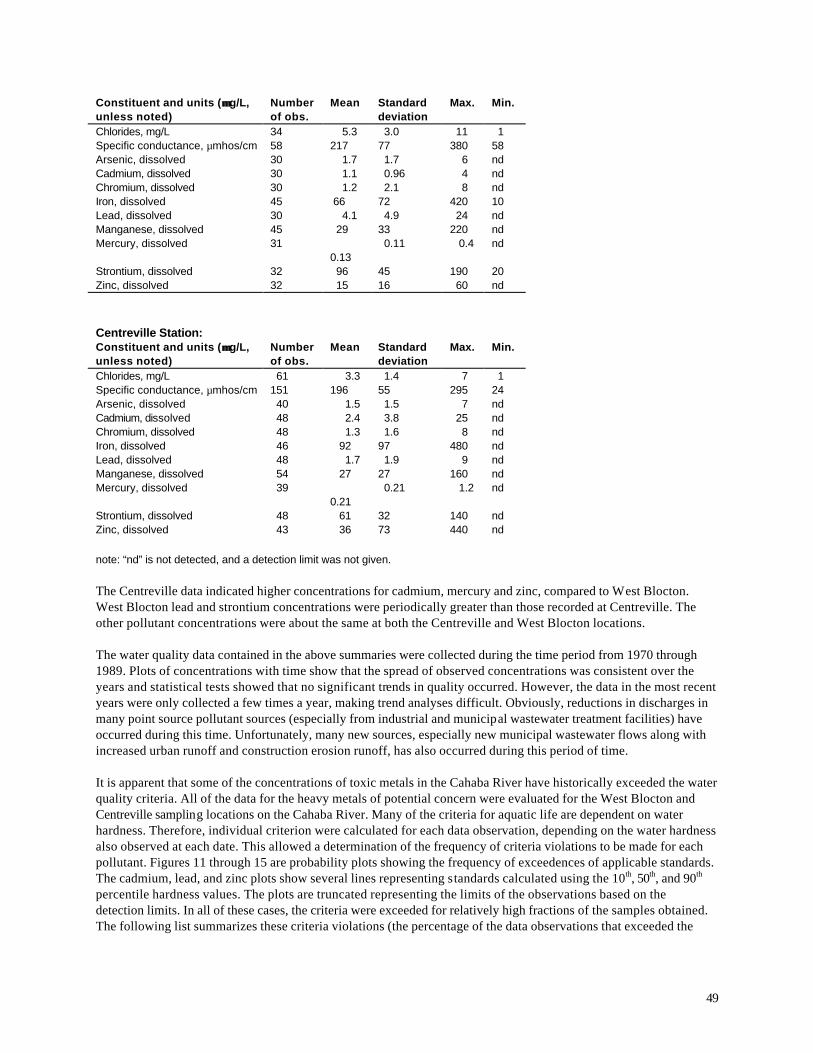
49
Constituent and units (µµ g/L, unless noted)
Number of obs.
Mean Standard deviation
Max. Min.
Chlorides, mg/L 34 5.3 3.0 11 1 Specific conductance, µmhos/cm 58 217 77 380 58 Arsenic, dissolved 30 1.7 1.7 6 nd Cadmium, dissolved 30 1.1 0.96 4 nd Chromium, dissolved 30 1.2 2.1 8 nd Iron, dissolved 45 66 72 420 10 Lead, dissolved 30 4.1 4.9 24 nd Manganese, dissolved 45 29 33 220 nd Mercury, dissolved 31
0.13 0.11 0.4 nd
Strontium, dissolved 32 96 45 190 20 Zinc, dissolved 32 15 16 60 nd Centreville Station: Constituent and units (µµ g/L, unless noted)
Number of obs.
Mean Standard deviation
Max. Min.
Chlorides, mg/L 61 3.3 1.4 7 1 Specific conductance, µmhos/cm 151 196 55 295 24 Arsenic, dissolved 40 1.5 1.5 7 nd Cadmium, dissolved 48 2.4 3.8 25 nd Chromium, dissolved 48 1.3 1.6 8 nd Iron, dissolved 46 92 97 480 nd Lead, dissolved 48 1.7 1.9 9 nd Manganese, dissolved 54 27 27 160 nd Mercury, dissolved 39
0.21 0.21 1.2 nd
Strontium, dissolved 48 61 32 140 nd Zinc, dissolved 43 36 73 440 nd note: “nd” is not detected, and a detection limit was not given. The Centreville data indicated higher concentrations for cadmium, mercury and zinc, compared to West Blocton. West Blocton lead and strontium concentrations were periodically greater than those recorded at Centreville. The other pollutant concentrations were about the same at both the Centreville and West Blocton locations. The water quality data contained in the above summaries were collected during the time period from 1970 through 1989. Plots of concentrations with time show that the spread of observed concentrations was consistent over the years and statistical tests showed that no significant trends in quality occurred. However, the data in the most recent years were only collected a few times a year, making trend analyses difficult. Obviously, reductions in discharges in many point source pollutant sources (especially from industrial and municipal wastewater treatment facilities) have occurred during this time. Unfortunately, many new sources, especially new municipal wastewater flows along with increased urban runoff and construction erosion runoff, has also occurred during this period of time. It is apparent that some of the concentrations of toxic metals in the Cahaba River have historically exceeded the water quality criteria. All of the data for the heavy metals of potential concern were evaluated for the West Blocton and Centreville sampling locations on the Cahaba River. Many of the criteria for aquatic life are dependent on water hardness. Therefore, individual criterion were calculated for each data observation, depending on the water hardness also observed at each date. This allowed a determination of the frequency of criteria violations to be made for each pollutant. Figures 11 through 15 are probability plots showing the frequency of exceedences of applicable standards. The cadmium, lead, and zinc plots show several lines representing standards calculated using the 10th, 50th, and 90th percentile hardness values. The plots are truncated representing the limits of the observations based on the detection limits. In all of these cases, the criteria were exceeded for relatively high fractions of the samples obtained. The following list summarizes these criteria violations (the percentage of the data observations that exceeded the
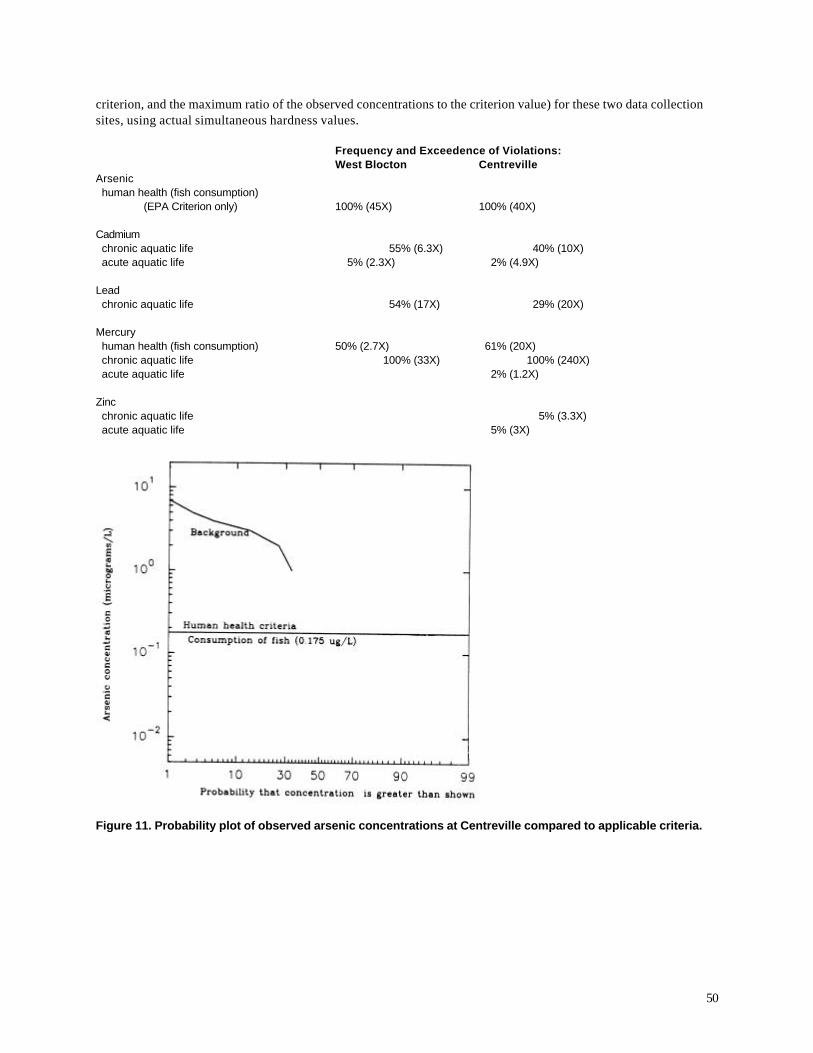
50
criterion, and the maximum ratio of the observed concentrations to the criterion value) for these two data collection sites, using actual simultaneous hardness values. Frequency and Exceedence of Violations: West Blocton Centreville Arsenic human health (fish consumption) (EPA Criterion only) 100% (45X) 100% (40X) Cadmium chronic aquatic life 55% (6.3X) 40% (10X) acute aquatic life 5% (2.3X) 2% (4.9X) Lead chronic aquatic life 54% (17X) 29% (20X) Mercury human health (fish consumption) 50% (2.7X) 61% (20X) chronic aquatic life 100% (33X) 100% (240X) acute aquatic life 2% (1.2X) Zinc chronic aquatic life 5% (3.3X) acute aquatic life 5% (3X)
Figure 11. Probability plot of observed arsenic concentrations at Centreville compared to applicable criteria.
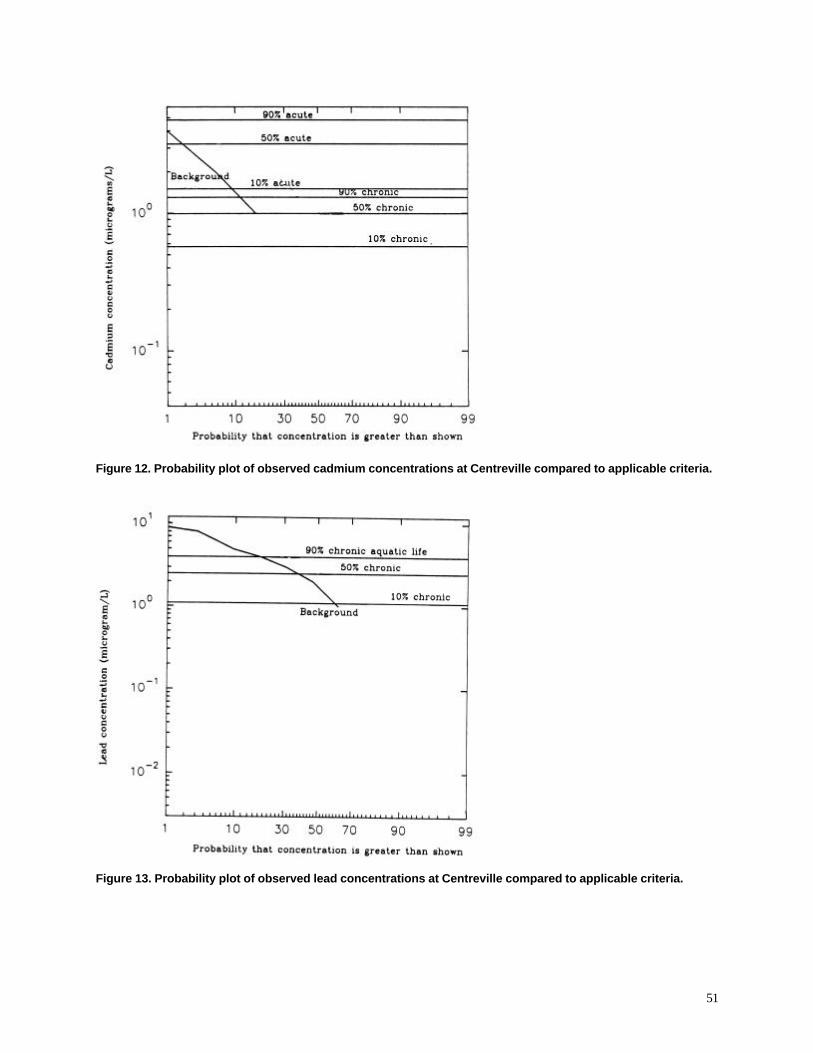
51
Figure 12. Probability plot of observed cadmium concentrations at Centreville compared to applicable criteria.
Figure 13. Probability plot of observed lead concentrations at Centreville compared to applicable criteria.
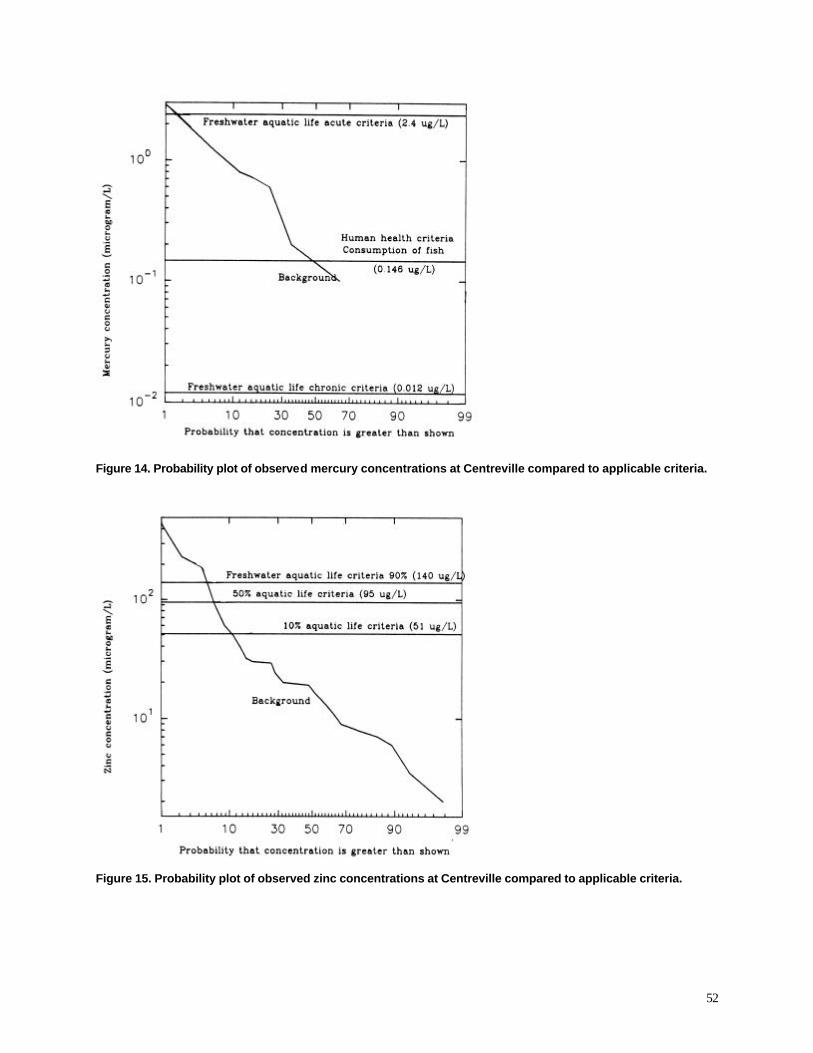
52
Figure 14. Probability plot of observed mercury concentrations at Centreville compared to applicable criteria.
Figure 15. Probability plot of observed zinc concentrations at Centreville compared to applicable criteria.
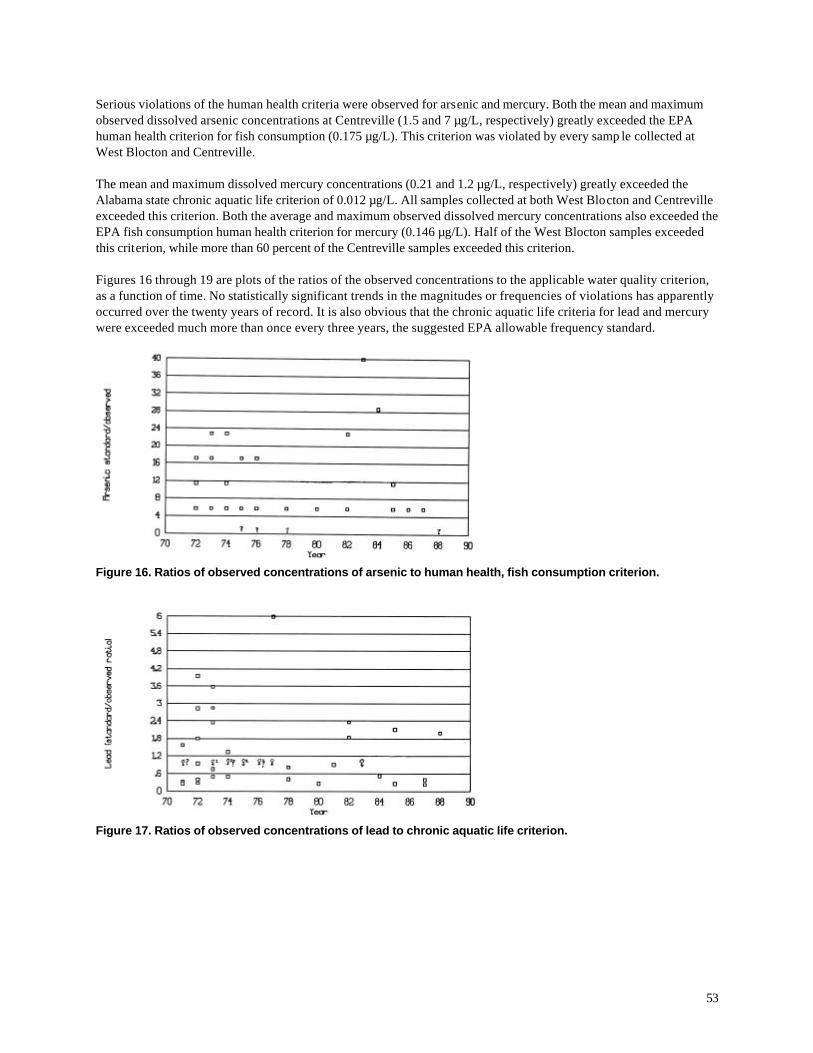
53
Serious violations of the human health criteria were observed for arsenic and mercury. Both the mean and maximum observed dissolved arsenic concentrations at Centreville (1.5 and 7 µg/L, respectively) greatly exceeded the EPA human health criterion for fish consumption (0.175 µg/L). This criterion was violated by every samp le collected at West Blocton and Centreville. The mean and maximum dissolved mercury concentrations (0.21 and 1.2 µg/L, respectively) greatly exceeded the Alabama state chronic aquatic life criterion of 0.012 µg/L. All samples collected at both West Blocton and Centreville exceeded this criterion. Both the average and maximum observed dissolved mercury concentrations also exceeded the EPA fish consumption human health criterion for mercury (0.146 µg/L). Half of the West Blocton samples exceeded this criterion, while more than 60 percent of the Centreville samples exceeded this criterion. Figures 16 through 19 are plots of the ratios of the observed concentrations to the applicable water quality criterion, as a function of time. No statistically significant trends in the magnitudes or frequencies of violations has apparently occurred over the twenty years of record. It is also obvious that the chronic aquatic life criteria for lead and mercury were exceeded much more than once every three years, the suggested EPA allowable frequency standard.
Figure 16. Ratios of observed concentrations of arsenic to human health, fish consumption criterion.
Figure 17. Ratios of observed concentrations of lead to chronic aquatic life criterion.
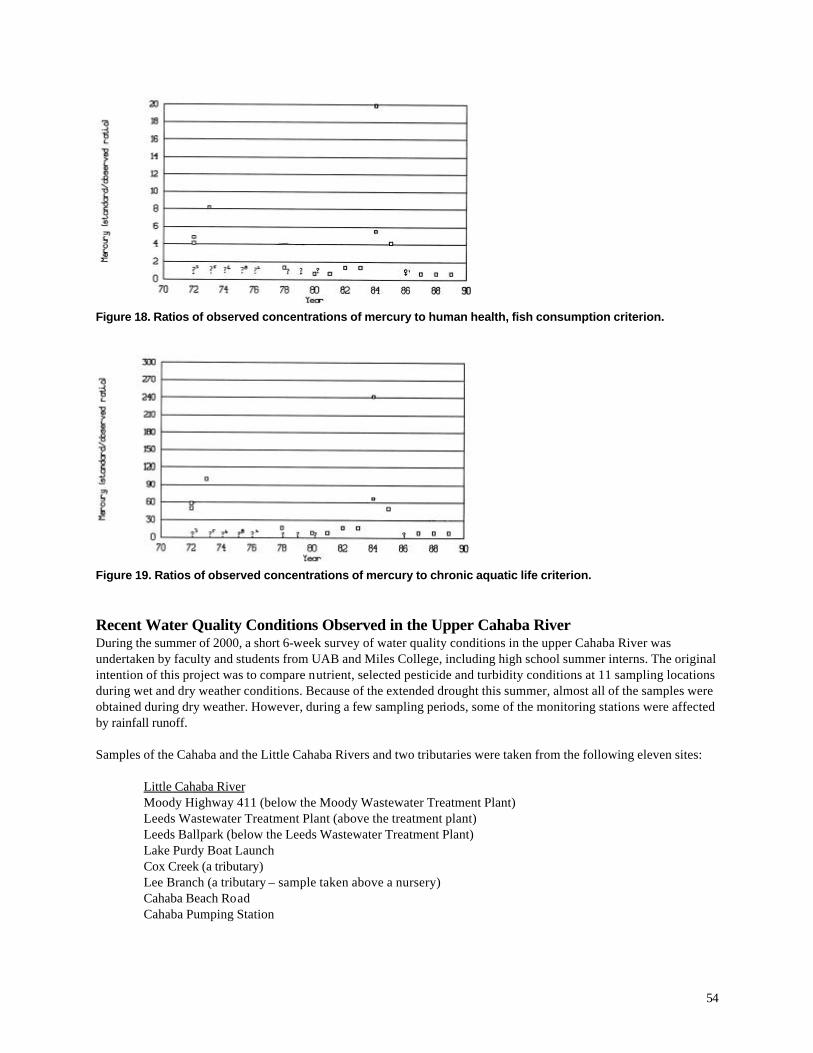
54
Figure 18. Ratios of observed concentrations of mercury to human health, fish consumption criterion.
Figure 19. Ratios of observed concentrations of mercury to chronic aquatic life criterion.
Recent Water Quality Conditions Observed in the Upper Cahaba River During the summer of 2000, a short 6-week survey of water quality conditions in the upper Cahaba River was undertaken by faculty and students from UAB and Miles College, including high school summer interns. The original intention of this project was to compare nutrient, selected pesticide and turbidity conditions at 11 sampling locations during wet and dry weather conditions. Because of the extended drought this summer, almost all of the samples were obtained during dry weather. However, during a few sampling periods, some of the monitoring stations were affected by rainfall runoff. Samples of the Cahaba and the Little Cahaba Rivers and two tributaries were taken from the following eleven sites:
Little Cahaba River Moody Highway 411 (below the Moody Wastewater Treatment Plant) Leeds Wastewater Treatment Plant (above the treatment plant) Leeds Ballpark (below the Leeds Wastewater Treatment Plant) Lake Purdy Boat Launch Cox Creek (a tributary) Lee Branch (a tributary – sample taken above a nursery) Cahaba Beach Road Cahaba Pumping Station
55
Cahaba River Highway 78 Grant Mills Road Liberty Park Cahaba Pumping Station (same as listed on the Little Cahaba) – water at the intake is a mix of both rivers
Methodology This project was performed by two teams: one from Miles College and one from The University of Alabama at Birmingham. Grab samples were collected by each team twice per week (on the same day) and, when necessary, as soon as possible after a rainfall-runoff event for the six-week period from June 16 through July 27, 2000. 500 mL of samples were collected in amber glass jars with Teflon-lined lids. The samples were returned to the UAB laboratory and were analyzed for the parameters and using the methods listed in Table 8. Table 9 lists the potential health effects caused by the pollutants of interest. It also lists the maximum levels of each contaminant that is allowed in the finished drinking water. Table 8. Laboratory Analyses
Analytes Analysis Method 2,4-D Elisa Method with Hach DR\2010 Spectrophotometer Ammonia EPA Method 350.2 Chlordane Elisa Method with Hach DR\2010 Spectrophotometer Chlorpyrifos Elisa Method with Hach DR\2010 Spectrophotometer Conductivity Horiba Conductivity Meter Nitrate EPA Method 353.5 pH EPA Method 150 Phosphate EPA Method 365.2 Sulfate Standard Methods Method 4500 – SO4
2 – E Turbidity EPA Method 180.1 Conductivity EPA Method 120.6
Source: Standard Methods for the Examination of Water and Wastewater, 19th Edition. APHA, AWWA, and WEF. 1995.
Table 9. Potential Health Effects and Drinking Water MCLs for the Pollutants of Interest Pollutant Potential Health Effects Maximum Contaminant
Level (MCL) Nitrate Causes methemoglobinemia (‘blue baby disease’) in infants 10 mg/L 2,4-Dichlorophen-oxyacetic acid (2,4-D)
Pancreatic damage, Central Nervous System effects, Mutagenicity, and Teratogenicity.
70 µg/L (proposed*)
Chlordane Upper respiratory tract irritation, liver damage, Peripheral nervous system effects, Embryo toxicity, and Carcinogenicity
2 µg/L (proposed*)
Ammonia Eye, skin, and upper respiratory tract irritation, allergic sensitization, central nervous system effects
NA
Chlorpyrifos Skin irritation and liver damage NA Sulfate Laxative effect 250 mg/L
(Secondary Drinking Water Standards)
Turbidity 1 – 5 NTU *Source: The Water Encyclopedia, 2nd Edition. Edited by Frits van der Leeden, Fred L. Troise, and David Keith Todd. Lewis Publishers, Boca Raton, FL. 1990.
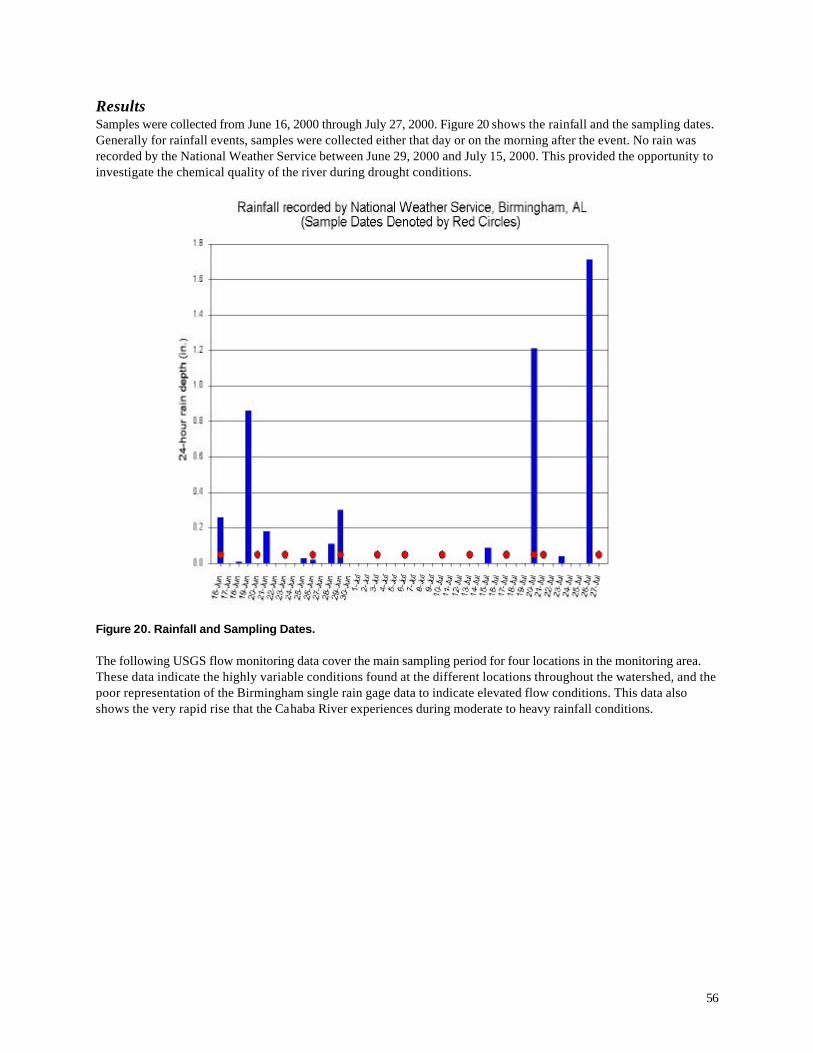
56
Results Samples were collected from June 16, 2000 through July 27, 2000. Figure 20 shows the rainfall and the sampling dates. Generally for rainfall events, samples were collected either that day or on the morning after the event. No rain was recorded by the National Weather Service between June 29, 2000 and July 15, 2000. This provided the opportunity to investigate the chemical quality of the river during drought conditions.
Figure 20. Rainfall and Sampling Dates. The following USGS flow monitoring data cover the main sampling period for four locations in the monitoring area. These data indicate the highly variable conditions found at the different locations throughout the watershed, and the poor representation of the Birmingham single rain gage data to indicate elevated flow conditions. This data also shows the very rapid rise that the Cahaba River experiences during moderate to heavy rainfall conditions.

57
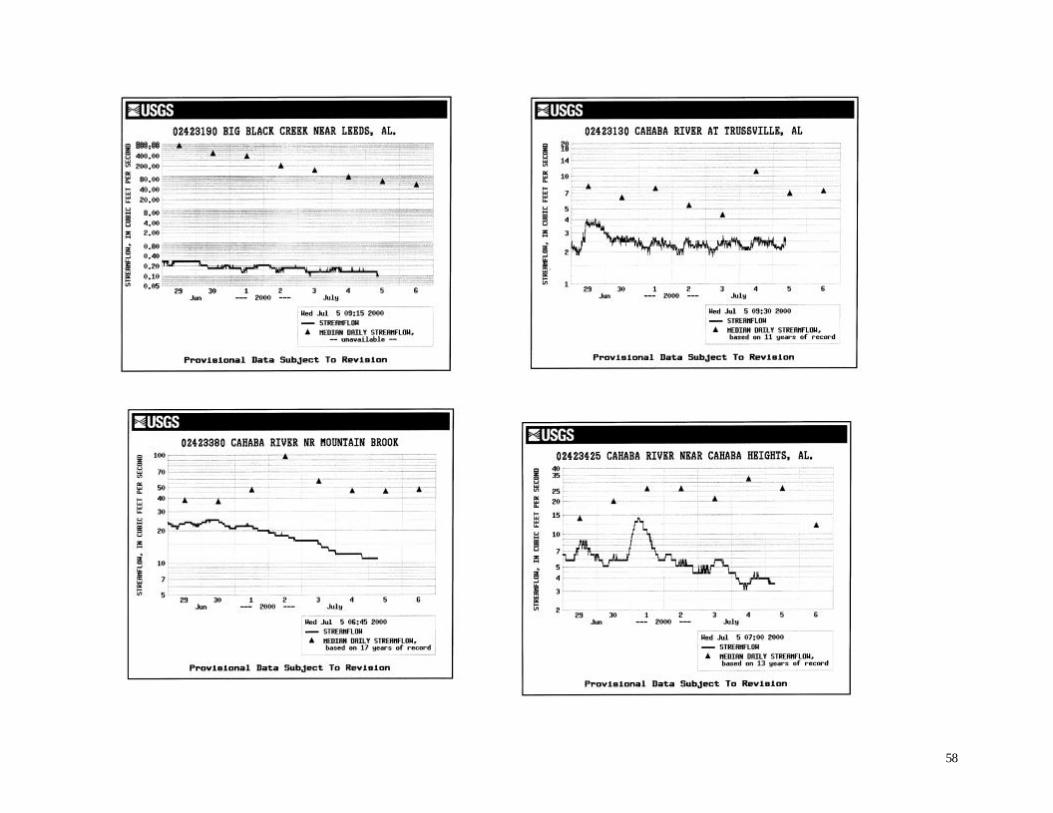
58
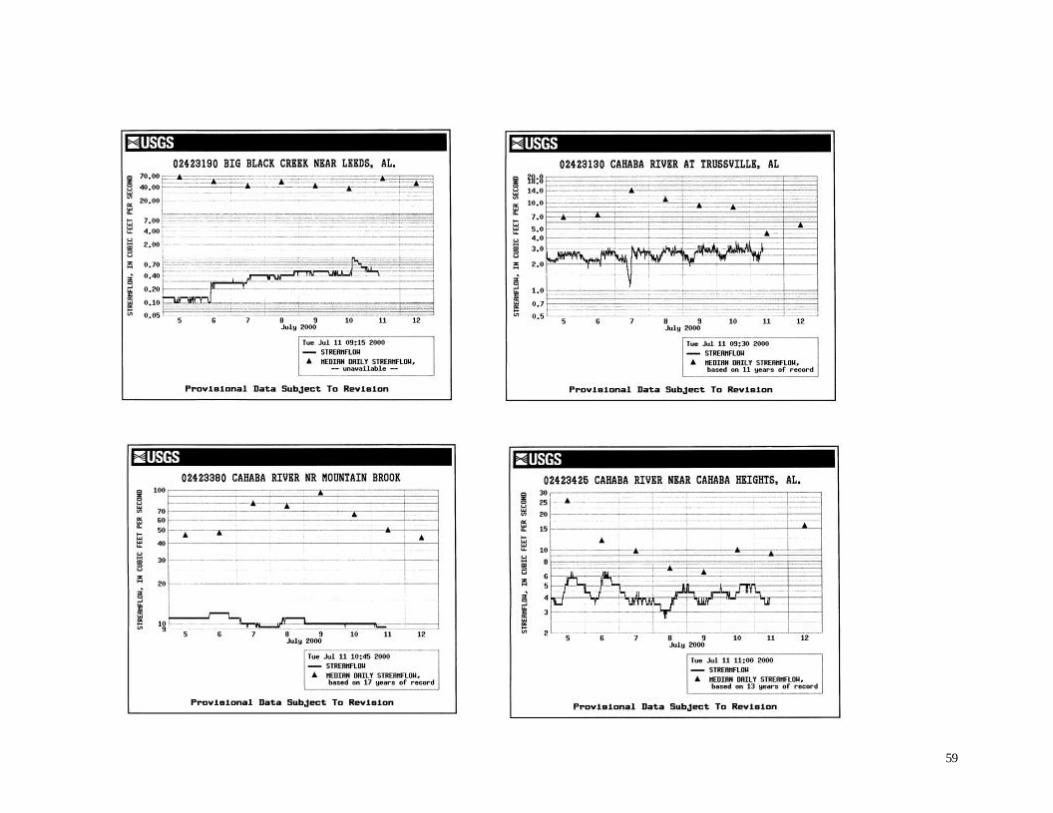
59
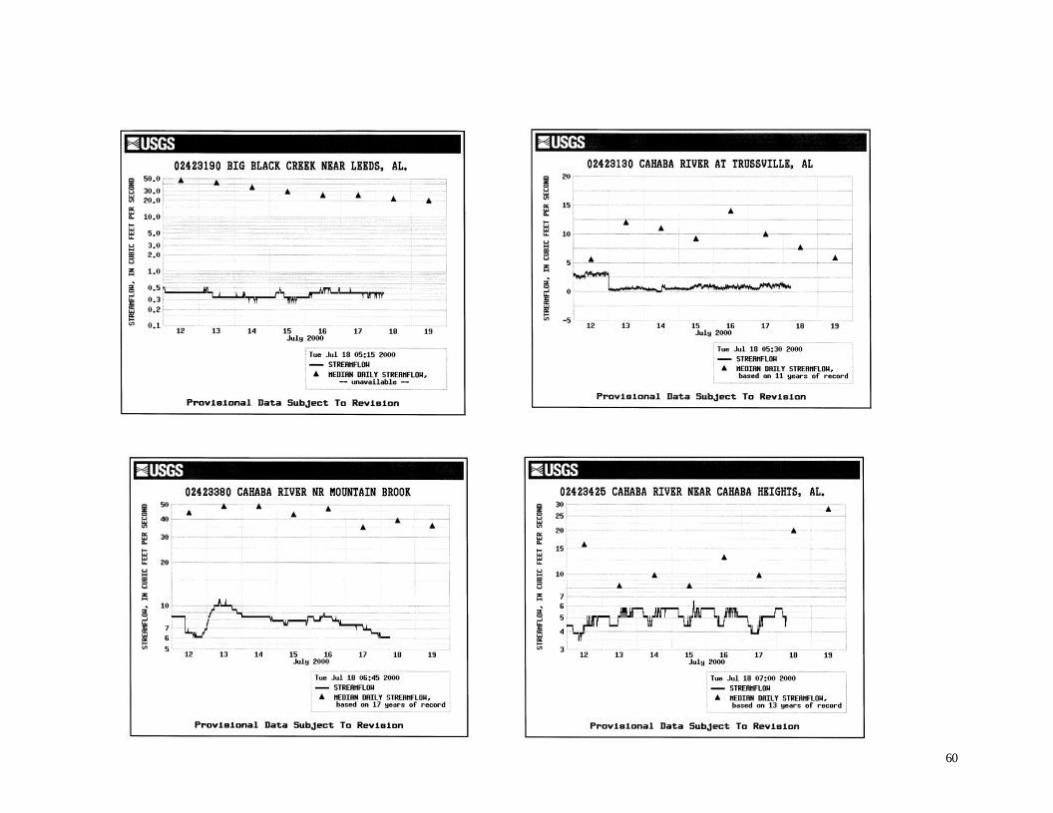
60
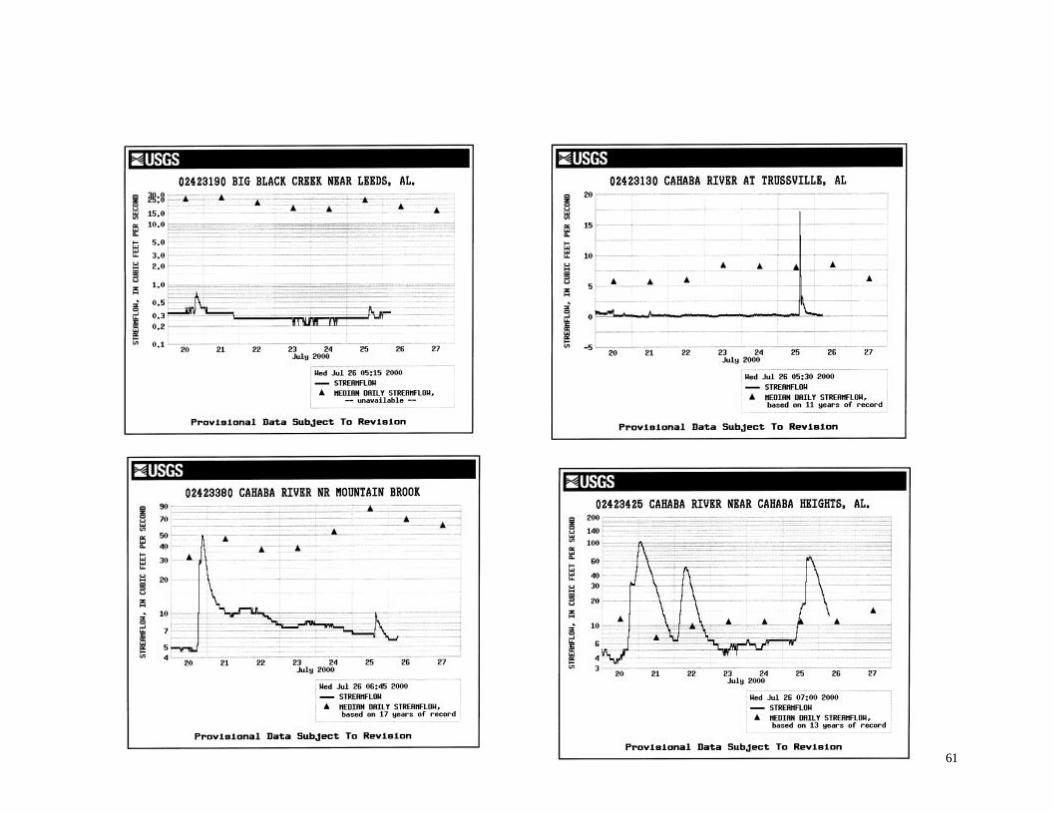
61
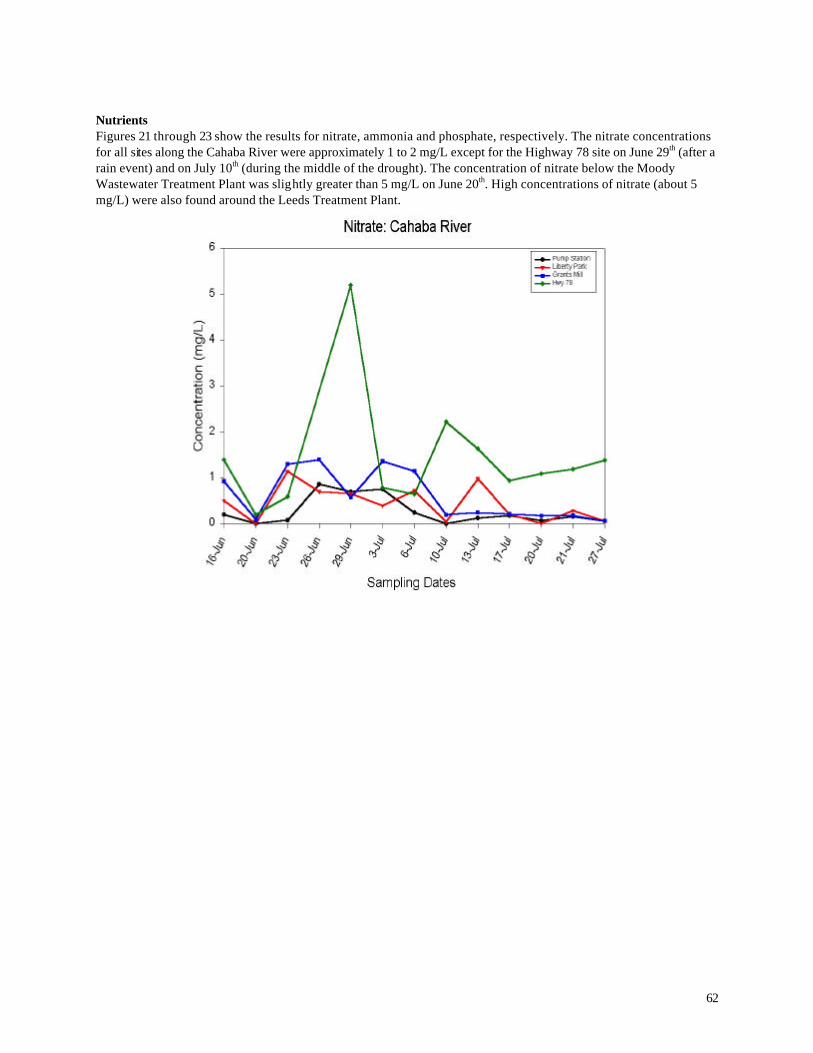
62
Nutrients Figures 21 through 23 show the results for nitrate, ammonia and phosphate, respectively. The nitrate concentrations for all sites along the Cahaba River were approximately 1 to 2 mg/L except for the Highway 78 site on June 29th (after a rain event) and on July 10th (during the middle of the drought). The concentration of nitrate below the Moody Wastewater Treatment Plant was slightly greater than 5 mg/L on June 20th. High concentrations of nitrate (about 5 mg/L) were also found around the Leeds Treatment Plant.
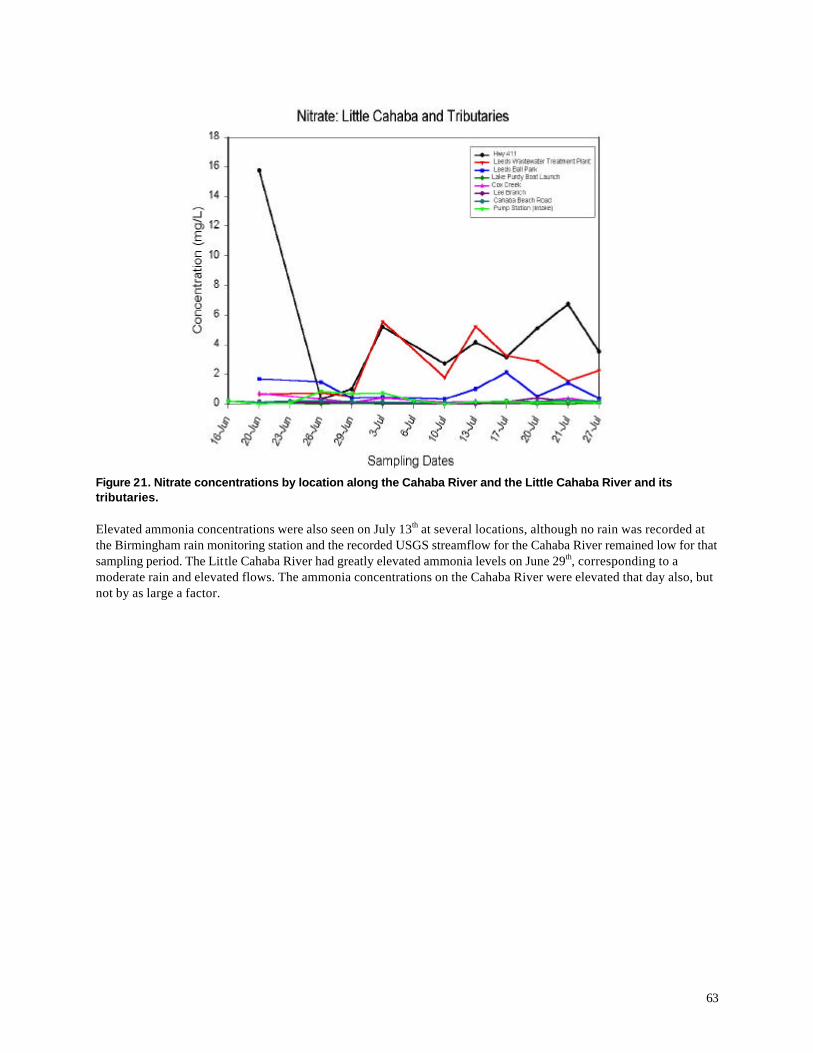
63
Figure 21. Nitrate concentrations by location along the Cahaba River and the Little Cahaba River and its tributaries. Elevated ammonia concentrations were also seen on July 13th at several locations, although no rain was recorded at the Birmingham rain monitoring station and the recorded USGS streamflow for the Cahaba River remained low for that sampling period. The Little Cahaba River had greatly elevated ammonia levels on June 29th, corresponding to a moderate rain and elevated flows. The ammonia concentrations on the Cahaba River were elevated that day also, but not by as large a factor.
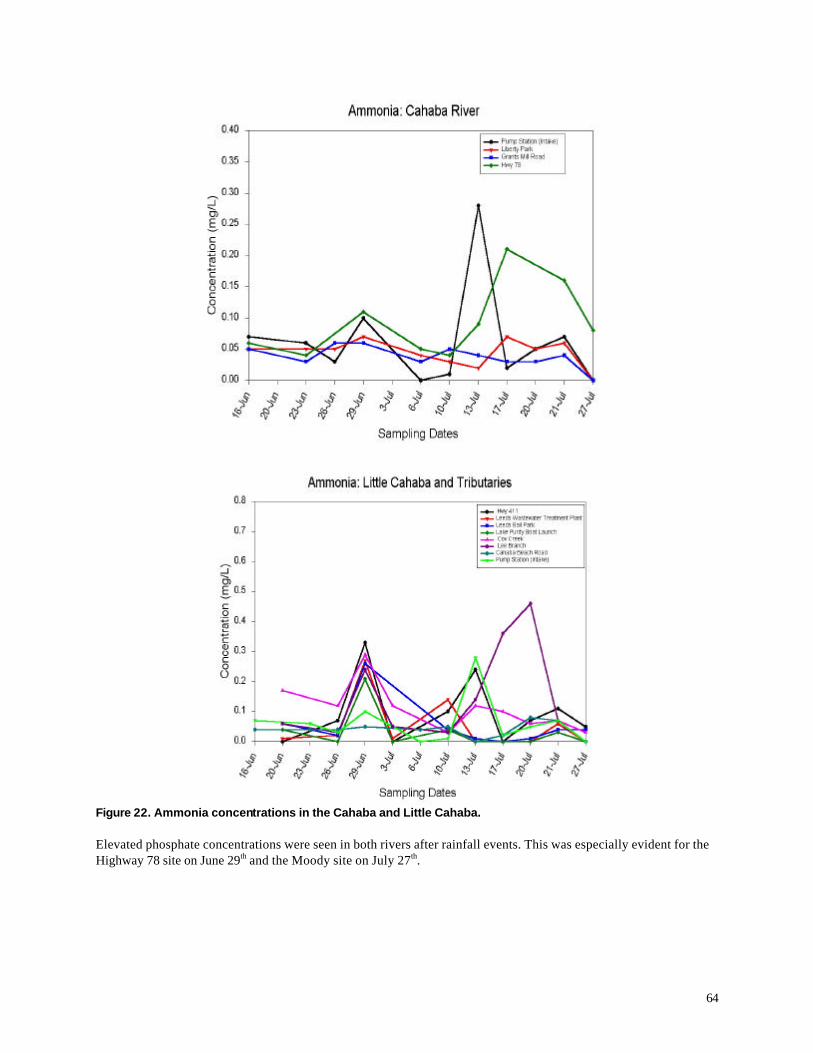
64
Figure 22. Ammonia concentrations in the Cahaba and Little Cahaba. Elevated phosphate concentrations were seen in both rivers after rainfall events. This was especially evident for the Highway 78 site on June 29th and the Moody site on July 27th.
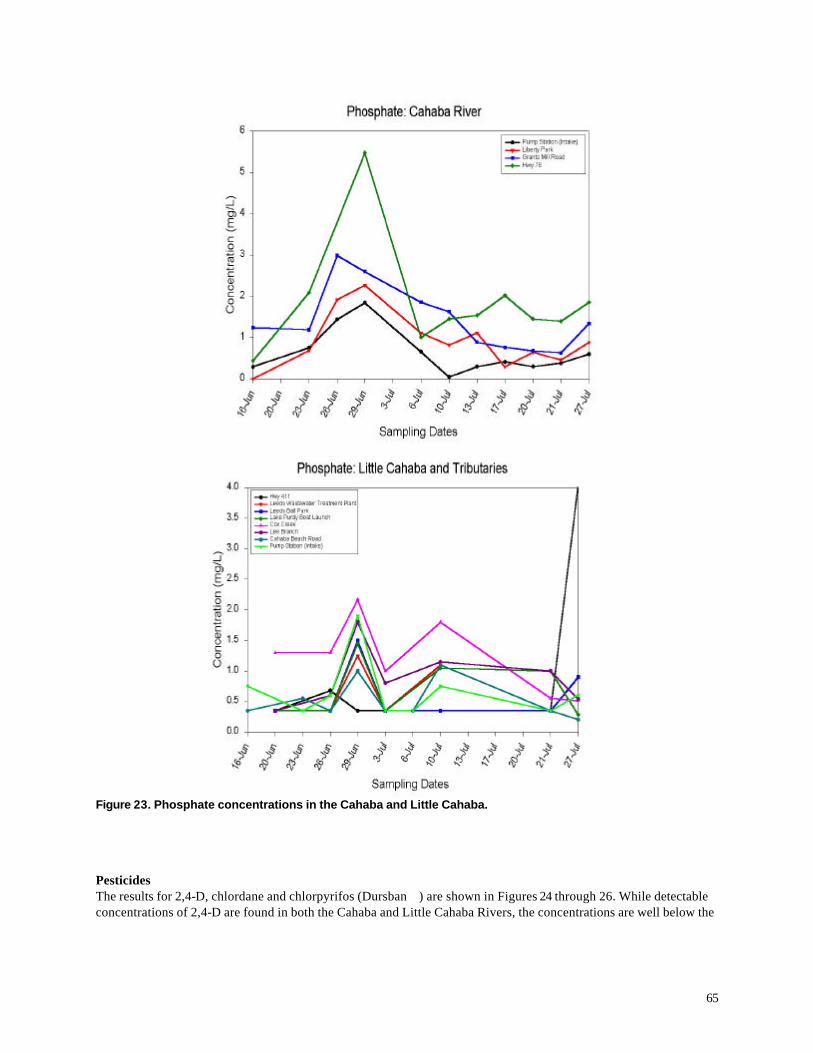
65
Figure 23. Phosphate concentrations in the Cahaba and Little Cahaba.
Pesticides The results for 2,4-D, chlordane and chlorpyrifos (Dursban ) are shown in Figures 24 through 26. While detectable concentrations of 2,4-D are found in both the Cahaba and Little Cahaba Rivers, the concentrations are well below the
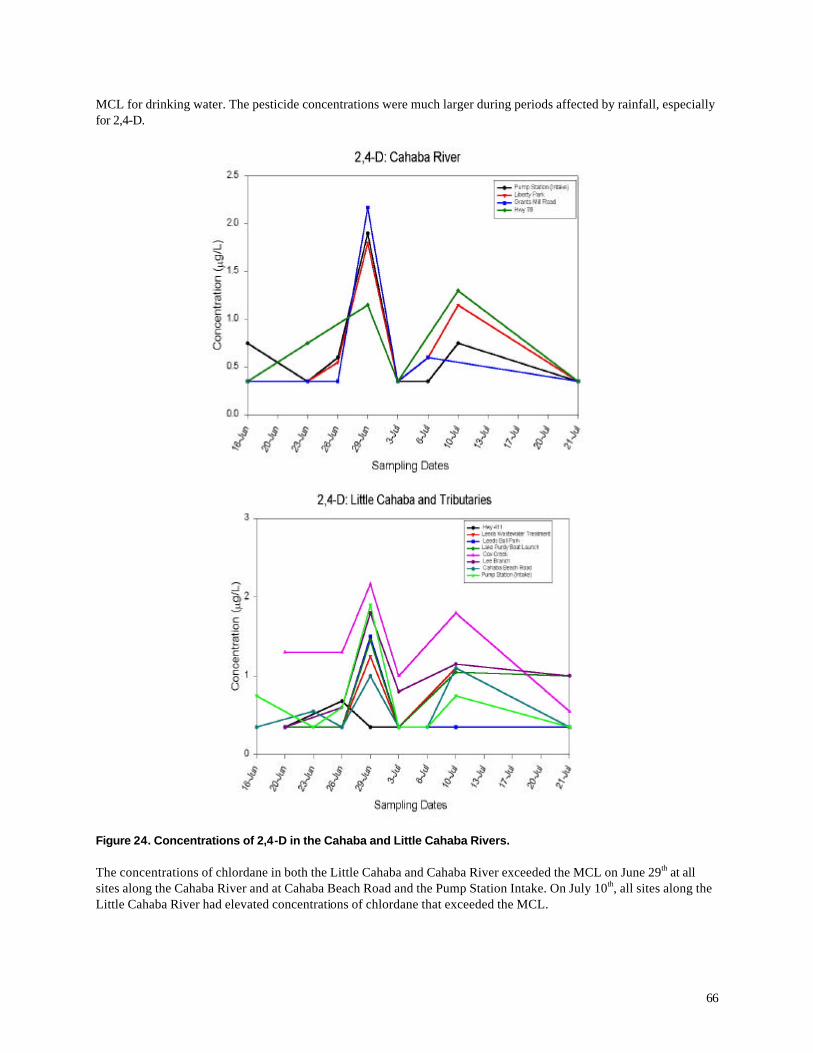
66
MCL for drinking water. The pesticide concentrations were much larger during periods affected by rainfall, especially for 2,4-D.
Figure 24. Concentrations of 2,4-D in the Cahaba and Little Cahaba Rivers. The concentrations of chlordane in both the Little Cahaba and Cahaba River exceeded the MCL on June 29th at all sites along the Cahaba River and at Cahaba Beach Road and the Pump Station Intake. On July 10th, all sites along the Little Cahaba River had elevated concentrations of chlordane that exceeded the MCL.
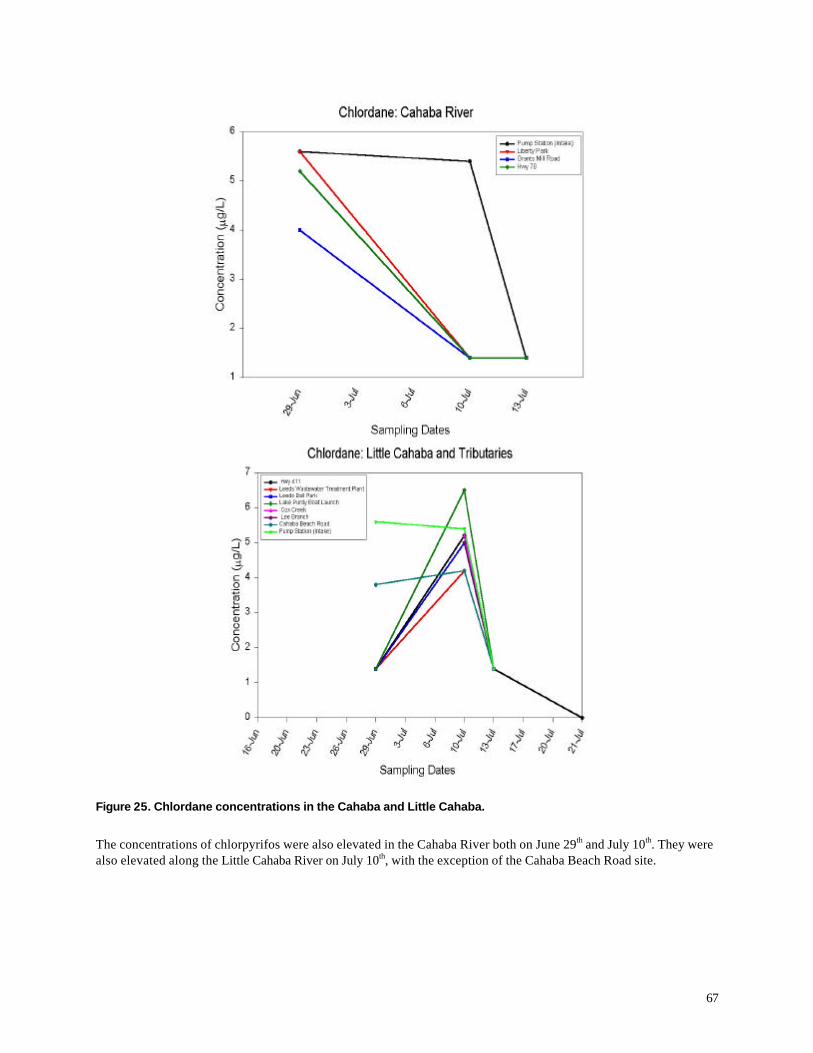
67
Figure 25. Chlordane concentrations in the Cahaba and Little Cahaba.
The concentrations of chlorpyrifos were also elevated in the Cahaba River both on June 29th and July 10th. They were also elevated along the Little Cahaba River on July 10th, with the exception of the Cahaba Beach Road site.
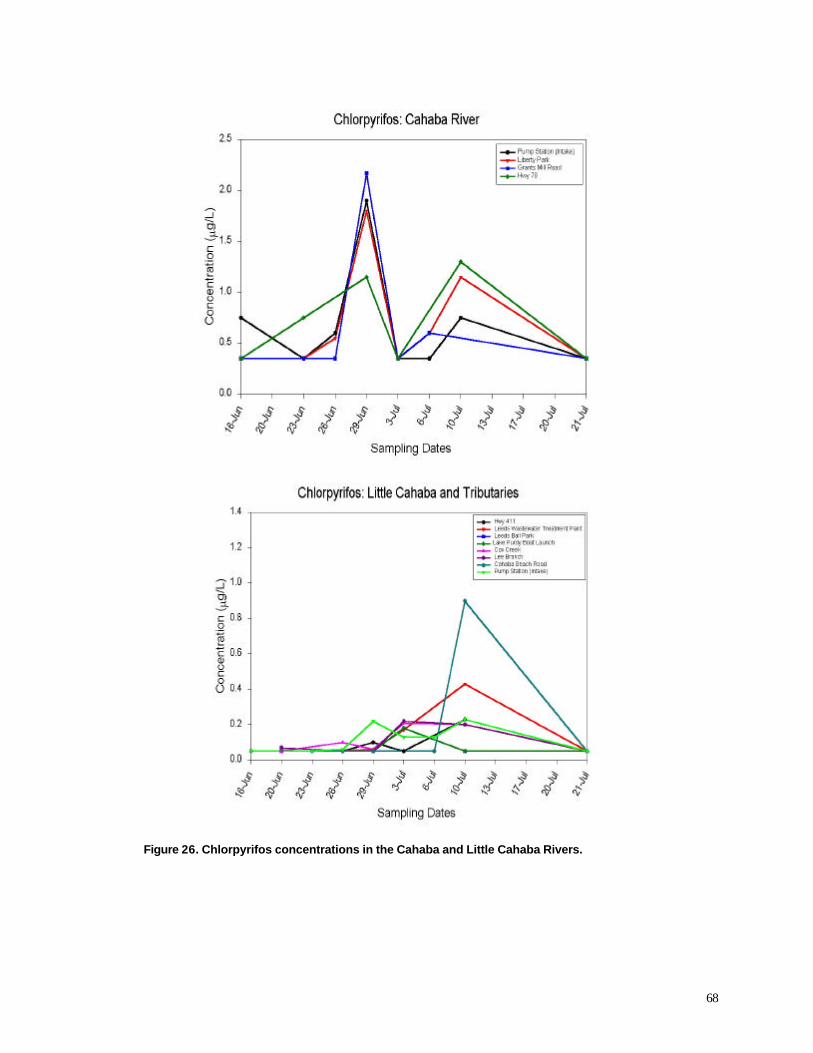
68
Figure 26. Chlorpyrifos concentrations in the Cahaba and Little Cahaba Rivers.
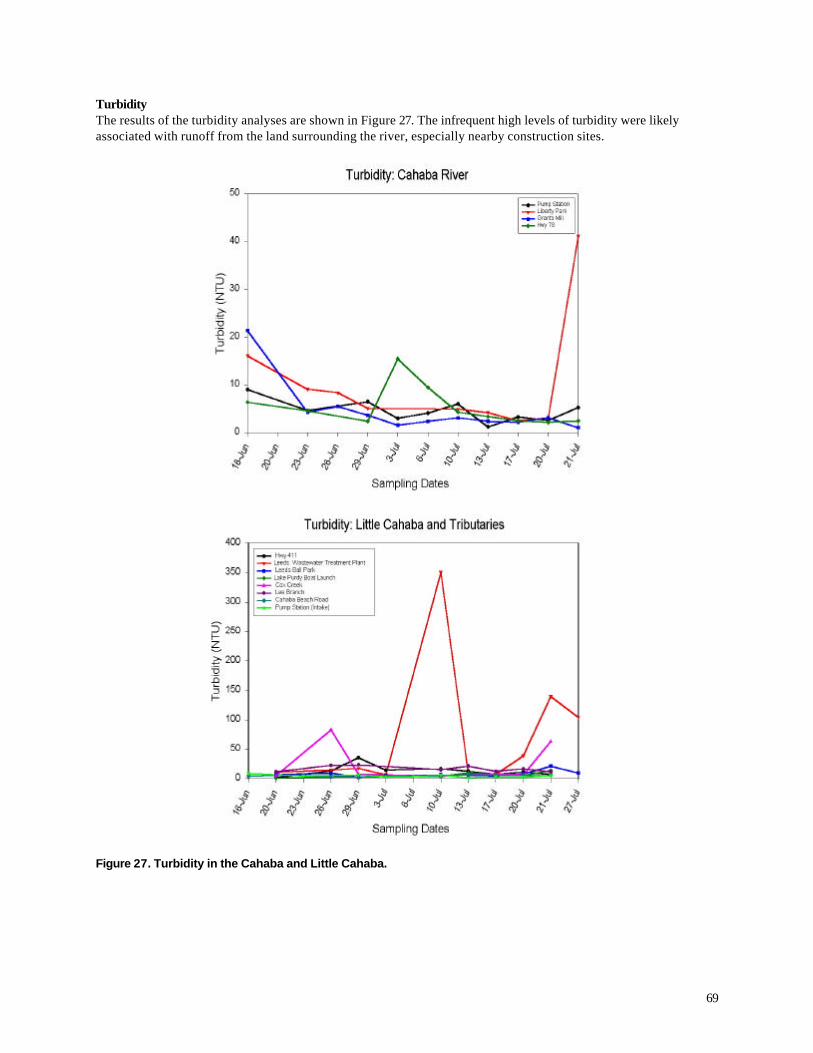
69
Turbidity The results of the turbidity analyses are shown in Figure 27. The infrequent high levels of turbidity were likely associated with runoff from the land surrounding the river, especially nearby construction sites.
Figure 27. Turbidity in the Cahaba and Little Cahaba.

70
Allowable Wastewater Discharges When determining allowable waste loadings that can be discharged to a receiving water, regulatory agencies consider the best levels of treatment economically achievable by the industrial category and the assimilative capacity of the receiving water. The discharge limits based on treatment levels defined by the industrial category are usually given as concentration limits in the discharge waters. The discharge limits established to protect the receiving water uses (the assimilative capacity) are based on critical low flows, uses of the receiving waters, existing background water pollutant concentrations, and expected future demands on the water. These assimilative capacity limits are usually given in allowable discharge mass limits (such as the maximum pounds per day of a pollutant that can be discharged). The following discussion shows that the receiving water assimilative capacity of the Cahaba River for toxic heavy metals is severely limited.
Critical Low Flows in the Cahaba River The ADEM Water Division prepared a water quality toxicity policy report in September 1988 describing the calculation procedures for chemical specific limits that use the minimum 7-day average low flow value that occurs once in 10 years (7Q10). ADEM also states, in the Alabama Toxic Pollutant Criteria Applicable to State Waters (Code of Alabama 335-6-10-.07), that “For the purposes of establishing effluent limitations pursuant to Chapter 335-6-6 of the Department's regulations, the minimum 7-day low flow that occurs once in 10 years (7Q10) shall be the basis for applying the chronic life criteria, and the minimum 1-day low flow that occurs once in 10 years (1Q10) shall be the basis for applying the acute aquatic life criteria.” ADEM further states (Code of Alabama 335-6-10-.07), that “For the purposes of establishing effluent limitations pursuant to Chapter 335-6-6 of the Department's regulations, the minimum 7-day low flow that occurs once in 10 years (7Q10) shall be the basis for applying the human health criteria for pollutants classified as non-carcinogens, and the mean annual flow shall be the basis for applying the human health criteria for pollutants classified as carcinogens.” As an example, average flows must therefore be used for arsenic discharge limitation calculations using the 0.175 ug/L receiving water criterion for the consumption of fish alone. The discharge limitation calculations for the chronic freshwater fish and wildlife criteria for arsenic, cadmium, chromium, lead, mercury and zinc should use the lowest 7 day average flows that occur once in ten years (7Q10). Calculations for discharge limitations for the acute freshwater fish and wildlife criteria for these metals should use the lowest 1 day average flows that occur once in ten years (1Q10). The following summarizes these flow values (in cubic feet per second, or CFS) for the Centreville location: Expected Flows (CFS) Average 7Q10 1Q10 Cahaba River at Centreville 1607(1) 140(2) <<140(3) footnotes: (1) 60 year average, presented in Water Resources Data for Alabama (USGS, 1987 water year). (2) The 7Q10 is from the Cahaba River Basin Water Quality Management Plan (Alabama Water Improvement Commission, July 1974). (3) The 1Q10 values are assumed to be substantially less than the 7Q10 values. 7Q10 values for other locations along the Cahaba River have also been tabulated in the Cahaba River Basin, Water Quality Management Plan: Station Closest upstream Drainage area 7Q10 number tributary (square miles) (CFS) 18 Black Creek 115 7.0 16 Little Shades Creek 230 0

71
14 Buck Creek unknown 25 6 Schulte Creek 1029 150 5 Dobine Creek 1379 220 1 Oakmulgee Creek 1768 280 All of the locations downstream of station number 18 are affected by the withdrawals of drinking water from Lake Purdy and the Cahaba River by the Birmingham Water Works Board (BWWB). These withdrawals averaged 82 CFS during the 1987 water year. Therefore, the 7Q10 values below this location are less than what would naturally occur. During critical low flow periods, the BWWB withdrawals reduce the Cahaba River flow to zero below their highway 280 diversion dam. Unfortunately, low flow values for most locations along the Cahaba River, and especially its tributaries, are not readily available. The 7Q10 values for small tributary creeks can be estimated by multiplying their drainage areas by the unit area 7Q10 values contained in The Map Abstract of Water Resources, Alabama (Alabama Development Office, University of Alabama, and Geological Survey of Alabama, 1974). The 1Q10 values would be much less than the 7Q10 values.
Water Quality During Critical Low Flow Conditions The specific conductance values, along with the concentrations of many of the pollutants, in the Cahaba River, are generally inversely related to the river flow. The river specific conductance values are greatest when the river flows are the lowest. Discharge limits must therefore consider these higher background values, which occur during the critical low flow periods, when determining discharge limits for the pollutants. A plot of all of the flow and specific conductance values obtained at the Centreville site, from 1970 through 1989 (the complete data record contained in the EPA’s STORET data file for this location as of 1990) shows that the critical low flow periods are strongly associated with the highest specific conductance values. Even though the mean specific conductance value at this location is about 200 µmhos/cm for this time period, the low flow periods had specific conductance values as much as 1.6 times as great (up to 315 µmhos/cm). The highest concentrations of other pollutants also occur during the critical low flow periods (generally between 100 and 1,000 CFS), as shown on Figures 28 through 30 for arsenic, chromium, and lead. Therefore, besides having very low flows, it is likely that many of the critical periods will also be associated with higher than average pollutant concentrations, resulting in reduced assimilative capacity in the receiving water.
Figure 28. Arsenic vs. flow at Centreville.
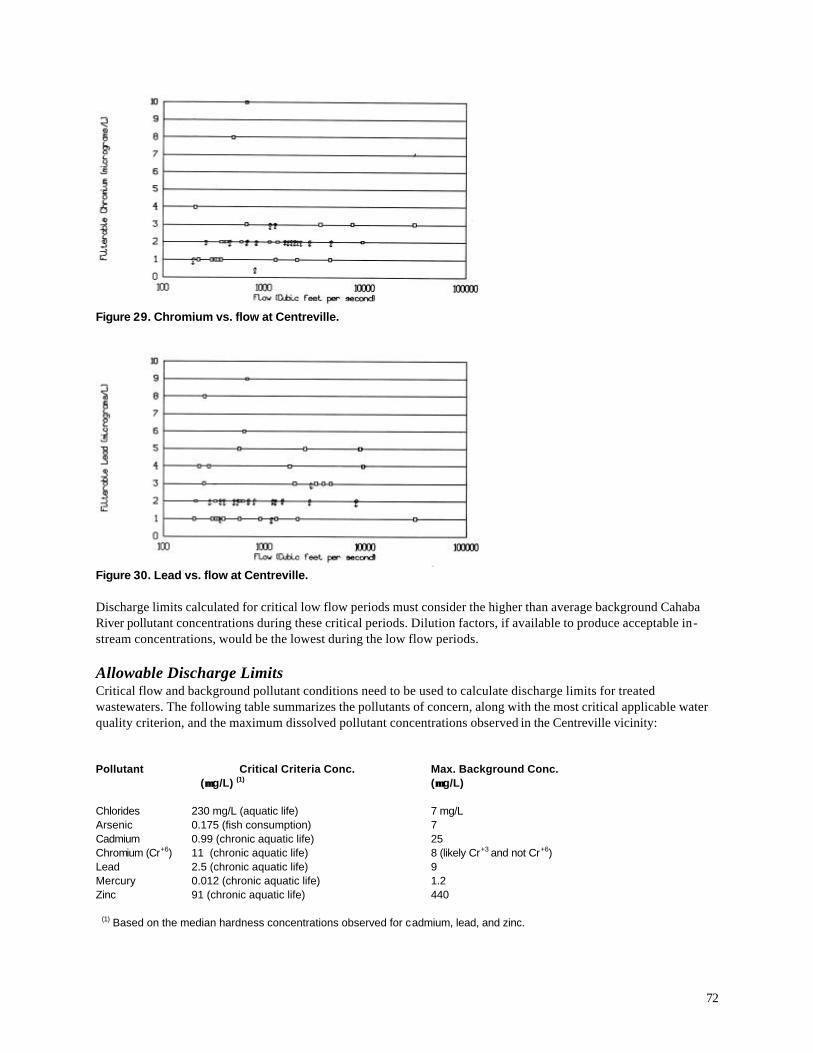
72
Figure 29. Chromium vs. flow at Centreville.
Figure 30. Lead vs. flow at Centreville. Discharge limits calculated for critical low flow periods must consider the higher than average background Cahaba River pollutant concentrations during these critical periods. Dilution factors, if available to produce acceptable in-stream concentrations, would be the lowest during the low flow periods.
Allowable Discharge Limits Critical flow and background pollutant conditions need to be used to calculate discharge limits for treated wastewaters. The following table summarizes the pollutants of concern, along with the most critical applicable water quality criterion, and the maximum dissolved pollutant concentrations observed in the Centreville vicinity: Pollutant Critical Criteria Conc. Max. Background Conc. (µµ g/L) (1) (µµ g/L) Chlorides 230 mg/L (aquatic life) 7 mg/L Arsenic 0.175 (fish consumption) 7 Cadmium 0.99 (chronic aquatic life) 25 Chromium (Cr+6) 11 (chronic aquatic life) 8 (likely Cr+3 and not Cr+6) Lead 2.5 (chronic aquatic life) 9 Mercury 0.012 (chronic aquatic life) 1.2 Zinc 91 (chronic aquatic life) 440 (1) Based on the median hardness concentrations observed for cadmium, lead, and zinc.
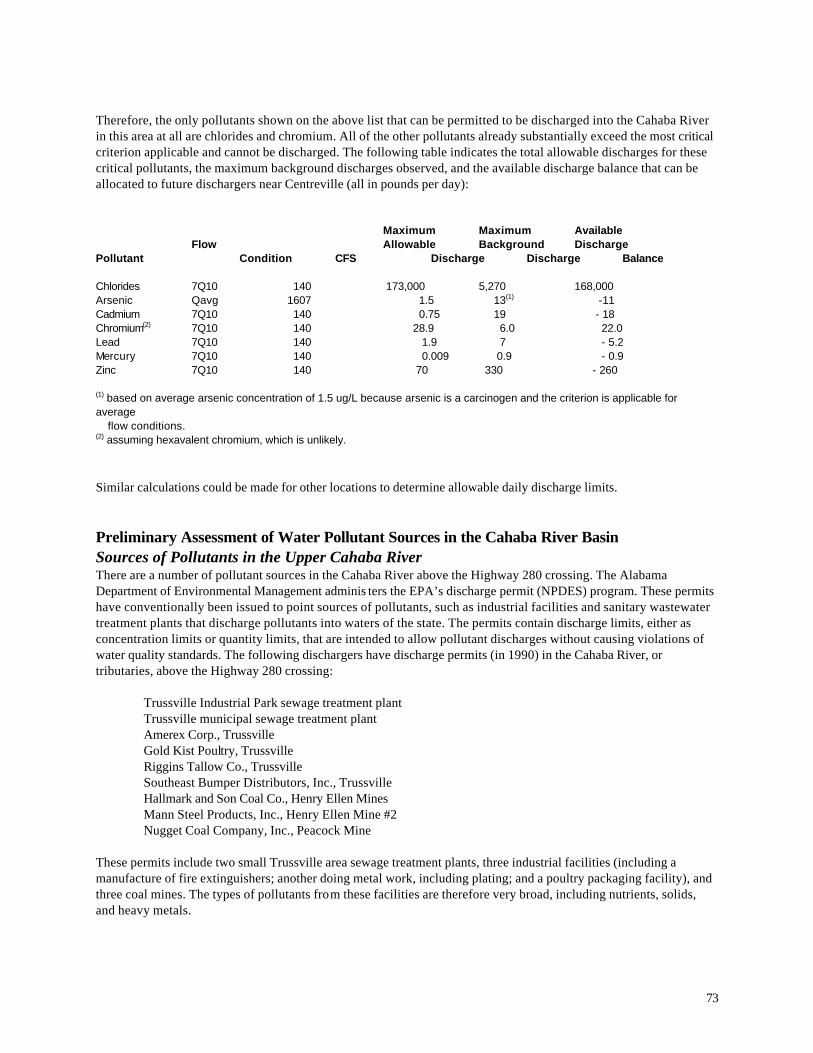
73
Therefore, the only pollutants shown on the above list that can be permitted to be discharged into the Cahaba River in this area at all are chlorides and chromium. All of the other pollutants already substantially exceed the most critical criterion applicable and cannot be discharged. The following table indicates the total allowable discharges for these critical pollutants, the maximum background discharges observed, and the available discharge balance that can be allocated to future dischargers near Centreville (all in pounds per day): Maximum Maximum Available Flow Allowable Background Discharge Pollutant Condition CFS Discharge Discharge Balance Chlorides 7Q10 140 173,000 5,270 168,000 Arsenic Qavg 1607 1.5 13(1) -11 Cadmium 7Q10 140 0.75 19 - 18 Chromium(2) 7Q10 140 28.9 6.0 22.0 Lead 7Q10 140 1.9 7 - 5.2 Mercury 7Q10 140 0.009 0.9 - 0.9 Zinc 7Q10 140 70 330 - 260 (1) based on average arsenic concentration of 1.5 ug/L because arsenic is a carcinogen and the criterion is applicable for average flow conditions. (2) assuming hexavalent chromium, which is unlikely. Similar calculations could be made for other locations to determine allowable daily discharge limits.
Preliminary Assessment of Water Pollutant Sources in the Cahaba River Basin Sources of Pollutants in the Upper Cahaba River There are a number of pollutant sources in the Cahaba River above the Highway 280 crossing. The Alabama Department of Environmental Management adminis ters the EPA’s discharge permit (NPDES) program. These permits have conventionally been issued to point sources of pollutants, such as industrial facilities and sanitary wastewater treatment plants that discharge pollutants into waters of the state. The permits contain discharge limits, either as concentration limits or quantity limits, that are intended to allow pollutant discharges without causing violations of water quality standards. The following dischargers have discharge permits (in 1990) in the Cahaba River, or tributaries, above the Highway 280 crossing: Trussville Industrial Park sewage treatment plant Trussville municipal sewage treatment plant Amerex Corp., Trussville Gold Kist Poultry, Trussville Riggins Tallow Co., Trussville Southeast Bumper Distributors, Inc., Trussville Hallmark and Son Coal Co., Henry Ellen Mines Mann Steel Products, Inc., Henry Ellen Mine #2 Nugget Coal Company, Inc., Peacock Mine These permits include two small Trussville area sewage treatment plants, three industrial facilities (including a manufacture of fire extinguishers; another doing metal work, including plating; and a poultry packaging facility), and three coal mines. The types of pollutants from these facilities are therefore very broad, including nutrients, solids, and heavy metals.
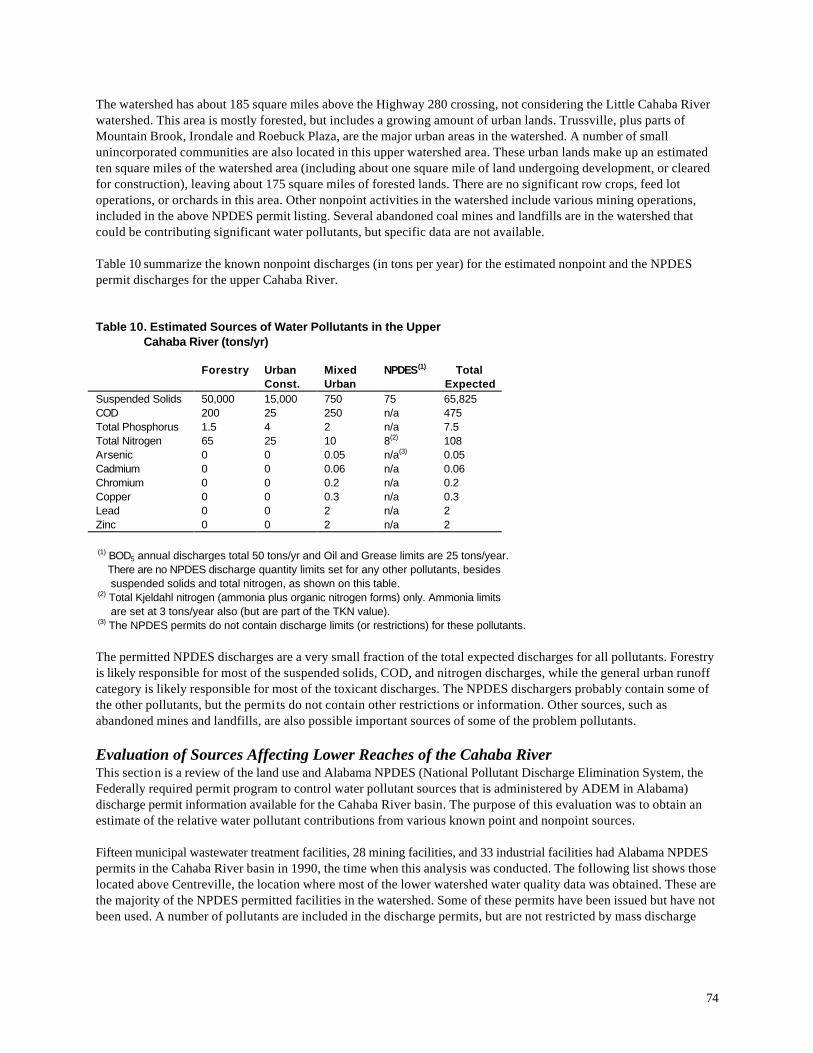
74
The watershed has about 185 square miles above the Highway 280 crossing, not considering the Little Cahaba River watershed. This area is mostly forested, but includes a growing amount of urban lands. Trussville, plus parts of Mountain Brook, Irondale and Roebuck Plaza, are the major urban areas in the watershed. A number of small unincorporated communities are also located in this upper watershed area. These urban lands make up an estimated ten square miles of the watershed area (including about one square mile of land undergoing development, or cleared for construction), leaving about 175 square miles of forested lands. There are no significant row crops, feed lot operations, or orchards in this area. Other nonpoint activities in the watershed include various mining operations, included in the above NPDES permit listing. Several abandoned coal mines and landfills are in the watershed that could be contributing significant water pollutants, but specific data are not available. Table 10 summarize the known nonpoint discharges (in tons per year) for the estimated nonpoint and the NPDES permit discharges for the upper Cahaba River. Table 10. Estimated Sources of Water Pollutants in the Upper
Cahaba River (tons/yr) Forestry Urban
Const. Mixed Urban
NPDES(1) Total Expected
Suspended Solids 50,000 15,000 750 75 65,825 COD 200 25 250 n/a 475 Total Phosphorus 1.5 4 2 n/a 7.5 Total Nitrogen 65 25 10 8(2) 108 Arsenic 0 0 0.05 n/a(3) 0.05 Cadmium 0 0 0.06 n/a 0.06 Chromium 0 0 0.2 n/a 0.2 Copper 0 0 0.3 n/a 0.3 Lead 0 0 2 n/a 2 Zinc 0 0 2 n/a 2 (1) BOD5 annual discharges total 50 tons/yr and Oil and Grease limits are 25 tons/year. There are no NPDES discharge quantity limits set for any other pollutants, besides suspended solids and total nitrogen, as shown on this table. (2) Total Kjeldahl nitrogen (ammonia plus organic nitrogen forms) only. Ammonia limits are set at 3 tons/year also (but are part of the TKN value). (3) The NPDES permits do not contain discharge limits (or restrictions) for these pollutants. The permitted NPDES discharges are a very small fraction of the total expected discharges for all pollutants. Forestry is likely responsible for most of the suspended solids, COD, and nitrogen discharges, while the general urban runoff category is likely responsible for most of the toxicant discharges. The NPDES dischargers probably contain some of the other pollutants, but the permits do not contain other restrictions or information. Other sources, such as abandoned mines and landfills, are also possible important sources of some of the problem pollutants.
Evaluation of Sources Affecting Lower Reaches of the Cahaba River This section is a review of the land use and Alabama NPDES (National Pollutant Discharge Elimination System, the Federally required permit program to control water pollutant sources that is administered by ADEM in Alabama) discharge permit information available for the Cahaba River basin. The purpose of this evaluation was to obtain an estimate of the relative water pollutant contributions from various known point and nonpoint sources. Fifteen municipal wastewater treatment facilities, 28 mining facilities, and 33 industrial facilities had Alabama NPDES permits in the Cahaba River basin in 1990, the time when this analysis was conducted. The following list shows those located above Centreville, the location where most of the lower watershed water quality data was obtained. These are the majority of the NPDES permitted facilities in the watershed. Some of these permits have been issued but have not been used. A number of pollutants are included in the discharge permits, but are not restricted by mass discharge
75
(pounds per day). Many of the pollutants have effluent concentration limits alone (such as in mg/L). Without mass discharge limits (or volume limits in conjunction with the concentration limits), the amounts of pollutants that could be discharged by the permitted facility is not restricted.
•• Municipal Discharge Permits above Centreville (ADEM Discharge Permits as of 1990) Cahaba River, Hoover Leeds Trussville Hoover Trussville (922934) Alabaster Helena Pelham Pelham, Hunters Glen Riverview, Birmingham Moody Centreville- Brent Montevallo •• Mining Discharge Permits above Centreville (ADEM Discharge Permits as of 1990) Blue Circle Inc., Roberta Plant Cheney Lime and Cement Co., Landmark Plant Dravo Basic Materials Co., Maylene Plant Lehigh Portland Cement Co., Leeds Plant Vulcan Materials Co., Calera Quarry Southern Ready Mix Inc., Calera Rock Quarry Vulcan Materials Co., Helena Quarry Bickerstaff Clay Products Co., Plant #5 Vulcan Materials Co., Parkwood Quarry Ray Cisco Construction Co., Shale Pit Alabama Refactory Clay Co., Montevallo Pit Bickerstaff Clay Products Co., Plant #6 BWS Technology Inc., Blocton #9 Reclamation Project Allied Products Co., Grayhill-Nunnally Mine Faulkner Energy Corp., Gurnee Mine Hallmark and Son Coal Co. Mann Steel Products Inc., Henry Ellen Mine #2 Allied Products Co., Woods tock Pits #1 and #2 B and G Mining Co., Yeshic Mine Central AL Paving Inc., White Pit New Circle Inc., Overton Nugget Coal Co., Peacock Mine U.S. Steel Mining Co., Gurnee Mine •• Industrial Discharge Permits above Centreville (ADEM Discharge Permits as of 1990) A. J. Gerrard and Co. Alabama Great South RR Norris Yard Amerex Corp. Birmingham Steel Drum

76
Cahaba Pressure Treated Forest Products Colonial Pipeline Co., Pelham Junction Electrical Specialty Products Co. Gold Kist Hatchery Gold Kist Poultry Hawkeye Oil and Gas, Inc. Interstate Lead M and B Metal Products Co. Met rock Steel and Wire Co. Olon Belcher Lumber Co. Owens-Illinois, Inc. Riggins Tallow Co. Rock Wool Manufacturing Co. Seaman Timber Co. Southeast Bumper Distributors, Inc. Southern Ready Mix, Inc., Plant #1 Southern Ready Mix, Inc., Plant #2 Sprviell Dairy Farm, Inc. Southern Precision Corp. Square D Co., Anderson Plant United Chair Vulcan Metal Products, Inc.
The expected nonpoint source discharges associated with forestry operations in the Cahaba River basin were estimated based on land use information from a number of sources. The unit area discharges and deliveries were mostly obtained from the Alabama Cooperative Study of the Alabama River, by the USDA in 1977. The delivery values estimate the fraction of the source area sheetflows that actually reach the receiving water. The amount of the pollutants that actually travel down the river to downstream areas is a function of many in-stream processes. The values from these sources for suspended solids was about 1.7 tons per acre per year lost, with about 25 percent being delivered to the receiving water. The COD loss was about 15 pounds per acre per year, the total phosphorus loss was about 0.12 pounds per acre per year, and the total nitrogen loss was about 4.3 pounds per acre per year, all with an estimated 25 percent delivery to the receiving water. Similar calculations were made for agricultural sources. The unit area pollutant rates were also obtained from the Alabama Cooperative Study and were based on the mixture of different crops expected in the river basin. The values from these sources for suspended solids was about 5 tons per acre per year lost, with about 25 percent being delivered to the receiving water. The COD loss was about 140 pounds per acre per year, the total phosphorus loss was about 0.46 pounds per acre per year, and the total nitrogen loss was about 9.9 pounds per acre per year, all with an estimated 25 percent delivery to the receiving water. Analyses were also made of urban construction site discharges. The areas under construction were assumed to be about six percent of the total urban area, based on preliminary Birmingham area surveys (specifically the Rocky Ridge Corridor demonstration project). The discharges were obtained from many local Birmingham area samples and averaged about 150 tons per acre per year. The deliveries to the streams were estimated to be about 25 percent. The COD loss was about 500 pounds per acre per year, the total phosphorus loss was about 80 pounds per acre per year, and the total nitrogen loss was about 500 pounds per acre per year, all with estimated 25 percent deliveries to the receiving water. Mixed urban area pollutant contributions in the watershed were also estimated. The mixture of land uses was obtained from local Birmingham data from detailed local measurements obtained in the Rocky Ridge Corridor demonstration project conducted by the Jefferson Co. SCS office. The unit area pollutant discharges were obtained

77
from NURP information (EPA 1983) and local EPA sponsored research (Pitt, et al. 1995). The values from these sources for suspended solids was about 250 pounds per acre per year lost, with 100 percent being delivered to the receiving water. The COD loss was about 80 pounds per acre per year, the total phosphorus loss was about 0.5 pounds per acre per year, and the total nitrogen loss was about 3.5 pounds per acre per year. The deliveries of these pollutants is 100 percent because the yields were measured at the outfalls to the receiving waters. The following additional urban area pollutant mass discharges were also estimated (all pounds per acre per year): lead: 0.5; zinc: 0.7; chromium: 0.06; copper: 0.1; cadmium: 0.02; and arsenic: 0.015. Suspended solids from the nonpoint sources will mostly accumulate in the river, while suspended solids from treated wastewaters are more likely to travel greater distances downstream due to the settling characteristics of the particles. Most other pollutants are likely to travel more efficiently than the suspended solids. The following summary shows the estimated nonpoint discharges from these sources for the complete watershed: Source Area Suspended COD Total P Total N (square Solids (tons/yr) (tons/yr) (tons/yr) miles) (tons/yr) Forestry 1350 370,000 1,600 13 470 Agriculture 130 100,000 1,400 5 100 Construction 13 300,000 500 80 500 Mixed urban 200 16,000 5,300 40 230 NPDES permits - 320 400 (est) NA 60 The following list summarizes the estimated pollutant contributions from the most significant sources for the whole Cahaba River watershed: TSS: construction site erosion: 40 percent. forestry: 50 percent. COD: mixed urban runoff: 60 percent. forestry: 20 percent. Total P: construction site erosion: 60 percent. mixed urban runoff: 30 percent. Total N: forestry: 35 percent. construction site erosion: 40 percent. mixed urban runoff: 20 percent. Lead: mixed urban runoff: about 100 percent. Zinc: mixed urban runoff: about 100 percent. The mass pollutant contributions from the NPDES permitted discharges are quite low: TSS: <1 percent COD: 4 percent. Total P: N/A. Obviously, the municipal wastewater facilities are significant phosphorus dischargers, but
none of them have P mass discharge limits set in their permits. Total N: 4 percent. Lead: <<1 percent. Zinc: <<1 percent. Estimated pollutant concentrations were calculated using these discharge values and an average river flow value of 3.8 X 10¹¹ gallons per year at Centreville. These calculated concentrations were compared to the observed
78
concentration values in the river as a rough check for the above mass balances. The following list summarizes these calculated concentrations and comparisons: • TSS: 330 mg/L. This value is too high. It is expected that about 90 percent of the nonpoint suspended solids discharges would settle out in the river as sediment accumulations. The long-term average
concentrations at Centreville are about 25 mg/L. • COD: 4.5 mg/L. This value is close to the expected COD concentration at Centreville. • Total P: 0.08 mg/L. This value is close to the expected P concentration at Centreville. • Total N: 0.6 mg/L. This value is close to the expected N concentration at Centreville. • Lead. 20 µg/L. This value is close to the expected total lead concentration at Centreville. The dissolved
lead concentration at Centreville is about 2 µg/L. About ten percent of the total lead concentration is expected to be dissolved. The urban contribution of lead at Centreville is about 2.3 tons per year, while the total river flow accounts for about 2.7 tons per year.
• Zinc: 30 µg/L. This value is close to the expected total zinc concentration at Centreville. The dissolved zinc concentration at Centreville is about 35 µg/L. Usually almost all of the total zinc in urban runoff is in the dis solved form. The urban contribution of zinc at Centreville is about 39 tons per year, while the total river flow accounts for about 57 tons per year.
• Chromium: 2.5 µg/L. This value is about twice the expected total chromium concentration at Centreville. The dissolved chromium concentration at Centreville is about 1.3 µg/L. The urban contribution of chromium at Centreville is about 2.1 tons per year, while the total river flow accounts for about 2.0 tons per year.
• Cadmium: 0.8 µg/L. This value is about one-third the expected total cadmium concentration at Centreville. The dissolved cadmium concentration at Centreville is about 2.4 µg/L. The urban contribution of cadmium at Centreville is about 0.56 tons per year, while the total river flow accounts for about 3.8 tons per year. Other unaccounted sources, including natural background conditions, may be responsible for the remainder.
• Arsenic: 0.6 µg/L. This value is about one-half the expected total arsenic concentration at Centreville. The dissolved arsenic concentration at Centreville is about 1.5 µg/L. The urban contribution of arsenic at Centreville is about 0.49 tons per year, while the total river flow accounts for about 2.4 tons per year. Other unaccounted sources, including natural background conditions, may be responsible for the remainder.
These calculated concentrations generally agree with the observed concentration values from Centreville. Therefore the mass balances given above are also expected to be reasonable accurate. However, unaccounted sources of some of the heavy metals, especially cadmium (two-thirds) and arsenic (one-half), may be significant.
Conclusions As indicated in the above discussion, high concentrations of many pollutants investigated were generally found in the highest reaches of the Cahaba River for which data was available. These were mostly located near likely localized sources (especially an abandoned landfill, old mines, and improper disposal at an industrial facility) and in stream reaches having relatively low flows. However, adverse concentrations for many constituents (especially heavy metals) were found at locations much further downstream from these localized sources. Cahaba River water quality at the Birmingham Water Works pumping station and even further downstream at Centreville indicated several problems described below. At these locations, urban stormwater was the largest source of pollutant discharges (compared to forestry operations, agriculture operations, and permitted NPDES discharges).
Pollutant Sources The following graphs summarize some of the historical and more recent water quality observations for nutrients in the Cahaba River, including source area sheetflow concentrations (Pitt, et al. 1995) and land use yields (Lalor, et al. 1998). There is a wide range of concentrations of nutrients in the river, based on historical and recent observations. Much of the variation is related to wet weather flows, which can have nutrient concentrations many times greater
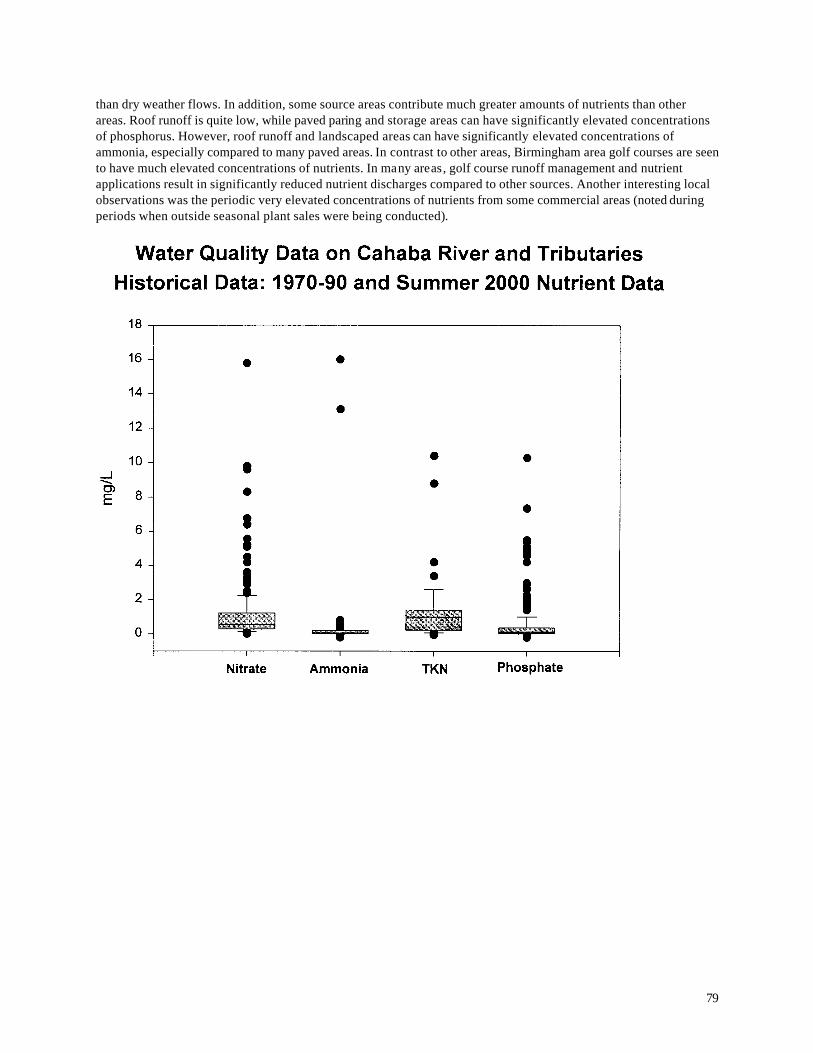
79
than dry weather flows. In addition, some source areas contribute much greater amounts of nutrients than other areas. Roof runoff is quite low, while paved paring and storage areas can have significantly elevated concentrations of phosphorus. However, roof runoff and landscaped areas can have significantly elevated concentrations of ammonia, especially compared to many paved areas. In contrast to other areas, Birmingham area golf courses are seen to have much elevated concentrations of nutrients. In many areas, golf course runoff management and nutrient applications result in significantly reduced nutrient discharges compared to other sources. Another interesting local observations was the periodic very elevated concentrations of nutrients from some commercial areas (noted during periods when outside seasonal plant sales were being conducted).
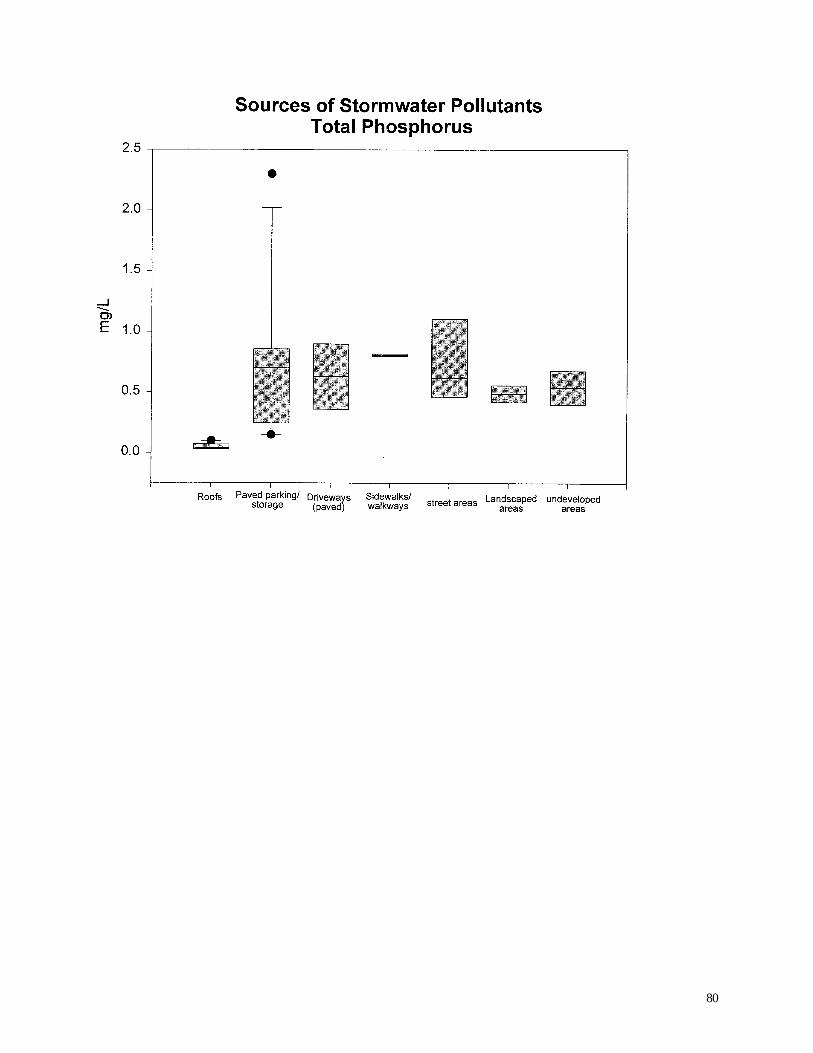
80
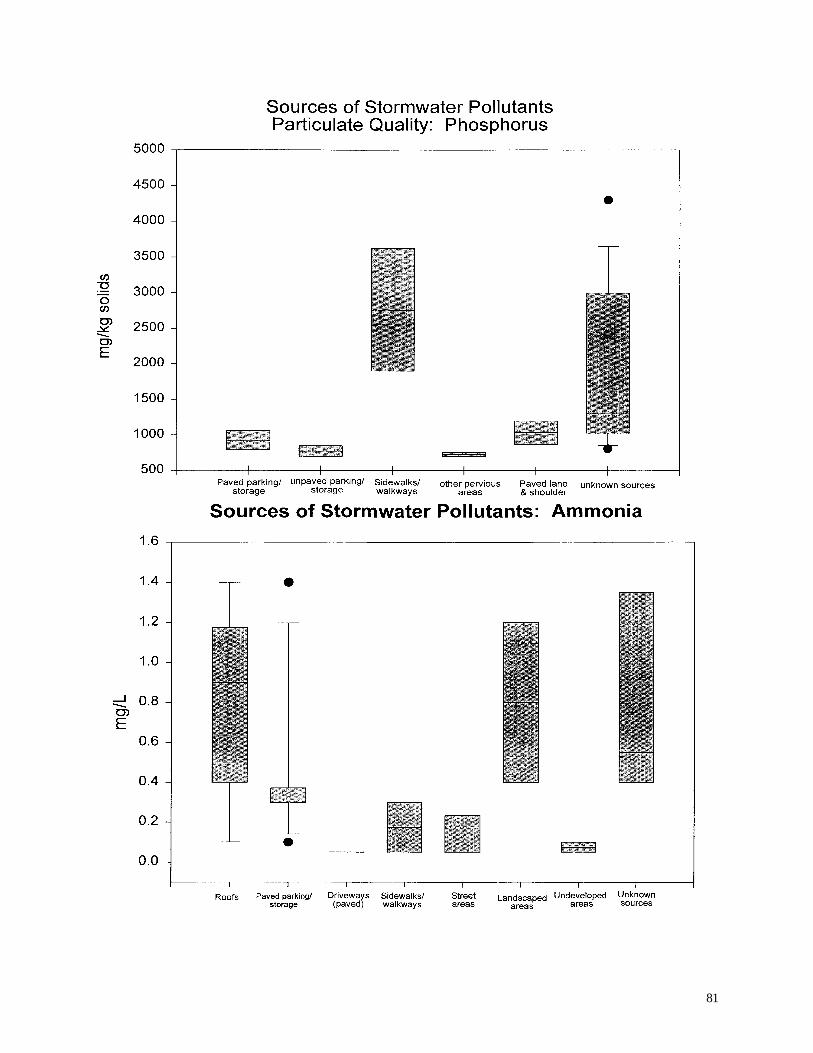
81
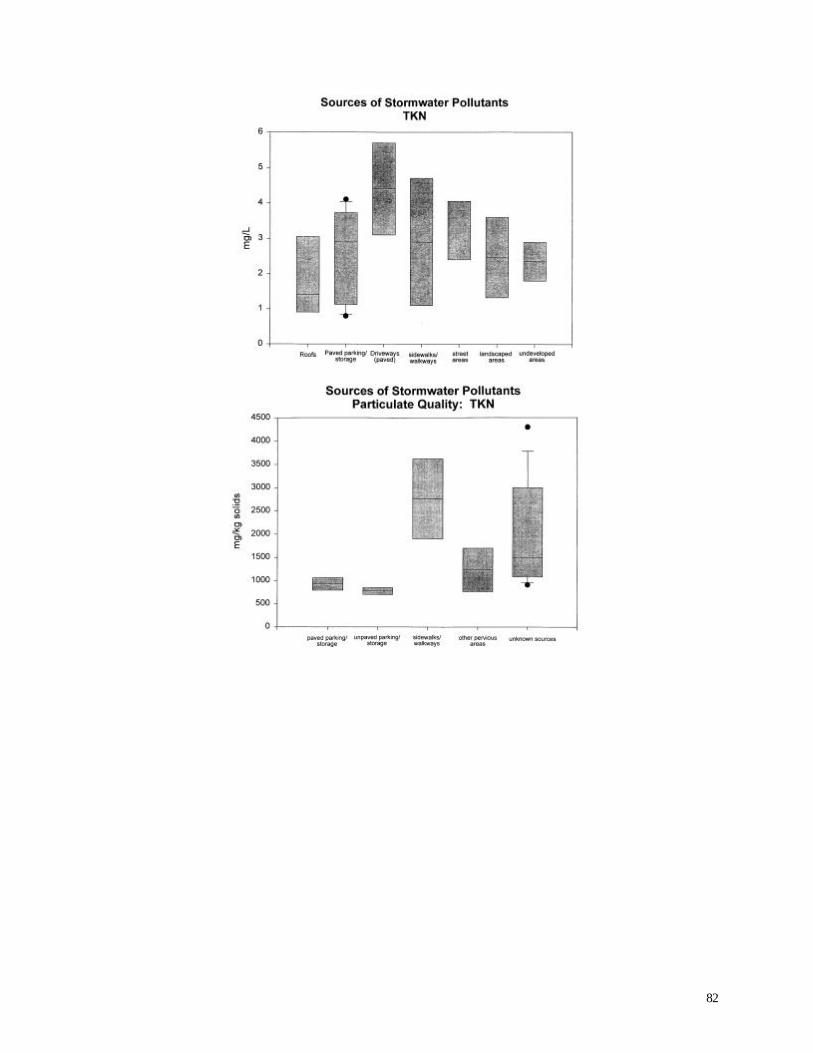
82
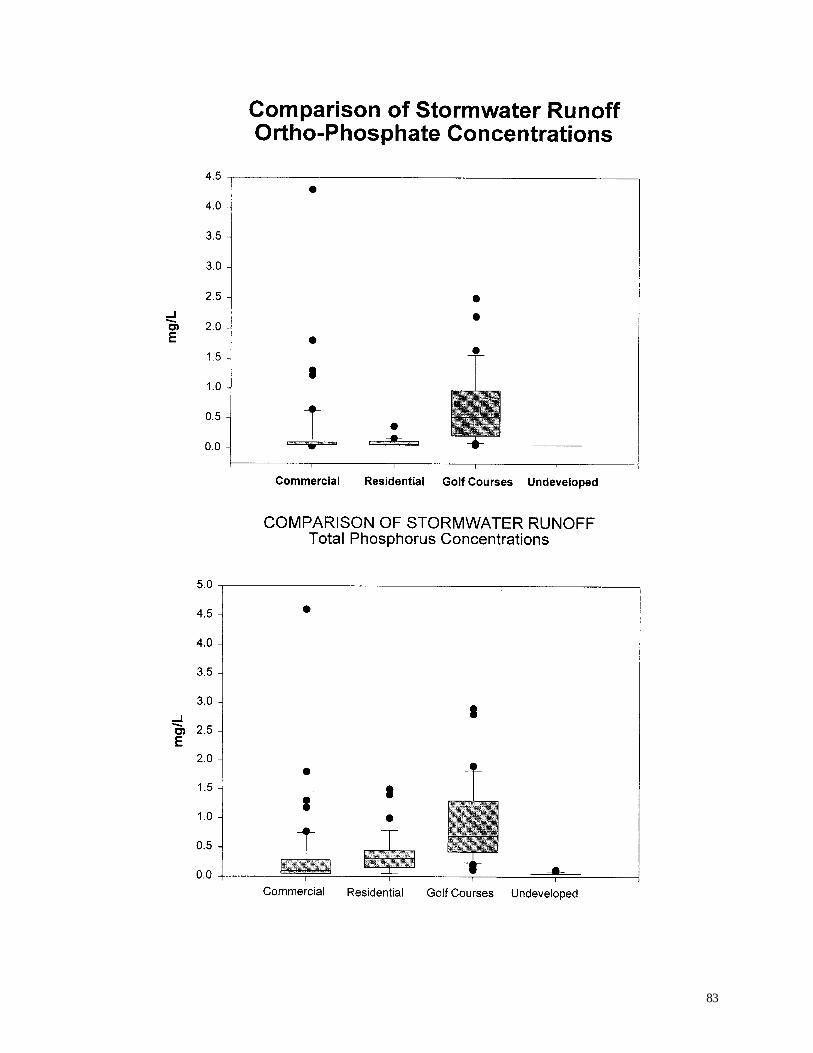
83
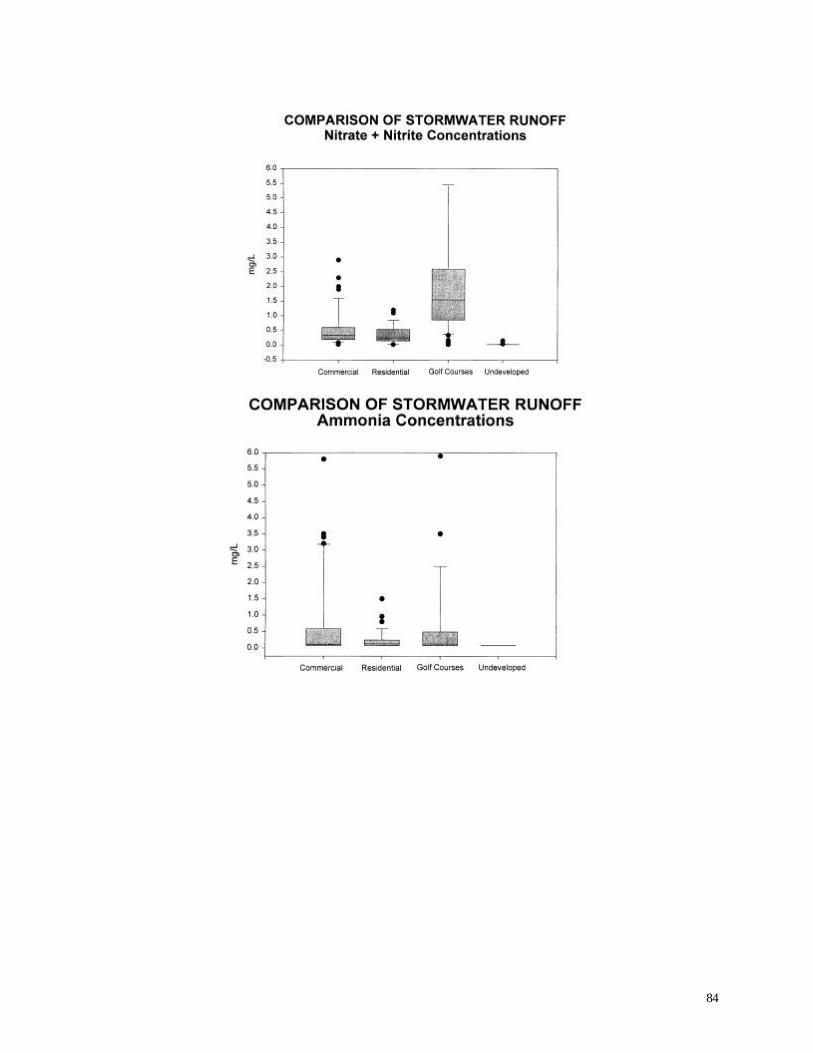
84

85
Upper-Reach Cahaba River Conditions The most serious water pollution problems in the upper reaches of the Cahaba River, in possible order of importance, are as follows: • Toxicants exceeding the human health criteria (especially the carcinogens arsenic and the organic PAHs,
plus mercury which always exceeded the EPA criteria, plus likely frequent violations of cadmium). • Nuisance conditions, especially eutrophication (nutrient enrichment) caused by high phosphorus
concentrations. Increased nitrogen discharges will dramatically worsen eutrophication conditions. Other nuisance conditions frequently occur caused by high iron content in drinking water and frequently turbid water.
• Aquatic life problems caused by toxicants (especially cadmium, lead, and possibly zinc), high temperatures during spawning periods, sedimentation because of localized high erosion, and infrequent low dissolved oxygen concentrations.
• Swimming problems caused by periodic exposures to pathogenic microörganisms (as indicated by high populations of fecal coliform bacteria).
The above problems are quite widespread and do not appear to be associated with specific locations, or times, although many of the toxicant problems are worse further upstream. Other problems identified (especially for chlorides and ammonia) are likely infrequent and were probably associated with intermittent (illegal?) industrial discharges. Some problems are also likely associated with more continuous discharges from improperly operated facilities (such as a landfill slightly above the BWWB pump station, upstream mines, and poorly operated wastewater treatment facilities).
Mid-Reach Cahaba River Conditions The current high concentrations of several heavy metals in the Cahaba River indicate the need for serious further investigations. Numerous and large violations of the EPA arsenic and mercury human health criteria (fish consumption) were observed for previously collected Cahaba River samples. These criteria were violated by every sample collected at West Blocton and Centreville. These criteria exceedences signal the need for comprehensive fish (and other organism) tissue analysis to quantify the threat to human health.
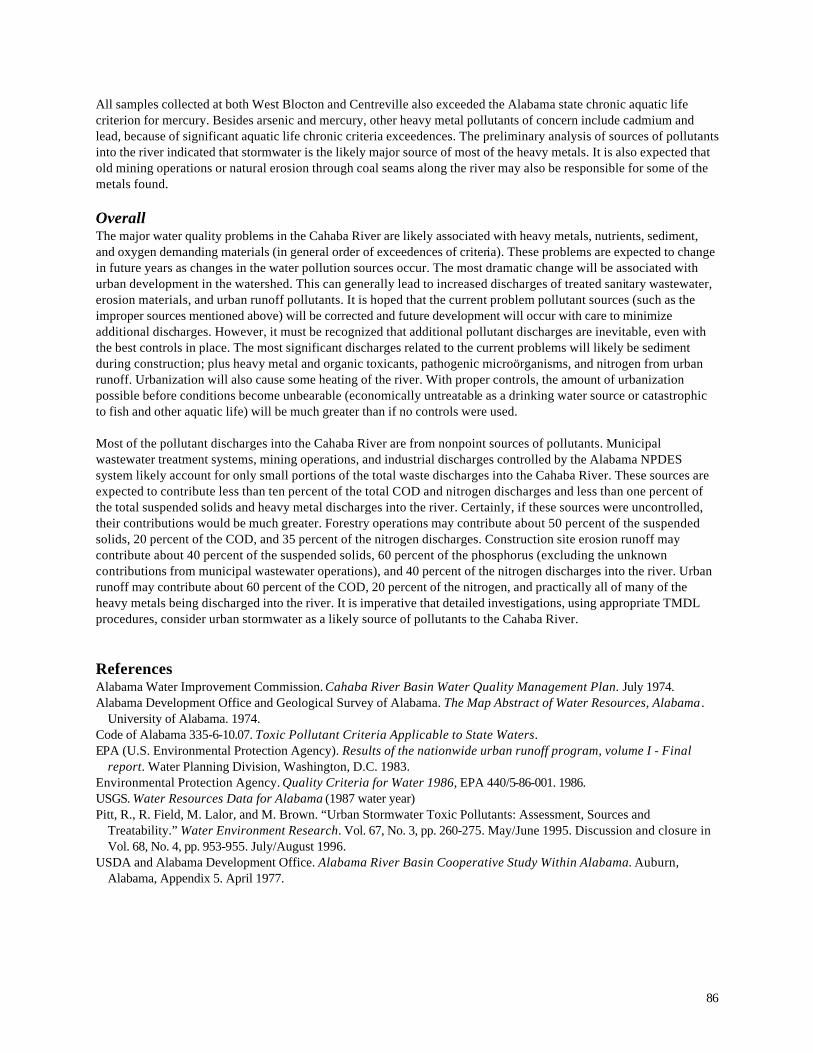
86
All samples collected at both West Blocton and Centreville also exceeded the Alabama state chronic aquatic life criterion for mercury. Besides arsenic and mercury, other heavy metal pollutants of concern include cadmium and lead, because of significant aquatic life chronic criteria exceedences. The preliminary analysis of sources of pollutants into the river indicated that stormwater is the likely major source of most of the heavy metals. It is also expected that old mining operations or natural erosion through coal seams along the river may also be responsible for some of the metals found.
Overall The major water quality problems in the Cahaba River are likely associated with heavy metals, nutrients, sediment, and oxygen demanding materials (in general order of exceedences of criteria). These problems are expected to change in future years as changes in the water pollution sources occur. The most dramatic change will be associated with urban development in the watershed. This can generally lead to increased discharges of treated sanitary wastewater, erosion materials, and urban runoff pollutants. It is hoped that the current problem pollutant sources (such as the improper sources mentioned above) will be corrected and future development will occur with care to minimize additional discharges. However, it must be recognized that additional pollutant discharges are inevitable, even with the best controls in place. The most significant discharges related to the current problems will likely be sediment during construction; plus heavy metal and organic toxicants, pathogenic microörganisms, and nitrogen from urban runoff. Urbanization will also cause some heating of the river. With proper controls, the amount of urbanization possible before conditions become unbearable (economically untreatable as a drinking water source or catastrophic to fish and other aquatic life) will be much greater than if no controls were used. Most of the pollutant discharges into the Cahaba River are from nonpoint sources of pollutants. Municipal wastewater treatment systems, mining operations, and industrial discharges controlled by the Alabama NPDES system likely account for only small portions of the total waste discharges into the Cahaba River. These sources are expected to contribute less than ten percent of the total COD and nitrogen discharges and less than one percent of the total suspended solids and heavy metal discharges into the river. Certainly, if these sources were uncontrolled, their contributions would be much greater. Forestry operations may contribute about 50 percent of the suspended solids, 20 percent of the COD, and 35 percent of the nitrogen discharges. Construction site erosion runoff may contribute about 40 percent of the suspended solids, 60 percent of the phosphorus (excluding the unknown contributions from municipal wastewater operations), and 40 percent of the nitrogen discharges into the river. Urban runoff may contribute about 60 percent of the COD, 20 percent of the nitrogen, and practically all of many of the heavy metals being discharged into the river. It is imperative that detailed investigations, using appropriate TMDL procedures, consider urban stormwater as a likely source of pollutants to the Cahaba River.
References Alabama Water Improvement Commission. Cahaba River Basin Water Quality Management Plan. July 1974. Alabama Development Office and Geological Survey of Alabama. The Map Abstract of Water Resources, Alabama .
University of Alabama. 1974. Code of Alabama 335-6-10.07. Toxic Pollutant Criteria Applicable to State Waters. EPA (U.S. Environmental Protection Agency). Results of the nationwide urban runoff program, volume I - Final
report. Water Planning Division, Washington, D.C. 1983. Environmental Protection Agency. Quality Criteria for Water 1986, EPA 440/5-86-001. 1986. USGS. Water Resources Data for Alabama (1987 water year) Pitt, R., R. Field, M. Lalor, and M. Brown. “Urban Stormwater Toxic Pollutants: Assessment, Sources and
Treatability.” Water Environment Research. Vol. 67, No. 3, pp. 260-275. May/June 1995. Discussion and closure in Vol. 68, No. 4, pp. 953-955. July/August 1996.
USDA and Alabama Development Office. Alabama River Basin Cooperative Study Within Alabama. Auburn, Alabama, Appendix 5. April 1977.
Related Documents