Water Quality Awareness and Infant Health: The Role of Breastfeeding Pinar Keskin, Gauri Kartini Shastry and Helen Willis 1 Wellesley College December 2013 Abstract Decades of nation-wide campaigns regarding water safety in Bangladesh have cautioned households about the dangers of water-borne diseases from surface water and, more recently, arsenic contamination from certain tubewells. In addition to switching to uncontaminated well water, mothers can also protect their young children by breastfeeding longer. We study whether mothers modify their behavior in response. We exploit geographic variation in exposure to arsenic and time variation in whether children were born before or after the most recent campaign. Our identifying assumption is that, conditional on village, birth year, and district trends, breastfeeding patterns were not changing differentially in more contaminated villages relative to less contaminated villages. In addition, we exploit geographic variation in the cost of switching to an arsenic-free well, namely the distance to nearby uncontaminated wells. We find that mothers breastfeed their children longer in contaminated areas and that this change is greater when households have less access to clean wells. We also find that very young children in contaminated areas are more likely to be exclusively breastfed. Consistent with this finding, we find suggestive evidence of relatively lower mortality rates and incidence of diarrhea for infants in more contaminated areas. 1 Please direct correspondence to [email protected]. We thank Alison Pearson for excellent research assistance and the Wellesley Summer Research Program in the Social Sciences for financial support. We are grateful to Alessandro Bonatti, Kristin Butcher, Dan Fetter, Andrew Foster, Robin McKnight, Phil Levine, Mark Rosenzweig, Casey Rothschild, Nick Ryan, Steven Stern and Dan Tortorice as well as seminar participants at Wellesley College, Singapore Management University, Dartmouth College, the Liberal Arts Colleges Development Economic Conference and the UVA Environment and Development Conference for valuable suggestions.

Welcome message from author
This document is posted to help you gain knowledge. Please leave a comment to let me know what you think about it! Share it to your friends and learn new things together.
Transcript

Water Quality Awareness and Infant Health: The Role of Breastfeeding
Pinar Keskin, Gauri Kartini Shastry and Helen Willis1
Wellesley College
December 2013
Abstract
Decades of nation-wide campaigns regarding water safety in Bangladesh have cautioned households about the dangers of water-borne diseases from surface water and, more recently, arsenic contamination from certain tubewells. In addition to switching to uncontaminated well water, mothers can also protect their young children by breastfeeding longer. We study whether mothers modify their behavior in response. We exploit geographic variation in exposure to arsenic and time variation in whether children were born before or after the most recent campaign. Our identifying assumption is that, conditional on village, birth year, and district trends, breastfeeding patterns were not changing differentially in more contaminated villages relative to less contaminated villages. In addition, we exploit geographic variation in the cost of switching to an arsenic-free well, namely the distance to nearby uncontaminated wells. We find that mothers breastfeed their children longer in contaminated areas and that this change is greater when households have less access to clean wells. We also find that very young children in contaminated areas are more likely to be exclusively breastfed. Consistent with this finding, we find suggestive evidence of relatively lower mortality rates and incidence of diarrhea for infants in more contaminated areas.
1 Please direct correspondence to [email protected]. We thank Alison Pearson for excellent research assistance and the Wellesley Summer Research Program in the Social Sciences for financial support. We are grateful to Alessandro Bonatti, Kristin Butcher, Dan Fetter, Andrew Foster, Robin McKnight, Phil Levine, Mark Rosenzweig, Casey Rothschild, Nick Ryan, Steven Stern and Dan Tortorice as well as seminar participants at Wellesley College, Singapore Management University, Dartmouth College, the Liberal Arts Colleges Development Economic Conference and the UVA Environment and Development Conference for valuable suggestions.

1
1. Introduction
Water-related diseases pose a major global health problem, particularly in the developing
world. According to the World Health Organization, water and hygiene-related causes account
for more than 3.5 million deaths each year, almost all in developing countries (Prüss-Üstün et al.
2008). Despite an extensive literature on how to encourage families to adopt better water
practices, such as water treatment, eliciting behavior change remains a challenge, in part due to
very low willingness to pay for clean water.2 In this paper, we provide evidence of a particular
sort of behavior change in response to recent concerns about water quality in Bangladesh:
increased breastfeeding duration and longer periods of exclusive breastfeeding. Breastfeeding
can provide a less pecuniary way for mothers to protect their children from water-borne diseases,
such as diarrheal illnesses, in their first years of life when these diseases are particularly severe
and potentially fatal (Habicht, DaVanzo, and Butz 1988).
Bangladesh has a long history of water quality concerns and safety measures. The first
water safety efforts began in the 1970s when millions of shallow tubewells were built across the
country to combat the spread of water-borne diseases through surface water. In the 1990s, high
levels of arsenic were discovered in water from many tubewells and about 35 million people
were thought to be drinking contaminated water (British Geological Survey and Department of
Public Health Engineering 2001). In response, the Bangladesh government began testing wells,
painting contaminated wells red, disseminating information on arsenic, and encouraging
households to switch to clean wells. These efforts began in 1999 and lasted until 2006 (Atkins,
Hassan and Dunn 2007); by 2004, 84% of households had heard of arsenic contamination and
only 8% were drinking contaminated water (BDHS data, authors’ tabulations).
In addition to switching to arsenic-free water sources, mothers can also respond to
increased concerns about water quality, both due to arsenic contamination and other water-borne
pathogens, by further utilizing the protective aspects of breastfeeding. A large literature has
established that breastfeeding protects children from contaminated food and water, and while
arsenic does pass through breast milk, the concentration in breast milk is very low relative to the
mothers’ exposure (Fängstrom et al. 2008). If mothers think breastfeeding is a way of limiting
the amount of dangerous water they feed their children, they may choose to breastfeed longer.
2 See Ahuja, Kremer and Zwane (2010) for a review of recent randomized evaluations.
2
While it is unlikely that mothers knew that breastfeeding protects children from arsenic,3
numerous nation-wide promotions have emphasized the value of breastfeeding.
To study this question, we take advantage of time variation in whether a child was born
before or after the information campaign and geographic variation in arsenic contamination using
a difference-in-difference (DID) strategy. We use three waves of the Bangladesh Demographic
Health Survey (BDHS 1999, 2004 and 2007) to compile a sample of children born each year
from 1995 to 2007 across contaminated and uncontaminated areas. We assume that the
information would be most salient for households near contaminated wells, making them most
likely to modify their breastfeeding choices. The geographic variation we rely on is sufficiently
local that we are able to include BDHS cluster (similar to village) fixed effects, which account
for many possible omitted variables correlated with arsenic contamination, as well as district-
specific linear trends.4 Our identifying assumption is that, conditional on village, birth year, and
district trends, breastfeeding patterns were not changing differentially in more contaminated
villages relative to less contaminated villages, other than for reasons related to the water safety
campaign. Using this strategy, we find that children born after the information campaign are
breastfed longer and more likely to be exclusively breastfed in arsenic contaminated areas
relative to uncontaminated areas. An event study specification confirms this finding and provides
support for our identifying assumption: prior to the information campaign, breastfeeding patterns
in contaminated areas are indistinguishable from those in uncontaminated areas. Unsurprisingly,
the results are driven by rural areas where piped water is less common.
Of course, breastfeeding is just one dimension on which households can respond to new
information on water quality. The more important dimension, switching to an uncontaminated
well, clearly dominates since it protects the whole household from both arsenic and microbial
pathogens. In fact, if a household switches to a clean well, one could argue that there is no need
to adjust breastfeeding behavior. We look for differential responses to the information campaign
with respect to the cost of switching to a clean well, by exploiting variation in the geographic
distribution of uncontaminated wells and estimating a triple difference. We first verify that 3 Based on the campaign documentation, we do not believe information on breastfeeding was disseminated to households as part of the campaign. The arsenic-related information was often provided at the well site during the arsenic test by engineers who were most often men. Since Bangladesh is predominantly Muslim, we believe it is unlikely these engineers spoke to local women or men about breastfeeding. 4 Figure 1 presents a map of the wells used to calculate our measure of contamination, shaded by the level of arsenic in 1998 (BGS and DPHE 2001). Wells that tested above 10 µg/L, the WHO’s guideline for contamination, are shaded grey and those that tested above 50 µg/L, the Bangladesh government’s standard, are shaded white.
3
households that live farther from an uncontaminated well are less likely to switch to a clean well;
they either continue to drink arsenic-contaminated well water or switch to surface water sources.
Regardless of which potentially contaminated water source they choose, these mothers can
protect their youngest children from both arsenic and bacterial contamination by breastfeeding.
We show that the DID effect described above is driven by households who are not using clean
wells. Next, acknowledging the endogeneity of the choice of water source, we find that the DID
effect is driven by mothers who live far from uncontaminated wells.
In addition to bolstering our identification strategy, this triple difference result supports
our interpretation that women breastfeed more to protect their children from contaminated water.
Specifically, it helps rule out alternative explanations for our results, such as improved health
due to reduced arsenic exposure, since women closer to clean wells should experience a greater
health improvement. We are unable to fully rule out other explanations such as a substitution
towards breastfeeding because of an increase in the time cost of fetching water or a change in the
value of the mothers’ time, but we argue below that these are unlikely.
Finally, we look for heterogeneous effects by age and find that the exclusive
breastfeeding results are driven by children younger than 12 months. Supporting our claim that
this behavior is in response to water concerns, we find that these children are less likely to drink
water in the past 24 hours. We also find evidence of lower mortality rates, lower incidence of
diarrhea and greater weight for these children (but not older children). While exclusive
breastfeeding can explain these effects, we cannot claim that this is the causal effect of
breastfeeding and not partly the effect of reduced arsenic exposure, even though there is little
evidence that children show arsenicosis symptoms.
Our paper contributes to the understanding of the consequences of this massive
environmental tragedy and related mitigation efforts. Pitt, Rosenzweig and Hassan (2012)
examine the consequences of arsenic poisoning and find that it has negative effects on cognition,
schooling and earnings for young men as well as on productivity in home production by women.
Various papers study the impact of the mitigation efforts, documenting that knowledge increased
and use of contaminated wells fell (Jakariya 2007, Madajewicz et al. 2007, Bennaer et al. 2013).
The closest paper to ours, Field, Glennerster and Hussam (2011), documents a substantial
increase in under-five mortality from diarrheal diseases among households whose closest well
was contaminated with arsenic. One likely explanation is that households that switched water

4
sources often switched back to surface sources, despite the well-known risks. This finding speaks
to unintended adverse consequences of the arsenic mitigation efforts, while our paper
demonstrates similarly unintended but positive consequences. Our findings complement these
earlier results: their mortality effects are strongest for older children, while ours are strongest for
the youngest children, who are more likely to be exclusively breastfed.
More broadly, our paper relates to the question of whether and how people change their
health behaviors in response to information. Ahuja, Kremer and Zwane (2010) provide a review
of randomized trials on water quality, which show mixed results. They conclude that programs to
improve access to water require more study. They also describe recent evidence that the
willingness to pay for clean water is low (see, for example, Kremer et al. 2011) and that
information dissemination has only a modest effect (Jalan and Somanathan 2008, Luoto, Levine
and Albert 2011), but that behavioral biases may have a role to play in explaining household
decisions about water (Madajewicz et al. 2007, Tarozzi et al. 2009). The impact of information
on other health behaviors has also been studied extensively but shows mixed results (see, for
example, Dupas 2011, Gallant and Maticka-Tyndale 2004, Hayes et al. 2005, on sexual health
education and HIV in Africa; Downs, Loewenstein and Wisdom 2009, Davis et al. 2009 on diet
and smoking in the US). Our contribution to this literature is providing evidence of behavior
change: in response to new information about water quality, mothers breastfed their children
longer and more exclusively. In Section 6, we discuss the motivation behind this behavior
change and argue that it is likely to be concern for child well-being.
The paper is organized as follows. The following section provides background on water
quality, arsenic mitigation efforts and the benefits of breastfeeding in Bangladesh. Section 3
describes the empirical strategy, including the data and the specifications. Section 4 documents
the impact of the information campaign on breastfeeding patterns. Section 5 presents the effect
of the information campaign on child health. Section 6 provides a discussion of alternative
explanations. Section 7 concludes.
2. Background
Arsenic is naturally present at unsafe levels in the groundwater of many regions around
the world. Chronic arsenic exposure through drinking water is associated with many human

5
health conditions (Saha et al. 1999).5 While the liver can process some ingested arsenic, chronic
exposure for 6 months or longer can lead to accumulation in the body and, eventually, major
health problems. In the short run, the symptoms of chronic exposure are relatively mild: for
example, skin rashes and irritation, weakness, diabetes, edema, and respiratory problems. After a
decade of exposure, however, arsenic is linked to increased risk of skin and internal organ
cancers, many of which are fatal.6 Since there is no known treatment for arsenic poisoning,
experts recommend drinking arsenic-free water as the only way to avoid arsenic related diseases
(Smith, Lingas and Rahman 2000). At the same time, however, there is little evidence that
arsenic exposure is related to ill health among children (Field, Glennerster and Hussam 2011).
2.A. Water safety efforts in Bangladesh
In the late 1970s and 1980s, public health concerns regarding water safety in Bangladesh
were focused on water-borne viral and parasitic infections. Millions of shallow tubewells were
built across the country by UNICEF and other international aid agencies to provide pathogen-
free drinking water and to prevent morbidity and mortality from gastrointestinal diseases (Smith,
Lingas and Rahman 2000). These agencies were successful at publicizing the dangers of surface
water through nationwide campaigns: 95% of rural Bangladeshis began drinking protected
groundwater (Caldwell et al. 2003).
In the late 1980s, however, geologists found traces of arsenic in this very same
groundwater.7 Soon afterwards, the skin lesions characteristic of chronic arsenic poisoning were
identified and diagnosed as arsenicosis. However, the magnitude of the problem was not clearly
understood until 1998 due to the lack of appropriate testing facilities (Carson, Koundouri and
Nauges 2011). In 1998 and 1999, the British Geological Survey (BGS) carried out the first
nation-wide survey to investigate the extent of the contamination problem, systematically testing
5 Although arsenic exposure can occur by ingestion through cooking or crops irrigated with contaminated water, the major exposure pathway from groundwater to human beings has been linked to drinking water (Kapaj et al. 2006). 6 Although no consensus has been reached about arsenic’s effect on reproductive health, epidemiological studies suggest that prolonged maternal exposure can cause elevated rates of neonatal and infant death (Hopenhayn-Rich et al. 2000). Arsenic can cross the placental barrier and adversely affect fetal development. Exposure to arsenic has been linked to higher rates of spontaneous abortion, stillbirth, and pre-term birth (Ahmad et al. 2001; Milton et al. 2005). However, we find no evidence that the campaign and subsequent reduction in arsenic exposure affected the probability of getting pregnant or of a pregnancy terminating in a miscarriage, abortion or stillbirth in our data. 7 Most scientists believe that the mechanism behind arsenic contamination of groundwater in Bangladesh is oxidation. Specifically, as the water table recedes—as it has during the past few decades in Bangladesh—atmospheric gases seep further below the surface. When sediment with arsenic deposits is exposed to oxygen, the two react, releasing the arsenic into the surrounding soil and water (Nahar 2009).

6
samples from 3534 tubewells across 61 of the 64 districts in Bangladesh (BGS and DPHE
2001).8 The survey found that water from 27% of the shallow tubewells (i.e. those that tap into
aquifers at depths of less than 150 meters) exceeded the Bangladesh standard for arsenic in
drinking water (>50 µg/L).9,10 The BGS report estimated that 35 million people were exposed to
dangerous levels of arsenic through their drinking water (BGS and DPHE 2001).
After the BGS confirmed the extent of the problem, the Department of Public Health
Engineering of Bangladesh (DPHE) initiated the Bangladesh Arsenic Mitigation Water Supply
Program (BAMWSP), a comprehensive screening of all shallow wells in contaminated regions,
in 1999 with the assistance of UNICEF and partly funded by the World Bank. The project was
carried out in the majority of villages in the more contaminated districts. Through the project,
55% of nearly 8.5 million wells around the country were tested for arsenic using field test kits.
While the project was not officially completed until 2006, the majority of the testing was done
by 2003. As part of the screening effort, tubewells were labeled to clearly indicate the amount of
arsenic in the water: if the arsenic content fell below the government threshold of 50 µg/L, the
walls of the tubewell were painted green. If not, the walls were painted red (UNICEF 2008). The
program also dug new wells (including deep wells) and increased access to arsenic-safe water for
2-2.5 million people (World Bank 2007).
In December 1999, UNICEF also launched the National Arsenic Communication
Strategy and Campaign by hiring a social marketing firm to design and implement ways to
disseminate information on the dangers of drinking arsenic-contaminated water. These messages
were spread by various kinds of workers, including teachers, religious leaders, and health care
workers. DPHE engineers conducting the arsenic tests were particularly effective at sharing basic
facts about arsenic to the tubewell users while running the half-hour long test. They dispelled
popular misconceptions, presented physical evidence of contamination and explained the color-
8 While this is only a small fraction of the millions of tubewells in the country, the BGS tested a geographically representative sample of wells, subject to a few practical considerations such as proximity to roads and the lack of a nationwide directory of wells. 9 46% of the wells exceeded the WHO guideline value of 10 µg/L. 10 Arsenic contamination levels in groundwater vary widely in Bangladesh. Researchers attribute this phenomenon to the fact that the concentration of arsenic is itself a function of many variables. Two are of particular relevance in Bangladesh—soil depth and sediment geology. Scientists have found that the highest levels of arsenic are concentrated (i) within medium depth soils, i.e., 10-150m below the surface (Kaufmann et. al. 2001), and (ii) where the surrounding sediment was derived from the Bengal Delta Plain during the Holocene Age (Mukherjee and Bhattacharya 2001). Groundwater drawn from depths greater than 150 meters usually contains less arsenic (Harvey et al. 2002). Only 1% of deep tubewells in the BGS sample had arsenic levels greater than 50 µg/L.

7
coding of the wells (UNICEF 2008).11
Overall, UNICEF’s information campaign, along with other similar efforts, raised
awareness about Bangladesh’s arsenic problem and villagers understood the need to stop using
arsenic-contaminated water (Jakariya 2007). In the late 1990s, less than ten percent of the
population knew that tubewell water could be contaminated by arsenic. According to a UNICEF
report in October 2008, this number had risen to eighty percent. Seventy percent of informed
households claimed that they were taking some sort of action to avoid consuming contaminated
water (UNICEF 2008).
It is likely the information campaign affected a number of water-related behaviors. The
color-coding was aimed at getting households to switch to clean wells, but the findings in Field,
Glennerster and Hussam (2011) suggest that many households increased their risk of diarrheal
diseases, possibly by switching to surface water. In addition, the greater distance from the
primary water source may have resulted in an increase in water storage time, when water often
becomes contaminated (Wright, Gundry and Conroy 2004), or a decrease in the amount of water
people drink (Prüss et al. 2002). All of these mechanisms are likely to have health effects.
2.B. Breastfeeding and arsenic exposure
The health benefits of breastfeeding have been well-documented in numerous studies and
are especially relevant in developing countries. There are biological benefits because breast milk
protects infants against infections in two ways: first, by inactivating pathogens, such as those
causing diarrhea, or preventing them from attaching to the gastrointestinal tract (Isaacs 2005,
Morrow et al. 2005). Second, mechanically, breastfed children are less likely to consume
contaminated food and water, which helps protect them in areas with poor sanitation (Habicht,
DaVanzo, and Butz 1988). This protective feature has been found both for exclusively breastfed
children (in which children are not fed anything besides breast milk, even plain water), and for
children who consume other foods as well (Prentice 1991). Multiple studies have found negative
correlations between breastfeeding and infant mortality (Betran et al. 2001, Chen, Yu and Li
1988, Briend, Wojtyniak and Rowland 1988). On the negative side, HIV can be transmitted
through breast milk. However, even HIV-positive mothers without access to antiretroviral drugs
11 The literature on the information campaign suggests that no particular demographic was targeted when warning the public about arsenic-contaminated water.

8
are encouraged to breastfeed for the first six months (World Health Organization 2010).
Breastfeeding is nearly universal in Bangladesh: in 1999, 97% of children under the age
of five had been breastfed (NIPORT 2001). However, despite several national breastfeeding
campaigns since 1989, exclusive breastfeeding rates remain low. Although UNICEF and the
WHO recommend that children be exclusively breastfed for the first six months of life,
supplementary feeding starts at a very early age in Bangladesh. The median duration of any
breastfeeding (i.e. exclusive and non-exclusive combined) was 30 months in 1999, but the
median duration of exclusive breastfeeding was only 1.8 months (NIPORT 2001) and stayed
roughly constant until 2007 (NIPORT 2009).12 Around half of infants under six months of age
are exclusively breastfed (NIPORT 2009). A large fraction of infants in this age group are fed
foods such as honey, sugar water, mustard oil, milk (cow, goat, powdered or condensed), rice,
wheat and barley gruels (Greiner 1997).
A study conducted in Bangladesh by Fängstrom et al. (2008) suggests that infants who
are exclusively breastfed are protected from the adverse effects of arsenic. The study finds a
positive and significant relationship between arsenic concentrations in a mother’s blood and her
breast milk. Yet, arsenic concentrations in breast milk were relatively low despite high maternal
exposure. Studies in arsenic-contaminated regions of other countries confirm these findings
(Concha et al. 1998, Samanta et al. 2007).
3. Empirical strategy
3.A. Identification strategy
Our identification strategy relies on geographic variation in arsenic levels and variation
over time in villagers’ knowledge about these levels. The campaign that tested wells and
disseminated information on arsenic contamination was nation-wide, but households near
contaminated wells would have been the most affected. Households whose own well tested
positive for arsenic would have to decide whether to continue using their contaminated well, find
a new, uncontaminated well or switch to surface water. Regardless of whether they chose a clean
water source, water safety would have been more salient to them after the campaign. Even
households whose own well tested negative may be concerned about water safety if, for example,
12 According to Haider, Kabir and Ashworth (1999), 99% of mothers reported hearing breastfeeding messages or receiving advice, and 97% claimed to understand the idea of exclusive breastfeeding. However, many women incorrectly believed that exclusive breastfeeding meant a child consumed water in addition to breast milk.
9
they do not trust the test or have updated their prior beliefs on the possibility of water dangers yet
to be discovered. Our hypothesis is that households in more contaminated areas would be most
likely to alter their breastfeeding behavior in response to the arsenic campaign.
We interact this geographic variation with over time variation in whether a child was
born before or after the information campaign in a difference in difference (DID) estimation
strategy, which accounts for many confounding stories. The strategy might be biased, however,
if there were confounding variables, such as land quality or wealth, correlated with arsenic
contamination and if these characteristics changed over time differentially in places with high
and low levels of arsenic contamination. The local variation created by the biogeochemical
sources of arsenic has been found to be uncorrelated with common observable characteristics at
the local level (Yu, Harvey and Harvey 2003),13 although it has been found to be correlated with
some village-level characteristics (Madajewicz et al. 2007).14 We include village fixed effects
and district-specific trends over time to deal with possible omitted variables.15
If there were village-specific trends correlated with arsenic contamination, that could still
cause a problem for our strategy. If less contaminated villages were richer (as Madajewicz et al.
2007 found in one subdistrict) and experiencing greater improvements in child health outcomes
than more contaminated villages, this would actually work against our findings. However, it is
not clear which way the bias would go with respect to breastfeeding trends. Similarly, while the
fixed effects and trends absorb any variation in breastfeeding preferences that is time-invariant or
linearly time-varying by district, our strategy would be vulnerable to a concurrent breastfeeding
promotion campaign correlated with arsenic exposure. We have found no evidence of any
campaign targeting contaminated areas. In fact, UNICEF reports that breastfeeding was not a 13 According to van Geen et al. (2003), the vast majority (88%) of contaminated wells are situated within 100 meters of an uncontaminated well. 14 Even local variation may be suspect if migration is frequent, and worse if it is due to the campaign. However, migration is not very common in Bangladesh. Ninety percent of the men and seventy-five percent of the women in the BDHS have lived in the same residence for more than 5 years and this did not change from 1999 to 2007. 15 Madajewicz et al. (2007) show that across 54 villages in Araihazar District in Bangladesh, households with uncontaminated wells are significantly richer than households with contaminated wells. This positive correlation between water quality and wealth disappears when village fixed effects are included and the authors suggest a geological relationship between arsenic levels and soil types as a possible explanation. However, Field, Glennerster and Hussam (2011) find the opposite correlation in their study district, Barisal District: arsenic contamination is higher in richer villages. We believe our cluster fixed effects and district-specific time trends should account for most omitted variable bias, but we also confirm that our results are robust to controlling for mother’s education and father’s education, and allowing these variables to have a different effect for each cohort. The results are also robust to a time trend interacted with dummies for each level of maternal and paternal schooling. A wealth index is only available for a subset of our data (2004 and 2007), but we confirm that the regressions we can run with this data are robust to including interactions with cohort dummies.

10
substantial part of their nutrition profile in Bangladesh over this period (UNICEF 2009). In
addition, the variation we use in arsenic contamination is sufficiently local that it would be
unusual for such campaigns to operate in one village but not in a nearby village.
Nevertheless, we respond to these concerns by looking for variation in the cost of
switching to a clean water source and implementing a triple difference strategy, further
exploiting the nonlinear geographic variation in where contaminated and uncontaminated wells
are located in each village. While all households for whom the campaign was salient are likely to
be more concerned about water quality, households that switched to a clean water source would
not need to modify their breastfeeding behavior in order to protect their children from water-
borne diseases. Certainly, they should modify their breastfeeding behavior less than households
unable to change their water source. Since whether a household switches water sources to a clean
well is endogenous, we exploit variation in the cost of switching: in particular, the distance to a
clean well. Despite the endogeneity concern, we first estimate a triple difference with whether
the household is not sourcing water from an uncontaminated well: these households are either
using a contaminated well or surface water.16 Note that breastfeeding would protect children both
from arsenic as well as from water-borne pathogens. Next, we estimate a triple difference with
whether the household is far from an uncontaminated well as the third difference.
Our measures of contamination and distance to clean wells, calculated from the BGS data
collected before the campaign began, are at the village-level. This alleviates some endogeneity
and reverse causality concerns about a household’s choice of water source, but likely introduces
measurement error. We discuss these issues below after describing the data. While we cannot
prove that the geographic variation we use is exogenous, the fact that this pre-existing nonlinear
pattern of distances to contaminated and uncontaminated wells predicts breastfeeding responses
supports our identification strategy.
3.B. Data
16 We are only able to use a subset of the data for this regression as only one BDHS round (2004) tested for arsenic. Note that we focus on a household’s current water source as it is not possible to construct an accurate measure of switching between water sources from the BDHS data. This is partly due to concerns about recall bias and misreporting. More importantly, the BDHS does not ask for previous water sources, making it impossible to know what sources households switched from. Finally, even if a household did not switch sources, living in a highly contaminated area might make concerns about water more salient after the campaign.
11
The household data are from the 1999, 2004 and 2007 Bangladesh Demographic and
Health Surveys. The BDHS is a nation-wide survey conducted by the National Institute of
Population Research and Training (NIPORT). In each year, a sample of approximately 10,000
households is chosen from about 360 villages (clusters). The survey is then administered to all
ever-married women, aged 10-49, and a subset of men in each household. In addition to standard
demographic information, the women’s questionnaire contains a module on all births in the past
five years, with questions on the child’s current health, how long the child was breastfed, and
foods provided to the child in the past 24 hours. Thus, the data includes observations for
approximately 20,000 children born each year between 1995 and 2007.17
The BDHS also includes a section on the source of the household’s drinking water and
water used for other purposes (dishwashing, hand washing, etc.). In 2004, this section included
questions on arsenic. The household’s drinking water was tested for arsenic, the well (if the
source was a well) was inspected and any markings (red or green) were noted. In addition, the
respondent was questioned about her knowledge of arsenic.
The BDHS also collected GPS data for the 360 clusters.18 One data challenge is that the
clusters are not the same across years. In our specifications, we either include cluster fixed
effects (where the clusters are survey-year specific) or we match the clusters from 1999 and 2007
to the closest 2004 cluster using the GPS coordinates.
3.B.1 Measures of arsenic contamination
Our main measures of arsenic contamination are from the British Geological Survey. In
1998 and 1999, the BGS tested the arsenic levels of 3,534 wells across the country.19 Using the
GPS coordinates of each well, we calculate various measures of arsenic contamination for each
BDHS cluster. Recall that the cluster’s GPS coordinates only approximate a household’s location
(in part because they are displaced, but also because they mark the closest enumeration area and
not the household’s actual location). Thus, the most straightforward measures, such as the
number and percent of wells within five miles of each cluster that are contaminated (greater than
or equal to 50 µg/L As) or the average contamination level of these wells, are not the best
17 Children born in 1994 were excluded because of a very small sample size. 18 GPS coordinates are displaced up to 2 km in urban areas and 5 km in rural areas, with 1% of rural locations displaced up to 10 km. 19 We drop around 300 children from the three districts that the BGS did not survey.

12
measures. Specifically, these measures do not take into account the geographic distribution of
contaminated wells around the cluster. For example, if all the contaminated wells are clustered in
a small part of the cluster’s catchment area, the fraction of households exposed to contaminated
wells would differ than if the contaminated wells were spread out. Therefore, we calculate the
probability of being within one mile of a sampled contaminated well, conditional on being within
five miles of the cluster. Our preferred measure is weighted by the inverse of the distance from
the cluster, assuming that a household has a higher probability of being closer to the center of the
five-mile radius. For expositional ease, we will refer to this measure as follows: a value of 0.07
(the mean) will be called a cluster with 7% contamination. This measure is highly correlated with
the simpler measures listed above.
There are advantages and disadvantages to using this village-level variable. A household-
level variable would provide more precision, but might be endogenous. For example, the 2004
BDHS tested each household’s water for arsenic but using that as a measure of contamination is
problematic since it is based on the water source the household chose after the information
campaign, which would likely be correlated with many omitted variables. Ideally, we would
want the contamination level of the well the household used before the discovery of arsenic, or
the well closest to the household’s exact location before the campaign, but neither is available in
any BDHS round. Our village-level measure is as close as we can get to the latter. One strength
of our measure is that the BGS ended the same year the BAMSWP began, which avoids reverse
causality concerns about new wells being built in contaminated areas.
Unfortunately, the BGS only tested a small fraction of the wells in the country. Figure 1
indicates that the geographic coverage of this sample is quite respectable and we note that more
than 90% of the children in our sample have at least three tested wells within five miles of their
cluster and 74% have five or more tested wells. In addition, our results are robust to dropping
those clusters with very few nearby wells. Nevertheless, it is possible that our use of village-level
measures introduces measurement error. Classical measurement error would simply suggest that
our results are biased towards zero, but it is important to verify that our preferred measures of
contamination and distance to clean wells are picking up something real. Table 1 presents
estimates from regressions of the household-level data on arsenic contamination (from the 2004
survey) on the village-level measures of arsenic exposure (our preferred measure is shown in the
final row). For each combination of measures, the correlation is positive and strongly significant

13
(at 1%). The first column shows that households in more contaminated areas are more likely to
have heard of arsenic, regardless of which measure we use, providing support for our assumption
that these are the villages where the campaign was most salient. Columns (2) to (5) use variables
that depend on the household’s choice of water source, which is likely to introduce bias, but it is
reassuring that the village-level measures of contamination predict whether households are still
using contaminated water sources in 2004.
We can provide similar support for our measures of access to clean wells. Given the
difficulty in predicting who switches to a clean well, we calculate a few different measures. Our
first measure parallels our measure of contamination: the probability of being within 1 mile of an
uncontaminated well, conditional on being within 5 miles of the cluster. Our second measure is
the average distance from the closest uncontaminated well, conditional on being within five
miles of the cluster.20 We also weight these measures by the inverse of the distance from the
cluster. Figure 3 plots a kernel-weighted local polynomial of the relationship between our
preferred measures of access to clean wells and whether the household drinks contaminated
water or surface water (i.e. is not using an arsenic-free well) from the 2004 survey. As expected,
the more households are close to clean wells, the fewer drink unclean water. Figure 4 plots this
relationship, separately for clusters with higher than median contamination and lower than
median contamination, and for households who have heard of arsenic and households who have
not. The negative relationship between access to clean wells and drinking contaminated water is
driven by households who have heard of arsenic in more contaminated regions, supporting our
view that this relationship is related to the information campaign.
3.B.2 Summary statistics
Table 2 presents the means of various demographic, outcome and contamination
measures separately for areas with lower and higher than median arsenic exposure. Data from
1999, prior to the information campaign, are presented in Columns (1) and (2). Column (3)
20 Since both our measures of arsenic exposure and access to clean wells are derived from BGS wells and matched by cluster to the BDHS, one might ask whether access to clean wells is simply the negative of exposure to contaminated wells. This is not the case. While the two measures are negatively correlated, variation in contamination explains a tiny fraction of the variation in access to clean water. The R-squared ranges from 0.0014 to 0.0604 depending on the measure used. We are exploiting the nonlinear geographic variation in the location of clean and contaminated wells within a cluster, as can be seen in Figure 2 which depicts two clusters with the same level of contamination (the same number and placement of sampled contaminated wells) but different levels of access to clean wells (in this case, the same number but different placement of sampled uncontaminated wells).

14
presents the differences between contaminated and uncontaminated areas, conditional on district
fixed effects, and indicates whether these differences are significant when standard errors are
clustered by BDHS cluster.21 There is only one statistical difference among the control variables
and the outcomes (in weight-for-height z-score); multiple comparisons logic suggests this is not
surprising since we are comparing 25 different variables. As expected, arsenic exposure is
significantly different in the two sets of clusters.22
Columns (4) to (6) repeat this exercise for the 2007 survey. Note that all these children
were born after the information campaign. The main result of our paper can be observed in this
table by computing the simple DID estimate for the months breastfed outcome. The average
number of months a child was breastfed in uncontaminated areas increased by 0.64 months from
1999 to 2007. In contaminated areas, the number of months a child was breastfed increased by
1.21 months, more than half a month more. In our empirical work, we bolster this result by
exploiting more variation in time and arsenic exposure and including various control variables.
3.C. Empirical model
To see how mothers’ respond to the new information about the quality and safety of their
drinking water, we run the following regression:
∙ (1)
where is a measure of how long child i living in cluster j district k, born in year t and
surveyed in year s was breastfed, is a measure of arsenic exposure for cluster j and is a
dummy variable for being born in 2002 or later.23 We include fixed effects for BDHS cluster
( )24 and birth year ( ), as well as district-specific trends ( ). The set of control variables,
21We are unable to include cluster fixed effects (which we do in our regressions) since our arsenic measures are at the cluster level. All standard errors presented in this paper are clustered by BDHS cluster. The results do not change when we cluster by district. 22 We present unweighted OLS regressions in this paper, although we confirm that our regression results are robust to using the sample weights. When we use the weights to compare summary statistics, one of the 10 breastfeeding outcome variables is significant at the 10% level, as one would expect given the multiple comparisons. 23 Although the mitigation program was in place from 1999 to 2006, its completion report indicates that progress was very slow for the first 2.5 years (World Bank 2007). The report also states “With acquired knowledge, unsafe wells painted, and availability of arsenic-safe water sources, most people in project areas use arsenic-safe sources for drinking. All achieved during 2002/2003.” Thus, we define the post period from 2002. 24 Because of the BDHS’ design, this regression will be estimated primarily off the 2004 clusters, since only those clusters have children born before and after 2002. (The 1999 sample includes children born between 1995 and 2000, and the 2007 sample includes children born between 2002 and 2007.) Our results are robust to using just the data from 2004. However, we continue to include the 1999 and 2007 samples because we need variation in treatment

15
, includes the current age of the child (we assign the age at death for children who died)
and a dummy variable for whether the child died, depending on the choice of dependent
variable.25 Our preferred measure of breastfeeding is the number of months a child is breastfed
but this dependent variable imposes a functional form assumption that the effect of the campaign
be linear and is right censored for children who died and children who are still breastfeeding. We
address these issues by considering two other dependent variables as well: whether a child was
breastfed for at least 12 months and whether a child is currently exclusively breastfeeding.26
Finally, we discuss various checks to deal with the right censoring in Section 4A.
The identifying assumption for this DID regression is that trends in breastfeeding
behavior were not correlated with arsenic exposure, conditional on BDHS cluster, other than
because of the information campaign. The district-specific trends strengthen the validity of this
assumption: our estimates are identified off deviations from pre-existing district trends.
Nevertheless, it is possible that breastfeeding behavior was trending differently in areas with
greater arsenic exposure for other reasons. As usual, we are unable to provide definitive evidence
for the parallel trend assumption, but we can estimate an ‘event study’ specification where we
interact arsenic exposure with dummy variables for each birth year. Specifically, we estimate:
∑ ∙ (2)
where for ∈ 1996,2007 are indicator variables for birth year and everything else is as
defined in equation (1). With this specification, we can test whether areas with more or less
arsenic exposure were experiencing differential trends in breastfeeding duration by examining
the coefficients, , for children born before the information campaign.
We also strengthen the validity of the exclusion restriction by focusing on those who
should be most responsive, that is, households that continue to use arsenic contaminated wells
and those who drink surface water. These households should choose to breastfeed longer to
protect their children from arsenic and water-borne diseases, while those who have already
switched to a clean water source (a well not contaminated with arsenic) do not need to. We
estimate this with the following specification:
status when we split the sample by age (all 4-year-olds in 2004 will be ‘untreated’ regardless of cluster). In those regressions, we include fixed effects for the closest 2004 cluster and for survey year. 25 While whether a child has died is endogenous, excluding children who died results in an endogenously-selected sample. We only include it for one breastfeeding measure. 26 The natural log of months breastfed gives us similar results (results not reported).

16
∙ ∙ ∙
(3)
where is an indicator variable for whether the water tested in the household contained
arsenic or was surface water. Recall that only the 2004 survey has this data. According to our
hypothesis, the coefficient should be zero and the coefficient should be positive.
As noted above, whether or not a household switches to a clean well may be correlated
with other household characteristics, potentially biasing our results. To deal with this, we re-
estimate specification (3) using predictors of whether the household is using clean well water as
the third difference, namely measures of the distance to an uncontaminated well.27
4. Response to information regarding arsenic exposure
4.A. Breastfeeding duration
Table 3 presents results from specification (1), estimating the number of additional
months mothers breastfeed children born after the information campaign. The dependent variable
we use in Panel A is the number of months the child is breastfed. The coefficient on the
interaction term is positive and strongly significant for all children (Column 1); moving from an
area with 0% contamination to 10% contamination (from the 25th to the 75th percentile in the
distribution, also equivalent to one standard deviation) would lead a mother to breastfeed an
additional 0.6 months.28 From 1997 to 2007, the average number of months breastfed only
increased by 0.6 months in less contaminated areas and 1.2 months in more contaminated areas,
so the campaign can explain much of this difference. Column (4) includes district-specific
trends, relying on less stringent identifying assumptions, and this hardly changes the estimate.
We next divide the sample into urban households (Columns 2 and 5) and rural
households (Columns 3 and 6). The result is driven by rural areas (although the coefficients are
usually not statistically distinguishable). In Appendix Table A2, we further divide the sample
into households with and without access to piped water. Since whether a household has piped
water is endogenous, we divide the sample by whether or not the village has access to piped
27 While it may seem like we should use these geographic measures as instruments for drinking unclean water in equation (3), we proceed with the reduced form regressions instead because the instruments are not available at a disaggregated level. The endogenous variable (drinking from unclean sources) varies at the household level, while the instrument varies at the cluster level. 28 In Appendix Table A1, we test the robustness of this result to different measures of arsenic exposure and find supportive results.

17
water. These estimates indicate that the results are driven by households in rural areas, without
access to piped water. Thus, we focus on rural areas for the remainder of the paper.
It is worth noting that our dependent variable is right-censored by children who are still
being breastfed and children who died while still being breastfed. For months breastfed, we
simply assign these children their current age or age at death. In Table 3, Panel B, we consider a
different outcome variable that suffers less from this problem: whether or not a child breastfed
for at least 12 months conditional on having lived at least 12 months. While the coefficient on
the interaction term is not significant for the entire sample, it is positive and significant for rural
children when we include district-specific linear trends (Column 6).29 Appendix Table A3 shows
that the result is not sensitive to the choice of breastfeeding duration; in fact, the coefficient gets
substantially larger as we increase the duration. Moving from the 25th to the 75th percentile in the
arsenic distribution increases the probability a child is breastfed for at least 12 months by an
additional 1.1 percentage points and the probability a child is breastfed for at least 36 months by
an additional 4.5 percentage points, or 12.6% evaluated at the mean.
In Table 3, Panel C, we consider a third dependent variable: whether or not the child is
exclusively breastfed.30 The BDHS does not ask whether children are exclusively breastfed
explicitly, but it does ask for the types of foods and liquids given to the child. We define a child
as exclusively breastfed if they are currently breastfeeding and have not received any liquids,
even plain water, in the past 24 hours. Note that this is quite restrictive: Out of the 10,000
children still breastfeeding in our sample, less than 12% are exclusively breastfed.31 Fifty percent
of children younger than 6 months were exclusively breastfed, but only 5% of children aged 6 –
14 months are exclusively breastfed. We see the same behavior change with this outcome
variable: children born in contaminated areas after the information campaign are more likely to
29 Recall that when focusing on a particular age, there is no variation in the 2004 sample and we include fixed effects for the nearest 2004 cluster instead of survey-year specific BDHS cluster fixed effects. Months breastfed is our preferred measure for this reason, as well as because it exploits more of the variation in breastfeeding duration. 30 This dependent variable also addresses the censoring issue, except that here only living children are included. In Appendix Table A4, we test whether the results are robust to different assumptions regarding the censored dependent variable. We estimate the regression just using children who are no longer breastfeeding, or assigning children who are still breastfeeding the max in the data (59 months). We then assign children who have died the max in the data or the age they would have been had they not died. The results are robust to these alternate assumptions. 31 Among children in rural areas who are not exclusively breastfeeding, 96% have had plain water in the last 24 hours, 5% have had baby formula, 9% have had sugar water, 30% have had cow’s or goat’s milk, and 10% have had other liquids. Among children in rural areas who are not breastfeeding at all, 85% have had plain water in the past 24 hours, 5% have had baby formula, 8% have had sugar water, 27% have had cow’s or goat’s milk, and 10% have had other liquids (BDHS data, authors’ tabulations).

18
be consuming only breast milk. Moving from the 25th to the 75th percentile in the distribution of
arsenic contamination would increase the probability of being exclusively breastfed by an
additional 2.84 percentage points, a 24% increase when evaluated at the mean (Column 6).
Given the variation in exclusive breastfeeding by age, we next look for heterogeneous
effects by age in Table 4. Since we are dividing the sample by age, we include fixed effects for
the nearest 2004 cluster. The dependent variable in Panel A is whether or not the child is still
being exclusively breastfed and the sample is divided up by age range: younger than 6 months, 6
to 1432 months and older than 12 months. The effect on exclusive breastfeeding is strongest for
younger children, exactly where we would expect the most variation in this variable. A one
standard deviation increase in arsenic exposure increases the probability a child is exclusively
breastfed by an additional 8.5 percentage points for children younger than six months and 3.6
percentage points for children between six and 14 months. The effect is substantially smaller and
not statistically significant for children older than 12 months.
Even if a mother is not exclusively breastfeeding, she may choose to give her children
milk or other non-water based liquids in response to the information campaign. We also note that
most of the variation behind exclusive breastfeeding is whether a child is given water to drink. In
Panel B of Table 4, we use whether a child consumed plain water in the past 24 hours as the
dependent variable. Here the effect is striking: A 10% increase in contamination leads to a 12
percentage point decline in whether a child under six months of age is given water, a 30%
decline, and a 7.3 percentage point decline in whether a child between six and 14 months is
given water. The effect is not statistically significant for older children, which is as expected
since these children are not likely to be getting enough hydration through other sources.
As described in section 3.C, we can provide support for the exclusion restriction with an
event study. Figure 5 plots the coefficients on the interaction between birth year and arsenic
exposure for each cohort, where ∈ 1996,2007 , after estimating specification (2) with
months breastfed as the dependent variable. The coefficients for the cohorts born before the
information campaign are small and not statistically significant.33 Starting in 2002, however, the
coefficients are positive and more or less increasing. By 2005, they are positive and statistically
32 We are unable to use 12 or 13 months because the variance matrix is highly singular. The coefficients are of similar magnitudes, but we could not calculate standard errors. 33 The coefficient on 1996 interacted with arsenic exposure is statistically significant and negative, but does not seem to indicate a trend since 1997 is back to 1995 levels.

19
significant. To provide a more formal test, we test and strongly reject the hypothesis that the
average of the coefficients from 1996-2001 is equal to the average of the coefficients from 2002-
2007. The F-statistic of this hypothesis test is 8.9 while the p-value is 0.003.
4.B. Variation in the cost of switching to a clean well
To strengthen the validity of the exclusion restriction, we estimate a triple difference
(specification 3) using variation in the ease of switching to a clean well. Households that live
very close to an uncontaminated well should find it very easy to switch water sources and
therefore would not need to modify their breastfeeding choices. Table 5 presents the two
coefficients of interest. In Column (1), we estimate the effect of the information campaign
separately for those who are using clean well water and those who are either using arsenic
contaminated wells or surface water. We find no evidence that those who are drinking clean well
water alter their breastfeeding duration after the information campaign (top row), but the triple
difference suggests that that the response differs significantly (at 1%), and is positive, for those
who did not switch to clean wells, supporting our hypothesis.
In Columns (2) to (5), we address the endogeneity of water source by replacing the triple
difference measure with proxies for the cost of switching to a clean well. In Column (2), we use
the probability of living within one mile of an uncontaminated well, conditional on living within
five miles of the cluster. The coefficient on the two-way interaction is the effect for households
with no nearby clean wells. As expected, women in these households breastfeed longer. The
triple interaction is also significant and negative, as predicted: as more households are within one
mile of a clean well, the breastfeeding response falls. At the mean value of prevalence of clean
wells, 0.15, the effect is still positive and significant, but the effect is not significantly different
from zero for clusters where the probability of being within one mile of a clean well is 20% or
more. Column (3) uses the weighted version of this variable. The main effect for those with no
nearby clean wells is positive and significant and the triple interaction is not significant, but it is
negative and non-trivial in magnitude: the effect of the information campaign is no longer
significant for households in clusters where the probability of being within one mile of a clean
well is more than 25%.
Column (4) uses a different variable to capture the difficulty of switching to a clean well:
the average distance to the closest uncontaminated well. Again, the signs of the coefficients are
20
as expected. Clusters where the average household is zero miles from an uncontaminated well do
not alter their breastfeeding behavior (the two-way interaction is not statistically significant), but
as the average household gets farther away from an uncontaminated well (the triple-interaction),
mothers breastfeed for longer. When we use the weighted measure (Column 5), neither
coefficient is statistically significant, but the effect of the information campaign for a cluster
where the average household is 2 or more miles away from an uncontaminated well is positive
and statistically significant.34
These triple difference results strengthen our causal argument. In Table 3, the identifying
assumption was that no omitted determinants of breastfeeding trends are correlated with arsenic
exposure, conditional on the controls. While the district-specific trends take out some secular
trends, one could still argue that places with more arsenic exposure could be trending differently
from places with less arsenic exposure, and these trends could be changing differently over time,
which would cause omitted variable bias. As described above, including birth year dummies
interacted with maternal education, paternal education and a wealth index does not alter our
results. In addition, Table 5 provides additional convincing evidence, because to bias our results,
these omitted variables would have to affect just households with little access to clean wells.
5. Health effects
We next turn to the consequences of the information campaign and breastfeeding
response for infant health. Table 6 presents estimates of specification (1) with health outcomes as
dependent variables. As in Table 4, we include fixed effects for the nearest 2004 cluster. In Panel
A, the dependent variable is a dummy variable for whether the child died before the age of 6, 12,
24, 36 or 48 months in Columns (1) to (5), respectively. The information campaign has a
negative and strongly statistically significant effect on child deaths before the age of 6 months
and a marginally significant effect on deaths before the age of 12 months. The magnitude of the
effect is not trivial: A one standard deviation increase in contamination would mean that the
34 The results are similar when we use breastfed for longer than 12 months as the dependent variable, in fact the triple interaction in Column (5) is also significant (results available upon request). While the triple interactions are not always significant when we use exclusive breastfeeding, the signs of the coefficients are the same. The effect of the campaign is no longer positive and significant for clusters where the probability of being within one mile of a clean well is 22-27%. When we use the average distance to the closest uncontaminated well to measure clean water access, we find that the effect of the campaign is only positive and significant for clusters where the average household is more than 1.455-1.58 miles from a clean well.
21
probability of an infant dying would fall by 1.1 percentage points more than it would have
otherwise. The point estimates for older ages are also negative but not statistically significant.
Note that we cannot identify the mechanism behind this health effect. It could be the
effect of increased breastfeeding. In fact, the impact on child survival for the youngest children
fits well with the impact on exclusive breastfeeding and consumption of water. Recall that 50%
of children younger than 6 months are exclusively breastfed and only 2% of children older than
12 months are exclusively breastfed. If infants are more likely to be exclusively breastfed and not
given water, they are less likely to suffer from water-borne diseases that can be especially fatal
for infants. For this reason, we believe our results complement, not contradict, the findings in
Field, Glennerster and Hussam (2011). Their results are strongest for older children, while our
results are strongest for the youngest children, the ones most likely to be exclusively breastfed
and for whom breast milk is a good substitute for water.
However, it could also be that the information campaign improved child survival rates by
reducing exposure to arsenic. We argue that reducing arsenic exposure should have affected
older children as well, but we concede that our health results are likely to be the combined
effects of all changes in health behaviors, including reduced exposure to arsenic-contaminated
drinking water and increased breastfeeding. We also note that one reason these health effects are
concentrated among the youngest children could be that parents have much less control over
what older children drink than what infants drink, regardless of whether the infant is breastfed.
We also find corroborating evidence in the impact on other health outcomes. In Panel B,
we divide the sample by age range (0-12, 12-24, 24-36 and 36-48 months) and examine the
effect of the information campaign on changes in the incidence of diarrhea. There is a strongly
statistically significant reduction in diarrhea incidence among children in their first year of life,
but no significant effect in future years. Again, exclusive breastfeeding is likely to protect
children from diarrheal diseases. We also find that weight for height is greater for children
younger than 12 months (and marginally for children aged 12-24 months). Finally, we find no
effect on height for any age group.
6. Discussion and alternative mechanisms
Our principal finding is that mothers improve their breastfeeding practices in arsenic
contaminated areas after a nation-wide water-safety information campaign and that this change is

22
greater when households have less access to clean wells. Our interpretation is that this is a
conscious choice to breastfeed more in order to protect children from contaminated water (either
water contaminated with arsenic or with pathogens), but there are at least three alternate
explanations. First, it could be a positive productivity shock due to reduced arsenic exposure:
drinking clean water may improve a mother’s health, thereby increasing her ability to breastfeed
or her efficiency at other tasks. Second, the change in water source may affect the time required
to fetch water, affecting how a woman chooses to allocate her time. Finally, there may be other
reasons women choose to breastfeed longer besides child health, such as greater birth spacing.
6.A. Productivity shock due to reduced arsenic exposure
It is possible that the campaign improved mothers’ health due to reduced arsenic
exposure. On one hand, this productivity shock would improve their ability to breastfeed and
their efficiency in other work. On the other hand, the productivity shock would affect the relative
prices of these two activities, but the change is ambiguous. It is not obvious where women will
expend this increased productivity. If the two effects impact breastfeeding in the same direction,
we would expect women closer to clean wells, who are more likely to experience the health
improvement, to exhibit a bigger increase in breastfeeding. Our results prove otherwise.35,36
It could be, however, that the change in the relative prices favors other activities, such as
household tasks or market work. If the productivity shock and the change in relative prices have
opposite effects on breastfeeding, one could argue that something else, such as a secular trend in
breastfeeding, could explain our findings. This alternative explanation is unlikely.37 First, the
more serious adverse health consequences of arsenic poisoning are long-term effects and, to the
best of our knowledge, there is no evidence of a biological link to improved milk supply. It is
35 Only women who switched from contaminated wells to clean wells would experience this health improvement. Women who continued to use contaminated wells or were not initially using contaminated wells would not experience any change in arsenic exposure. Given how much local variation there is in contamination, we assume that the share of women in the first group is higher closer to clean wells. If this assumption is not true, we would still expect no evidence of increased breastfeeding for mothers close to clean wells (which we confirm), but it would not rule out the health channel. 36 While researchers believe that arsenic exposure has little impact on morbidity or mortality among young children, another possible mechanism is that reduced arsenic exposure (either prenatal or postpartum) may improve a child’s ability to breastfeed. Our triple difference results preclude this possibility in a similar manner: children more likely to switch to a clean well will experience a greater health gain. 37 This alternate explanation is testable with time use data, which unfortunately the BDHS does not have. We do have data on labor force participation, but only 18.7% of the children have mothers who work, and only 16% of those who work do so seasonally otherwise we could have used this variation in the value of the women’s time to distinguish among these explanations (BDHS data, authors’ tabulations).

23
possible that short-run symptoms such as weakness and respiratory problems may affect
breastfeeding or other activities, but these effects are likely to be small. Second, while
economists often expect individuals to substitute towards market work at the expense of home
production, few women in Bangladesh work outside the house. Here the decision is likely to be
between child care and other types of home production, such as cooking and cleaning. While we
know little about time allocation decisions in this context, it seems unlikely that women would
forego breastfeeding in order to spend more time on other household production, especially
given the lack of affordable and high-quality substitutes for breast milk.38
6.B. Time to fetch water
A second alternative explanation relates to the fact that households may now fetch water
from a more distance source. Since most water gatherers in Bangladesh are female (Crow and
Sultana 2002), this could affect a woman’s breastfeeding choices. This increase in the time cost
of getting water reduces the time available to breastfeed, but it also increases the mother’s
comparative advantage in breastfeeding, leading her to breastfeed more. Thus, one explanation
for our results is that women substitute away from getting water and towards breastfeeding not
because of arsenic contamination, but because water is more expensive in terms of time. This
explanation seems unlikely because the increased time cost was fairly small: multiple studies
have documented an increase of about 4-18 minutes per day (Madajewicz et al. 2007, Sultana
2006, Ahmad et al 2003, Bangladesh Bureau of Statistics and UNICEF 2007).
6.C. Motives for breastfeeding
In addition to child health benefits, breastfeeding also has a contraceptive effect. Women
may choose to breastfeed longer to lengthen the time between subsequent children (birth
spacing) after the campaign. This could be because of more salient concerns about child health or
because of lower desired fertility if the cost of feeding and monitoring children rises.
Jayachandran and Kuziemko (2011) show that breastfeeding patterns in India respond to this
38 The literature on this question is thin, but one study using the American Time Use Survey shows that better health is associated with only certain types of household production (Podor and Halliday 2012). In particular, they find no significant effect of health on childcare for one’s own children, housework or food preparation, although people spend more time on lawn and garden care, consumer goods purchases, grocery shopping, travel, and caring for non-household children at the expense of leisure.
24
contraceptive effect and reflect fertility preferences.39 We find no evidence that the campaign
affected the desired total number of children, actual birth spacing or desired birth spacing
(measured by whether women respond that they want another child, but only after 2 years).
In conclusion, our results suggest that the breastfeeding response we document is
evidence of behavior change. We posit that women are choosing to breastfeed more to protect
their children from arsenic and water-borne pathogens, but this is speculative. Mothers are not
likely to know that arsenic is not fully transmitted in breast milk. However, as a consequence of
past breastfeeding promotions, they may naturally assume that their own breast milk is safe, even
if they drink contaminated water. The fact that they are less likely to give their youngest children
water and that these children’s health improved helps support this hypothesis, but we cannot rule
out other explanations such as changes in the value of the women’s time.
7. Conclusion
Despite some studies that show promise, the literature on whether information campaigns
elicit health behavior change has found disappointing results. Water safety, particularly for
children, is one area where relatively easy precautions can dramatically reduce the burden of
disease in the developing world, and yet persuading households to treat their drinking water
remains a challenge. In this context, the arsenic awareness campaign in Bangladesh poses a
puzzle: many papers, including this one, have found that this campaign had tremendous success
in motivating behavior change (even including some changes with adverse consequences). It is
not clear whether this is because of a particular aspect of the campaign, such as the massive size,
or because of some feature of arsenic poisoning, such as the characteristic skin rashes or
connotations of arsenic poisoning. We leave this important question to future work.
In this paper, we provided evidence of a simple change that mothers in Bangladesh made
in response to new information about the dangers in drinking water: they breastfed their children
longer. We also found that they were more likely to exclusively breastfeed infants and that this
may have had some beneficial health effects: infants had lower mortality rates and lower diarrhea
incidence. Our results are strongest for mothers who have less access to uncontaminated wells,
39 Jayachandran and Kuziemko (2011) find that mothers breastfeed their sons longer than their daughters, providing another explanation for gender gaps in child health. We find larger effects of the arsenic information campaign on breastfeeding for boys, but the difference is not statistically significant.

25
supporting our view that this behavior change is not a biological response due to improved
maternal or child health but instead, a conscious response to concerns about water quality.

26
References
Ahmad, Junaid, B.N. Goldar, Smita Misra, and M. Jakariya. 2003. “Willingness to pay for arsenic-free, safe drinking water in Bangladesh.” Dhaka: World Bank Water and Sanitation Program-South Asia. http://www.wsp.org/sites/wsp.org/files/publications/WSP_Pay_Arsenic_free.pdf (accessed August 1, 2013).
Ahmad, S. Akhtar, M. H. Salim Ullah Sayed, Shampa Barua, Manzurul Haque Khan, M. H. Faruquee, Abdul Jalil, S. Abdul Hadi, and Humayun Kabir Talukder. 2001. “Arsenic in drinking water and pregnancy outcomes.” Environmental Health Perspectives, 109 (6): 629-631.
Ahuja, Amrita, Michael Kremer and Alix Peterson Zwane. 2010. “Providing Safe Water: Evidence from Randomized Evaluations.” Annual Review of Resource Economics, 2: 237-256.
Atkins, Peter, Manzurul Hassan, and Christine Dunn. 2007. “Poisons, Pragmatic Governance and Deliberative Democracy: The Arsenic Crisis in Bangladesh.” Geoforum, 38 (1): 155-170.
Bangladesh Bureau of Statistics and UNICEF. 2007. “Monitoring the situation of children and women. Multiple Indicator Cluster Survey.” Dhaka: Bangladesh Bureau of Statistics. http://www.childinfo.org/mics3_surveys.html (accessed February 26, 2013).
Bennaer, Lori, Alessandro Tarozzi, Alexander Pfaff, Soumya Balasubramanya, Kazi Matin Ahmed and Alexander van Geen. 2013. “Impact of a randomized controlled trial in arsenic risk communication on household water-source choices in Bangladesh.” Journal of Environmental Economics and Management, 65 (2): 225-240.
Betran, Ana, Mercedes de Onis, Jeremy Lauer, and José Villar. 2001. “Ecological Study of Effect of Breast feeding on Infant Mortality in Latin America.” British Medical Journal, 323 (303): 1-5.
Briend, André, Bogdan Wojtyniak, and Michael Rowland. 1988. “Breastfeeding, Nutritional State, and Child Survival in Rural Bangladesh.” British Medical Journal, 296 (6626): 879-882.
British Geological Survey and Department of Public Health Engineering (BGS and DPHE). 2001. “Arsenic contamination of groundwater in Bangladesh.” Edited by D.G. Kinniburgh and P.L. Smedley. Keyworth, U.K.: British Geological Survey. http://www.bgs.ac.uk/arsenic/bangladesh/ (accessed August 1, 2013).
Caldwell, Bruce, John Caldwell, S.N. Mitra and Wayne Smith. 2003. “Tubewells and Arsenic in Bangladesh: Challenging a Public Health Success Story.” International Journal of Population Geography, 9: 23-38.
Carson, Richard, Phoebe Koundouri, and Céline Nauges. 2011. “Arsenic mitigation in Bangladesh: A household labor market approach.” American Journal of Agricultural Economics, 93 (2): 407-414.
Chen, Yue, Shunzhang Yu, and Wan-xian Li. 1988. “Artificial Feeding and Hospitalization in the First 18 Months of Life.” Pediatrics, 81 (1): 58-62.
Concha Gabriela, Gerardo Vogler, Barbro Nermell and Marie Vahter. 1998. “Low-level arsenic excretion in breast milk of native Andean women exposed to high levels of arsenic in the drinking water.” International Archives of Occupational and Environmental Health, 71 (1): 42–46.
27
Crow, Ben and Farhana Sultana. 2002. “Gender, Class and Access to Water: Three Cases in a Poor and Crowded Delta.” Society and Natural Resources, 15 (8): 709-724.
Davis, Kevin, Matthew Farrelly, Peter Messeri, and Jennifer Duke. 2009. “The Impact of National Smoking Prevention Campaigns on Tobacco-Related Beliefs, Intentions to Smoke and Smoking Initiation: Results from a Longitudinal Survey of Youth in the United States.” International Journal of Environmental Research and Public Health, 6 (2): 722–40.
Downs, Julie, George Loewenstein, and Jessica Wisdom. 2009. “Strategies for Promoting Healthier Food Choices.” American Economic Review, 99 (2): 159–64.
Dupas, Pascaline. 2011. “Do Teenagers Respond to HIV Risk Information? Evidence from a Field Experiment in Kenya.” American Economic Journal: Applied Economics, 3 (1): 1–34.
Fängstrom Britta, Sophie Moore, Barbro Nermell, Linda Kuenstl, Walter Goessler, Margaretha Grandér, Iqbal Kabir, Brita Palm, Shams El Arifeen, and Marie Vahter. 2008. “Breast-feeding protects against arsenic exposure in Bangladeshi infants.” Environmental Health Perspectives, 116 (7): 963–969.
Field, Erica, Rachel Glennerster and Reshmann Hussam. 2011. “Throwing the Baby out with the Drinking Water: Unintended Consequences of Arsenic Mitigation Efforts in Bangladesh.” http://scholar.harvard.edu/files/field/files/arsenic_infantmortality_feb10.pdf
Gallant, Melanie, and Eleanor Maticka-Tyndale. 2004. “School-Based HIV Prevention Programmes for African Youth.” Social Science and Medicine, 58 (7): 1337–51.
Greiner, Ted. 1997. “Breastfeeding in Bangladesh: a review of the literature.” Bangladesh J Nutr, 10 (1&2): 37-50.
Habicht, Jean-Pierre, Julie DaVanzo, and William Butz. 1988. “Mother's Milk and Sewage: Their Interactive Effects of Infant Mortality.” Pediatrics, 81 (3): 456-461.
Haider, Rukhsana, I. Kabir, and A. Ashworth. 1999. “News from the region. Are breastfeeding promotion messages influencing mothers in Bangladesh? Results from an urban survey in Dhaka, Bangladesh.” Journal of tropical pediatrics, 45 (5): 315-318.
Harvey, Charles, Christopher Swartz, A.B.M. Badruzzaman, Nicole Keon-Blute, Winston Yu, M. Ashraf Ali, and Jenny Jay et al. 2002. Arsenic mobility and groundwater extraction in Bangladesh. Science, 298 (5598): 1602-1606.
Hayes, Richard, John Changalucha, David Ross, Awena Gavyole, Jim Todd, Angela I. Obasi, Mary Plummer, Daniel Wright, David Mabey, and Heiner Grosskurth. 2005. “The MEMA kwa Vijana Project: Design of a Community Randomised Trial of an Innovative Adolescent Sexual Health Intervention in Rural Tanzania.” Contemporary Clinical Trials, 26 (4): 430–42.
Hopenhayn-Rich, Claudia, Steven Browning, Irva Hertz-Picciotto, Catterina Ferreccio, Cecilia Peralta and Herman Gibb. 2000. “Chronic arsenic exposure and risk of infant mortality in two areas of Chile.” Environmental Health Perspectives, 108 (7): 667-673.
Isaacs, Charles. 2005. “Human Milk Inactivates Pathogens Individually, Additively, and Synergistically.” Journal of Nutrition, 40 (1): 1286-1288.
Jakariya, Md. “Arsenic in tubewell water of Bangladesh and approaches for sustainable mitigation.” Ph. D. diss., KTH, 2007.
kth.diva-portal.org/smash/get/diva2:11999/FULLTEXT01 Jalan, Jyotsna and E. Somanathan. 2008. “The Importance of Being Informed: Experimental
Evidence on Demand for Environmental Quality.” Journal of Development Economics, 87 (1): 14–28.
28
Jayachandran, Seema and Ilyana Kuziemko. 2011. "Why Do Mothers Breastfeed Girls Less than Boys? Evidence and Implications for Child Health in India." The Quarterly Journal of Economics, 126 (3): 1485-1538.
Kapaj, Simon, Hans Peterson, Karsten Liber, and Prosun Bhattacharya. 2006. “Human health effects from chronic arsenic poisoning–a review.” Journal of Environmental Science and Health Part A, 41 (10): 2399-2428.
Kaufmann, R.B., Birte Holm Sorensen, Mahfuzur Rahman, Kim Streatfield, and Lars Ake Persson. 2001. “Addressing the public health crisis caused by arsenic contamination of drinking water in Bangladesh.” Washington, D.C.: World Bank. http://www-wds.worldbank.org/external/default/WDSContentServer/ WDSP/IB/2003/07/08/000094946_03062504024860/Rendered/PDF/multi0page.pdf (Accessed July 25, 2013).
Kremer, Michael, Jessica Leino, Edward Miguel and Alix Peterson Zwane. 2011. “Spring cleaning: rural water impacts, valuation, and institutions.” The Quarterly Journal of Economics 126 (1): 145-205.
Luoto, Jill, David Levine and Jeff Albert. 2011. “Information and persuasion: achieving safe water behavior in Kenya.” RAND Working Paper WR-885.
Madajewicz, Malgosia, Alexander Pfaff, Alexander van Geen, Joseph Graziano, Iftikhar Hussein, Hasina Momotaj, Roksana Sylvi, and Habibul Ahsan. 2007. “Can Information Alone Change Behavior? Response to Arsenic Contamination of Groundwater in Bangladesh.” Journal of Development Economics, 84 (2): 731–54.
Milton, Abul Hasnat, Wayne Smith, Bayzidur Rahman, Ziaul Hasan, Umme Kulsum, Keith Dear, M. Rakibuddin, and Azahar Ali. 2005. “Arsenic exposure and adverse pregnancy outcomes in Bangladesh.” Epidemiology, 16 (1): 82-86.
Morrow, Ardythe, Guillermo Ruiz-Palacios, Xi Jiang, and David Newburg. 2005. “Human-Milk Glycans That Inhibit Pathogen Binding Protect Breastfeeding Infants against Infectious Diarrhea.” Journal of Nutrition, 135: 1304-1307.
Mukherjee, Arun and Prosun Bhattacharya. 2001. “Arsenic in groundwater in the Bengal Delta Plain: slow poisoning in Bangladesh.” Environmental Review, 9: 189-220.
Nahar, N. 2009. “Causes and distribution of arsenic contamination in Bangladesh: evidence from the literature.” Water Policy, 11: 362-378.
National Institute of Population Research and Training (NIPORT), Mitra and Associates (MA), and ORC Macro (ORCM). 2001. “Bangladesh Demographic and Health Survey 1999-2000.” Dhaka, Bangladesh and Calverton,MD: National Institute of Population Research and Training, Mitra and Associates, and ORC Macro. http://www.measuredhs.com/pubs/pdf/FR119/FR119.pdf
National Institute of Population Research and Training (NIPORT), Mitra and Associates, and Macro International. 2009. “Bangladesh Demographic and Health Survey 2007.” Dhaka, Bangladesh and Calverton, MD: National Institute of Population Research and Training, Mitra and Associates, and Macro International. http://www.measuredhs.com/pubs/pdf/FR207/FR207%5BApril-10-2009%5D.pdf
Pitt, Mark, Mark Rosenzweig, and Nazmul Hassan. 2012. “Identifying the Hidden Costs of a Public Health Success: Arsenic Well Water Contamination and Productivity in Bangladesh.” PSTC Working Paper Series 2012-02.
Podor, Melinda and Timothy Halliday. 2012. “Health Status and the Allocation of Time.” Health Economics, 21: 514-527.

29
Prentice, Ann. 1991. “Breast Feeding and the Older Infant.” Acta Paediatrica, 80 (s374): 78-88. Prüss, Annette, David Day, Lorna Fewtrell and Jamie Bartram. 2002. “Estimating the Burden of
Disease from Water, Sanitation, and Hygiene at a Global Level.” Environmental Health Perspectives, 110 (5): 537-542.
Prüss-Üstün, Annette, Robert Bos, Fiona Gore and Jamie Bartram. 2008. “Safer water, better health: costs, benefits and sustainability of interventions to protect and promote health.” Geneva: World Health Organization. http://www.who.int/water_sanitation_health/publications/safer_water/en/
Saha, J. C., A.K. Dikshit, M. Bandyopadhyay, and K.C. Saha. 1999. “A review of arsenic poisoning and its effects on human health.” Critical Reviews in Environmental Science and Technology, 29 (3): 281-313.
Samanta, Gautam, Dipankar Das, Badal Mandal, Tarit Chowdhury, Dipankar Chakraborti, Arup Pal and Sad Ahamed. 2007. “Arsenic in the breast milk of lactating women in arsenic-affected areas of West Bengal, India and its effect on infants.” Journal of Environmental Science and Health Part A, 42 (12): 1815–1825.
Smith, Allan, Elena Lingas, and Mahfuzar Rahman (2000). “Contamination of drinking-water by arsenic in Bangladesh: a public health emergency.” Bulletin of the World Health Organization, 78 (9): 1093-1103.
Sultana, Farhana. 2006. “Gender concerns in arsenic mitigation in Bangladesh: trends and challenges.” APSU Selected papers on the social aspects of arsenic and arsenic mitigation in Bangladesh, Arsenic Policy Support Unit, Dhaka, Bangladesh: 53-84.
Tarozzi A, S. Balasubramany, L.S. Bennear, and A. Pfaff. 2009. “Bright lines, risk beliefs, and risk avoidance: Evidence from a randomized experiment in Bangladesh.” BREAD Working Paper No. 285.
UNICEF. 2008. “Arsenic mitigation in Bangladesh.” New York: UNICEF. www.unicef.org/bangladesh/Arsenic.pdf. (accessed August 1, 2013).
UNICEF. 2009. “Infant and Young Child Feeding Programme Review. Case Study: Bangladesh.” Report. New York: UNICEF. http://www.aednutritioncenter.org/update_docs/IYCF_Feeding_Prog_Rev_Case_Study_Bangladesh.pdf (accessed August 1, 2013)
Van Geen, A., Y. Zheng, R. Versteeg, M. Stute, A. Horneman, R. Dhar, M. Stekler, A. Gelman, C. Small, and H. Ahsan et al. 2003. “Spatial variability of arsenic in 6000 tube wells in a 25 km2 area of Bangladesh.” Water Resources Research, 39(5): 1-15.
World Bank, The. 2007. “Implementation Completion and Results Report (IDA-31240 SWTZ-21082) on a Credit in the Amount of SDR 24.2 Million (US$ 44.4 Million Equivalent) to Bangladesh for Arsenic Mitigation Water Supply.” Washington, D.C.: World Bank. http://users.physics.harvard.edu/~wilson/arsenic/WB_final.pdf
World Health Organization. 2010. “Guidelines on HIV and Infant Feeding 2010: Principles and Recommendations for Infant Feeding in the Context of HIV and a Summary of Evidence.” Geneva: World Health Organization. http://whqlibdoc.who.int/publications/2010/9789241599535_eng.pdf (accessed August 1, 2013)
Wright, Jim, Stephen Gundry and Ronan Conroy. 2004. “Household drinking water in developing countries: a systematic microbiological contamination between source and point-of-use.” Tropical Medicine and International Health 9 (1): 106-117.

30
Yu, Winston, Charles M. Harvey, and Charles F. Harvey. 2003. “Arsenic in groundwater in Bangladesh: A geostatistical and epidemiological framework for evaluating health effects and potential remedies.” Water Resources Research 39 (6): 1146.
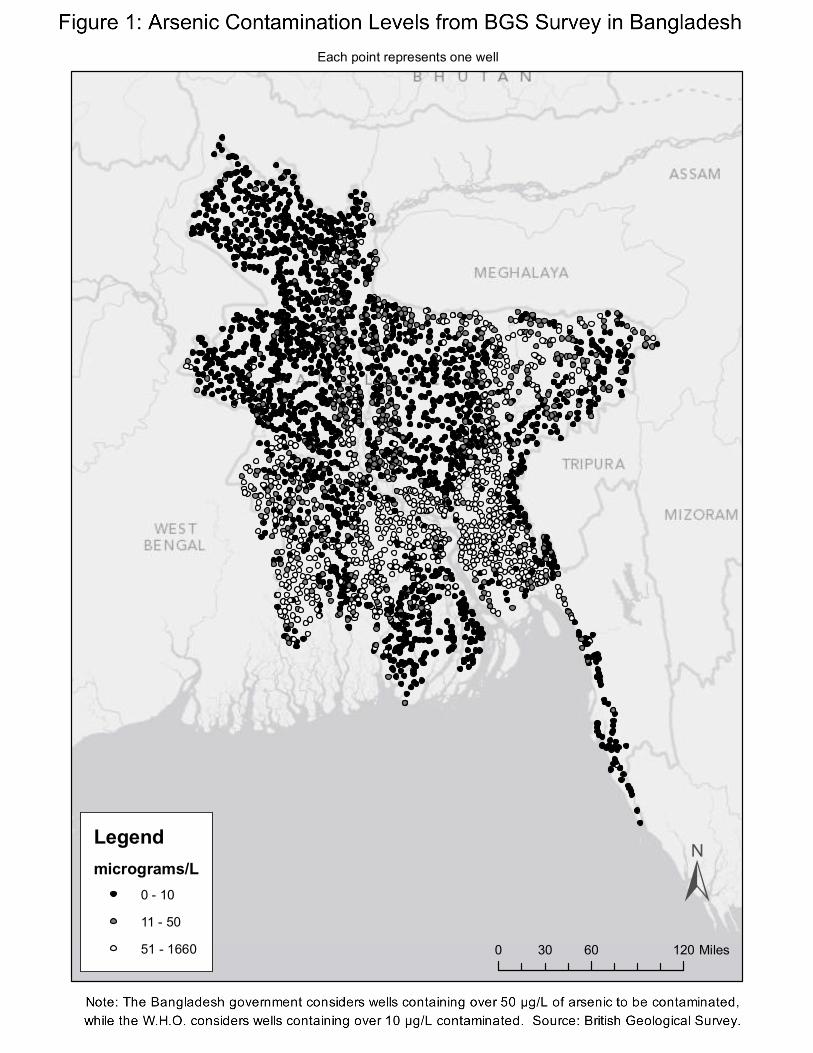
Arsenic Contamination Levels from BGS Survey in Bangladesh Each point represents one well
±0 60 12030 Miles
Legendmicrograms/L
0 - 10
11 - 50
51 - 1660
gshastry
Figure 1: Arsenic Contamination Levels from BGS Survey in Bangladesh
Helen Willis
Note: The Bangladesh government considers wells containing over 50 µg/L of arsenic to be contaminated, while the W.H.O. considers wells containing over 10 µg/L contaminated. Source: British Geological Survey.

0
0.05
0.1
0.15
0.2
0.25
0.3
0.35
0 0.1 0.2 0.3 0.4 0.5 0.6 0.7
Household water contaminated or from surfacewater
Probability of living within 1 m of an Uncontaminated Well
Figure 3: Access to a clean well
Unweighted
Weighted
Note: This figure plots a Kernel‐weighted local polynomial of the relationship between a household'saccess to a clean well and whether a household gets water from a contaminated well or surfacesources. The plots uses an epanechnikov kernel and bandwidth 0.05.
GPS coordinates of clusterGPS coordinates of a sampled contaminated wellGPS coordinates of a sampled uncontaminated well
Figure 2: Variation in Access to Uncontaminated Wells, conditional on Contamination Level
Cluster A Cluster B
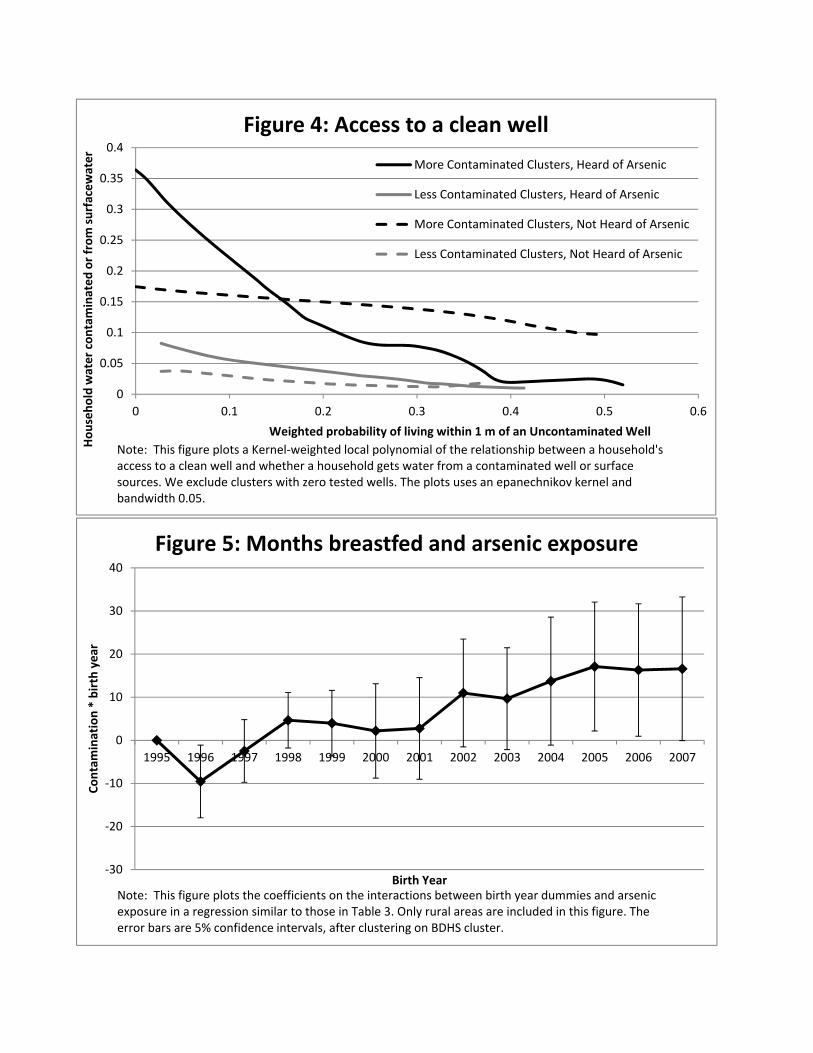
0
0.05
0.1
0.15
0.2
0.25
0.3
0.35
0.4
0 0.1 0.2 0.3 0.4 0.5 0.6
Household water contaminated or from surfacewater
Weighted probability of living within 1 m of an Uncontaminated Well
Figure 4: Access to a clean well
More Contaminated Clusters, Heard of Arsenic
Less Contaminated Clusters, Heard of Arsenic
More Contaminated Clusters, Not Heard of Arsenic
Less Contaminated Clusters, Not Heard of Arsenic
Note: This figure plots a Kernel‐weighted local polynomial of the relationship between a household'saccess to a clean well and whether a household gets water from a contaminated well or surfacesources. We exclude clusters with zero tested wells. The plots uses an epanechnikov kernel and bandwidth 0.05.
‐30
‐20
‐10
0
10
20
30
40
1995 1996 1997 1998 1999 2000 2001 2002 2003 2004 2005 2006 2007
Contamination * birth year
Birth Year
Figure 5: Months breastfed and arsenic exposure
Note: This figure plots the coefficients on the interactions between birth year dummies and arsenic exposure in a regression similar to those in Table 3. Only rural areas are included in this figure. The error bars are 5% confidence intervals, after clustering on BDHS cluster.
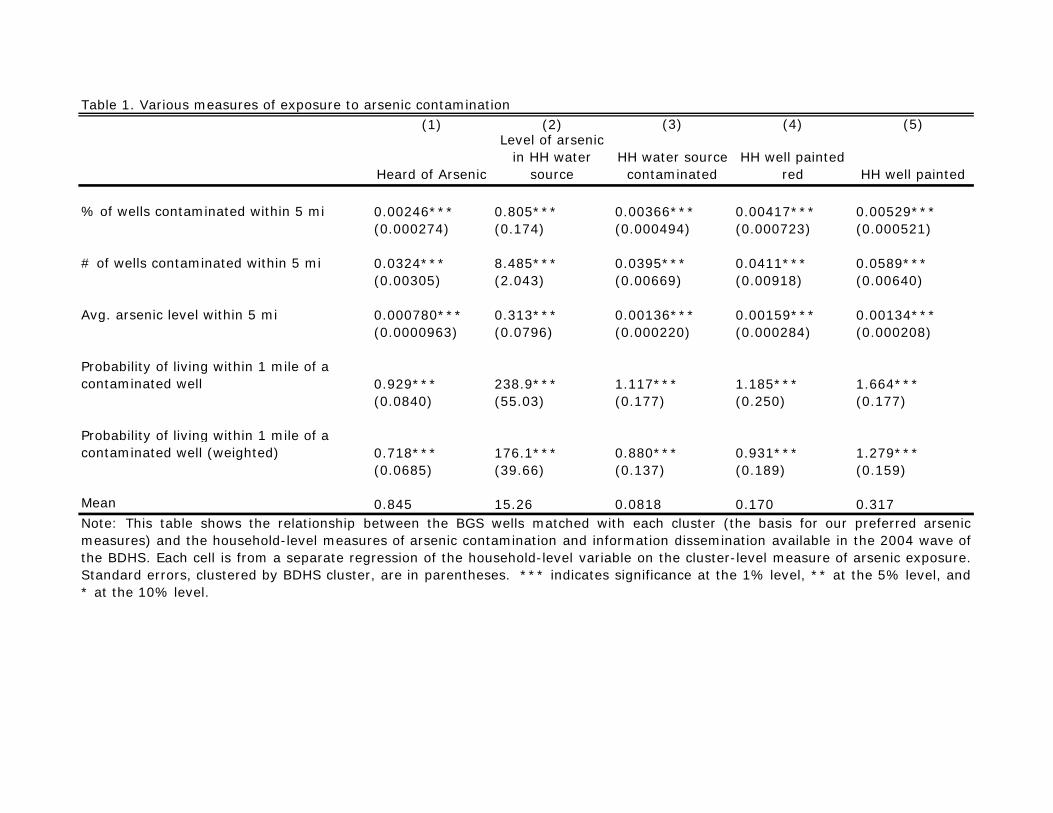
(1) (2) (3) (4) (5)
Heard of Arsenic
Level of arsenic in HH water
sourceHH water source
contaminatedHH well painted
red HH well painted
% of wells contaminated within 5 mi 0.00246*** 0.805*** 0.00366*** 0.00417*** 0.00529***(0.000274) (0.174) (0.000494) (0.000723) (0.000521)
# of wells contaminated within 5 mi 0.0324*** 8.485*** 0.0395*** 0.0411*** 0.0589***(0.00305) (2.043) (0.00669) (0.00918) (0.00640)
Avg. arsenic level within 5 mi 0.000780*** 0.313*** 0.00136*** 0.00159*** 0.00134***(0.0000963) (0.0796) (0.000220) (0.000284) (0.000208)
Probability of living within 1 mile of a contaminated well 0.929*** 238.9*** 1.117*** 1.185*** 1.664***
(0.0840) (55.03) (0.177) (0.250) (0.177)
Probability of living within 1 mile of a contaminated well (weighted) 0.718*** 176.1*** 0.880*** 0.931*** 1.279***
(0.0685) (39.66) (0.137) (0.189) (0.159)
Mean 0.845 15.26 0.0818 0.170 0.317Note: This table shows the relationship between the BGS wells matched with each cluster (the basis for our preferred arsenicmeasures) and the household-level measures of arsenic contamination and information dissemination available in the 2004 wave ofthe BDHS. Each cell is from a separate regression of the household-level variable on the cluster-level measure of arsenic exposure.Standard errors, clustered by BDHS cluster, are in parentheses. *** indicates significance at the 1% level, ** at the 5% level, and* at the 10% level.
Table 1. Various measures of exposure to arsenic contamination

(1) (2) (3) (4) (5) (6)
Contamination Level Low HighConditional Difference Low High
Conditional Difference
Control variablesChild's age (in months) 27.18 26.367 -0.754 28.17 28.302 0.222Muslim 0.893 0.89476 -0.00865 0.911 0.91926 0.0314Mother's age (in years) 25.69 25.911 0.199 25.81 25.677 -0.0487Mother's years of education 2.987 3.296 -0.0779 4.775 4.942 -0.0159Father's years of education 3.938 4.16 -0.0374 4.836 4.761 -0.194Mother works outside home 0.196 0.1442 0.00812 0.260 0.2162 -0.00911Household has electricity 0.333 0.33286 -0.0209 0.477 0.46715 0.0131Urban area 0.273 0.2475 0.0623 0.362 0.321 0.0272Drinking water source:
Piped water 0.0978 0.0328 -0.0427 0.0920 0.0224 -0.00597Tubewell 0.868 0.9216 0.0297 0.858 0.9278 0.00570Surface water 0.0220 0.0406 0.0138 0.0218 0.0391 0.0124
Mother's weight-for-height z-score -1.564 -1.564428 -0.0148 -1.233 -1.2212 0.0251
OutcomesMonths breastfed 19.31 18.618 -0.573 19.95 19.828 0.0671Breastfed for longer than:
6 months 0.953 0.95652 0.00400 0.964 0.964266 0.00026612 months 0.932 0.931403 0.000711 0.933 0.94008 -0.0032118 months 0.868 0.87306 0.00909 0.871 0.8822 0.011224 months 0.768 0.7574 -0.00135 0.766 0.76834 0.018936 months 0.390 0.3336 -0.0250 0.345 0.3208 -0.0242
Exclusively breastfed 0.129 0.13808 -0.00455 0.0931 0.0969 -0.0101Exclusively breastfed for children:
Less than 6 months old 0.533 0.5469 -0.00775 0.434 0.4679 -0.02676-14 months old 0.0902 0.0467 -0.0434 0.0269 0.03563 -0.0130Older than 12 months 0.0104 0.01438 0.0110 0.0193 0.0037 -0.0295***
Child died 0.0757 0.07326 0.0133 0.0589 0.05729 -0.00844Height for age z-score -1.811 -1.81429 -0.0620 -1.548 -1.5293 -0.000379Weight-for-height z-score -0.984 -0.897 0.0755** -1.150 -1.0508 0.144***
Arsenic measuresPercent contaminated in 5 mi 0.845 48.455 37.18*** 1.267 47.117 38.06***Num. wells contaminated 5 mi 0.0531 3.2161 2.293*** 0.0714 3.3324 2.532***Avg. As contamination in 5 mi 5.594 104.924 53.57*** 6.543 97.493 66.14***Probability of living within 1 mile of a contaminated well 0.00221 0.12021 0.0860*** 0.00322 0.12522 0.0955***Probability of living within 1 mile of a contaminated well (weighted) 0.00122 0.13622 0.101*** 0.00177 0.14077 0.112***
Number of Observations 3147 3478 3124 2952
Table 2. Descriptive statistics in 1999 (before the campaign) and in 2007 (after the campaign)
Survey Year 1999 Survey Year 2007
Note: This table shows summary statistics for all variables used in this paper, separately for clusters withlower and higher than median exposure to arsenic (as measured by the weighted probability of being within1 mile of a contaminated well). Columns (3) and (6) show the difference between areas, conditional ondistrict fixed effects. The standard errors used to indicate significant differences are clustered by BDHScluster. *** indicates significance at the 1% level, ** at the 5% level, and * at the 10% level.
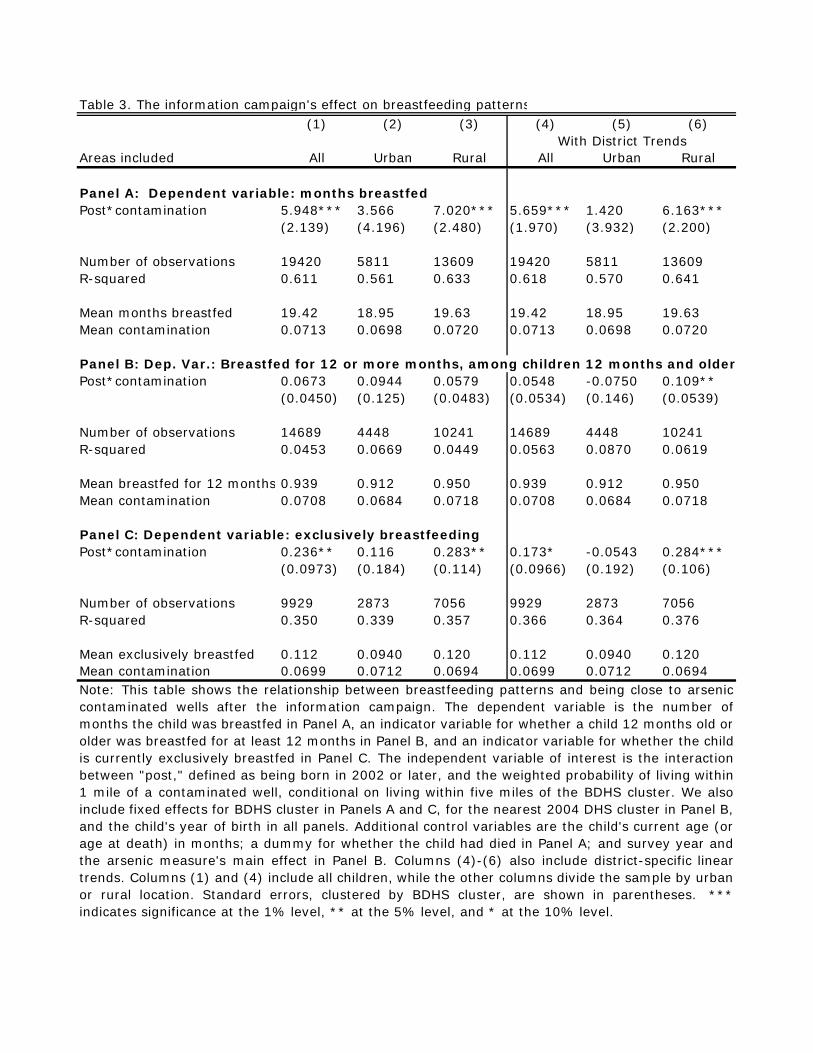
Table 3. The information campaign's effect on breastfeeding patterns(1) (2) (3) (4) (5) (6)
Areas included All Urban Rural All Urban Rural
Panel A: Dependent variable: months breastfedPost*contamination 5.948*** 3.566 7.020*** 5.659*** 1.420 6.163***
(2.139) (4.196) (2.480) (1.970) (3.932) (2.200)
Number of observations 19420 5811 13609 19420 5811 13609R-squared 0.611 0.561 0.633 0.618 0.570 0.641
Mean months breastfed 19.42 18.95 19.63 19.42 18.95 19.63Mean contamination 0.0713 0.0698 0.0720 0.0713 0.0698 0.0720
Panel B: Dep. Var.: Breastfed for 12 or more months, among children 12 months and olderPost*contamination 0.0673 0.0944 0.0579 0.0548 -0.0750 0.109**
(0.0450) (0.125) (0.0483) (0.0534) (0.146) (0.0539)
Number of observations 14689 4448 10241 14689 4448 10241R-squared 0.0453 0.0669 0.0449 0.0563 0.0870 0.0619
Mean breastfed for 12 months 0.939 0.912 0.950 0.939 0.912 0.950Mean contamination 0.0708 0.0684 0.0718 0.0708 0.0684 0.0718
Post*contamination 0.236** 0.116 0.283** 0.173* -0.0543 0.284***(0.0973) (0.184) (0.114) (0.0966) (0.192) (0.106)
Number of observations 9929 2873 7056 9929 2873 7056R-squared 0.350 0.339 0.357 0.366 0.364 0.376
Mean exclusively breastfed 0.112 0.0940 0.120 0.112 0.0940 0.120Mean contamination 0.0699 0.0712 0.0694 0.0699 0.0712 0.0694
Panel C: Dependent variable: exclusively breastfeeding
Note: This table shows the relationship between breastfeeding patterns and being close to arseniccontaminated wells after the information campaign. The dependent variable is the number ofmonths the child was breastfed in Panel A, an indicator variable for whether a child 12 months old orolder was breastfed for at least 12 months in Panel B, and an indicator variable for whether the childis currently exclusively breastfed in Panel C. The independent variable of interest is the interactionbetween "post," defined as being born in 2002 or later, and the weighted probability of living within1 mile of a contaminated well, conditional on living within five miles of the BDHS cluster. We alsoinclude fixed effects for BDHS cluster in Panels A and C, for the nearest 2004 DHS cluster in Panel B,and the child's year of birth in all panels. Additional control variables are the child's current age (orage at death) in months; a dummy for whether the child had died in Panel A; and survey year andthe arsenic measure's main effect in Panel B. Columns (4)-(6) also include district-specific lineartrends. Columns (1) and (4) include all children, while the other columns divide the sample by urbanor rural location. Standard errors, clustered by BDHS cluster, are shown in parentheses. ***indicates significance at the 1% level, ** at the 5% level, and * at the 10% level.
With District Trends

Table 4. Heterogeneous effects on exclusive breastfeeding by age(1) (2) (3)
Ages included < 6 m 6 - 14 m > 12 m
Panel A: Dependent variable: Breastfeeding exclusivelyPost*contamination 0.849* 0.358** 0.0267
(0.476) (0.162) (0.0557)
Number of observations 1351 1839 4332R-squared 0.384 0.261 0.107
Mean exclusively breastfed 0.506 0.0527 0.0180Mean contamination 0.0766 0.0719 0.0667
Panel B: Dependent Variable: Had plain water in past 24 hoursPost*contamination -1.219*** -0.734*** 0.0955
(0.421) (0.222) (0.0662)
Number of observations 1469 1894 7848R-squared 0.432 0.271 0.0780
Mean had plain water 0.410 0.921 0.962Mean contamination 0.0753 0.0722 0.0717Note: This table shows the relationship between exclusive breastfeedingpatterns or being given plain water at different ages and being close toarsenic contaminated wells after the information campaign. As in Table3, the independent variable of interest is the interaction between "post,"defined as being born in 2002 or later, and the weighted probability ofliving within 1 mile of a contaminated well, conditional on living withinfive miles of the BDHS cluster. We include fixed effects for the nearest2004 BDHS cluster in both panels. We also include fixed effects for thechild's year of birth and survey year, as well as district-specific lineartrends. Additional control variables are the child's current age in monthsand the arsenic exposure main effect. The dependent variable in Panel Ais a dummy for whether the child is exclusively breastfed and in Panel Bis a dummy for whether the child has consumed plain water in the last24 hours, but the sample is restricted to children under 6 months,between 6 and 14 months and more than 12 months, respectively. Onlychilden living in rural areas are included. Standard errors, clustered byBDHS cluster, are shown in parentheses. *** indicates significance atthe 1% level, ** at the 5% level, and * at the 10% level.

Table 5. Differential responses with respect to water source or distance to uncontaminated wells(1) (2) (3) (4) (5)
Triple difference measure
Water sample is contaminated with
arsenic or from surface source
Probability of living within 1 mile
of an uncontaminated
well
Probability of living within 1 mile
of an uncontaminated well (weighted)
Average distance to closest
uncontaminated well
Average distance to closest
uncontaminated well (weighted)
Dependent Variable: Months BreastfedPost*contamination 2.457 11.50*** 8.205** -1.347 1.352
(2.839) (3.435) (3.393) (4.350) (3.967)
Post*contamination 13.10*** -41.28** -13.43 2.485** 1.660 *triple difference measure (4.951) (19.02) (15.55) (1.202) (1.088)
Number of observations 4765 13609 13609 13609 13609R-squared 0.681 0.641 0.641 0.641 0.641
Mean months breastfed 19.60 19.63 19.63 19.63 19.63Mean contamination 0.0741 0.0720 0.0720 0.0720 0.0720Note: This table shows the relationship between breastfeeding patterns and being close to arsenic contaminated wells after the informationcampaign differentially with respect to different measures of the household's use of and access to uncontaminated wells. The specificationis identical to the one in Table 3, except for the triple interaction and all relevant main effects and two-way interactions. The dependentvariable is the number of months the child was breastfed. The independent variables of interest are the interaction between "post,"defined as being born in 2002 or later, and the weighted probability of living within 1 mile of a contaminated well, conditional on livingwithin five miles of the BDHS cluster, and the triple interaction between this variable and an indicator for households that did not sourcewater from a clean well (Column 1) or a measure of the distance to an uncontaminated well (Columns 2-5). We also include fixed effectsfor BDHS cluster, the child's year of birth, as well as district-specific linear trends. Additional control variables are the measure of thedistance to an uncontaminated well, its interactions with post and with arsenic exposure, the child's current age (or age at death) inmonths, and a dummy for whether the child had died. Only children living in rural areas are included. Standard errors, clustered by BDHScluster, are shown in parentheses. *** indicates significance at the 1% level, ** at the 5% level, and * at the 10% level.
Measure of distance to uncontaminated well
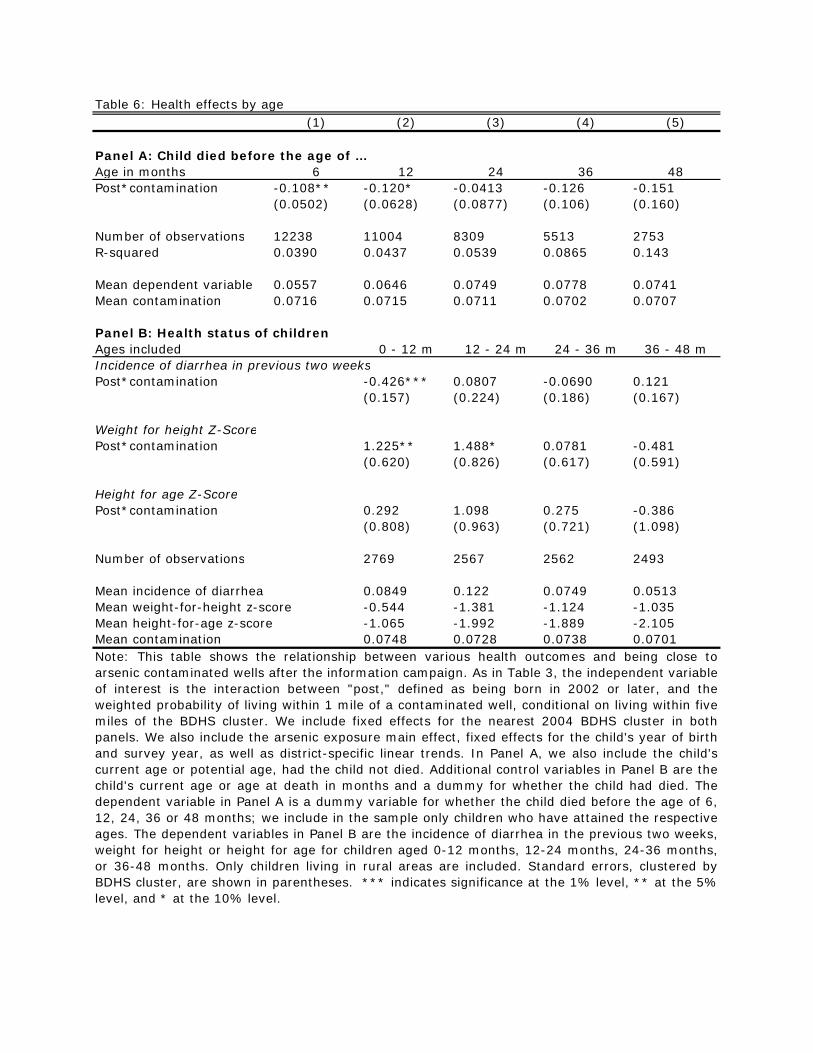
Table 6: Health effects by age(1) (2) (3) (4) (5)
Age in months 6 12 24 36 48Post*contamination -0.108** -0.120* -0.0413 -0.126 -0.151
(0.0502) (0.0628) (0.0877) (0.106) (0.160)
Number of observations 12238 11004 8309 5513 2753R-squared 0.0390 0.0437 0.0539 0.0865 0.143
Mean dependent variable 0.0557 0.0646 0.0749 0.0778 0.0741Mean contamination 0.0716 0.0715 0.0711 0.0702 0.0707
Ages included 0 - 12 m 12 - 24 m 24 - 36 m 36 - 48 mIncidence of diarrhea in previous two weeksPost*contamination -0.426*** 0.0807 -0.0690 0.121
(0.157) (0.224) (0.186) (0.167)
Weight for height Z-ScorePost*contamination 1.225** 1.488* 0.0781 -0.481
(0.620) (0.826) (0.617) (0.591)
Height for age Z-ScorePost*contamination 0.292 1.098 0.275 -0.386
(0.808) (0.963) (0.721) (1.098)
Number of observations 2769 2567 2562 2493
Mean incidence of diarrhea 0.0849 0.122 0.0749 0.0513Mean weight-for-height z-score -0.544 -1.381 -1.124 -1.035Mean height-for-age z-score -1.065 -1.992 -1.889 -2.105Mean contamination 0.0748 0.0728 0.0738 0.0701Note: This table shows the relationship between various health outcomes and being close toarsenic contaminated wells after the information campaign. As in Table 3, the independent variableof interest is the interaction between "post," defined as being born in 2002 or later, and theweighted probability of living within 1 mile of a contaminated well, conditional on living within fivemiles of the BDHS cluster. We include fixed effects for the nearest 2004 BDHS cluster in bothpanels. We also include the arsenic exposure main effect, fixed effects for the child's year of birthand survey year, as well as district-specific linear trends. In Panel A, we also include the child'scurrent age or potential age, had the child not died. Additional control variables in Panel B are thechild's current age or age at death in months and a dummy for whether the child had died. Thedependent variable in Panel A is a dummy variable for whether the child died before the age of 6,12, 24, 36 or 48 months; we include in the sample only children who have attained the respectiveages. The dependent variables in Panel B are the incidence of diarrhea in the previous two weeks,weight for height or height for age for children aged 0-12 months, 12-24 months, 24-36 months,or 36-48 months. Only children living in rural areas are included. Standard errors, clustered byBDHS cluster, are shown in parentheses. *** indicates significance at the 1% level, ** at the 5%level, and * at the 10% level.
Panel A: Child died before the age of …
Panel B: Health status of children
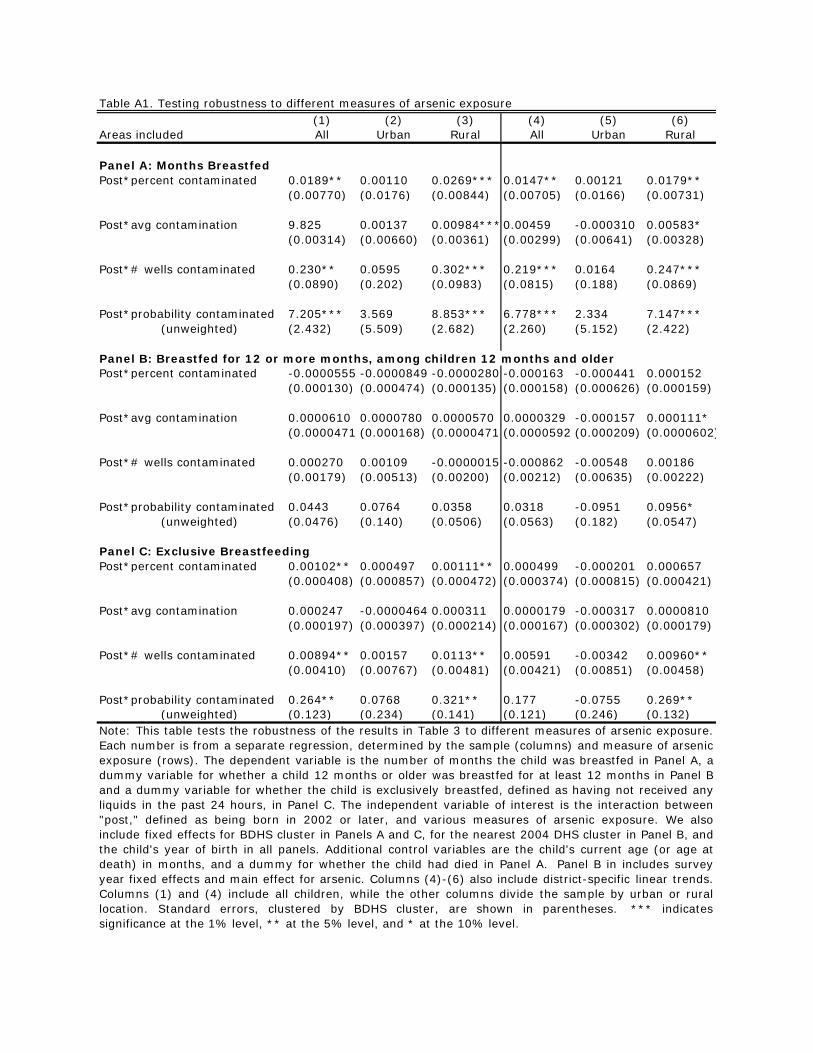
Table A1. Testing robustness to different measures of arsenic exposure(1) (2) (3) (4) (5) (6)
Areas included All Urban Rural All Urban Rural
Post*percent contaminated 0.0189** 0.00110 0.0269*** 0.0147** 0.00121 0.0179**(0.00770) (0.0176) (0.00844) (0.00705) (0.0166) (0.00731)
Post*avg contamination 9.825 0.00137 0.00984***0.00459 -0.000310 0.00583*(0.00314) (0.00660) (0.00361) (0.00299) (0.00641) (0.00328)
Post*# wells contaminated 0.230** 0.0595 0.302*** 0.219*** 0.0164 0.247***(0.0890) (0.202) (0.0983) (0.0815) (0.188) (0.0869)
Post*probability contaminated 7.205*** 3.569 8.853*** 6.778*** 2.334 7.147*** (unweighted) (2.432) (5.509) (2.682) (2.260) (5.152) (2.422)
Panel B: Breastfed for 12 or more months, among children 12 months and olderPost*percent contaminated -0.0000555 -0.0000849 -0.0000280 -0.000163 -0.000441 0.000152
(0.000130) (0.000474) (0.000135) (0.000158) (0.000626) (0.000159)
Post*avg contamination 0.0000610 0.0000780 0.0000570 0.0000329 -0.000157 0.000111*(0.0000471 (0.000168) (0.0000471 (0.0000592 (0.000209) (0.0000602)
Post*# wells contaminated 0.000270 0.00109 -0.0000015 -0.000862 -0.00548 0.00186(0.00179) (0.00513) (0.00200) (0.00212) (0.00635) (0.00222)
Post*probability contaminated 0.0443 0.0764 0.0358 0.0318 -0.0951 0.0956* (unweighted) (0.0476) (0.140) (0.0506) (0.0563) (0.182) (0.0547)
Post*percent contaminated 0.00102** 0.000497 0.00111** 0.000499 -0.000201 0.000657(0.000408) (0.000857) (0.000472) (0.000374) (0.000815) (0.000421)
Post*avg contamination 0.000247 -0.0000464 0.000311 0.0000179 -0.000317 0.0000810(0.000197) (0.000397) (0.000214) (0.000167) (0.000302) (0.000179)
Post*# wells contaminated 0.00894** 0.00157 0.0113** 0.00591 -0.00342 0.00960**(0.00410) (0.00767) (0.00481) (0.00421) (0.00851) (0.00458)
Post*probability contaminated 0.264** 0.0768 0.321** 0.177 -0.0755 0.269** (unweighted) (0.123) (0.234) (0.141) (0.121) (0.246) (0.132)
Panel A: Months Breastfed
Panel C: Exclusive Breastfeeding
Note: This table tests the robustness of the results in Table 3 to different measures of arsenic exposure.Each number is from a separate regression, determined by the sample (columns) and measure of arsenicexposure (rows). The dependent variable is the number of months the child was breastfed in Panel A, adummy variable for whether a child 12 months or older was breastfed for at least 12 months in Panel Band a dummy variable for whether the child is exclusively breastfed, defined as having not received anyliquids in the past 24 hours, in Panel C. The independent variable of interest is the interaction between"post," defined as being born in 2002 or later, and various measures of arsenic exposure. We alsoinclude fixed effects for BDHS cluster in Panels A and C, for the nearest 2004 DHS cluster in Panel B, andthe child's year of birth in all panels. Additional control variables are the child's current age (or age atdeath) in months, and a dummy for whether the child had died in Panel A. Panel B in includes surveyyear fixed effects and main effect for arsenic. Columns (4)-(6) also include district-specific linear trends.Columns (1) and (4) include all children, while the other columns divide the sample by urban or rurallocation. Standard errors, clustered by BDHS cluster, are shown in parentheses. *** indicatessignificance at the 1% level, ** at the 5% level, and * at the 10% level.
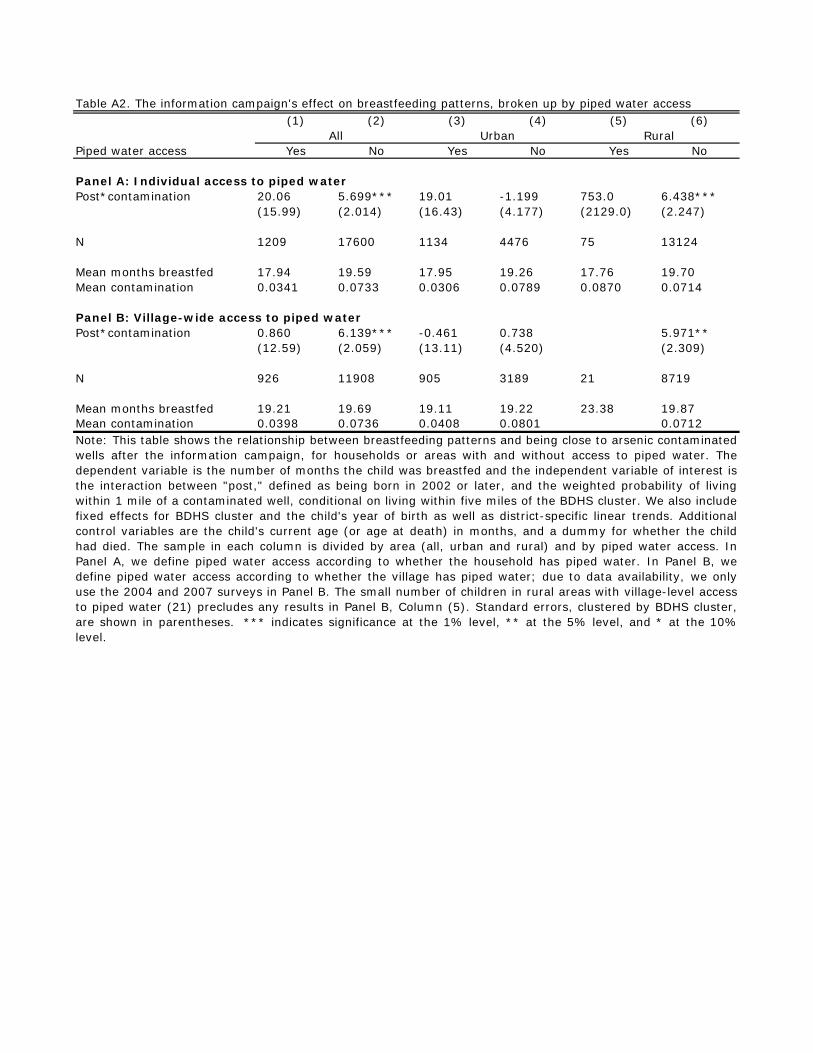
Table A2. The information campaign's effect on breastfeeding patterns, broken up by piped water access(1) (2) (3) (4) (5) (6)
Piped water access Yes No Yes No Yes No
Post*contamination 20.06 5.699*** 19.01 -1.199 753.0 6.438***(15.99) (2.014) (16.43) (4.177) (2129.0) (2.247)
N 1209 17600 1134 4476 75 13124
Mean months breastfed 17.94 19.59 17.95 19.26 17.76 19.70Mean contamination 0.0341 0.0733 0.0306 0.0789 0.0870 0.0714
Panel B: Village-wide access to piped waterPost*contamination 0.860 6.139*** -0.461 0.738 5.971**
(12.59) (2.059) (13.11) (4.520) (2.309)
N 926 11908 905 3189 21 8719
Mean months breastfed 19.21 19.69 19.11 19.22 23.38 19.87Mean contamination 0.0398 0.0736 0.0408 0.0801 0.0712Note: This table shows the relationship between breastfeeding patterns and being close to arsenic contaminatedwells after the information campaign, for households or areas with and without access to piped water. Thedependent variable is the number of months the child was breastfed and the independent variable of interest isthe interaction between "post," defined as being born in 2002 or later, and the weighted probability of livingwithin 1 mile of a contaminated well, conditional on living within five miles of the BDHS cluster. We also includefixed effects for BDHS cluster and the child's year of birth as well as district-specific linear trends. Additionalcontrol variables are the child's current age (or age at death) in months, and a dummy for whether the childhad died. The sample in each column is divided by area (all, urban and rural) and by piped water access. InPanel A, we define piped water access according to whether the household has piped water. In Panel B, wedefine piped water access according to whether the village has piped water; due to data availability, we onlyuse the 2004 and 2007 surveys in Panel B. The small number of children in rural areas with village-level accessto piped water (21) precludes any results in Panel B, Column (5). Standard errors, clustered by BDHS cluster,are shown in parentheses. *** indicates significance at the 1% level, ** at the 5% level, and * at the 10%level.
Panel A: Individual access to piped water
All Urban Rural
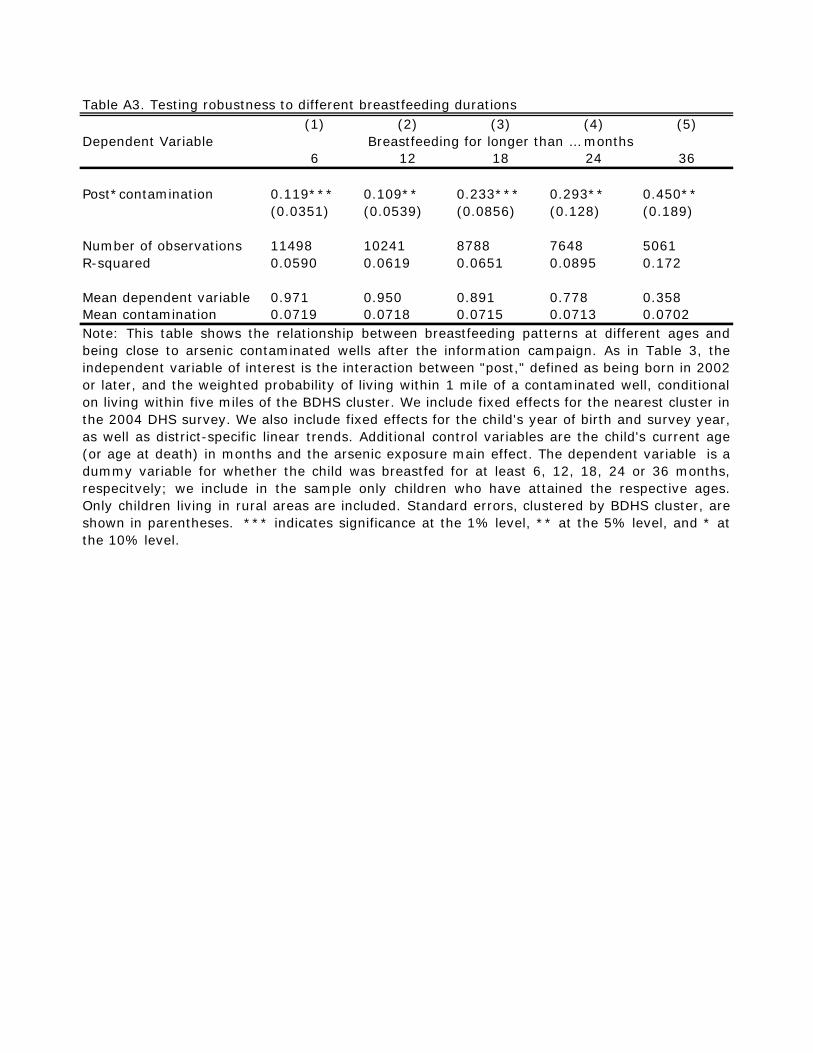
Table A3. Testing robustness to different breastfeeding durations(1) (2) (3) (4) (5)
Dependent Variable6 12 18 24 36
Post*contamination 0.119*** 0.109** 0.233*** 0.293** 0.450**(0.0351) (0.0539) (0.0856) (0.128) (0.189)
Number of observations 11498 10241 8788 7648 5061R-squared 0.0590 0.0619 0.0651 0.0895 0.172
Mean dependent variable 0.971 0.950 0.891 0.778 0.358Mean contamination 0.0719 0.0718 0.0715 0.0713 0.0702
Breastfeeding for longer than … months
Note: This table shows the relationship between breastfeeding patterns at different ages andbeing close to arsenic contaminated wells after the information campaign. As in Table 3, theindependent variable of interest is the interaction between "post," defined as being born in 2002or later, and the weighted probability of living within 1 mile of a contaminated well, conditionalon living within five miles of the BDHS cluster. We include fixed effects for the nearest cluster inthe 2004 DHS survey. We also include fixed effects for the child's year of birth and survey year,as well as district-specific linear trends. Additional control variables are the child's current age(or age at death) in months and the arsenic exposure main effect. The dependent variable is adummy variable for whether the child was breastfed for at least 6, 12, 18, 24 or 36 months,respecitvely; we include in the sample only children who have attained the respective ages.Only children living in rural areas are included. Standard errors, clustered by BDHS cluster, areshown in parentheses. *** indicates significance at the 1% level, ** at the 5% level, and * atthe 10% level.

Table A4. Testing robustness with respect to right-censored dependent variable(1) (2) (3)
Post*contamination 19.05*** 7.830*(6.459) (4.131)
Number of observations 5266 13609R-squared 0.301 0.592
Post*contamination 5.016* 5.590**(2.943) (2.371)
Number of observations 13610 13610R-squared 0.438 0.538
Panel B: Right-censoring due to child death while breastfeeding
Panel A: Right-censoring due to still breastfeeding
Note: This table tests the robustness of the results in Table 3 Panel A todifferent assumptions regarding the right-censoring of the dependent variable,months breastfed. In Column (1), we include only children who have alreadystopped breastfeeding. In Column (2), we replace months breastfed with themax in the data for those who are still breastfeeding, in Panel A, and for thosewho died, in Panel B. In Column (3), we replace months breastfed with the agethe child would have been at the time of the survey (which is the greatestnumber of months breastfed that would have been possible had the child notdied, given the timing of the survey). As in Table 3, the independent variable ofinterest is the interaction between "post," defined as being born in 2002 or later,and the weighted probability of living within 1 mile of a contaminated well,conditional on living within five miles of the BDHS cluster. We also include fixedeffects for BDHS cluster and the child's year of birth, as well as district-specificlinear trends. Additional control variables are the child's current age (or age atdeath) in months (in Panel A), the child's potential age at the time of the surveyhad she or he not died (in Panel B), and a dummy for whether the child haddied. Only childen living in rural areas are included. Standard errors, clusteredby BDHS cluster, are shown in parentheses. *** indicates significance at the1% level, ** at the 5% level, and * at the 10% level.
Related Documents