Water Quality Assessment: Bacteria • Water Quality Standards • Designated Use Impairment • Water Quality Monitoring Data and Analysis • Bacteria Source Assessment • Pollution Reduction Strategies & BMPs 1 The high bacteria levels in Kiefer Creek could come from a variety of sources in the watershed, the most likely being faulty septic systems contaminating the groundwater and pet and wildlife waste washed into the creek. E. coli is a common bacterium found in the digestive tract of all warm-blooded animals. E. coli is often used as an indicator that waters are polluted with animal or human waste and potentially harmful to human health. Although there have been no previous studies specific to Kiefer Creek, it has been included in Meramec River Watershed plans since they began to be written, as well as plans for neighboring Meramec tributaries. St. Louis County Water Pollution Control Study Phase I – Areas tributary to the Meramec River MSD-September 1972 Historical data shows Kiefer having a steadily elevated level of Coliform bacteria, although not nearly as high as has been recorded by the USGS, MSD and MDNR in recent years.. In September 1972 the East West Gateway Council published the St. Louis County Water Pollution Control Study - Phase I - Areas Tributary to the Meramec River. In this study, EWG looked specifically at the potential to expand sewer services to tributary areas of the Lower Meramec River, with specific emphasis on Fishpot and Grand Glaize Creek, but also including the Kiefer Creek Watershed. At the time that this study was conducted the problems with wastewater that persist in Kiefer Creek, were prevalent in Fishpot and Grand Glaize Creek as well. As a regional planning agency, EWG saw that the population would inevitably expand into these areas and the existing wastewater infrastructure, or lack thereof, would be inadequate to handle this influx. This study included testing of three locations in the Kiefer Creek Watershed for a variety of parameters. The data indicates high bacteria levels in Kiefer Creek, showing that Kiefer Creek has had a bacteria problem for a long time, although the scale may have fluctuated over time. Current data shows that Kiefer can have very low levels of bacteria during low water and very high levels during high water. 1980 Section 208 Water Pollution Control Plan for the St. Louis Region was created by the East West Gateway and although it covered the greater St. Louis region, it focused in on the Meramec River Basin and the Lower Meramec Watershed as an area for a long term focus on improving water quality. The 208 Plan demonstrated that in-stream water quality could not be met with point source controls alone, emphasizing the need for watershed planning to address nonpoint sources in the area. Because of this, the 208 plan identifies both sewage facility construction and stormwater management as areas to focus on.

Welcome message from author
This document is posted to help you gain knowledge. Please leave a comment to let me know what you think about it! Share it to your friends and learn new things together.
Transcript

Water Quality Assessment: Bacteria• Water Quality Standards• Designated Use Impairment• Water Quality Monitoring Data and Analysis• Bacteria Source Assessment• Pollution Reduction Strategies & BMPs
1
The high bacteria levels in Kiefer Creek could come from a variety of sources in the watershed, the most likely being faulty septic systems contaminating the groundwater and pet and wildlife waste washed into the creek. E. coli is a common bacterium found in the digestive tract of all warm-blooded animals. E. coli is often used as an indicator that waters are polluted with animal or human waste and potentially harmful to human health. Although there have been no previous studies specific to Kiefer Creek, it has been included in Meramec River Watershed plans since they began to be written, as well as plans for neighboring Meramec tributaries.
St. Louis County Water
Pollution Control Study Phase I – Areas tributary
to the Meramec River MSD-September 1972
Historical data shows Kiefer having a steadily elevated level of Coliform bacteria, although not nearly as high as has been recorded by the USGS, MSD and MDNR in recent years.. In September 1972 the East West Gateway Council published the St. Louis County Water Pollution Control Study - Phase I - Areas Tributary to the Meramec River. In this study, EWG looked specifically at the potential to expand sewer services to tributary areas of the Lower Meramec River, with specific emphasis onFishpot and Grand Glaize Creek, but also including the Kiefer Creek Watershed. At the time that this study was conducted the problems withwastewater that persist in Kiefer Creek, were prevalent in Fishpot and
Grand Glaize Creek as well. As a regional planning agency, EWG saw that the population would inevitably expand into these areas and the existing wastewater infrastructure, or lack thereof, would be inadequate to handle this influx. This study included testing of three locations in the Kiefer Creek Watershed for a variety of parameters. The data indicates high bacteria levels in Kiefer Creek, showing that Kiefer Creek has had a bacteria problem for a long time, although the scale may have fluctuated over time. Current data shows that Kiefer can have very low levels of bacteria during low water and very high levels during high water.
1980 Section 208 Water Pollution Control Plan for the St. Louis Regionwas created by the East West Gateway and although it covered the greater St. Louis region, it focused in on the Meramec River Basin and the Lower Meramec Watershed as an area for a long term focus on improving water quality. The 208 Plan demonstrated that in-stream water quality could not be met with point source controls alone, emphasizing the need for watershed planning to address nonpoint sources in the area. Because of this, the 208 plan identifies both sewage facility construction and stormwater management as areas to focus on.

Introduction: Past Watershed & Water Quality Studies
2
2009 Source Water Protection Plan for the Meramec River ExchangeThe 2009 Exchange was funded by a grant from the US Forest Service and was undertaken by the St. Louis Regional Open Space Council and a coalition of more than thirty agencies and organizations. In preparation for the exchange, a report summarizing watershed conditions in three HUC-12 sub-basins of the Lower Meramec was prepared. This report includes a set of maps depicting the watershed attributes and conditions, as well as contextual and historical information relevant to the current conditions of the Meramec as a drinking water source. This report identified a broad range of point and non-point source pollutants and historical degradation of the Lower Meramec Watershed. The 2012 Lower Meramec Watershed Plan specifically recommends the development of sub-watershed plans, listing Kiefer Creek as a high priority.
The report prepared for the Exchange emphasizes the importance of education for residents and municipal officials on BMPs for watershed health. The 2009 plan outlines the following five goals as high priority:1. Develop strategies to protect a vitally
important source of drinking water for 200,000 St. Louis county residents.
2. Improve and protect habitat and recreational areas in streams and restore degraded tributaries.
3. Develop strategies to protect healthy, sensitive streams that are at risk of being degraded by human actions.
4. Develop long range plans for public education.
5. Achieve and maintain compliance with water quality standards.

Introduction: Past Watershed & Water Quality Studies
3
2012 Lower Meramec Watershed Plan is the most recent planning effort on the Meramec River is the 2012 Lower Meramec Watershed Plan. The 2012 plan is a Nine Element Watershed Plan that builds on The 208 Plan. It includes The Kiefer Creek Watershed (7 sq. miles) in the planning area, as well as many other tributaries to the Lower Meramec. In total this plan covers 182.2 square miles and looked at a broad range of issues from many different watersheds.
The 2012 Lower Meramec Watershed Plan continues to address, and expands upon the goals of the 2009 plan in the following areas:1. Timeline : The 2012 plan proposes a long term framework for
impaired sub-watersheds, as well as short and mid term actions for local residents as well as local government public agencies.
2. Models, Monitoring and Load Reductions : In writing the plan, the East West Gateway analyzed twenty-six existing watershed models to create a comprehensive model that spans the urban and suburban settings of the Lower Meramec Watershed.
3. City, County and State Owned Public Lands : A key recommendation of the plan is to focus on public lands within the watershed. Communities and agencies can quickly move to implement BMPs in parks and other public lands
4. Sub-Watershed Planning : The plan emphasizes the importance of sub-watershed plans, especially for the three impaired sub-watersheds, Kiefer Creek, Fishpot Creek and Grand Glaize Creek.
5. Public Awareness and Education : The East West Gateway hosted public meetings to raise awareness about water quality issues in the area. The EWG also plans to develop informational brochures, and to provide a framework to its partners in the Meramec River Tributary Alliance (MRTA) for future action.
4
Water Quality Assessment: Bacteria
Water Quality Standards & ImpairmentWater quality standards are the biological and chemical criteria required to support a given designated use. Waters protected under the Clean Water Act, known as Waters of the United States , are assigned designated uses. Designated uses in Missouri include supporting aquatic life, recreational use, irrigation, livestock watering, wildlife, industrial processes, and source drinking water. Each of these uses is accompanied by a set of science based numeric criteria that are used to determine if a Water of the United States is capable of supporting the uses assigned to it. Numeric standards have been developed to determine which waters of the US are impaired based on monitoring data collected primarily by regulatory and scientific agencies as well as regulated entities. The Missouri numeric water quality standards for bacteria concentrations to protect recreational uses are as follows:
Pollutant (/100 mL) WBC-A WBC-B SCRE. coli Bacteria** 126 206 1134**Geometric mean during the recreational season in waters designated for recreation or at any time in losing streams. The recreational season is from April 1 to October 31.WBC – Whole Body Contact RecreationSCR – Secondary Contact Recreation
Under the Clean Water Act, an impaired waterway is one that is “too polluted or otherwise degraded to meet the water quality standards set by states, territories or authorized tribes.” Under section 303(d) of the Clean Water Act, states, territories, and authorized tribes are required to develop lists of impaired waters. These are waters that are too polluted or otherwise degraded to meet the water quality standards set by states, territories, or authorized tribes. The law requires that these jurisdictions establish priority rankings for waters on the lists and develop TMDLs for these waters. A Total Maximum Daily Load, or TMDL, is a calculation of the maximum amount of a pollutant that a water body can receive and still safely meet water quality standards.In 2010 Kiefer Creek was added to the 303(d) List of Impaired Waters of Missouri due to high levels of bacteria that violate the numeric criteria for Whole Body Contact Recreational Use B.
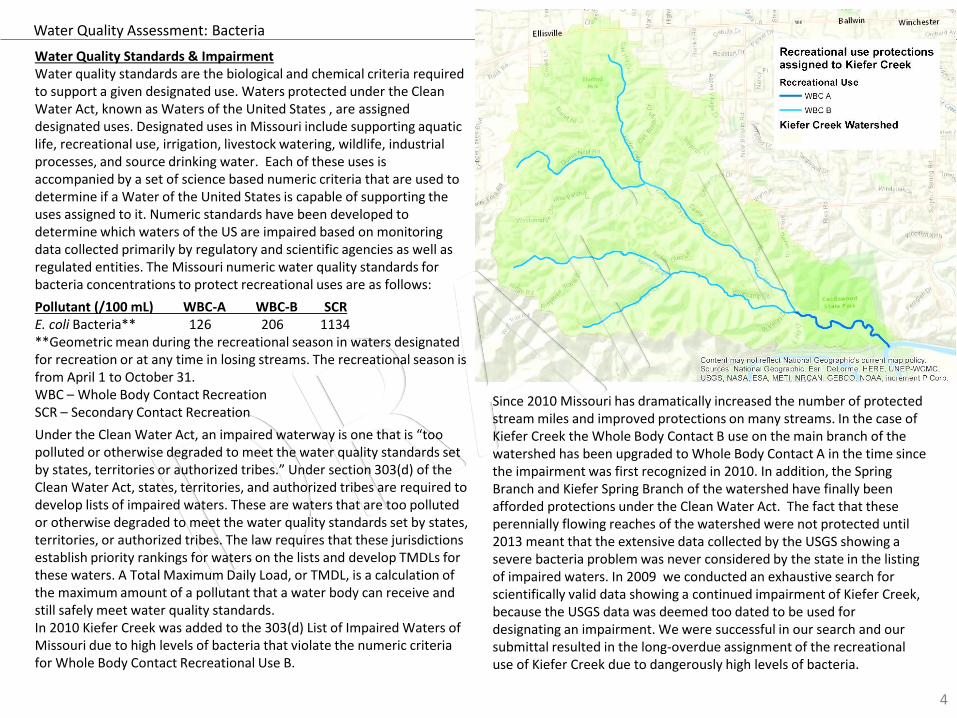
Since 2010 Missouri has dramatically increased the number of protected stream miles and improved protections on many streams. In the case of Kiefer Creek the Whole Body Contact B use on the main branch of the watershed has been upgraded to Whole Body Contact A in the time since the impairment was first recognized in 2010. In addition, the Spring Branch and Kiefer Spring Branch of the watershed have finally been afforded protections under the Clean Water Act. The fact that these perennially flowing reaches of the watershed were not protected until 2013 meant that the extensive data collected by the USGS showing a severe bacteria problem was never considered by the state in the listing of impaired waters. In 2009 we conducted an exhaustive search for scientifically valid data showing a continued impairment of Kiefer Creek, because the USGS data was deemed too dated to be used for designating an impairment. We were successful in our search and our submittal resulted in the long-overdue assignment of the recreational use of Kiefer Creek due to dangerously high levels of bacteria.
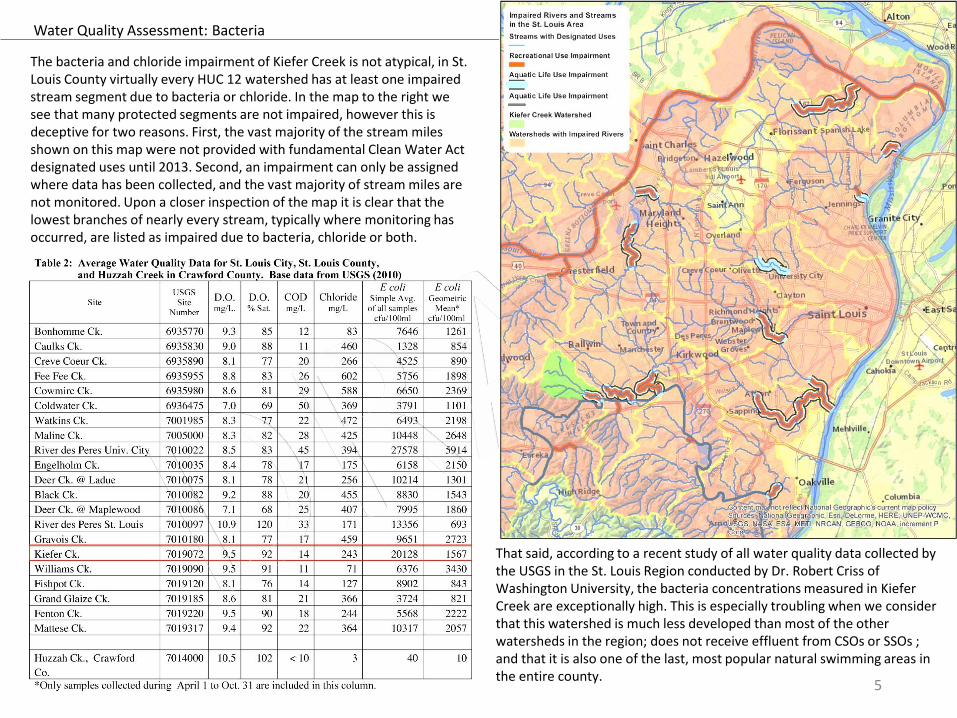
The bacteria and chloride impairment of Kiefer Creek is not atypical, in St. Louis County virtually every HUC 12 watershed has at least one impaired stream segment due to bacteria or chloride. In the map to the right we see that many protected segments are not impaired, however this is deceptive for two reasons. First, the vast majority of the stream miles shown on this map were not provided with fundamental Clean Water Act designated uses until 2013. Second, an impairment can only be assigned where data has been collected, and the vast majority of stream miles are not monitored. Upon a closer inspection of the map it is clear that the lowest branches of nearly every stream, typically where monitoring has occurred, are listed as impaired due to bacteria, chloride or both.
That said, according to a recent study of all water quality data collected by the USGS in the St. Louis Region conducted by Dr. Robert Criss of Washington University, the bacteria concentrations measured in Kiefer Creek are exceptionally high. This is especially troubling when we consider that this watershed is much less developed than most of the other watersheds in the region; does not receive effluent from CSOs or SSOs ; and that it is also one of the last, most popular natural swimming areas in the entire county.
5
Water Quality Assessment: Bacteria
Water Quality Assessment : Bacteria
6
USGS MSD
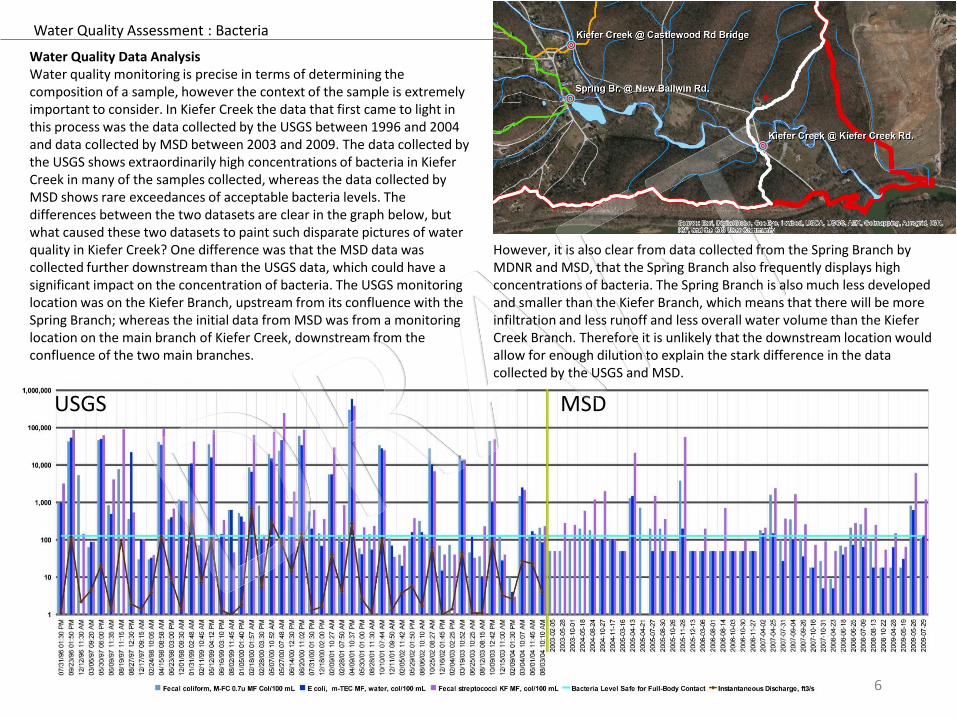
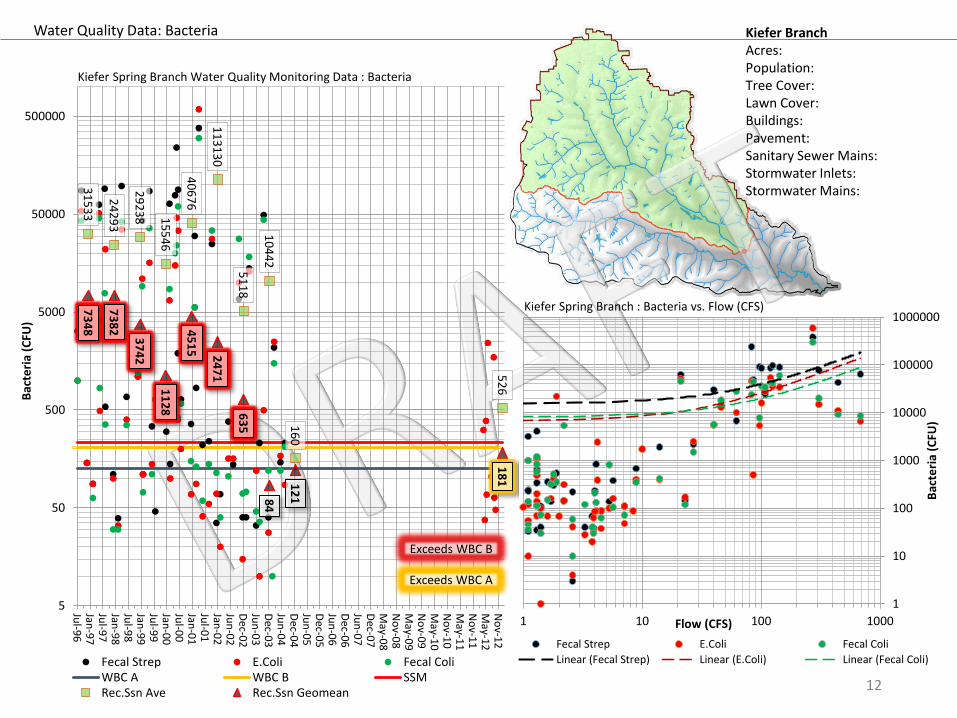
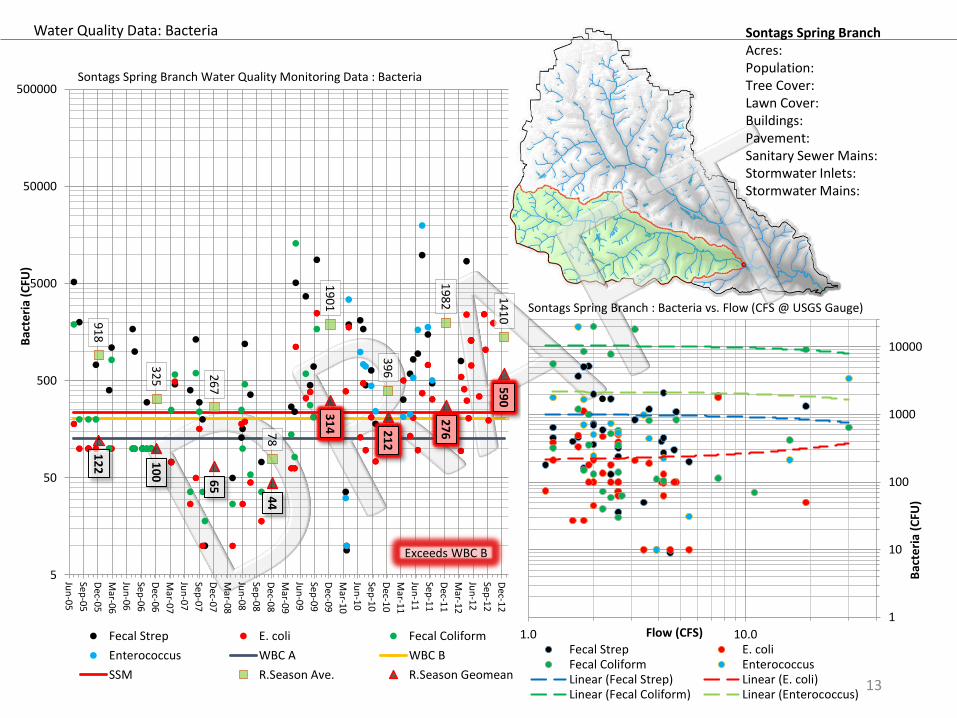
Water Quality Data AnalysisWater quality monitoring is precise in terms of determining the composition of a sample, however the context of the sample is extremely important to consider. In Kiefer Creek the data that first came to light in this process was the data collected by the USGS between 1996 and 2004 and data collected by MSD between 2003 and 2009. The data collected by the USGS shows extraordinarily high concentrations of bacteria in Kiefer Creek in many of the samples collected, whereas the data collected by MSD shows rare exceedances of acceptable bacteria levels. The differences between the two datasets are clear in the graph below, but what caused these two datasets to paint such disparate pictures of water quality in Kiefer Creek? One difference was that the MSD data was collected further downstream than the USGS data, which could have a significant impact on the concentration of bacteria. The USGS monitoring location was on the Kiefer Branch, upstream from its confluence with the Spring Branch; whereas the initial data from MSD was from a monitoring location on the main branch of Kiefer Creek, downstream from the confluence of the two main branches.
However, it is also clear from data collected from the Spring Branch by MDNR and MSD, that the Spring Branch also frequently displays high concentrations of bacteria. The Spring Branch is also much less developed and smaller than the Kiefer Branch, which means that there will be more infiltration and less runoff and less overall water volume than the Kiefer Creek Branch. Therefore it is unlikely that the downstream location would allow for enough dilution to explain the stark difference in the data collected by the USGS and MSD.

Having ruled out the location of the samples as the primary factor effecting the differences in bacteria concentrations we looked to another likely culprit, precipitation. Precipitation is the source of every watershed, without rain watersheds would not exist, however it can also be the driving force behind the delivery of pollution to a stream channel. In order to study the relationship between the bacteria levels measured in Kiefer Creek and precipitation in the watershed, we compared stream flow measurements from the USGS flow monitoring station in the watershed at the times when samples were collected. This analysis shows a strong correlation between flow (cubic feet per second) and bacteria level and provides a sound explanation for the differences in the data collected by the USGS and MSD.
Water Quality Assessment: Bacteria
7
Date ID CFS E.ColiTotal
Bacteria
7/9/08 MSD 5.6 700 1024
5/29/02 USGS 5.7 160 645
4/6/10 MSD 5.8 27 47
4/2/07 MSD 7 210 540
2/11/99 USGS 7.1 110 292
5/18/04 MSD 7.3 600 800
5/8/12 MSD 7.6 3500 4390
10/27/04 MSD 8.3 2000 2200
10/6/09 MSD 8.4 18000 32610
6/23/98 USGS 8.9 400 1430
4/21/05 MSD 9.9 771
4/25/07 MSD 11 2400 4150
6/14/00 USGS 14 400 2720
4/5/11 MSD 15 1500 1821
4/13/05 MSD 17 21000 23800
5/30/97 USGS 21.1 51000 159000
6/1/04 USGS 23 170 436
3/4/04 USGS 27 2500 6170
4/26/10 MSD 29 1710 3210
2/9/01 USGS 40 5600 41200
3/19/03 USGS 46 13000 45300
10/25/02 USGS 62 10000 44800
5/27/00 USGS 83 46000 310000
10/9/03 USGS 86 499 93499
8/19/97 USGS 97 5400 104200
5/12/99 USGS 101 16000 138000
10/10/01 USGS 108 28000 86800
9/23/96 USGS 120 54000 184000
4/15/98 USGS 125 35000 174000
6/20/00 USGS 143 34000 183000
4/9/01 USGS 272 590000 1270000
5/7/00 USGS 306 15000 113000
1/31/99 USGS 444 11000 63200
2/18/00 USGS 685 6600 79200
Date ID CFS E.ColiTotal
Bacteria
10/31/07 MSD 1.9 91 123
10/12/10 MSD 1.9 36 160
10/15/01 MSD 2 545 745
8/14/06 MSD 2 700 800
4/23/08 MSD 2 50 64
7/6/11 MSD 2 340 1046
12/12/96 USGS 2.2 144 5688
8/30/05 MSD 2.2 360 610
8/10/10 MSD 2.2 330 586
4/3/12 MSD 2.2 27 237
7/7/10 MSD 2.4 270 677
6/6/11 MSD 2.4 200 532
5/28/05 MSD 2.4 770
8/13/08 MSD 2.5 250 359
5/30/01 USGS 2.6 41 320
2/9/04 USGS 2.6 4 17
7/26/10 MSD 2.6 600 1147
6/18/08 MSD 2.7 64 174
4/13/10 MSD 2.8 10 20
7/29/09 MSD 3 1200 1442
5/28/03 MSD 3.1 280 330
12/15/03 USGS 3.3 28 188
10/1/03 MSD 3.5 250 350
9/15/10 MSD 3.5 280 636
2/5/02 USGS 3.8 20 129
2/24/98 USGS 3.9 33 102
8/3/04 USGS 4 86 526
5/17/11 MSD 4 100 250
2/28/01 USGS 4.1 88 1060
6/25/08 MSD 4.2 280 563
7/27/05 MSD 4.4 1500 1750
3/6/97 USGS 4.5 88 239
2/28/00 USGS 5.3 100 1060
8/24/04 MSD 5.5 1200 1480
Total BacteriaDate ID CFS E.Coli
12/16/02 USGS 0.97 15 125
10/3/06 MSD 0.97 50 150
8/2/99 USGS 0.98 640 1326
7/30/01 MSD 1 300 400
9/4/07 MSD 1 1650 2100
7/31/96 USGS 1.1 1000 5200
8/28/01 USGS 1.1 55 435
6/25/03 USGS 1.1 120 199
8/12/03 USGS 1.1 10 276
6/9/97 USGS 1.3 490 5426
12/1/98 USGS 1.3 1100 3400
6/16/99 USGS 1.3 140 590
7/31/00 USGS 1.3 200 1420
12/11/01 USGS 1.3 70 219
9/26/07 MSD 1.3 260 406
9/7/11 MSD 1.3 100 162
12/17/97 USGS 1.4 100 240
2/4/03 USGS 1.4 1 114
7/31/07 MSD 1.5 370 497
6/6/12 MSD 1.5 200 285
12/18/00 USGS 1.6 69 579
7/10/01 MSD 1.6 100 150
10/4/11 MSD 1.6 82 197
8/6/02 USGS 1.7 160 618
8/25/09 MSD 1.7 490 1006
9/16/09 MSD 1.7 360 1192
1/5/00 USGS 1.8 420 1240
10/26/05 MSD 1.8 50 100
10/16/07 MSD 1.8 73 109
10/22/08 MSD 1.8 54 90
8/2/11 MSD 1.8 200 479
8/27/97 USGS 1.9 22000 22895
8/1/06 MSD 1.9 50 150
High Low
CFS
USGS Tests 1996-2004
E. coli Ave
Total Bacteria
Ave
MSD Tests 2001-2012
E. coli Ave
Total Bacteria Average
0-1 2 328 242 3 75 331
1-2 15 1729 952 19 218 146
2-3 3 63 669 10 331 218
3-4 4 42 78 4 228 157
4-5 2 88 217 2 890 386
5-7.5 3 123 222 5 547 299
7.5-10 1 400 477 4 7833 3997
10–15 1 400 906 2 1950 995
15–25 2 25585 26573 1 21000 7933
25-50 3 7033 10297 1 1710 1605
50-100 4 15475 46042
100-200 5 33400 51053
200 < 4 155650 127116
49 18486 20373 51 3478 1607

0.1
1
10
100
1 2 3 4 5 6 7 8 9 10 11 12 13 14 15 16 17 18 19 20 21 22 23 24 25 26 27 28 29 30 31
Higher Samples
12/1/98 8/27/97 6/14/00 5/30/97 5/27/00 4/9/01
8
Lower Samples Higher Samples
Date 12
/16
/02
8/1
2/0
3
2/4
/03
2/9
/04
6/1
/04
10
/9/0
3
12
/1/9
8
8/2
7/9
7
6/1
4/0
0
5/3
0/9
7
5/2
7/0
0
4/9
/01
E.Coli 15 10 1 4 170 499 1100 22000 400 51000 46000 590000
Fecal Col. 70 36 73 10 120 44000 1200 355 420 45500 24000 300000
Fecal Str. 40 230 40 3 146 49000 1100 540 1900 62500 240000 380000
Total Bacteria 125 276 114 17 436 93499 3400 22895 2720 159000 310000 1270000
CFS 0.97 1.1 1.4 2.6 23 86 1.3 1.9 14 21.1 83 272
Water Quality Assessment: Bacteria
The USGS samples were collected during a wider range of hydrologic conditions in Kiefer Creek, the data collected by MSD was primarily collected during low and normal flow conditions. The comparison of these datasets also rendered some interesting variations in the overall pattern that we decided to look into further. by studying the flow characteristics leading up to tests that showed either higher and lower bacteria levels relative to flow.
To analyze the flow trends for high and low variations from above in the following graphs contain the mean daily CFS data from the USGS for the CFS at the time of the sample (1) and the 30 days prior to the sample.
In the graphs it is notable that most of the flow trends on the low variation graph show a falling flow, while most of the flow trends on the high variation graph show a rising flow. The low variation sample with the highest bacteria concentration shows an increasing flow and the high variation sample with the lowest bacteria concentrations shows a decreasing flow. The trend based on this subset of the sampling data appears to reinforce the connection between flow and bacteria concentration. This analysis also helps to understand when Kiefer Creek is the least safe for recreation. Lower bacteria concentrations seem to prevail when the flow has remained low and stable for more than 6 days, while higher bacteria concentrations are found when flow has increased in the 6 days leading up to the test.
To enhance this analysis, the study was expanded to incorporate the precipitation data leading up to and on the sample dates. This analysis was conducted on the data collected by the USGS on the Kiefer Spring Branch and MSD on the Kiefer Main Branch between 1996 and 2009. Precipitation data was collected primarily from records provided by MSD, which were available as far back as the last quarter of 1998, for earlier samples historical data from the weather station south of Lambert Airport were collected from the website wunderground.com were used. In the following table the rainfall has been tracked not only on the day of the test, but also on the 5 days preceding when the sample was taken, in order to better understand the duration of high bacteria concentrations.
0.1
1
10
100
1 2 3 4 5 6 7 8 9 10 11 12 13 14 15 16 17 18 19 20 21 22 23 24 25 26 27 28 29 30 31
Lower Samples
12/16/02 8/12/03 2/4/03 2/9/04 6/1/04 10/9/03

Bacteria CFU
Total Bact. CFU
Precip .01-.5 .5-1 1-1.5 1.5-2 2-3 3-4 4+
Mean Daily CFSE. coli
Fecal Coli.
Fecal Strep.
Day of Test
Rainfall in. by days before test
6-Day Total
Inst. CFSEntity Date 1 2 3 4 5
USGS 4/9/01 590000 300000 381000 1271000 2.17 0 0 0 0 0 2.17 274 19
USGS 5/27/00 46000 24000 244000 314000 1.4 1.52 0.1 0 0.14 0.35 3.51 83 34
USGS 9/23/96 54000 43000 87000 184000 1.23 0 0 0 0 0 1.23 120 65
USGS 6/20/00 34000 60000 89000 183000 0.87 0 0 0.5 1.14 0 2.51 143 9.2
USGS 4/15/98 35000 42000 97000 174000 0.51 0 0.74 0 0 0 1.25 125 31
USGS 5/30/97 50000 46000 62500 158500 0.67 0 0.02 0.04 0.6 0.62 1.95 21 6.7
USGS 5/12/99 16000 36000 86000 138000 2.23 0.11 0 0 0 0 2.34 101 22
USGS 5/7/00 15000 20000 78000 113000 4.45 0.25 0.04 0 0 0.33 5.07 306 251
USGS 8/19/97 7800 91000 98800 1.25 0 0.35 0 0.9 0.06 2.56 97 22
USGS 10/9/03 1000 44000 49000 94000 0.65 0 0 0 0 0 0.65 86 21
USGS 10/10/01 28000 34000 24800 86800 1.67 0 0 0 0.01 1.03 2.71 108 19
USGS 2/18/00 6600 8600 64000 79200 1.04 0.56 0 0 0 0.29 1.89 685 76
USGS 1/31/99 11000 9200 43000 63200 0.52 1.15 0 0.08 0 0 1.75 444 35
MSD 11/28/05 200 3800 56000 60000 1.06 0.85 0 0 0 0 1.91 35 44
USGS 3/19/03 13000 18000 14000 45000 0.99 0.05 0 0 0 0 1.04 46 20
USGS 10/25/02 10000 28000 6800 44800 0.63 0 0 0 0 0 0.63 62 12
USGS 2/9/01 5600 5600 29500 40700 0.72 0 0 0.53 0 0 1.25 40 9.5
MSD 10/6/09 9210 5400 18000 32610 0.44 0 0 0 0.01 0.84 1.29 17 8.4
MSD 4/13/05 1500 1300 21000 23800 0.16 0.93 0.45 0 0 0 1.54 18 17
USGS 8/27/97 22000 360 540 22900 0 0.06 0 0 0 0 0.06 1.9 1.6
MSD 5/26/09 620 820 6100 7540 0.13 1.25 0.06 0.05 0 0 1.49 9.6 12
USGS 3/4/04 1500 2500 2170 6170 0.78 0.61 0 0 0.06 0 1.45 27 29
USGS 12/12/96 5400 144 5544 0.02 0 0 0 0 0 0.02 2.2 2.3
USGS 6/9/97 490 840 4100 5430 0 0.02 0 0.09 0 0 0.11 1.3 1.2
USGS 7/31/96 1000 1000 3200 5200 0 0.01 0.91 1.78 0.02 0 2.72 1.1 1.2
MSD 4/25/07 150 1600 2400 4150 0.22 0.49 0 0 0 0 0.71 12 11
USGS 12/1/98 1100 1200 1120 3420 0 0.23 0 0 0 0 0.23 1.3 1.4
USGS 6/14/00 400 420 1940 2760 0.06 0.01 0.58 0.44 0 0 1.09 14 5.7
MSD 10/27/04 100 100 2000 2200 0.05 0.45 0 0 0.21 0 0.71 9.1 8.3
MSD 9/4/07 100 350 1650 2100 0 0 0 0 0 0 0 0.8 1
MSD 7/27/05 50 200 1500 1750 0 0.32 0 0 0 0 0.32 5.5 4.4
MSD 8/24/04 100 180 1200 1480 0 0.3 0 0 0.52 0.18 1 5.2 5.5
MSD 7/29/09 132 110 1200 1442 0.17 0 0 0.05 0 0.13 0.35 2.6 3
USGS 6/23/98 400 350 680 1430 0 0.01 1.39 0.49 0 0.01 1.9 8.9 8.7
USGS 7/31/00 200 580 640 1420 0 0 0.67 0.74 0 0 1.41 1.3 1.8
USGS 8/2/99 640 640 46 1326 0 0 0 0 0 0 0 0.98 1.2
USGS 1/5/00 420 520 304 1244 0 0 0.52 0 0 0 0.52 1.8 1.9
MSD 9/16/09 602 230 360 1192 0 0.13 0 0 0 0 0.13 1.5 1.7
USGS 2/28/01 88 130 840 1058 0 0.09 0 0.01 1.23 0.4 1.73 4.1 3.1
USGS 2/28/00 100 820 135 1055 0 0 0 0 0 0 0 5.3 6.3
MSD 7/9/08 64 260 700 1024 0.48 0.16 0 0 0 0 0.64 5.1 5.6
MSD 8/25/09 146 370 490 1006 0 0 0 0 0.01 0.96 0.97 1.6 1.7
MSD 8/14/06 50 50 700 800 0 0 0 0 0.19 0.37 0.56 1.8 2
MSD 5/18/04 200 600 800 0 0 0 0 0.42 1.08 1.5 2.6 7.3
MSD 4/21/05 720 720 0.43 0.22 0 0 0 0 0.65 13 9.9
Bacteria CFU
Total Bact. CFU
Precip .01-.5 .5-1 1-1.5 1.5-2 2-3 3-4 4+
Mean Daily CFSE. coli
Fecal Coli.
Fecal Strep.
Day of Test
Rainfall in. by days before test
6-Day Total
Inst. CFSEntity Date 1 2 3 4 5
USGS 5/29/02 160 100 380 640 0 0.06 0 0.01 0 0.08 0.15 5.7 5
USGS 8/6/02 160 320 138 618 0.11 0 0 0 0 0 0.11 1.7 1.8
MSD 8/30/05 50 200 360 610 0 0 0 0 0.51 1.01 1.52 2.57 2.2
USGS 6/16/99 140 110 340 590 0 0 0 0 0 0 0 1.3 1.1
USGS 12/18/00 69 150 356 575 0 0.01 0.08 0.14 0.07 0.09 0.39 1.6 2.1
MSD 6/25/08 73 210 280 563 0 0.05 0 0.11 0.02 0.15 0.33 2.4 2.5
MSD 4/2/07 150 180 210 540 0 0 0.01 0.01 0 0.03 0.05 7.2 7
USGS 8/3/04 86 210 230 526 0 0 0 0 2.26 0 2.26 4 4
MSD 7/31/07 27 100 370 497 0 0 0 0 0 0 0 1.3 1.5
USGS 6/1/04 170 120 146 436 0.01 0.1 0.18 0 0.01 0.08 0.38 23 14
USGS 8/28/01 55 140 235 430 0.01 0 0 0 0 0 0.01 1.1 1.1
MSD 9/26/07 36 110 260 406 0 0.01 0.01 0 0.01 0 0.03 1.4 1.3
MSD 8/13/08 18 91 250 359 0 0 0 0 0 0 0 2.4 2.5
MSD 10/1/03 100 250 350 0.01 0 0.01 0.02 0.01 0.01 0.06 3.5 3.5
MSD 5/28/03 50 280 330 0 0 0.01 1.22 0.29 0 1.52 2.8 3.1
USGS 5/30/01 41 59 215 315 0 0 0 0 0.03 0.23 0.26 2.6 4.6
MSD 11/17/04 100 100 100 300 0 0 0 0 0 0 0 2.8 2.8
MSD 3/6/06 50 50 200 300 0.05 0.26 0 0 0 0 0.31 2 2.1
USGS 2/11/99 110 72 110 292 0 0 0 0 1.65 1.28 2.93 7.1 11
USGS 8/12/03 10 36 230 276 0 0 0 0 0 0 0 1.1 0.99
USGS 3/6/97 88 63 88 239 0 0.02 0 0 0 0.12 0.14 4.5 4.5
USGS 12/17/97 100 30 106 236 0 0 0 0 0 0 0 1.4 1.4
MSD 4/28/09 63 18 150 231 0 0.2 0 0 0 0 0.2 4.5 4.8
USGS 12/11/01 70 110 35 215 0 0 0 0 0 0.01 0.01 1.3 1.3
MSD 10/30/06 50 50 100 200 0 0 0 0.79 0.52 0.41 1.72 1.7 1.6
USGS 6/25/03 120 46 33 199 0 0 0 0 0 0 0 1.1 13
USGS 12/15/03 28 120 40 188 0 0 0.07 0 0 0.13 0.2 3.3 2.9
MSD 6/18/08 40 70 64 174 0 0 0 0 0 0.21 0.21 5.1 5.6
MSD 3/16/05 50 50 50 150 0 0 0 0 0 0 0 2 1.6
MSD 10/26/05 50 50 50 150 0.01 0 0 0.01 0 0 0.02 1.7 1.8
MSD 12/13/05 50 50 50 150 0 0 0.01 0.09 0 0 0.1 1.8 1.7
MSD 8/1/06 50 50 50 150 0 0 0 0.2 0 0 0.2 2 1.9
MSD 10/3/06 50 50 50 150 0 0.01 0 0.01 0 0.01 0.03 0.92 0.97
MSD 11/27/06 50 50 50 150 0 0 0 0 0 0 0 1.8 1.9
USGS 2/5/02 20 40 69 129 0 0 0 0 0 1.08 1.08 3.8 4
USGS 12/16/02 15 70 40 125 0 0 0 0.05 0 0 0.05 0.97 1.5
MSD 10/31/07 5 27 91 123 0.01 0.03 0.25 0 0 0.01 0.3 2 1.9
USGS 2/4/03 1 73 40 114 0 0.02 0 0 0.08 0 0.1 1.4 1.5
MSD 5/19/09 31 18 64 113 0 0 0 0.03 1.05 0.02 1.1 2.4 2.5
MSD 10/16/07 18 18 73 109 0 0.01 0.01 0 0.01 0 0.03 1.8 1.8
USGS 2/24/98 33 30 39 102 0 0 0 0 0 0.02 0.02 3.9 3.7
MSD 2/5/03 50 50 100 0 0 0.02 0 0 0.08 0.1 1.3 1.3
MSD 10/22/08 18 18 54 90 0.09 0 0 0 0 0 0.09 1.8 1.8
MSD 4/23/08 5 9 50 64 0 0.09 0 0 0.05 0.92 1.06 2.2 2
USGS 2/9/04 10 4 3 17 0 0 0 0 0.11 0 0.11 2.6 3
9
10
Water Quality Data: Bacteria
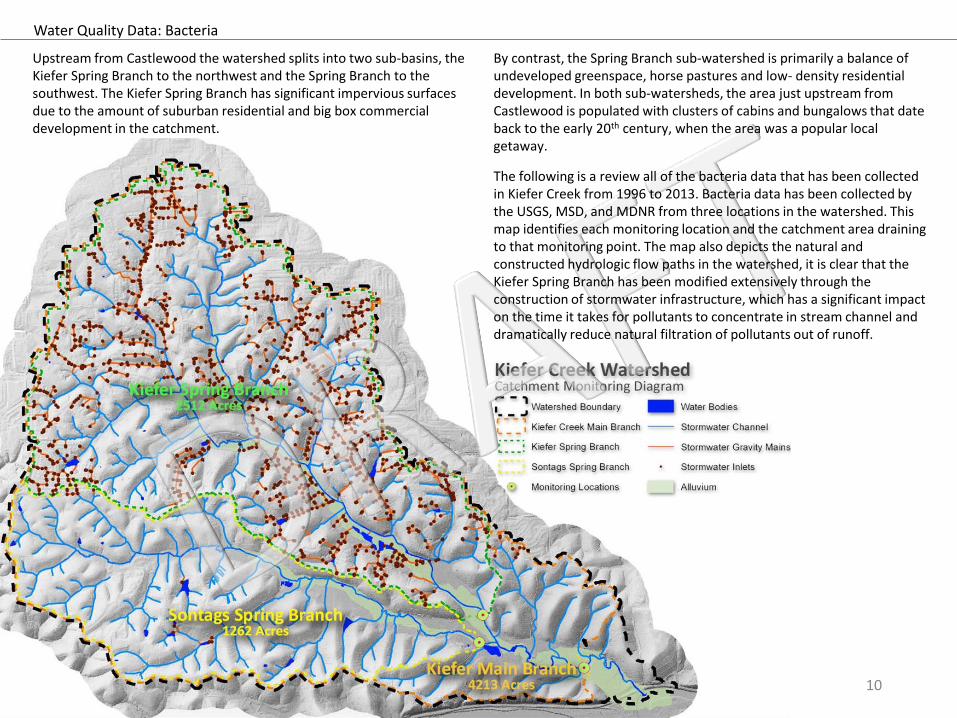
Upstream from Castlewood the watershed splits into two sub-basins, the Kiefer Spring Branch to the northwest and the Spring Branch to the southwest. The Kiefer Spring Branch has significant impervious surfaces due to the amount of suburban residential and big box commercial development in the catchment.
By contrast, the Spring Branch sub-watershed is primarily a balance of undeveloped greenspace, horse pastures and low- density residential development. In both sub-watersheds, the area just upstream from Castlewood is populated with clusters of cabins and bungalows that date back to the early 20th century, when the area was a popular local getaway.
The following is a review all of the bacteria data that has been collected in Kiefer Creek from 1996 to 2013. Bacteria data has been collected by the USGS, MSD, and MDNR from three locations in the watershed. This map identifies each monitoring location and the catchment area draining to that monitoring point. The map also depicts the natural and constructed hydrologic flow paths in the watershed, it is clear that the Kiefer Spring Branch has been modified extensively through the construction of stormwater infrastructure, which has a significant impact on the time it takes for pollutants to concentrate in stream channel and dramatically reduce natural filtration of pollutants out of runoff.

11
Kiefer Creek Water Quality Monitoring Data : Bacteria
Kiefer Creek : Bacteria vs. Flow (CFS)
216170
560
1853
122
442
126
1899
309214
819
100 99
50
75
26
254
8062
251
5
50
500
5000
50000
500000
Jun
-01
Dec-0
1
Jun
-02
No
v-02
May-0
3
No
v-03
May-0
4
No
v-04
May-0
5
No
v-05
May-0
6
No
v-06
May-0
7
No
v-07
May-0
8
Oct-0
8
Ap
r-09
Oct-0
9
Ap
r-10
Oct-1
0
Ap
r-11
Oct-1
1
Ap
r-12
Oct-1
2
Bac
teri
a (C
FU)
Fecal Strep E. coli Fecal ColiformEnterococcus WBC A WBC BSSM Total Rec.Ssn Average E.coli Rec.Ssn Geomean
1
10
100
1000
10000
100000
1 10Fecal Strep E. coliFecal Coliform EnterococcusLinear (Fecal Strep) Linear (E. coli)Linear (Fecal Coliform) Linear (Enterococcus)
Kiefer CreekAcres:Population:Tree Cover:Lawn Cover:Buildings:Pavement:Sanitary Sewer Mains:Stormwater Inlets:Stormwater Mains:
Water Quality Data: Bacteria
31
53
3
24
29
3
29
23
8 15
54
6
40
67
6
11
31
30
51
18
10
44
2
16
0
52
6
73
48
73
82
37
42
11
28
45
15 2
47
1
63
5
84
12
1
18
1
5
50
500
5000
50000
500000
Jul-9
6Jan
-97
Jul-9
7Jan
-98
Jul-9
8Jan
-99
Jul-9
9Jan
-00
Jul-0
0Jan
-01
Jul-0
1Jan
-02
Jun
-02
Dec-0
2Ju
n-0
3D
ec-03
Jun
-04
Dec-0
4Ju
n-0
5D
ec-05
Jun
-06
Dec-0
6Ju
n-0
7D
ec-07
May-0
8N
ov-0
8M
ay-09
No
v-09
May-1
0N
ov-1
0M
ay-11
No
v-11
May-1
2N
ov-1
2
Bac
teri
a (C
FU)
Fecal Strep E.Coli Fecal ColiWBC A WBC B SSMRec.Ssn Ave Rec.Ssn Geomean
Exceeds WBC B
Exceeds WBC A
12
Kiefer Spring Branch Water Quality Monitoring Data : Bacteria
1
10
100
1000
10000
100000
1000000
1 10 100 1000
Bac
teri
a (C
FU)
Flow (CFS)
Fecal Strep E.Coli Fecal Coli
Linear (Fecal Strep) Linear (E.Coli) Linear (Fecal Coli)
Kiefer Spring Branch : Bacteria vs. Flow (CFS)
Kiefer BranchAcres:Population:Tree Cover:Lawn Cover:Buildings:Pavement:Sanitary Sewer Mains:Stormwater Inlets:Stormwater Mains:
Water Quality Data: Bacteria
91
8
32
5 26
7
78
19
01
39
6
19
82 14
10
12
2 10
0 65
44
31
4 21
2
27
6
59
0
5
50
500
5000
50000
500000
Jun
-05
Sep-0
5
Dec-0
5
Mar-06
Jun
-06
Sep-0
6
Dec-0
6
Mar-07
Jun
-07
Sep-0
7
Dec-0
7
Mar-08
Jun
-08
Sep-0
8
Dec-0
8
Mar-09
Jun
-09
Sep-0
9
Dec-0
9
Mar-10
Jun
-10
Sep-1
0
Dec-1
0
Mar-11
Jun
-11
Sep-1
1
Dec-1
1
Mar-12
Jun
-12
Sep-1
2
Dec-1
2
Bac
teri
a (C
FU)
Fecal Strep E. coli Fecal Coliform
Enterococcus WBC A WBC B
SSM R.Season Ave. R.Season Geomean13
Sontags Spring Branch Water Quality Monitoring Data : Bacteria
Sontags Spring Branch : Bacteria vs. Flow (CFS @ USGS Gauge)
Sontags Spring BranchAcres:Population:Tree Cover:Lawn Cover:Buildings:Pavement:Sanitary Sewer Mains:Stormwater Inlets:Stormwater Mains:
1
10
100
1000
10000
1.0 10.0
Bac
teri
a (C
FU)
Flow (CFS)
Fecal Strep E. coliFecal Coliform EnterococcusLinear (Fecal Strep) Linear (E. coli)Linear (Fecal Coliform) Linear (Enterococcus)
Exceeds WBC B
Water Quality Data: Bacteria
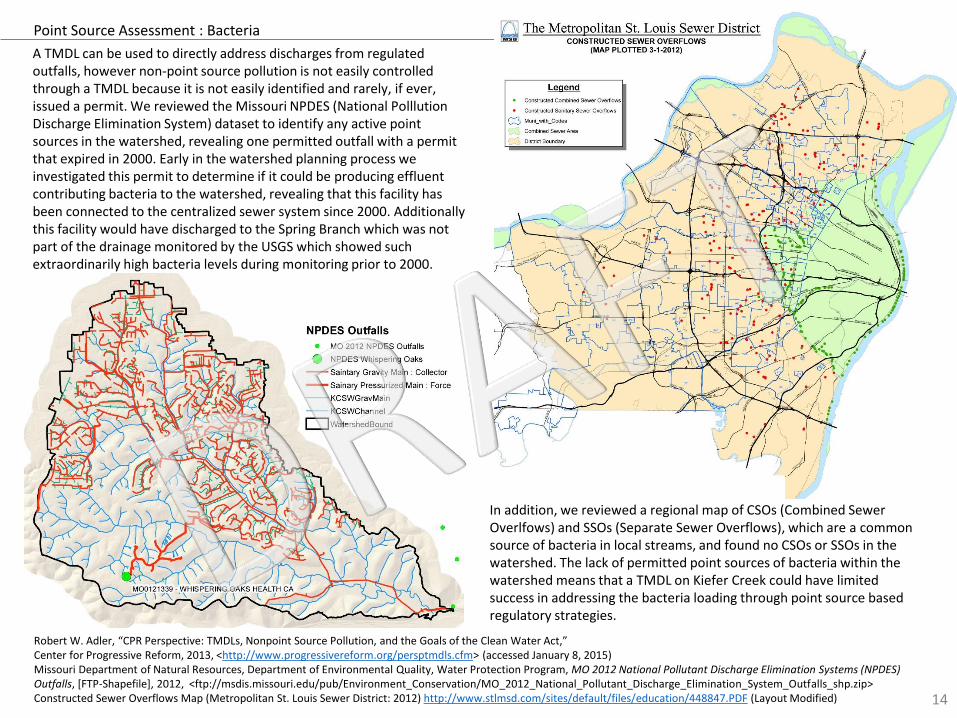
A TMDL can be used to directly address discharges from regulated outfalls, however non-point source pollution is not easily controlled through a TMDL because it is not easily identified and rarely, if ever, issued a permit. We reviewed the Missouri NPDES (National PolllutionDischarge Elimination System) dataset to identify any active point sources in the watershed, revealing one permitted outfall with a permit that expired in 2000. Early in the watershed planning process we investigated this permit to determine if it could be producing effluent contributing bacteria to the watershed, revealing that this facility has been connected to the centralized sewer system since 2000. Additionally this facility would have discharged to the Spring Branch which was not part of the drainage monitored by the USGS which showed such extraordinarily high bacteria levels during monitoring prior to 2000.
In addition, we reviewed a regional map of CSOs (Combined Sewer Overlfows) and SSOs (Separate Sewer Overflows), which are a common source of bacteria in local streams, and found no CSOs or SSOs in the watershed. The lack of permitted point sources of bacteria within the watershed means that a TMDL on Kiefer Creek could have limited success in addressing the bacteria loading through point source based regulatory strategies.
Robert W. Adler, “CPR Perspective: TMDLs, Nonpoint Source Pollution, and the Goals of the Clean Water Act,” Center for Progressive Reform, 2013, <http://www.progressivereform.org/persptmdls.cfm> (accessed January 8, 2015)Missouri Department of Natural Resources, Department of Environmental Quality, Water Protection Program, MO 2012 National Pollutant Discharge Elimination Systems (NPDES) Outfalls, [FTP-Shapefile], 2012, <ftp://msdis.missouri.edu/pub/Environment_Conservation/MO_2012_National_Pollutant_Discharge_Elimination_System_Outfalls_shp.zip>Constructed Sewer Overflows Map (Metropolitan St. Louis Sewer District: 2012) http://www.stlmsd.com/sites/default/files/education/448847.PDF (Layout Modified) 14
Point Source Assessment : Bacteria
15
U.S. Census Bureau, MO 2010 TIGER Census Tracts, [FTP-Shapefile], 2010, <ftp://msdis.missouri.edu/pub/Administrative_Political_Boundaries/MO_2010_TIGER_Census_Tracts_shp.zip>AVMA , U.S. Pet Ownership Statistics: Pet Calculator, 2015, <https://www.avma.org/KB/Resources/Statistics/Pages/Market-research-statistics-US-pet-ownership.aspx>Donald H. Wilkison and Jerri V. Davis, U.S. Department of the interior, U.S. Geological Survey, Occurrence and Sources of Escherichia coli in Metropolitan St. Louis Streams, October 2004 through September 2007, Scientific Investigations Report 2010-5150 (Reston, VA: U.S. Geological Survey, 2010), 28, Figure 12.Criss, Water Quality Report for Small Streams of the St. Louis Area, 3.
Non-Point Source Assessment : Bacteria : Pet Waste
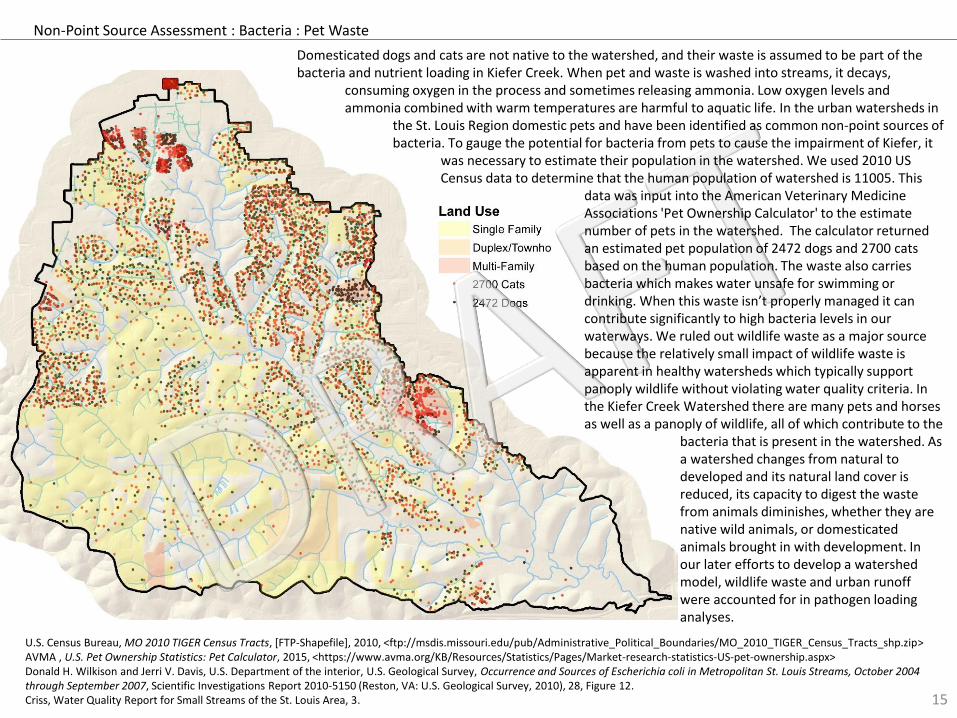
Domesticated dogs and cats are not native to the watershed, and their waste is assumed to be part of the bacteria and nutrient loading in Kiefer Creek. When pet and waste is washed into streams, it decays,
consuming oxygen in the process and sometimes releasing ammonia. Low oxygen levels and ammonia combined with warm temperatures are harmful to aquatic life. In the urban watersheds in
the St. Louis Region domestic pets and have been identified as common non-point sources of bacteria. To gauge the potential for bacteria from pets to cause the impairment of Kiefer, it
was necessary to estimate their population in the watershed. We used 2010 US Census data to determine that the human population of watershed is 11005. This
data was input into the American Veterinary Medicine Associations 'Pet Ownership Calculator' to the estimate number of pets in the watershed. The calculator returned an estimated pet population of 2472 dogs and 2700 cats based on the human population. The waste also carries bacteria which makes water unsafe for swimming or drinking. When this waste isn’t properly managed it can contribute significantly to high bacteria levels in our waterways. We ruled out wildlife waste as a major source because the relatively small impact of wildlife waste is apparent in healthy watersheds which typically support panoply wildlife without violating water quality criteria. In the Kiefer Creek Watershed there are many pets and horses as well as a panoply of wildlife, all of which contribute to the
bacteria that is present in the watershed. As a watershed changes from natural to developed and its natural land cover is reduced, its capacity to digest the waste from animals diminishes, whether they are native wild animals, or domesticated animals brought in with development. In our later efforts to develop a watershed model, wildlife waste and urban runoff were accounted for in pathogen loading analyses.
Pet & Wildlife Waste Cleanup - The more frequently and thoroughly animal waste is removed from mown lawns and other impervious surfaces, the less likely it is to contaminate local waters. Cleanup of domestic animal waste before rain events is the most effective way to prevent waste from washing into the creek. Landowners could make an additional impact by periodically cleaning up wildlife waste from yards and impervious surfaces. When native wildlife defecates on a non-native mown lawn, sidewalk or driveway there is the potential for this waste to be carried quickly through the stormwater system and into the stream channel by a rain event. Watershed residents should be encouraged to cleanup all waste that they find in non-forested/non-native landscapes, especially in areas where stormwater inlets or flow channels are in close proximity. Waste from both pets and wildlife (geese, turkey, deer, raccoon, coyote, etc.) should be removed from these areas to reduce the transport of bacteria from this source. Implementation of a pet and wildlife waste cleanup project would likely include:• Distribution of information about pet and wildlife waste cleanup to
watershed stakeholders • Encouragement of cleanup with the placement of bag dispensers in
neighborhoodsThese two practices can be combined by creating bag dispensers that are either printed with information about pet and wildlife waste or include a box with fliers on the topic. Although many people in the watershed have yards where most of the waste is likely to be deposited, the placement of bag dispensers with information in neighborhoods will be a good way to remind people why this practice is important and encourage them to do a good job. Pet waste cleanup can also be encouraged by inclusion of information on cleaning up pet waste in municipal and sewer district mailings to residents. Scope of Implementation - Pet waste concentrations are likely to be highest in areas where there are the most people living, these are also the areas with the most intensive stormwater infrastructure capable of delivering all . It makes sense to implement a strategy that focuses on the areas with the greatest density of housing units. This could be achieved by placing informative bag dispensers based on the number of
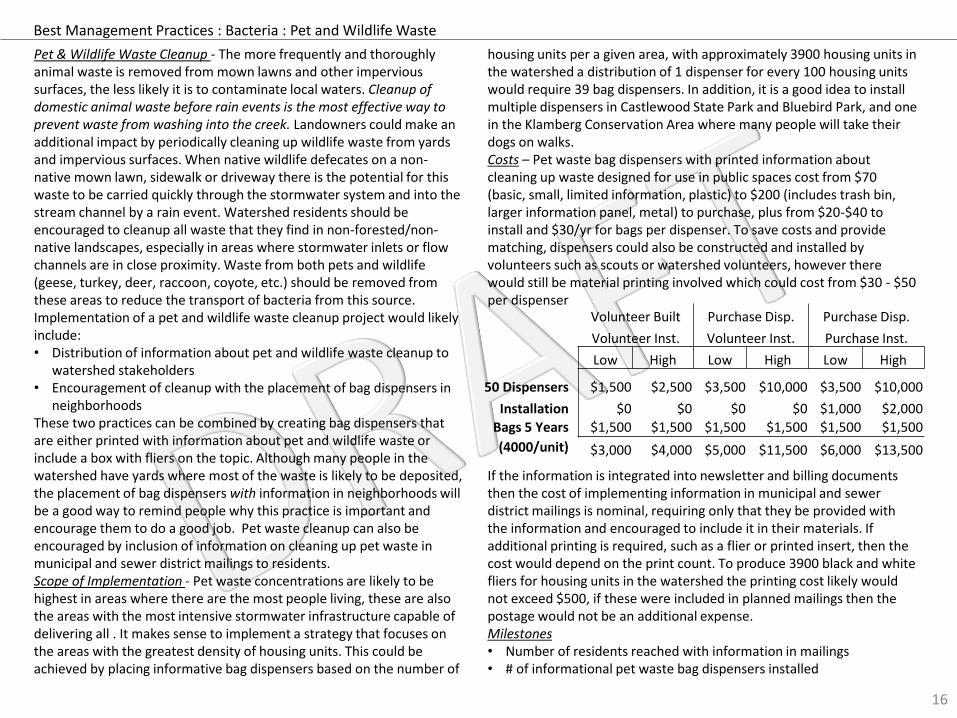
housing units per a given area, with approximately 3900 housing units in the watershed a distribution of 1 dispenser for every 100 housing units would require 39 bag dispensers. In addition, it is a good idea to install multiple dispensers in Castlewood State Park and Bluebird Park, and one in the Klamberg Conservation Area where many people will take their dogs on walks. Costs – Pet waste bag dispensers with printed information about cleaning up waste designed for use in public spaces cost from $70 (basic, small, limited information, plastic) to $200 (includes trash bin, larger information panel, metal) to purchase, plus from $20-$40 to install and $30/yr for bags per dispenser. To save costs and provide matching, dispensers could also be constructed and installed by volunteers such as scouts or watershed volunteers, however there would still be material printing involved which could cost from $30 - $50 per dispenser
If the information is integrated into newsletter and billing documents then the cost of implementing information in municipal and sewer district mailings is nominal, requiring only that they be provided with the information and encouraged to include it in their materials. If additional printing is required, such as a flier or printed insert, then the cost would depend on the print count. To produce 3900 black and white fliers for housing units in the watershed the printing cost likely would not exceed $500, if these were included in planned mailings then the postage would not be an additional expense. Milestones• Number of residents reached with information in mailings• # of informational pet waste bag dispensers installed
16
Best Management Practices : Bacteria : Pet and Wildlife Waste
Volunteer Built Purchase Disp. Purchase Disp.
Volunteer Inst. Volunteer Inst. Purchase Inst.
Low High Low High Low High
50 Dispensers $1,500 $2,500 $3,500 $10,000 $3,500 $10,000
Installation $0 $0 $0 $0 $1,000 $2,000
Bags 5 Years $1,500 $1,500 $1,500 $1,500 $1,500 $1,500
(4000/unit) $3,000 $4,000 $5,000 $11,500 $6,000 $13,500
17U.S. Department of Agriculture, Natural Resource Conservation Service, New Jersey Pasture Management Guide for Horse Owners, (Columbia, MO: 2011), 16-17.(http://www.esc.rutgers.edu/publications/stablemgt /E307.htm)
Non-Point Source Assessment : Bacteria : Horses
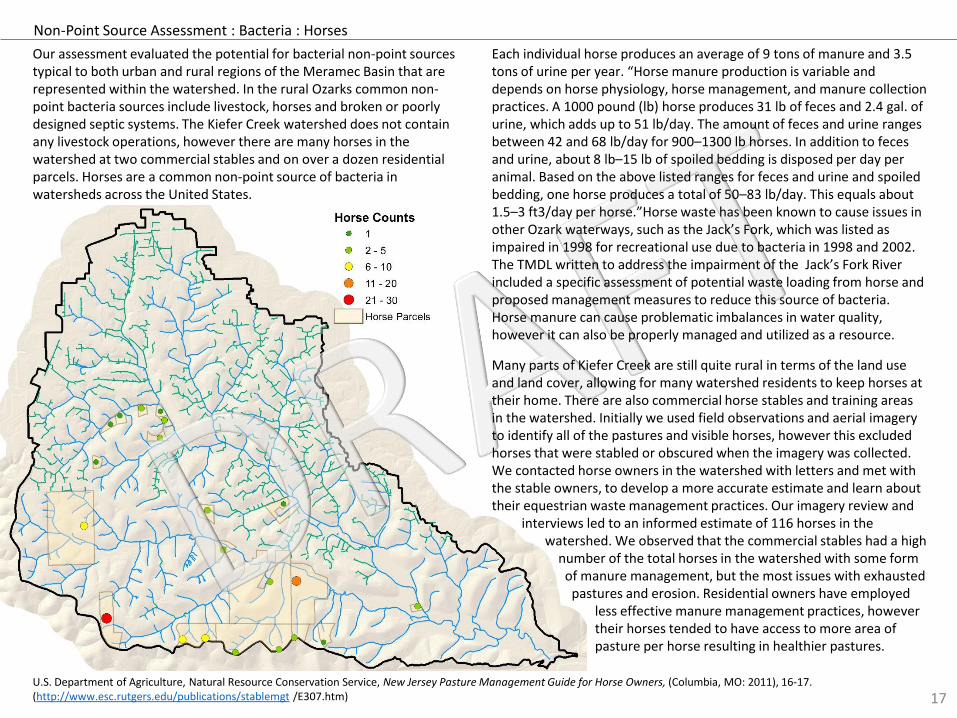
Our assessment evaluated the potential for bacterial non-point sources typical to both urban and rural regions of the Meramec Basin that are represented within the watershed. In the rural Ozarks common non-point bacteria sources include livestock, horses and broken or poorly designed septic systems. The Kiefer Creek watershed does not contain any livestock operations, however there are many horses in the watershed at two commercial stables and on over a dozen residential parcels. Horses are a common non-point source of bacteria in watersheds across the United States.
Each individual horse produces an average of 9 tons of manure and 3.5 tons of urine per year. “Horse manure production is variable and depends on horse physiology, horse management, and manure collection practices. A 1000 pound (lb) horse produces 31 lb of feces and 2.4 gal. of urine, which adds up to 51 lb/day. The amount of feces and urine ranges between 42 and 68 lb/day for 900–1300 lb horses. In addition to feces and urine, about 8 lb–15 lb of spoiled bedding is disposed per day per animal. Based on the above listed ranges for feces and urine and spoiled bedding, one horse produces a total of 50–83 lb/day. This equals about 1.5–3 ft3/day per horse.”Horse waste has been known to cause issues in other Ozark waterways, such as the Jack’s Fork, which was listed as impaired in 1998 for recreational use due to bacteria in 1998 and 2002. The TMDL written to address the impairment of the Jack’s Fork River included a specific assessment of potential waste loading from horse and proposed management measures to reduce this source of bacteria. Horse manure can cause problematic imbalances in water quality, however it can also be properly managed and utilized as a resource.
Many parts of Kiefer Creek are still quite rural in terms of the land use and land cover, allowing for many watershed residents to keep horses at their home. There are also commercial horse stables and training areas in the watershed. Initially we used field observations and aerial imagery to identify all of the pastures and visible horses, however this excluded horses that were stabled or obscured when the imagery was collected. We contacted horse owners in the watershed with letters and met with the stable owners, to develop a more accurate estimate and learn about their equestrian waste management practices. Our imagery review and
interviews led to an informed estimate of 116 horses in the watershed. We observed that the commercial stables had a high
number of the total horses in the watershed with some form of manure management, but the most issues with exhausted
pastures and erosion. Residential owners have employed less effective manure management practices, however their horses tended to have access to more area of pasture per horse resulting in healthier pastures.
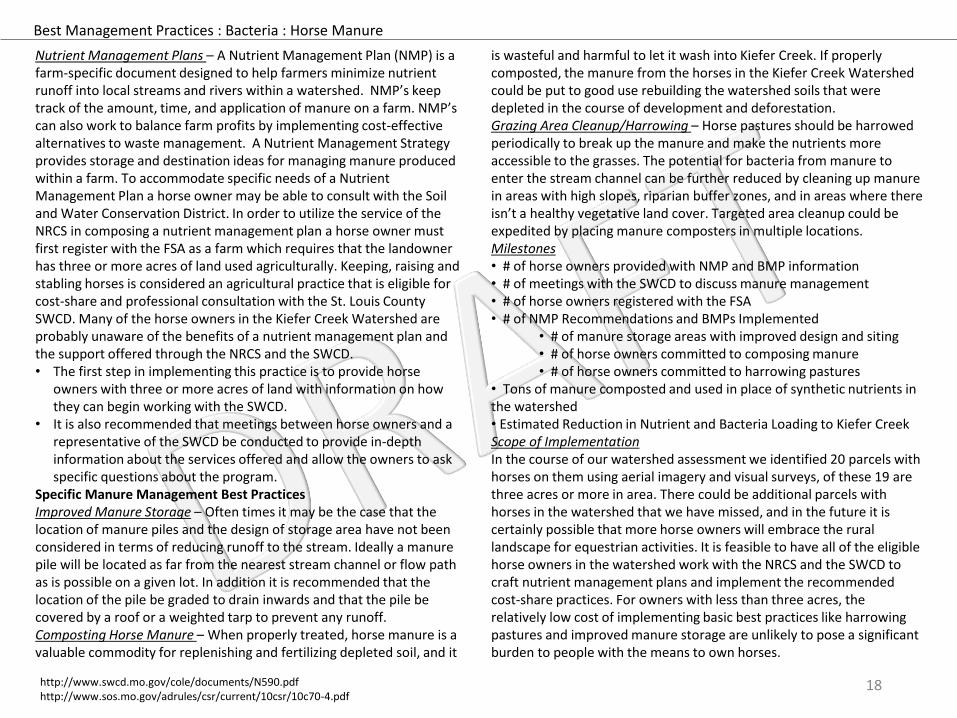
Nutrient Management Plans – A Nutrient Management Plan (NMP) is a farm-specific document designed to help farmers minimize nutrient runoff into local streams and rivers within a watershed. NMP’s keep track of the amount, time, and application of manure on a farm. NMP’s can also work to balance farm profits by implementing cost-effective alternatives to waste management. A Nutrient Management Strategy provides storage and destination ideas for managing manure produced within a farm. To accommodate specific needs of a Nutrient Management Plan a horse owner may be able to consult with the Soil and Water Conservation District. In order to utilize the service of the NRCS in composing a nutrient management plan a horse owner must first register with the FSA as a farm which requires that the landowner has three or more acres of land used agriculturally. Keeping, raising and stabling horses is considered an agricultural practice that is eligible for cost-share and professional consultation with the St. Louis County SWCD. Many of the horse owners in the Kiefer Creek Watershed are probably unaware of the benefits of a nutrient management plan and the support offered through the NRCS and the SWCD.• The first step in implementing this practice is to provide horse
owners with three or more acres of land with information on how they can begin working with the SWCD.
• It is also recommended that meetings between horse owners and a representative of the SWCD be conducted to provide in-depth information about the services offered and allow the owners to ask specific questions about the program.
Specific Manure Management Best PracticesImproved Manure Storage – Often times it may be the case that the location of manure piles and the design of storage area have not been considered in terms of reducing runoff to the stream. Ideally a manure pile will be located as far from the nearest stream channel or flow path as is possible on a given lot. In addition it is recommended that the location of the pile be graded to drain inwards and that the pile be covered by a roof or a weighted tarp to prevent any runoff. Composting Horse Manure – When properly treated, horse manure is a valuable commodity for replenishing and fertilizing depleted soil, and it
is wasteful and harmful to let it wash into Kiefer Creek. If properly composted, the manure from the horses in the Kiefer Creek Watershed could be put to good use rebuilding the watershed soils that were depleted in the course of development and deforestation.Grazing Area Cleanup/Harrowing – Horse pastures should be harrowed periodically to break up the manure and make the nutrients more accessible to the grasses. The potential for bacteria from manure to enter the stream channel can be further reduced by cleaning up manure in areas with high slopes, riparian buffer zones, and in areas where there isn’t a healthy vegetative land cover. Targeted area cleanup could be expedited by placing manure composters in multiple locations. Milestones• # of horse owners provided with NMP and BMP information • # of meetings with the SWCD to discuss manure management• # of horse owners registered with the FSA• # of NMP Recommendations and BMPs Implemented
• # of manure storage areas with improved design and siting• # of horse owners committed to composing manure• # of horse owners committed to harrowing pastures
• Tons of manure composted and used in place of synthetic nutrients in the watershed• Estimated Reduction in Nutrient and Bacteria Loading to Kiefer CreekScope of ImplementationIn the course of our watershed assessment we identified 20 parcels with horses on them using aerial imagery and visual surveys, of these 19 are three acres or more in area. There could be additional parcels with horses in the watershed that we have missed, and in the future it is certainly possible that more horse owners will embrace the rural landscape for equestrian activities. It is feasible to have all of the eligible horse owners in the watershed work with the NRCS and the SWCD to craft nutrient management plans and implement the recommended cost-share practices. For owners with less than three acres, the relatively low cost of implementing basic best practices like harrowing pastures and improved manure storage are unlikely to pose a significant burden to people with the means to own horses.
18http://www.swcd.mo.gov/cole/documents/N590.pdfhttp://www.sos.mo.gov/adrules/csr/current/10csr/10c70-4.pdf
Best Management Practices : Bacteria : Horse Manure

In addition to the specific best practices regarding the management of horse manure, pet and wildlife waste, there are general landscape based best practices that will increase the ability of the ecosystem to process waste and reduce transport of bacteria into the stream channel.Erosion Control and Riparian Buffers – The areas where horses are kept in the watershed are large by necessity, and in many cases they include riparian zones that could benefit from restoration. In addition many of the residential parcels where dogs and cats are likely to defecate are located in close proximity to stream channels and flow paths. Restoring stream and flow buffers will help to filter and process the manure that is deposited in pastures and animal waste in back yards. There are also un-vegetated areas in some of the pastures that may be erosive and contribute to sediment loading due to high horse traffic. Shifting trails over time to distribute impacts, planting more resilient native grasses, and rebuilding degraded areas would all help to reduce erosion due to horses. Reducing erosion and sediment loading will reduce the amount of bacteria being carried to the stream because bacteria is much more mobile when it can bind to sediment particles. Excluding horses from travelling along stream banks altogether would also be a good practice to reduce the amount of erosion and bacteria entering the stream. Home Landscape Habitat Restoration – In undisturbed ecosystems, animal waste is digested and absorbed as a beneficial nutrient for the flora and fauna of the watershed. This is shown by the relatively undeveloped reaches of streams in the Ozarks that support a vibrant wildlife population without excessive bacteria in the waterways. When animal waste is deposited on an impervious surface or a turf lawn, runoff will carry the waste directly to the stormwater management system and subsequently, the local waterway. When natural habitat increases, so does the likelihood of animal waste being naturally digested. By converting mown lawns back to the native forests, wildlife contributions of bacteria to Kiefer Creek will be reduced, as will bacteria loading from domestic animals. This is also a great opportunity to link up forest fragments to create larger contiguous habitats which is essential to restoring biodiversity to the watershed and creating stronger forest ecosystems. Many of the backyards in the Kiefer Creek
Watershed back up to forests, by adding site appropriate native plantings to the forest edge and infiltrative native planting beds in low spots the bacteria runoff from pet and wildlife waste in yards has a greater chance of being intercepted and naturally disinfected instead of contributing to the non-point source bacteria load. Scope of ImplementationThese practices can, and should, be implemented throughout the watershed, even watershed residents without pets and horses can implement these practices to help reduce bacteria loading from wildlife and outdoor cats. Through programs like St. Louis Audubon’s ‘Bring Conservation Home Program watershed residents and horse owners can get professional advice on how to proceed with implementation. Milestones# of horse and pet owners provided with information on restorationAcres of riparian zone restored/native plants planted# of horse and pet owners engaged with agencies that support restoration efforts such as St. Louis Audubon and the Missouri Department of Conservation • Acres reduction in mown lawn area in backyards• # Native trees planted along forest edge• Square feet of native plant beds targeted to low spots and flow pathsAcres of native habitat restored# of native trees and plants plantedAcreage increase in contiguous forest areas CostsLandscaping can cost a lot or a little depending on the approach taken. Native tree and shrub saplings called ‘whips’ can be ordered from MDC for as little as 10 cents each, or one can spend more than $100 on one large tree. Perennial native grasses, wildflowers and other herbaceous plant materials can be acquired from any number of local nurseries or planted from seed. Once established, most native species can be divided and distributed to expand restoration areas at no cost beyond the time spent. As the area of native plantings and expanded forests increases the costs of lawn maintenance will decrease, potentially to the point that native plantings provide more savings than the initial cost of purchasing and installing the plants.
19
Best Management Practices : Bacteria : All Animals

St. Louis County Missouri, GIS Service Center, Saint Louis County Parcel Dataset, [DVD-Shapefile] St. Louis County Government, 2014.U.S. Environmental Protection Agency, Office of Water, Office of Research and Development, Onsite Wastewater Treatment Systems Manual (EPA/625/R-00/008, Washington, DC: GPO, 2002), 1-7, Table 1-3. 20
Non-Point Source Assessment : Bacteria : Septic Systems : Identification
Year Built Range
Non-Vacant Parcels
Single Family
Duplex Townhome
Multi-Family
Institutional & Parks
Commercial & Industrial
1900 > 3 3 0 0 0 0
1901 - 1910 2 2 0 0 0 0
1911 - 1920 20 19 1 0 0 0
1921 - 1930 62 58 1 1 1 1
1931 - 1940 12 8 1 2 1 0
1941 - 1950 33 32 0 0 0 1
1951 - 1960 64 58 1 0 2 3
1961 - 1970 62 55 1 1 1 4
1971 - 1980 310 247 0 53 2 8
1981 - 1985 180 140 0 33 1 6
Total 748 622 5 90 8 23
Early on in our investigation we suspected that septic systems could be a significant source of bacteria, many of the watershed's older homes were built long before the area was reached by centralized sewer infrastructure in the late 80's. Septic systems are a notorious source of bacteria in many small streams and lakes across the country. The EPA estimates that 168,000 viral illnesses and 34,000 bacterial illnesses occur each year as a result of ingestion of improperly treated well water, and malfunctioning septic systems have been identified as one potential source of ground water contamination. The steep Karst topography and rocky soils of the Kiefer Creek Watershed make it especially vulnerable to the negative effects of inadequately designed and maintained septic systems.
The first step in determining the potential bacteria loading from septic systems in the watershed is to quantify the number of septic systems in the watershed. Information on septic systems is usually in the form of an educated estimate based on census data and land use characteristics. A process of elimination was developed that employs datasets and assistance from the Metropolitan St. Louis Sewer District and St. Louis County, which rendered a highly refined septic system dataset for the watershed. This process can and should be employed across the entire county to guide the strategic deployment of improved infrastructure connectivity.
The St. Louis County Parcel Database contains a wide range of useful attribute data including a column called ‘YEARBLT,’ which refers to the year in which a structure was first built on the according to county records. The MSD pump station in Castlewood State Park came online in 1986, and serves the majority of the parcels within the Kiefer Creek catchment. All non-vacant watershed parcels developed prior to the operational date of the pump station were extracted to a new dataset representing potentially un-sewered parcels based on the infrastructure timeline.
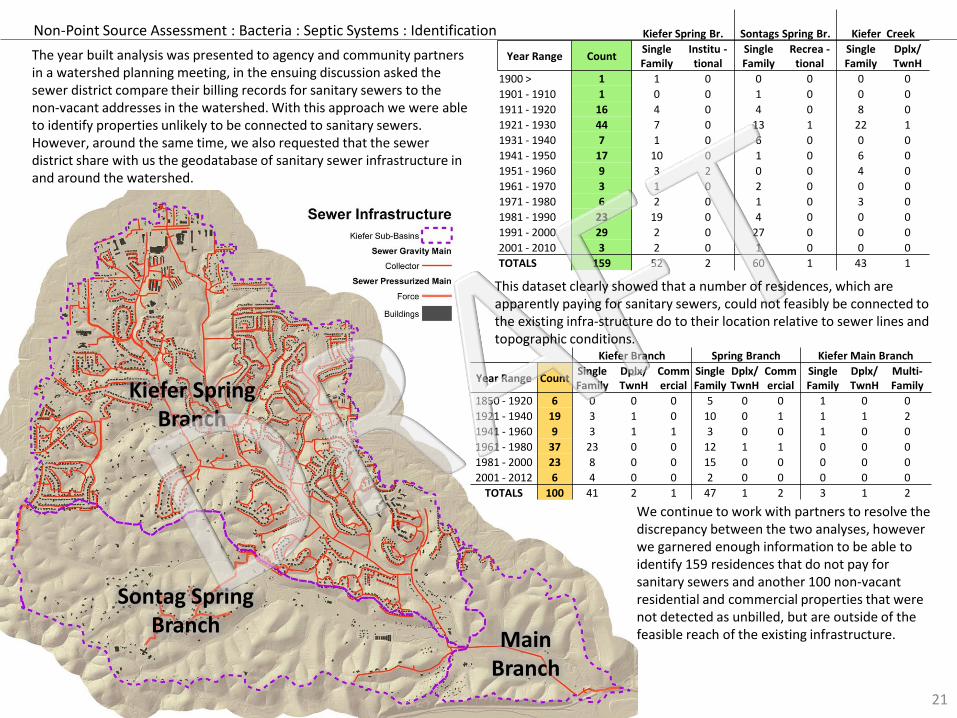
The year built analysis was presented to agency and community partners in a watershed planning meeting, in the ensuing discussion asked the sewer district compare their billing records for sanitary sewers to the non-vacant addresses in the watershed. With this approach we were able to identify properties unlikely to be connected to sanitary sewers.However, around the same time, we also requested that the sewer district share with us the geodatabase of sanitary sewer infrastructure in and around the watershed.
We continue to work with partners to resolve thediscrepancy between the two analyses, however we garnered enough information to be able to identify 159 residences that do not pay for sanitary sewers and another 100 non-vacant residential and commercial properties that were not detected as unbilled, but are outside of the feasible reach of the existing infrastructure.
21
Kiefer Branch Spring Branch Kiefer Main Branch
Year Range CountSingle Family
Dplx/ TwnH
Commercial
Single Family
Dplx/ TwnH
Commercial
Single Family
Dplx/ TwnH
Multi-Family
1850 - 1920 6 0 0 0 5 0 0 1 0 0
1921 - 1940 19 3 1 0 10 0 1 1 1 2
1941 - 1960 9 3 1 1 3 0 0 1 0 0
1961 - 1980 37 23 0 0 12 1 1 0 0 0
1981 - 2000 23 8 0 0 15 0 0 0 0 0
2001 - 2012 6 4 0 0 2 0 0 0 0 0
TOTALS 100 41 2 1 47 1 2 3 1 2
Kiefer SpringBranch
Sontag SpringBranch
MainBranch
Non-Point Source Assessment : Bacteria : Septic Systems : Identification Kiefer Spring Br. Sontags Spring Br. Kiefer Creek
Year Range Count Single Family
Institu -tional
Single Family
Recrea -tional
Single Family
Dplx/ TwnH
1900 > 1 1 0 0 0 0 0
1901 - 1910 1 0 0 1 0 0 0
1911 - 1920 16 4 0 4 0 8 0
1921 - 1930 44 7 0 13 1 22 1
1931 - 1940 7 1 0 6 0 0 0
1941 - 1950 17 10 0 1 0 6 0
1951 - 1960 9 3 2 0 0 4 0
1961 - 1970 3 1 0 2 0 0 0
1971 - 1980 6 2 0 1 0 3 0
1981 - 1990 23 19 0 4 0 0 0
1991 - 2000 29 2 0 27 0 0 0
2001 - 2010 3 2 0 1 0 0 0
TOTALS 159 52 2 60 1 43 1
This dataset clearly showed that a number of residences, which are apparently paying for sanitary sewers, could not feasibly be connected to the existing infra-structure do to their location relative to sewer lines and topographic conditions.
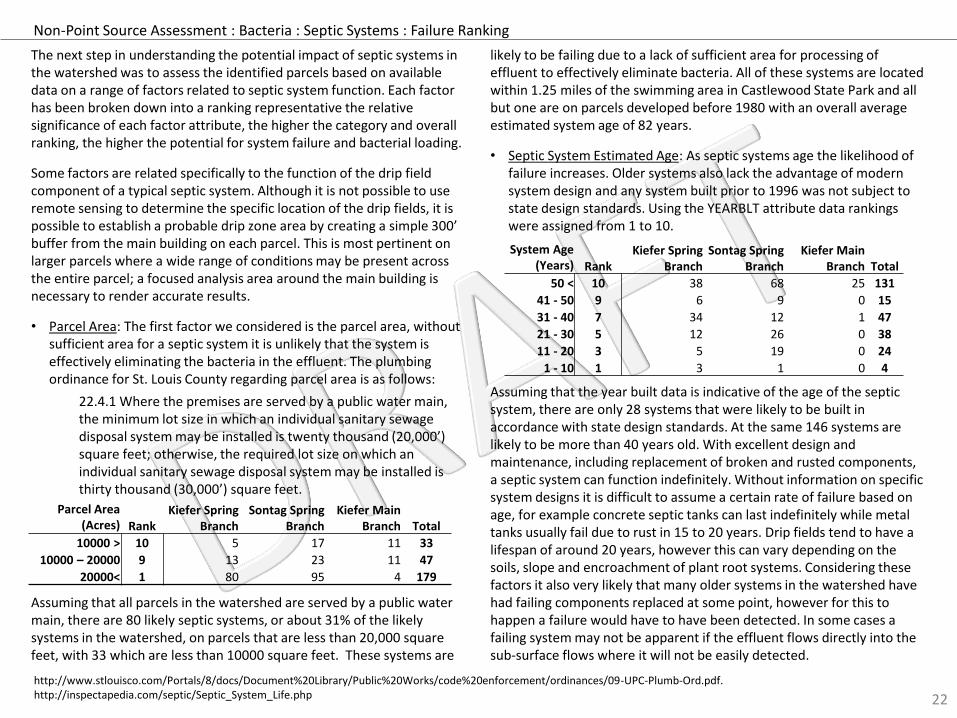
The next step in understanding the potential impact of septic systems in the watershed was to assess the identified parcels based on available data on a range of factors related to septic system function. Each factor has been broken down into a ranking representative the relative significance of each factor attribute, the higher the category and overall ranking, the higher the potential for system failure and bacterial loading.
Some factors are related specifically to the function of the drip field component of a typical septic system. Although it is not possible to use remote sensing to determine the specific location of the drip fields, it is possible to establish a probable drip zone area by creating a simple 300’ buffer from the main building on each parcel. This is most pertinent on larger parcels where a wide range of conditions may be present across the entire parcel; a focused analysis area around the main building is necessary to render accurate results.
• Parcel Area: The first factor we considered is the parcel area, without sufficient area for a septic system it is unlikely that the system is effectively eliminating the bacteria in the effluent. The plumbing ordinance for St. Louis County regarding parcel area is as follows:
22.4.1 Where the premises are served by a public water main, the minimum lot size in which an individual sanitary sewage disposal system may be installed is twenty thousand (20,000’) square feet; otherwise, the required lot size on which an individual sanitary sewage disposal system may be installed is thirty thousand (30,000’) square feet.
Assuming that all parcels in the watershed are served by a public water main, there are 80 likely septic systems, or about 31% of the likely systems in the watershed, on parcels that are less than 20,000 square feet, with 33 which are less than 10000 square feet. These systems are
likely to be failing due to a lack of sufficient area for processing of effluent to effectively eliminate bacteria. All of these systems are located within 1.25 miles of the swimming area in Castlewood State Park and all but one are on parcels developed before 1980 with an overall average estimated system age of 82 years.
• Septic System Estimated Age: As septic systems age the likelihood of failure increases. Older systems also lack the advantage of modern system design and any system built prior to 1996 was not subject to state design standards. Using the YEARBLT attribute data rankings were assigned from 1 to 10.
Assuming that the year built data is indicative of the age of the septic system, there are only 28 systems that were likely to be built in accordance with state design standards. At the same 146 systems are likely to be more than 40 years old. With excellent design and maintenance, including replacement of broken and rusted components, a septic system can function indefinitely. Without information on specific system designs it is difficult to assume a certain rate of failure based on age, for example concrete septic tanks can last indefinitely while metal tanks usually fail due to rust in 15 to 20 years. Drip fields tend to have a lifespan of around 20 years, however this can vary depending on the soils, slope and encroachment of plant root systems. Considering these factors it also very likely that many older systems in the watershed have had failing components replaced at some point, however for this to happen a failure would have to have been detected. In some cases a failing system may not be apparent if the effluent flows directly into the sub-surface flows where it will not be easily detected.
22
System Age (Years) Rank
Kiefer Spring Branch
Sontag Spring Branch
Kiefer Main Branch Total
50 < 10 38 68 25 131
41 - 50 9 6 9 0 15
31 - 40 7 34 12 1 47
21 - 30 5 12 26 0 38
11 - 20 3 5 19 0 24
1 - 10 1 3 1 0 4
Parcel Area (Acres) Rank
Kiefer Spring Branch
Sontag Spring Branch
Kiefer Main Branch Total
10000 > 10 5 17 11 33
10000 – 20000 9 13 23 11 47
20000< 1 80 95 4 179
http://www.stlouisco.com/Portals/8/docs/Document%20Library/Public%20Works/code%20enforcement/ordinances/09-UPC-Plumb-Ord.pdf.http://inspectapedia.com/septic/Septic_System_Life.php
Non-Point Source Assessment : Bacteria : Septic Systems : Failure Ranking
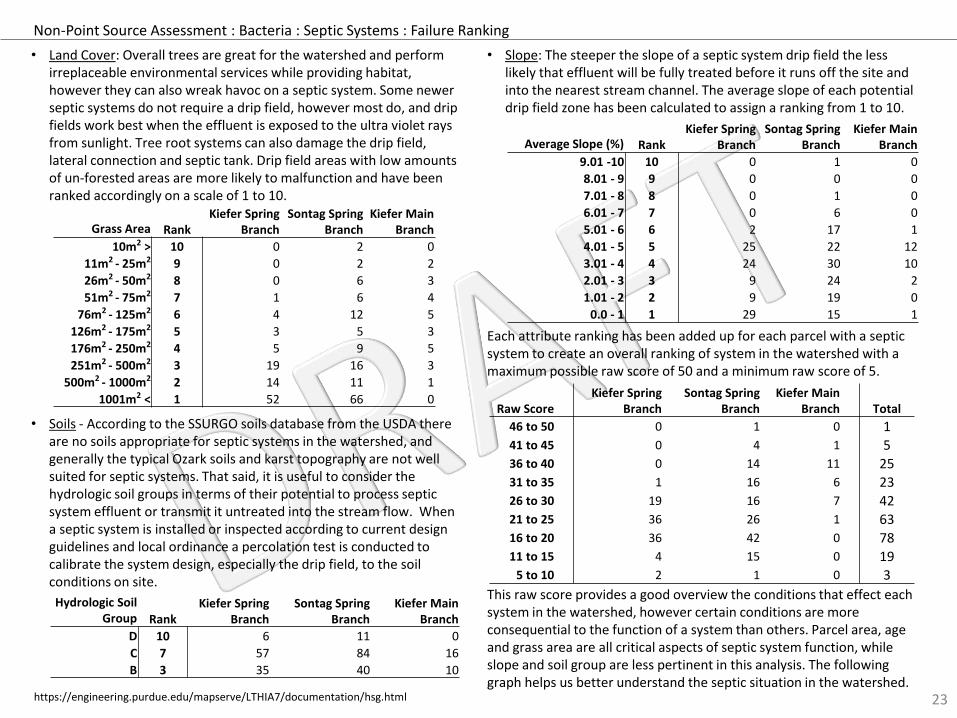
• Land Cover: Overall trees are great for the watershed and perform irreplaceable environmental services while providing habitat, however they can also wreak havoc on a septic system. Some newer septic systems do not require a drip field, however most do, and drip fields work best when the effluent is exposed to the ultra violet rays from sunlight. Tree root systems can also damage the drip field, lateral connection and septic tank. Drip field areas with low amounts of un-forested areas are more likely to malfunction and have been ranked accordingly on a scale of 1 to 10.
• Soils - According to the SSURGO soils database from the USDA there are no soils appropriate for septic systems in the watershed, and generally the typical Ozark soils and karst topography are not well suited for septic systems. That said, it is useful to consider the hydrologic soil groups in terms of their potential to process septic system effluent or transmit it untreated into the stream flow. When a septic system is installed or inspected according to current design guidelines and local ordinance a percolation test is conducted to calibrate the system design, especially the drip field, to the soil conditions on site.
• Slope: The steeper the slope of a septic system drip field the less likely that effluent will be fully treated before it runs off the site and into the nearest stream channel. The average slope of each potential drip field zone has been calculated to assign a ranking from 1 to 10.
Each attribute ranking has been added up for each parcel with a septic system to create an overall ranking of system in the watershed with a maximum possible raw score of 50 and a minimum raw score of 5.
This raw score provides a good overview the conditions that effect each system in the watershed, however certain conditions are more consequential to the function of a system than others. Parcel area, age and grass area are all critical aspects of septic system function, while slope and soil group are less pertinent in this analysis. The following graph helps us better understand the septic situation in the watershed.
23
Average Slope (%) RankKiefer Spring
BranchSontag Spring
BranchKiefer Main
Branch
9.01 -10 10 0 1 0
8.01 - 9 9 0 0 0
7.01 - 8 8 0 1 0
6.01 - 7 7 0 6 0
5.01 - 6 6 2 17 1
4.01 - 5 5 25 22 12
3.01 - 4 4 24 30 10
2.01 - 3 3 9 24 2
1.01 - 2 2 9 19 0
0.0 - 1 1 29 15 1
Hydrologic Soil Group Rank
Kiefer Spring Branch
Sontag Spring Branch
Kiefer Main Branch
D 10 6 11 0
C 7 57 84 16
B 3 35 40 10
Grass Area RankKiefer Spring
BranchSontag Spring
BranchKiefer Main
Branch
10m2 > 10 0 2 0
11m2 - 25m2 9 0 2 2
26m2 - 50m2 8 0 6 3
51m2 - 75m2 7 1 6 4
76m2 - 125m2 6 4 12 5
126m2 - 175m2 5 3 5 3
176m2 - 250m2 4 5 9 5
251m2 - 500m2 3 19 16 3
500m2 - 1000m2 2 14 11 1
1001m2 < 1 52 66 0
https://engineering.purdue.edu/mapserve/LTHIA7/documentation/hsg.html
Raw ScoreKiefer Spring
BranchSontag Spring
BranchKiefer Main
Branch Total
46 to 50 0 1 0 141 to 45 0 4 1 536 to 40 0 14 11 2531 to 35 1 16 6 2326 to 30 19 16 7 4221 to 25 36 26 1 6316 to 20 36 42 0 7811 to 15 4 15 0 19
5 to 10 2 1 0 3
Non-Point Source Assessment : Bacteria : Septic Systems : Failure Ranking
24
0
5
10
15
20
25
30
35
40
45
50
Sontag Spring Branch
Area Rank Age Rank Grass Rank Slope Rank Soil Rank
0
5
10
15
20
25
30
35
Kiefer Spring Branch
Area Rank Age Rank Grass Rank Slope Rank Soil Rank
0
5
10
15
20
25
30
35
40
45
Kiefer Main Branch
Area Rank Age Rank Grass Rank
Slope Rank Soil Rank
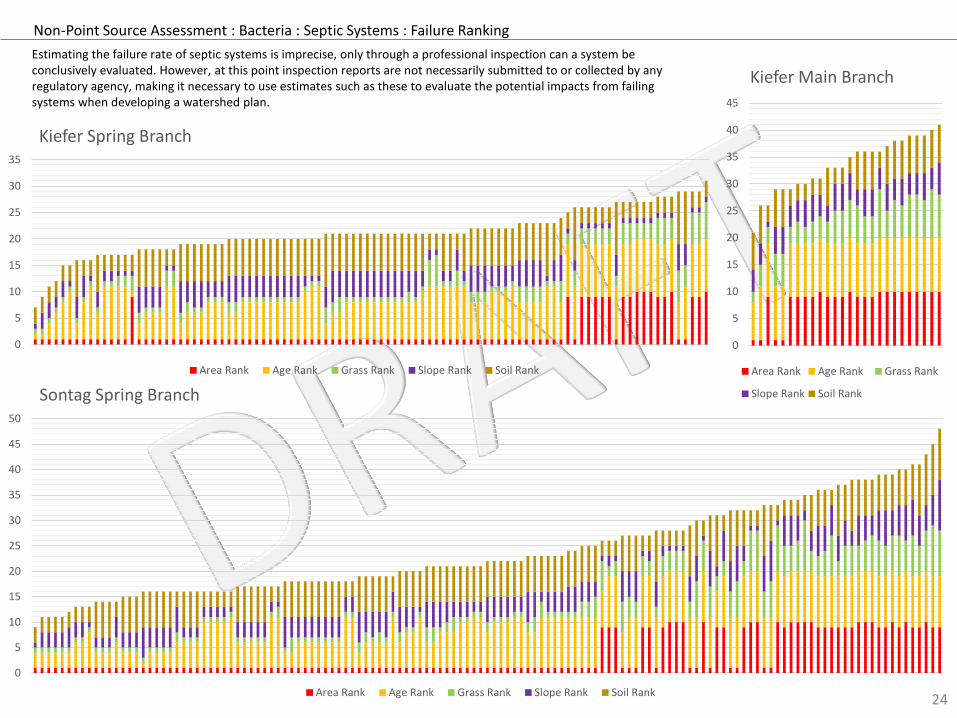
Estimating the failure rate of septic systems is imprecise, only through a professional inspection can a system be conclusively evaluated. However, at this point inspection reports are not necessarily submitted to or collected by any regulatory agency, making it necessary to use estimates such as these to evaluate the potential impacts from failing systems when developing a watershed plan.
Non-Point Source Assessment : Bacteria : Septic Systems : Failure Ranking
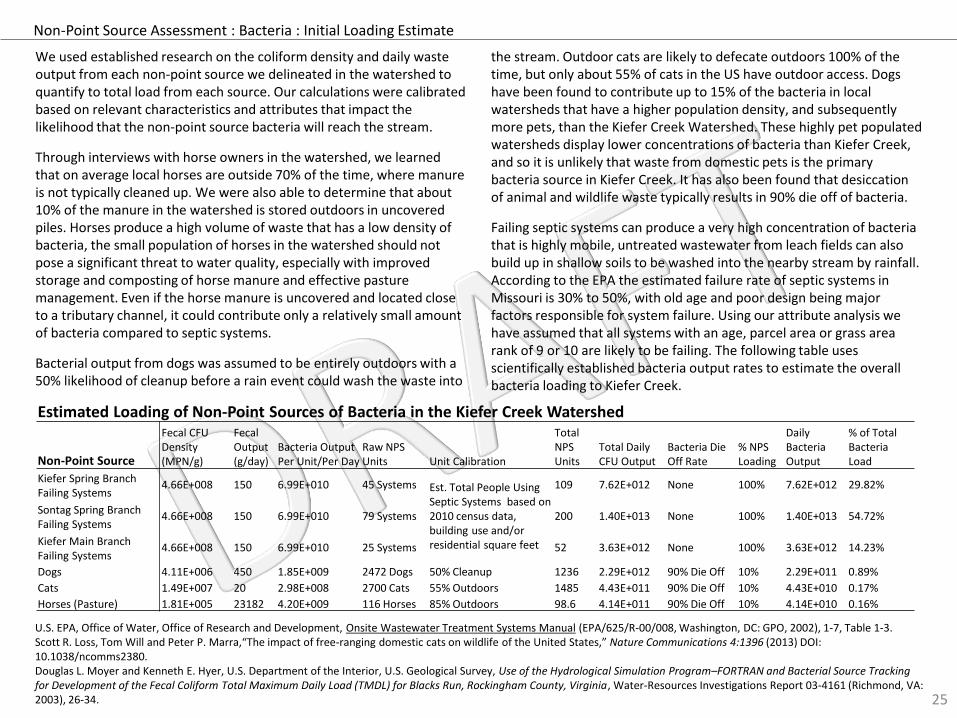
We used established research on the coliform density and daily waste output from each non-point source we delineated in the watershed to quantify to total load from each source. Our calculations were calibrated based on relevant characteristics and attributes that impact the likelihood that the non-point source bacteria will reach the stream.
Through interviews with horse owners in the watershed, we learned that on average local horses are outside 70% of the time, where manure is not typically cleaned up. We were also able to determine that about 10% of the manure in the watershed is stored outdoors in uncovered piles. Horses produce a high volume of waste that has a low density of bacteria, the small population of horses in the watershed should not pose a significant threat to water quality, especially with improved storage and composting of horse manure and effective pasture management. Even if the horse manure is uncovered and located close to a tributary channel, it could contribute only a relatively small amount of bacteria compared to septic systems.
Bacterial output from dogs was assumed to be entirely outdoors with a 50% likelihood of cleanup before a rain event could wash the waste into
the stream. Outdoor cats are likely to defecate outdoors 100% of thetime, but only about 55% of cats in the US have outdoor access. Dogs have been found to contribute up to 15% of the bacteria in local watersheds that have a higher population density, and subsequently more pets, than the Kiefer Creek Watershed. These highly pet populated watersheds display lower concentrations of bacteria than Kiefer Creek, and so it is unlikely that waste from domestic pets is the primary bacteria source in Kiefer Creek. It has also been found that desiccation of animal and wildlife waste typically results in 90% die off of bacteria.
Failing septic systems can produce a very high concentration of bacteria that is highly mobile, untreated wastewater from leach fields can also build up in shallow soils to be washed into the nearby stream by rainfall. According to the EPA the estimated failure rate of septic systems in Missouri is 30% to 50%, with old age and poor design being major factors responsible for system failure. Using our attribute analysis we have assumed that all systems with an age, parcel area or grass area rank of 9 or 10 are likely to be failing. The following table uses scientifically established bacteria output rates to estimate the overall bacteria loading to Kiefer Creek.
25
U.S. EPA, Office of Water, Office of Research and Development, Onsite Wastewater Treatment Systems Manual (EPA/625/R-00/008, Washington, DC: GPO, 2002), 1-7, Table 1-3.Scott R. Loss, Tom Will and Peter P. Marra,“The impact of free-ranging domestic cats on wildlife of the United States,” Nature Communications 4:1396 (2013) DOI: 10.1038/ncomms2380.Douglas L. Moyer and Kenneth E. Hyer, U.S. Department of the Interior, U.S. Geological Survey, Use of the Hydrological Simulation Program–FORTRAN and Bacterial Source Tracking for Development of the Fecal Coliform Total Maximum Daily Load (TMDL) for Blacks Run, Rockingham County, Virginia, Water-Resources Investigations Report 03-4161 (Richmond, VA: 2003), 26-34.
Estimated Loading of Non-Point Sources of Bacteria in the Kiefer Creek Watershed
Non-Point Source
Fecal CFU Density (MPN/g)
Fecal Output (g/day)
Bacteria Output Per Unit/Per Day
Raw NPS Units Unit Calibration
Total NPS Units
Total Daily CFU Output
Bacteria Die Off Rate
% NPS Loading
Daily Bacteria Output
% of Total Bacteria Load
Kiefer Spring Branch Failing Systems
4.66E+008 150 6.99E+010 45 Systems Est. Total People Using Septic Systems based on 2010 census data, building use and/or residential square feet
109 7.62E+012 None 100% 7.62E+012 29.82%
Sontag Spring Branch Failing Systems
4.66E+008 150 6.99E+010 79 Systems 200 1.40E+013 None 100% 1.40E+013 54.72%
Kiefer Main Branch Failing Systems
4.66E+008 150 6.99E+010 25 Systems 52 3.63E+012 None 100% 3.63E+012 14.23%
Dogs 4.11E+006 450 1.85E+009 2472 Dogs 50% Cleanup 1236 2.29E+012 90% Die Off 10% 2.29E+011 0.89%
Cats 1.49E+007 20 2.98E+008 2700 Cats 55% Outdoors 1485 4.43E+011 90% Die Off 10% 4.43E+010 0.17%
Horses (Pasture) 1.81E+005 23182 4.20E+009 116 Horses 85% Outdoors 98.6 4.14E+011 90% Die Off 10% 4.14E+010 0.16%
Non-Point Source Assessment : Bacteria : Initial Loading Estimate

26
Non-Point Source Assessment : Bacteria : Connectivity Analysis
Many of the homes likely to have septic systems could feasibly be connected to the existing sanitary sewer infrastructure. It is important to distinguish which systems may be most easily dealt with through a lateral connection, from those that will require an expansion of infrastructure. Both MSD and St. Louis County require that a lateral connection be made when a property boundary is within 200’ of a sewer line. However, it appears that this provision is primarily implemented in cases of new construction and when a septic system failure complaint is filed. With many homes and other developments that were built before sewers were available in the watershed, and many areas still lacking access, Kiefer faces a difficult predicament. There may need to be significant policy changes at MSD and St. Louis County to ensure that homes that can be feasibly connected to existing infrastructure are connected, and those that can’t are managed to the best extent possible. In the next section we
evaluate the current connective potential of septic systems to sewer infrastructure in the
watershed, then investigate the potential policy changes, infrastructure expansion
and alternative approaches that will be necessary to reign in the bacteria in Kiefer Creek.
Not only do septic systems make up the majority of the excess bacteria in Kiefer Creek, they are also the most complex and expensive source of bacteria to control. In the Kiefer Creek Watershed a major investment has been made to install approximately 60 miles of sewer lines, 3000+ lateral connections and seven pumping facilities to ensurethat the human waste generated in the watershed does not wind up
polluting the creek. Unfortunately it only takes a relatively small number of failing septic systems to render the stream unsafe for recreation, undermining the efforts to protect water quality with centralized sewers. It may seem expensive to expand sewer access and connect homes currently on septic systems to sewers, but this cost is tiny compared to the costs paid by the majority of watershed residents to have sewers to ensure that Kiefer Creek does not become polluted with human waste.

27
Non-Point Source Assessment : Bacteria : Connectivity Analysis & Watershed Model
Lateral Connectivity Category Kiefer Spring
BranchSontag Spring
BranchKiefer Main
Branch
Connectable (Connect)
47 4 1Parcel Distance < 200ft
Building Distance < 500ft
Building Elev. > Sewer Elev.
Difficult Connection (D_Connect)
2 1 0Building Distance > 500ft
Parcel Distance < 200ft
Building Elev. > Near Sewer Elev.
Elevation Conflict (No_Connect_E)
1 20 0Building Elev.<Near Sewer Elev
Distance to Lower Sewer Elev.>500ft.
Parcel Distance < 200ft
Distance Impediment (No_Connect_PD)
48 110 25Parcel Distance > 200ft
Distance to Lower Sewer Elev.>500ft.
In the Kiefer Creek Watershed there are cases where a property line may be within 200’, but a connection is not feasible due to elevation or relative distance from the main building on larger parcels. In this analysis septic parcels have been divided into four categories: systems that can be connected; systems that are within 200’ but cannot be connected due to elevation; systems that are within 200’ but would require more than 500’ to connect via lateral; and systems that are not within 200’.
Watershed ModelAlthough our first estimate clearly indicates that the majority of the bacteria loading in Kiefer Creek comes from septic systems, we decided to use a watershed model to take more variables into account and run a variety of scenarios based on probable and improved conditions in the watershed. We also used this model to estimate the bacteria load reduction from the implementation of best practices that would reduce the number of failing septic systems in the watershed. The watershed model that we selected for this analysis is called MapShed and it was developed by the University of Pennsylvania Department of Earth Sciences. MapShed is a system that utilizes a combination of GIS datasets, weather data, and a wide range of input settings to simulate the production and transport of pollutants in a watershed. One major
strengths of this model is the ability to directly quantify the number of septic systems in a basin, then derive monthly bacteria production and loading averages by source. Within this model other sources of bacteria that are considered are farm animals, urban runoff, and wildlife. By assembling our collected data on Kiefer Creek into layers and inputs for the model we have been able to better understand the loading reductions necessary to bring Kiefer Creek into compliance with the recreational use bacteria standard.
The foundation of the MapShed model is built on the GWLF (Generalized Watershed Loading Function) framework, but goes further to provide a GIS based interface that utilizes geospatial data and numeric input settings to create a comprehensive input file for the GWLF-E model.
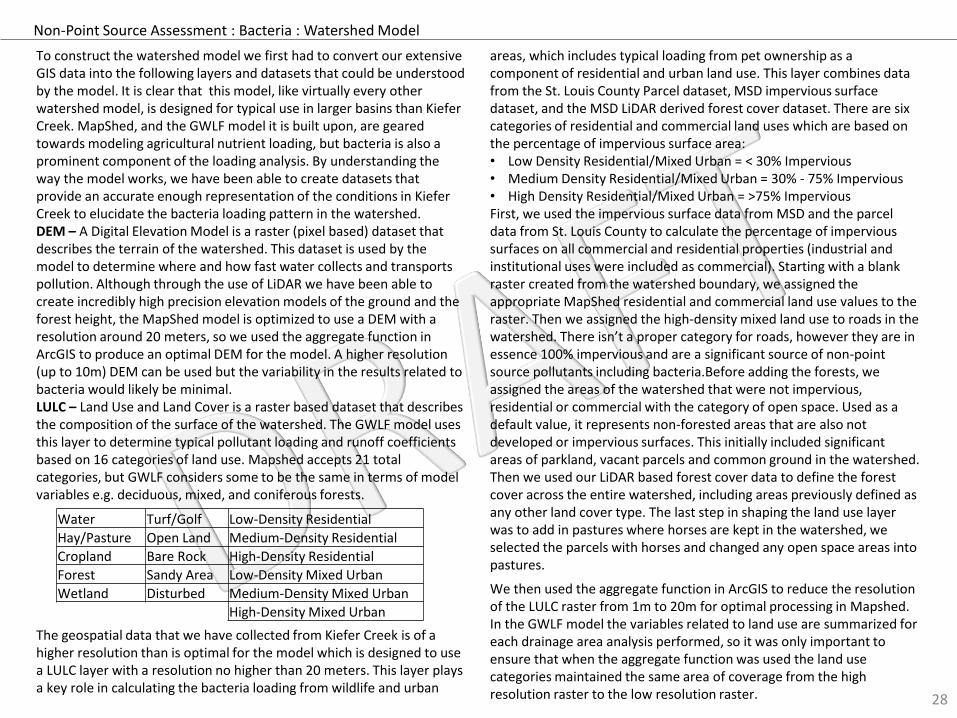
To construct the watershed model we first had to convert our extensive GIS data into the following layers and datasets that could be understood by the model. It is clear that this model, like virtually every other watershed model, is designed for typical use in larger basins than Kiefer Creek. MapShed, and the GWLF model it is built upon, are geared towards modeling agricultural nutrient loading, but bacteria is also a prominent component of the loading analysis. By understanding the way the model works, we have been able to create datasets that provide an accurate enough representation of the conditions in Kiefer Creek to elucidate the bacteria loading pattern in the watershed. DEM – A Digital Elevation Model is a raster (pixel based) dataset that describes the terrain of the watershed. This dataset is used by the model to determine where and how fast water collects and transports pollution. Although through the use of LiDAR we have been able to create incredibly high precision elevation models of the ground and the forest height, the MapShed model is optimized to use a DEM with a resolution around 20 meters, so we used the aggregate function in ArcGIS to produce an optimal DEM for the model. A higher resolution (up to 10m) DEM can be used but the variability in the results related to bacteria would likely be minimal.LULC – Land Use and Land Cover is a raster based dataset that describes the composition of the surface of the watershed. The GWLF model uses this layer to determine typical pollutant loading and runoff coefficients based on 16 categories of land use. Mapshed accepts 21 total categories, but GWLF considers some to be the same in terms of model variables e.g. deciduous, mixed, and coniferous forests.
The geospatial data that we have collected from Kiefer Creek is of a higher resolution than is optimal for the model which is designed to use a LULC layer with a resolution no higher than 20 meters. This layer plays a key role in calculating the bacteria loading from wildlife and urban
areas, which includes typical loading from pet ownership as a component of residential and urban land use. This layer combines data from the St. Louis County Parcel dataset, MSD impervious surface dataset, and the MSD LiDAR derived forest cover dataset. There are six categories of residential and commercial land uses which are based on the percentage of impervious surface area: • Low Density Residential/Mixed Urban = < 30% Impervious• Medium Density Residential/Mixed Urban = 30% - 75% Impervious• High Density Residential/Mixed Urban = >75% Impervious First, we used the impervious surface data from MSD and the parcel data from St. Louis County to calculate the percentage of impervious surfaces on all commercial and residential properties (industrial and institutional uses were included as commercial). Starting with a blank raster created from the watershed boundary, we assigned the appropriate MapShed residential and commercial land use values to the raster. Then we assigned the high-density mixed land use to roads in the watershed. There isn’t a proper category for roads, however they are in essence 100% impervious and are a significant source of non-point source pollutants including bacteria.Before adding the forests, we assigned the areas of the watershed that were not impervious, residential or commercial with the category of open space. Used as a default value, it represents non-forested areas that are also not developed or impervious surfaces. This initially included significant areas of parkland, vacant parcels and common ground in the watershed. Then we used our LiDAR based forest cover data to define the forest cover across the entire watershed, including areas previously defined as any other land cover type. The last step in shaping the land use layer was to add in pastures where horses are kept in the watershed, we selected the parcels with horses and changed any open space areas into pastures.
We then used the aggregate function in ArcGIS to reduce the resolution of the LULC raster from 1m to 20m for optimal processing in Mapshed. In the GWLF model the variables related to land use are summarized for each drainage area analysis performed, so it was only important to ensure that when the aggregate function was used the land use categories maintained the same area of coverage from the high resolution raster to the low resolution raster. 28
Water Turf/Golf Low-Density Residential
Hay/Pasture Open Land Medium-Density Residential
Cropland Bare Rock High-Density Residential
Forest Sandy Area Low-Density Mixed Urban
Wetland Disturbed Medium-Density Mixed Urban
High-Density Mixed Urban
Non-Point Source Assessment : Bacteria : Watershed Model

29
Category 20m% Acres 1m % Acres % ∆ Acres ∆
Water 0.99% 42.45 0.45% 19.13 0.54% 23.32
Forest 64.17% 2758.02 64.54% 2773.77 -0.37% -15.75
Open Land 6.19% 266.21 6.20% 266.39 0.00% -0.18
Hay/Pasture 3.72% 159.94 3.72% 160.03 0.00% -0.09
LD Residential 12.69% 545.48 12.83% 551.22 -0.13% -5.73
MD Residential 5.84% 250.79 5.84% 250.83 0.00% -0.04
HD Residential 0.01% 0.52 0.01% 0.52 0.00% 0.00
LD Mixed Urban 0.30% 12.90 0.34% 14.42 -0.04% -1.52
MD Mixed Urban 0.25% 10.68 0.25% 10.68 0.00% 0.00
HD Mixed Urban 5.84% 251.01 5.84% 251.01 0.00% 0.00
We compared the results of the aggregated function to the original 1m resolution LULC layer and found the greatest variation in percent coverage by category to be 0.54% in the water category. This difference more than doubles the water area from 19.13 acres to 42.25 acres, and could have a slight impact on the model, although at less than one percent of watershed the impact will be very small. Water is also the only land use that changes on a regular basis depending on the amount of rainfall, evaporation, flooding and temporary impoundments built by beavers.
Non-Point Source Assessment : Bacteria : Watershed Model
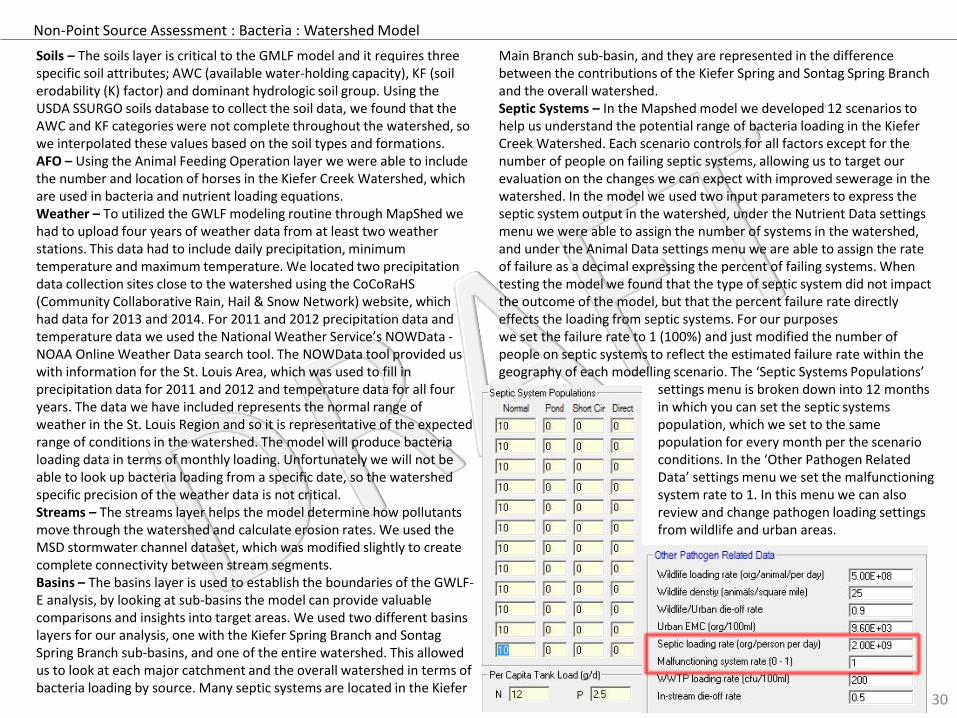
Soils – The soils layer is critical to the GMLF model and it requires three specific soil attributes; AWC (available water-holding capacity), KF (soil erodability (K) factor) and dominant hydrologic soil group. Using the USDA SSURGO soils database to collect the soil data, we found that the AWC and KF categories were not complete throughout the watershed, so we interpolated these values based on the soil types and formations. AFO – Using the Animal Feeding Operation layer we were able to include the number and location of horses in the Kiefer Creek Watershed, which are used in bacteria and nutrient loading equations.Weather – To utilized the GWLF modeling routine through MapShed we had to upload four years of weather data from at least two weather stations. This data had to include daily precipitation, minimum temperature and maximum temperature. We located two precipitation data collection sites close to the watershed using the CoCoRaHS(Community Collaborative Rain, Hail & Snow Network) website, which had data for 2013 and 2014. For 2011 and 2012 precipitation data and temperature data we used the National Weather Service’s NOWData -NOAA Online Weather Data search tool. The NOWData tool provided us with information for the St. Louis Area, which was used to fill in precipitation data for 2011 and 2012 and temperature data for all four years. The data we have included represents the normal range of weather in the St. Louis Region and so it is representative of the expected range of conditions in the watershed. The model will produce bacteria loading data in terms of monthly loading. Unfortunately we will not be able to look up bacteria loading from a specific date, so the watershed specific precision of the weather data is not critical.Streams – The streams layer helps the model determine how pollutants move through the watershed and calculate erosion rates. We used the MSD stormwater channel dataset, which was modified slightly to create complete connectivity between stream segments. Basins – The basins layer is used to establish the boundaries of the GWLF-E analysis, by looking at sub-basins the model can provide valuable comparisons and insights into target areas. We used two different basins layers for our analysis, one with the Kiefer Spring Branch and Sontag Spring Branch sub-basins, and one of the entire watershed. This allowed us to look at each major catchment and the overall watershed in terms of bacteria loading by source. Many septic systems are located in the Kiefer
Main Branch sub-basin, and they are represented in the difference between the contributions of the Kiefer Spring and Sontag Spring Branch and the overall watershed.Septic Systems – In the Mapshed model we developed 12 scenarios to help us understand the potential range of bacteria loading in the Kiefer Creek Watershed. Each scenario controls for all factors except for the number of people on failing septic systems, allowing us to target our evaluation on the changes we can expect with improved sewerage in the watershed. In the model we used two input parameters to express the septic system output in the watershed, under the Nutrient Data settings menu we were able to assign the number of systems in the watershed, and under the Animal Data settings menu we are able to assign the rate of failure as a decimal expressing the percent of failing systems. When testing the model we found that the type of septic system did not impact the outcome of the model, but that the percent failure rate directly effects the loading from septic systems. For our purposes we set the failure rate to 1 (100%) and just modified the number of people on septic systems to reflect the estimated failure rate within the geography of each modelling scenario. The ‘Septic Systems Populations’
settings menu is broken down into 12 months in which you can set the septic systems population, which we set to the same population for every month per the scenario conditions. In the ‘Other Pathogen Related Data’ settings menu we set the malfunctioning system rate to 1. In this menu we can also review and change pathogen loading settings from wildlife and urban areas.
30
Non-Point Source Assessment : Bacteria : Watershed Model
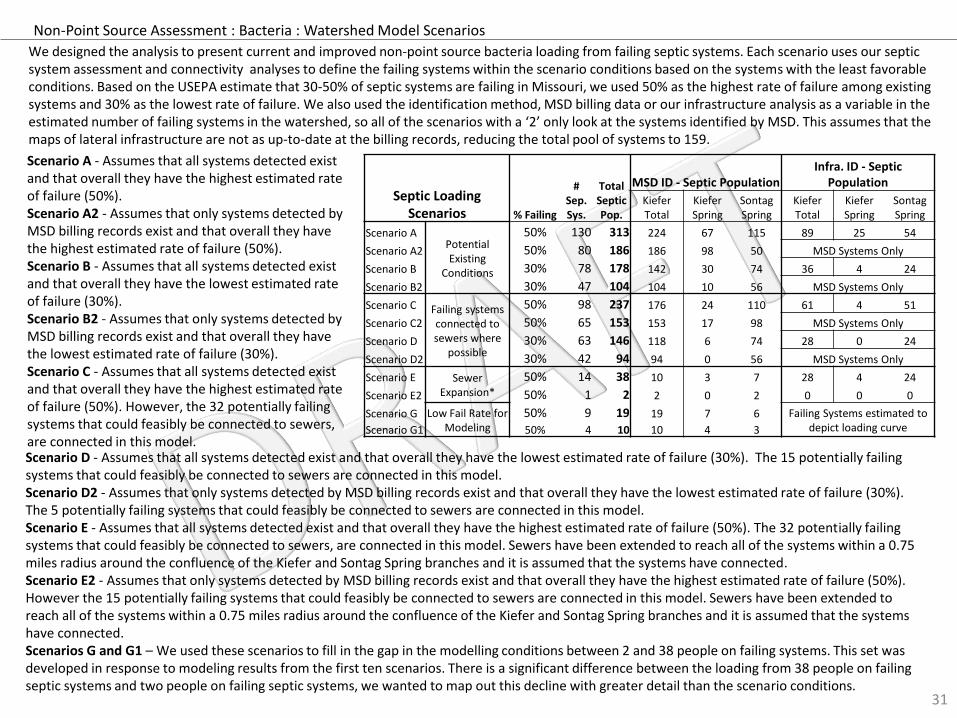
Scenario A - Assumes that all systems detected exist and that overall they have the highest estimated rate of failure (50%). Scenario A2 - Assumes that only systems detected by MSD billing records exist and that overall they have the highest estimated rate of failure (50%). Scenario B - Assumes that all systems detected exist and that overall they have the lowest estimated rate of failure (30%). Scenario B2 - Assumes that only systems detected by MSD billing records exist and that overall they have the lowest estimated rate of failure (30%). Scenario C - Assumes that all systems detected exist and that overall they have the highest estimated rate of failure (50%). However, the 32 potentially failing systems that could feasibly be connected to sewers, are connected in this model.
31
Septic Loading Scenarios % Failing
# Sep. Sys.
Total Septic Pop.
MSD ID - Septic PopulationInfra. ID - Septic
Population
Kiefer Total
Kiefer Spring
Sontag Spring
Kiefer Total
Kiefer Spring
Sontag Spring
Scenario APotential Existing
Conditions
50% 130 313 224 67 115 89 25 54
Scenario A2 50% 80 186 186 98 50 MSD Systems Only
Scenario B 30% 78 178 142 30 74 36 4 24
Scenario B2 30% 47 104 104 10 56 MSD Systems Only
Scenario C Failing systems connected to sewers where
possible
50% 98 237 176 24 110 61 4 51
Scenario C2 50% 65 153 153 17 98 MSD Systems Only
Scenario D 30% 63 146 118 6 74 28 0 24
Scenario D2 30% 42 94 94 0 56 MSD Systems Only
Scenario E Sewer Expansion*
50% 14 38 10 3 7 28 4 24
Scenario E2 50% 1 2 2 0 2 0 0 0
Scenario G Low Fail Rate for Modeling
50% 9 19 19 7 6 Failing Systems estimated to depict loading curveScenario G1 50% 4 10 10 4 3
We designed the analysis to present current and improved non-point source bacteria loading from failing septic systems. Each scenario uses our septic system assessment and connectivity analyses to define the failing systems within the scenario conditions based on the systems with the least favorable conditions. Based on the USEPA estimate that 30-50% of septic systems are failing in Missouri, we used 50% as the highest rate of failure among existing systems and 30% as the lowest rate of failure. We also used the identification method, MSD billing data or our infrastructure analysis as a variable in the estimated number of failing systems in the watershed, so all of the scenarios with a ‘2’ only look at the systems identified by MSD. This assumes that the maps of lateral infrastructure are not as up-to-date at the billing records, reducing the total pool of systems to 159.
Scenario D - Assumes that all systems detected exist and that overall they have the lowest estimated rate of failure (30%). The 15 potentially failing systems that could feasibly be connected to sewers are connected in this model. Scenario D2 - Assumes that only systems detected by MSD billing records exist and that overall they have the lowest estimated rate of failure (30%). The 5 potentially failing systems that could feasibly be connected to sewers are connected in this model. Scenario E - Assumes that all systems detected exist and that overall they have the highest estimated rate of failure (50%). The 32 potentially failing systems that could feasibly be connected to sewers, are connected in this model. Sewers have been extended to reach all of the systems within a 0.75 miles radius around the confluence of the Kiefer and Sontag Spring branches and it is assumed that the systems have connected. Scenario E2 - Assumes that only systems detected by MSD billing records exist and that overall they have the highest estimated rate of failure (50%). However the 15 potentially failing systems that could feasibly be connected to sewers are connected in this model. Sewers have been extended to reach all of the systems within a 0.75 miles radius around the confluence of the Kiefer and Sontag Spring branches and it is assumed that the systems have connected. Scenarios G and G1 – We used these scenarios to fill in the gap in the modelling conditions between 2 and 38 people on failing systems. This set was developed in response to modeling results from the first ten scenarios. There is a significant difference between the loading from 38 people on failing septic systems and two people on failing septic systems, we wanted to map out this decline with greater detail than the scenario conditions.
Non-Point Source Assessment : Bacteria : Watershed Model Scenarios
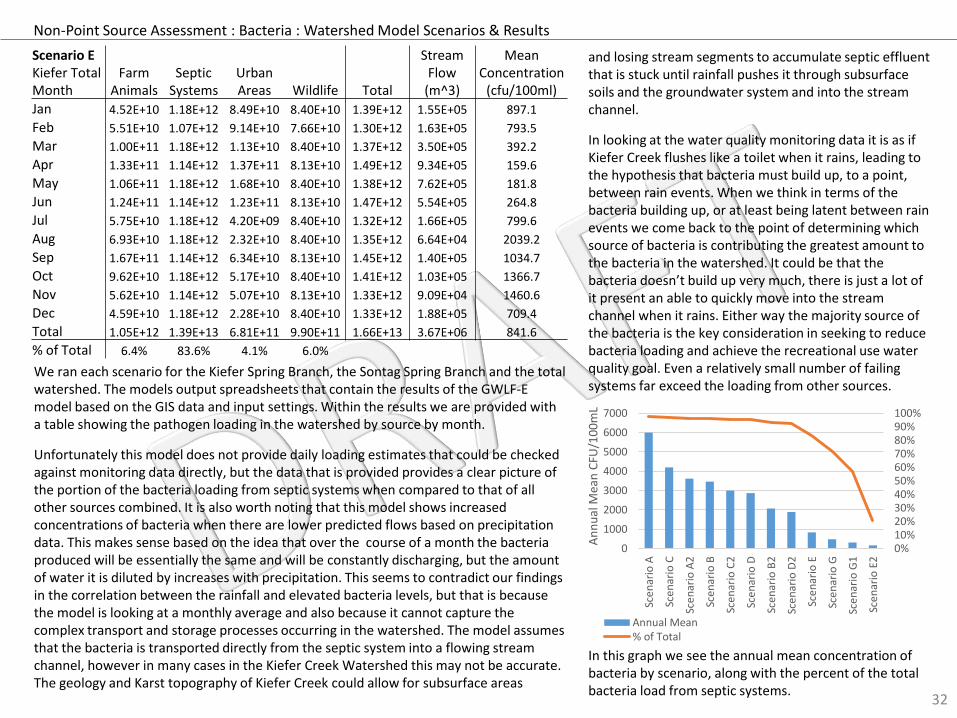
and losing stream segments to accumulate septic effluent that is stuck until rainfall pushes it through subsurface soils and the groundwater system and into the stream channel.
In looking at the water quality monitoring data it is as if Kiefer Creek flushes like a toilet when it rains, leading to the hypothesis that bacteria must build up, to a point, between rain events. When we think in terms of the bacteria building up, or at least being latent between rain events we come back to the point of determining which source of bacteria is contributing the greatest amount to the bacteria in the watershed. It could be that the bacteria doesn’t build up very much, there is just a lot of it present an able to quickly move into the stream channel when it rains. Either way the majority source of the bacteria is the key consideration in seeking to reduce bacteria loading and achieve the recreational use water quality goal. Even a relatively small number of failing systems far exceed the loading from other sources.
In this graph we see the annual mean concentration of bacteria by scenario, along with the percent of the total bacteria load from septic systems.
32
We ran each scenario for the Kiefer Spring Branch, the Sontag Spring Branch and the total watershed. The models output spreadsheets that contain the results of the GWLF-E model based on the GIS data and input settings. Within the results we are provided with a table showing the pathogen loading in the watershed by source by month.
Unfortunately this model does not provide daily loading estimates that could be checked against monitoring data directly, but the data that is provided provides a clear picture of the portion of the bacteria loading from septic systems when compared to that of all other sources combined. It is also worth noting that this model shows increased concentrations of bacteria when there are lower predicted flows based on precipitation data. This makes sense based on the idea that over the course of a month the bacteria produced will be essentially the same and will be constantly discharging, but the amount of water it is diluted by increases with precipitation. This seems to contradict our findings in the correlation between the rainfall and elevated bacteria levels, but that is because the model is looking at a monthly average and also because it cannot capture the complex transport and storage processes occurring in the watershed. The model assumes that the bacteria is transported directly from the septic system into a flowing stream channel, however in many cases in the Kiefer Creek Watershed this may not be accurate. The geology and Karst topography of Kiefer Creek could allow for subsurface areas
Scenario EKiefer TotalMonth
Farm Animals
Septic Systems
Urban Areas Wildlife Total
Stream Flow
(m^3)
Mean Concentration
(cfu/100ml)
Jan 4.52E+10 1.18E+12 8.49E+10 8.40E+10 1.39E+12 1.55E+05 897.1
Feb 5.51E+10 1.07E+12 9.14E+10 7.66E+10 1.30E+12 1.63E+05 793.5
Mar 1.00E+11 1.18E+12 1.13E+10 8.40E+10 1.37E+12 3.50E+05 392.2
Apr 1.33E+11 1.14E+12 1.37E+11 8.13E+10 1.49E+12 9.34E+05 159.6
May 1.06E+11 1.18E+12 1.68E+10 8.40E+10 1.38E+12 7.62E+05 181.8
Jun 1.24E+11 1.14E+12 1.23E+11 8.13E+10 1.47E+12 5.54E+05 264.8
Jul 5.75E+10 1.18E+12 4.20E+09 8.40E+10 1.32E+12 1.66E+05 799.6
Aug 6.93E+10 1.18E+12 2.32E+10 8.40E+10 1.35E+12 6.64E+04 2039.2
Sep 1.67E+11 1.14E+12 6.34E+10 8.13E+10 1.45E+12 1.40E+05 1034.7
Oct 9.62E+10 1.18E+12 5.17E+10 8.40E+10 1.41E+12 1.03E+05 1366.7
Nov 5.62E+10 1.14E+12 5.07E+10 8.13E+10 1.33E+12 9.09E+04 1460.6
Dec 4.59E+10 1.18E+12 2.28E+10 8.40E+10 1.33E+12 1.88E+05 709.4
Total 1.05E+12 1.39E+13 6.81E+11 9.90E+11 1.66E+13 3.67E+06 841.6
% of Total 6.4% 83.6% 4.1% 6.0%
0%10%20%30%40%50%60%70%80%90%100%
0
1000
2000
3000
4000
5000
6000
7000
Sce
nar
io A
Sce
nar
io C
Sce
nar
io A
2
Sce
nar
io B
Sce
nar
io C
2
Sce
nar
io D
Sce
nar
io B
2
Sce
nar
io D
2
Sce
nar
io E
Sce
nar
io G
Sce
nar
io G
1
Sce
nar
io E
2
An
nu
al M
ean
CFU
/10
0m
L
Annual Mean% of Total
Non-Point Source Assessment : Bacteria : Watershed Model Scenarios & Results

In the graph to the right we can see the total bacteria load from all sources, the population on septic systems and the percent of the total bacteria load by scenario. Along the left y-axis we have plotted the population and percent of total bacteria from septic systems, the axis is in logarithmic scale. Following the right y-axis we have plotted the total annual bacteria output by source in trillions of organisms. The scenarios have been arranged according to the population on septic systems. This graph shows that without reductions in the number of failing systems, it will be impossible to achieve significant reductions in bacteria loading in Kiefer Creek. It is possible that the number of failing systems could be reduced by replacing broken components or entire systems, however this approach has a number of weaknesses. Replacing entire systems can be very expensive, especially on small lots where it may not even be permissible according to current plumbing code regulations regarding lot size. All septic systems, and especially newer systems, require attentive maintenance and will inevitably face component failure at some point. Homeowners may not be able to determine when a system failure is occurring. Kiefer Creek has exactly the wrong kind of geology and hydrology for a proper septic system, and failing systems can discharge into the shallow groundwater, evading detection. By connecting to centralized sewers or adopting an alternative technology like a composting toilet, the bacteria discharge from that population is reduced to zero, there is the potential for sanitary sewer system to break on occasion, but MSD is responsive and adept when it comes to detecting and repairing sanitary sewer issues. Composting toilets require more interaction than most people may be comfortable with; but the cost, reliability and low-impact of this type of system may appeal to people farther from the beaten path in places harder to reach with sewer lines.
33
0.0%10.0%20.0%30.0%40.0%50.0%60.0%70.0%80.0%90.0%100.0%
0
1000
2000
3000
4000
5000
6000
7000
0 100 200 300
Mea
n A
nn
ual
B
acte
ria
Co
nce
ntr
atio
n
Septic Population
Mean Annual Bacteria by Septic Population
Annual Mean % of TotalLinear (Annual Mean)
31
3
23
7
18
6
17
8
15
3
14
6
10
4
94
38
19
10
2
97
.4%
96
.7%
96
.1%
96
.0%
95
.4%
95
.1%
93
.3%
92
.6%
83
.6%
71
.8%
57
.3%
21
.1%
0
1
10
100
1000
0
20
40
60
80
100
A -
31
3
C -
23
7
A2
- 1
86
B -
17
8
C2
- 1
53
D -
14
6
B2
- 1
04
D2
- 9
4
E -
38
G -
19
G1
- 1
0
E2 -
2
% o
f To
tal B
acte
ria
Sep
tic
Po
pu
lati
on
Tota
l An
nu
al B
acte
ria
CFU
Ou
tpu
t (T
rilli
on
s)
Total Annual Bacteria Loading by Source
Urban Areas Wildlife
Farm Animals Septic Systems
Population Septic Systems % of Total
In the graph to the left we have plotted the Mean Annual Bacteria Concentration against the failing septic system population. There is a direct correlation between the two, and we see that the failing septic systems will need to be reduced to less than 50 systems before a significant reduction in bacteria will be seen in the watershed.
Non-Point Source Assessment : Bacteria : Watershed Model Results

Connectable Parcels When a home with a septic system is connected to the centralized sewer system the system maintenance is no longer the responsibility of the homeowner and the lateral connection to the sewer is covered against failure by the St. Louis County Lateral Program. Upon connection and removal or closure of the septic tank the bacteria contribution from a home is effectively eliminated for good, making this an ideal solution in many cases. That said, lateral line connections are not cheap and can be very costly depending on the distance of the connection and site conditions, which could spell financial disaster for homeowners on fixed or limited incomes. It is important that the watershed plan works for the community, so we have sought out a policy based solution to this issue that will have the least financial impact on homeowners in the watershed. Through policy changes and smart utilization of financial resources, the connectable parcels in the watershed can be addressed without creating disastrous financial impacts for current residents.
The primary regulatory authority over septic systems falls on the State and County Departments of Health. In St. Louis County, enforcement is currently driven only by complaints, which are informed by observations of local residents, not water quality considerations. When a complaint is made it is important to ensure that a professional inspection occurs and includes an evaluation of the site in terms of the 200ft sewer connection requirement. If a connection is available there should be a financing instrument available to homeowners to allow them to pay off the cost over time and potentially receive funding to offset the connection cost.
St. Louis County currently includes a $28 lateral program fee in the annual property taxes on all residential parcels, and the funds are to be used to repair broken lateral lines, but currently cannot be used to establish new lateral connections. The basis of the lateral program and centralized infrastructure overall, is to reduce wastewater issues in valuable local water resources. Kiefer is a highly valued local stream that is easily and readily accessed in Castlewood State Park. Using lateral program funds to resolve issues with outdated infrastructure in the Kiefer Watershed would be in-line with the underlying goals of the program, protecting what is arguably the most highly valued small
stream in our region. In addition, it makes sense to use any other available funding source to further encourage connection to centralized sewers where possible. At the state level there are both 319 funds and State Revolving Load funds that may be available to help offset or defer the costs of installing new lateral connections in the watershed. These connections will result in increased property value and elimination of septic system maintenance costs, but will add to the monthly sewer bill. The cost of sewer service is comparable to the cost of proper septic system maintenance and repair. In a loan-based program there may be a way to recoup the loan balance at the time of sale under the reasoning that the home sale price has increased due to the lateral connection. Following this line of reasoning, expedited connections could be made with a provision allowing for the cost to be paid when the home is sold at a future date.
Time of Sale Occupancy Permit Sanitary Inspection Requirement When a property is put on the market a recent inspection of the waste treatment method should be required, just as an inspection of other fundamental systems in a home must be inspected. This should be a requirement for the issuance of an occupancy permit. This inspection should include an evaluation of the site in terms of the 200ft connection rule, which would require connections where possible. If a failing system cannot feasibly be connected to the centralized sewers at the time of sale, the system will need to be fixed and updated to current design standards according to site conditions, or replaced with a more effective alternative waste treatment technology. The cost of the lateral connection, septic system repairs and upgrades, or an alternative technology should be included in the sale price of the property, thereby financing the upgrades and passing along the improved property value to the new owner without having a major financial impact on the prior owner.
Milestones# of Septic Systems Inspected# of Septic Systems Converted to Lateral Connections # of Septic Systems Repaired and/or Replaced
34
Best Management Practices : Bacteria : Septic Systems : Connectable Parcels

Distribution of Septic System Information – In many cases a lateral connection is not currently possible, resulting in septic systems that will fail the inspection at the time of sale that cannot be connected via lateral. These systems may be updated to ensure that waste is being treated most effectively and that there is the least likelihood of a leak, or an alternative technology may be implemented. As we pointed out earlier in this section, the soils and Karst topography of the watershed make it ill suited for septic systems. Septic systems also rely on the homeowner for maintenance and repairs, however many homeowners may not know how to properly maintain their system and some may not even know that they have a septic system. Many newer systems, especially those designed for poor site conditions, rely on careful maintenance which may exceed the expertise of many homeowners. To ensure that all septic system owners have the information available to them it is recommended that all parcels identified as likely to have septic systems be mailed comprehensive information on how to maintain a septic system. This mailing should include a response form that the septic owners can use to send back information regarding their maintenance of their system, and their interest in moving forward with a lateral connection or alternative technology.Milestones• % of septic system owners provided with information• # of resulting maintenance activities, inspections and upgrades
Expanded Sewer Infrastructure – When septic systems are replaced with lateral connections the maintenance responsibility is taken care of by St. Louis County and MSD, eliminating the burden on the homeowner to understand how to maintain their system and have it professionally inspected and repaired. For these reasons there is good cause to consider the potential to expand the reach of sewer infrastructure in the watershed to allow more homeowners to connect to the sewer system. It is worth noting however that in some cases the expansion of sewer infrastructure could spur an increase in development of areas in the watershed. In expanding the sewer infrastructure there are many factors to consider and it is important to prioritize the investments that will have biggest impact on helping Kiefer Creek achieve compliance
with the recreational use criteria for bacteria. There are currently an estimated 66 miles of sewers in the watershed which serve over 3000 parcels. In the areas just upstream from Castlewood State Park, where the highest concentration of problematic septic systems are located, we estimate that the installation of around 2 miles of sewer lines would allow all of these homes to be connected to the centralized sewers. An additional estimated 4.5 miles of sewers would allow all but 25 to 30 septic systems in the watershed to be replaced with lateral connections.
To move forward with an effort to expand sewer infrastructure a feasibility study should be conducted to establish the costs, requirements, constraints and timeframe for expanding infrastructure into these areas. Under Section 604b of the Clean Water Act the regional planning authority is allowed funding to develop a feasibility study. This process would be led by the East/West Gateway Council in close coordination with MSD, St. Louis County and impacted watershed residents. Although the entire watershed falls within the service area of MSD, a sub-districting process may be required to implement an expansion of the sewer lines in the watershed. It is unclear if all potentially connected septic systems would be required to immediately connect when new sewers were laid. However, just by being available the new sewer lines would amplify the potential impact of the time of sale policy change clearing the way to a clean and safe Kiefer Creek.Milestones• Sewer Expansion Feasibility Study• Progress on installation of sewers in priority expansion areas• # of septic systems replaced with lateral connections to new sewers
35
Best Management Practices : Bacteria : Septic Systems : Un-Connectable Parcels

Watershed Community: Unincorporated St. Louis County & Wildwood
Formation of a Neighborhood Improvement District – Funding is going to be a major hurdle to overcome, each failing system represents a potential cost of more than $15,000 to replace or repair a septic system, or construct a lateral connection. This upfront cost makes it unlikely that homes will be proactive in connecting to sewers, especially where people have lower or fixed incomes. This means that progress in reducing bacteria in the watershed would be dependent on a time of sale requirement that could take decades to impact enough of the failing systems. Just because the sewers have expanded, doesn’t mean that homes are necessarily connected to them, as we see in the current conditions in the watershed. So when new sewers are built how do we ensure that all homes that can connect do, and how can we make it easier for homeowners to implement connections as soon as possible? A neighborhood improvement district would create a pool of low-interest loan funding that could be used to complete connections ASAP and be paid back in small installments over time by the homeowner, the balance of the loan being paid at the time of the home sale or carrying over to the new owner. Some financial mechanism must be made available in order to expedite the reduction of bacteria in the watershed.
Recommended Alternative TechnologyComposting Toilets – No longer limited to remote areas where water is scarce, composting toilets have been making a positive impact on water quality by eliminating pathogens and conserving water. Because composting toilets eliminate the need to flush toilets, this significantly reduces water use and allows for the recycling of valuable plant nutrients. Composting toilets contain, immobilize, and destroy pathogens using heat and aerobic decomposition, reducing the risk of human infection to acceptable levels without contaminating the environment. There is no smell associated with composting toilets. Correctly installed and operating composting toilet will not smell because there is a positive suction of air through the toilet at all times. The convenience behind a composting toilet is that it can be installed anywhere unlike a septic system or sewer line. Waterless toilets can be used in all types of conditions and areas including areas with: low percolation, high water tables, shallow soil, or rough terrain.
Composting toilets are relatively inexpensive as compared to septic systems and lateral connections however they may be difficult for many people to accept because the waste does not just ‘go away.’ Composting toilet systems do require some maintenance, electricity and well thought out siting and installation. Milestones# of septic systems replaced with composting toilets
36
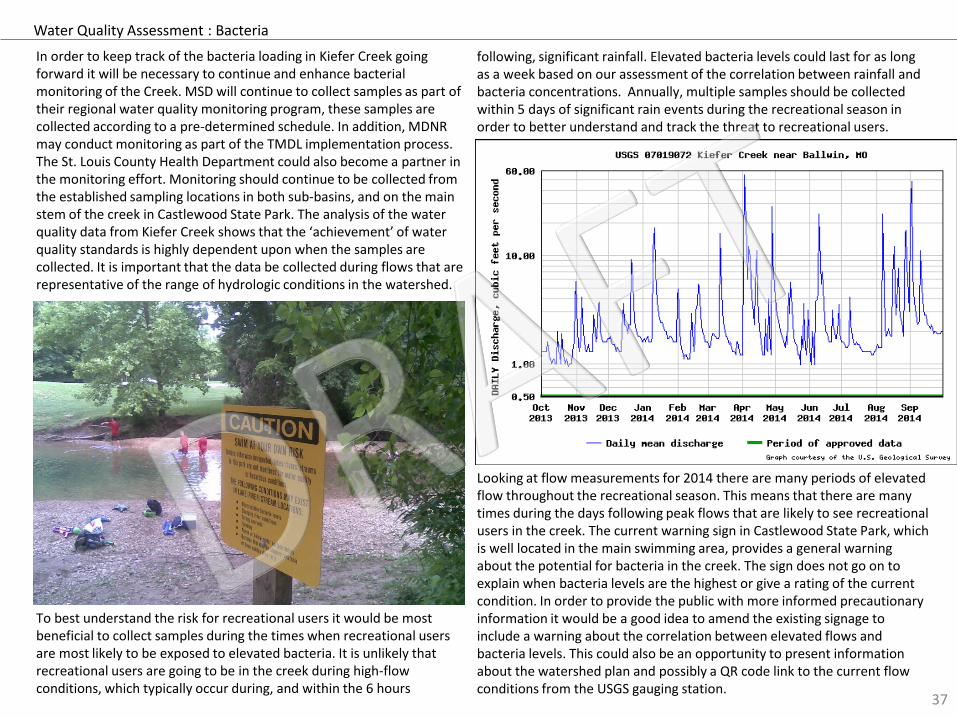
Water Quality Assessment : Bacteria
In order to keep track of the bacteria loading in Kiefer Creek going forward it will be necessary to continue and enhance bacterial monitoring of the Creek. MSD will continue to collect samples as part of their regional water quality monitoring program, these samples are collected according to a pre-determined schedule. In addition, MDNR may conduct monitoring as part of the TMDL implementation process. The St. Louis County Health Department could also become a partner in the monitoring effort. Monitoring should continue to be collected from the established sampling locations in both sub-basins, and on the main stem of the creek in Castlewood State Park. The analysis of the water quality data from Kiefer Creek shows that the ‘achievement’ of water quality standards is highly dependent upon when the samples are collected. It is important that the data be collected during flows that are representative of the range of hydrologic conditions in the watershed.
To best understand the risk for recreational users it would be most beneficial to collect samples during the times when recreational users are most likely to be exposed to elevated bacteria. It is unlikely that recreational users are going to be in the creek during high-flow conditions, which typically occur during, and within the 6 hours
37
following, significant rainfall. Elevated bacteria levels could last for as long as a week based on our assessment of the correlation between rainfall and bacteria concentrations. Annually, multiple samples should be collected within 5 days of significant rain events during the recreational season in order to better understand and track the threat to recreational users.
Looking at flow measurements for 2014 there are many periods of elevated flow throughout the recreational season. This means that there are many times during the days following peak flows that are likely to see recreational users in the creek. The current warning sign in Castlewood State Park, which is well located in the main swimming area, provides a general warning about the potential for bacteria in the creek. The sign does not go on to explain when bacteria levels are the highest or give a rating of the current condition. In order to provide the public with more informed precautionary information it would be a good idea to amend the existing signage to include a warning about the correlation between elevated flows and bacteria levels. This could also be an opportunity to present information about the watershed plan and possibly a QR code link to the current flow conditions from the USGS gauging station.

In addition to the scheduled monitoring by MSD; MDNR and the St. Louis County Health Department could undertake more targeted monitoring approaches to fully understand the correlation between rainfall, flow and bacteria concentrations. It would be immensely beneficial to collect samples sets before, during and after a rain event on an annual basis during the recreational season. Starting prior to the rain event, samples could be collected at intervals such as every 4, 6 or 12 hours or in the morning and afternoon, continuing until at least 72 hours after the peak flow conditions or when flow stabilizes around the 50th percentile flow of 2.5 cfs.
This type of coordinated monitoring presents two significant logistical challenges. Someone will have to collect and deliver the sample to the lab, and proper quality control measures require that a sample be delivered to a laboratory for bacterial testing within 6 hours of the collection time. These difficulties may be surmounted with enrollment of watershed partners at the Wildlife Rescue Center and Castlewood State Park in the collection of samples at regular intervals. The person taking the sample will have to coordinate closely with the lab to ensure that samples are received in time. This testing protocol could achieved through a university partnership to gain access to a laboratory during non-business hours for research purposes.
Water Quality Assessment : Bacteria
38
In the example above proposed rain event sampling times have been overlaid on a USGS hydrograph of a rain event in Kiefer Creek
It is also very important to continue the review of water quality data in Kiefer Creek at regular intervals over the course of the implementation of best management practices and non-point source pollution reduction strategies. The results of this analysis will be used to gauge the effectiveness of the practices that have been implemented and inform the adaptation of the watershed plan.
On an annual basis, new monitoring data and trends should be compared to implementation measures and milestones in each sub-basin and in the overall watershed. MSD already assembles annual reports on the data they collect in the watershed, and they could also provide a list of parcels in the watershed that have been added to the sanitary sewers over the past year. MDNR and a watershed coalition could collect information regarding other best management practices according to the milestones for each practice. BMPs that are funded through 319 grants would require extensive reporting on implementation activities. The watershed coalition partners could keep track other implementation activities and hold a meeting on a yearly basis to review the findings, discuss implementation successes and challenges, and tweak ongoing efforts and projects. Every five years the plan should be revisited and revised based on major trends and successes.
WQ Sample
USGS SUMMARY STATISTICSWater Year
2014Water Years 1996-2014
Annual total 1,165
Annual mean 3.19 5.55
Highest annual mean 9.31 2010
Lowest annual mean 3.11 2001
Highest daily mean 55 3-Apr 302 9/14/08
Lowest daily mean 0.94 25-Oct 0.51 5/6/08
Annual 7-day minimum 1.01 22-Oct 0.629 8/22/03
Maximum peak flow 1,320 1-Sep 2,570 9/14/08
Maximum peak stage 7.59 1-Sep 10.48 9/14/08
Annual runoff (cfsm) 0.816 1.42
Annual runoff (inches) 11.1 19.3
10 percent exceeds 5.28 11
50 percent exceeds 1.8 2.5
90 percent exceeds 1.2 1.2
Related Documents