Water Quality 2013-2014 Coaches Workshop Adapted from the PowerPoint developed by KAREN LANCOUR & C. Robyn Fischer KAREN LANCOUR & C. Robyn Fischer sonic.org sonic.org 2013 2013

Water Quality 2013-2014 Coaches Workshop KAREN LANCOUR & C. Robyn Fischer sonic.org 2013 Adapted from the PowerPoint developed by KAREN LANCOUR & C. Robyn.
Dec 18, 2015
Welcome message from author
This document is posted to help you gain knowledge. Please leave a comment to let me know what you think about it! Share it to your friends and learn new things together.
Transcript

Water Quality 2013-2014
Coaches Workshop
Adapted from the PowerPoint developed by KAREN LANCOUR & C. Robyn Fischer KAREN LANCOUR & C. Robyn Fischer sonic.org sonic.org 20132013


Ecology Content – 2014Ecology Content – 2014– Part 1 – Part 1 – Estuary and Marine Ecology Estuary and Marine Ecology
– Part 2 – Part 2 – Coral Reef EcologyCoral Reef Ecology
– Part 3 – Part 3 – Water Monitoring and Analysis Water Monitoring and Analysis
Process skillsProcess skills in data, graph and in data, graph and diagram analysis diagram analysis
Event parameters – Event parameters – check the event check the event parameters in the rules for resources parameters in the rules for resources allowed.allowed.

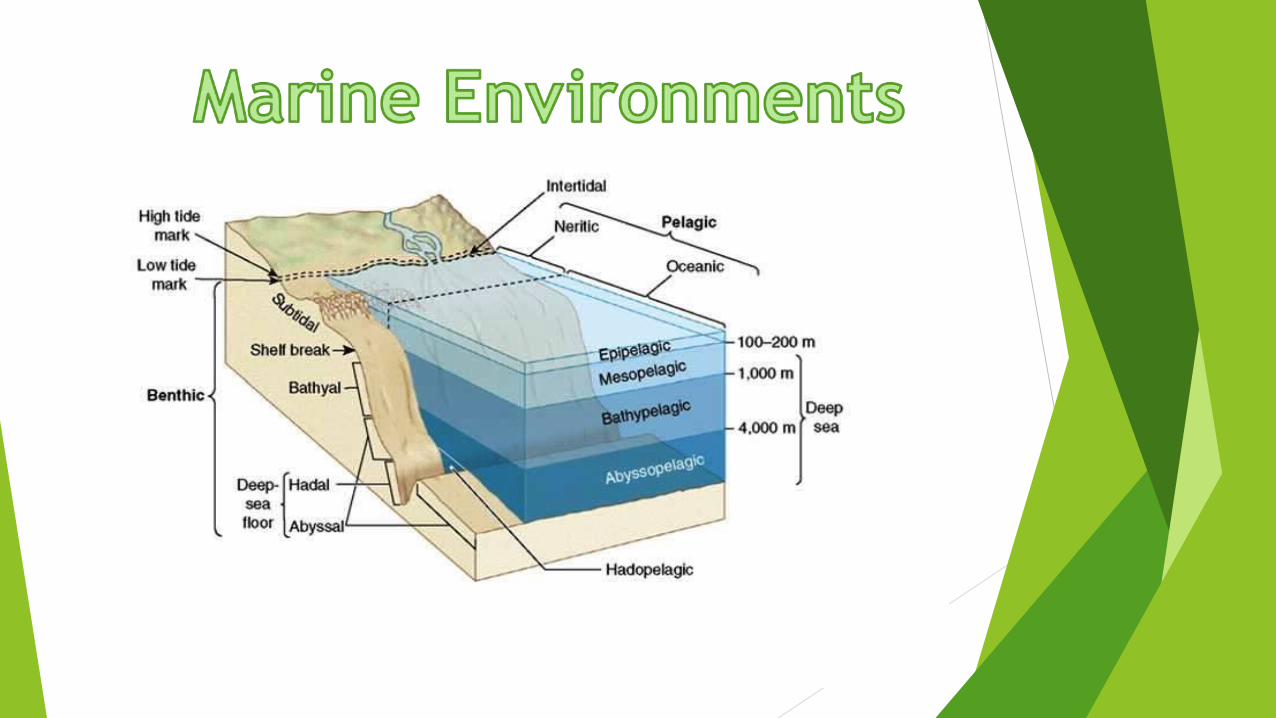
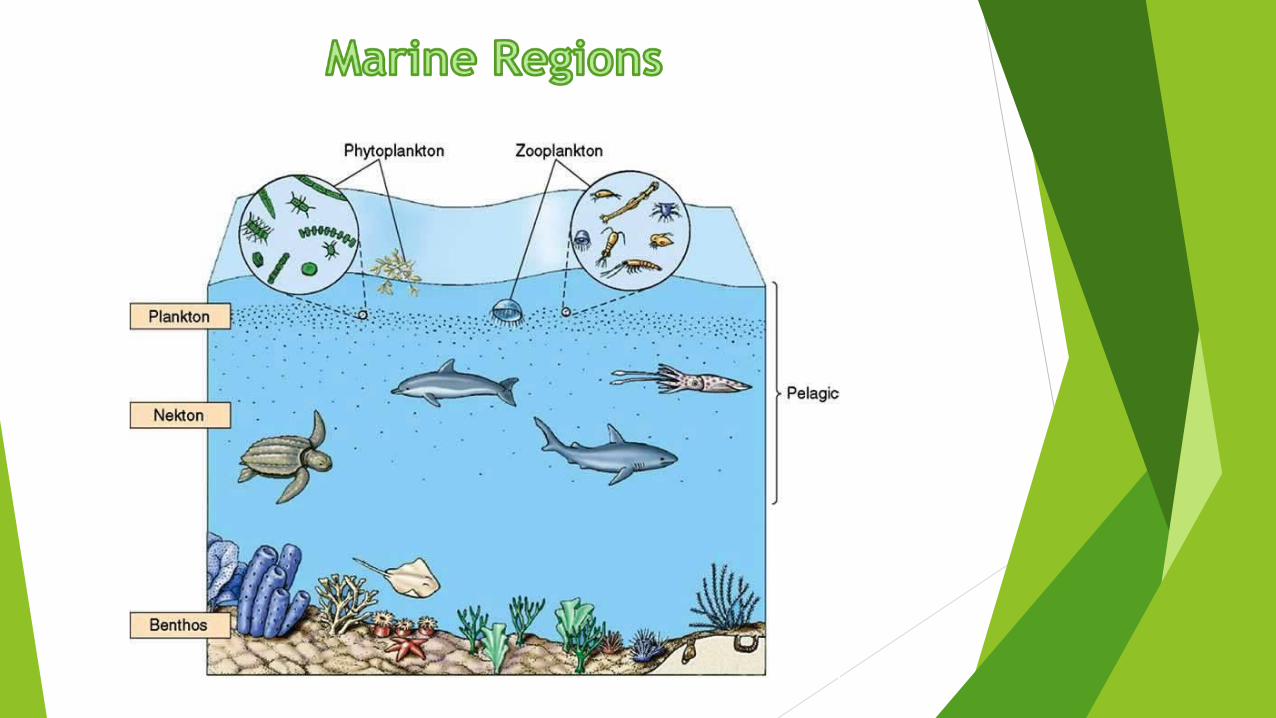
–Aquatic Ecology in Aquatic Ecology in Marine/Estuary EnvironmentsMarine/Estuary Environments
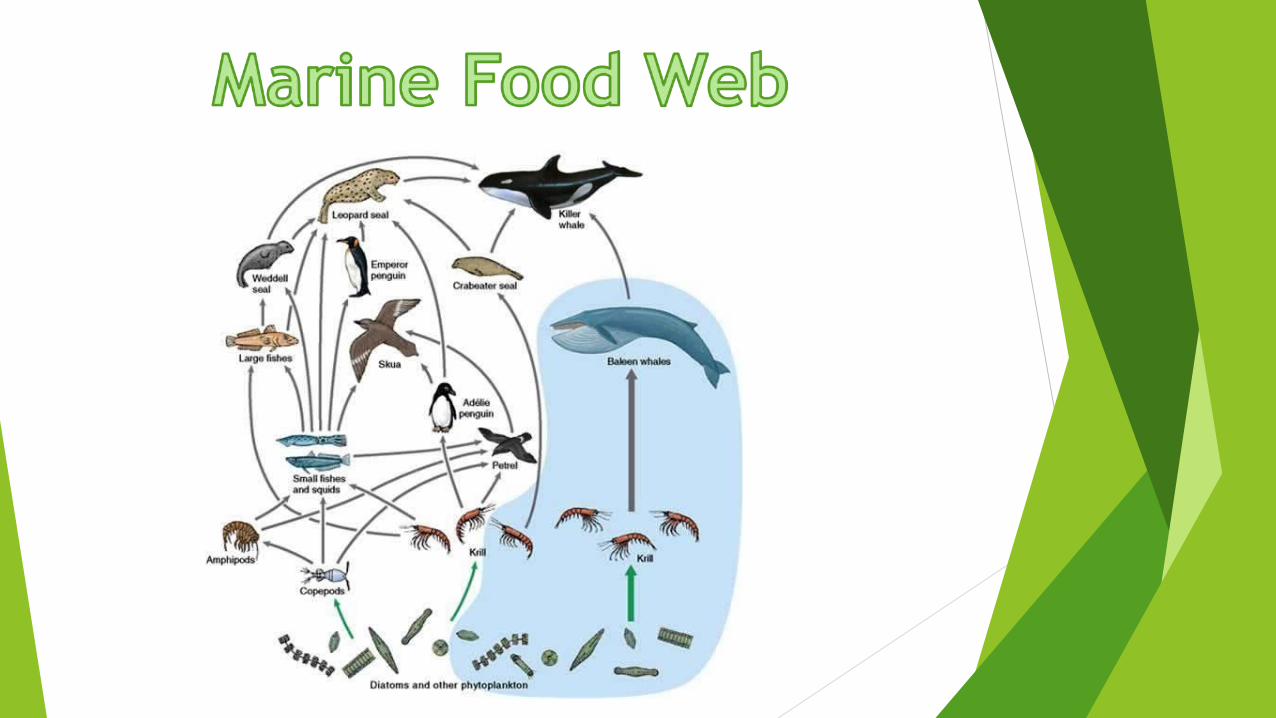
–Aquatic Food Chains and Aquatic Food Chains and WebsWebs
– Population DynamicsPopulation Dynamics– Community Interactions Community Interactions –Nutrient Recycling Nutrient Recycling –Water CycleWater Cycle– Threats to Marine & Estuary Threats to Marine & Estuary Water Quality Water Quality

watersalinitylightpressuretemperaturedissolved gasespHtidescurrentswavessubstratumnutrient supplyexposure to air

The oceans consist of (by mass):
96.5% water
3.0% sodium and chlorine ions (table salt, Na+ and Cl–)
0.5% other salts

Ecological pyramid - a graph representing trophic level numbers within an ecosystem. The primary producer level is at the base of the pyramid with the consumer levels above.
Numbers pyramid - compares the number of individuals in each trophic level. May be inverted due to size of individuals
Biomass pyramid - compares the total dry weight of the organisms in each trophic level.
Energy pyramid - compares the total amount of energy available in each trophic level. This energy is usually measured in kilocalories.
Oil spills and their ecological disasters
Marine dumping of wastes – plastic and other wastes
Dredging Wastes
Overfishing
Ocean acidification reducing calcium carbonate
Population displacement
Mangrove Destruction
Bycatch – marine wildlife unintentionally caught as sea turtles, porpoises, albatross, crabs, starfish & fish
Whaling is still a problem though strides are being make
Marine Pollution Habitat DestructionOverfishing and ExploitationClimate ChangeSea Temperature Rise Ocean Acidification Invasive Species Ocean Dead Zones
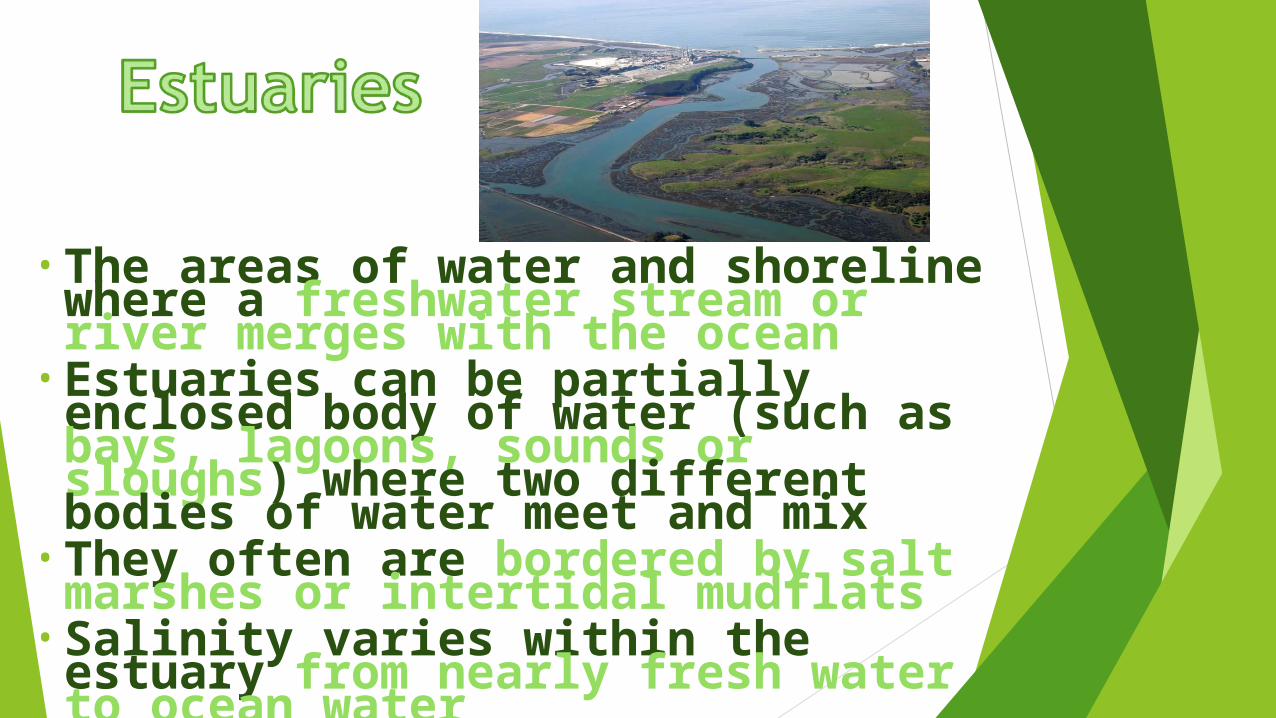
• The areas of water and shoreline where a freshwater stream or river merges with the ocean
• Estuaries can be partially enclosed body of water (such as bays, lagoons, sounds or sloughs) where two different bodies of water meet and mix
• They often are bordered by salt marshes or intertidal mudflats
• Salinity varies within the estuary from nearly fresh water to ocean water
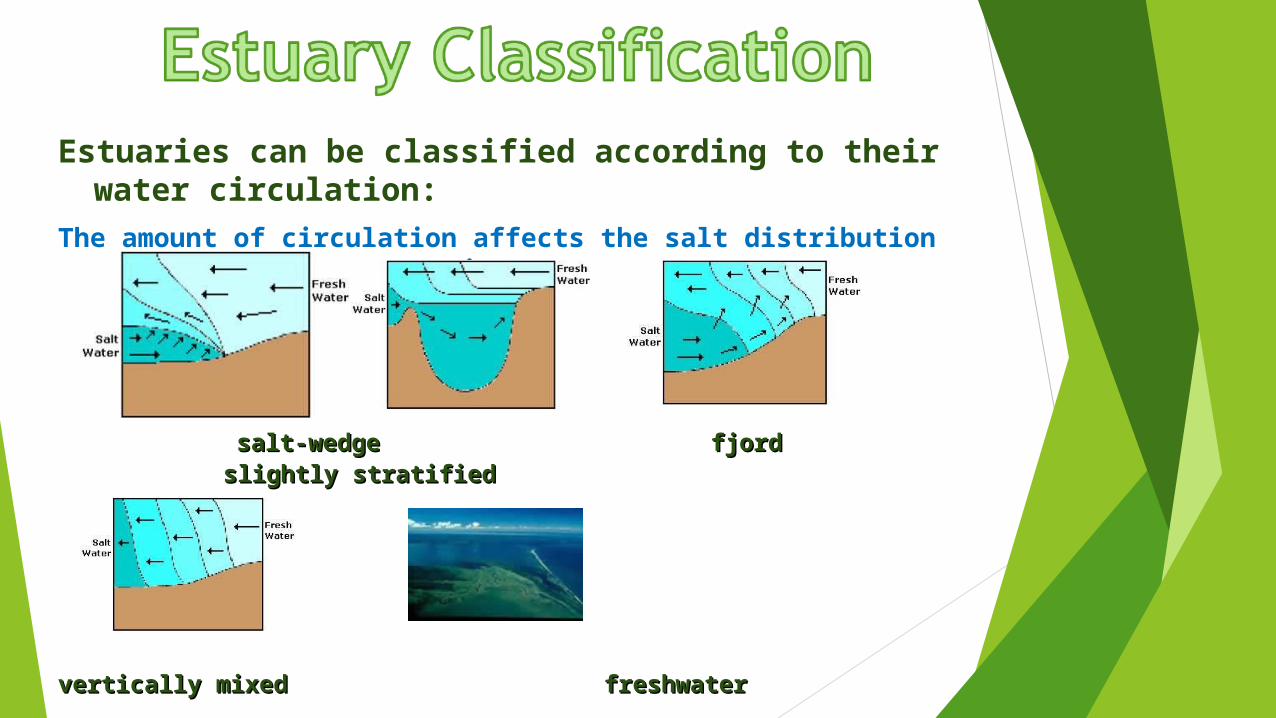
Estuaries can be classified according to their water circulation:
The amount of circulation affects the salt distribution and salinity concentrations
salt-wedge salt-wedge fjord slightly fjord slightly stratifiedstratified
vertically mixedvertically mixed freshwater freshwater

Of the 32 largest cities in the world, 22 are located on estuaries
Many animal species rely on estuaries for nesting and breeding
Most of the fish and shellfish eaten in the United States, including salmon, herring, and oysters, complete at least part of their life cycles in estuaries
Estuaries filter out sediments and pollutants from rivers and streams before they flow into the ocean, providing cleaner waters for humans and marine life
Humans also rely on estuaries for recreation, jobs, and even our homes
Coastal development, introduction of invasive species, over fishing, dams, and global climate change have led to a decline in the health of estuaries, making them one of the most threatened ecosystems on Earth

oyster reefs kelp forests rocky and soft
shorelines submerged
aquatic
vegetation coastal marshes mangroves
forests deep-water
swamps
and riverine forests
mud flats tidal streams barrier beaches salt marshes

Salinity, temperature, water levels and light Salinity, temperature, water levels and light levels vary along the length of an estuarylevels vary along the length of an estuary
shutting up shells, digging borrows and excretion of excess salts
fish maintain water balance by actively drinking salt water
increasing their respiratory water flow and increase oxygen consumption
mechanisms to deal with high energy winds and waves
most efficient tree is low, with numerous crowded branches
the tree may include flattening of the trunk, root and branches in a plan parallel to the wind direction


Too many nutrients
Pathogens
Toxic chemicals
Habitat loss
Invasive Species
Changes in water flow

Examine coral reefs and the effects of pollution on reef ecosystems
•Topics that may be included are: coral reef biology growth and reproduction zooxanthellae reef fish communitiesreef ecosystemhealth indicatorsthe importance of coral reefsproblems associated with pollutionmanagement of reef systems
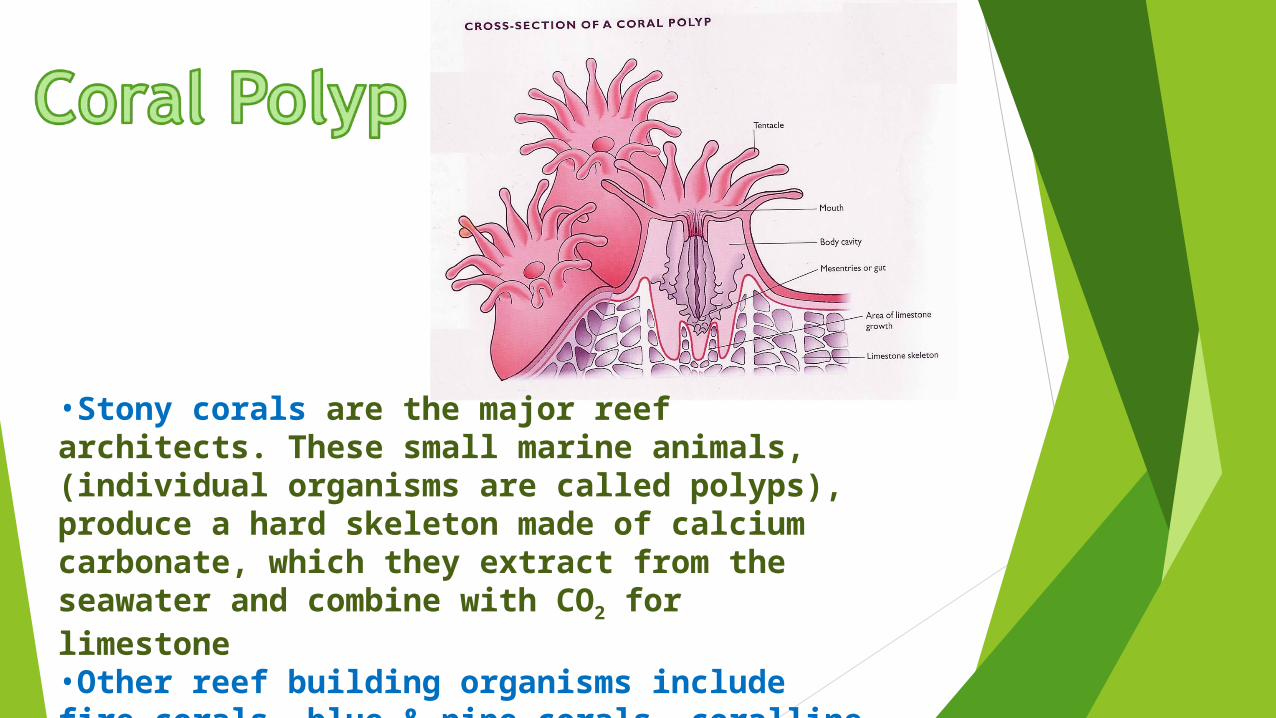
•Stony corals are the major reef architects. These small marine animals, (individual organisms are called polyps), produce a hard skeleton made of calcium carbonate, which they extract from the seawater and combine with CO2 for limestone•Other reef building organisms include fire corals, blue & pipe corals, coralline algae, tropical reef worms

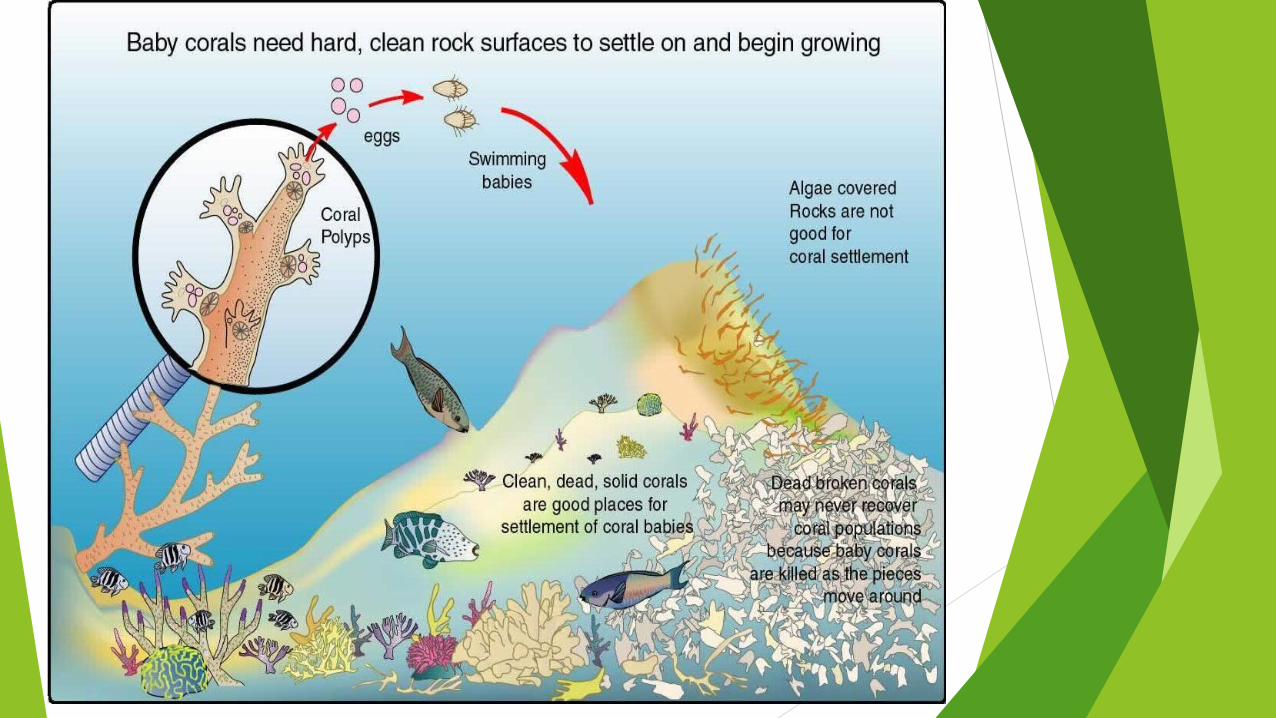
First stage of the coral’s life cycle is planulae larvae, which allows it to be free swimming.
Second stage of its life is polyp which is when the coral is stuck to a rock.
In the polyp stage, it is able to reproduce,
either asexual - involves the splitting of a coral (called fission) or sprouting another coral from itself (called budding).
sexually (with another polyp)
involves a cycle of:
SPAWNING >> FERTILIZING >> PLANULAE LARVAE SETTLEMENT >> CLONING

Coral Polyp provides a home for the zooxanthellae, it provides nitrates and phosphates, and it gives off CO2
Zooxanthellae, a dinoflagellate carries out photosynthesis and make oxygen and food for the polyp through photosynthesis, gain nutrients from the corals nitrogen and phosphorus wastes, and provide for most of the colors for the coral in the reef making them look like underwater gardens

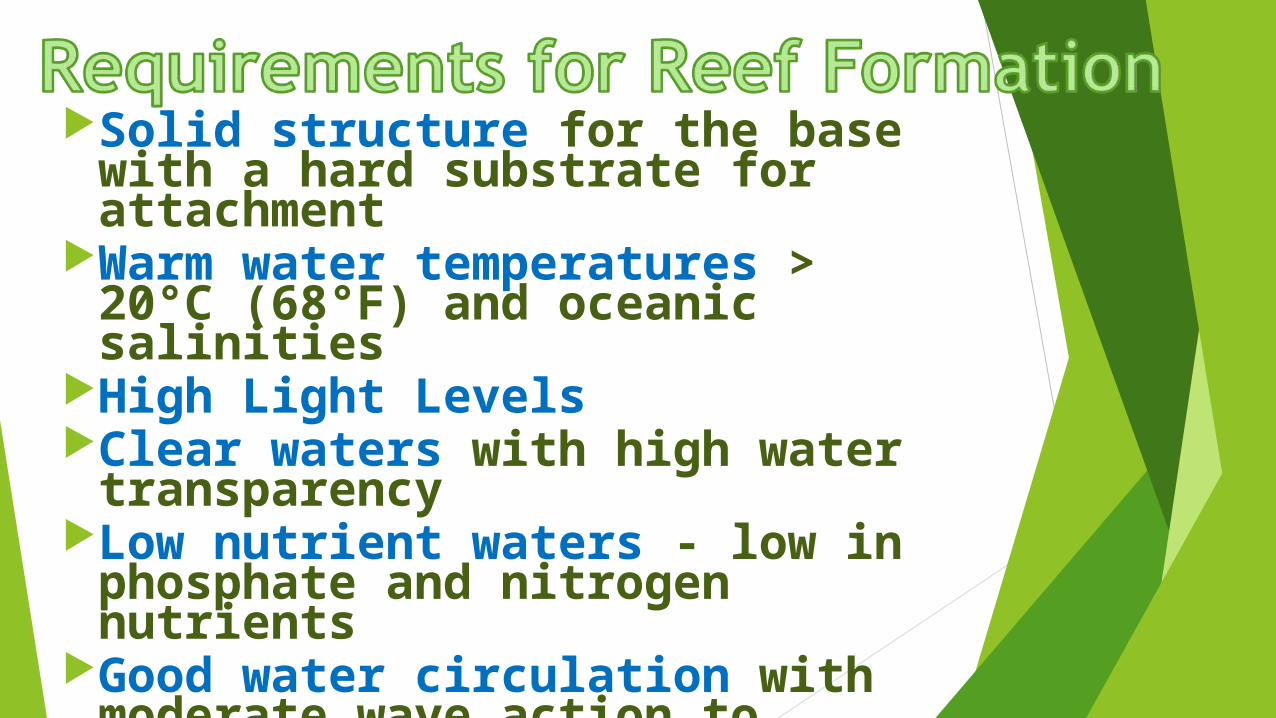
Solid structure for the base with a hard substrate for attachment
Warm water temperatures > 20°C (68°F) and oceanic salinities
High Light LevelsClear waters with high water
transparencyLow nutrient waters - low in
phosphate and nitrogen nutrients
Good water circulation with moderate wave action to disperse wastes and bring oxygen and plankton to the reef


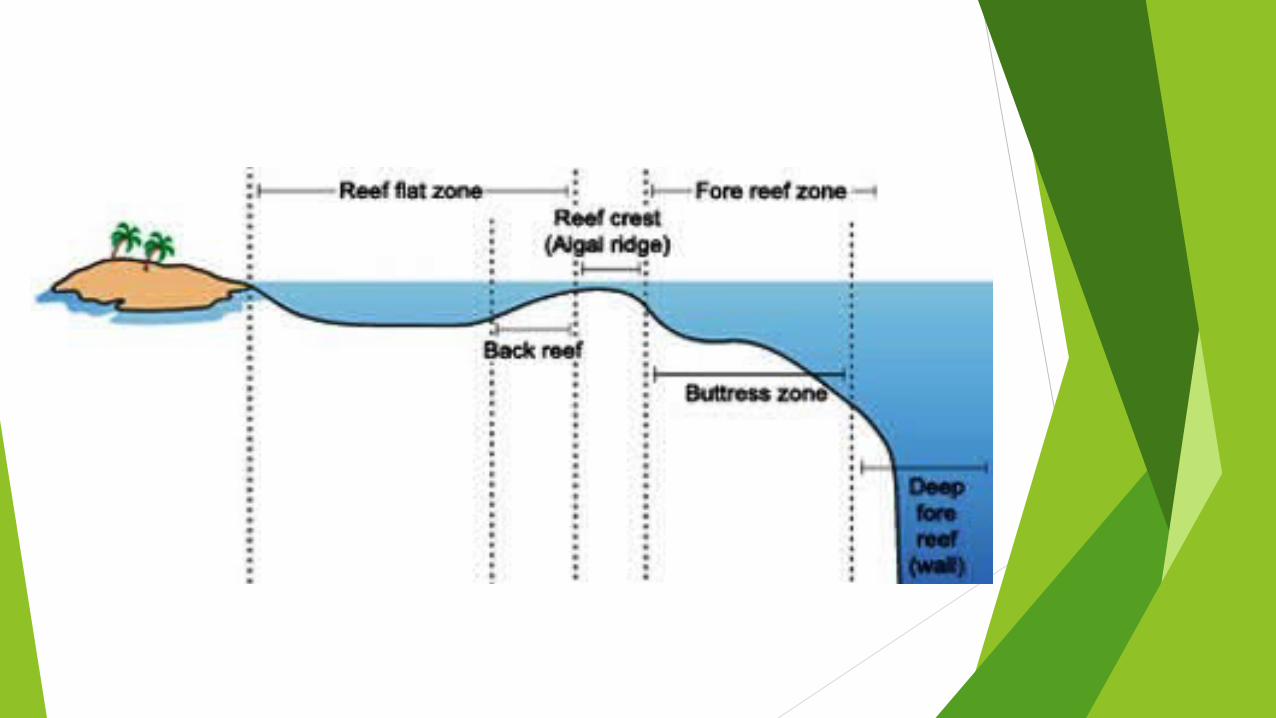
Shore or inner reef zone - area is between the crest and the shoreline-full of life including fishes, sea cucumbers, starfish, and anemones.
Crest reef zone - highest point of the reef and where the waves break over the reef.
Fore or outer reef zone - As the reef wall falls off, the waters get calmer. Around 30 feet deep, will be the most populated part of the reef along with lots of different types of coral species.

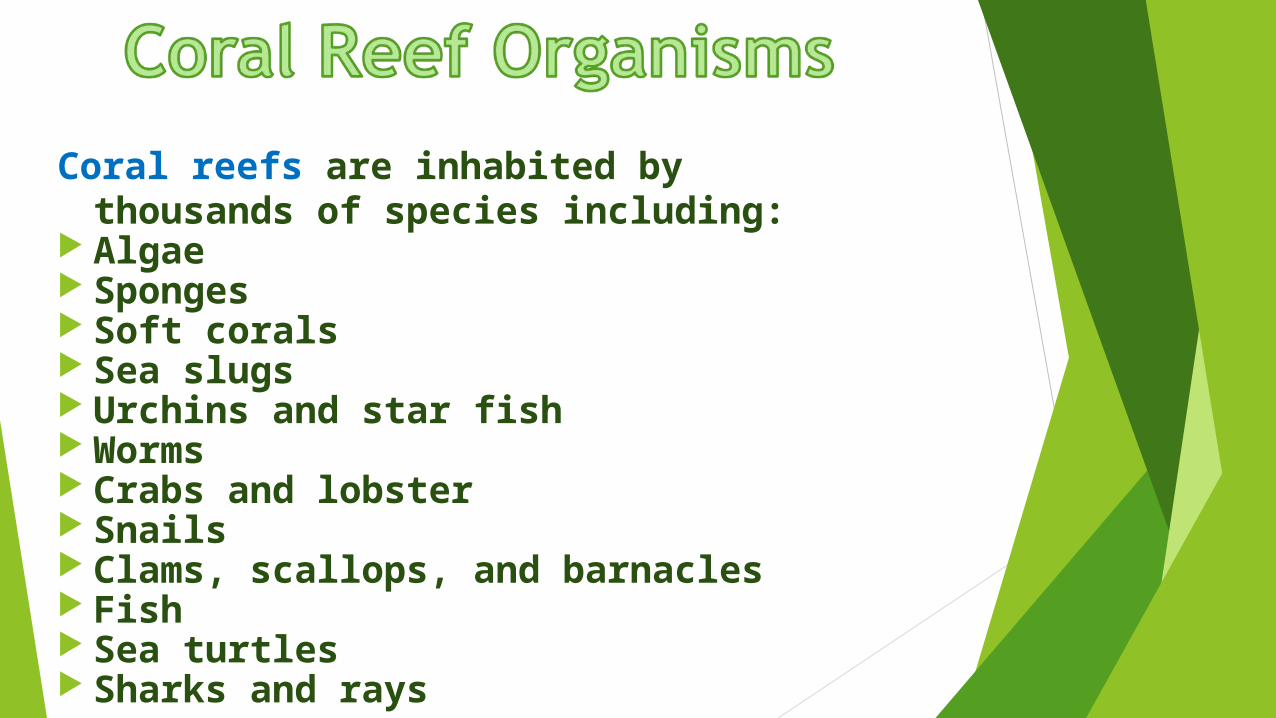
Coral reefs are inhabited by thousands of species including:
Algae Sponges Soft corals Sea slugs Urchins and star fish Worms Crabs and lobster Snails Clams, scallops, and barnacles Fish Sea turtles Sharks and rays


• Reef Check Reef Check http://reefcheck.org/about_RC_Reef/publicationhttp://reefcheck.org/about_RC_Reef/publications/Reef%20Check%20Report.pdf/s/Reef%20Check%20Report.pdf/RC_report_FINAL_2.pdfRC_report_FINAL_2.pdf
• Global Coral Reef Monitoring Global Coral Reef Monitoring Network-Network-http://gcrmn.org/gcrmn-publication/stahttp://gcrmn.org/gcrmn-publication/status-of-coral-reefs-of-the-world-2008/tus-of-coral-reefs-of-the-world-2008/
• http://gcrmn.org/publication-category/status-http://gcrmn.org/publication-category/status-of-coral-reefs-of-the-world/of-coral-reefs-of-the-world/
• Marine Apex Predators• Biomass• Average Catch Length• Coral Cover• Indicator Organisms

• Chemical Chemical pollutantspollutants• Excess nutrientsExcess nutrients• SedimentationSedimentation• Coral bleachingCoral bleaching• Coral diseasesCoral diseases• Climate change Climate change and ocean and ocean acidificationacidification•Overfishing Overfishing


•Fisheries regulation
•Marine protected areas
•Coastal zoning
•The problem of ecosystem phase-shifts (when corals die and area is taken over by algae, it achieves a new steady state and is very difficult for corals to re-colonize)
Understand and interpret data related to testing procedures and purposes for water testing (No actual testing)
Build and demonstrate a salinometer capable of testing saltwater (1-10%)
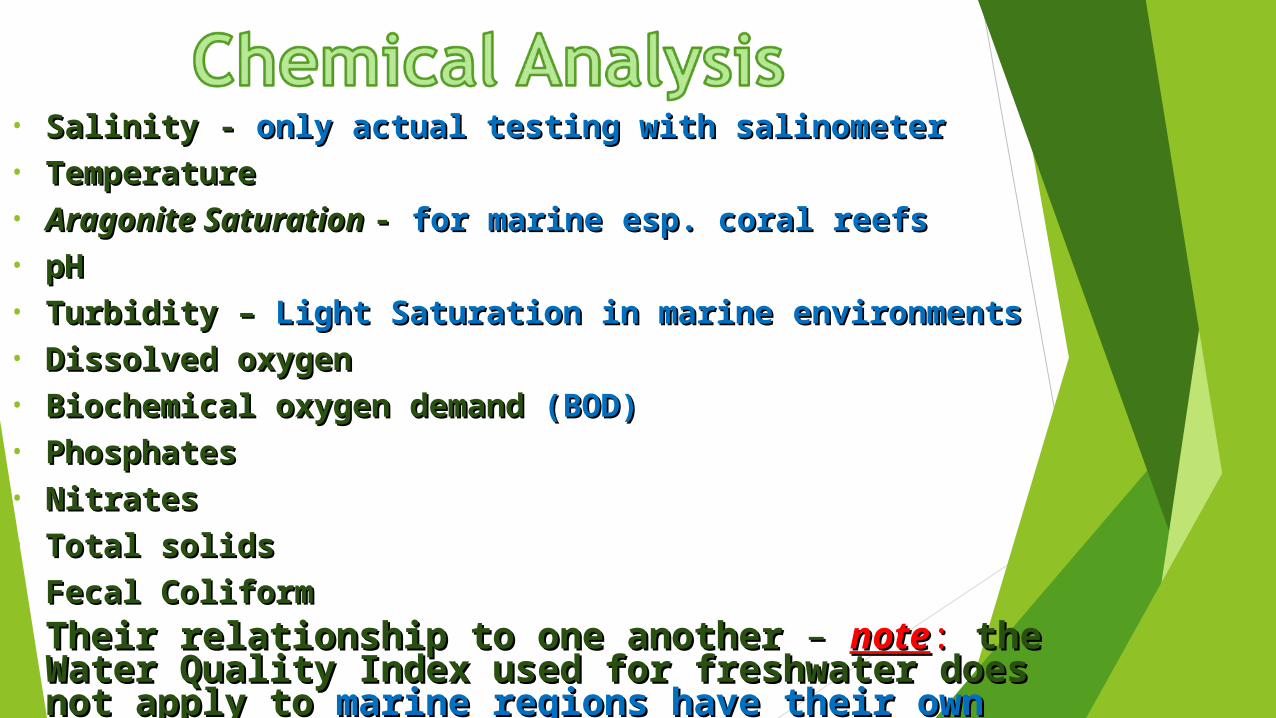
• Salinity - Salinity - only actual testing with salinometeronly actual testing with salinometer• TemperatureTemperature• Aragonite Saturation Aragonite Saturation - - for marine esp. coral reefs for marine esp. coral reefs • pHpH• Turbidity – Turbidity – Light Saturation in marine environmentsLight Saturation in marine environments• Dissolved oxygenDissolved oxygen• Biochemical oxygen demand Biochemical oxygen demand (BOD)(BOD)• PhosphatesPhosphates• NitratesNitrates• Total solidsTotal solids• Fecal ColiformFecal Coliform
Their relationship to one anotherTheir relationship to one another – – notenote:: the the Water Quality Index used for freshwater does not Water Quality Index used for freshwater does not apply to apply to marinemarine regions have their own marine regions have their own marine water quality indexwater quality index.

HydrometerHydrometer calibrated to read in % of salt concentration
MaterialsMaterials – soda straw
modeling clay
a fine-tipped permanent marker
a tall clear container to hold the solution for calibrating your device
salt for mixing one or more standard solutions
water (tap water will work-distilled is better)
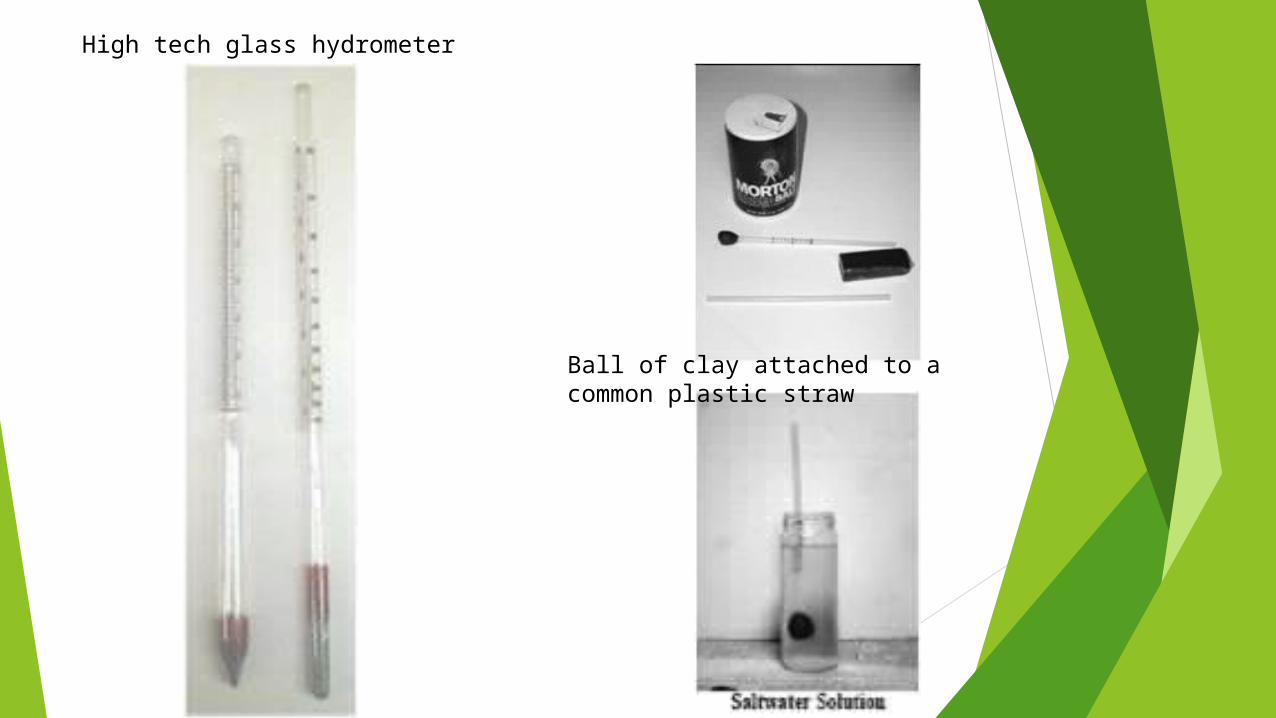
High tech glass hydrometer
Ball of clay attached to a common plastic straw
Related Documents