Water Pollution Ch. 20

Water Pollution Ch. 20. APES Put name on water, put on side lab bench (by other water) Get out GHG & Ozone Graphs of Tables 1 & 2.
Dec 23, 2015
Welcome message from author
This document is posted to help you gain knowledge. Please leave a comment to let me know what you think about it! Share it to your friends and learn new things together.
Transcript
Water Pollution
Ch. 20

APES
• Put name on water, put on side lab bench (by other water)
• Get out GHG & Ozone Graphs of Tables 1 & 2.

How to Collect Water Samples
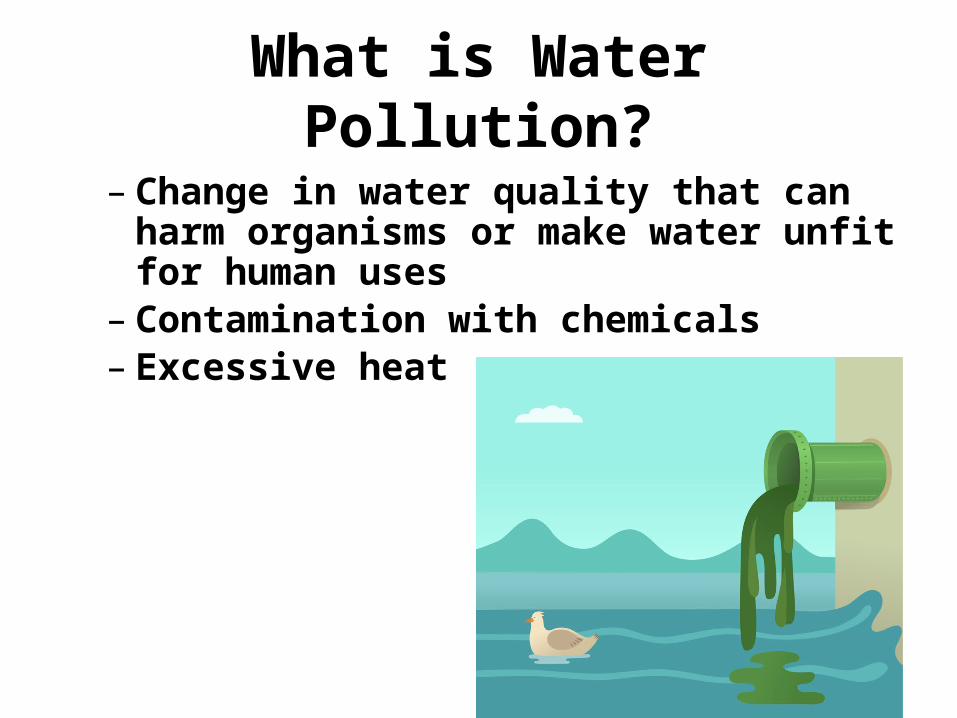
What is Water Pollution?
– Change in water quality that can harm organisms or make water unfit for human uses
– Contamination with chemicals– Excessive heat
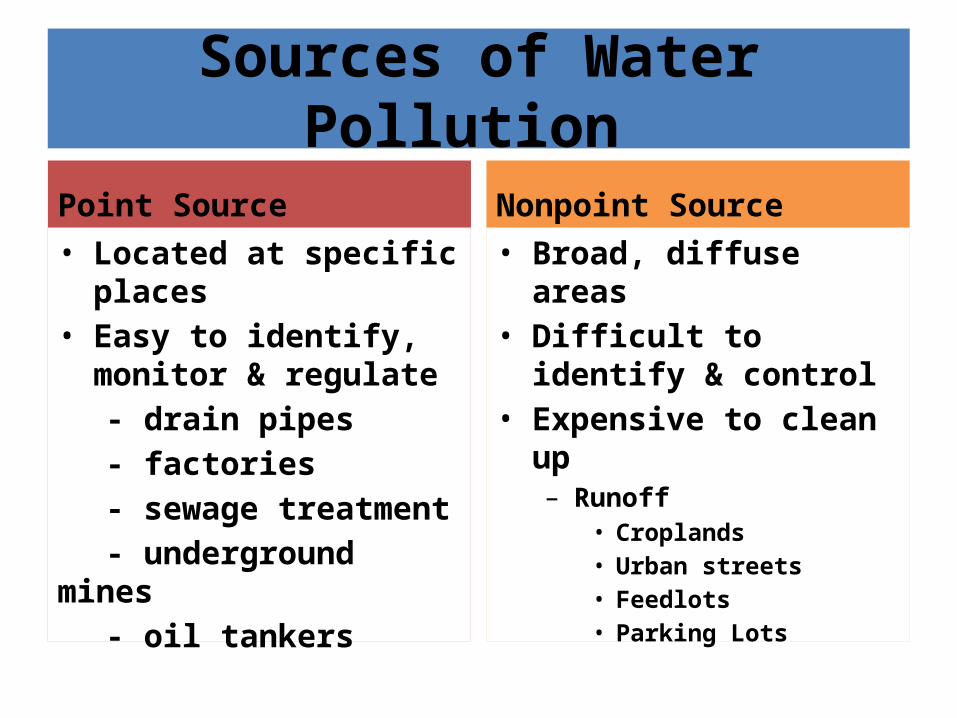
Sources of Water Pollution
Point Source• Located at specific
places• Easy to identify, monitor
& regulate- drain pipes- factories- sewage treatment - underground
mines- oil tankers
Nonpoint Source• Broad, diffuse areas• Difficult to identify &
control • Expensive to clean up
– Runoff • Croplands• Urban streets• Feedlots• Parking Lots
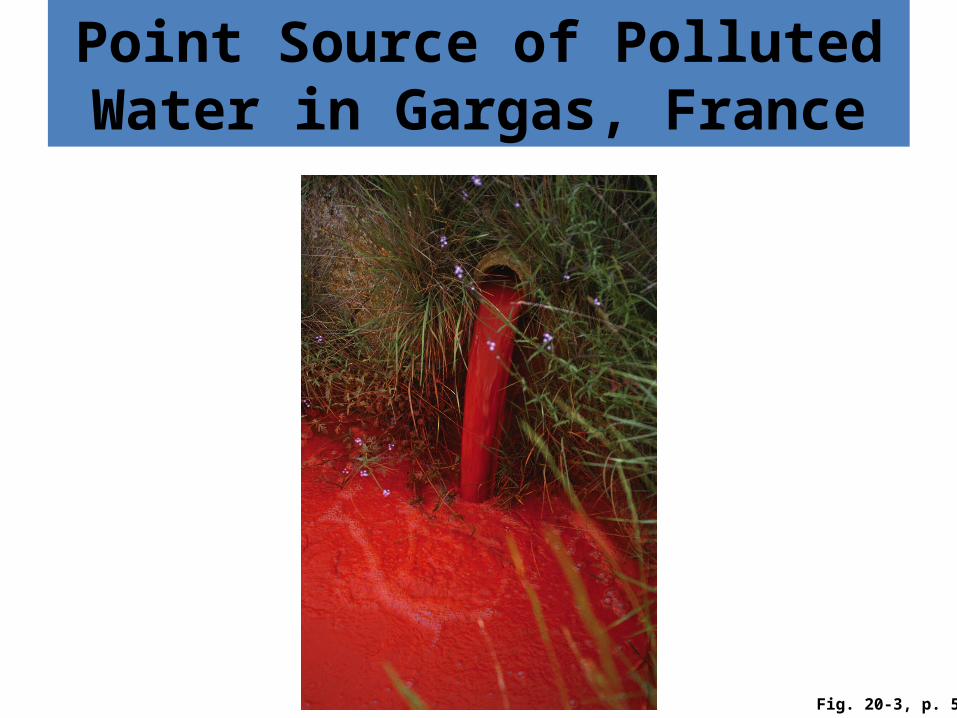
Point Source of Polluted Water in Gargas, France
Fig. 20-3, p. 530

Nonpoint Sediment from Unprotected Farmland Flows into Streams
Fig. 20-4, p. 530

Point & Nonpoint SourcesNONPOINT SOURCES
Urban streets
Suburban development
Wastewater treatment plant
Rural homes
Cropland
Factory
Animal feedlot
POINT SOURCES

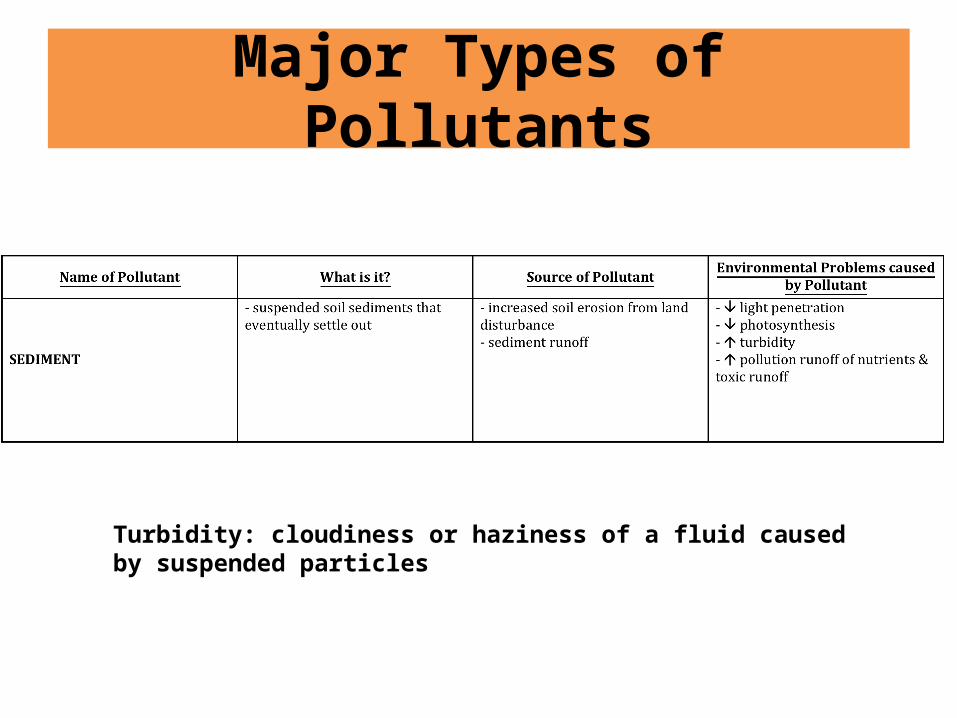
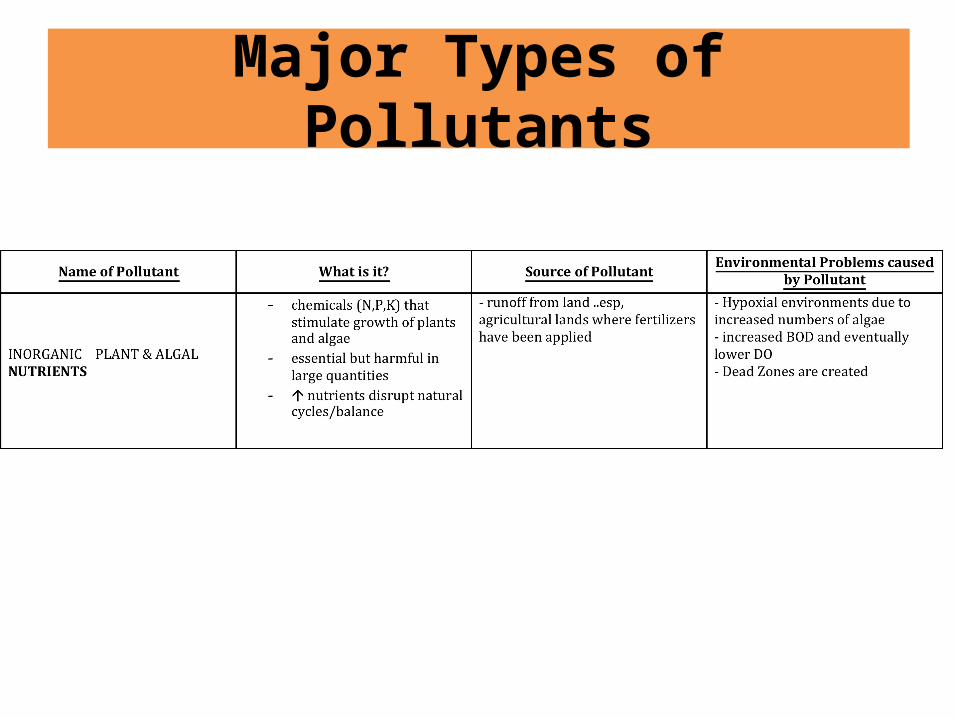
Major Types of Pollutants
• Sewage• Disease Agents• Sediment• Inorganic Plant & Algal Nutrients• Organic Compounds• Inorganic Compounds• Radioactives• Thermal Pollution
Review Table 20.1!!

Major Types of Pollutants

Major Types of Pollutants
Major Types of Pollutants
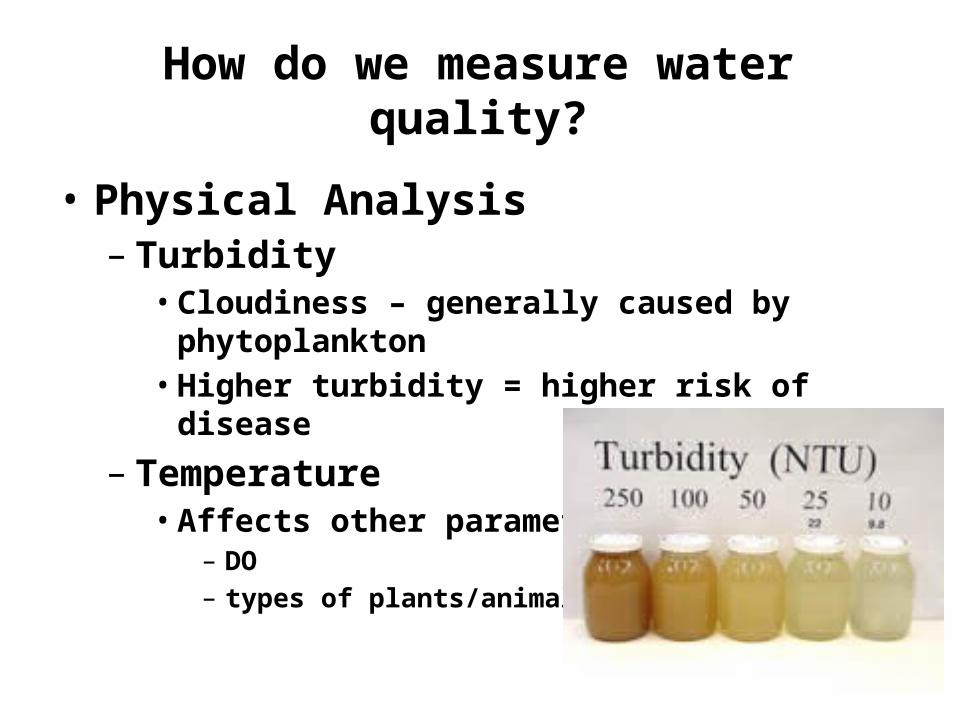
Turbidity: cloudiness or haziness of a fluid caused by suspended particles
Major Types of Pollutants

Major Types of Pollutants

Major Types of Pollutants

Major Types of Pollutants

Major Types of Pollutants

Common Diseases Transmitted Through Contaminated Drinking Water
Type of Organism Disease Effects
Bacteria Typhoid fever Diarrhea, Severe Vomiting, Enlarged, Spleen, Fatal if untreated
Cholera Diarrhea, severe vomiting, fatal if left untreated
Bacterial Dysentery Diarrhea, bleeding, rarely fatal except in infants
Enteritis Severe Stomach Pain, nausea, vomiting, rarely fatal
Viruses Infectious hepatitis Fever, severe headache, loss of appetite, abdominal pain, jaundice, enlarged liver, rarely fatal, but cause liver damage
Parasitic Protozoa Amoebic Dysentery Severe diarrhea, headache, abdominal pain, chills, fever, if not treated can cause liver abscess, bowel perforation, & death
Giardiasis Diarrhea, abdominal cramps, flatulence, belching fatigue
Parasitic Worms Shistosomiasis Abdominal pain, skin rash, anemia, chronic fatigue, chronic general ill health.
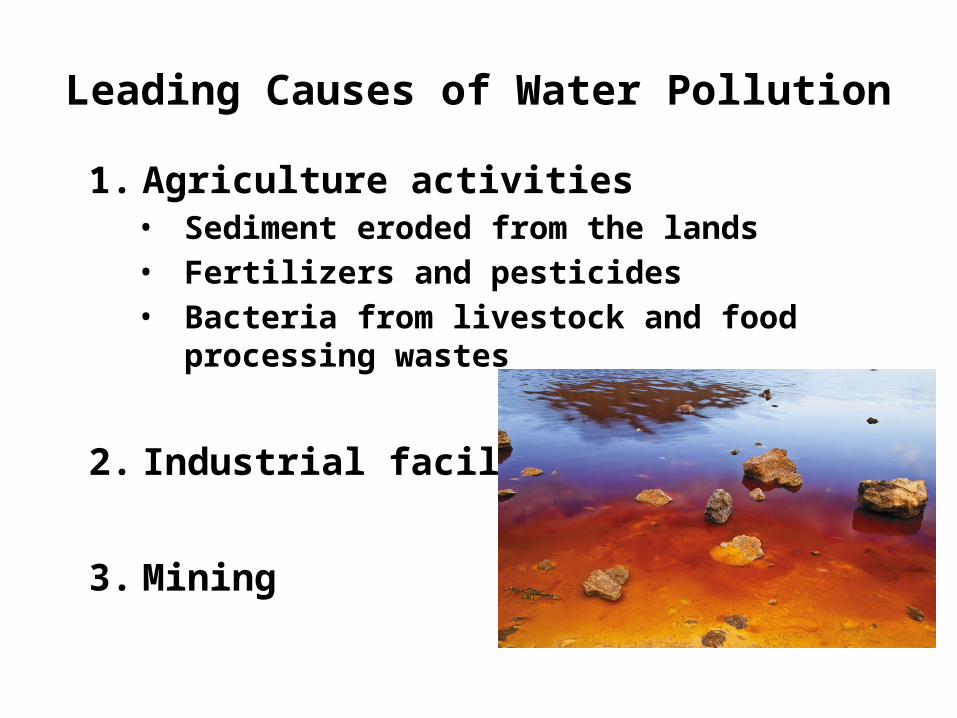
Leading Causes of Water Pollution
1. Agriculture activities• Sediment eroded from the lands• Fertilizers and pesticides• Bacteria from livestock and food processing
wastes
2. Industrial facilities
3. Mining

Effects of YUCK water
The World Health Organization (WHO) – 1.6 million people die every year, mostly
under the age of 5– Diarrhea

How do we measure water quality?• Using DO + BOD measurements
• Using Coliform bacteria: Escherichia Coli tests
• Using Chemical Analysis– Presence/Absence and concentration
• Using Indicator Species– Macroinvertebrates
• Using Physical Analysis– Turbidity – cloudiness– Temperature
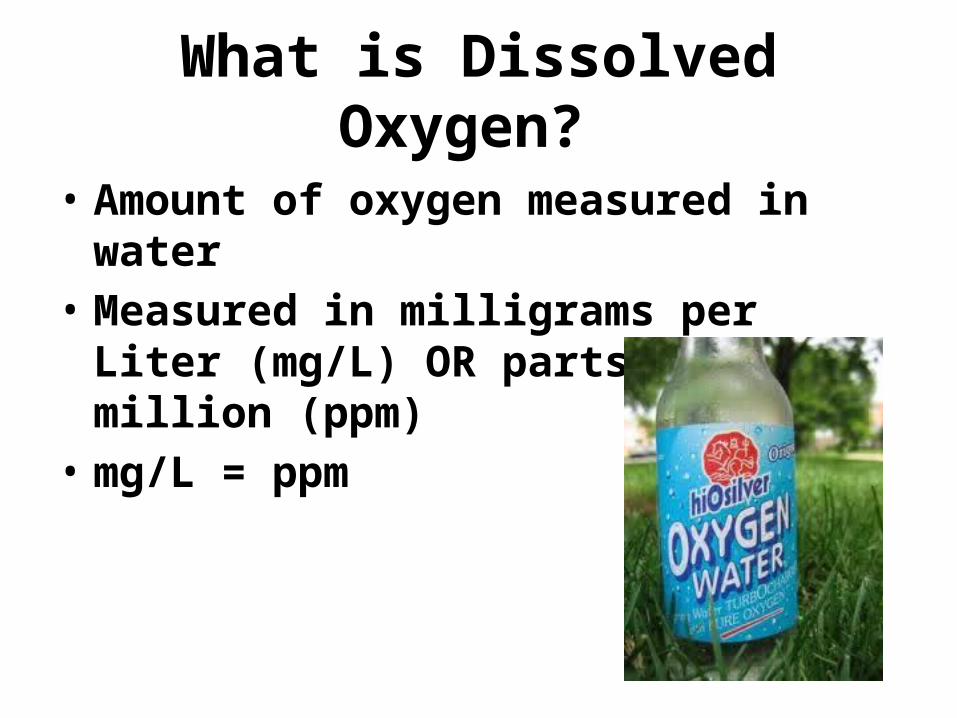
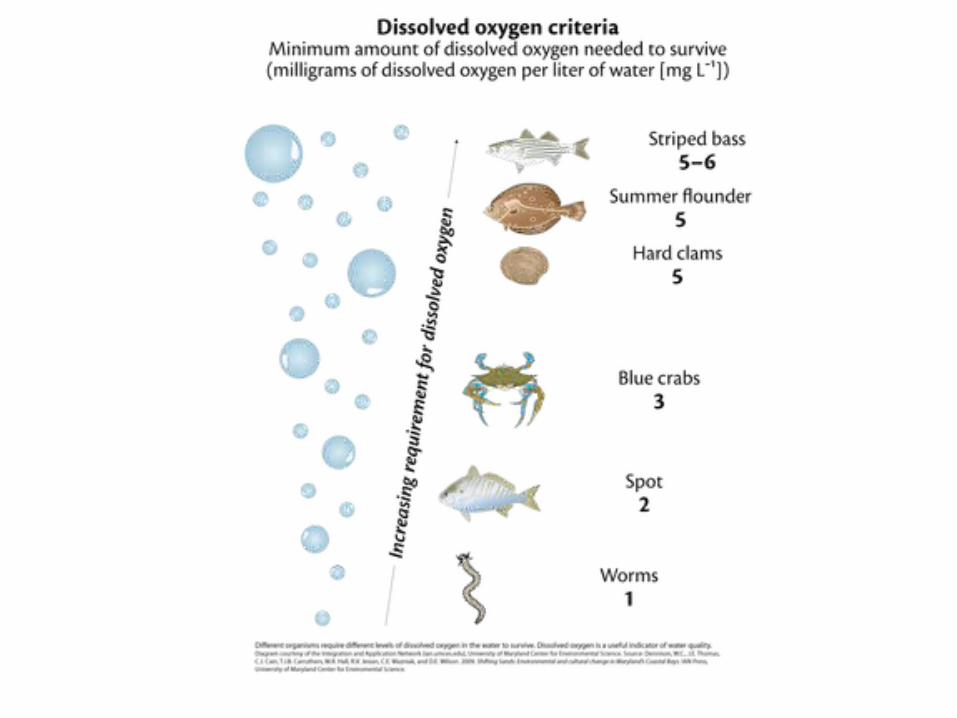
What is Dissolved Oxygen?
• Amount of oxygen measured in water• Measured in milligrams per Liter (mg/L)
OR parts per million (ppm)• mg/L = ppm

How do we measure water quality?
Measuring the level of Dissolved Oxygen (DO)

Dissolved Oxygen (DO) & Biological Oxygen Demand (BOD)
• Dissolved Oxygen – Amount of oxygen dissolved in solution
• BOD- rate at which organisms use up oxygen in water– The rate of oxygen consumption in a stream
is affected by: temp., pH, microorganisms, type of organic/inorganic material in water

Pollution of Streams

Fig. 20-7, p. 534
Point source
Pollution- tolerant fishes
(carp, gar)
Fish absent, fungi, sludge
worms, bacteria
(anaerobic)Types of
organisms
Normal clean water organisms
(Trout, perch, bass, mayfly,
stonefly)
Pollution- tolerant fishes
(carp, gar)8 ppm
Normal clean water organisms
(Trout, perch, bass, mayfly,
stonefly)
Dissolved oxygen (ppm)
8 ppm
Biochemical oxygen demand Recovery
Zone
Clean Zone
Septic ZoneDecomposition
ZoneClean Zone
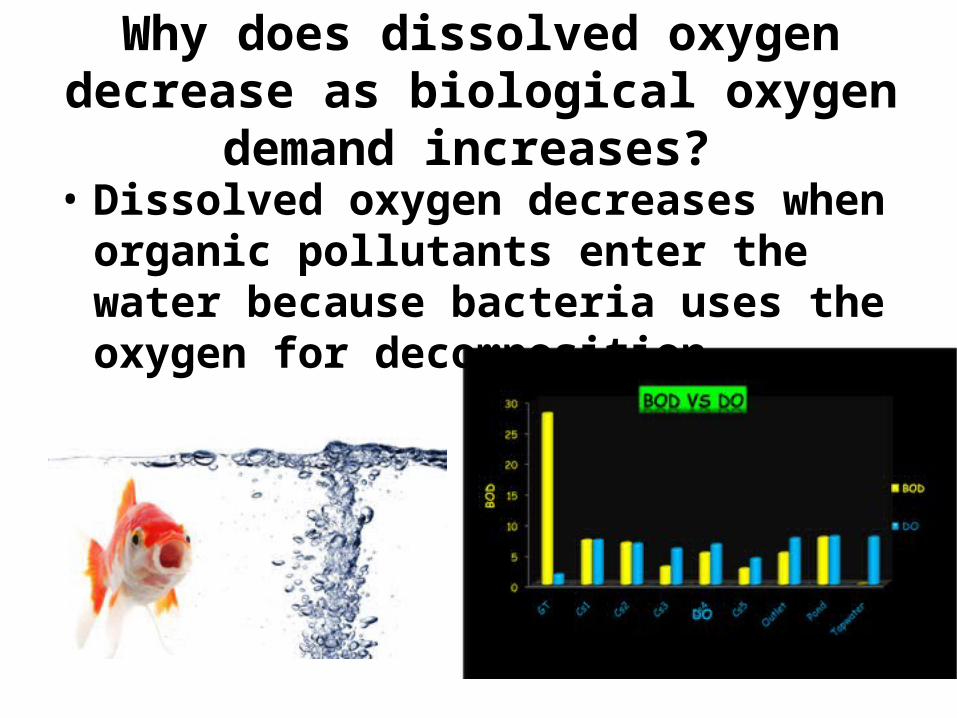
Why does dissolved oxygen decrease as biological oxygen demand increases?
• Dissolved oxygen decreases when organic pollutants enter the water because bacteria uses the oxygen for decomposition.
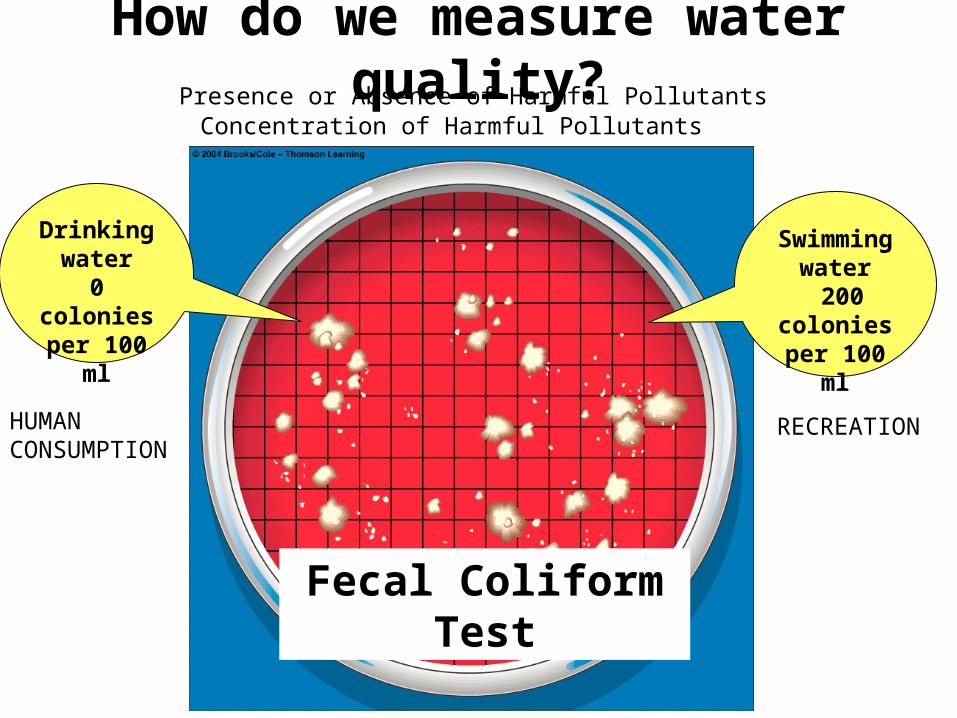
How do we measure water quality?
Fecal Coliform Test
Drinking water
0 colonies per 100 ml
Swimming water 200
colonies per 100 ml
Presence or Absence of Harmful PollutantsConcentration of Harmful Pollutants
HUMAN CONSUMPTION
RECREATION
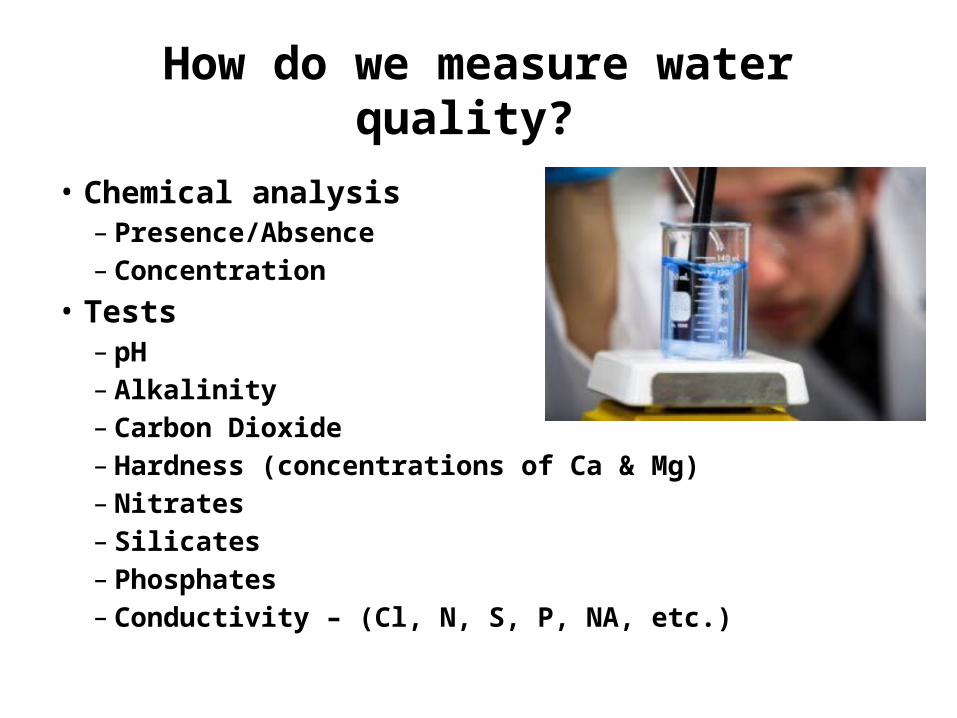
How do we measure water quality?
• Chemical analysis– Presence/Absence– Concentration
• Tests– pH– Alkalinity– Carbon Dioxide– Hardness (concentrations of Ca & Mg)– Nitrates– Silicates– Phosphates– Conductivity – (Cl, N, S, P, NA, etc.)

How do we measure water quality?
• Indicator Species– Macro invertebrates
How do we measure water quality?
• Physical Analysis– Turbidity
• Cloudiness – generally caused by phytoplankton• Higher turbidity = higher risk of disease
– Temperature• Affects other parameters
– DO– types of plants/animals

APES
• Turn in GHG & Ozone graphs and analysis
• Get out Ch. 20 Water Pollution Notes
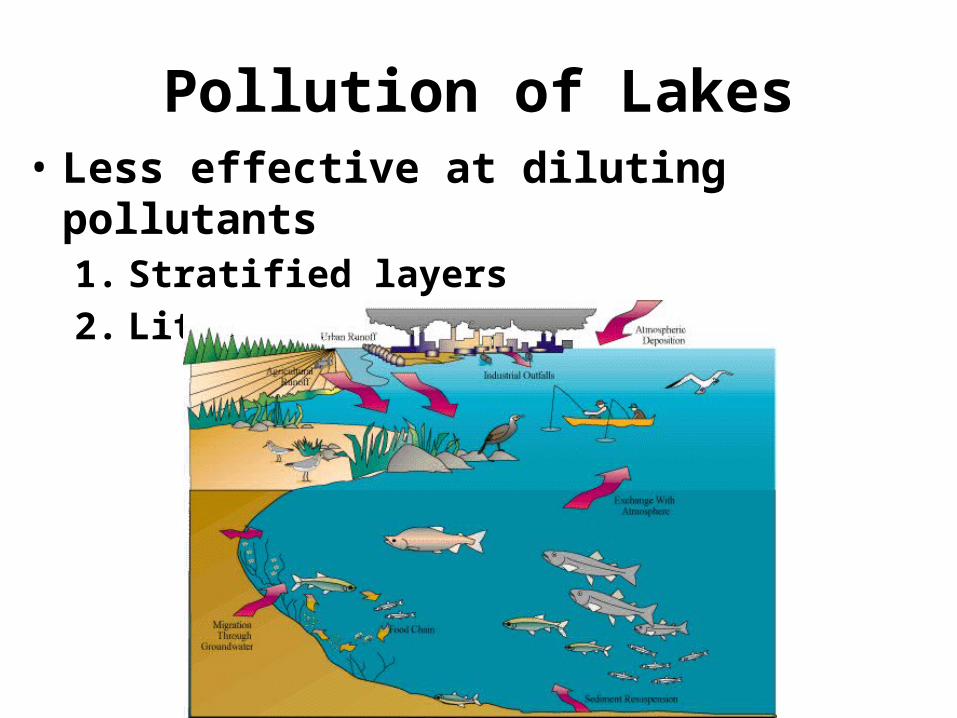
Pollution of Lakes• Less effective at diluting pollutants
1. Stratified layers2. Little to no flow

Pollution of Lakes
• Slow Turnover– Flushing & changing of water temp.
• Thermal Stratification– Little vertical mixing
• Biological Magnification– Increase in the concentration of chemicals in
organisms at successively higher trophic levels of a food chain
• Eutrophication– Natural nutrient enrichment of lakes
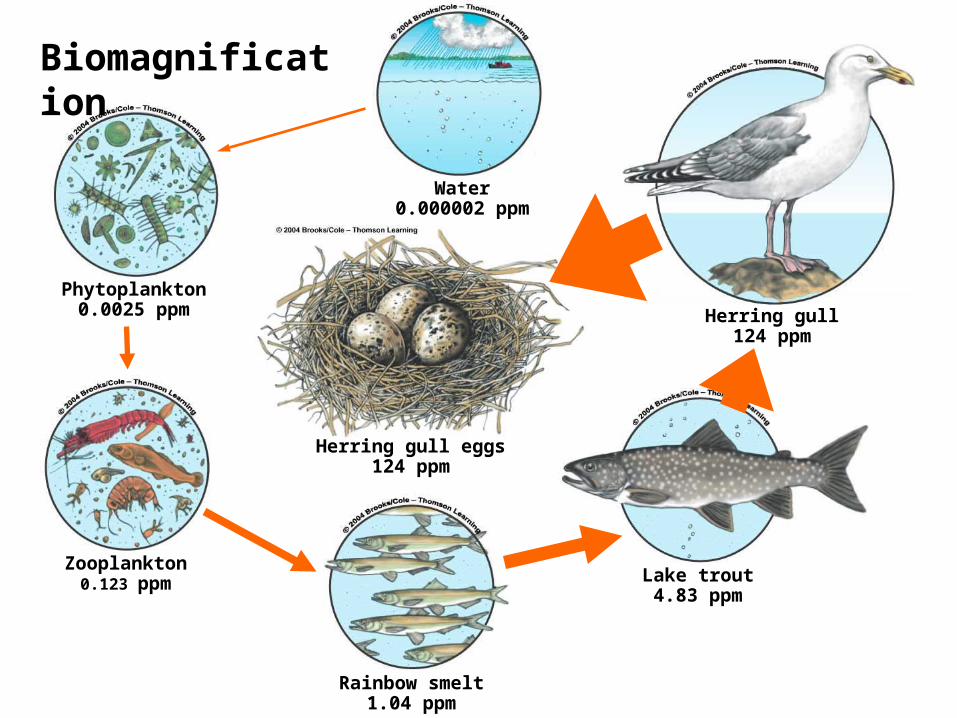
Water0.000002 ppm
Phytoplankton0.0025 ppm
Zooplankton0.123 ppm
Rainbow smelt1.04 ppm
Lake trout4.83 ppm
Herring gull124 ppm
Herring gull eggs124 ppm
Biomagnification
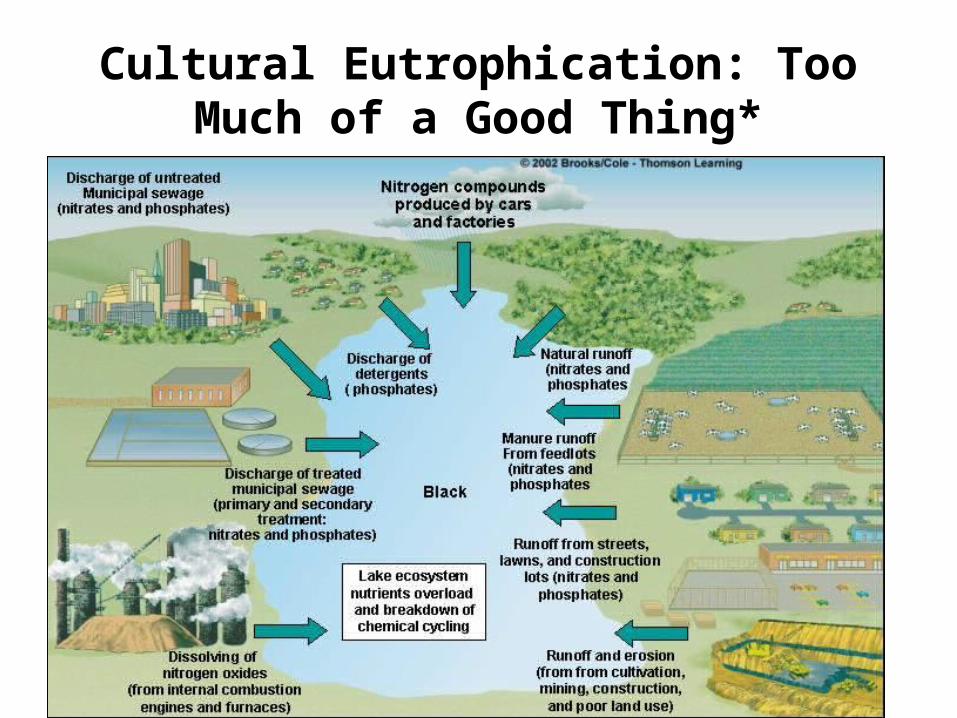
Cultural Eutrophication: Too Much of a Good Thing*
Caused by runoff of plant nutrients- nitrates- phosphates

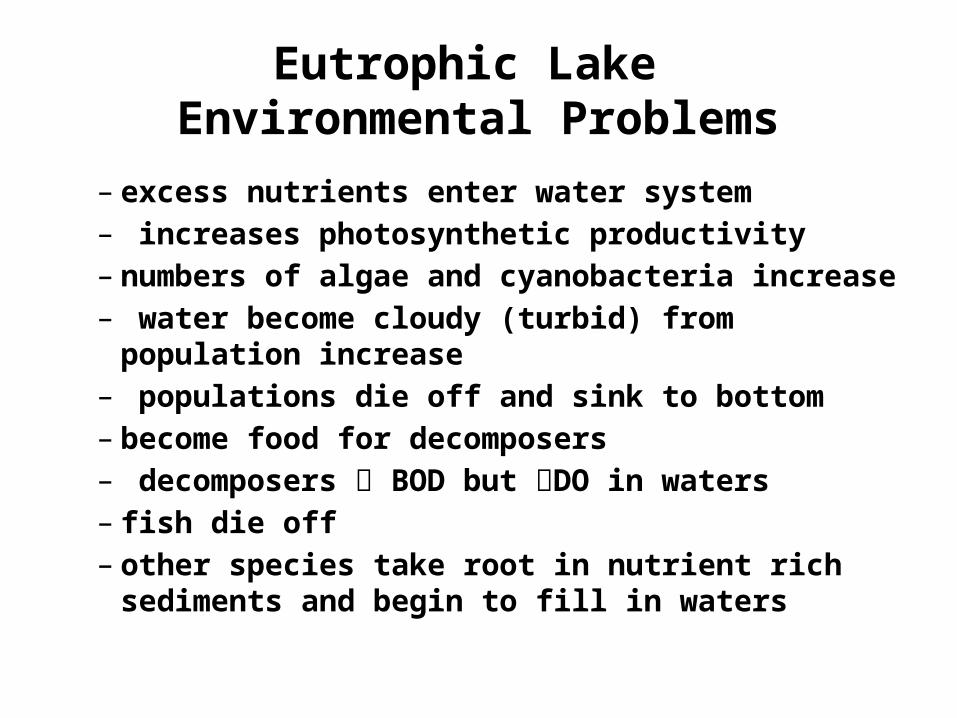
Eutrophic Lake Environmental Problems
– excess nutrients enter water system– increases photosynthetic productivity – numbers of algae and cyanobacteria increase – water become cloudy (turbid) from population
increase– populations die off and sink to bottom– become food for decomposers – decomposers BOD but DO in waters – fish die off– other species take root in nutrient rich sediments
and begin to fill in waters

Eutrophic Lakes
• Prevention– Remove nitrates & phosphates– Diversion of water
• Clean Up– Remove excess weeds– Use herbicides & algaecides (downside? )– Pump in air
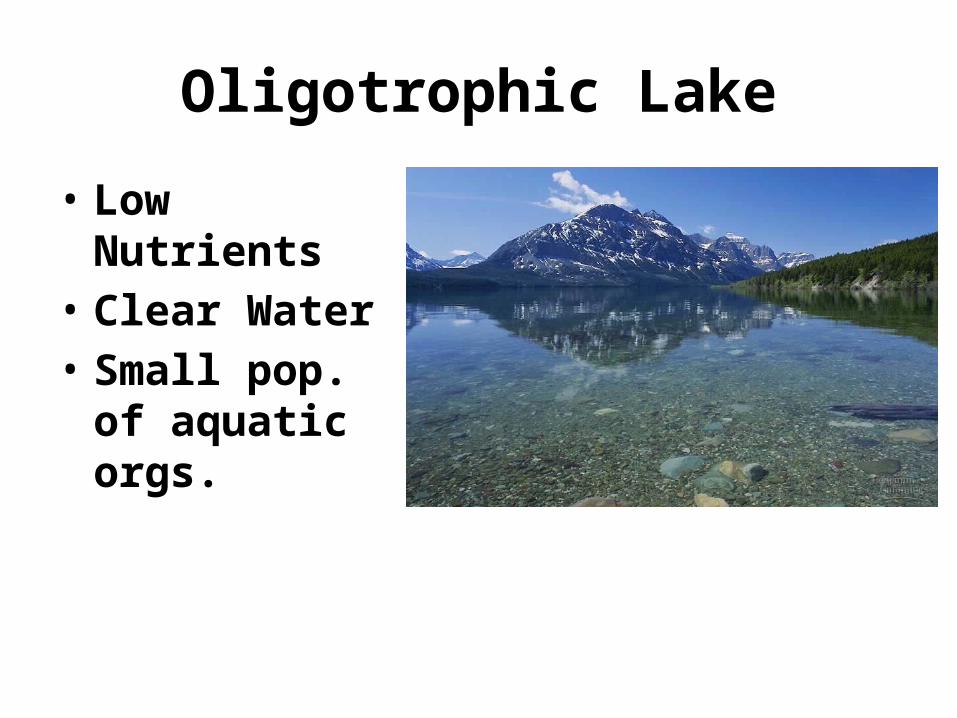
Oligotrophic Lake
• Low Nutrients• Clear Water• Small pop. of
aquatic orgs.

Reducing Surface Water Pollution
Nonpoint Source• Reduce Runoff• Buffer Zone Vegetation• Reduce Soil Erosion
Point Sources• Clean Water Act• Water Quality Act

Groundwater Pollution

Groundwater Pollution• It can take hundreds to thousands of
years for contaminated groundwater to cleanse itself of degradable wastes.
• Nondegradable wastes (toxic lead, arsenic, fluoride) are there permanently.
• Slowly degradable wastes (DDT) are there for decades.
Groundwater Pollution
• Source of drinking water• Common pollutants
– Fertilizers & Pesticides– Gasoline– Organic Solvents
• Pollutants dispersed in a widening plume• Pollutants fill porous rock, sand, bedrock,
like water saturates a sponge
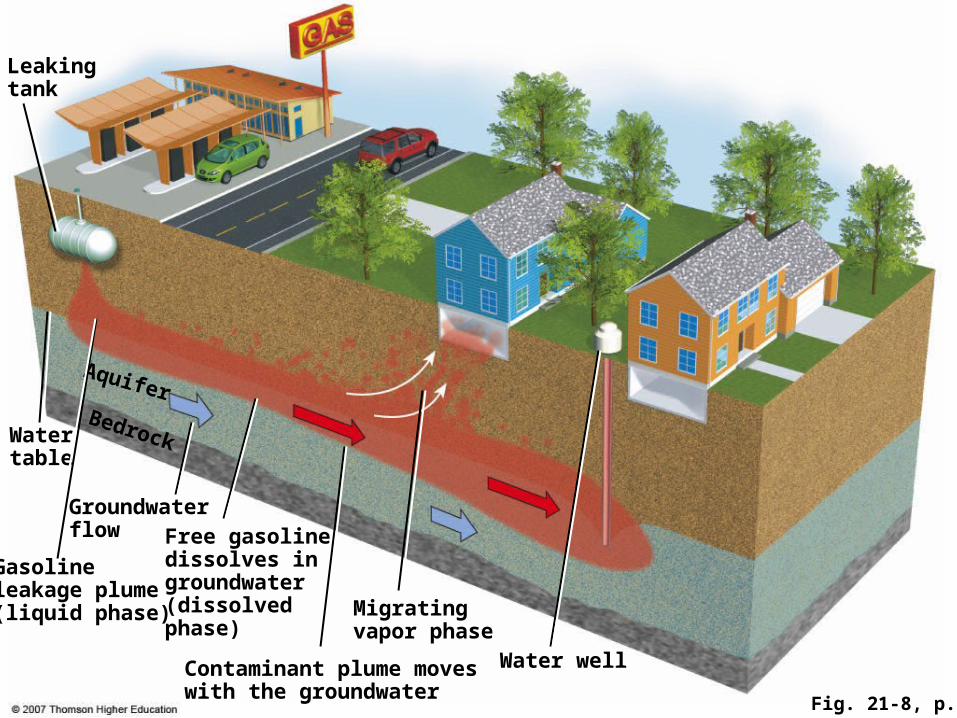
Fig. 21-8, p. 502
Aquifer
Water well
Migrating vapor phase
Contaminant plume moveswith the groundwater
Free gasolinedissolves ingroundwater(dissolved phase)
Groundwaterflow
Watertable
Gasolineleakage plume(liquid phase)
Leakingtank
Bedrock
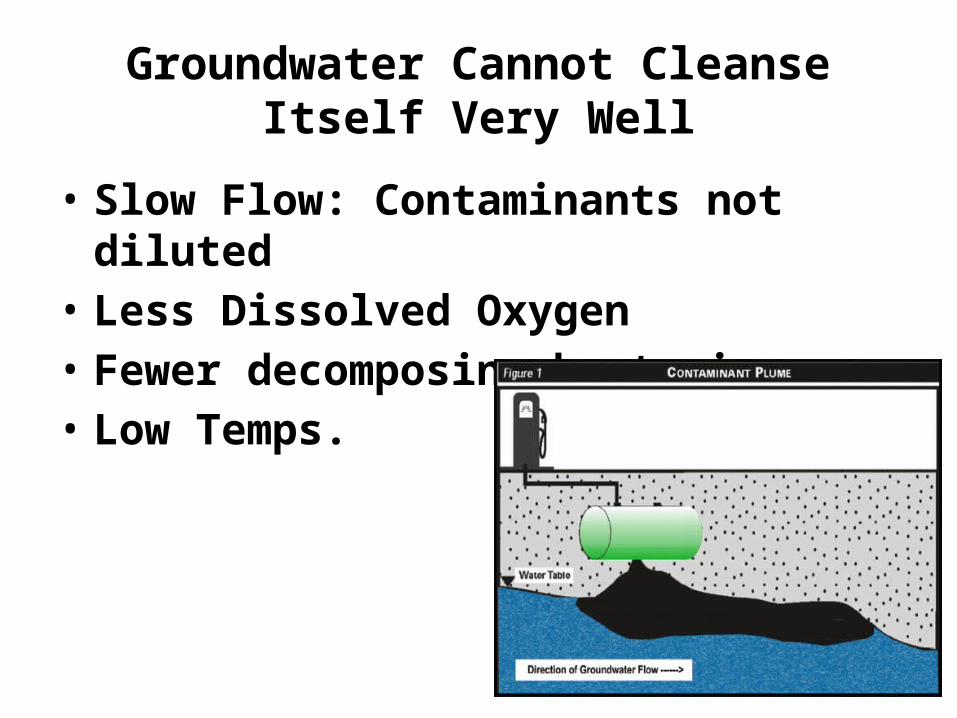
Groundwater Cannot Cleanse Itself Very Well
• Slow Flow: Contaminants not diluted• Less Dissolved Oxygen• Fewer decomposing bacteria• Low Temps.

Fig. 20-13, p. 540
Polluted air
Hazardous waste
injection wellPesticides and fertilizers
Deicing road salt
Coal strip mine runoff
Buried gasoline and solvent tanks
Pumping well Gasoline stationCesspool, septic tank
Water pumping wellWaste lagoon
LandfillSewer
Accidental spills Leakage from faulty
casing
Discharge
Freshwater aquifer
Groundwater flow
Groundwater Pollution Sources

Pollution Prevention = Only Effective Way to Protect Groundwater!
• Cleanup = expensive & time consuming
Groundwater Pollution PREVENTION
• Monitoring aquifers• Leak detection systems• Use toxic chemical substitutes • Strict regulation – hazardous waste
disposal• Storing hazardous wastes materials
above ground

Water Pollution & Oceans
• 2006: State of the Marine Environment– 80% of marine pollution originates on land– Sewage– Coastal areas most affected
• Deeper ocean waters– Dilution– Dispersion– Degradation

Fig. 20-16, p. 545
Industry Nitrogen oxides from autos and smokestacks, toxic chemicals, and heavy metals in effluents flow into bays and estuaries.
Cities Toxic metals and oil from streets and parking lots pollute waters; sewage adds nitrogen and phosphorus.
Urban sprawl Bacteria and viruses from sewers and septic tanks contaminate shellfish beds and close beaches; runoff of fertilizer from lawns adds nitrogen and phosphorus.
Construction sites Sediments are washed into waterways, choking fish and plants, clouding waters, and blocking sunlight.
Farms Runoff of pesticides, manure, and fertilizers adds toxins and excess nitrogen and phosphorus.
Red tides Excess nitrogen causes explosive growth of toxic microscopic algae, poisoning fish and marine mammals.
Closed shellfish beds
Closed beach
Oxygen-depleted zone
Toxic sediments Chemicals and toxic metals contaminate shellfish beds, kill spawning fish, and accumulate in the tissues of bottom feeders.
Oxygen-depleted zone Sedimentation and algae overgrowth reduce sunlight, kill beneficial sea grasses, use up oxygen, and degrade habitat.
Healthy zone Clear, oxygen-rich waters promote growth of plankton and sea grasses, and support fish.
Water Pollution & Oceans
• Cruise line pollution: what is being dumped?
• U.S. coastal waters– Raw sewage – Sewage and agricultural runoff: NO3
- and PO43-
– Harmful algal blooms– Oxygen-depleted zones
• Huge mass of plastic in North Pacific Ocean
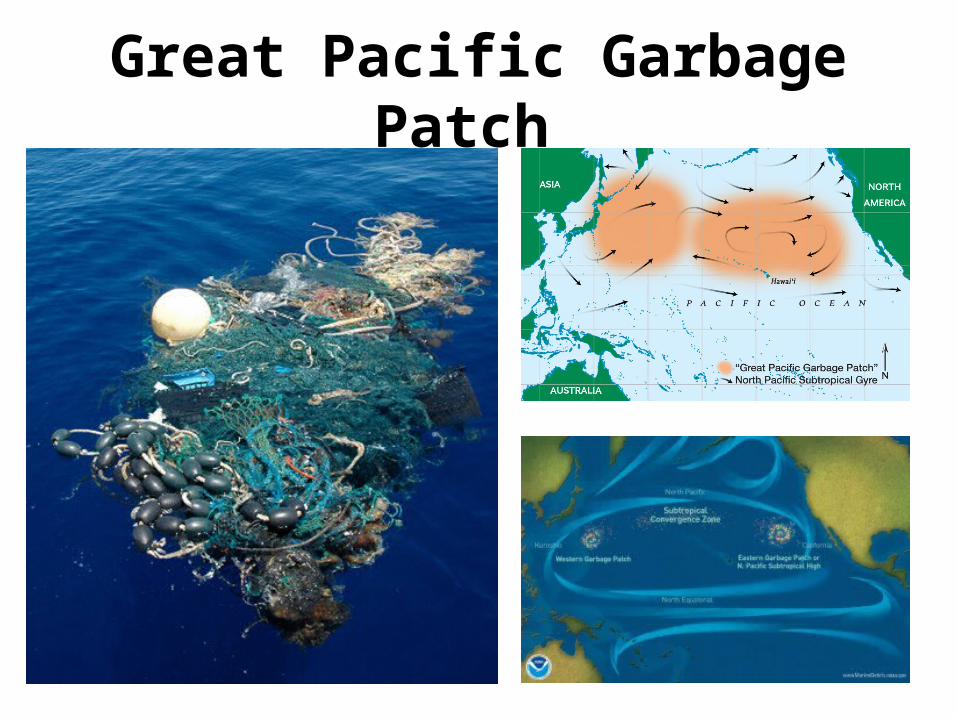
Great Pacific Garbage Patch
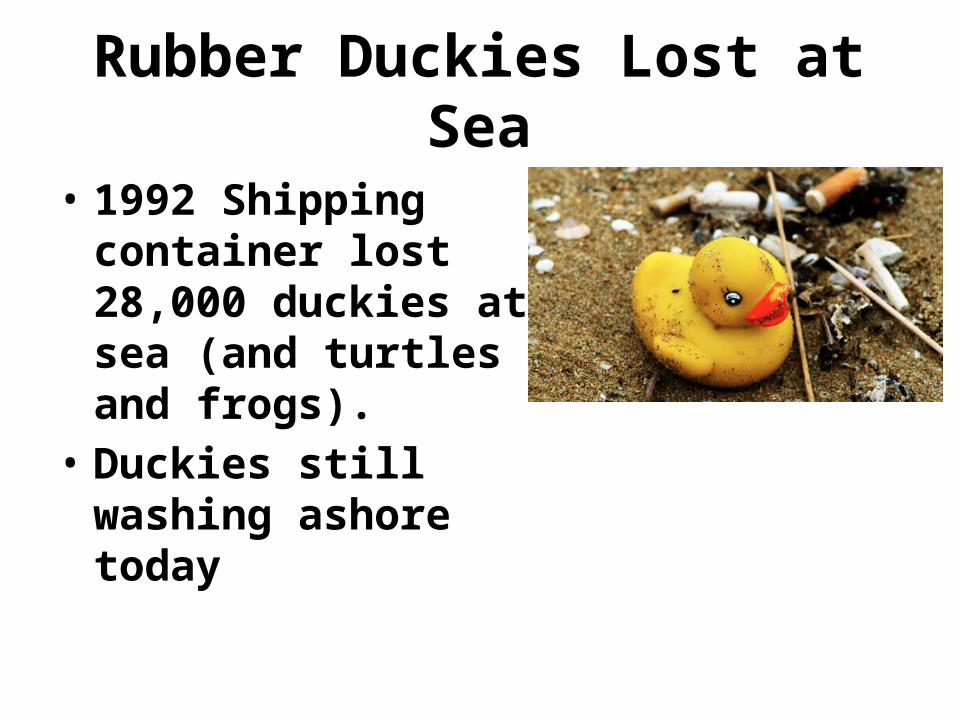
Rubber Duckies Lost at Sea
• 1992 Shipping container lost 28,000 duckies at sea (and turtles and frogs).
• Duckies still washing ashore today
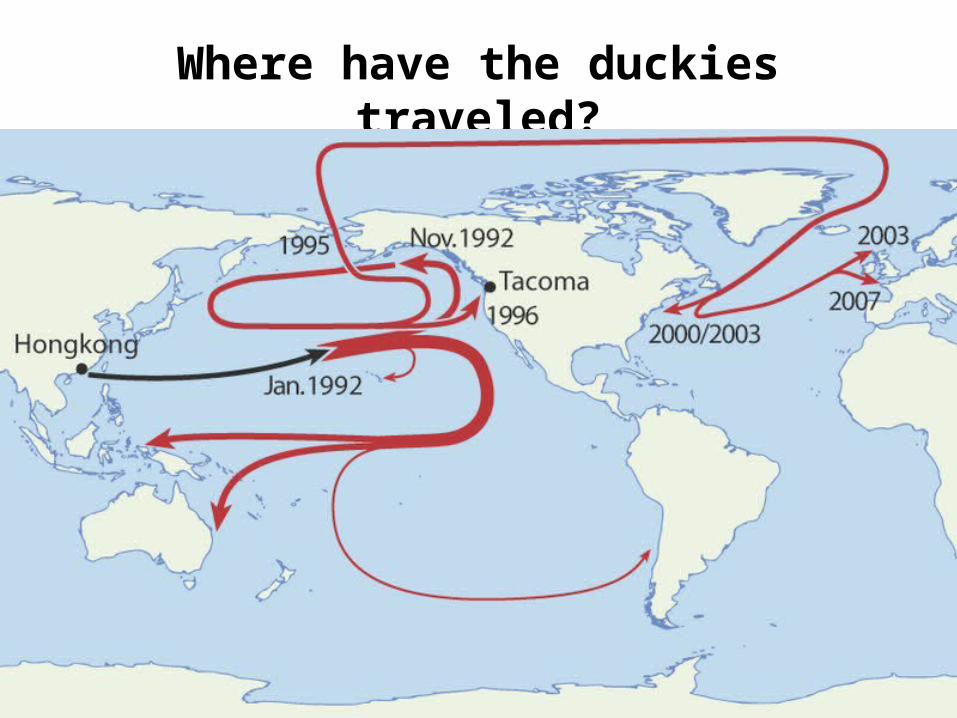
Where have the duckies traveled?
Ocean Pollution From Oil
• 1989: Exxon Valdez, oil tanker– Rleased 41 million liters (11 mill. gallons)– Alaska’s Prince William Sound
• 2010: BP explosion in the Gulf of Mexico– Sank rig– 11 crewmembers killed

Deepwater Horizon Blowout in the Gulf of Mexico, April 20, 2010
Fig. 20-18, p. 547

How do we purify water? • Reservoir & purification
plant• Process sewer water to
drinking water• Expose clear plastic
containers to sunlight (UV)
• The lifestraw• PUR: Chlorine & iron
sulfate powder

Laws & Water Quality
• 1974: U.S. Safe Drinking Water Act– Amended 1986 & 1996– 1996 amendment required discoloser to
citizens of contaminated water– Sets max. contamination levels for any
pollutants that affect human health– EPA determined MCLs (Maximum
Contaminant Levels)– Health Scientists: STRENGTHEN law– Water-polluting Companies: WEAKEN law

Laws & Water Quality
• 1977 Clean Water Act • Amended 1981 & 1987
– Formerly – Water Pollution Control Act (1972)
• Two Main Goals– eliminate discharge of pollutants– attain water quality for safe fishing and
swimming
Laws & Water Quality
• 1977 Clean Water Act • CWA effective at improving water quality at point
sources • Point source discharges must obtain NPDES permits
– (National Pollutant Discharge Elimination System) to release untreated wastewater into waterways
– Nonpoint Source discharges very difficult to control – 1987 NPDES permit needed for nonpoint source
discharges– CWA not as effective at monitoring these discharges due
to lack of cooperation/coordination between govt, citizens, and industry
Discharge Trading Policy
• Experiment – permits for water pollution
Laws & Water Quality
• Easier to control/regulate point source pollution rather than nonpoint source.
• Govts regulate either by imposing penalty on polluter OR by taxing polluters for cleanup costs.

2 million plastic bottles,dumped every 5 minutes.
Is Bottled Water the Answer?
Is Bottled Water the Answer?• Some bottled water is not as pure as tap
water and costs much more.
• 1.4 million metric tons of plastic bottles are thrown away.
• Fossil fuels are used to make plastic bottles.– The oil used to produce plastic bottles in the U.S.
each year would fuel 100,000 cars.
Related Documents


