Water Pollution: An Introduction

Water Pollution: An Introduction. Outline of Topics The Hydrosphere –Water Reservoirs –Water Usage in the US –The Hydrologic Cycle Composition of the.
Dec 17, 2015
Welcome message from author
This document is posted to help you gain knowledge. Please leave a comment to let me know what you think about it! Share it to your friends and learn new things together.
Transcript
Water Pollution:An Introduction

Outline of Topics• The Hydrosphere
– Water Reservoirs– Water Usage in the US– The Hydrologic Cycle
• Composition of the Hydrosphere– The Dissolution Process– Composition of Seawater– Composition of Rivers
• Water Pollution– Changes in River Composition– Westhampton Lake– Water Pollution Overview: Sources, Pollutants– US Water Quality

The Hydrosphere• Lecture Question
– List the major water reservoirs on Earth – ie, the components of the hydrosphere – in order of volume (largest to smallest).
Reservoir Avg Turnover TimeOceans 1.34E+09 96.54% 2640 yrCryosphere 2.41E+07 1.74% 8900 yrGroundwater/Permafrost 2.37E+07 1.71% 515 yrLakes/Rivers 1.90E+05 0.01% 4.3 yrSoil Moisture 1.65E+04 0.0012% 52 dAtmosphere 1.29E+04 0.0009% 8.2 dBiomass 1.12E+03 0.0001% 5.6 d
Volume, km3

US Freshwater Usage
Sources of freshwater
• approx 75% surface water
• approx 25% ground water
Uses of freshwater
• agriculture (41%)
• hydro power (39%)
• drinking/washing/etc (12%)
• almost half (48%) supplied by ground water
• industrial/mining (8%)
Largest Consumption
• agriculture, by far (85%)

The Hydrologic Cycle• Questions
– What is the hydrologic cycle?• The hydrologic cycle is the movement of water between its
reservoirs, on either a local or global scale.
– What are the processes by which water circulates between its reservoirs?
• Precipitation• Condensation• Evaporation• Transpiration
– Uptake from soil by plants, release as vapor from stomata
• Overland flow– Surface runoff– Channel flow
• Groundwater flow– Baseflow recharges surface water (rivers, lakes, etc)
• Infiltration into the soil– Mechanism of groundwater recharge
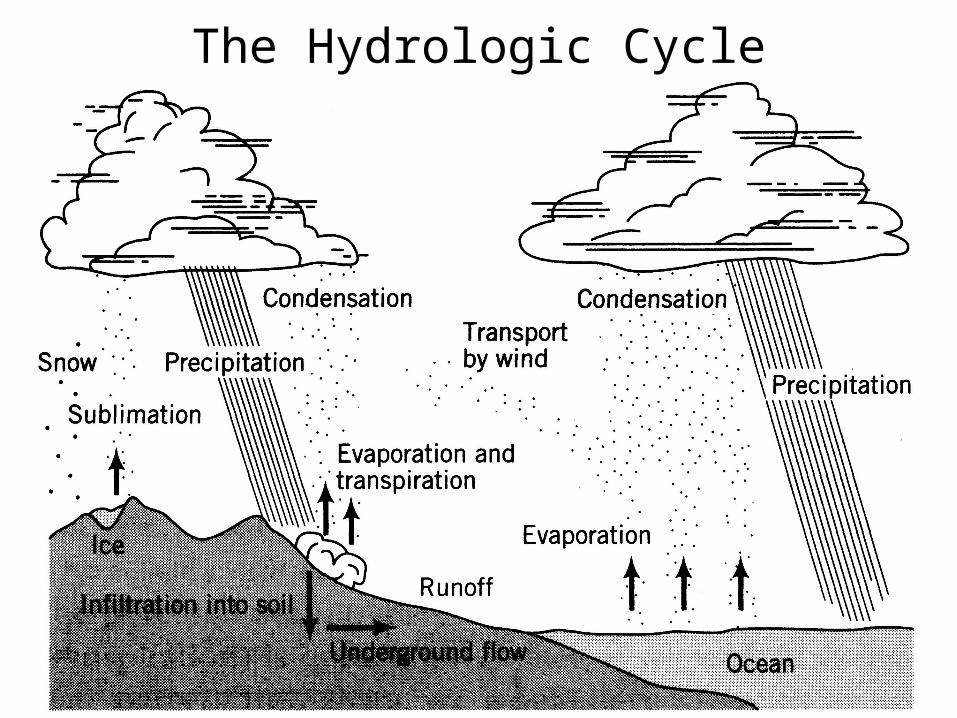
The Hydrologic Cycle
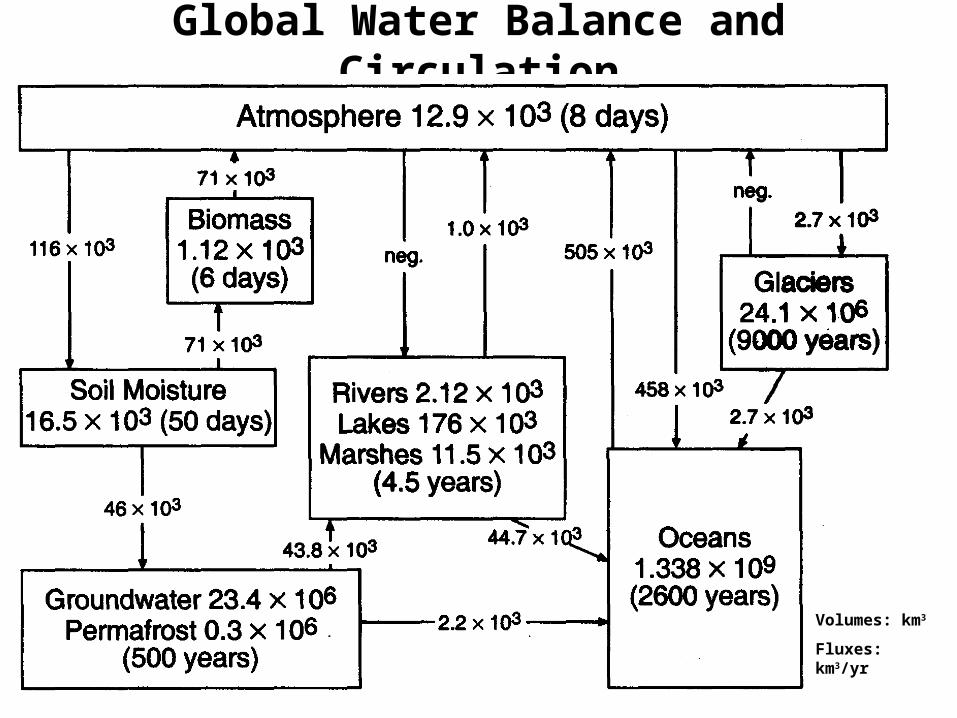
Global Water Balance and Circulation
Volumes: km3
Fluxes: km3/yr
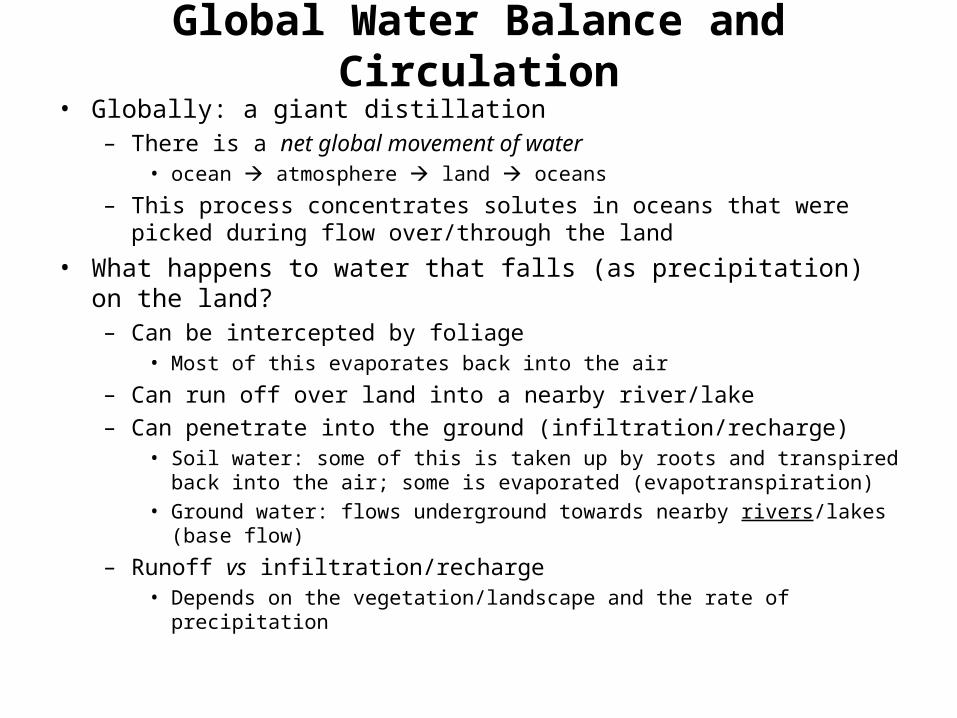
Global Water Balance and Circulation• Globally: a giant distillation
– There is a net global movement of water• ocean atmosphere land oceans
– This process concentrates solutes in oceans that were picked during flow over/through the land
• What happens to water that falls (as precipitation) on the land?– Can be intercepted by foliage
• Most of this evaporates back into the air
– Can run off over land into a nearby river/lake
– Can penetrate into the ground (infiltration/recharge)• Soil water: some of this is taken up by roots and transpired back into the air;
some is evaporated (evapotranspiration)• Ground water: flows underground towards nearby rivers/lakes (base flow)
– Runoff vs infiltration/recharge• Depends on the vegetation/landscape and the rate of precipitation
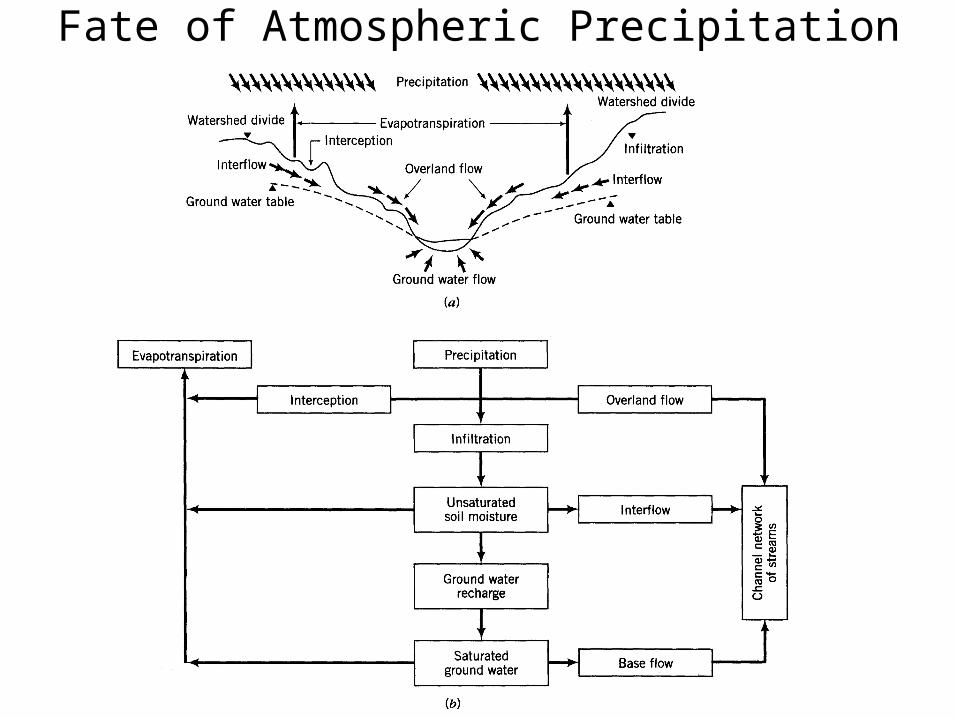
Fate of Atmospheric Precipitation
Dissolution of Solids• Question
– What is a solution? How is it formed?
– Electrolytes vs nonelectrolytes– Dissolution of solids
• Molecular compounds
• Ionic compounds

Composition of the Hydrosphere• Lecture Question
– What are the most concentrated solutes in the hydrosphere?
– Cations: Na+, K+, Ca2+, Mg2+
– Anions: Cl-, SO42-, H2CO3/HCO3
-/CO32-
– Neutral: Si(OH)4

Dissolved Solutes in Seawater
SO42-, 7.72%
HCO3-, 0.30%
Br-, 0.19%
Na+, 30.67%
Mg2+, 3.65%
Ca2+, 1.17%
K+, 1.14%Cl-, 55.05%
typical valuespH: 8.1TDS (salinity): 35 g/kg
• Proportions are by mass fraction
• Proportions remain fairly constant, even as salinity changes
• Ranges of salinity:33 – 37 g/kg

Dissolved Solutes in Seawaterg/kg g/L mass fraction
Na+ 10.7838 11.0534 30.67%Mg2+ 1.2837 1.315793 3.65%Ca2+ 0.4121 0.422403 1.17%K+ 0.3991 0.409078 1.14%
Sr2+ 0.0079 0.008098 0.02%Cl
19.3529 19.83672 55.05%
SO4
2.7124 2.78021 7.72%
HCO3
0.107 0.109675 0.30%
Br
0.0672 0.06888 0.19%CO3
0.0161 0.016503 0.05%
F
0.0068 0.00697 0.02%B(OH)3 0.0045 0.004613 0.01%
Si(OH)4 0.002 0.00205 0.01%
TDS 35.1555 36.03439 100%density 1.025
pH 8.1salinity (g/kg) 33-37

Dissolved Solutes in Rivers
Cl
SO4
HCO3
K+
Mg2+
Na+
Ca2+Si(OH)4
48%
10%
8%
9%13%
7%
3%
1%
typical valuespH: 7.3 8.1TDS (salinity): 70 200
Values from 1980
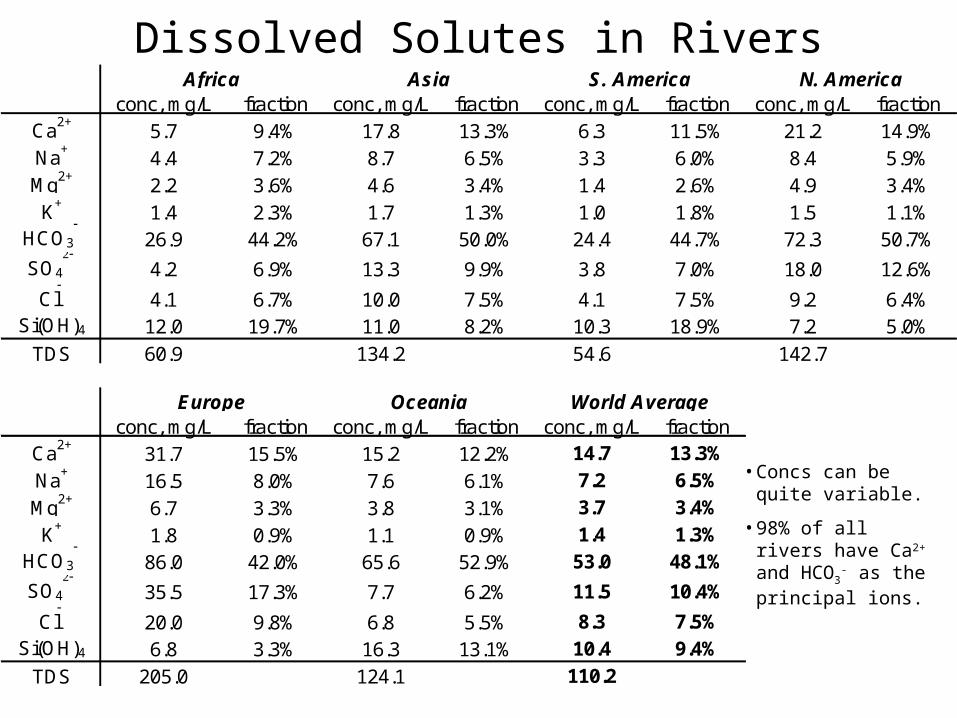
Dissolved Solutes in Riversconc, mg/L fraction conc, mg/L fraction conc, mg/L fraction conc, mg/L fraction
Ca2+ 5.7 9.4% 17.8 13.3% 6.3 11.5% 21.2 14.9%Na+ 4.4 7.2% 8.7 6.5% 3.3 6.0% 8.4 5.9%Mg2+ 2.2 3.6% 4.6 3.4% 1.4 2.6% 4.9 3.4%K+ 1.4 2.3% 1.7 1.3% 1.0 1.8% 1.5 1.1%
HCO3
26.9 44.2% 67.1 50.0% 24.4 44.7% 72.3 50.7%
SO4
4.2 6.9% 13.3 9.9% 3.8 7.0% 18.0 12.6%
Cl
4.1 6.7% 10.0 7.5% 4.1 7.5% 9.2 6.4%Si(OH)4 12.0 19.7% 11.0 8.2% 10.3 18.9% 7.2 5.0%
TDS 60.9 134.2 54.6 142.7
conc, mg/L fraction conc, mg/L fraction conc, mg/L fractionCa2+ 31.7 15.5% 15.2 12.2% 14.7 13.3%
Na+ 16.5 8.0% 7.6 6.1% 7.2 6.5%
Mg2+ 6.7 3.3% 3.8 3.1% 3.7 3.4%
K+ 1.8 0.9% 1.1 0.9% 1.4 1.3%HCO3
86.0 42.0% 65.6 52.9% 53.0 48.1%
SO4
35.5 17.3% 7.7 6.2% 11.5 10.4%
Cl
20.0 9.8% 6.8 5.5% 8.3 7.5%Si(OH)4 6.8 3.3% 16.3 13.1% 10.4 9.4%
TDS 205.0 124.1 110.2
World AverageOceaniaEurope
Africa Asia S. America N. America
• Concs can be quite variable.
• 98% of all rivers have Ca2+ and HCO3
- as the principal ions.
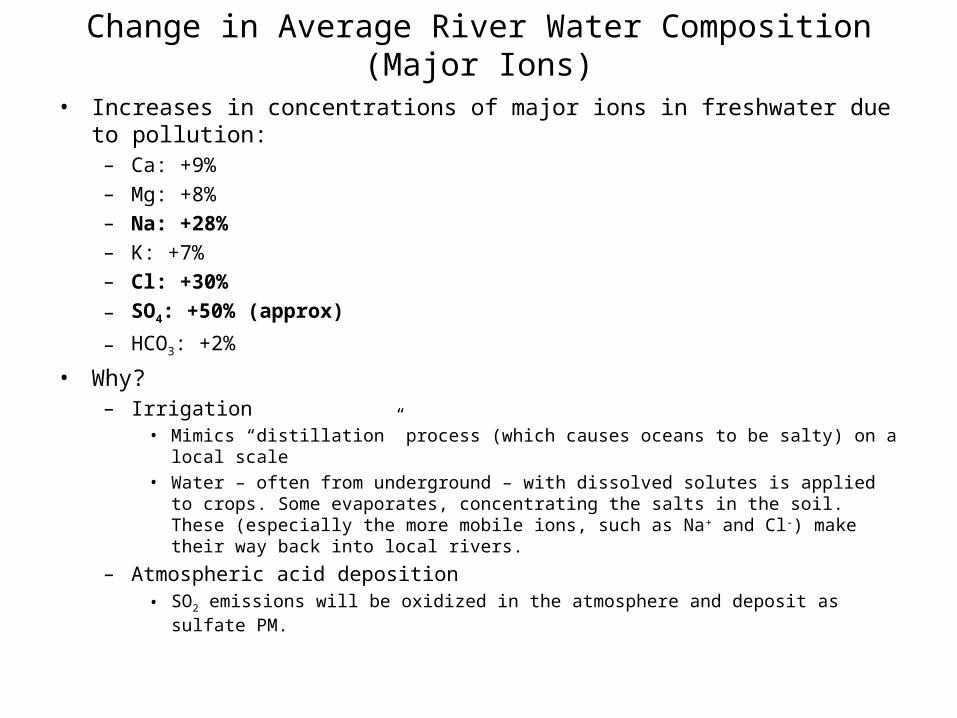
Change in Average River Water Composition (Major Ions)
• Increases in concentrations of major ions in freshwater due to pollution:– Ca: +9%– Mg: +8%– Na: +28%– K: +7%– Cl: +30%
– SO4: +50% (approx)
– HCO3: +2%
• Why?– Irrigation
• Mimics “distillation” process (which causes oceans to be salty) on a local scale
• Water – often from underground – with dissolved solutes is applied to crops. Some evaporates, concentrating the salts in the soil. These (especially the more mobile ions, such as Na+ and Cl-) make their way back into local rivers.
– Atmospheric acid deposition• SO2 emissions will be oxidized in the atmosphere and deposit as sulfate PM.
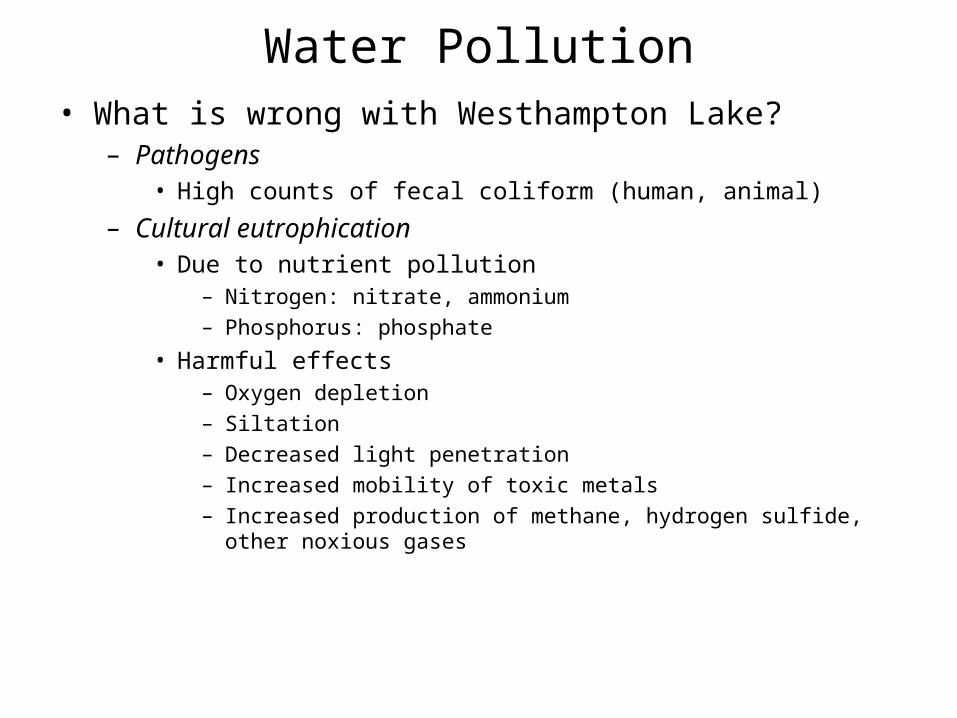
Water Pollution• What is wrong with Westhampton Lake?
– Pathogens• High counts of fecal coliform (human, animal)
– Cultural eutrophication• Due to nutrient pollution
– Nitrogen: nitrate, ammonium– Phosphorus: phosphate
• Harmful effects– Oxygen depletion– Siltation– Decreased light penetration– Increased mobility of toxic metals– Increased production of methane, hydrogen sulfide, other noxious
gases

Classification of Water Pollution
• Biological pollution– Pathogens (poor sanitation)– Others: invasive species, eutrophication, etc
• Physical pollution– Thermal pollution (water used as coolant)– Siltation (increased TSS), eg due to increased erosion
• Chemical pollution– Change in chemical composition and toxicity

Water Pollution Overview• Worst Water Pollution Problems
– Pathogens• Due to poor sanitation
• Can be a serious problem in developing countries
• WMO estimate: 3.5 million die a year from water-born disease, mostly children under 2 years old
– Nutrient pollution• Causes cultural eutrophication, algae blooms, oxygen depletion
– High BOD waste• Causes oxygen depletion
– Toxic metals• Sometimes called “heavy” metals
• Lead, mercury, arsenic are the worst offenders
– Toxic organics• Pesticides, petroleum by-products, solvents, industrial waste, etc

Major Activities that Pollute the Hydrosphere• Industrial discharges
– eg, paper and pulp mills, chemical manufacturers, steel plants, textile manufacturers, food processing plants
• Sewage discharges– Discharges of treated sewage from treatment plants; combined sewer overflows
(CSOs)
• Urban runoff– Runoff from impervious surfaces (streets, etc)
• Agricultural operations– Crop production, livestock operations (esp cafos)
• Silvicultural operations– Forest management, tree harvesting, logging road construction
• Resource extraction– Mining, petroleum drilling, runoff from mine tailing sites
• Waste disposal– Landfill leachate, underground injection, incineration (followed by atmospheric
deposition of pollutants)
• Hydrologic modification– Channelization, dredging, dam construction, removal of riparian vegetation,
streambank modification, drainage/filling of wetlands
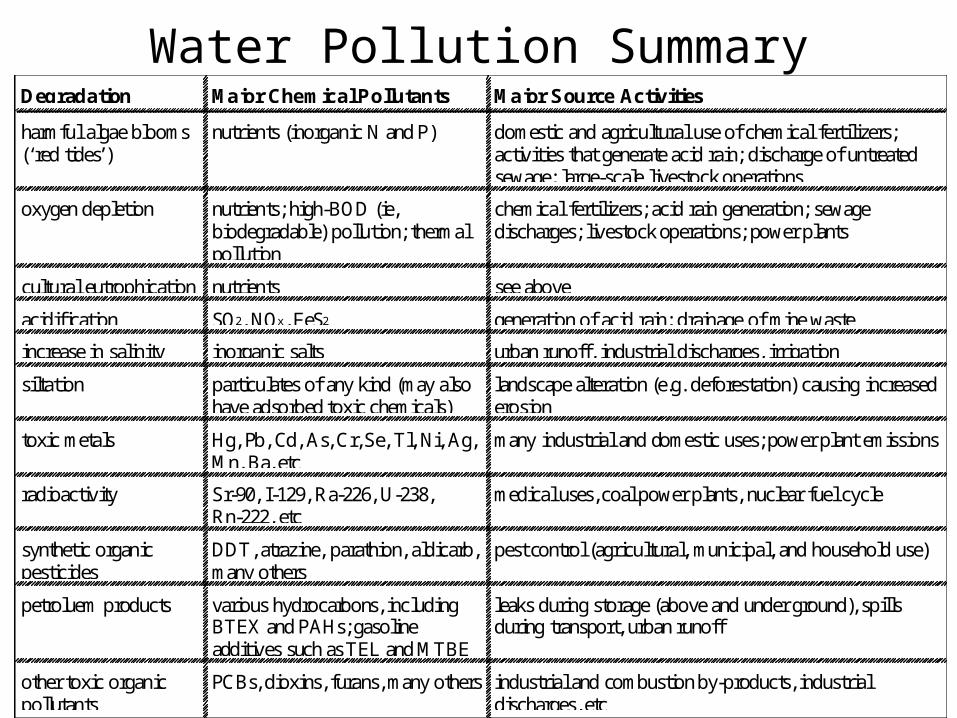
Water Pollution Summary
industrial and combustion by-products, industrialdischarges, etc
PCBs, dioxins, furans, many othersother toxic organicpollutants
leaks during storage (above and under ground), spillsduring transport, urban runoff
various hydrocarbons, includingBTEX and PAHs; gasolineadditives such as TEL and MTBE
petroluem products
pest control (agricultural, municipal, and household use)DDT, atrazine, parathion, aldicarb,many others
synthetic organicpesticides
medical uses, coal power plants, nuclear fuel cycleSr-90, I-129, Ra-226, U-238,Rn-222, etc
radioactivity
many industrial and domestic uses; power plant emissionsHg, Pb, Cd, As, Cr, Se, Tl, Ni, Ag,Mn, Ba, etc
toxic metals
landscape alteration (e.g. deforestation) causing increasederosion
particulates of any kind (may alsohave adsorbed toxic chemicals)
siltation
urban runoff, industrial discharges, irrigationinorganic saltsincrease in salinity
generation of acid rain; drainage of mine wasteSO2, NOx, FeS2acidification
see abovenutrientscultural eutrophication
chemical fertilizers; acid rain generation; sewagedischarges; livestock operations; power plants
nutrients; high-BOD (ie,biodegradable) pollution; thermalpollution
oxygen depletion
domestic and agricultural use of chemical fertilizers;activities that generate acid rain; discharge of untreatedsewage; large-scale livestock operations
nutrients (inorganic N and P)harmful algae blooms(‘red tides’)
Major Source ActivitiesMajor Chemical PollutantsDegradation
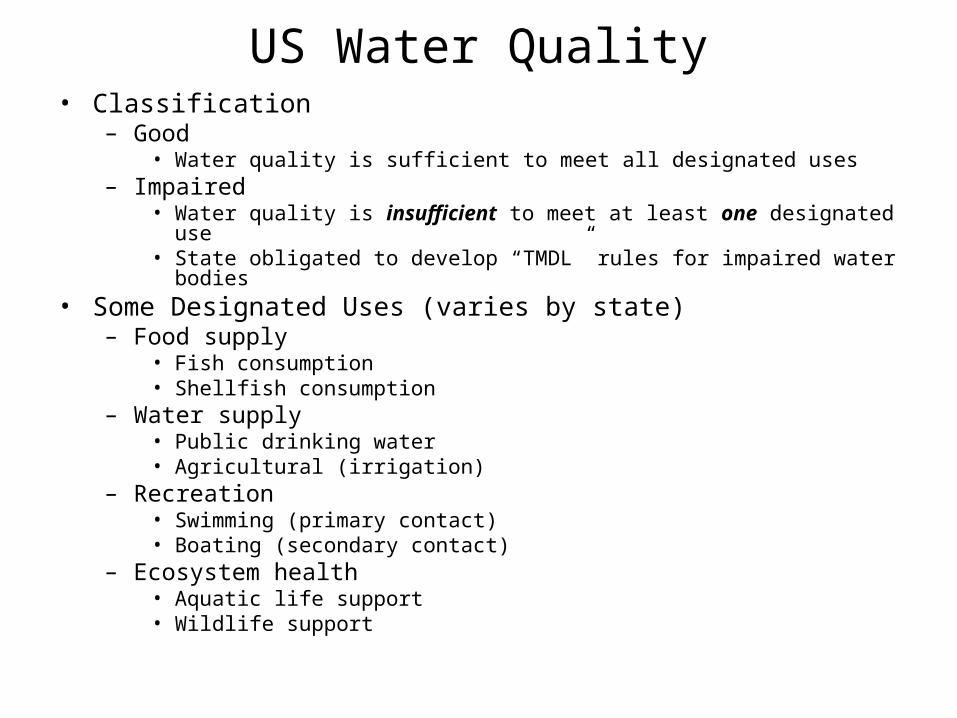
US Water Quality• Classification
– Good• Water quality is sufficient to meet all designated uses
– Impaired• Water quality is insufficient to meet at least one designated use• State obligated to develop “TMDL” rules for impaired water bodies
• Some Designated Uses (varies by state)– Food supply
• Fish consumption• Shellfish consumption
– Water supply• Public drinking water• Agricultural (irrigation)
– Recreation• Swimming (primary contact)• Boating (secondary contact)
– Ecosystem health• Aquatic life support• Wildlife support

US Water Quality: Common Causes of Impairment
Leading Pollutant Sources (US EPA, 2000)
industrialagriculturalatmospheric depositionsewage discharges5
fertilizer applicationatmospheric depositionunspecified nonpoint
sourcesforestry4
landfillsindustrialurban runoffurban runoff3
septic tanksurban runoffhydrologic
modificationhydrologic
modification2
leaky USTssewage dischargesagricultureagriculture1
GroundwaterEstuariesLakesRiversRank
Leading Pollutants/Stressors (US EPA, 2000)
nitratetoxic organicsBODnutrients5
pesticidespathogensTDSBOD4
toxic metalsBODsiltationhabitat alterations3
petroleum productspesticidestoxic metalssiltation2
VOCstoxic metalsnutrientspathogens1
GroundwaterEstuariesLakesRiversRank

Water Quality in the US (2000): Rivers and Streams
• Overall impairment level– 39% of rivers and streams are
impaired for their designated use
• Leading Polluting Sources1. Agriculture
2. Hydrologic Modification
3. Urban Runoff
4. Forestry
5. Sewage Discharges
• Leading Pollutants/Stressors1. Pathogens
2. Siltation
3. Habitat Alterations
4. High BOD
5. Nutrients

Water Quality in the US (2000): Lakes, Reservoirs, Ponds
• Overall impairment level– 45% of lakes, reservoirs, and
ponds are impaired for their designated use
• Leading Polluting Sources1. Agriculture2. Hydrologic Modification3. Urban Runoff4. Unspecified Point Sources5. Atmospheric Deposition
• Leading Pollutants/Stressors1. Nutrients2. Toxic Metals3. Siltation4. TDS (ie, high salinity)5. High BOD

Water Quality in the US (2000): Estuaries
• Overall impairment level– 51% of estuaries are impaired for
their designated use
• Leading Polluting Sources1. Sewage Discharges
2. Urban Runoff
3. Industrial
4. Atmospheric Deposition
5. Agricultural
• Leading Pollutants/Stressors1. Toxic Metals
2. Pesticides
3. High BOD
4. Pathogens
5. Toxic Organics
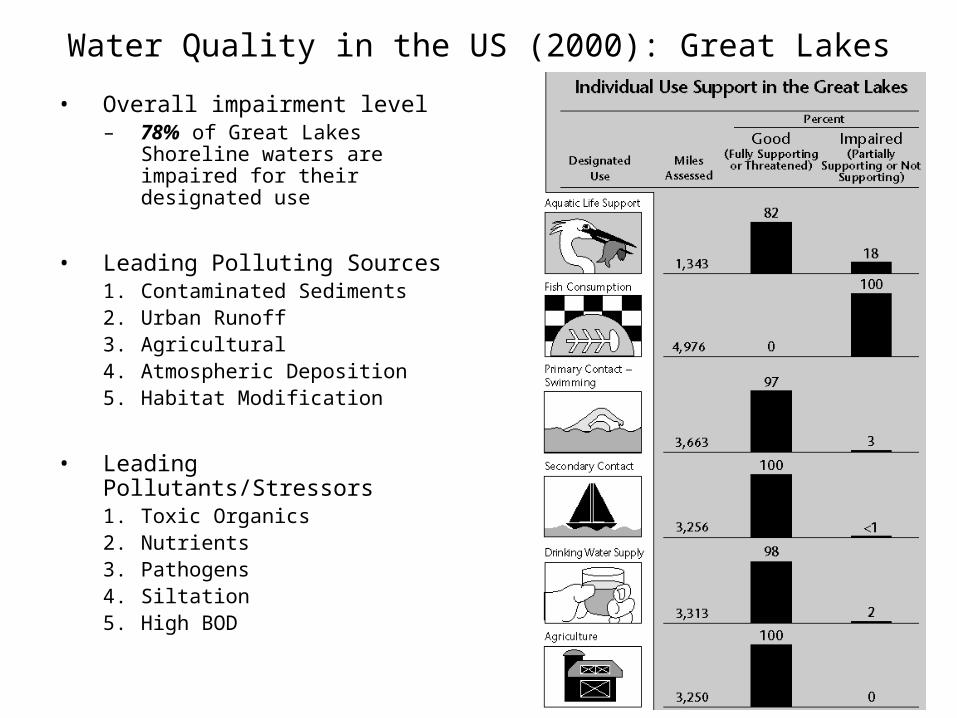
Water Quality in the US (2000): Great Lakes
• Overall impairment level– 78% of Great Lakes Shoreline
waters are impaired for their designated use
• Leading Polluting Sources1. Contaminated Sediments2. Urban Runoff3. Agricultural4. Atmospheric Deposition5. Habitat Modification
• Leading Pollutants/Stressors1. Toxic Organics2. Nutrients3. Pathogens4. Siltation5. High BOD
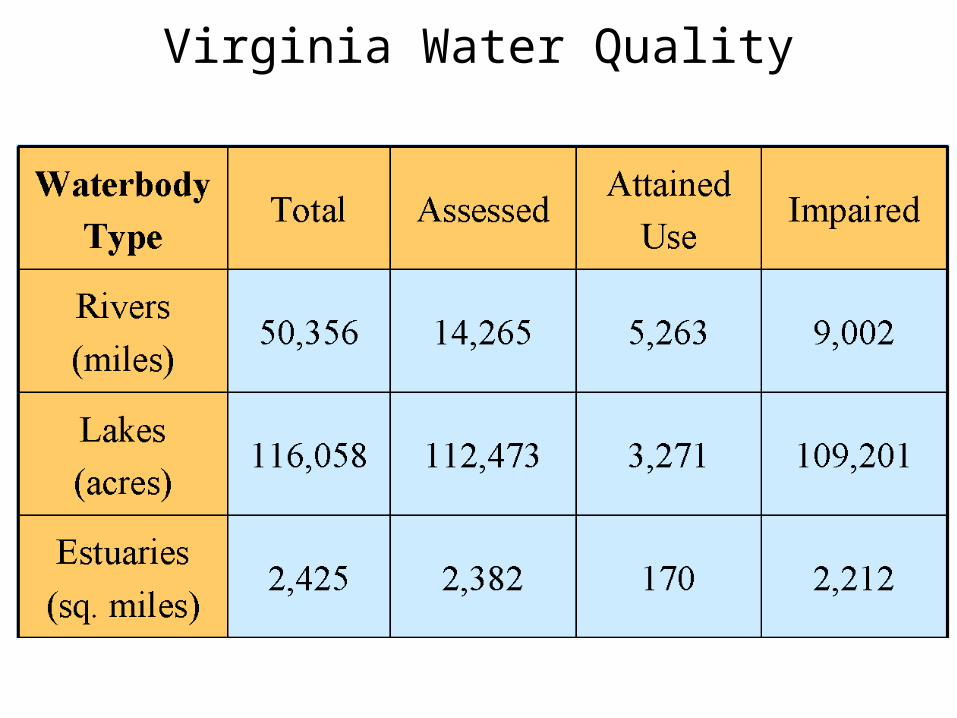
Virginia Water Quality

VA Water Quality• Leading causes of impairment
– Rivers• Major: Pathogens (fecal coliform, e coli)
• Others (minor): DO, pH, freshwater benthics, PCBs in fish
– Lakes1. DO
2. PCBs in fish
– Estuaries (Chesapeake)1. PCBs in fish
2. DO
3. Benthics (more minor)

VA Water Quality Trends
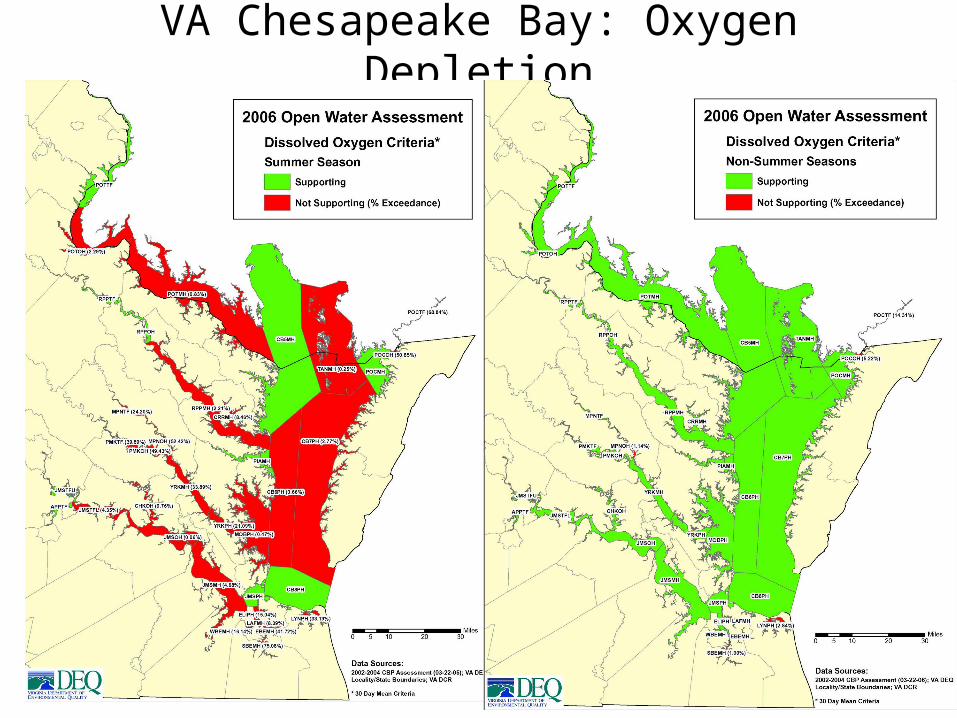
VA Chesapeake Bay: Oxygen Depletion

VA Chesapeake Bay: Submerged Aquatic Vegetation
• SAV goal: 77,463 acres– 37,640 acres attained– 38,823 acre shortfall
Related Documents