WATER INEQUALITY IN AN IMPAIRED ESTUARY: LEGACIES AND WATER HAZARDS IN CALIFORNIA’S BAY-DELTA RAOUL S. LIÉVANOS, M.A.¹ ON BEHALF OF RESEARCH PARTNERS: DEBBIE DAVIS, ENVIRONMENTAL JUSTICE COALITION FOR WATER MIHO KIM AND CELIA DAVIS, DATA CENTER ¹UNIVERSITY OF CALIFORNIA, DAVIS DEPARTMENT OF SOCIOLOGY & ATMOSPHERIC AEROSOLS AND HEALTH PROGRAM, DEPARTMENT OF LAND, AIR AND WATER RESOURCES June 2, 2009 Water Justice: Local and Global Perspectives An Environmental Justice Project Community & Young Scholars Event University of California, Davis

WATER INEQUALITY IN AN IMPAIRED ESTUARY: LEGACIES AND WATER HAZARDS IN CALIFORNIA’S BAY-DELTA RAOUL S. LIÉVANOS, M.A. ¹ ON BEHALF OF RESEARCH PARTNERS:
Dec 17, 2015
Welcome message from author
This document is posted to help you gain knowledge. Please leave a comment to let me know what you think about it! Share it to your friends and learn new things together.
Transcript

WATER INEQUALITY IN AN IMPAIRED ESTUARY: LEGACIES AND WATER HAZARDS
IN CALIFORNIA’S BAY-DELTA
RAOUL S. LIÉVANOS, M.A.¹
ON BEHALF OF RESEARCH PARTNERS: DEBBIE DAVIS, ENVIRONMENTAL JUSTICE COALITION FOR WATER
MIHO KIM AND CELIA DAVIS, DATA CENTER
¹UNIVERSITY OF CALIFORNIA, DAVIS DEPARTMENT OF SOCIOLOGY & ATMOSPHERIC AEROSOLS AND HEALTH PROGRAM, DEPARTMENT OF LAND, AIR AND WATER RESOURCES
June 2, 2009Water Justice: Local and Global Perspectives
An Environmental Justice Project Community & Young Scholars Event
University of California, Davis

Organization of the Talk
Acknowledgements Introduction Research Strategy Findings Conclusion & Future Directions
Title slide credits: Fish advisory sign photo by Raoul S. Liévanos.
Acknowledgements
Ford Foundation Rose Foundation UC Davis John Muir Institute of the Environment: Environmental Justice
Project & Julie Sze, Trina Filan, and Fraser Shilling UC Davis Center for Regional Change & Jonathan London UC Berkeley Community Forestry & Environmental Research Partnerships EJ Delta Research Collaborative:
Environmental Justice Coalition for Water DataCenter Bay-Delta Community and Regional Organizations (alphabetical order):
Asian Pacific Americans News and Review; California Delta Chambers and Visitor's Bureau; California Indian Environmental Alliance; Catholic Charities of Stockton; Center for Environmental Health Central California Environmental Justice Network; Central Valley Asian-American Chamber of Commerce; Clean Water Action; Community Water Center; Farmworker Health Services; Hazardous Materials Program, Contra Costa County; Lao Khmu Association, Inc.; Nototomne Cultural Preservation; Public Health Services of San Joaquin County; Restore the Delta; Southeast Asian Assistance Center; Todos Unidos; Tracy Interfaith Ministries; and the United Cambodian Families.
UC Davis/UC Merced Atmospheric Aerosols and Health Program and the UC Toxic Substances Research and Teaching Program

Introduction
“I don't know if I can support this study you are doing. I think looking at Delta water issues from a minority perspective is a limited approach to the local water issues we face.
Our local major concern is the attempt to take Delta water south to LA which makes our local water quality worse. There have been lots of blatant lies saying that the Delta would be fine with less water. We know that isn't true.
If the purpose of your study is to hinder the building of the Peripheral Canal that is something we support. Trying to support it from a minority ‘environmental justice’ position is interesting, but ultimately has little chance of success against the financial pressures coming from Southern California for Northern California water. The fight over water is historically a major battle in California. It needs a much tougher position than a minority perspective on poor water quality to win. This is just my opinion of course.
Your study also fails to address the majority of those who live, work and play in the Delta and make their livelihood here which are not ethnic minority groups for the most part. In other words, I don't see that your study addresses the population most affected by poor water quality in the Delta.
I'm not sure if your research angle really helps us, since it is centering on a minority perspective versus the bigger picture...”
-- Delta Resident who declined to participate in this study

Introduction
“From a sociological perspective, it is never sufficient to point to the environment as having been protected. The question must always be asked, for whom and from whom?”¹
Environmental Inequality: “…addresses more structural questions that focus on social inequality (the unequal distribution of power and resources in society) and environmental burdens…[E]nvironmental inequalities include any form of environmental hazard that burdens a particular social group.”²
Water Justice: the ability of all communities to access safe, affordable water for drinking, fishing, recreational, and cultural uses.”³
Water Inequality: water hazards that burden a particular social group.
¹Schnaiberg (1980:5) quoted in Pellow (2002:1). ²Pellow (2000:582). ³http:www.ejcw.org.

Introduction
Recent National-Level Reassessment: those factors “uniquely associated with race, such as racial targeting, housing discrimination, or other race-related factors are associated with the location of the nation’s hazardous waste facilities.”³
Analyses of California4: Various forms of environmental inequality documented: The San Francisco Bay Area (e.g., Environmental Breast Cancer
Movement, TRI facilities and Est. Cancer Risks from Air Toxics Exposure)
Silicon Valley (e.g., High-tech industry exploitation of immigrant workers and the environment)
San Joaquin Valley (e.g., pesticide drift, facility siting, and water well contamination & cancer clusters); and
Southern California (e.g., TSDF & TRI facility locations, Est. Cancer Risks from Air Toxics Exposures, and “white privilege”)
³Mohai and Saha (2007:343). 4 Brown (2007); Cole and Foster (2001); Morello-Frosch et al. (2002); Nash (2006); Pastor et al. (2005); Pastor et al. (2007); Pellow and Park (2002); Pulido (1996, 2000); Harrison (2008, 2006).

Introduction
Common Foci on the Bay-Delta Region: Engineering, agricultural & resource economics, hydrology, etc.:
Important & Informative, but biophysical and econometric bias5
Risk assessments and ecosystem analyses: Advance our understanding of water quality and fish
contamination problems, but often disconnected from region’s demographics and geographic communities6
Previous sociological and historical perspectives: Ethnographic/historical look at region’s water politics and macro-level
analyses of “state-making” & the origins of U.S. flood control policy, and fish consumption and advisory awareness among disadvantaged groups.7
5 Lund et al. (2007); Lund et al. (2008). 6 Lydy and Austin (2004); Lam et al. (1994); Davis et al. (2003); Davis et al. (2008). 7 Gottlieb (1988); O’Neil (2006); Silver et al. (2007); Shilling (2003); Shilling, London, and Lievanos (In Press).

Introduction

Introduction
2 studies beginning to explicitly explore water inequality in the region: Shilling (2003):
Located zip code areas w/highest frequency of anglers in river locations w/high mercury concentrations (>0.3 parts per million) in fish tissue, but no comparison was made to areas outside these locations.
Silver et al. (2007): African Americans and Asians (Vietnamese and
Cambodians) and those not aware of fish advisories in the region are potentially at the highest risk for eating contaminated fish from the Delta. Does not look at the relationship between the spatial distribution of water hazards and community demographics.

Research Strategy
Questions: What is the social and spatial distribution of water
inequality in the Bay-Delta? What are the perspectives from potentially impacted
communities on this water inequality Approach
Geographic Information Systems (GIS) to assess “plausible exposure zones” to surface water hazards (4-mile buffer)¹ and select tracts with 50% or more of their area within the buffer to reliably capture the tracts and demographics within the buffers.
Ethnographic observations, interviews, focus groups¹See Harner et al. (2002) for the discussion of U.S. EPA’s reasoning for the 4-mile buffer.²See Mohai and Saha (2007) for more on this method called, “50 percent areal containment” method.

Research Strategy
Key Primary Data and Methods “Snow Ball Sample”¹ for 16 interviews and 3 focus groups with
community members and environmental health and justice organization representatives in the region (N=45): Race and ethnicity: 40% Latino, 27.5% Caucasian, 22.5% Asian/Pacific
Islander, 4.5% African American, 4.5% Native American; Country of origin: 36% born outside U.S. in countries such as Mexico, El
Salvador, Peru, the Philippines, Hong Kong, Cambodia, and Laos; Current residence: 49% live in San Joaquin, 29% in Contra Costa, 13% in
Sacramento Counties with 7% living in Stanislaus or Alameda counties who commute to the Delta for work;
Median age of those who gave it (N=39) was 52 years old; Average length of residence of participants at current residence: 14
years with only 4 individuals at their residence for less than a year; Income: 47% had an annual household income under $34,999, 25% between
$50,000 and $74,999, and 19% between %75,000 and $149,999 (N=32). Data read and coded in Nvivo 8 – qualitative data analysis software –
and double checked between the members of the research team¹ (Lofland et al. 2006).

Research Strategy
Key Secondary Data and Methods Inventory of Surface Water-Toxic Releasing Facilities in California in
1999 with hazard scores¹ (U.S. EPA’s Risk-Screening Environmental Indicators Version 2.1.5 (9/2007)
January 1, 2009 release of Geodata (U.S. EPA’s latest List of “Impaired” rivers, streams, and major water bodies as of 2006
(California State Water Resources Control Board (SWRCB 2008a; 2008b)
1970-2000 Population and Housing Data from the U.S. Census Bureau (courtesy Seattle Regional Office)
Spatial Analysis (ArcInfo V.9.3). Statistical Analysis (SPSS V. 17):
Independent Sample T-Tests (comparison of means of those contained within the buffers against those outside the buffers)
Logistic Regression (find strongest predictors of proximity to water hazards)
¹Hazard scores = pounds of toxic emissions x the oral toxicity weight of toxins emitted

Organization of the Findings
Qualitative Themes: Mistrust in Government and Authority Stuck between a Fish and a Hard Place
GIS and Statistical Analysis: Description of the social and spatial
distribution of water inequality in the region Predictors of water inequality: indirect bias,
direct bias, and legacies of bias

Institutional Recreancy: Mistrust in Government and AuthorityAssistance with data analysis from Trina Filan
“All the hype that has been created around a catastrophe that could happen in the Delta, a seismic catastrophe etcetera…there has never been a major seismic event in the Delta, in the history of the Delta. So, granted we have a lot more information now on what faults are, and who am I to, to question [experts on the Delta]….[T]o me it feels like an excuse, uh, [to] change the whole region, for economic benefit. Um, so…I guess to me, the whole effort seems very, very orchestrated.” (Personal Interview, 2008)
“[W]hen you use the Katrina example, ok, this is what’s really frustrating to me…If you’re going to spend $21 billion on a bypass that is further going to sink the islands to create more local flooding, where in the world are we gonna have any money left to keep up with levee maintenance and protect the levees? And the Katrina-type failures, are…if they’re gonna happen they’re gonna happen in San Joaquin county. South Sacramento and San Joaquin county, ok? …[T]hey’re already taking, FEMA’s already deserted five levees, ok? If that is really a concern then why isn’t out of all this planning fixing those levees first most important.” (Personal Interview, 2008)
“[Y]ou have this, you know, this hierarchy…the land owners, these various different professionals and all, and their main concern is really themselves and protecting their own interests rather than, you know, some general plan to help for the good of all, the whole. Do you see what I mean? And that’s what I see as a problem.” (Personal Interview, 2008)

Institutional Recreancy: Mistrust in Government and AuthorityAssistance with data analysis from Trina Filan
“And I was wondering okay, what do I do if something happens? And see, in terms of emergency preparedness…a lot of it is very generic, as far as I’m concerned. You want to be able to know what you can do and where you can go, and you want to have some means of knowing to get out….[T]here was never any notice that if you hear that siren go off for whatever you need to go out of there, you are in real danger, particularly down in the Delta where there are a lot of farm laborers….That seems to me to be a very critical issue. You can’t just let people drown like rats...you know what I mean?...
…It seems like the Department of Water Resources holds water in all of these dams until it reaches a very critical level [then t]hey just start massively dumping water down into the rivers…and it really raises that river level, and it really speeds up the flow of the water in all. So, that’s about the water they are pushing and the velocity that it gains because they are dumping so much water out and all. And like I said I don't understand the philosophy. I guess they’re thinking, ‘Well, we can't afford to lose this water,’…but…you start throwing these massive volumes of water down that creates really critical safety issues for everybody….[Y]ou know, you have purportedly a weakened levee system already, and you’re putting added pressure on it by all this water at the bottom…and so, you know, that has got to be putting a lot of stress on the levees, and you’re creating a condition that could easily turn into a disaster” (Personal Interview, 2008).

Between a Fish and the Hard Place: Negotiating Place Attachment and Risky Subsistence
Fishing spots as a “my place of solace out there in that water,” where they “sit there…relax and [have] time away from everybody” (Personal Interview, 2008).
“If you have less money to buy food, you fish more. If you have less work and money, then you will go to the dollar store for food which has food that is worse for you.” (Focus Group, 2008).
“Water affects us when the factories send waste into the river and ocean. This affects fish and all of us because it contaminates the water. There is a drain next to where I fish with liquid that comes [from] I don’t know where. I don’t know what factories are around there” (Focus Group, 2008).
Between a Fish and the Hard Place: Negotiating Place Attachment and Risky Subsistence
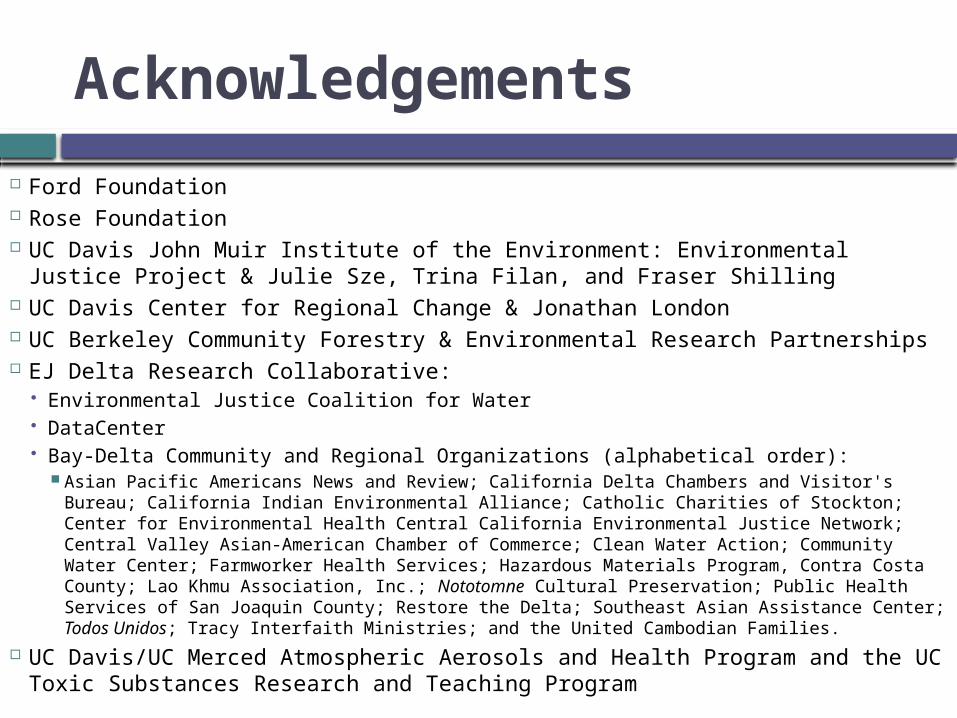
“[I]t makes my family and I feel sad that our elders and our youth will no longer be able to enjoy the clean water that our ancestors did. My brothers no longer fish to eat as they have seen the deformities and sickness come from the water. Now they fish for the sport of it…[Whatever] Sacramento's decision[s] are on the State's water management will impact our people in many ways. It will impact fishing areas if the water is diverted to other areas, it will dry up our sloughs, gathering areas, and much more.” (Personal Communication, 2008)
“[I]t’s not an easy thing to live in two different worlds…I leave [home]. I go to work. I’m in their world. I live by their rules. I act like them, ok, to a certain extent. I go out the door, I come home, I’m in my own world, you know? I do what native people do. I act like a Native. I feel like a Native. I eat like a Native, you know? And, it’s not easy juggling my life like that, but that’s how I have to live because…most people…cannot relate.” (Personal Interview, 2008)
“[R]ight now, the only policy option is to tell people to eat different fish or less of the contaminated fish. So, it’s totally on the consumer, and it’s their personal responsibility to not accumulate toxins. And that’s pretty much where it stands. And that’s not acceptable.” (Personal Interview, 2008)

GIS and Statistical Analysis
Description of Water Inequality Impaired Rivers and Streams Impaired Major Water Bodies Surface Water-Toxic Release Facilities Surface Water Hazard Zones
Predictors of Water Inequality Models testing three hypotheses:
Indirect Bias Direct Bias Legacies of Bias

Impaired Rivers and Streams
Impaired Rivers and Streams
Cont. Not Cont.
Cont. Not Cont.
Cont. Not Cont.
Cont. Not Cont.
1970 1980 1990 2000
$0
$50,000
$100,000
$150,000
$200,000
$250,000
$300,000
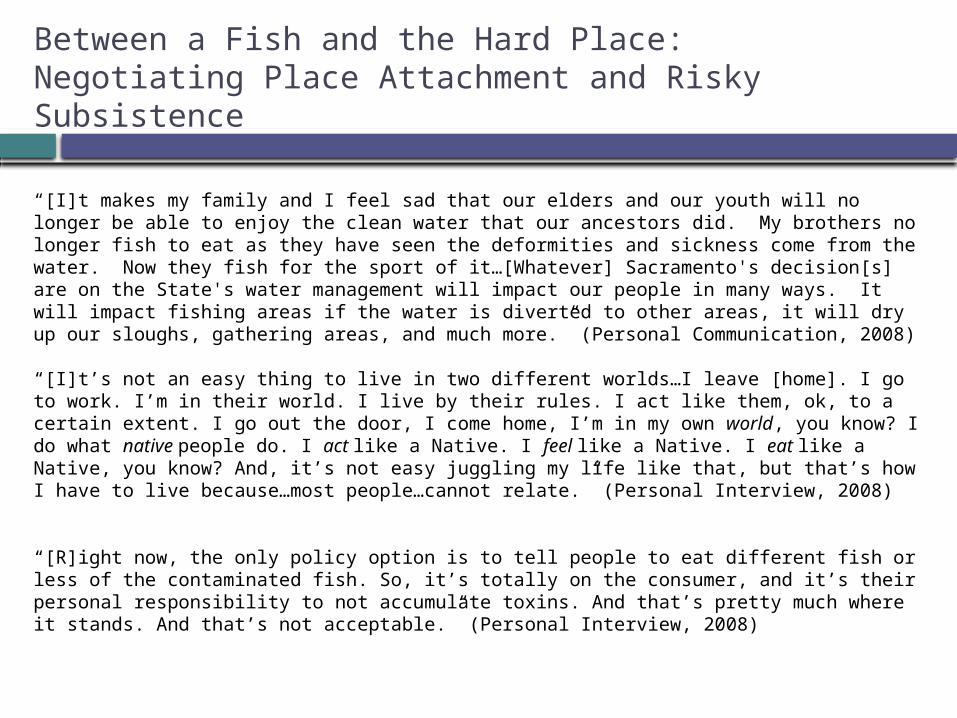
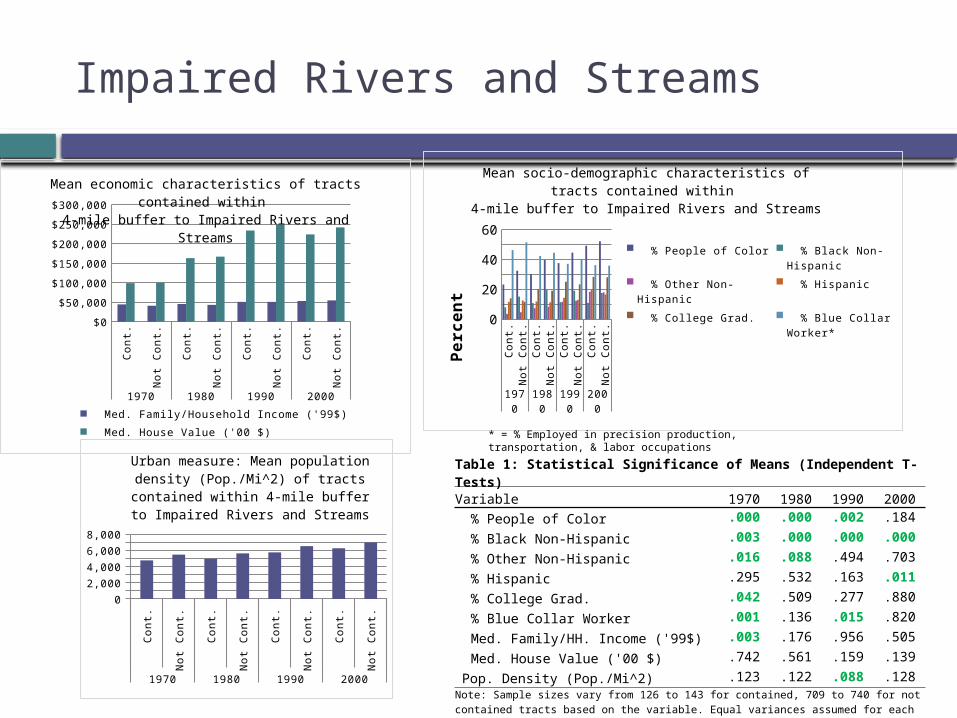
Mean economic characteristics of tracts contained within 4-mile buffer to Impaired Rivers and Streams
Med. Family/Household Income ('99$) Med. House Value ('00 $)
Cont. Not Cont.
Cont. Not Cont.
Cont. Not Cont.
Cont. Not Cont.
1970 1980 1990 2000
0
1,000
2,000
3,000
4,000
5,000
6,000
7,000
8,000
Urban measure: Mean population density (Pop./Mi^2) of tracts contained within 4-mile
buffer to Impaired Rivers and Streams
Cont. Not Cont.
Cont. Not Cont.
Cont. Not Cont.
Cont. Not Cont.
1970 1980 1990 2000
0
10
20
30
40
50
60
Mean socio-demographic characteristics of tracts contained within 4-mile buffer to Impaired Rivers and Streams
% People of Color
% Black Non-Hispanic
% Other Non-Hispanic
% Hispanic
% College Grad.
% Blue Collar Worker*Per
cen
t* = % Employed in precision production, transportation, & labor occupations
Table 1: Statistical Significance of Means (Independent T-Tests)
Variable 1970 1980 1990 2000
% People of Color .000 .000 .002 .184
% Black Non-Hispanic .003 .000 .000 .000
% Other Non-Hispanic .016 .088 .494 .703
% Hispanic .295 .532 .163 .011
% College Grad. .042 .509 .277 .880
% Blue Collar Worker .001 .136 .015 .820
Med. Family/HH. Income ('99$) .003 .176 .956 .505
Med. House Value ('00 $) .742 .561 .159 .139
Pop. Density (Pop./Mi^2) .123 .122 .088 .128
Note: Sample sizes vary from 126 to 143 for contained, 709 to 740 for not contained tracts based on the variable. Equal variances assumed for each comparison of means.

Impaired Major Water Bodies

Impaired Major Water Bodies
Cont. Not Cont.
Cont. Not Cont.
Cont. Not Cont.
Cont. Not Cont.
1970 1980 1990 2000
$0
$50,000
$100,000
$150,000
$200,000
$250,000
$300,000
Mean economic characteristics of tracts contained within 4-mile buffer to Impaired Major Water Bodies
Med. Family/Household Income ('99$) Med. House Value ('00 $)
Cont. Not Cont.
Cont. Not Cont.
Cont. Not Cont.
Cont. Not Cont.
1970 1980 1990 2000
0
10
20
30
40
50
60
Mean socio-demographic characteristics of tracts contained within 4-mile buffer to Impaired Major Water Bodies
% People of Color
% Black Non-Hispanic
% Other Non-Hispanic
% Hispanic
% College Grad.
% Blue Collar Worker*
Per
cent
Cont. Not Cont.
Cont. Not Cont.
Cont. Not Cont.
Cont. Not Cont.
1970 1980 1990 2000
0
1,000
2,000
3,000
4,000
5,000
6,000
7,000
8,000
Urban measure: Mean population density (Pop./Mi^2) of tracts contained within 4-mile
buffer to Impaired Major Water Bodies
* = % Employed in precision production, transportation, & labor occupations
Table 2: Statistical Significance of Means (Independent T-Tests)
Variable 1970 1980 1990 2000
% People of Color .000 .000 .000 .000
% Black Non-Hispanic .000 .000 .000 .000
% Other Non-Hispanic .000 .000 .000 .000
% Hispanic .042 .009 .001 .000
% College Grad. .111 .156 .290 .463
% Blue Collar Worker .050 .017 .018 .006
Med. Family/HH. Income ('99$) .000 .000 .000 .000
Med. House Value ('00 $) .017 .000 .067 .252
Pop. Density (Pop./Mi^2) .000 .000 .000 .000
Note: Sample sizes vary from 292 to 302 for contained, 543 to 581 for not contained tracts based on the variable. Equal variances assumed for each comparison of means.

Surface Water-Toxic Release Facilities

Surface Water-Toxic Release Facilities
Cont. Not Cont.
Cont. Not Cont.
Cont. Not Cont.
Cont. Not Cont.
1970 1980 1990 2000
$0
$50,000
$100,000
$150,000
$200,000
$250,000
$300,000
Mean economic characteristics of tracts contained within 4-mile buffer to Surface Water-TRI Facilities
Med. Family/Household Income ('99$) Med. House Value ('00 $)
Cont. Not Cont.
Cont. Not Cont.
Cont. Not Cont.
Cont. Not Cont.
1970 1980 1990 2000
0
10
20
30
40
50
60
70
Mean socio-demographic characteristics of tracts contained within 4-mile buffer to Surface Water-TRI Facilities
% People of Color
% Black Non-Hispanic
% Other Non-Hispanic
% Hispanic
% College Grad.
% Blue Collar Worker*Per
cen
t* = % Employed in precision production, transportation, & labor occupations
Cont. Not Cont.
Cont. Not Cont.
Cont. Not Cont.
Cont. Not Cont.
1970 1980 1990 2000
0
1,000
2,000
3,000
4,000
5,000
6,000
7,000
8,000
9,000
Urban measure: Mean population density (Pop./Mi^2) of tracts contained within 4-mile
buffer to Surface Water-TRI FacilitiesTable 3: Statistical Significance of Means (Independent T-Tests)
Variable 1970 1980 1990 2000
% People of Color .000 .000 .000 .000
% Black Non-Hispanic .000 .000 .000 .000
% Other Non-Hispanic .000 .000 .000 .000
% Hispanic .000 .000 .000 .000
% College Grad. .000 .000 .000 .000
% Blue Collar Worker .000 .000 .000 .000
Med. Family/HH. Income ('99$) .000 .000 .000 .002
Med. House Value ('00 $) .000 .000 .058 .651
Pop. Density (Pop./Mi^2) .000 .000 .000 .000
Note: Sample sizes vary from 286 to 305 for contained, 549 to 578 for not contained tracts based on the variable. Equal variances assumed for each comparison of means.

Surface Water Hazard Zones

Surface Water Hazard Zones
Cont. Not Cont.
Cont. Not Cont.
Cont. Not Cont.
Cont. Not Cont.
1970 1980 1990 2000
$0
$50,000
$100,000
$150,000
$200,000
$250,000
$300,000
Mean economic characteristics of tracts contained within Surface Water Hazard Zones
Med. Family/Household Income ('99$) Med. House Value ('00 $)
Cont. Not Cont.
Cont. Not Cont.
Cont. Not Cont.
Cont. Not Cont.
1970 1980 1990 2000
0
10
20
30
40
50
60
70
Mean socio-demographic characteristics of tracts contained within Surface Water Hazard Zones
% People of Color
% Black Non-Hispanic
% Other Non-Hispanic
% Hispanic
% College Grad.
% Blue Collar Worker*Per
cen
t* = % Employed in precision production, transportation, & labor occupations
Cont. Not Cont.
Cont. Not Cont.
Cont. Not Cont.
Cont. Not Cont.
1970 1980 1990 2000
0
2,000
4,000
6,000
8,000
Urban measure: Mean population density (Pop./Mi^2) of tracts contained within Surface
Water Hazard ZonesTable 4: Statistical Significance of Means (Independent T-Tests)
Variable 1970 1980 1990 2000
% People of Color .000 .000 .000 .000
% Black Non-Hispanic .000 .000 .000 .000
% Other Non-Hispanic .044 .002 .000 .000
% Hispanic .000 .000 .000 .000
% College Grad. .000 .000 .000 .000
% Blue Collar Worker .000 .000 .000 .000
Med. Family/HH. Income ('99$) .000 .000 .000 .000
Med. House Value ('00 $) .000 .000 .000 .001
Pop. Density (Pop./Mi^2) .000 .000 .000 .000Note: Sample sizes vary from171 to 178 for contained, 664 to 705 for not contained tracts based on the variable. Equal variances assumed for each comparison of means.

Predictors of Water Inequality: Impaired Waters
Table 5: Logistic Regression Results of Four-Mile Proximity to Water Hazards in the 6 County Bay-Delta Region Using 50% Areal Containment Method
Impaired Rivers and Streams Impaired Major Water Bodies
VariableModel 1:
Indirect BiasModel 2:
Direct BiasModel 3: Legacy
Model 4: Indirect Bias
Model 5: Direct Bias
Model 6: Legacy
Race/Ethnicity % Black Non-Hisp. .072*** .088*** % Other Non-Hisp. 0.016# .062** % Hispanic 0.066*** .046*** Change % Black Non-Hisp., '80-'00 .046*** .032** -.034** Change % Other Non-Hisp., '80-'00 .070*** .071*** -.089** Change % Hisp., '80-'00 .095*** .058**Economic (ln)Med. HH. Income 0.924** 1.196*** -1.733*** -2.464*** (ln)Med. Housing Value -1.507** Change Med. HH. Income, '79-'99 (1,000 '99 Dollars) -.023# .047*** Change Med. Housing Unit Value, '80-'00 (1,000 '00 Dollars) .004* .006** -.004** -.005*Sociopolitical % College Grad. .062*** .039*** % Blue Collar Worker -0.024# Change % College Grad., '80-'00 .022# Change % Blue Collar Worker, '80-'00 .032**Urban Properties (ln)Pop. Density 0.271*** .383*** .302** Change Pop. Density, '80-'00 (1,000 Pop./Mi^2) -.121* -.264*** -.192**Zoning and Spatial FeaturesTract Intersects Primary Delta Boundary 1.856#Tract Intersects Secondary Delta Boundary -1.939*** -2.113*** -1.899*** 3.469*** 4.096*** 3.533***Tract in Alameda County -2.548*** -2.553*** -2.938*** 4.839*** 6.120*** 5.229***Tract in Contra Costa County -2.002*** -1.903*** -2.321*** 3.424*** 4.909*** 4.200***Tract in Sacramento County 2.421*** 3.007*** 2.611***Tract in San Joaquin County 2.837*** 4.032*** 3.769***Tract in Solano County -2.928*** -2.416*** -2.910*** 4.189*** 5.131*** 4.388***Constant 2.341*** -9.109* -13.818*** -2.808*** 30.599*** 18.867***Nagelkerle R^2 0.240 0.226 0.290 0.326 0.464 0.503 -2 Log Likelihood 625.444 637.817 595.572 878.618 759.128 720.112Model X^2 (df) 130.180*** (df = 9) 122.524*** (df = 9) 160.052*** (df = 13) 232.037*** (df = 10) 354.873*** (df = 10) 390.543*** (df = 16)Sample Size 864 868 864 864 868 864Notes: Data from the U.S. Census Bureau (1970, 1980, 1990, 2000). Significance levels: *** p < .001., ** p < .01, * p < .05, # p < .10.

Predictors of Water Inequality: Surface Water-Toxic Hazards
Table 6: Logistic Regression of Four-Mile Proximity to Water Hazards in the 6 County Bay-Delta Region Using 50% Areal Containment Method TRI Surface Water Facilities Surface-Water Hazard Zones
VariableModel 7:
Indirect BiasModel 8:
Direct BiasModel 9: Legacy
Model 10: Indirect Bias
Model 11: Direct Bias
Model 12: Legacy
Race/Ethnicity % Other Non-Hisp. .060*** .094*** .030*** .040*** % Hispanic .041*** .045*** .034*** .065*** Change % Black Non-Hisp., '80-'00 -.017# Change % Other Non-Hisp., '80-'00 .057*** -.041# .035** Change % Hisp., '80-'00 .032** .059***Economic (ln)Med. HH. Income -1.291*** -.655# -.791** (ln)Med. Housing Value -1.765** -1.067*** Change Med. Housing Unit Value, '80-'00 (1,000 '00 Dollars) -.004** .009*** -.005**Sociopolitical % College Grad. -.028** -.070*** -.063*** % Blue Collar Worker -.034# -.071** -.057** Change % College Grad., '80-'00 .063*** .029* .089*** Change % Blue Collar Worker, '80-'00 .037** .041**Urban Properties (ln)Pop. Density .173# .259** Change Pop. Density, '80-'00 (1,000 Pop./Mi^2) -.137* -.202***Zoning and Spatial FeaturesTract Intersects Secondary Delta Boundary 1.277*** 1.059*** 1.257*** .692** .499#Tract in Alameda County 2.932*** 2.462*** 2.382*** .493* .746**Tract in Contra Costa County 1.665** 1.681*** 1.798*** .731**Tract in Sacramento County -1.276# -2.160*** -2.655*** -3.049*** -3.326***Tract in San Joaquin County 1.012#Tract in Solano County 1.193# .746# .789#Constant -3.036*** 12.056*** 26.811*** -2.198*** 10.136** 6.630Nagelkerle R^2 0.394 0.480 0.522 0.229 0.283 0.339 -2 Log Likelihood 828.269 751.033 708.211 739.858 705.391 665.602
Model X^2 (df)291.260***
(df = 10)371.940***
(df = 10)411.317***
(df = 17)136.355***
(df =7)172.651***
(df = 6)210.612***
(df =11)Sample Size 864 868 864 864 868 864Notes: Data from the U.S. Census Bureau (1970, 1980, 1990, 2000). Significance levels: *** p < .001., ** p < .01, * p < .05, # p < .10.

Conclusion: Envisioning an Environmentally Just and Sustainable Bay-Delta
Build trust and respect with local communities in the Bay-Delta Region Require disciplinary and credential diversification within Bay-Delta
science programs and governing entities. Institute a full research program on environmental inequality in the Bay-
Delta that coordinates with current efforts of the Cumulative Impact/Precautionary Approach Workgroup in California Environmental Protection Agency’s Environmental Justice Program
Democratize California water for historically marginalized and environmentally overburdened communities through the use of multilingual, non-internet-based outreach and education methods.
Bay-Delta policy should be informed by the state’s public and tribal trust responsibilities.
Ensure fair and efficient disaster preparedness and flood protection for vulnerable and environmentally overburdened communities.
Promote just and sustainable local and state economies and land uses within the Bay-Delta and other areas connected to vital drinking water sources throughout California.
Increase financing for any and all efforts that will ensure and environmentally just and sustainable Bay-Delta.

Thank You • e-mail: [email protected]
ReferencesBrown, Phil. 2007. Toxic Exposures: Contested Illness and the Environmental Health Movement. New York, NY: Columbia University Press.
Burley, D., P. Jenkins, S. Laska, and T. Davis. 2007. “Place Attachment and Environmental Change in Coastal Louisiana.” Organization & Environment 20(3): 346-366.
Cole, L.W. and S.R. Foster. 2001. From the Ground up: Environmental Racism and the Rise of the Environmental Justice Movement. New York: New York University Press.
Davis, J. A., B. K. Greenfield, G. Ichikawa, M. Stephenson. 2008. “Mercury in Sport Fish from the Sacramento-San Joaquin Delta Region, California, USA.” Science of the Total Environment 391:66-75.
Davis, J. A., D. Yee, J. N. Collins, S. E. Schwarzbach, and S. N. Luoma. 2003. “Potential for Increased Mercury Accumulation in the Estuary Food Web.” San Francisco Estuary and Watershed Science 1(1) (Available at http://repositories.cdlib.org/jmie/sfews/vol1/iss1/art4).
Freudenburg, William R. 1993. “Risk and Recreancy: Weber, the Division of Labor, and the Rationality of Risk Perceptions.” Social Forces 71(4): 909-932.
Gottlieb, R. 1988. A Life of Its Own: The Politics and Power of Water. New York: Harcourt Brace Jovanovich, Publishers.
Herner, J., K. Warner, J. Pierce, and T. Huber. 2002. “Urban Environmental Justice Indices.” The Professional Geographer 54(3): 318-331.
Harrison, J.L. 2006. “‘Accidents’ and Invisibilities: Scaled Discourses and the Naturalization of Regulatory Neglect in California’s Pesticide Drift Conflict.” Political Geography 25: 506-529.
Harrison, J.L. 2008. “Abandoned Bodies and Spaces of Sacrifice: Pesticide Drift Activism and the Contestation of Neoliberal Environmental Politics in California.” Geoforum 39: 1197-1214.
Lam, R.H.F., J.P. Brown, A.M. Fan, A. Milea. 1994. “Chemicals in California Drinking Water: Source Contaminants, Risk Assessment, Risk Management, and Regulatory Standards.” Journal of Hazardous Materials 39: 173-192.
Lofland, J., D. Snow, L. Anderson, and L. H. Lofland. 2006. Analyzing Social Settings: A Guide to Qualitative Observation and Analysis, 4th ed. Belmont, CA: Wadsworth/Thompson Learning.
Lund, J., E. Hanak, W. Fleenor, R. Howitt, J. Mount, and P. Moyle. 2007. Envisioning Futures for the Sacramento-San Joaquin Delta. San Francisco, CA: Public Policy Institute of California.
Lund, J., E. Hanak, W. Fleenor, W. Bennett, R. Howitt, J. Mount, and P. Moyle. 2008. Comparing Futures for the Sacramento-San Joaquin Delta. San Francisco, CA: Public Policy Institute of California.
Lydy, M. J. and K. R. Austin. 2004. “Toxicity Assessment of Pesticide Mixtures Typical of the Sacramento-San Joaquin Delta Using Chironomus Tentans.” Archives of Environmental Contamination and Toxicology 48(1):49-55.
Mohai, P. and R. Saha. 2007. “Racial Inequality in the Distribution of Hazardous Waste: A National-Level Reassessment.” Social Problems 54(3):343-370.
Morello-Frosch, R.A., M. Pastor, C. Porras, J. Sadd. 2002. “Environmental Justice and Regional Inequality in Southern California.” Environmental Health Perspectives 110(2): 149-154.
Nash, L. 2006. Inescapable Ecologies: A History of Environment, Disease, and Knowledge. Berkeley: University of California Press.
O’Neill, K. 2006. Rivers by Design: State Power and the Origins of U.S. Flood Control. Durham, NC: Duke University Press.
Pastor, M., J.L. Sadd, R. Morello-Frosch. 2005. “The Air is Always Cleaner on the Other Side: Race, Space, and Air Toxics Exposures in California.” Journal of Urban Affairs 27(2): 127-148.
Pastor, M., J. Sadd, R. Morello-Frosch. 2007. Still Toxic After All These Years: Air Quality and Environmental Justice in the San Francisco Bay Area. Santa Cruz, CA: University of California, Santa Cruz, Center for Justice, Tolerance & Community.
Pellow, D.N. 2000. “Environmental Inequality Formation: Toward a Theory of Environmental Injustice.” American Behavioral Scientist 43(4): 581-601.
Pellow, D.N. 2002. Garbage Wars: The Struggle for Environmental Justice in Chicago. Cambridge: The MIT Press.
Pellow, D.N. and L.S. Park. 2002. The Silicon Valley of Dreams: Environmental Injustice, Immigrant Workers, and the High-Tech Global Economy. New York: New York University Press.
Pulido, L. 1996. Environmentalism and Economic Justice: Two Chicano Struggles in the Southwest. Tucson, AZ: The University of Arizona Press.
Pulido, L. 2000. “Rethinking Environmental Racism: White Privilege and Urban Development in Southern California.” Annals of the Association of American Geographers 90(1): 12-40.
Schnaiberg, A. 1980. The Environment: From Surplus to Scarcity. Oxford: Oxford University Press.
Shilling, F. 2003. Background Information for a Central Valley Fish Consumption Study: Geographic Information System and Relational Database for Fish Tissue Mercury and Creel Survey Data. Sacramento, CA: Delta Tributaries Mercury Council.
Shilling, F., J. London, R. Lievanos. In Press. “Marginalization by Collaboration: Environmental Justice as a Third Party in and beyond CALFED.” Environmental Science and Policy.
Togh, J.F. and R.B. Brown. 1997. “Racial and Gender Meanings of Why People Participate in Recreational Fishing.” Leisure Sciences 19: 129-146.
Related Documents