ACTA UNIVERSITATIS UPSALIENSIS UPPSALA 2006 Digital Comprehensive Summaries of Uppsala Dissertations from the Faculty of Science and Technology 170 Water-Induced Charge Transport in Microcrystalline Cellulose MARTIN NILSSON ISSN 1651-6214 ISBN 91-554-6541-2 urn:nbn:se:uu:diva-6815

Welcome message from author
This document is posted to help you gain knowledge. Please leave a comment to let me know what you think about it! Share it to your friends and learn new things together.
Transcript
ACTAUNIVERSITATISUPSALIENSISUPPSALA2006
Digital Comprehensive Summaries of Uppsala Dissertationsfrom the Faculty of Science and Technology 170
Water-Induced Charge Transportin Microcrystalline Cellulose
MARTIN NILSSON
ISSN 1651-6214ISBN 91-554-6541-2urn:nbn:se:uu:diva-6815


List of papers I. Water-induced charge transport in tablets of microcrystalline
cellulose of varying density: Dielectric spectroscopy and tran-sient current measurements. Martin Nilsson, Göran Alderborn and Maria Strømme. Chemical Physics 295 (2003) 159-165. Copy-right 2003 Elsevier.
II. Electrodynamic investigations of conduction processes in hu-mid microcrystalline cellulose tablets. Martin Nilsson and Maria Strømme. J. Phys. Chem. B 109 (2005) 5450-5455. Copyright 2005 American Chemical Society.
III. Mesopore structure of microcrystalline cellulose tablets charac-terized by nitrogen adsorption and SEM: The influence on wa-ter-induced ionic conduction. Martin Nilsson, Sima Valizadeh and Maria Strømme. Submitted to J. Phys. Chem. B.
IV. Conductivity percolation in loosely compacted microcrystalline cellulose: An in situ study by dielectric spectroscopy during densification. Martin Nilsson, Göran Frenning, Johan Gråsjö, Göran Alderborn and Maria Strømme. In manuscript.
V. Generalized regular singular-point description of low-frequency dielectric responses. Göran Frenning, Martin Nilsson and Maria Strømme. Phys. Rev. B 70 (2004) 012506:1-4. Copyright 2004 American Physical Society.
All the appended papers are reprinted with the permission from the publishers.
Comments on my participation: I Experiments, analysis, part of planning, part of writing II Experiments, analysis, planning, part of writing III Experiments, analysis, planning, writing IV Experiments, design of sample cell, analysis, planning, writing V Experiments, part of writing, did not take part of the theoretical
model development

Also published: Dielectric and Li transport properties of electron conducting and non-conducting sputtered amorphous Ta2O5 films.Göran Frenning, Martin Nilsson, Jörgen Westlinder, Gunnar Niklas-son, Maria Strømme Mattsson. Electrochim. Acta 46 (2001) 2041-2046.
Dielectric study of thin films of Ta2O5 and ZrO2.AnnaKarin Jonsson, Göran Frenning, Martin Nilsson, Maria Strømme Mattsson, Gunnar Niklasson. IEEE Trans. Dielectrics Electrical Insula-tion 8 (2001) 648-651.
Conductance phenomena in microcrystalline cellulose.Martin Nilsson. Phys. Stat. Sol. (c) 3 (2006) 251-254.

Contents
Introduction.....................................................................................................7
Aims................................................................................................................8
Background on the Cellulose structure ...........................................................9Water in cellulose.....................................................................................10
Charge transport in cellulose: Earlier findings .............................................12Power-law model......................................................................................12Exponential model....................................................................................12Charge transport at zero moisture content................................................13Charge transport percolation theory .........................................................13
Experimental methods and materials ............................................................15Electrical methods ....................................................................................15
Impedance spectroscopy and dielectric response ................................15Transient current measurements ..........................................................18The sample cells and electrodes ..........................................................19
Gas Adsorption.........................................................................................21BET......................................................................................................21BJH ......................................................................................................22Equipment and measurement procedure..............................................22Fractal dimension determination from the capillary condensation region ...................................................................................................22
Scanning Electron Microscopy ................................................................24Materials...................................................................................................24
Results and discussion ..................................................................................25Generalized regular singular-points .........................................................26Dielectric relaxations................................................................................26
The high-frequency relaxation..........................................................26The low-frequency wet relaxation .......................................................26Cole-Cole parameters ..........................................................................27
DC conduction..........................................................................................28Charge carrier density..........................................................................29The effect of pore structure on dc conduction .....................................31

Summary and conclusion..............................................................................40
Summary of appended papers .......................................................................42
Acknowledgements.......................................................................................46
Summary in Swedish ....................................................................................48Vatteninducerad laddningstransport i mikrokristallin cellulosa...............48
References.....................................................................................................51

7
Introduction
Cellulose is the most abundant natural polymer on earth, and was first iso-lated and reported in the late 1830’s. The cellulose polymer is the major part of the plant cell wall, but can also be found in bacteria, fungi, algae and ani-mals (Tunicate). The estimated annual synthesised amount of cellulose is 1011 to 1012 metric tons.1, 2
Cellulose is an important material in a number of applications such as pa-pers and sanitary products, packaging, insulator material in high voltage systems and as one of the most important excipient materials for pharmaceu-tical tablets.
Many applications of cellulose as a functional material rely on the water-cellulose interaction properties. In insulator applications it is important to understand and control the influence of water on the dielectric properties of cellulose. In sanitary products it is mainly the water absorption capacity that determines the functionality of the product, whereas in pharmaceutical ap-plication the key parameters connected to water-cellulose interactions – de-fining the feasibility of the product – are a bit more complex. In the last mentioned area it is of importance that the cellulose particles do not dissolve in water and, thus, that they are not taken up by the human body. In these applications the cellulose’s ability to absorb water makes sure that a cellu-lose containing tablet disintegrates properly and releases the drug molecules incorporated in the tablet when meeting the aqueous content of the stomach.3It has been suggested that it is the speed by which water molecules move in the cellulose structure that determines the rate by which drugs are released rather than a direct drug-cellulose interaction for drug molecules and ions that are surrounded by an hydration shell (Paper I). Further the cellulose’s ability to bind water molecules in order to prevent moisture-sensitive drugs from degrading when mixed with the cellulose, has been shown to be a key parameter determining the stability of a drug in a cellulose matrix (see, e.g., Mihranyan et al.4 and references therein).
The topic of the present thesis is about creating a more fundamental un-derstanding of how water molecules are transported – and affect other trans-port mechanisms – in cellulose. With a greater knowledge about these charge transport mechanisms, improvement of several cellulose-based prod-ucts may be achieved.
8
Aims
The aims of the thesis are to obtain a more fundamental understanding of the water-induced charge transport in cellulose. More specifically, my contribu-tions to the field are to investigate
the influence of density, the influence of moisture content, and the influence of pore structure
on this charge transport in microcrystalline cellulose (MCC), which is the cellulose type used in pharmaceutical applications. Other aims are also to assess and analyse dielectric relaxation processes pertaining to other proc-esses than the above mentioned as well as to use MCC as a model material for a generalized regular singular point analysis.
9
Background on the Cellulose structure
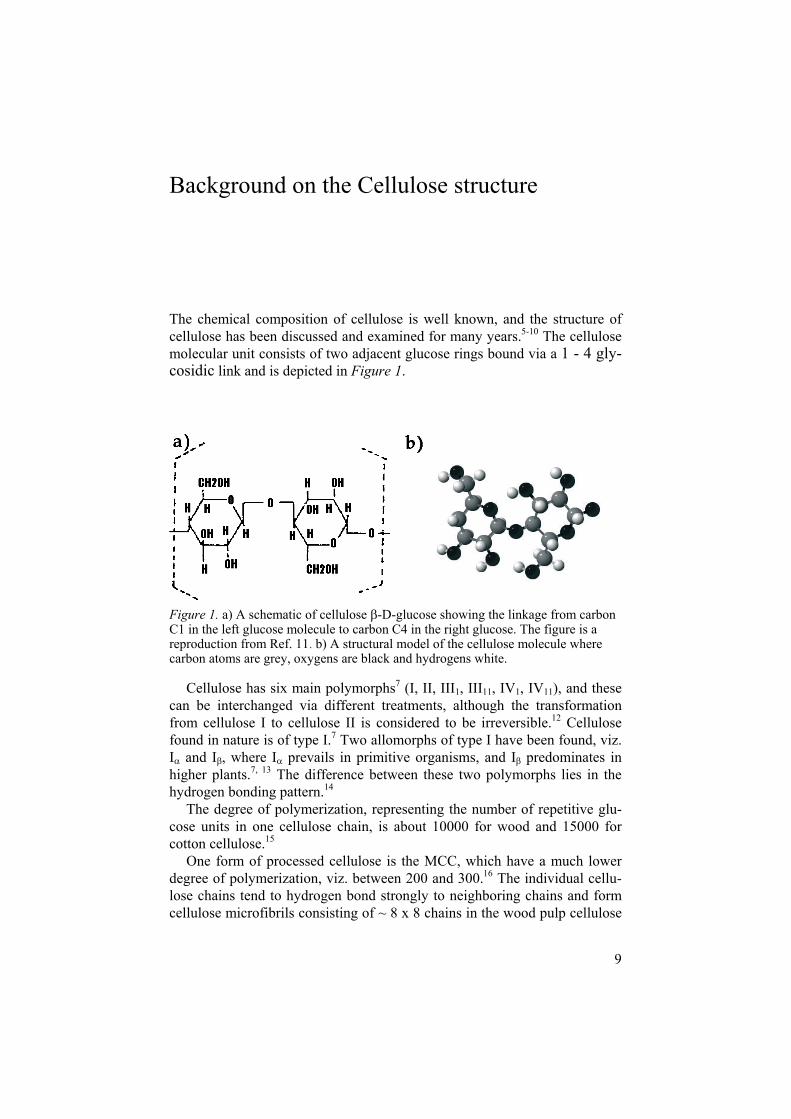
The chemical composition of cellulose is well known, and the structure of cellulose has been discussed and examined for many years.5-10 The cellulose molecular unit consists of two adjacent glucose rings bound via a 1 - 4 gly-cosidic link and is depicted in Figure 1.
Figure 1. a) A schematic of cellulose -D-glucose showing the linkage from carbon C1 in the left glucose molecule to carbon C4 in the right glucose. The figure is a reproduction from Ref. 11. b) A structural model of the cellulose molecule where carbon atoms are grey, oxygens are black and hydrogens white.
Cellulose has six main polymorphs7 (I, II, III1, III11, IV1, IV11), and these can be interchanged via different treatments, although the transformation from cellulose I to cellulose II is considered to be irreversible.12 Cellulose found in nature is of type I.7 Two allomorphs of type I have been found, viz. I and I , where I prevails in primitive organisms, and I predominates in higher plants.7, 13 The difference between these two polymorphs lies in the hydrogen bonding pattern.14
The degree of polymerization, representing the number of repetitive glu-cose units in one cellulose chain, is about 10000 for wood and 15000 for cotton cellulose.15
One form of processed cellulose is the MCC, which have a much lower degree of polymerization, viz. between 200 and 300.16 The individual cellu-lose chains tend to hydrogen bond strongly to neighboring chains and form cellulose microfibrils consisting of ~ 8 x 8 chains in the wood pulp cellulose

10
type made to produce MCC.17 The lateral dimension of these microfibrils are ~ 4 x 4 nm and they consist of crystalline interior regions and disordered surface regions.8, 18 Approximately 44% of the individual chains are, thus, located on the microfibril surfaces. The microfibrils form fibril aggregates which in their turn form the cellulose particles.17, 19, 20
Water in cellulose Cellulose is a hygroscopic material and adsorbs water in three stages.21, 22
First moisture adsorbs in amorphous regions at carbon-6 hydroxyl (6-OH) positions. In MCC water molecules bind to two 6-OH position on adjacent cellulose microfibrils when the water content is below ~ 1.5 wt %. Above this moisture content and up to ~3 wt % water binds to one of the chains only. After these two stages are completed, additional water molecules bind to the water molecules already bound to the structure and form a bulk phase which may swell the cellulose structure. Figure 2 shows the three stages of water in MCC.

11
Figure 2. Three water adsorption stages in cellulose. a) First stage where water molecules bind to two adjacent cellulose microfibrils. b) Second stage where the adsorbed water molecules bind to one microfibril chain only. c) Third stage, repre-senting the bulk water phase where water molecules bind to water molecules already bound to the cellulose. The figure is a reproduction from Ref. 22.

12
Charge transport in cellulose: Earlier findings
Power-law model Already in 1960 it was shown that the ionic conductivity in cellulose in-creases with increasing moisture content to the power of 9 and it was sug-gested that moisture in cellulose constituted a pathway on which alkali ions, incorporated as impurities, could move.23 Later research put forward that also dissociated water molecules contribute to the charge transport process taking place on water molecules bond to the cellulose structure.24, 25 As an argument for the experimentally observed power-law behaviour, Murphy23
put forward an explanation based on the existence of an impurity-cation-generating-sites at every 9th cellulose monomer.
Exponential model Later this argument has been considered quite unrealistic26 and instead it has been shown that the strong increase in conductivity with increasing moisture content can be interpreted by an exponential model24, 26 that is not based on an assumption of a high concentration of impurity-cation-generating-sites. The physics behind the exponential model is instead based on the hypothesis that the number of water molecules per hydroxyl group on the cellulose fi-bres is Poisson distributed and that the conductivity is linearly increasing with the number of occupied hydroxyl groups.26 Just like earlier,23 the as-sumption that the water molecules create a transport path on which charged impurities present in the cellulose can travel, was considered realistic. The exponential model alone does not, however, explain the levelling off in a log-lin plot of the conductivity vs. moisture content, observed experimen-tally for high moisture contents, (see e.g. Sapieha et al.24 and Paper II). An explanation to this deviation from a pure exponential behaviour above mois-ture contents of ~ 3 wt %, has been given24 based on the fact that structural changes in cellulose may take place at moisture contents higher than those at which structural bonding of water to the cellulose occurs, cf. Figure 2c.
There are also other models27, 28 which represent combinations of the power law and the exponential model.
13
Charge transport at zero moisture content Experimental data shows that there is a small but finite conductivity in cellu-lose at zero moisture content.24, 29, 30 Whereas the power-law model predicts zero conductivity at zero moisture content and the exponential model envis-ages a finite conductivity value caused by ionic charge transport, preliminary band structure calculations based on density functional theory31-33 show that the electronic density of states of MCC at zero moisture content has a small but finite value at the Fermi level. Introduction of moisture appears to reduce the electronic density of states at the Fermi energy to zero.34
These findings show that there indeed is a small electronic conductivity present in the cellulose at zero moisture contents disappearing when mois-ture is introduced. The fact that the exponential model, in the absence of moisture, foresees a finite ionic conductivity that is assumed to take place on a transport path made up of water molecules must be deemed quite unphysi-cal. From the above view-point the power-law model should be valid for non-zero moisture contents. In the result and discussion section I will give further arguments to support the power-law model involving that an assump-tion of a high concentration distribution of impurity generating sites is not necessarily required to explain the observed high power-law exponent.
Charge transport percolation theory The theory of percolation has proven to be a useful tool for analyzing a physical property, such as conductivity, of binary disordered systems when the property in question differs significantly in magnitude between the com-ponent materials.35, 36
For a random mixture of conducting and insulating materials, one of the predictions of percolation theory is the existence of a percolation threshold. As the volume fraction, , of the conducting phase goes up, the percolation threshold signifies the volume fraction, c , at which the conductivity of the mixture abruptly increases. Close to c the conductivity exhibits scaling behaviour.37 Specifically, above c , the conductivity, , of the binary mix-ture is predicted to vary as
tc0 )( . (1)
Here 0 is a constant, dependent on c but not on , proportional to the conductivity of the component material with the highest conductivity, and tis the scaling exponent.
14
This type of equation applies to percolation phenomena, in general, and not only to the conductivity, but the magnitude of c and t may however depend on the physical property under consideration. Equation (1) is expected to hold in a limited critical region above c . For a three dimensional random resistor network it has been shown that the exponent t equals 2,38, 39 and for most binary microgranular conduction systems a volume percolation thresh-old of ~ 0.2 is usually obtained.40

15
Experimental methods and materials
In the experiments conducted in the appended publications, on which this thesis is based, two different types of electrodynamics measurement methods were used, viz. impedance spectroscopy and transient current measurements. In addition to these techniques, gas adsorption measurements and scanning electron microscopy were also employed. Below, these methods are de-scribed along with the equipment used and a description of some of the most frequently encountered response types observed with the methods. Finally, the investigated materials are presented.
Electrical methods Two important parameters defining the electrical properties of a material are the permittivity and the conductivity. The electrical conductivity describes the migration of electric charge through a material under the action of an applied electric field, whereas the permittivity describes the polarisation (rotation and distribution of charges) in the material.
The electrodynamic methods utilized in the current work uses alternating currents (AC) or direct currents (DC). The AC method is usually referred to as Impedance Spectroscopy or Dielectric Spectroscopy whereas the DC method utilized is called Transient Current Measurements.
Impedance spectroscopy and dielectric response Impedance spectroscopy is a well-established characterization tool in mate-rials sciences. It may be used to investigate the dynamics of bound or mobile charge in the bulk or interfacial regions of any kind of solid or liquid mate-rial: ionic, semi-conducting, mixed electronic-ionic, and even insulators (dielectrics).41, 42
In impedance spectroscopy, a sinusoidal AC voltage is applied across a material localized between two electrodes in a probe station and the fre-quency of the voltage is scanned from a maximum to a minimum value. The measured current response due to charged species present in the sample can be interpreted in terms of several interrelated complex frequency dependent

16
parameters such as impedance, conductance, capacitance and dielectric per-mittivity. For example, the complex permittivity of a sample is obtained from the measured capacitance C as
0CC''i' , (2)
where 0C is the capacitance of the empty probe station, and ' and '' are the real and imaginary parts of the permittivity, respectively. For a parallel plate electrode probe station d/AC 00 , where A and d are the electrode area and electrode separation distance, respectively, and 0 is the permittiv-ity of free space (8.854 10-14 F/cm).
In this work we focus on the analysis of both the complex permittivity and of the real part, ' , of the complex conductivity, . The real part of the conductivity is related to the real part, 'G , of the measured conductance and to the imaginary part, '' , of the dielectric permittivity as
'''GAd' 0 . (3)
Here denotes the angular frequency.
The Debye response One of the most elementary dielectric responses is the Debye response43
which describes non-interacting dipoles in a liquid. The Debye response is mathematically expressed as
i1)( s , (4)
where and s are the high-frequency and the static permittivity, respec-tively, and is the relaxation time. The electrical circuit representation of this response is shown in Figure 3a, where 1C and 2C are capacitances and R is a resistance. This type of simple dielectric response is seldom seen in solids.

17
Figure 3. The Debye (a) and the Cole-Cole (b) equivalent circuits. Here C and R denote capacitances and resistance and CPE is a Constant Phase Element.
The Cole-Cole response It is often found in solids, especially in disordered ones, that the peak in ''when plotted vs. frequency is broader than predicted by Eq. (4). One of the most commonly used models to account for such peak-broadening is the Cole-Cole model44 explaining the broadening by a distribution in dipolar relaxation times. The Cole-Cole response can be expressed as
i1)( s , (5)
where is a constant between 0 and 1. The electrical circuit representation of the Cole-Cole type of response is shown in Figure 3b, where CPE is a so called Constant Phase Element characterized by an impedance 1i .
The Davidson-Cole and the Havriliak-Negami response types While the Debye and the Cole-Cole distributions are symmetrical with re-spect to a central frequency or relaxation time, several models have been used to explain experimentally observed asymmetric dielectric relaxation responses. Of these the Davidson-Cole45, described by
i1)( s (6)
and the Havriliak-Negami46 described by

18
i1)( s (7)
are the most frequently encountered ones. Here is a constant between 0 and 1.
Generalized regular singular-points It is a well-known mathematical fact that power-type solutions are obtained from ordinary differential equations (ODEs) having so-called regular singu-lar-points. Moreover, the current response function, from which the dielec-tric permittivity may be determined by a straightforward transformation, is expected to fulfil a homogeneous first-order ODE in time.47 Exploiting these observations, general expressions for the dielectric permittivity may be de-rived. Whereas the transformation from the time to the frequency domain may be calculated analytically in the simplest case, numerical methods are needed in general, however. The generalized regular singular-points (GRSP) model was developed to account for dielectric spectra of the wide range of materials having a frequency response containing more than two power-law regions.
EquipmentTwo impedance spectroscopy instrumentations were used for the low-frequency measurements, i.e. for frequencies below ~ 106 Hz, conducted in this thesis; a Solartron 1260 with a Novocontrol BDC and a Novocontrol Alpha-AN High Performance Frequency Analyzer. A Novocool Quatro Cryosystem with an Agilent 4291B was used for the high-frequency meas-urements, i.e., for frequencies between ~ 106 and ~ 2*109 Hz.
Transient current measurements The sample/electrode configuration in transient current measurements is the same as that for impedance spectroscopy. Instead of a sinusoidal frequency dependent voltage, however, a constant voltage step is applied across the sample and the resulting current is measured as a function of time. Depend-ing on the initial charge distribution in the sample and the type of electrodes used, information about charge transport parameters such as diffusion coef-ficients and ion concentrations can be extracted following various proce-dures.48-50 In this thesis the only case considered is when the potential across the sample is changed from zero to a specified value, U, taking the sample from a uniform charge distribution to a polarized state.
Neglecting space-charge effects and assuming that the initial current de-cay is dominated by migration of ions toward an ion blocking contact, both

19
the number, n, of migrating ions per volume as well as their mobility, , can be obtained by fitting the measured current response, I, to49, 51
)tdUexp(
dUAnq)t(I
2. (8)
Here q is the charge of the migrating ions and t denotes the time elapsed after the applied potential step. Equation (8) ideally holds when there are only identical ions present in the investigated material. The equation is, however, easily adapted to the case when more than one type of ions is pre-sent in the sample simultaneously by just adding one additional term identi-cal to the one already at the right-hand-side of the equation per ion type.49
EquipmentThe transient current measurements were conducted by an HP 4156A Preci-sion Semiconductor Parameter Analyzer.
The sample cells and electrodes The electrodynamics experiments of the current work have been carried out in different measurement cells: The ex situ measurements used a sample cell with brass electrodes having a diameter of 10.0 mm. The heavy (907 gram) upper electrode induced a pressure of about 90 kPa on the material under investigation and was equipped with a Teflon guard. The electrodes and the material under investigation were situated in an enclosed, electrically screened, encasement containing a salt solution ensuring a constant relative humidity (RH) during the measurements. A detailed description of the exsitu sample cell can be found in Ref. 52.
The in situ experimental measurement cell In some of the impedance spectroscopy measurements performed in the cur-rent work the density of the investigated MCC was increased between con-secutive measurement series (Paper IV). In order to accomplish such re-cordings, a measurement cell was designed and constructed with the capacity of inducing a pressure up to ~2 MPa.
The measurements were performed by using a materials tester together with a dielectric spectroscopy instrument. The materials tester used was a Zwick Z100 (Zwick/Roell, Zwick GmbH & Co. KG, Germany) equipped with a 100 kN load cell. The Novocontrol Alpha-AN High Performance Frequency Analyzer and a ZG2 2-wire test interface (Novocontrol Tech-nologies GmbH & Co. KG, Hundsangen, Germany) constituted the dielectric instrument. A flat-faced stationary lower punch (diameter 18.89 mm) and a
20
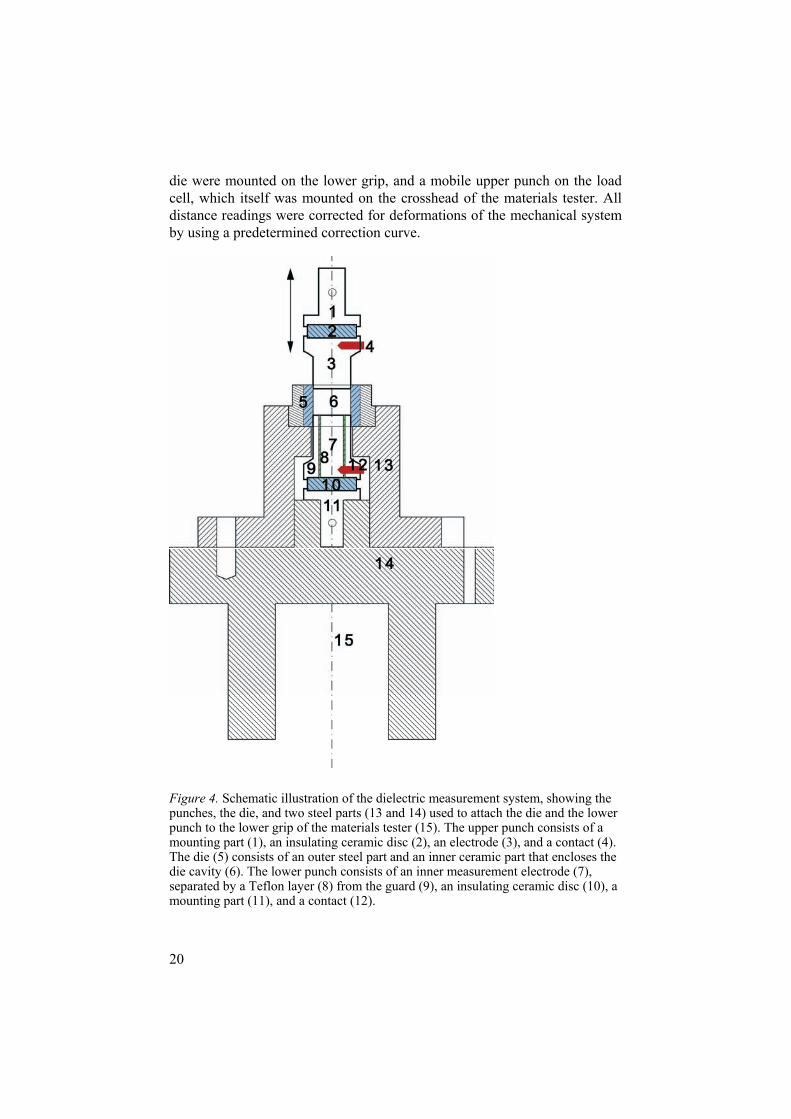
die were mounted on the lower grip, and a mobile upper punch on the load cell, which itself was mounted on the crosshead of the materials tester. All distance readings were corrected for deformations of the mechanical system by using a predetermined correction curve.
Figure 4. Schematic illustration of the dielectric measurement system, showing the punches, the die, and two steel parts (13 and 14) used to attach the die and the lower punch to the lower grip of the materials tester (15). The upper punch consists of a mounting part (1), an insulating ceramic disc (2), an electrode (3), and a contact (4). The die (5) consists of an outer steel part and an inner ceramic part that encloses the die cavity (6). The lower punch consists of an inner measurement electrode (7), separated by a Teflon layer (8) from the guard (9), an insulating ceramic disc (10), a mounting part (11), and a contact (12).

21
The punches and die were specially designed to allow accurate in situ dielec-tric spectroscopy measurements to be performed during compaction. The upper punch consisted of two stainless steel parts, one of which constituted the electrode, and the other the mounting part. These two parts were electri-cally insulated from each other by a ceramic disc (7.0 mm high and 26.5 mm in diameter) as shown in Figure 4. The ceramic disc was situated between the two parts and the distance in air was 3.0 mm. The lower punch was de-signed in a similar manner, but the electrode was separated into two different concentric parts by a 1 mm thick Teflon layer, to produce an inner measure-ment electrode and an outer guard. The purpose of the guard was to mini-mize edge effects by restricting the measurement to the central part of the electrode, where the electric field is more uniform. The guard was main-tained at the same potential as the measurement electrode, but was not part of the actual measurement system. The die consisted of an inner hollow insu-lating cylinder, made from the same ceramic material as the above men-tioned disc (height 22 mm, inner diameter 18.89 mm, outer diameter 25 mm), and an outer stainless steel part, as illustrated in Figure 4. The up-per face of the lower punch was located approximately 5 mm above the bot-tom of the die, thus leaving 17 mm for the powder material to be analyzed.
Gas Adsorption With gas adsorption techniques, the surface area of a material and the pore structure can be extracted from the number of molecules that are adsorbed in the structure by analysing the gas adsorption isotherm, i.e., the number of adsorbed molecules plotted vs. the relative gas-pressure when the recordings are made at constant temperature, T.
BETThe theory of adsorption of a single layer of molecules, from which the sur-face area of a material can be derived, was originally developed by Irving Langmuir and later extended by Brunauer, Emmet and Teller,53 commonly referred to as BET. They showed that the number, N, of adsorbed molecules for relative gas pressures, x, below ~ 0.3, can be expressed as
x)1c(1x1cxNN m , (9)
where mN is the number of molecules in one monolayer and c is a parameter that describes short-range interactions and is given by

22
kT/EEexpc ca . (10)
Here aE and cE are the heats of adsorption and condensation, respectively, and k is the Boltzmann constant.
BJHBy taking into account both multilayer gas adsorption and capillary conden-sation in cylindrical pores Barret, Joyner and Halenda,54 referred to as BJH, showed how the pore size distribution of a porous medium could be obtained from gas adsorption isotherms (or more correctly from desorption iso-therms).
The most commonly used gas for surface area and pore-size distribution studies is nitrogen, but also other non-polar gases like krypton and argon are frequently utilized.55
Equipment and measurement procedure The nitrogen adsorption isotherms of the current work were recorded with an Accelerated Surface Area and Porosimetry Analyzer (ASAP 2010, Micro-meritics, USA). In order to remove water and other sorbed molecules, the tablets were degassed for 8 hours at a pressure of 2.66*10-3 Pa at 343 K prior to the adsorption measurements. The nitrogen adsorption measure-ments where then performed at a temperature of 77 K. The tablet surface area and the pore size distribution were calculated using the ASAP 2010 software, implementing the BET and the BJH methods, respectively.
Fractal dimension determination from the capillary condensation regionThe interpretation of adsorption isotherms for materials with a fractal surface or bulk has been a controversial problem for more than two decades and several fractal dimension determination methods based on gas adsorp-tion/desorption exist.56-58 Analysis of the initial layer-by-layer adsorption may in some cases be favourable56 while for other situations, using the capil-lary condensation part of the isotherm may give the most adequate results.57
Fractal capillary condensation analysis of moisture adsorption/desorption isotherms has previously proven successful for obtaining information about the distribution of sites – both inside open pores and inside amorphous bulk regions – available to water molecules in various cellulose powder struc-tures.59 In the present work a similar analysis of nitrogen adsorption iso-therms is performed in order to acquire knowledge about the geometry of the open pore structure and about how it is affected by densification.
23
In the pressure interval where adsorption on the cellulose structure occurs due to condensation in pores of successively larger diameters, the relation between the radius, r, of the pores being filled at a certain relative pressure can be expressed as60
xlncm10*5664.9
xlnRTV2
r8
mol for nitrogen adsorption. (11)
Here is the surface tension of the liquid condensate (8.85*10-7 J/cm2 for nitrogen), molV is the molar volume (34.6 cm3 at 77 K for nitrogen), and R is the molar gas constant (8.314 J/mol K). At high surface coverage, when capillary condensation dominates the adsorption process, the interface be-tween the adsorber and the adsorbent is controlled by the liquid/gas surface tensions.55 At the lower end of the adsorption isotherm, representing the early stages of multilayer buildup, the material/gas interface is controlled by attractive van der Waals forces between the gas and the solid material.55
The isotherm equation
Sm )x/1ln(N/N , (12)
has been shown to describe adsorption in both the multilayer55, 58 and the capillary condensation55, 57 regime. The exponent S equals (D-3) when liq-uid-gas interactions dominate the adsorption process, i.e., in the capillary condensation regime.55 Here D is the fractal dimension of the accessible surface of the investigated material. If, on the other hand, surface tension forces are negligible and instead the interactions at the interface are domi-nated by the van der Waals forces between the solid adsorber and the gas adsorbent, i.e., in the multilayer adsorption region, the exponent is (D-3)/3.55,
58 For S values between –1 and 0 the dominant force can be roughly esti-mated from the equation55
2)S1(3 (13)
If < 0, the liquid-gas surface tension forces are dominant and S+3 can be taken as a good estimate of the fractal surface dimension of the adsorber material. If instead > 0, van der Waals forces dominate and 3(1+S) is con-sidered a reliable value of the fractal dimension.

24
Scanning Electron Microscopy With a Scanning Electron Microscope the outer surface of a material can be depicted. The surface of the sample is scanned with electrons, and the re-flected and/or emitted electrons are detected. The technique was described in the 1930s after de Broglie proved that electrons could be used as information transmitters in the same way as photons in an ordinary optical microscope. Since electrons have a much shorter wavelength than photons, the depicted object can be much smaller. The scanning electron micrographs were re-corded on a LEO 1550. The investigated tablets were prepared by sputtering of a thin layer of gold-palladium (90-10%) onto their outer surface to reduce charging of the surface.
Materials The as-delivered MCC powder (Avicel PH 101, FMC, Ireland) studied in the current work has a particle size of about 50 m.29 According to unpublished measurements comparing the conductivities in water baths containing tablets consisting of pure MCC and MCC tablets containing known concentrations of NaCl, the MCC grade used in the present study contains impurity ions giving rise to a conductivity corresponding to 0.7 wt % of NaCl being incor-porated in the MCC. Transformed into numbers of Na+ or H+ ions, which are possible charge carriers in cellulose, this conductivity corresponds to 1 im-purity ion per 41 or 284 cellulose monomer units, respectively (the weight of a unit being 162 g/mol). In the above estimation of impurity concentration, the density of H+ comes out lower because of its higher mobility in water as compared to Na+.

25
Results and discussion
In this chapter the most important results of the appended papers are summa-rized and discussed.
In Figure 5 the permittivity spectrum over 13 orders of magnitude in fre-quency for an MCC tablet compacted at ~ 50 MPa and equilibrated at 37% RH is shown. Three frequency regions of particular interest are pointed at by arrows.
Figure 5. Impedance spectra of the real ( ' ) and imaginary ( '' ) part of the permit-tivity of an MCC tablet made at a compaction pressure of ~50 MPa. The permittivity is recorded with a high- and low-frequency equipment and the spectra are joined at 106 Hz. Three different processes are indicated by arrows.

26
Generalized regular singular-points Before performing a detailed analysis of the above mentioned frequency regions, the results from the generalized regular singular-points method will be presented. As is evident from the curve fit shown in Paper V to the di-electric data in Figure 5, the GRSP analysis is able to describe the permittiv-ity spectrum well. The parameters extracted from the analysis with the GRSP model are tk and k (n = 1, 2 ..., 6).
The parameters tk are the crossover times from one power-law region to the next and ( k 1) are the power-law exponents in the current response function. The corresponding exponents seen in the permittivity and conduc-tivity spectra are k 1 and k, respectively. The value of the low frequency parameter, 6, indicates low-frequency dispersion (since 0< 6<1) or quasi-dc conduction (since 6 . The spectrum could be described without intro-ducing the DC conductivity or the high frequency permittivity.
Dielectric relaxations
The high-frequency relaxation The high-frequency relaxation process, referred to as , is also present in other polysaccharides and can be related to the segmental motion of the polymer chain.61-63 The motion has proven to be only weakly influenced by the particular substructure of this chain.64 The relaxation intensity decreases with increasing crystallinity and the intensity of the peak for cellulose sam-ples having a crystallinity similar to that of MCC has been found to increase with increasing humidity.64 The background to this humidity dependence probably lies partly in the fact that bound water, by increasing the total dipo-lar moment of the mobile polymer unit, increases the polarizability of the polymer chain, and also partly in the fact that water penetrating amorphous regions of the cellulose causes swelling65 and thus a reduction of the spatial hindrance, something which results in an increased mobility of the chain segments.
The low-frequency wet relaxation The other relaxation process, denoted wet in Figure 5, has been observed earlier in MCC tablets29 and in cellulose powders64, 66, 67 and is related to the presence of water in the material. The specific molecular origin of this proc-ess is, up to now, not totally clear. However, it has been proposed that this relaxation is related to the collective motions of a water-cellulose mixed phase.64

27
Cole-Cole parameters The peaks of both the wet and the process were found to be very symmet-ric in the log-frequency representation, and both processes were thus ana-lysed by the Cole-Cole equation (Eq. 5). The result of the Cole-Cole analysis showed that no significant variation with compaction pressure was found in
s for the wet relaxation process. was more or less constant and ~ 70. The lack of variation with compaction pressure is in agreement with the result that moisture sorption isotherms of powdered MCC are iden-tical to isotherms taken on compacted tablets (Paper III) and, thus, that the amount of water incorporated in the cellulose at a specific RH is independent of compaction pressure.
Figure 6 shows for the process as a function of the pressure used to form the cellulose compact. The figure also shows that the variation in the data points is less than ~ 6 %.
2
3
4
5
6
50 100 150 200 250 300 350 400 450
proc
ess
Compaction pressure (MPa)Figure 6. Cole-Cole parameter for the process in MCC tablets as a function of tablet compaction pressure. The lines are drawn as guides for the eye.
A similar behaviour to that in Figure 6 has been found for the amplitude of the relaxation process in cellulose acetate.68 The initial increase in amplitude followed by a plateau was then attributed to pressure inducing a greater de-gree of disorder in the fibrillar structure at low compaction pressures and,
28
hence, increasing the total amount of amorphous regions. Also Einfeldt et al.64 found that pressing of un-dried cellulose increases the intensity of the dielectric response.
The Cole-Cole parameters and were found to be independent of com-paction pressure for both the wet- and the relaxation process. The values were ~ 0.75 and 0.35, respectively, for these processes while was obtained as ~ 0.30 and 1.0*10-8 s, respectively. The values correspond very well to what has been observed earlier for celluloses containing a similar amount of moisture as our samples at room temperature for the wet process and at –60 °C for the process.66 For the wet process, has earlier66 been found to be ~ 1.0 s for compacted cellulose powders containing similar amounts of mois-ture as our samples at room temperature, which is slightly larger than the value we found. For the process, has been obtained for dry and wet cellu-lose in the temperature range between 0 and –120 °C along with activation energies for this process.66 From these data we can estimate the room tem-perature to lie between 6*10-9 (6 wt % moisture content) and 3*10-8 s (< 0.2 wt % moisture content). From this we can draw the conclusion that the earlier published activation energies for the low-temperature range also de-scribes the process at room temperature.
DC conduction At low frequencies both the real and the imaginary part of the permittivity increases with decreasing frequency according to a power-law behaviour42
with an exponent close to unity. This behavior is characteristic for dc-like imperfect charge transport.69 The magnitude of the conductivity of this charge transport process can be extracted by a procedure outlined in Ref. 51 and Paper II.
Figure 7 displays the MCC dc conductivity values, dc , obtained for MCC from impedance spectroscopy and from applying Eq. (8) with
nqdc to transient current measurements recorded for different MCC moisture contents. The detailed information about the experimental method behind the separate data points can be found in Paper II. Included in the figure are curve fits to the above presented power-law and exponential mod-els, respectively. From these fits alone it is not possible to exclude either of the models as being unrepresentative of the data. In Paper II, however, we argue in favour of the power-law model by suggesting that the physical basis for this model may be that the extent of the 6-OH sites – to which the water molecules are attached – as well as the distance between them are such that a tunnelling transport mechanism may explain the large power-law exponent. The large exponent could alternatively, or additionally, be described by the strong anisotropy of the cellulose fibers.

29
Figure 7. Ionic conductivity in MCC vs. moisture content. Included in the figure are a power-law and an exponential fit to the data. The corresponding equations are also displayed. For the power-law fit the data point at zero moisture content was ex-cluded.
Charge carrier density From the transient current measurements presented in Paper II, not only
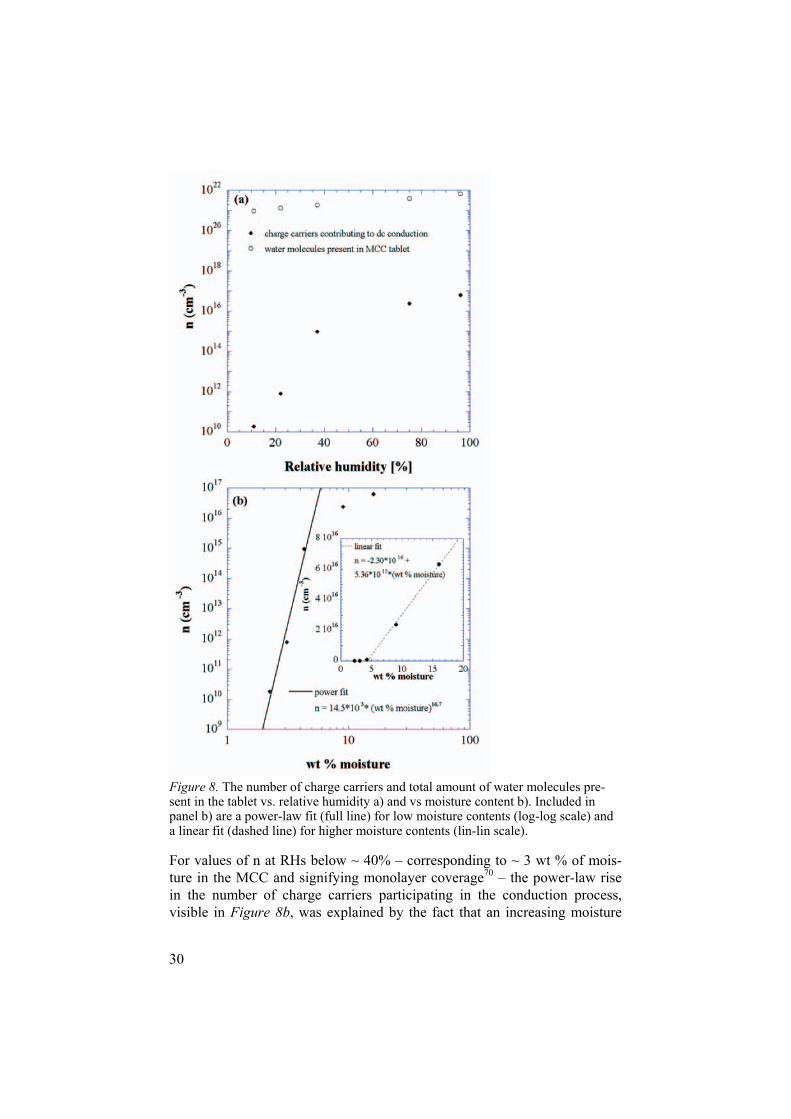
dc but also the charge carrier density was extracted by employing Eq. (8). Figure 8a shows n as a function of RH. Included in this figure panel is also the water adsorption isotherms for MCC powders70 expressed as the number of water molecules present at the various RH values. From this panel we observe that the initial rapid increase in number of charge carriers seem to level off at high moisture contents. We also observe that the number of charge carriers is between 1011 and 105 orders of magnitude lower than the number of water molecules present in the tablet, the difference decreasing with increasing RH.
30
Figure 8. The number of charge carriers and total amount of water molecules pre-sent in the tablet vs. relative humidity a) and vs moisture content b). Included in panel b) are a power-law fit (full line) for low moisture contents (log-log scale) and a linear fit (dashed line) for higher moisture contents (lin-lin scale).
For values of n at RHs below ~ 40% – corresponding to ~ 3 wt % of mois-ture in the MCC and signifying monolayer coverage70 – the power-law rise in the number of charge carriers participating in the conduction process, visible in Figure 8b, was explained by the fact that an increasing moisture

31
content increases the number of connected conduction paths on which the charge carriers can move through the entire sample (Paper II). Above monolayer coverage, all the conduction paths are connected and a transition from the power-law increase to a linear effective medium theory increase is to be expected.22
The effect of pore structure on dc conduction In this section the influence of the pore structure on the dc-like imperfect charge transport is presented. Five different batches of compacted MCC powder form the basis of the analysis. The compaction data of the different batches are summarized in Table 1.
Table 1. Compaction data of MCC tablets Tablet batch Compaction pressure [MPa] Tablet density [g/cm3]
1 57.7 0.5 1.01
2 150.3 2.5 1.15
3 206.5 1.4 1.25
4 249.8 2.1 1.31
5 404.0 1.8 1.39
The values are given as average value over 4 measurements standard deviation.
Fractal dimension Figure 9 shows the nitrogen adsorption isotherms for the five different tablet batches under study plotted vs. the logarithm of the inverse partial nitrogen pressure on a log-log scale. As is obvious from the figure, the higher tablet density the less nitrogen is adsorbed. Included in the figure are also fits to Eq. (12) in order to allow for an extraction of the fractal dimension of the tablet surface, available to nitrogen molecules, of the different tablet batches. From the figure it can be seen that the onset of the region where this equa-tion is applicable (the region were the curves appear linear) is shifted to-wards higher relative pressures with increasing tablet density. It can also be seen that the exponents S in Eq. (12) lie in the -0.52 to -0.70 interval which, according to Eq. (13), indicates that the dominant interface forces can be attributed to the surface tension between the gas and the adsorbed liquid phase. The fractal dimension can, thus, be estimated as S+3, and the ob-served shift in the onset of condensation from ln(1/x) 0.47 for Tablets 1 to

32
ln(1/x) 0.20 for Tablets 5 should be a consequence of a decrease in the total volume of pores with radii in the 2.0 – 4.8 nm region, according to Eq. (11), as the tablet density increases.
10-2
10-1
1
10
10-3 10-2 10-1 1 10
Tablet 1Tablet 2Tablet 3Tablet 4Tablet 5
0.26 [cm3/g STP] * ln(1/x)^(-0.52)0.21 [cm3/g STP] * ln(1/x)^(-0.52)0.16 [cm3/g STP] * ln(1/x)^(-0.56)0.13 [cm3/g STP] * ln(1/x)^(-0.61) 0.057 [cm3/g STP] * ln(1/x)^(-0.70)
Vol
ume
Ads
orbe
d [c
m3 /g
ST
P]
ln(1/x)Figure 9. Nitrogen adsorption isotherms on five different batches of MCC of vary-ing density vs. the logarithm of the inverse partial nitrogen pressure on a log-log scale. Curve fits of Eq. (12) are included as solid lines and the corresponding equa-tions are displayed.
Figure 10, displaying the extracted values of the fractal dimension D, shows that it remains rather constant and 2.48 for the lowest tablet densities and starts to decrease at densities above 1.2 g/cm3 to reach a value of 2.30 for the 1.39 g/cm3 tablets. By employing Eq. (12) to the nitrogen adsorption isotherms presented in Strømme et al.71 for uncompacted MCC (Avicel PH102) powder, the fractal dimension is also obtained as 2.48, supporting the observation that D remains unaffected by the compaction process at low compaction pressures. The length scales probed by the present analysis is, according to Eq. (11) and the extent of the linear curve regions in Figure 9,from 2.0 – 4.8 nm to 50–100 nm.

33
Figure 10. Fractal dimension D, extracted from the analysis in Figure 9, together with the ionic conductivity obtained from impedance spectroscopy performed at 37 % RH. The presented D values represent averages over 3 measurements and the variation in each data point is less than 8%, while the presented conductivity values are averages over ~ 5 measurements and the variation in each data point is less than 25 %.
The fractal dimension being nearly density-independent at low tablet densi-ties, indicates that compaction pressures below 200 MPa has little effect on the nanoscale roughness of the nitrogen accessible open pore surfaces in the MCC. At pressures above 200 MPa, however, structures smaller than 100 nm becomes smoother.
Included in Figure 10 are also the ionic conductivities obtained from im-pedance spectroscopy measurements performed at a RH of 37% representing monolayer coverage humidity. From the figure it can be observed that a drop off in conductivity takes place at the same tablet density for which the fractal dimension starts to decrease.
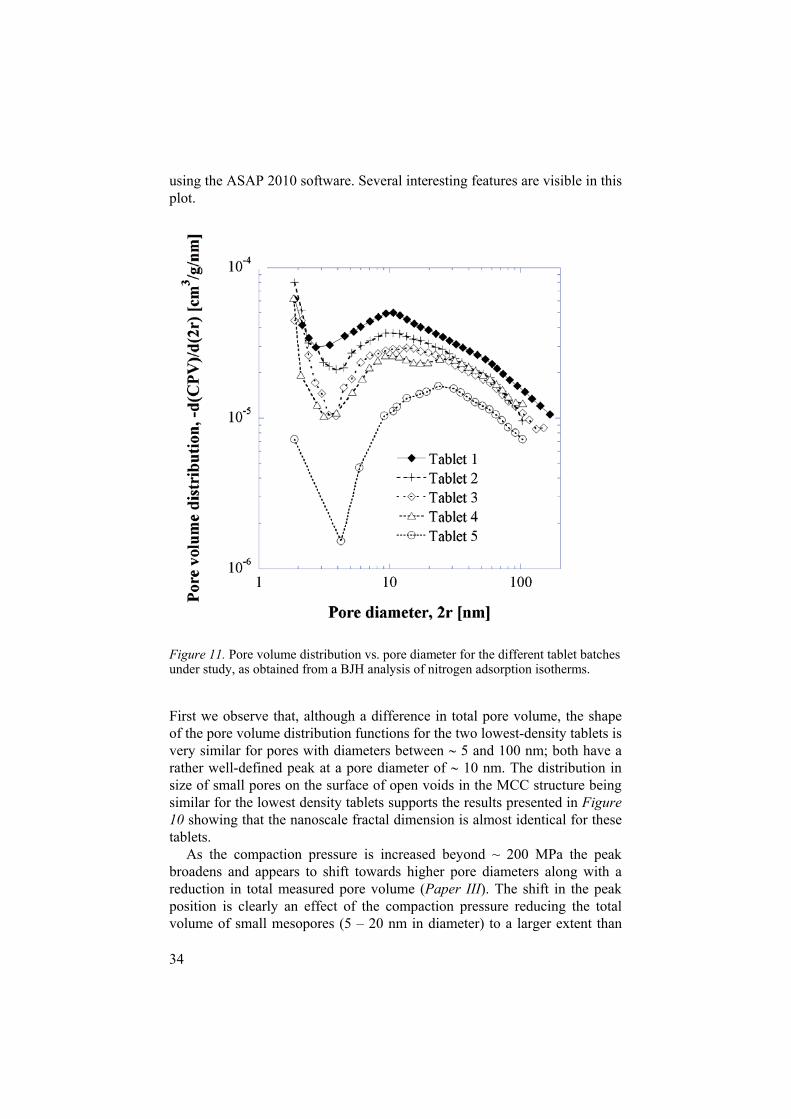
Pore volume and surface area The pore volume distributions of the various tablets, in terms of the negative derivative of the cumulative pore volume (CPV) with respect to pore diame-ter, are displayed in Figure 11, as obtained from a BJH analysis performed
34
using the ASAP 2010 software. Several interesting features are visible in this plot.
Figure 11. Pore volume distribution vs. pore diameter for the different tablet batches under study, as obtained from a BJH analysis of nitrogen adsorption isotherms.
First we observe that, although a difference in total pore volume, the shape of the pore volume distribution functions for the two lowest-density tablets is very similar for pores with diameters between 5 and 100 nm; both have a rather well-defined peak at a pore diameter of 10 nm. The distribution in size of small pores on the surface of open voids in the MCC structure being similar for the lowest density tablets supports the results presented in Figure 10 showing that the nanoscale fractal dimension is almost identical for these tablets.
As the compaction pressure is increased beyond ~ 200 MPa the peak broadens and appears to shift towards higher pore diameters along with a reduction in total measured pore volume (Paper III). The shift in the peak position is clearly an effect of the compaction pressure reducing the total volume of small mesopores (5 – 20 nm in diameter) to a larger extent than

35
the macropore (above 50 nm in diameter) volume. Paper III presents addi-tional figures showing that the small mesopores are rapidly extinguished as the tablet density increases above 1.3 g/cm3.
Figure 12. Surface area and total cumulative pore volume extracted from a BET and BJH analysis, respectively, of nitrogen adsorption isotherms are shown vs. tablet density. The values are averages over 3 measurements and the variation in each data point is less than 3 and 5 %, respectively.
Figure 12 shows the surface area available to nitrogen molecules vs. tablet density as obtained by a BET analysis of the adsorption isotherms at relative pressures below 0.3. The total CPV is also displayed in this figure. In con-trast to the fractal dimension and the conductivity, the total surface area and pore volume accessible to nitrogen molecules decrease smoothly with in-creasing density over the entire density interval under study, showing that the overall amount of open surfaces steadily diminishes as the compaction pressure increases.
Conductivity percolation From Figure 10 it is obvious that as the density of the MCC compact is re-duced below a value of ~ 1.2 g/cm3 the conductivity rapidly increases. In Paper III we showed that the conductivity at high density and 37 % RH, producing monolayer coverage of water molecules in the MCC structure,

36
followed a percolation type behavior with an exponent of 2 signifying charge transport in a 3D porous network, cf. Eq. (1). Relating this result to the pore structure data of Figure 11 and SEM micrographs of the different tablet batches, it was shown that the mesopore network plays a dominant role in the water induced charge transport of compacted MCC (Paper III). Decreas-ing the tablet density below ~1.2 g/cm3 results in a significant increase of pores with a diameter between ~ 5 and 20 nm. When the network of pores with a diameter in this interval is reduced to the point where it no longer forms a continuous passageway throughout the compact, the conduction process is likely dominated by the transport in amorphous regions of the cellulose bulk, i.e., on the surfaces of individual microfibrils mainly situated in the bulk of the fibril aggregates. The conductivity of this process is of the order of 1*10-12 S/cm at 37 % RH, cf. Figure 10. Sufficiently above the per-colation threshold where a continuous mesopore network is formed, the con-ductivity increases to a ~ 200 % higher value and the dependence of the con-ductivity on porosity levels out.
The above analysis pertains to high-density MCC tablets. In order to en-able the study of the conduction process in MCC of densities below and around which a coherent tablet network is formed, the in situ experimental measurement cell described in Figure 4 was developed (Paper IV).
Figure 13. Selected conductivity values, dc , obtained for 5 different RHs during MCC powder densification. The initial parts of the conductivity vs. density curves are fitted to Eq. (1) and shown as solid lines. The equations describing the fits are also displayed.
37
Figure 13 shows five sets of conductivity values, pertaining to different RHs, extracted from the dc-like imperfect charge transport region of permit-tivity spectra similar to those in Figure 5 using the method outlined in Ref. 51 and in Paper II. The conductivity clearly increases with increasing den-sity until a levelling-out is observed for densities above ~ 0.7 g/cm3. In-cluded in the figure are also fits to Eq. (1) for the initial part of the densifica-tion process with the density (as opposed to the porosity) as the conducting phase variable, showing that conductivity percolation occurs also on the low-density side of the dc -vs.-density curve for MCC.
The finding that the conductivity, associated with water-induced ionic charge transport in MCC, clearly shows percolation behaviour at low densi-ties can only be explained by the successive creation of conductivity path-ways as densification proceeds (Paper IV). For MCC, which consolidates mainly by plastic deformation, compaction may be described in terms of three dominant processes: Particle rearrangement, plastic deformation of particles, and formation of interparticulate bonds.72 Moreover, powder com-paction is often considered to occur in sequential stages, where each stage is represented by the mechanism that dominates or controls the process in that stage. It has been suggested that a stage dominated by particle rearrangement and fragmentation is followed by a stage dominated by elastic/plastic parti-cle deformation,73 while interparticulate bonds are being formed throughout the entire compaction process. The onset of the water-induced ionic transport in MCC, characterized by Eq. (1), most likely coincides with the forming of the interparticulate bonds since a measurable ionic transport requires a con-tinuous pathway for the ions to move also in-between particles.
These results add to the complete understanding of the density dependent water-induced ionic transport in cellulose showing that – at a given moisture content – there are two major parameters determining the magnitude of the conductivity: The connectedness of the interparticluate bonds (Paper IV) and the connectedness of pores with a diameter in the 5-20 nm size range (PaperIII). At densities between ~ 0.7 and 1.2 g/cm3 both the bond- and the pore networks have percolated, paving the way for a facilitated charge transport through the MCC compact.
From fits similar to those in Figure 13, the density percolation threshold c could be extracted. These threshold values are shown as a function of
RH in Figure 14. It is evident that the percolation threshold decreases with increasing RH for RH values below ~ 50 %. At the highest RH of this study, 60 %, an increase in c is detected.

38
0
0.1
0.2
0.3
0.4
0.5
0 20 40 60 80 100Den
sity
per
cola
tion
thre
shol
d,
c [g/
cm3 ]
Relative Humidity [%]Figure 14. Density percolation threshold c – extracted from fits similar to those in Figure 13 and associated with water-induced ionic transport in MCC – vs. MCC equilibration RH. The error bars signify standard deviations for three measurements.
The lowering of the density percolation threshold with increasing RH, ob-served in Figure 14 at RHs below ~ 50 %, may be explained by a combina-tion of two factors; an increased plastic deformation propensity and a de-creased tendency for particle rearrangement. Earlier experience shows that the presence of 5 wt % water may reduce the yield pressure determined from a Heckel analysis by as much as 25 % compared to the dry state.74 Moreover,it appears to be a general consensus that water reduces the flowability of MCC powder, as indicated for instance by shear cell experiments.75 Hence,with increasing moisture contents in the powder, a jammed state76 is reached and interparticulate bonds with comparatively large bonding surfaces are formed earlier in the compaction process, thus promoting the formation of a bond-percolation cluster that spans through the entire powder bed at succes-sively lower densities with increasing moisture contents.
Presently we have no solid explanation for the observed increase in the percolation threshold value observed at 60% RH, corresponding to a cellu-lose moisture content of ~ 6 wt % (Paper II). However, it is remarkable that this increase coincides with the moisture content interval for which a bulk water phase in the cellulose starts to form, cf. Figure 2c.22 At these high moisture contents capillary condensation, instead of multilayer adsorption,

39
starts to dominate the water adsorption process in the material.59 As well, the behaviour of the ionic conduction has been shown to change nature, most likely due to swelling in the cellulose fiber structure.24

40
Summary and conclusion
MCC is the most frequently used excipient for direct compaction of tablets within the pharmaceutical industry. When cellulose is used for hosting and delivering drugs to the human body its interactions with water becomes of uttermost importance. Upon contact with water, polar drug molecules ionize and get surrounded by a hydration shell consisting purely of water mole-cules. When MCC absorbs water in the gastrointestinal tract, water mole-cules will surround the incorporated drug during the entire drug release process. It has earlier been indicated that the interactions between the free hydroxyl groups of the cellulose with the water molecules in the hydration shell regulate the speed by which the drug ions are able to leave the cellulose particles. These interactions, and the charge transport properties of the con-stituent ions of water in cellulose, are therefore important to analyze and understand in order to identify how the cellulose nanostructure should be modified to tailor the drug release process.
In this thesis an analysis of the water-induced charge transport in MCC and the physical parameters affecting this transport have been presented. Dielectric relaxation processes pertaining to other processes than the above mentioned have also been assessed and analysed, and a generalized regular singular-point model has been shown to be able to satisfactorily describe all features of the dielectric spectrum.
The magnitude of the water-induced conductivity, appearing as a dc-like imperfect ionic hopping process in the low-frequency part of the MCC per-mittivity spectrum, has been shown to strongly depend on the MCC moisture content. In fact, the dc conductivity increases by almost 8 orders in magni-tude as the MCC moisture content is raised from 0 to 16 wt%.
It has been shown that the ionic charge transport mechanism in humid MCC most likely is governed by two parallel processes; one involving water constituent ions diffusing between adjacent lowest energy sites in disordered regions of the cellulose and the other caused by impurity ions, such as Na+,and protons or H3O+ ions jumping between neighboring cellulose OH-
groups to which a primary water molecule is attached. At relative humidities of ~ 37 % (representing monolayer coverage of water on available sites in the cellulose) and higher, the latter process is totally dominating the charge transport. This is also the process that has been in focus by cellulose re-searchers during the last half-century and that has been analyzed by both power-law and exponential models. The current work gives some support in
41
favor of the power-law model in which the high-exponent increase in con-ductivity with moisture content is argued to have the physical basis in the extent of the 6-OH sites as well as in the distance between them: The large power-law exponent may be explained by a tunnelling transport mechanism and/or by the strong anisotropy of the cellulose fibers.
It has further been shown that the fractal dimension of pore surfaces at a length scale below 100 nm is density independent and 2.48 for MCC tablet densities below 1.2 g/cm3 and decreases to reach a value of 2.30 for 1.39 g/cm3 density tablets. The density region in which the fractal pore sur-face dimension decreases coincides with the region where the total volume of small mesopores (5 – 20 nm in diameter) and the dc conductivity noticea-bly diminish. An analysis of this phenomenon as well as of the behavior of the dc conductivity at low densities leads to the following conclusion:
After an unbroken bond-percolation cluster – extending through the entire MCC compact – has been formed, the conductivity continues to increase until a levelling-out is detected for densities above ~ 0.7 g/cm3. The plateaux in the conductivity continues until a decrease, caused by the disappearance of a continuous network of mesopores, sets in at densities above ~ 1.2 g/cm3.Concludingly, at a given moisture content, there are two parameters deter-mining the magnitude of the water-induced ionic conductivity in MCC; the connectedness of the interparticulate bonds and the connectedness of pores with a diameter in the 5-20 nm size range. At densities between ~ 0.7 and 1.2 g/cm3 both the bond- and the pore networks have percolated paving the way for a facilitated charge transport through the MCC compact.
The above presented findings emphasize the importance of analysing and being able to control the mesopore structure of a pharmaceutical cellulose-based system in order to tailor the drug transport properties related to cellu-lose-water interactions. The results presented in this thesis should also be significant to other fields where cellulose-water interactions are of key issue, such as for paper and sanitary product research and for food industries using cellulose-based gels.

42
Summary of appended papers
Paper I Water-induced charge transport in tablets of microcrystalline cellu-lose of varying density: Dielectric spectroscopy and transient current meas-urements. M. Nilsson, G. Alderborn and M. Strømme. Chem. Phys. 295(2003) 159-165.
Room temperature dielectric frequency response data taken over 13 decades in frequency on MCC tablets of density above ~ 1 g/cm3 are presented. The frequency response shows on three different processes. The first one is a high frequency (~ 108 Hz) relaxation process ( process) whose magnitude increases and reaches a plateau as the tablet density increases. This process is associated with orientational motions of local chain segments via glycosi-dic bonds. The second relaxation process ( wet process), related to the pres-ence of water in the MCC matrix and located at frequencies around 1 Hz, is insensitive to changes in tablet density. At lower frequencies, dc-like imper-fect charge transport was found to dominate the dielectric spectrum. The dc conductivity decreases with increasing tablet density and increase with in-creasing humidity.
Transient current measurements indicated that two different ionic species – possibly the constituent ions of water – lied behind the observed conduc-tivity. The diffusion coefficient of the ions were found to be of the order of 10-9 cm2/s, which is the same as for small salt building ions (Na+ and Cl-) in MCC. This finding suggests that ionic drugs leaving a tablet matrix diffuse in the same manner as the constituent ions of water and, thus, elucidates the necessity to understand the water transport properties of excipient materials to be able to tailor the drug release process from pharmaceutical tablets.
Paper II Electrodynamic investigations of conduction processes in humid microcrystalline cellulose tablets. M. Nilsson and M. Strømme. J. Phys. Chem. B 109 (2005) 5450-5455.
The conduction mechanism in MCC tablets having a density of ~ 1.3 g/cm3
was investigated using low frequency dielectric spectroscopy and transient current analysis at room temperature and at varying RH. The behaviour of the charge carrier concentration indicated that the conduction process, by

43
H3O+ and/or impurity cations, may take place on a percolating network of water molecules adsorbed to 6-OH units on the cellulose chain. The extent of these sites as well as the distance between them are such that a tunnelling transport mechanism may be needed in order to explain the large power-law exponent describing the conduction process at low moisture contents. The large exponent could alternatively, or additionally, be described by the strong anisotropy of the cellulose fibres.
The average carrier mobility was shown to vary with cellulose moisture content and the variation indicated that the sites available for transport of at least some of the charge carrying ions are progressively being blocked as the moisture content increases up to the value signifying monolayer coverage. Below monolayer coverage, when a water molecule is sitting at the end of a conduction path that is not spanning through the whole sample, a H3O+ ion is created when a proton ends it journey at that water molecule. The most fa-vourable way to continue the conduction process from this point, may be for the H3O+ ion to move to the adjacent available 6-OH group. The more water molecules that are adsorbed, the less probable is this process because of the increasing occupancy of the 6-OH sites, something which leads to the ob-served decrease in the average carrier mobility. Above monolayer coverage, all available 6-OH groups are occupied and connected paths of H2O mole-cules span through the entire sample. The observed increase in average mo-bility with increasing moisture content probably has its explanation in the structural changes that takes place at high humidities.
Paper III Mesopore structure of microcrystalline cellulose tablets charac-terized by nitrogen adsorption and SEM: The influence on water-induced ionic conduction. M. Nilsson, S. Valizadeh and M. Strømme. Submitted to J.Phys. Chem. B.
Nitrogen and water adsorption isotherms as well as SEM micrographs of MCC formed at different compaction pressures were analysed to obtain in-formation about tablet pore structure, surface area and fractal dimension of internal pore surfaces. The results of this analysis were compared to the ionic charge transport properties of the cellulose tablets.
The fractal analysis of nitrogen adsorption isotherms showed that the dominant interface forces during adsorption could be attributed to the sur-face tension between the gas and the adsorbed liquid phase. The fractal di-mension, characterizing the pore surfaces of the tablets in the length scale region from 2.0–4.8 nm to 50–100 nm, was shown to decrease from a constant value of 2.5 for tablets of densities lower than 1.2 g/cm3 to 2.3 for tablets with a density of 1.4 g/cm3. This decrease of surface fractal-lity coincided with a rapid reduction of mesopore volume and a decrease in the water induced ionic conductivity.

44
The ionic conductivity at 37 % RH, previously indicated to be governed by impurity ions and/or protons jumping between neighbouring water mole-cules bound to OH- groups on the amorphous microfibril surfaces, was ana-lyzed in terms of a percolation model. The porosity percolation threshold for the conduction was shown to be ~ 0.1. However, it is not until the porosity reaches a value of ~0.25 (density ~1.2 g/cm3) that the conduction on open mesopore surfaces starts to dominate over the conduction process tak-ing place within the amorphous bulk. Deduced from the size of the cellulose fibril aggregates visible in SEM micrographs, these surfaces constitute ~ 36% of the total amount of microfibril surfaces available for water-induced ionic transport.
Paper IV Conductivity percolation in loosely compacted microcrystalline cellulose: An in situ study by dielectric spectroscopy during densification. M. Nilsson, G. Frenning, J. Gråsjö, G. Alderborn and M. Strømme. In manu-script.
The behaviour of water-induced charge transport in loosely compacted MCC powder was investigated as a function of density, for densities below ~ 1 g/cm3, employing a new type of measurement set-up, allowing for dielectric spectroscopy measurement in situ during compaction. The set-up was char-acterized dielectrically and verified to give reliable results for the dielectric response of the material tested as long as the thickness of the powder bed was below ~ 3 mm.
The ionic conductivity in MCC was found to increase with increasing density until a levelling-out was observed for densities above ~ 0.7 g/cm3.Further, it was found that the conductivity vs. density followed a percolation type behaviour with a percolation exponent of 2 and a density percolation threshold between ~ 0.2 and 0.4 g/cm3 depending strongly on the cellulose moisture content. The observed percolation behaviour was attributed to the forming of interparticulate bonds in the MCC powder bed whereas the per-colation threshold dependence on moisture was linked to the moisture de-pendence of particle rearrangement and plastic deformation in the MCC compaction process.
The presented results add to the complete understanding of the density dependent water-induced ionic transport in cellulose showing that at a given moisture content there are two major parameters determining the magnitude of the conductivity: The connectedness of the interparticulate bonds and, as earlier put forward (Paper III), the connectedness of pores with a diameter in the 5-20 nm size range. At densities between ~ 0.7 and 1.2 g/cm3 both the bond- and the pore networks have percolated, paving the way for a facili-tated charge transport through the MCC compact.

45
Paper V Generalized regular singular-point description of low-frequency dielectric responses. G. Frenning, M. Nilsson and M. Strømme. Phys. Rev. B70 (2004) 012506:1-4.
A generalized regular singular-point (GRSP) model developed to account for dielectric spectra of the wide range of materials having a frequency response containing more than two power-law regions is presented. In fact, the model is valid for an unlimited number of such regions, and is shown to provide a good description of the entire dielectric spectrum of tablets made of MCC, including two relaxation peaks and power-law responses at low and high frequencies. This finding puts the GRSP model in a unique position, since no model existing in the literature is able to describe the totality of features present in the spectrum, without resorting to a superposition of more elemen-tary responses.
46
Acknowledgements
This work has been carried out at the Department of Engineering Sciences (division of Solid State Physics (SSP) and later on, my supervisor started the division of Nanotechnology and Functional Materials (NFM)) and the De-partment of Pharmacy, at Uppsala University. Therefore all the persons at the three divisions are most gratefully acknowledged.
I wish to express my sincere gratitude to:
My supervisors; Professor Maria Strømme, for hiring me and giving me supervision and inspiration; and co-supervisor Professor Göran Alderborn, for letting me be part of his research group at department of Pharmacy, and both of you for creating such a nice atmosphere in your groups. All former and present members of the research groups at SSP, NFM and Pharmacy. Here I especially would like to mention Göran Frenning, Ken Welch, Ulrika Brohede, Albert Mihranyan, Josefina Hellström and Frauke Fichtner.My other co-authors Johan Gråsjö and Sima Valizadeh; and co-workers Ralph Scheicher and Rajeev Ahuja for making the calculations on cellulose possible.The seniors who shared their knowledge and wisdom with me, among others I would like to mention Gunnar Niklasson, Peter Heszler, Ragnar Ek and Andris Azens. Those who have helped me with measurements in one way or another: Jör-gen Westlinder, formerly at Solid State Electronics; Jan Swenson and Helén Jansson at the department of Applied Physics at Chalmers University of Technology. Those who always make sure that the equipment works: Shuxi Zhao and Bengt Götesson at SSP; Elisabeth Börjesson and Leif Dahlberg at Dept. of Pharmacy. All those who have contributed to discussions over lunch and coffee (here I would like to mention Anna Werner, Eva Wäckelgård, C-G Ribbing, Arne Roos, Magdalena Lundh, Mari-Louise Persson and Herman Högström). Fredric Kristiansson and Göran Frenning, for your responses to all my ques-tions.

47
Lars Hammerström and Ernesto Coronel, for being such a good support dur-ing the writing of this thesis. To one of my oldest friends, Ulrik Beste, for all interesting endless discus-sions.To all my friends and family for just being there. Tack till mormor Berta! Det största tacket riktas slutligen till mina föräldrar Ella och Leif samt min syster Helena.
_____________________________
Martin Nilsson, Uppsala 2006-04-02

48
Summary in Swedish
Vatteninducerad laddningstransport i mikrokristallin cellulosa. Cellulosa är en mycket vanligt förekommande naturlig polymer och den årliga tillväxten är uppskattningsvis mellan 1011 och 1012 ton. Cellulosa är den största beståndsdelen i växters cellväggar och ger mekanisk styrka till växten. Intressant att notera är att cellulosa även finns i vissa bakterier, svampar, alger och vattenlevande organismer. Cellulosa består av kol, väte och syre i en rak polymerkedja (utan förgreningar), där den minsta bestånds-delen är cellobiose (två -D-glukosmolekyler). Cellulosa har sex stycken kristallina huvudgrupper benämnda I, II, III1, III11, IV1, IV11. Den vanligast förekommande formen av cellulosa är I, och denna form har två skilda kris-tallina former; I och I , där I dominerar i primitiva organismer och I i de högre.
Figur 15. a) En schematisk bild over cellulosamolekylen -D-glukos som visar bidningen från kol C1 i den vänstra glukosmolekylen till kol C4 i den högra moleky-len. Figuren är en reproduktion från Ref. 11. b) En strukturell modell av cellulosa-molekylen där kolatomer är grå, syre svart och väte är vitt.
Cellulosamolekylen finns vanligtvis i långa polymerer, i storleksordningen 10000–15000 molekylenheter långa. En individuell kedja av cellulosa sitter i kvadratisk formation med 8 stycken kedjor i bredd och djup, bildande en s.k. mikrofibrill. Tvärsnittsarean på en mikrofibrill är ~ 4 nm x 4 nm och fibrillen består av ett kristallint inre och en oordnad yta. Mikrofibrillen sammanfogas
49
(aggregerar) till vad som kallas fibrillaggregat med en tvärsnittsdiameter på storleksordningen 20 nm, och dessa aggregat bildar sedan cellulosapariklar.
Tack vare mikrofibrillens egenskap att vara kristallin har vatten mycket svårt att diffundera igenom ytan för att binda inne i kristallina delar, utan istället binds vatten på ytan av mikrofibrillen. Denna egenskap gör att cellu-losans minsta kristallina beståndsdelar inte löses upp i vatten vilket är gynn-samt exempelvis när cellulosa används som läkemedelsbärare varvid ett läkemedel blandas med cellulosa och pressas till en tablett. När tabletten sväljs och cellulosan sväller så att läkemedlet kan frisättas i mag-tarmkanalen passerar cellulosan sedan genom kroppen utan att ha lösts upp eller tagits upp av kroppen.
Mikrokristallin cellulosa, även kallad MCC, som är benämningen på den typ av cellulosa som används i farmaceutiska sammanhang skiljer sig från cellulosan man hittar i naturen genom att den byggs upp av kedjor som är mellan 200 och 300 molekylenheter långa. MCC är ett av dom vanligaste hjälpämnen i den farmaceutiska industrin. När MCC används för att lagra ett läkemedel och frisätta det i människokroppen, är cellulosans sätt att växel-verka med vatten ytterst viktig. När cellulosa-läkemedelsblandningen kom-mer i kontakt med vatten i magen, joniseras polära läkemedelsmolekyler och blir omgivna av ett vattenskal. Det har tidigare visats att det är växelverkan mellan detta vattenskal och cellulosan som styr hastigheten på läkemedels–frisättningsprocessen. Denna växelverkan, samt transporten av de joner som vattenmolekyler kan bilda i cellulosa, är därför mycket viktiga att analysera och förstå för att veta hur man skall modifiera cellulosans struktur för att kunna skräddarsy själva läkemedelsfrisättningsprocessen.
Huvudmålet med denna avhandling var att uppnå en mer grundläggande förståelse för hur vatteninducerad laddningstransport i MCC går till. Mer specifikt har jag undersökt hur cellulosans densitet, fukthalt och porstruktur påverkar hur elektrisk laddning transporteras i MCC. För att åstadkomma detta har jag använt mig av tekniker så som impedansspektroskopi, transient-ström–mätningar, kvävgasadsorptionsmätningar och elektronmikroskopi. Jag har även designat en mätcell som gör det möjligt att mäta laddningstrans-portegenskaper i cellulosan vart efter densiteten ändras.
Storleken på den vatteninducerade ledningsförmågan, vilken visar sig som en dc-liknande hopprocess av joner i lågfrekvensområdet av det dielek-triska spektrat för MCC, beror till stor del av vattenhalten i MCC. DC-ledningsförmågan ökar 8 storleksordningar när vattenhalten i MCC ökar från 0 till 16 vikt%.
Jag har visat att jonledningsförmågan i fuktig MCC troligtvis styrs av två parallella processer, där den ena innebär att joner som finns i vatten, diffun-derar mellan närliggande positioner med lägst energi i oordnade områden i cellulosan och den andra processen är orsakad av föroreningar, såsom Na+
och protoner (H+) eller H3O+-joner som hoppar mellan närliggande OH--grupper, till vilken en vattenmolekyl är bunden. Vid en relativ fuktighet om

50
37% (som motsvarar ett monolager vattenmolekyler på alla tillgängliga posi-tioner i cellulosan) och högre fuktigheter, dominerar den senare processen totalt laddningstransporten. Detta är också den process som har varit i fokus av forskare de senaste femtio åren och har analyserats med fysikaliska mo-deller bestående av både potensfunktioner och exponentialer.
Föreliggande arbete ger stöd åt potensmodellen (framför exponentialmo-dellen) där ökningen i ledningsförmåga med fukthalt har en fysikalisk grund i omfattningen av cellulosans fria 6-OH positioner och i avståndet mellan dem: Den höga exponenten kan (eventuellt) förklaras genom tunnling och/eller genom den kraftiga anisotropin (skillnaden hos strukturen i olika riktningar) för cellulosans fibrer.
Jag har också visat att den fraktala dimensionen hos porernas ytor på en längdskala mindre än ~100 nm är oberoende av densiteter lägre än 1.2 g/cm3
samt minskar för att nå värden kring ~2.30 vid en MCC-densitet kring 1.4 g/cm3. Densitetsområdet i vilken den fraktala porytans dimension minskar sammanfaller med området där den totala volymen för små mesoporer (5-20 nm i diameter) och dc-ledningsförmågan avtar. Analysen av detta fenomen samt dc-ledningsförmågans uppträdande vid låga densiteter leder till följan-de slutsats:
Efter att ett sammanhängande bindnings-perkolationskluster har formats, ökar ledningsförmågan kontinuerligt tills en platå uppmäts för densiteter över ~0.7 g/cm3. Konduktivitetsplatån fortsätter tills en nedgång orsakad av att ett sammanhängande kluster av mesoporer försvinner, vid densiteter över ~1.2 g/cm3. Vid en given fukthalt, styr alltså två parametrar storleken av den vatteninducerade jonledningsförmågan i MCC; den sammanhängande kopp-lingen av interpartikulära bindningar och sammanhängande koppling av porer med en diameter kring 5-20 nm. Vid densiteter mellan ~0.7 och 1.2 g/cm3 har både interpartikulära bindningar och ett pornätverk perkolerat vilken främjar ledningstransport genom MCC-tabletten.
De ovan presenterade rönen understryker betydelsen av att analysera och ha möjligheten att modifiera/kontrollera strukturen hos mesoporerna i ett farmaceutiskt cellulosasystem för att kunna skräddarsy egenskaper för trans-porten av läkemedel som är relaterade till cellulosa-vattenväxelverkningar.
De presenterade resultaten i denna avhandling torde också vara av bety-delse för andra områden där cellulosa-vattenväxelverkningar är en viktig faktor, såsom i utveckling av papper och sanitetsprodukter samt inom mat-industri som nyttjar cellulosabaserade geler.

51
References
1 D. N. S. Hon, Cellulose 1, 1-25 (1994). 2 H. A. Krässig, Cellulose: structure, accessibility, and reactivity,
Vol. 11 (Gordon and Breach Science Publishers, Yverdon, Switzer-land, 1993).
3 G. Alderborn, in Pharmaceutics: The science of dosage form design,edited by M. E. Aulton (Churchill Livingstone, New York, 2002).
4 A. Mihranyan, M. Strømme, and R. Ek, Eur. J. Pharm. Sci. 27, 220-225 (2006).
5 I. Ohad and D. Danon, J. Cell Biol. 22, 302-305 (1964). 6 K. H. Gardner and J. Blackwell, Biopolymers 13, 1975-2001 (1974). 7 A. C. O'Sullivan, Cellulose 4, 173-207 (1997). 8 P. T. Larsson, K. Wickholm, and T. Iversen, Carbohydr. Res. 302,
19-25 (1997). 9 P. T. Larsson, E.-L. Hult, K. Wickholm, E. Petterson, and T.
Iversen, Solid State Nuclear Magnetic Resonance 15, 31-40 (1999). 10 Y. Nishiyama, P. Langan, and H. Chanzy, J. Am. Chem. Soc. 124,
9074-9082 (2002). 11 S. Westermarck, Thesis, University of Helsinki, 2000. 12 D. Klemm, H.-P. Schmauder, and T. Heinze, Polysaccharides II:
Polysaccharides for Eukaryotes; in Biopolymers, Vol. 6 (Wiley-VCH, 2004).
13 I. Simon, H. A. Scheraga, and R. S. J. Manley, Macromolecules 21,983-990 (1988).
14 A. P. Heiner, L. Kuutti, and O. Teleman, Carbohydr. Res. 306, 205-220 (1998).
15 E. Sjöström, Wood chemistry - Fundamentals and Applications(Academic Press, New York, 1981).
16 European Pharmacopoeia, Strasbourg, 1997. 17 C. Gustafsson, H. Lennholm, T. Iversen, and C. Nyström, Drug Dev.
Ind. Pharm 29, 1095-1107 (2003). 18 K. Wickholm, P. T. Larsson, and T. Iversen, Carbohydr. Res. 312,
123-129 (1998). 19 M. A. S. Azizi Samir, F. Alloin, and A. Dufresne, Biomacro-
molecules 6, 612-626 (2005). 20 E.-L. Hult, P. T. Larsson, and T. Iversen, Polymer 42, 3309-3314
(2001).21 G. Zografi, M. J. Kontny, A. Y. S. Yang, and G. S. Brenner, Int. J.
Pharm. 18, 99-116 (1984). 22 F. Khan and N. Pilpel, Powder Technology 50, 237-241 (1987).

52
23 E. J. Murphy, J. Phys. Chem. Solids 16, 115-122 (1960). 24 S. Sapieha, M. Inoue, and P. Lepoutre, J. Appl. Poym. Sci. 30, 1257-
1266 (1985). 25 R. Pethig, Dielectric and Electronic Properties of Biological Mate-
rials (Wiley, Chichester, UK, 1979). 26 S. Simula and K. Niskanen, Nord. Pulp Paper Res. J. 14, 243-246
(1999).27 R. E. Barker and R. Thomas, J. Appl. Phys. 35, 3203-3215 (1964). 28 J. H. Christie, S. R. Sylvander, I. M. Woodheas, and K. Irie, J. Non-
Crystalline Solids 341, 115-123 (2004). 29 R. Ek, R. M. Hill, and J. M. Newton, J. Mater. Sci. 32, 4807-4814
(1997).30 E. J. Murphy, J. Phys. Chem. Solids 15, 66-71 (1960). 31 W. Kohn and L. J. Sham, Phys. Rev. 140, A1133-A1138 (1965). 32 J. P. Perdew, J. A. Chevary, S. H. Vosko, K. A. Jackson, M. R. Pe-
derson, D. J. Singh, and C. Fiolhais, Phys. Rev. B 46, 6671-6687 (1992).
33 G. Kresse and J. Furthmueller, Comput. Mater. Sci. 6, 15-50 (1996). 34 R. Scheicher, Unpublished data of cellulose electronic bandstruc-
ture calculations, (Condensed Matter Theory Group, Dept. of Phys-ics, Uppsala University, 2006).
35 D. J. Bergman and D. Stroud, Advances in Research and Applica-tions (Academic, San Diego, 1992).
36 D. Stauffer and A. Aharony, Introduction to Percolation Theory,2nd ed. (Taylor & Francis, London, UK, 1992).
37 J. P. Clerc, G. Giraud, J. M. Laugier, and J. M. Luck, Adv. Phys. 39,191-309 (1990).
38 S. Kirkpatrick, Rev. Mod. Phys 45, 574-588 (1973). 39 D. B. Gingold and C. J. Lobb, Phys. Rev. B 42, 8220-8224 (1990). 40 P. Grassberger, J. Phys. A 19, 241-246 (1986). 41 J. R. Macdonald, Impedance Spectroscopy, Emphasizing solid mate-
rials and systems (Wiley, New York, 1987). 42 A. K. Jonscher, Dielectric relaxations in solids (Chelsea Dielectric
Press, London, 1983). 43 P. Debye, Polar Molecules (Chemical Catalogue Company, New
York, 1929). 44 K. S. Cole and C. R. H., J. Chem. Phys. 9, 341-351 (1941). 45 D. W. Davidson and R. H. Cole, J. Chem. Phys. 19, 1484-1490
(1951).46 S. Havriliak and S. Negami, J. Polym. Sci., Part C: Polym. Symp.
14, 99-117 (1966). 47 G. Frenning, Phys. Rev. B 65, 245117:1-8 (2002). 48 U. Brohede, T. Bramer, K. Edsman, and M. Strømme, J. Phys.
Chem. B 109, 15250-15255 (2005). 49 M. Watanabe, M. Rikukawa, K. Sanui, and N. Ogata, J. Appl. Phys.
58, 736-740 (1985). 50 G. Frenning and M. Strømme, J. Appl. Phys. 90, 5570-5575 (2001).

53
51 M. Strømme-Mattsson, G. A. Niklasson, K. Forsgren, and A. Harsta., J. Appl. Phys. 85, 2185-2191 (1999).
52 H. Hägerström, K. Edsman, and M. Strømme, J. Pharm. Sci. 92,1869-1881 (2003).
53 S. Brunauer, P. H. Emmet, and E. Teller., J. Am. Chem. Soc. 60,309-319 (1938).
54 E. P. Barret, L. G. Joyner, and P. P. Halenda, J. Am. Chem. Soc. 73,373-380 (1951).
55 I. M. K. Ismail and P. Pfeifer, Langmuir 10, 1532-1538 (1994). 56 P. Pfeifer, M. Obert, and M. W. Cole, Proc. R. Soc. London A423,
169-188 (1989). 57 Y. Yin, Langmuir 7, 216-217 (1991). 58 P. Pfeifer, Y. J. Wu, M. W. Cole, and J. Krim, Phys. Rev. Lett. 62,
1997-2000 (1989). 59 A. Mihranyan, M. Strømme, Chem. Phys. Letters 393, 389-392
(2004).60 J. Kelvin (published under the name of Sir William Thomson), Phil.
Mag. 42, 448-452. (1871). 61 D. Meissner, J. Einfeldt, and A. Kwasniewski., J. Non-Crystalline
Solids 275, 199-209 (2000). 62 Liedermann K. and L. Lapcík Jr., Chem. Papers 50, 218 (1996). 63 M. Scandola, G. Ceccorulli, and P. M., Int. J. Biol. Macromol. 13,
254-260 (1991). 64 J. Einfeldt and A. Kwasniewski, Cellulose 9, 225-238 (2002). 65 G. Zografi and M. J. Kontny, Pharm. Res 3, 187-194 (1986). 66 J. Einfeldt, D. Meissner, and A. Kwasniewski., Macromol. Chem.
Phys. 201, 1969-1975 (2000). 67 J. Einfeldt, D. Meissner, A. Kwasniewski., and L. Einfeldt, Polymer
42, 7049-7062 (2001). 68 D. J. Crofton and R. A. Pethrick, Polymer 23, 1609-1614 (1982). 69 R. M. Hill and L. A. Dissado, Solid State Ionics 26, 295-297 (1988). 70 A. Mihranyan, A. P. Llagostera, R. Karmhag, M. Strømme, and R.
Ek, Int. J. Pharm. 269, 433-442 (2004). 71 M. Strømme, A. Mihranyan, R. Ek, and G. A. Niklasson, J. Phys.
Chem. B 107, 14378-14382 (2003). 72 C. Nyström and P.-G. Karehill, The Importance of Intermolecular
Bonding Forces and the Concept of Bonding Surface Area (Dekker, New York, 1996).
73 M. Duberg and C. Nyström, Powder Technology 46, 67-75 (1986). 74 F. Khan, N. Pilpel, and S. Ingham, Powder Technology 54, 161-164
(1988).75 G. E. Amidon and M. E. Houghton, Pharm. Res. 12, 923-929
(1995).76 M. E. Cates, J. P. Wittmer, J.-P. Bouchaud, and P. Claudin, Phys.
Rev. Lett. 81, 1841-1844 (1998).

Acta Universitatis UpsaliensisDigital Comprehensive Summaries of Uppsala Dissertationsfrom the Faculty of Science and Technology 170
Editor: The Dean of the Faculty of Science and Technology
A doctoral dissertation from the Faculty of Science andTechnology, Uppsala University, is usually a summary of anumber of papers. A few copies of the complete dissertationare kept at major Swedish research libraries, while thesummary alone is distributed internationally through theseries Digital Comprehensive Summaries of UppsalaDissertations from the Faculty of Science and Technology.(Prior to January, 2005, the series was published under thetitle “Comprehensive Summaries of Uppsala Dissertationsfrom the Faculty of Science and Technology”.)
Distribution: publications.uu.seurn:nbn:se:uu:diva-6815
ACTAUNIVERSITATISUPSALIENSISUPPSALA2006
Related Documents


