Water in Sport: Deakin University final evaluation report to VicHealth 1 Water in Sport Final evaluation report to VicHealth Deakin University September 2020

Welcome message from author
This document is posted to help you gain knowledge. Please leave a comment to let me know what you think about it! Share it to your friends and learn new things together.
Transcript
Water in Sport: Deakin University final evaluation report to VicHealth 1
Water in Sport Final evaluation report to VicHealth Deakin University September 2020
Water in Sport: Deakin University final evaluation report to VicHealth 2
Prepared by Devorah Riesenberg1, Miranda Blake1, Adrian Cameron1, Tara Boelsen-Robinson1, Helena Romaniuk2, Liliana Orellana2 and Anna Peeters1
1Deakin University, Geelong, Australia, Global Obesity Centre, Institute for Health Transformation 2Deakin University, Geelong, Australia, Biostatistics Unit September 2020 Funded by VicHealth For further information regarding this report, contact Devorah Riesenberg at [email protected]
Water in Sport: Deakin University final evaluation report to VicHealth 3
Contents 1. Executive Summary ........................................................................................................... 7
1.1. BACKGROUND ........................................................................................................................ 7
1.2. AIM ...................................................................................................................................... 7
1.3. METHODS.............................................................................................................................. 7
1.4. RESULTS ................................................................................................................................ 8
1.5. CONCLUSION ........................................................................................................................ 10
1.6. RECOMMENDATIONS ............................................................................................................. 10
1.6.1. FOR IMPLEMENTATION SUPPORT AGENCIES (SUCH AS NUTRITION AUSTRALIA) ............................ 10
1.6.2. FOR LOCAL GOVERNMENT ................................................................................................. 10
1.6.3. FOR THE CONVENING AGENCY (SUCH AS VICHEALTH) ............................................................. 10
2. Background ...................................................................................................................... 11
2.1. SETTING ............................................................................................................................... 11
Table 1: Facilities included1 in the Water in Sport initiative, across eight local government areas in Victoria, Australia. .............................................................................................. 12
2.2. REPORT AIM ......................................................................................................................... 13
2.3. REPORT OBJECTIVES ............................................................................................................... 13
2.4. KEY TERMS ........................................................................................................................... 14
2.5. METHODS SUMMARY ............................................................................................................ 14
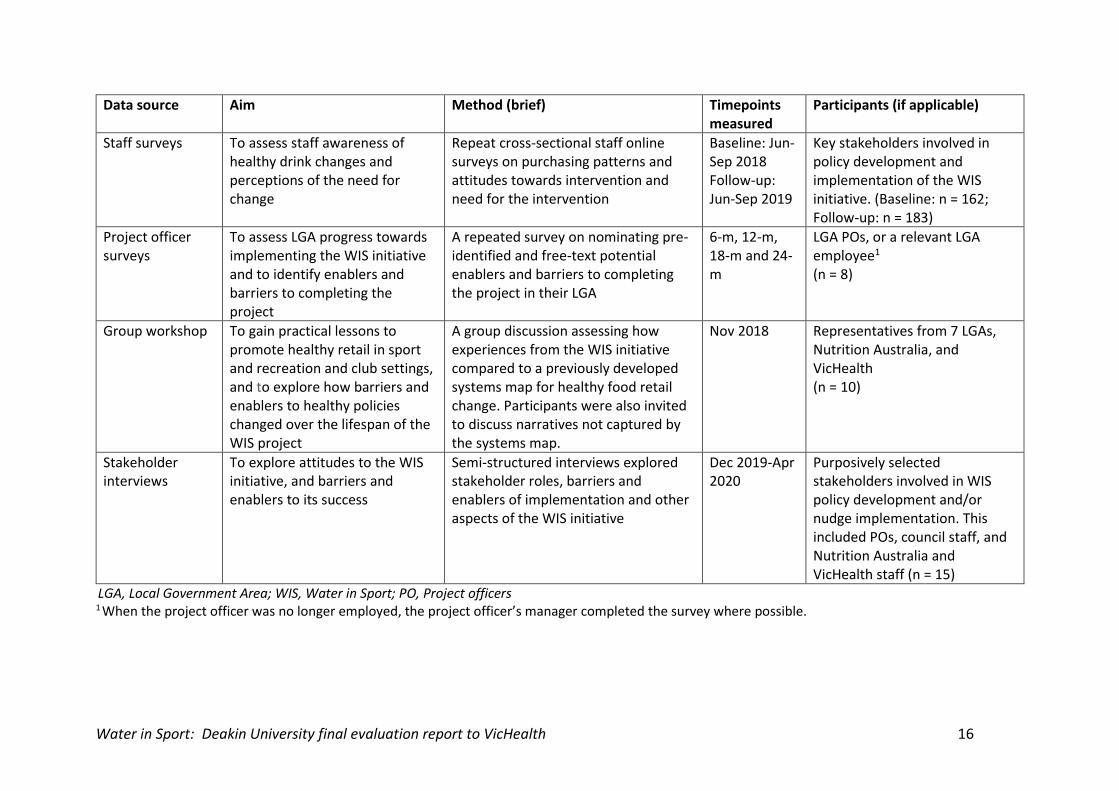
Table 2: Summary of data sources used in the evaluation of Water in Sport initiative, in local government-owned sport and recreation centres, Victoria, Australia, 2018-2020 15
3. Achievement of Water in Sport council project deliverables........................................ 17
3.1. DELIVERABLES SUMMARY ........................................................................................................ 17
Table 3: Indicators of local government area progress towards key goals of the Water in Sport initiative at February 2020 ..................................................................................... 17
3.2. MEDIA COVERAGE ................................................................................................................. 18
Figure 1: Example of media coverage ‘Soft drinks loose fizz’ appeared in the Sunday Herald Sun on 17 February 2019 ..................................................................................... 18
4. Photographic audits ........................................................................................................ 18
4.1. AIM .................................................................................................................................... 18
4.2. METHODS............................................................................................................................ 18
4.2.1. FOOD CHECKER REPORT.................................................................................................... 18
4.2.2. FOOD ENVIRONMENT AUDIT ............................................................................................. 18
4.3. RESULTS .............................................................................................................................. 19
4.3.1. FOOD CHECKER REPORT.................................................................................................... 19
4.3.2. FOOD ENVIRONMENT AUDIT ............................................................................................. 19
Water in Sport: Deakin University final evaluation report to VicHealth 4
Table 4: Mean1 baseline, 6-month, 12-month, 18-month drink availability and if Healthy Choices guidelines were met, per Local Government Area ............................................. 20
Figure 2: Mean baseline, 6-month, 12-month and 18-month healthiness of drink availability, per Local Government Area.......................................................................... 21
Table 5: Mean1 baseline, 6-month, 12-month, 18-month food avalibility and proportion of Healthy Choices standards met, per Local Government Area ..................................... 22
5. Water in Sport policy ...................................................................................................... 23
5.1. AIM .................................................................................................................................... 23
5.2. METHODS............................................................................................................................ 23
5.3. RESULTS .............................................................................................................................. 23
Table 6: Summary of participating Water in Sport council healthy food and drink policy development and scope, 2018 to 2020 ........................................................................... 23
6. Sales data ......................................................................................................................... 28
6.1. AIM .................................................................................................................................... 28
6.2. METHODS............................................................................................................................ 28
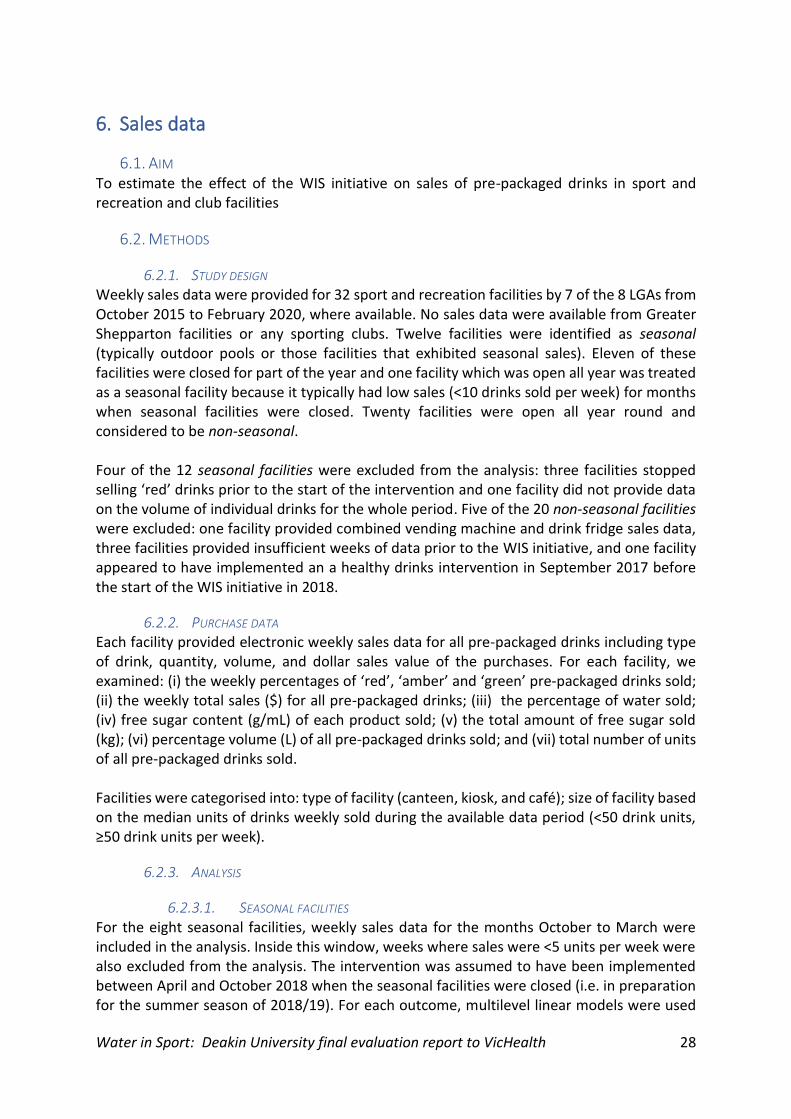
6.2.1. STUDY DESIGN ............................................................................................................... 28
6.2.2. PURCHASE DATA ............................................................................................................. 28
6.2.3. ANALYSIS ...................................................................................................................... 28
6.2.3.1. SEASONAL FACILITIES ................................................................................................... 28
6.2.3.2. NON-SEASONAL FACILITIES ............................................................................................ 29
6.3. RESULTS .............................................................................................................................. 29
6.3.1. SEASONAL FACILITIES ....................................................................................................... 29
Table 7: Estimated mean weekly outcomes pre-and post-initiative in eight seasonal facilities ............................................................................................................................ 30
6.3.2. NON-SEASONAL FACILITIES ............................................................................................... 34
6.3.3. INDIVIDUAL ANALYSIS OF NON-SEASONAL FACILITIES ............................................................... 34
Figure 5: Weekly mean percentage of type of pre-packaged cold drink sold, by volume, for 15 non-seasonal facilities, January 2016 to February 2020 ....................................... 35
Figure 6: Weekly mean revenue ($) of pre-packaged drinks for 15 non-seasonal facilities, January 2016 to February 2020 ....................................................................................... 36
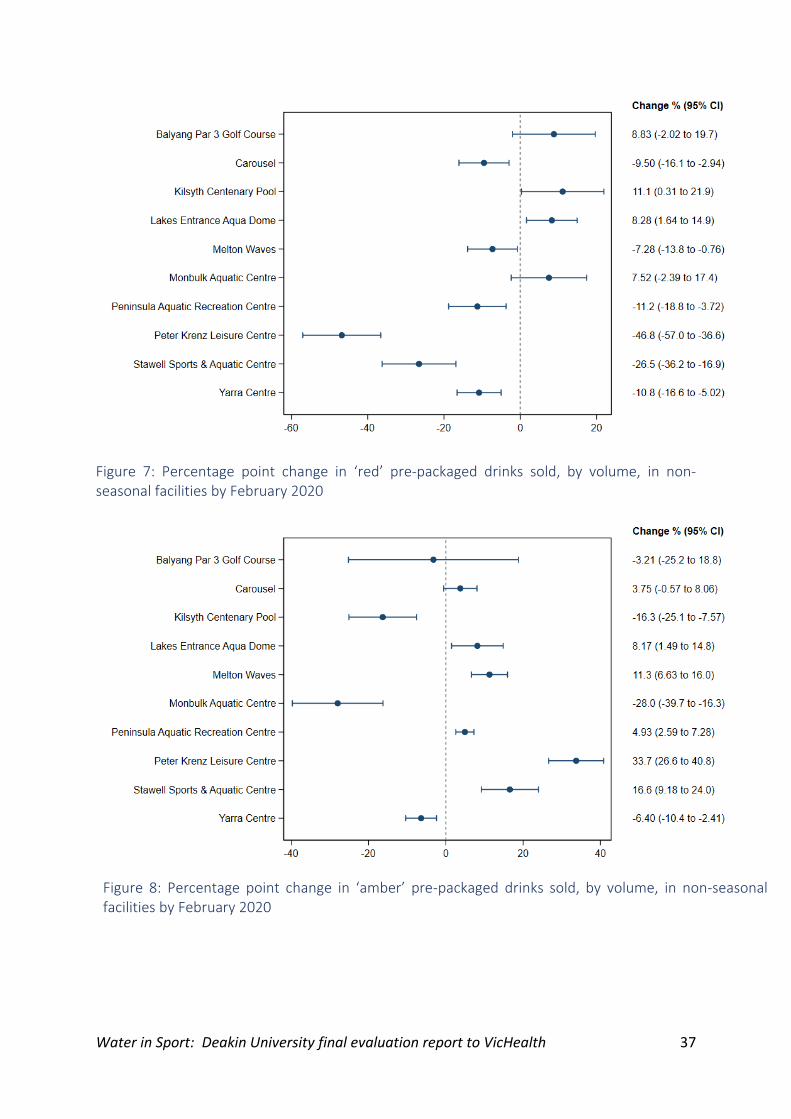
Figure 7: Percentage point change in ‘red’ pre-packaged drinks sold, by volume, in non-seasonal facilities by February 2020 ................................................................................ 37
Figure 8: Percentage point change in ‘amber’ pre-packaged drinks sold, by volume, in non-seasonal facilities by February 2020 ........................................................................ 37
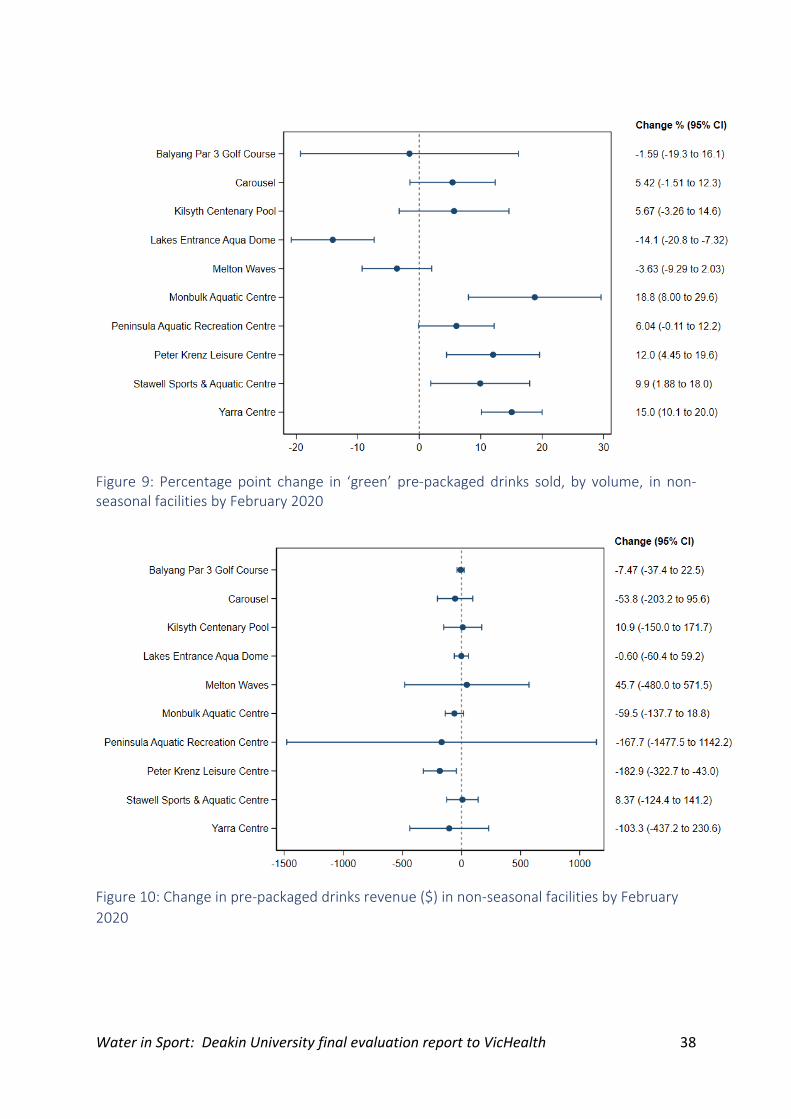
Figure 9: Percentage point change in ‘green’ pre-packaged drinks sold, by volume, in non-seasonal facilities by February 2020 ........................................................................ 38
7. Victorian local government survey ................................................................................. 39
7.1. AIM .................................................................................................................................... 39
Water in Sport: Deakin University final evaluation report to VicHealth 5
7.2. METHODS............................................................................................................................ 39
7.2.1. ANALYSIS ...................................................................................................................... 39
7.3. RESULTS .............................................................................................................................. 39
Table 8: Demographics of all and participating Victorian local governments (n = 26) ... 40
Table 9: Comparison of healthy food retail action in Water in Sport and non-Water in Sport councils (n = 26 local governments) ....................................................................... 41
Table 10: Comparison of change in local government priorities relating to promoting healthy eating and obesity in Water in Sport and non- Water in Sport participating local governments (n = 26 local governments) ........................................................................ 43
Table 11: Comparison between Water in Sport and non-Water in Sport councils in the identification and importance of barriers and enablers to improving the healthiness of the food and/or drink environment in sport and recreation facilities, baseline survey, 2018 (n = 26 local governments) ..................................................................................... 44
Table 12: Comparison between Water in Sport and non- Water in Sport councils in identification and ranking of barriers and enablers to improving the healthiness of the food and/or drink environment in sport and recreation facilities in surveyed local government follow-up survey, 2020 (n = 26 local governments) ................................... 45
8. Customer surveys ............................................................................................................ 47
8.1. AIM .................................................................................................................................... 47
8.2. METHODS............................................................................................................................ 47
8.2.1. ANALYSIS ...................................................................................................................... 47
8.3. RESULTS .............................................................................................................................. 47
Table 13: Customer survey response numbers per local government area at baseline (2018, n = 1,079) and follow-up (2019, n = 1,118) .......................................................... 48
Table 14: Characteristics of all local government respondents at baseline (2018, n = 1,145) and follow-up (2019, n = 1,300) ........................................................................... 48
Table 15: Comparison of customer knowledge and attitudes in relation to water and sugary drinks, and awareness of interventions between baseline (2018, n = 1,079) and follow-up (2019, n = 1,118) surveys ................................................................................ 50
9. Staff surveys .................................................................................................................... 52
9.1. AIM .................................................................................................................................... 52
9.2. METHODS............................................................................................................................ 52
9.2.1. ANALYSIS ...................................................................................................................... 52
9.3. RESULTS .............................................................................................................................. 52
Table 16: Staff survey response numbers per local government area at baseline (2018, n = 162) and follow-up (2019, n = 183)............................................................................... 53
Table 17: Characteristics of staff survey respondents at baseline (2018, n = 220) and follow-up (2019, n = 235) ................................................................................................. 54
Water in Sport: Deakin University final evaluation report to VicHealth 6
Table 18: Comparison of staff knowledge regarding organisational intent to implement healthy changes and awareness of polices related to the healthy change intervention at baseline (2018, n = 162) and follow-up (2019, n = 183) .................................................. 55
10. Qualitative analysis ......................................................................................................... 57
10.1. AIMS ............................................................................................................................ 57
10.2. METHODS ..................................................................................................................... 57
10.2.1. COUNCIL PROJECT OFFICER SURVEYS ................................................................................ 57
10.2.2. GROUP WORKSHOP ..................................................................................................... 57
10.2.3. STAKEHOLDER INTERVIEWS ........................................................................................... 58
10.2.4. QUALITATIVE DATA ANALYSIS AND SYNTHESIS .................................................................... 58
10.3. RESULTS ....................................................................................................................... 59
11. Discussion ........................................................................................................................ 68
12. Recommendations .......................................................................................................... 70
Table 19: Recommendations and suggested implementation strategies ....................... 71
13. Acknowledgments ........................................................................................................... 77
13.1. FUNDING ...................................................................................................................... 77
13.2. PARTICIPANTS ................................................................................................................ 77
14. References ....................................................................................................................... 78
Appendix 1: Food and drink environment audit .................................................................... 80
Appendix 2: Drink fridge audit results at project completion, by LGA ................................. 84
Appendix 3: Food environment audits results at project completion, by LGA .................... 89
Appendix 4: Sales data anlaysis: Seasonal facilities .............................................................. 94
Appendix 5: Sales data anlaysis: Non-seasonal facilities ...................................................... 99
Appendix 6: Sales data anlaysis: Individual non-seasonal facilities .................................... 104
Appendix 7: Survey of food and drink policies and provision in Victorian sport and recreation facilities (baseline) .............................................................................................. 107
Appendix 8: Survey of food and drink policies and provision in Victorian sport and recreation facilities (follow- up) ........................................................................................... 115
Appendix 9: Customer Survey .............................................................................................. 128
Appendix 10: Staff Survey .................................................................................................... 134
Appendix 11: Sensitivity analysis results for customer and staff survey ............................ 137
Appendix 12: Project officer progress survey ...................................................................... 141
Appendix 13: Interview discussion guide ............................................................................. 145
Water in Sport: Deakin University final evaluation report to VicHealth 7
1. Executive Summary
1.1. BACKGROUND The Water in Sport initiative (WIS) commenced in January 2018, with funding provided by VicHealth to eight local government areas (LGAs) to each employ a project officer for a two-year period. Project officers were responsible for facilitating the implementation of one of two ‘nudges’ in a number council-owned and/or -managed sport and recreation and club facilities in each LGA. Nudges were intended to increase the provision and purchasing of healthier drink options and consisted of either i) limiting sugar-sweetened drink display to less than 20% of display space, or ii) removing sugar-sweetened drinks from display.
1.2. AIM The aim of this report was to evaluate the WIS initiative, including the changes in drink availability, the impact on sales of drinks, staff and customer satisfaction, comparison to change occurring in other non-WIS LGAs, and barriers and enablers to implementation and maintenance.
1.3. METHODS The WIS initiative was conducted in eight LGAs and included 54 sport and recreation or club facilities (non-seasonal=24, seasonal=30). Project officers were recruited from April-June 2019, with nudges implemented over one and a half years between August 2018 and February 2020. Nudges were negotiated between VicHealth and the LGAs prior to the appointment of the project officers. Depending on a variety of factors, including council readiness to change, some councils were required to implement two complementary nudges over the two-year period, with one nudge implemented in the first year and the second nudge implemented in the second year. However, upon project commencement and understanding the complexities of the project, nudges were negotiated with each facility separately, with the role of the project officers being to encourage and assist retailers at the sport and recreation or club facilities in their LGA to implement one of the two nudges during the funded project. A mixed method evaluation was undertaken to estimate the extent to which the project was implemented, the consequences of implementation, and barriers and enablers to implementation and maintenance. Drinks available at each facility were assessed every six months and classified according to the Victorian Government’s Healthy Choices guidelines (HCGs) for sport and recreation facilities as ‘green’ (‘best choice’), ‘amber’ (‘choose carefully’) or ‘red’ (‘limit’). In order to promote nudge maintenance, local governments were also required to create a healthy drinks policy which incorporated aspects of the Healthy Choices guidelines within all sport and recreation facilities involved in the WIS initiative by the end of the project. Customers and staff of sport and recreation facilities in the eight LGAs completed a survey at baseline (June-September 2018) and follow-up (June-September 2019). Surveys investigated the perceived need for healthy drink options, the awareness of changes to drink availability and attitudes towards these changes. Weekly sales data from November 2015 until February 2020 were analysed to evaluate the impact of the initiative on the relative healthiness of drinks sold, and drink revenue. Analyses
Water in Sport: Deakin University final evaluation report to VicHealth 8
included estimating the change in the percentage of ‘red’, ‘amber’, and ‘green’ drinks sold by volume, and total drink revenue before and after project officer appointment. In order to compare progress toward healthy food and drinks policies in the eight WIS LGAs to progress in other Victorian LGAs (non-WIS councils), an online cross‐sectional survey was emailed to all 79 Victorian LGAs in July 2018 and again in July 2020. Survey questions explored: 1) the types of facilities owned or managed by the local government that sold food or drink, and any changes made to improve the healthiness of food and drink provision to date; 2) the priority given to obesity prevention and the removal of sugary drinks from facilities; and 3) barriers and enablers to change. Focus groups were conducted with council project officers and other key stakeholders, as well as qualitative interviews with 15 selected stakeholders involved in WIS policy development and/or implementation. These were used to assess perceptions of stakeholders regarding the value, limitations, and barriers and enablers of the WIS approach to increase healthy drink provision in sport and recreation facilities.
1.4. RESULTS Forty-five nudges were implemented by thirty-nine facilities or clubs as part of the WIS initiative with at least one nudge implemented in each LGA. Overall, availability of ‘red’ drinks decreased from 39 to 11% of all drinks (28 percentage point decrease), and availability of ‘green’ drinks increased from 43 to 63% of all drinks (20 percentage point increase). Three of the eight participating LGAs implemented a healthy drinks policy for sport and recreation facilities incorporating the Healthy Choices guidelines. Repeat cross-sectional surveys were completed by 1,079 customers and 162 staff at baseline (June 2018), and 1,188 customers and 183 staff at follow-up (June 2020). Over three-quarters of respondents believed that sport and recreation facilities should promote healthy eating, there was no change between baseline and follow-up results. Half of respondents believed that removing sugary drinks from sport and recreation facilities would help reduce consumption and this did not change from baseline to follow-up. More staff believed at follow-up compared to baseline that promoting healthy eating was a high priority in their facility (baseline: staff 40%; follow-up: 50%). More staff believed at follow-up compared to baseline that their facility had made healthy changes in the past six months (baseline: 15%; follow-up: 44%). When limiting responses to only customers at facilities that had implemented a nudge at follow-up, there was low customer awareness of the healthy changes made at the facilities at both time points, although more customers were aware of changes at follow-up compared to baseline (e.g., changes to availability of sugary drinks: baseline: 3%, follow-up: 11%). Different trends were observed in seasonal and non-seasonal facilities and they were therefore analysed separately. Following the implementation of the WIS initiative, in eight seasonal facilities (typically outdoor pools or those facilities that exhibited seasonal sales), the mean percentage of ‘red’ drinks sold each week was reduced from 47.9% of volume sales before the initiative to 25.4% of sales after the initiative, a reduction of 22.5 percentage points [95% confidence interval -35.0, -10.0]. The percentage of ‘amber’ drinks sold increased from 11.4% to 24.2%, and increase of 12.8 percentage points [+6.5, +19.2]). The percentage
Water in Sport: Deakin University final evaluation report to VicHealth 9
of ‘green’ drinks increased from 40.8% to 50.5%, an increase of 9.8 percentage points [+2.7, +16.8]. The mean percentage of volume of water sold per week increased from 36.4% to 44.0%, an increase of 7.6 percentage points [+0.22, +14.9]. There was no change in total weekly drink revenue before and after the WIS initiative. In the 15 non-seasonal facilities included in analysis, the evaluation estimated the difference between the actual outcome observed and the predicted outcome that would have been observed if the initiative had not been implemented for two timepoints: (i) the week immediately after the project officer commenced; and (ii) the final week of the Water in Sport evaluation period (week 24 February - 1 March 2020). In order to isolate the effect of the intervention, the analysis took account of sales trends over time that were unrelated to the WIS initiative, for example whether sales of ‘red’ drinks had been trending down before the intervention started. Considerable variation in the impact of the WIS initiative on sales was observed between facilities, such that, on average, no statistically significant overall change in sales were seen. However, when analysed individually, the percentage volume of ‘red’ drinks sold in February 2020 decreased in 6 of the ten non-seasonal facilities (change in percentage points ranged from -46.8 to -7.3), increased in two facilities, and did not change in two facilities. The percentage volume of ‘green’ drinks sold increased in four non-seasonal facilities (change in percentage points ranged from +9.9 to +18.8), decreased in ten facilities, and did not change in five facilities. The percentage volume of ‘amber’ drinks sold increased in five of the ten non-seasonal facilities (change in percentage points ranged +4.9 to +33.7), decreased in three facilities, and did not change in two facilities. In nine of ten facilities, there was no change in weekly drinks revenue, although one facility demonstrated a decrease in revenue by February 2020. The local government surveys conducted in 2018 and 2020 demonstrated that ‘reducing the prevalence of obesity’ and ‘promoting healthy eating’ were a higher priority in local governments participating in the WIS project (n = 8) than in non-WIS local governments (n = 18) at baseline. The priority given to various actions by councils was measured on a scale from 0-10, where 10 was the highest priority and 0 was the lowest priority. The mean priority score for ‘reducing the prevalence of obesity’ was 7.9 [6.0, 9.7] in WIS councils and 6.7 [5.5, 8.0] in non-WIS councils at baseline. The priority given to ‘promoting healthy eating/drinking’ at baseline was 8.6 [7.6, 9.6] in WIS councils, and 6.6 [5.4, 7.7] in non-WIS councils. While these priorities did not change at follow-up for WIS councils, non-WIS council priorities for ‘increasing the availability of healthy food and drinks in local government-owned sport and recreation facilities’ increased (baseline: WIS councils= 8.5 [7.2, 9.8], non-WIS councils= 5.1 [3.8, 6.3]; follow-up: WIS councils= 8.4 [7.6, 9.2], non-WIS councils= 8.7 [8.0,9.5]). Both WIS and non-WIS councils reported support from key stakeholders (e.g. local government elected members, leadership teams) to be the most important enabler of implementing healthy changes, and lack of key support to be the most critical barrier, however a variety of barriers and enablers were identified as important. Focus groups and fifteen qualitative interviews of key stakeholders involved in the WIS project were conducted, including local government members and project officers. These highlighted the importance of funding, support and knowledge provided by VicHealth and Nutrition Australia (Victoria Division). Stakeholders revealed the key role played by WIS funded project officers in providing tailored support and timely resources to facilities to enable the smooth
Water in Sport: Deakin University final evaluation report to VicHealth 10
implementation of nudges. Stakeholders highlighted that maintaining nudges may require both ongoing human resources and recognition of those facilities that make healthy changes.
1.5. CONCLUSION This mixed method evaluation of the WIS initiative, providing a dedicated project officer and nutrition support, demonstrates that this can be an effective way to promote healthier drink environments in the sport and recreation setting. In-depth interviews revealed the importance of the project officers for the implementation of nudges. The sustainability of nudges implemented as part of the WIS initiative requires ongoing monitoring, while the cost-effectiveness of resourcing a project officer to assist with a healthy retailer intervention will need to be considered prior to further implementation at scale.
1.6. RECOMMENDATIONS Based on the evaluation of the WIS initiative, including reflections from key stakeholders in the qualitative evaluation, along with key learnings from the research team, and the broader literature, several actions are recommended to facilitate and promote the implementation of nudges to create healthier food and drink environments in community retail settings.
1.6.1. FOR IMPLEMENTATION SUPPORT AGENCIES (SUCH AS NUTRITION AUSTRALIA)
• Support project officers with targeted training in (a) retailer engagement; (b) policy development; (c) systems thinking and strategic planning; and (d) basic evaluation skills
1.6.2. FOR LOCAL GOVERNMENT
• Start by trialling a small ‘quick win’ which is easy to implement and unlikely to cause revenue loss, such as rearranging the fridge to put ‘green’ drinks at eye-level
• Recruit, train, and resource skilled project officers to support retailers with initial changes
• Ensure regular two-way communication between council and facility personnel and management
1.6.3. FOR THE CONVENING AGENCY (SUCH AS VICHEALTH)
• Maximise funding effectiveness by providing (a) some flexibility for fund use, with the majority earmarked for salary support; (b) flexibility for implementation targets, to allow interventions to be tailored to opportunities; (c) sufficient FTE per council (2 to 4 days per week depending on number of engaged facilities for at least 2 years); and (d) longer-term maintenance funding once changes have been made (e.g. 1 to 2 days per week)
• Provide implementation expertise to support council project officers including in product classification, stakeholder engagement, and policy development
Water in Sport: Deakin University final evaluation report to VicHealth 11
2. Background Local governments can have an important influence on the food environments of their municipality as part of their efforts to promote community health and wellbeing [1]. Sport and recreation and club facilities offer a unique opportunity to promote and encourage health through both physical activity and creating healthy food environments [2]. In January 2018, VicHealth provided funding to eight local government areas (LGAs) to implement the Water in Sport (WIS) initiative. The initiative aimed to support local government-owned and/or managed sport and recreation facilities and clubs to implement a ‘nudge’ to reduce customer purchases of sugary drinks and make water the drink of choice. Nudges involved either i) limiting display of ‘red’ drinks to less than 20% of display space, or ii) removing ‘red’ drinks from display altogether whilst increasing display of healthier (green) drinks to greater than 50%. The healthiness of drinks available was classified according to the Victorian Government’s Healthy Choices guidelines (HCG) for sport and recreation facilities into ‘green’ (‘best choice’), ‘amber’ (‘choose carefully’) and ‘red’ (‘limit’) [3] . The Deakin University Global Obesity Centre (GLOBE) was funded to evaluate the effectiveness of the WIS initiative. The research team sought to determine the reach and effectiveness of providing capacity-building support to LGAs to implement the WIS initiative; and to assess the impact of this initiative on progress compared to non-funded councils, policy, healthiness of drink availability, and consumer purchases and attitudes.
2.1. SETTING VicHealth provided funding to eight LGAs to employ a project officer (PO) to support facilities to remove sugary drinks from sport and recreation and club facilities and make water the drink of choice. In order to be eligible for WIS funding, councils were required to submit an application and demonstrate agreement from the facilities to implement a nudge as described earlier. Nudges were agreed upon with VicHealth and the LGAs prior to the appointment of the project officers with some councils required to implement two separate nudges over the two-year period, with one nudge implemented in the first year and the second nudge implemented within the second year. However, as the project commenced, nudges were negotiated with each retailer separately, with the role of the POs being to encourage all targeted facilities in their LGA to implement one of the two nudges during the project period. Participating facilities included sport clubs, sport and recreation centres and seasonal pools with the number of facilities involved in the project varying per council (see Table 1 for summary of facilities involved). Nutrition Australia Vic Division was funded by VicHealth to provide program delivery support to each LGA via the Healthy Eating Advisory Service (HEAS).
Water in Sport: Deakin University final evaluation report to VicHealth 12
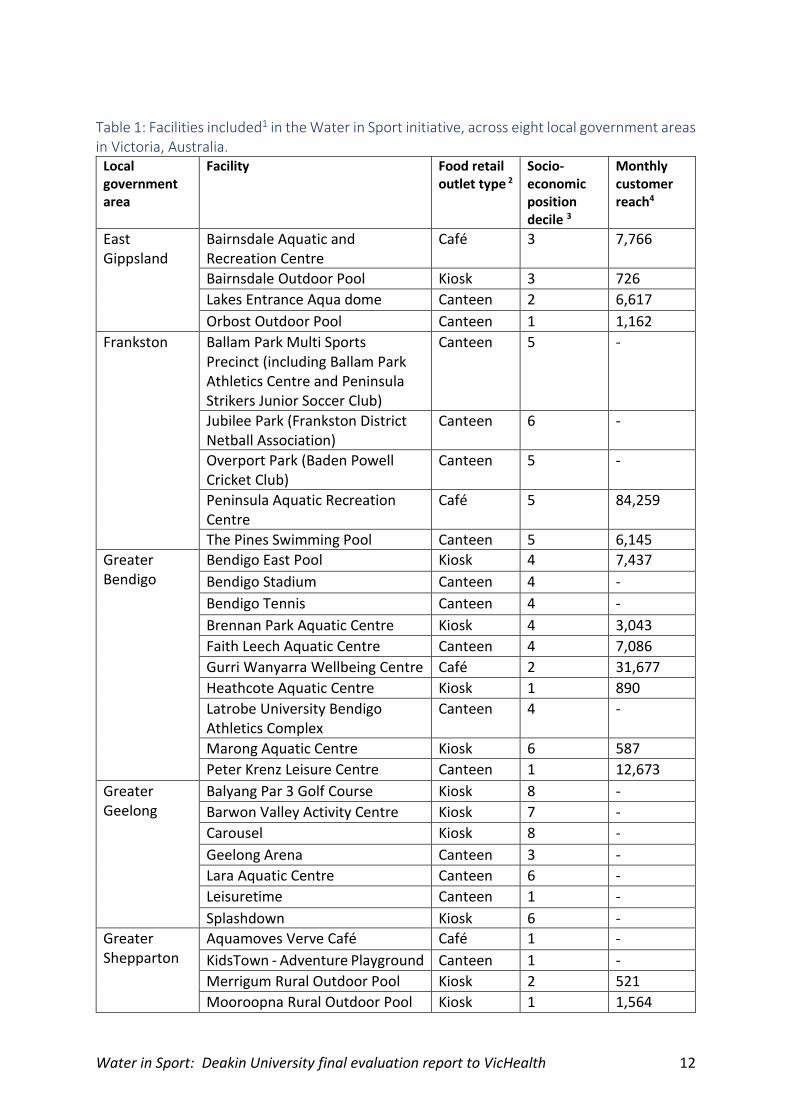
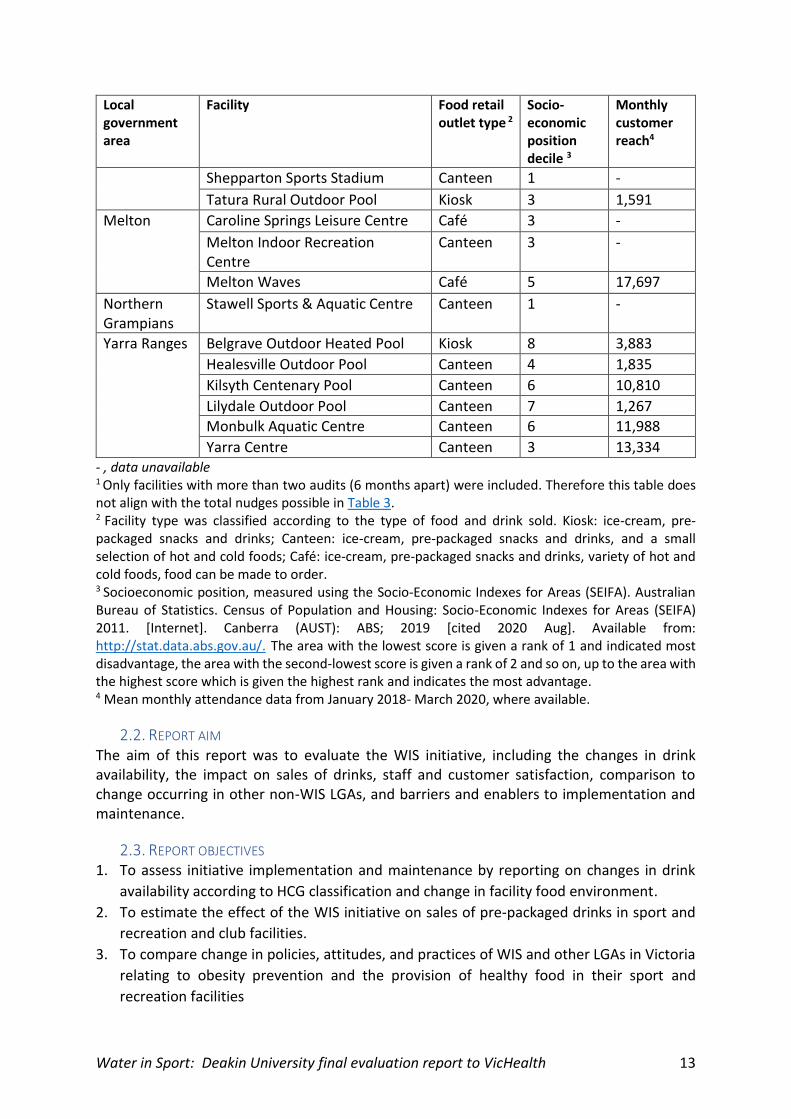
Table 1: Facilities included1 in the Water in Sport initiative, across eight local government areas in Victoria, Australia.
Local government area
Facility Food retail outlet type 2
Socio-economic position decile 3
Monthly customer reach4
East Gippsland
Bairnsdale Aquatic and Recreation Centre
Café 3 7,766
Bairnsdale Outdoor Pool Kiosk 3 726
Lakes Entrance Aqua dome Canteen 2 6,617
Orbost Outdoor Pool Canteen 1 1,162
Frankston Ballam Park Multi Sports Precinct (including Ballam Park Athletics Centre and Peninsula Strikers Junior Soccer Club)
Canteen 5 -
Jubilee Park (Frankston District Netball Association)
Canteen 6 -
Overport Park (Baden Powell Cricket Club)
Canteen 5 -
Peninsula Aquatic Recreation Centre
Café 5 84,259
The Pines Swimming Pool Canteen 5 6,145
Greater Bendigo
Bendigo East Pool Kiosk 4 7,437
Bendigo Stadium Canteen 4 -
Bendigo Tennis Canteen 4 -
Brennan Park Aquatic Centre Kiosk 4 3,043
Faith Leech Aquatic Centre Canteen 4 7,086
Gurri Wanyarra Wellbeing Centre Café 2 31,677
Heathcote Aquatic Centre Kiosk 1 890
Latrobe University Bendigo Athletics Complex
Canteen 4 -
Marong Aquatic Centre Kiosk 6 587
Peter Krenz Leisure Centre Canteen 1 12,673
Greater Geelong
Balyang Par 3 Golf Course Kiosk 8 -
Barwon Valley Activity Centre Kiosk 7 -
Carousel Kiosk 8 -
Geelong Arena Canteen 3 -
Lara Aquatic Centre Canteen 6 -
Leisuretime Canteen 1 -
Splashdown Kiosk 6 -
Greater Shepparton
Aquamoves Verve Café Café 1 -
KidsTown - Adventure Playground Canteen 1 -
Merrigum Rural Outdoor Pool Kiosk 2 521
Mooroopna Rural Outdoor Pool Kiosk 1 1,564
Water in Sport: Deakin University final evaluation report to VicHealth 13
Local government area
Facility Food retail outlet type 2
Socio-economic position decile 3
Monthly customer reach4
Shepparton Sports Stadium Canteen 1 -
Tatura Rural Outdoor Pool Kiosk 3 1,591
Melton Caroline Springs Leisure Centre Café 3 -
Melton Indoor Recreation Centre
Canteen 3 -
Melton Waves Café 5 17,697
Northern Grampians
Stawell Sports & Aquatic Centre Canteen 1 -
Yarra Ranges Belgrave Outdoor Heated Pool Kiosk 8 3,883
Healesville Outdoor Pool Canteen 4 1,835
Kilsyth Centenary Pool Canteen 6 10,810
Lilydale Outdoor Pool Canteen 7 1,267
Monbulk Aquatic Centre Canteen 6 11,988
Yarra Centre Canteen 3 13,334 - , data unavailable 1 Only facilities with more than two audits (6 months apart) were included. Therefore this table does not align with the total nudges possible in Table 3. 2 Facility type was classified according to the type of food and drink sold. Kiosk: ice-cream, pre-packaged snacks and drinks; Canteen: ice-cream, pre-packaged snacks and drinks, and a small selection of hot and cold foods; Café: ice-cream, pre-packaged snacks and drinks, variety of hot and cold foods, food can be made to order. 3 Socioeconomic position, measured using the Socio‐Economic Indexes for Areas (SEIFA). Australian Bureau of Statistics. Census of Population and Housing: Socio-Economic Indexes for Areas (SEIFA) 2011. [Internet]. Canberra (AUST): ABS; 2019 [cited 2020 Aug]. Available from: http://stat.data.abs.gov.au/. The area with the lowest score is given a rank of 1 and indicated most disadvantage, the area with the second-lowest score is given a rank of 2 and so on, up to the area with the highest score which is given the highest rank and indicates the most advantage. 4 Mean monthly attendance data from January 2018- March 2020, where available.
2.2. REPORT AIM The aim of this report was to evaluate the WIS initiative, including the changes in drink availability, the impact on sales of drinks, staff and customer satisfaction, comparison to change occurring in other non-WIS LGAs, and barriers and enablers to implementation and maintenance.
2.3. REPORT OBJECTIVES 1. To assess initiative implementation and maintenance by reporting on changes in drink
availability according to HCG classification and change in facility food environment.
2. To estimate the effect of the WIS initiative on sales of pre-packaged drinks in sport and
recreation and club facilities.
3. To compare change in policies, attitudes, and practices of WIS and other LGAs in Victoria
relating to obesity prevention and the provision of healthy food in their sport and
recreation facilities
Water in Sport: Deakin University final evaluation report to VicHealth 14
4. To evaluate the perceptions of key stakeholders including to assess:
a. customer awareness of healthy drink changes and perceptions of the need for change
customer and staff response to (changes in) healthy food and drink policy
b. staff awareness of healthy drink changes and perceptions of the need for change
c. attitudes to the WIS initiative, and barriers and enablers to its success
5. To develop recommendations and priorities to assist the implementation of healthy retail
changes.
2.4. KEY TERMS Local Government Area (LGA): An administrative division of a state or territory that is below federal and state government. Non-WIS councils: Councils that have been involved in the local government Victorian survey however have not received funding from VicHealth to engage in the Water in Sport initiative Healthy Choices guidelines (HCGs): The Victorian Government has developed the Healthy Choices guidelines to improve the availability and promotion of healthier foods and drinks in community settings WIS model: The appointment of a PO to assist with implementation of healthy drinks nudges Baseline: The first time point at which data was collected by POs (0-months post-baseline) 6-month: The second time point at which data was collected by POs (6-month post-baseline) 12-month: The third time point at which data was collected by POs (12-month post-baseline) 18-month: The fourth time point at which data was collected by POs (18-month post-baseline) 24-month: The fifth and final time point at which data is collected by POs (24-months post baseline)
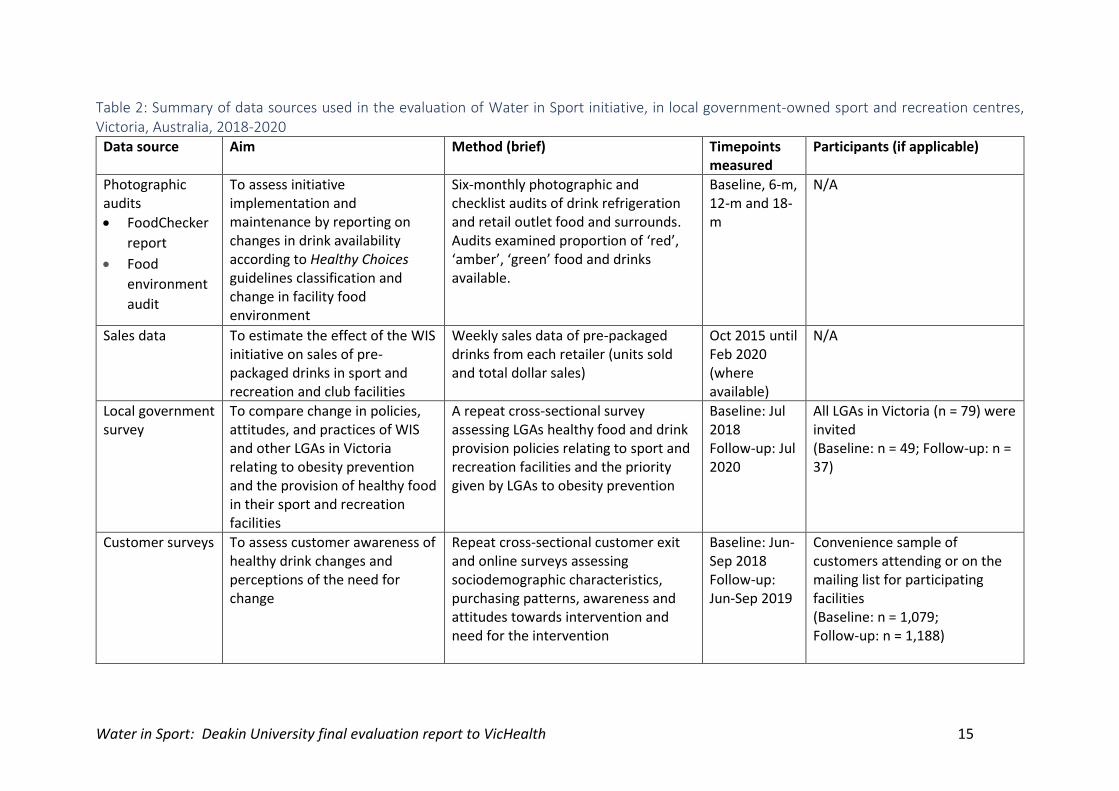
2.5. METHODS SUMMARY A mixed methods evaluation was undertaken to explore the implementation and outcomes of the Water in Sport initiative. See Table 2 for a summary of data sources and analysis. Due to the COVID-19-related closure of many facilities, and the drastically altered food and drink availability at others during the pandemic, this report includes food environment audits to 18 months only.
Water in Sport: Deakin University final evaluation report to VicHealth 15
Table 2: Summary of data sources used in the evaluation of Water in Sport initiative, in local government-owned sport and recreation centres, Victoria, Australia, 2018-2020
Data source Aim Method (brief) Timepoints measured
Participants (if applicable)
Photographic audits
• FoodChecker
report
• Food
environment
audit
To assess initiative implementation and maintenance by reporting on changes in drink availability according to Healthy Choices guidelines classification and change in facility food environment
Six-monthly photographic and checklist audits of drink refrigeration and retail outlet food and surrounds. Audits examined proportion of ‘red’, ‘amber’, ‘green’ food and drinks available.
Baseline, 6-m, 12-m and 18-m
N/A
Sales data To estimate the effect of the WIS initiative on sales of pre-packaged drinks in sport and recreation and club facilities
Weekly sales data of pre-packaged drinks from each retailer (units sold and total dollar sales)
Oct 2015 until Feb 2020 (where available)
N/A
Local government survey
To compare change in policies, attitudes, and practices of WIS and other LGAs in Victoria relating to obesity prevention and the provision of healthy food in their sport and recreation facilities
A repeat cross‐sectional survey assessing LGAs healthy food and drink provision policies relating to sport and recreation facilities and the priority given by LGAs to obesity prevention
Baseline: Jul 2018 Follow-up: Jul 2020
All LGAs in Victoria (n = 79) were invited (Baseline: n = 49; Follow-up: n = 37)
Customer surveys To assess customer awareness of healthy drink changes and perceptions of the need for change
Repeat cross-sectional customer exit and online surveys assessing sociodemographic characteristics, purchasing patterns, awareness and attitudes towards intervention and need for the intervention
Baseline: Jun-Sep 2018 Follow-up: Jun-Sep 2019
Convenience sample of customers attending or on the mailing list for participating facilities (Baseline: n = 1,079; Follow-up: n = 1,188)
Water in Sport: Deakin University final evaluation report to VicHealth 16
Data source Aim Method (brief) Timepoints measured
Participants (if applicable)
Staff surveys To assess staff awareness of healthy drink changes and perceptions of the need for change
Repeat cross-sectional staff online surveys on purchasing patterns and attitudes towards intervention and need for the intervention
Baseline: Jun-Sep 2018 Follow-up: Jun-Sep 2019
Key stakeholders involved in policy development and implementation of the WIS initiative. (Baseline: n = 162; Follow-up: n = 183)
Project officer surveys
To assess LGA progress towards implementing the WIS initiative and to identify enablers and barriers to completing the project
A repeated survey on nominating pre-identified and free-text potential enablers and barriers to completing the project in their LGA
6-m, 12-m, 18-m and 24-m
LGA POs, or a relevant LGA employee1
(n = 8)
Group workshop To gain practical lessons to promote healthy retail in sport and recreation and club settings, and to explore how barriers and enablers to healthy policies changed over the lifespan of the WIS project
A group discussion assessing how experiences from the WIS initiative compared to a previously developed systems map for healthy food retail change. Participants were also invited to discuss narratives not captured by the systems map.
Nov 2018 Representatives from 7 LGAs, Nutrition Australia, and VicHealth (n = 10)
Stakeholder interviews
To explore attitudes to the WIS initiative, and barriers and enablers to its success
Semi-structured interviews explored stakeholder roles, barriers and enablers of implementation and other aspects of the WIS initiative
Dec 2019-Apr 2020
Purposively selected stakeholders involved in WIS policy development and/or nudge implementation. This included POs, council staff, and Nutrition Australia and VicHealth staff (n = 15)
LGA, Local Government Area; WIS, Water in Sport; PO, Project officers 1 When the project officer was no longer employed, the project officer’s manager completed the survey where possible.
Water in Sport: Deakin University final evaluation report to VicHealth 17
3. Achievement of Water in Sport council project deliverables
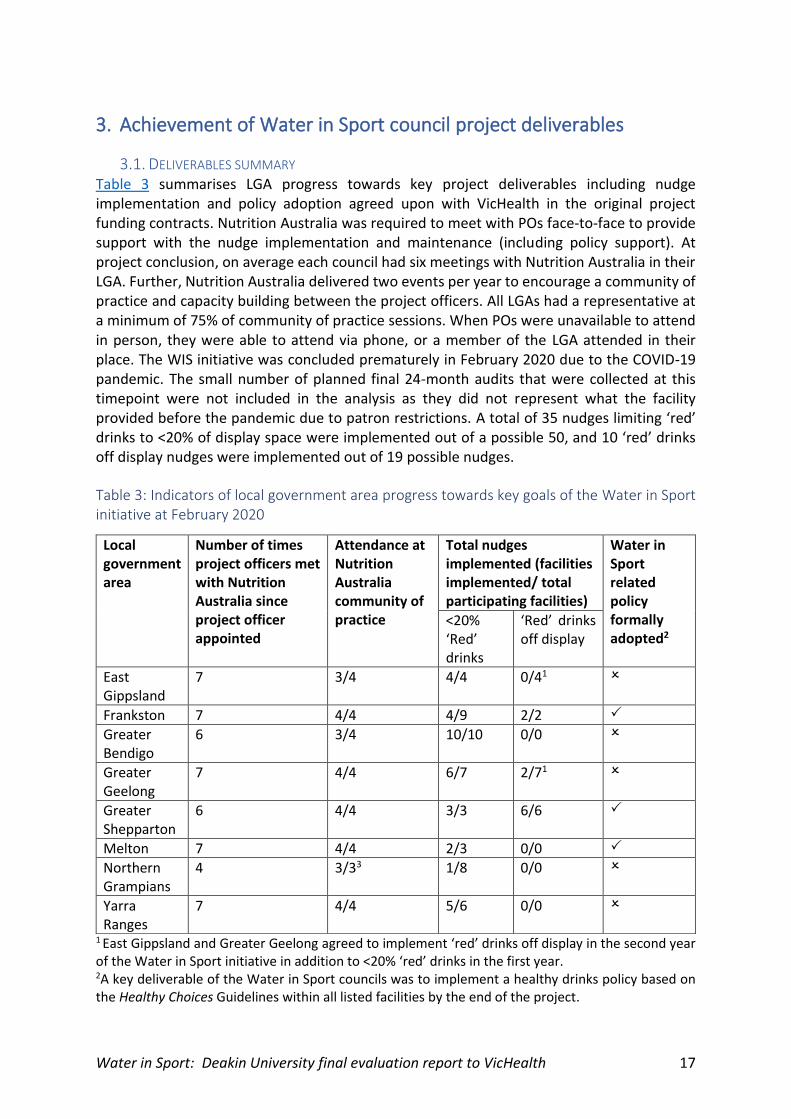
3.1. DELIVERABLES SUMMARY Table 3 summarises LGA progress towards key project deliverables including nudge implementation and policy adoption agreed upon with VicHealth in the original project funding contracts. Nutrition Australia was required to meet with POs face-to-face to provide support with the nudge implementation and maintenance (including policy support). At project conclusion, on average each council had six meetings with Nutrition Australia in their LGA. Further, Nutrition Australia delivered two events per year to encourage a community of practice and capacity building between the project officers. All LGAs had a representative at a minimum of 75% of community of practice sessions. When POs were unavailable to attend in person, they were able to attend via phone, or a member of the LGA attended in their place. The WIS initiative was concluded prematurely in February 2020 due to the COVID-19 pandemic. The small number of planned final 24-month audits that were collected at this timepoint were not included in the analysis as they did not represent what the facility provided before the pandemic due to patron restrictions. A total of 35 nudges limiting ‘red’ drinks to <20% of display space were implemented out of a possible 50, and 10 ‘red’ drinks off display nudges were implemented out of 19 possible nudges.
Table 3: Indicators of local government area progress towards key goals of the Water in Sport initiative at February 2020
1 East Gippsland and Greater Geelong agreed to implement ‘red’ drinks off display in the second year of the Water in Sport initiative in addition to <20% ‘red’ drinks in the first year. 2A key deliverable of the Water in Sport councils was to implement a healthy drinks policy based on the Healthy Choices Guidelines within all listed facilities by the end of the project.
Local government area
Number of times project officers met with Nutrition Australia since project officer appointed
Attendance at Nutrition Australia community of practice
Total nudges implemented (facilities implemented/ total participating facilities)
Water in Sport related policy formally adopted2
<20% ‘Red’ drinks
‘Red’ drinks off display
East Gippsland
7 3/4 4/4 0/41
Frankston 7 4/4 4/9 2/2
Greater Bendigo
6 3/4 10/10 0/0
Greater Geelong
7 4/4 6/7 2/71
Greater Shepparton
6 4/4 3/3 6/6
Melton 7 4/4 2/3 0/0
Northern Grampians
4 3/33 1/8 0/0
Yarra Ranges
7 4/4 5/6 0/0
Water in Sport: Deakin University final evaluation report to VicHealth 18
3The project officer was no longer employed when the final community of practice session was held.
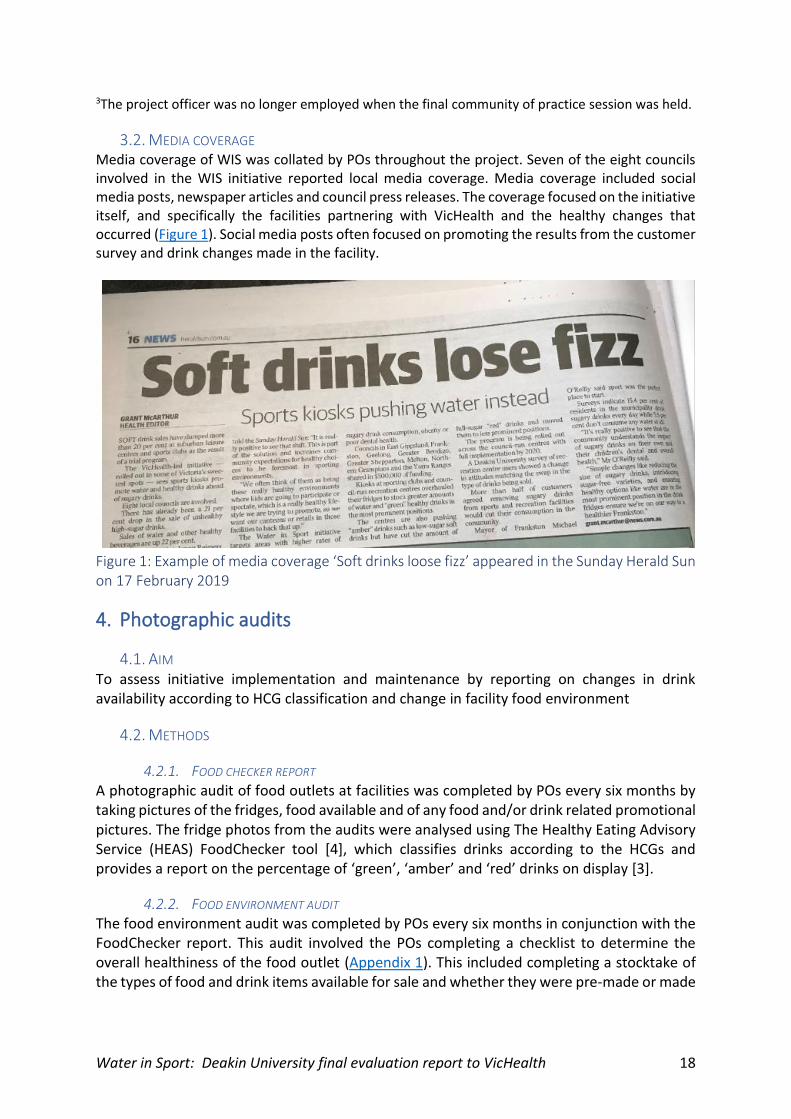
3.2. MEDIA COVERAGE Media coverage of WIS was collated by POs throughout the project. Seven of the eight councils involved in the WIS initiative reported local media coverage. Media coverage included social media posts, newspaper articles and council press releases. The coverage focused on the initiative itself, and specifically the facilities partnering with VicHealth and the healthy changes that occurred (Figure 1). Social media posts often focused on promoting the results from the customer survey and drink changes made in the facility.
Figure 1: Example of media coverage ‘Soft drinks loose fizz’ appeared in the Sunday Herald Sun on 17 February 2019
4. Photographic audits
4.1. AIM To assess initiative implementation and maintenance by reporting on changes in drink availability according to HCG classification and change in facility food environment
4.2. METHODS
4.2.1. FOOD CHECKER REPORT A photographic audit of food outlets at facilities was completed by POs every six months by taking pictures of the fridges, food available and of any food and/or drink related promotional pictures. The fridge photos from the audits were analysed using The Healthy Eating Advisory Service (HEAS) FoodChecker tool [4], which classifies drinks according to the HCGs and provides a report on the percentage of ‘green’, ‘amber’ and ‘red’ drinks on display [3].
4.2.2. FOOD ENVIRONMENT AUDIT The food environment audit was completed by POs every six months in conjunction with the FoodChecker report. This audit involved the POs completing a checklist to determine the overall healthiness of the food outlet (Appendix 1). This included completing a stocktake of the types of food and drink items available for sale and whether they were pre-made or made
Water in Sport: Deakin University final evaluation report to VicHealth 19
on-site1. The audit examined achievement of ‘extra’ Healthy Choices food and drink standards for sport and recreation facilities, including food and drink advertising, promotion and display, infrastructure to support the preparation of healthy foods and drinks, and whether water is freely available.
4.3. RESULTS
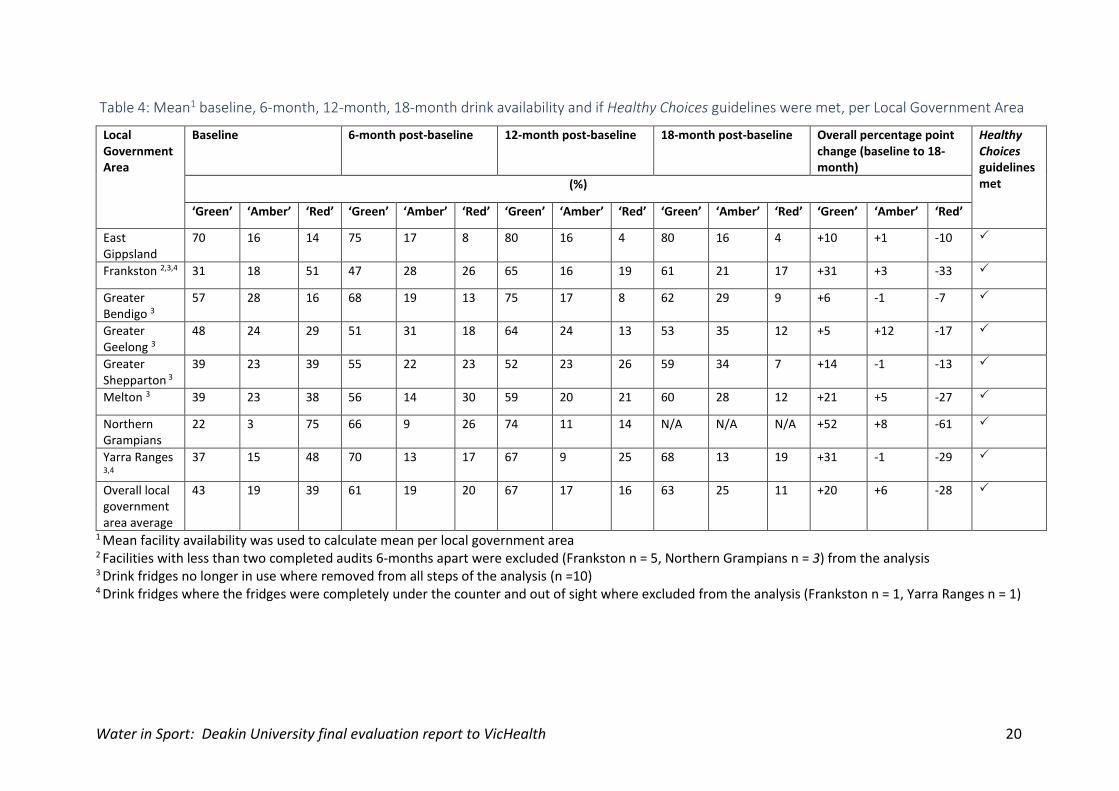
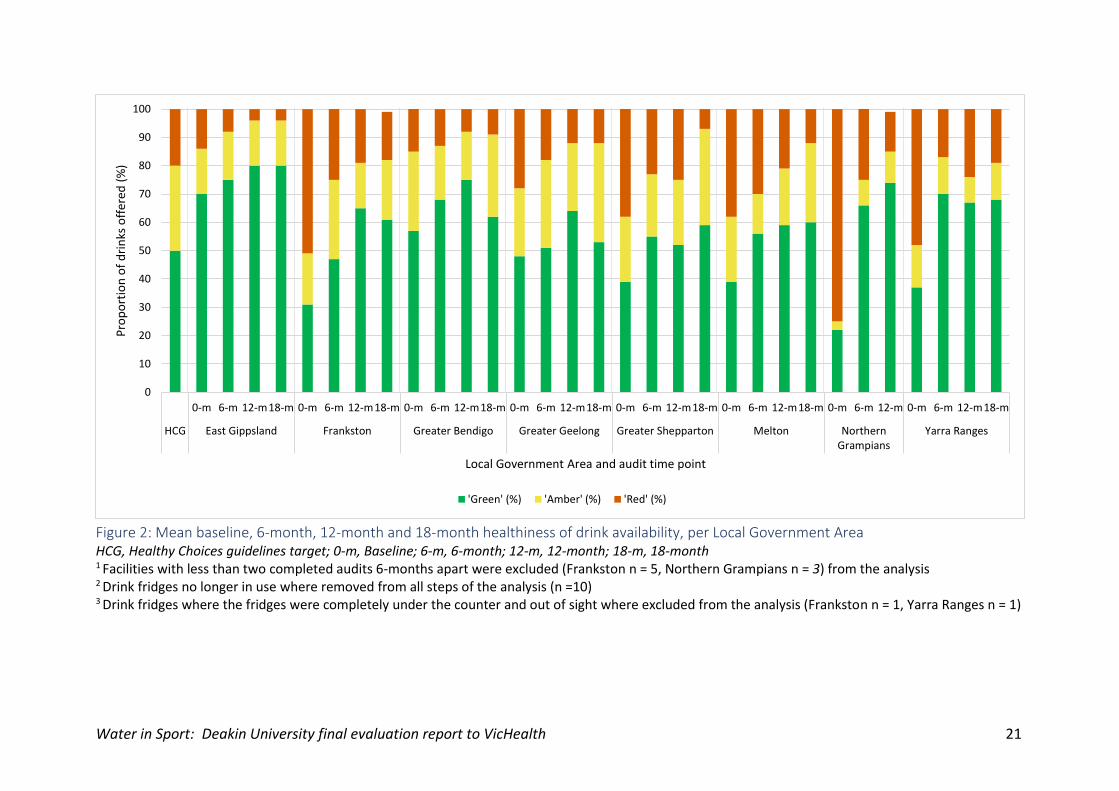
4.3.1. FOOD CHECKER REPORT The most recent (February 2020) audits of healthiness of drinks available in the sport and recreation and club facilities involved in the WIS initiative are described in Table 4 and Figure 2 with results based on audits completed by the PO between May 2018 and February 2020. At the completion of the WIS initiative (February, 2020), 68% of drinks fridges met the HCGs (facilities with less than two completed audits within a 6-month period, fridges that were no longer in use were removed from the analysis or hidden from customer view), which is an improvement of more than 40% since baseline (May-December 2018), when 24% outlets met HCGs. Overall, availability of ‘red’ drinks decreased from 39 to 11% of all drinks (28 percentage point decrease), and availability of ‘green’ drinks increased from 43 to 63% of all drinks (20 percentage point increase). Appendix 2 summarises the healthiness of drinks available at the facilities involved in the initiative, per facility, per LGA.
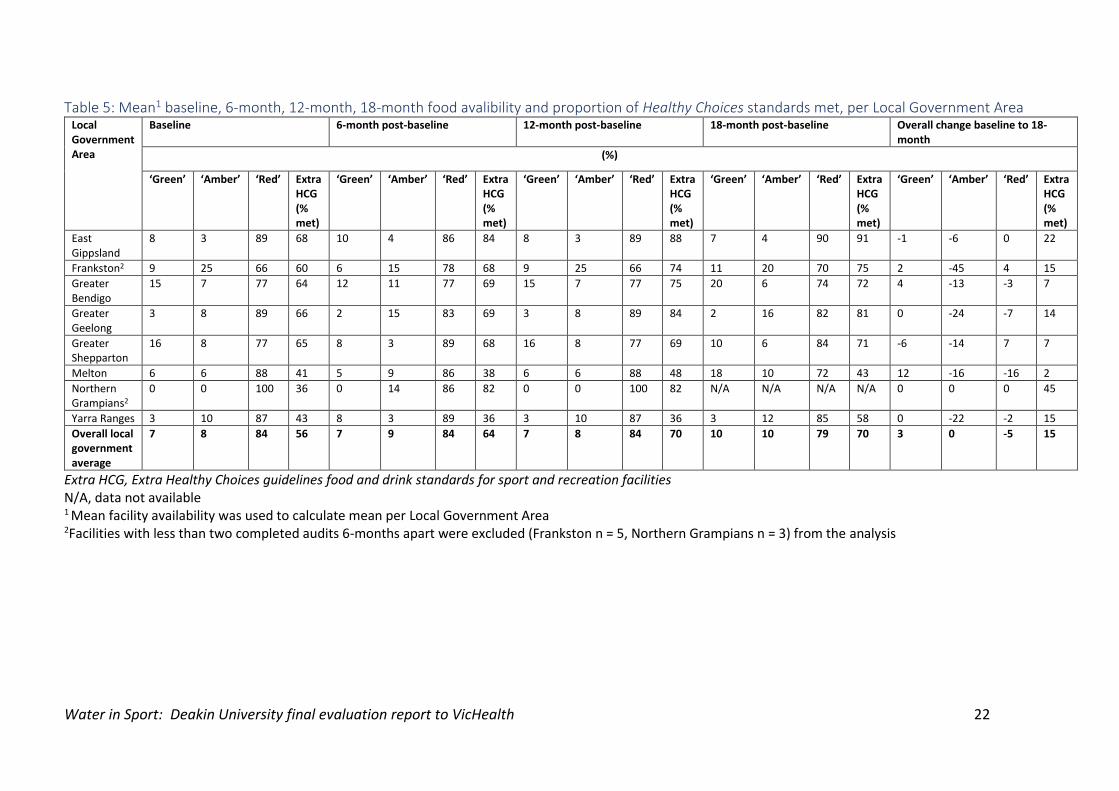
4.3.2. FOOD ENVIRONMENT AUDIT The most recent (February 2020) food and drink environment audit at the sport and recreation and club facilities involved in the initiative are described in Table 5 with results based on audits completed between May 2018 and February 2020. All the facilities audited offered a high proportion of ‘red’ foods and limited ‘green’ foods. The mean proportion of ‘red’ foods available in each LGA was above 60% at each time point. On average across WIS councils, ‘red’ food availability decreased by 5% decrease from baseline (May-December 2018) to the conclusion of the project (February 2020), with a 3% increase in ‘green’ foods available. Appendix 3 summarises the healthiness of food available at the facilities involved in the initiative, per LGA.
1 Assumptions made during the analysis in order to classify the food items reported on the audit as green (‘best choice’), amber (‘choose carefully’) or red (‘limit’). Green: all sandwiches, wraps and salads were; Amber: hot meals, sushi and popcorn; Red: all sausage rolls, pies, pasties, hot chips, other deep fried food, lollies, chocolate bars, cakes, biscuits, muffins, slices, crisps and ice-cream or icy poles
Water in Sport: Deakin University final evaluation report to VicHealth 20
Table 4: Mean1 baseline, 6-month, 12-month, 18-month drink availability and if Healthy Choices guidelines were met, per Local Government Area
1 Mean facility availability was used to calculate mean per local government area
2 Facilities with less than two completed audits 6-months apart were excluded (Frankston n = 5, Northern Grampians n = 3) from the analysis 3 Drink fridges no longer in use where removed from all steps of the analysis (n =10) 4 Drink fridges where the fridges were completely under the counter and out of sight where excluded from the analysis (Frankston n = 1, Yarra Ranges n = 1)
Local Government Area
Baseline 6-month post-baseline 12-month post-baseline 18-month post-baseline Overall percentage point change (baseline to 18-month)
Healthy Choices guidelines met (%)
‘Green’ ‘Amber’ ‘Red’ ‘Green’ ‘Amber’ ‘Red’ ‘Green’ ‘Amber’ ‘Red’ ‘Green’ ‘Amber’ ‘Red’ ‘Green’ ‘Amber’ ‘Red’
East Gippsland
70 16 14 75 17 8 80 16 4 80 16 4 +10 +1 -10
Frankston 2,3,4 31 18 51 47 28 26 65 16 19 61 21 17 +31 +3 -33
Greater Bendigo 3
57 28 16 68 19 13 75 17 8 62 29 9 +6 -1 -7
Greater Geelong 3
48 24 29 51 31 18 64 24 13 53 35 12 +5 +12 -17
Greater Shepparton 3
39 23 39 55 22 23 52 23 26 59 34 7 +14 -1 -13
Melton 3 39 23 38 56 14 30 59 20 21 60 28 12 +21 +5 -27
Northern Grampians
22 3 75 66 9 26 74 11 14 N/A N/A N/A +52 +8 -61
Yarra Ranges 3,4
37 15 48 70 13 17 67 9 25 68 13 19 +31 -1 -29
Overall local government area average
43 19 39 61 19 20 67 17 16 63 25 11 +20 +6 -28
Water in Sport: Deakin University final evaluation report to VicHealth 21
Figure 2: Mean baseline, 6-month, 12-month and 18-month healthiness of drink availability, per Local Government AreaHCG, Healthy Choices guidelines target; 0-m, Baseline; 6-m, 6-month; 12-m, 12-month; 18-m, 18-month 1 Facilities with less than two completed audits 6-months apart were excluded (Frankston n = 5, Northern Grampians n = 3) from the analysis 2 Drink fridges no longer in use where removed from all steps of the analysis (n =10) 3 Drink fridges where the fridges were completely under the counter and out of sight where excluded from the analysis (Frankston n = 1, Yarra Ranges n = 1)
0
10
20
30
40
50
60
70
80
90
100
0-m 6-m 12-m18-m 0-m 6-m 12-m18-m 0-m 6-m 12-m18-m 0-m 6-m 12-m18-m 0-m 6-m 12-m18-m 0-m 6-m 12-m18-m 0-m 6-m 12-m 0-m 6-m 12-m18-m
HCG East Gippsland Frankston Greater Bendigo Greater Geelong Greater Shepparton Melton NorthernGrampians
Yarra Ranges
Pro
po
rtio
n o
f d
rin
ks o
ffer
ed (
%)
Local Government Area and audit time point
'Green' (%) 'Amber' (%) 'Red' (%)
Water in Sport: Deakin University final evaluation report to VicHealth 22
Table 5: Mean1 baseline, 6-month, 12-month, 18-month food avalibility and proportion of Healthy Choices standards met, per Local Government Area Local Government Area
Baseline 6-month post-baseline 12-month post-baseline
18-month post-baseline
Overall change baseline to 18-month
(%)
‘Green’ ‘Amber’ ‘Red’ Extra HCG (% met)
‘Green’ ‘Amber’ ‘Red’ Extra HCG (% met)
‘Green’ ‘Amber’ ‘Red’ Extra HCG (% met)
‘Green’ ‘Amber’ ‘Red’ Extra HCG (% met)
‘Green’ ‘Amber’ ‘Red’ Extra HCG (% met)
East Gippsland
8 3 89 68 10 4 86 84 8 3 89 88 7 4 90 91 -1 -6 0 22
Frankston2 9 25 66 60 6 15 78 68 9 25 66 74 11 20 70 75 2 -45 4 15
Greater Bendigo
15 7 77 64 12 11 77 69 15 7 77 75 20 6 74 72 4 -13 -3 7
Greater Geelong
3 8 89 66 2 15 83 69 3 8 89 84 2 16 82 81 0 -24 -7 14
Greater Shepparton
16 8 77 65 8 3 89 68 16 8 77 69 10 6 84 71 -6 -14 7 7
Melton 6 6 88 41 5 9 86 38 6 6 88 48 18 10 72 43 12 -16 -16 2
Northern Grampians2
0 0 100 36 0 14 86 82 0 0 100 82 N/A N/A N/A N/A 0 0 0 45
Yarra Ranges 3 10 87 43 8 3 89 36 3 10 87 36 3 12 85 58 0 -22 -2 15
Overall local government average
7 8 84 56 7 9 84 64 7 8 84 70 10 10 79 70 3 0 -5 15
Extra HCG, Extra Healthy Choices guidelines food and drink standards for sport and recreation facilities N/A, data not available 1 Mean facility availability was used to calculate mean per Local Government Area
2Facilities with less than two completed audits 6-months apart were excluded (Frankston n = 5, Northern Grampians n = 3) from the analysis
Water in Sport: Deakin University final evaluation report to VicHealth 23
5. Water in Sport policy
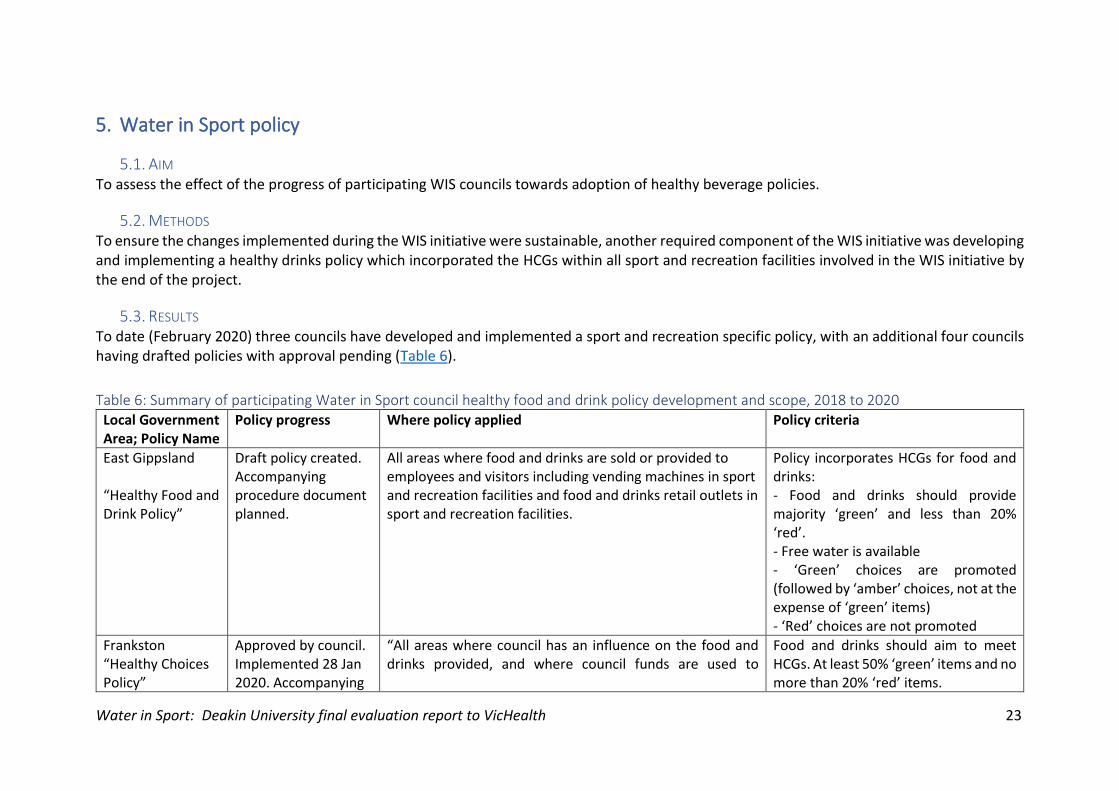
5.1. AIM To assess the effect of the progress of participating WIS councils towards adoption of healthy beverage policies.
5.2. METHODS To ensure the changes implemented during the WIS initiative were sustainable, another required component of the WIS initiative was developing and implementing a healthy drinks policy which incorporated the HCGs within all sport and recreation facilities involved in the WIS initiative by the end of the project.
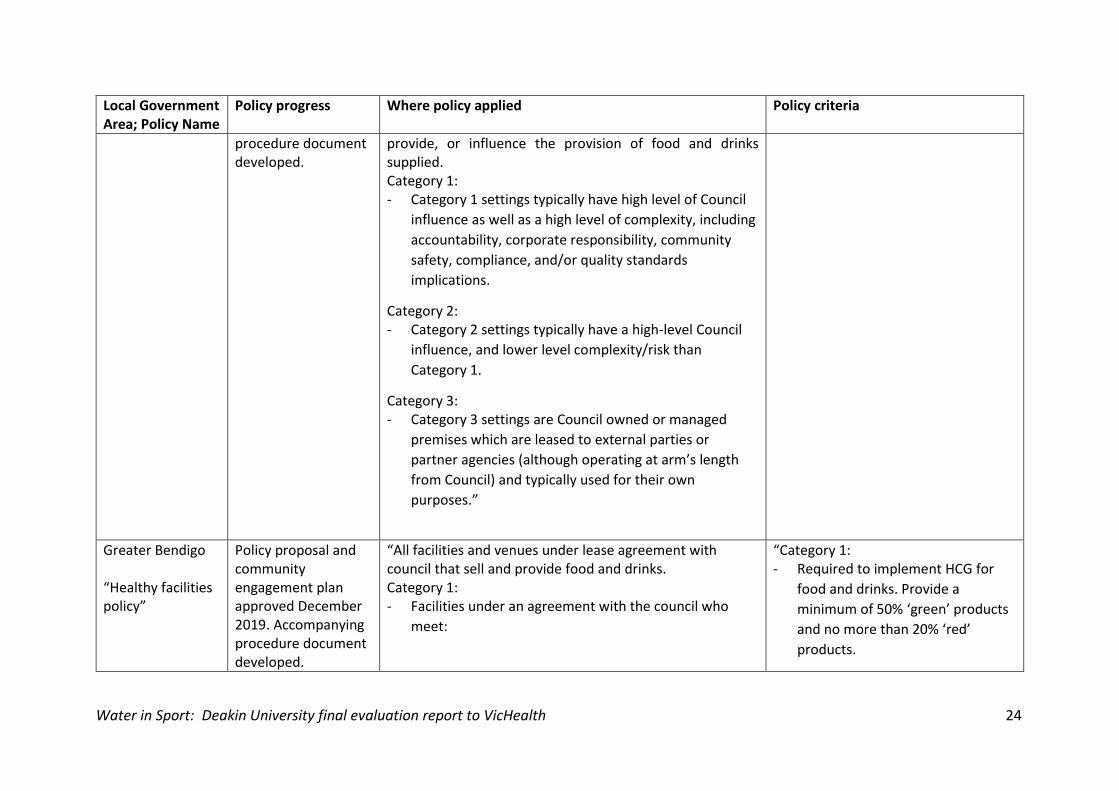
5.3. RESULTS To date (February 2020) three councils have developed and implemented a sport and recreation specific policy, with an additional four councils having drafted policies with approval pending (Table 6).
Table 6: Summary of participating Water in Sport council healthy food and drink policy development and scope, 2018 to 2020 Local Government Area; Policy Name
Policy progress Where policy applied Policy criteria
East Gippsland “Healthy Food and Drink Policy”
Draft policy created. Accompanying procedure document planned.
All areas where food and drinks are sold or provided to employees and visitors including vending machines in sport and recreation facilities and food and drinks retail outlets in sport and recreation facilities.
Policy incorporates HCGs for food and drinks: - Food and drinks should provide majority ‘green’ and less than 20% ‘red’. - Free water is available - ‘Green’ choices are promoted (followed by ‘amber’ choices, not at the expense of ‘green’ items) - ‘Red’ choices are not promoted
Frankston “Healthy Choices Policy”
Approved by council. Implemented 28 Jan 2020. Accompanying
“All areas where council has an influence on the food and drinks provided, and where council funds are used to
Food and drinks should aim to meet HCGs. At least 50% ‘green’ items and no more than 20% ‘red’ items.
Water in Sport: Deakin University final evaluation report to VicHealth 24
Local Government Area; Policy Name
Policy progress Where policy applied Policy criteria
procedure document developed.
provide, or influence the provision of food and drinks supplied. Category 1: - Category 1 settings typically have high level of Council
influence as well as a high level of complexity, including
accountability, corporate responsibility, community
safety, compliance, and/or quality standards
implications.
Category 2: - Category 2 settings typically have a high-level Council
influence, and lower level complexity/risk than
Category 1.
Category 3: - Category 3 settings are Council owned or managed
premises which are leased to external parties or
partner agencies (although operating at arm’s length
from Council) and typically used for their own
purposes.”
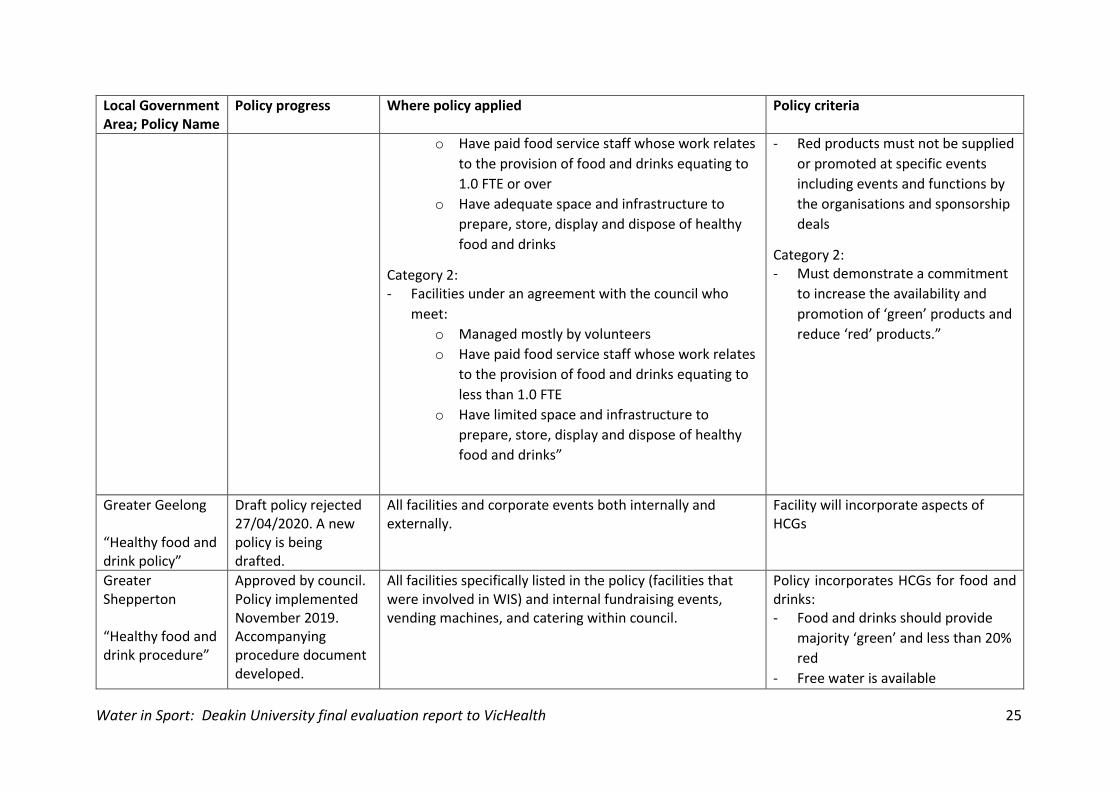
Greater Bendigo “Healthy facilities policy”
Policy proposal and community engagement plan approved December 2019. Accompanying procedure document developed.
“All facilities and venues under lease agreement with council that sell and provide food and drinks. Category 1: - Facilities under an agreement with the council who
meet:
“Category 1: - Required to implement HCG for
food and drinks. Provide a
minimum of 50% ‘green’ products
and no more than 20% ‘red’
products.
Water in Sport: Deakin University final evaluation report to VicHealth 25
Local Government Area; Policy Name
Policy progress Where policy applied Policy criteria
o Have paid food service staff whose work relates
to the provision of food and drinks equating to
1.0 FTE or over
o Have adequate space and infrastructure to
prepare, store, display and dispose of healthy
food and drinks
Category 2: - Facilities under an agreement with the council who
meet:
o Managed mostly by volunteers
o Have paid food service staff whose work relates
to the provision of food and drinks equating to
less than 1.0 FTE
o Have limited space and infrastructure to
prepare, store, display and dispose of healthy
food and drinks”
- Red products must not be supplied
or promoted at specific events
including events and functions by
the organisations and sponsorship
deals
Category 2: - Must demonstrate a commitment
to increase the availability and
promotion of ‘green’ products and
reduce ‘red’ products.”
Greater Geelong “Healthy food and drink policy”
Draft policy rejected 27/04/2020. A new policy is being drafted.
All facilities and corporate events both internally and externally.
Facility will incorporate aspects of HCGs
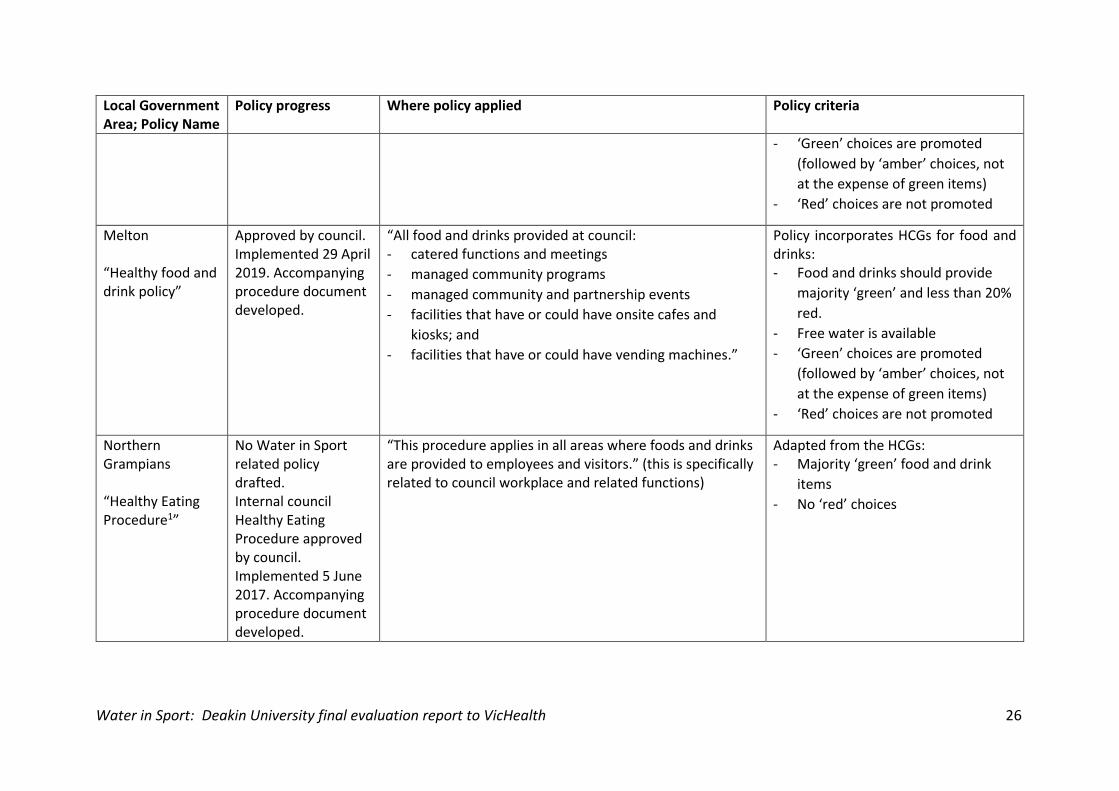
Greater Shepperton “Healthy food and drink procedure”
Approved by council. Policy implemented November 2019. Accompanying procedure document developed.
All facilities specifically listed in the policy (facilities that were involved in WIS) and internal fundraising events, vending machines, and catering within council.
Policy incorporates HCGs for food and drinks: - Food and drinks should provide
majority ‘green’ and less than 20%
red
- Free water is available
Water in Sport: Deakin University final evaluation report to VicHealth 26
Local Government Area; Policy Name
Policy progress Where policy applied Policy criteria
- ‘Green’ choices are promoted
(followed by ‘amber’ choices, not
at the expense of green items)
- ‘Red’ choices are not promoted
Melton “Healthy food and drink policy”
Approved by council. Implemented 29 April 2019. Accompanying procedure document developed.
“All food and drinks provided at council: - catered functions and meetings
- managed community programs
- managed community and partnership events
- facilities that have or could have onsite cafes and
kiosks; and
- facilities that have or could have vending machines.”
Policy incorporates HCGs for food and drinks: - Food and drinks should provide
majority ‘green’ and less than 20%
red.
- Free water is available
- ‘Green’ choices are promoted
(followed by ‘amber’ choices, not
at the expense of green items)
- ‘Red’ choices are not promoted
Northern Grampians “Healthy Eating Procedure1”
No Water in Sport related policy drafted. Internal council Healthy Eating Procedure approved by council. Implemented 5 June 2017. Accompanying procedure document developed.
“This procedure applies in all areas where foods and drinks are provided to employees and visitors.” (this is specifically related to council workplace and related functions)
Adapted from the HCGs: - Majority ‘green’ food and drink
items
- No ‘red’ choices
Water in Sport: Deakin University final evaluation report to VicHealth 27
Local Government Area; Policy Name
Policy progress Where policy applied Policy criteria
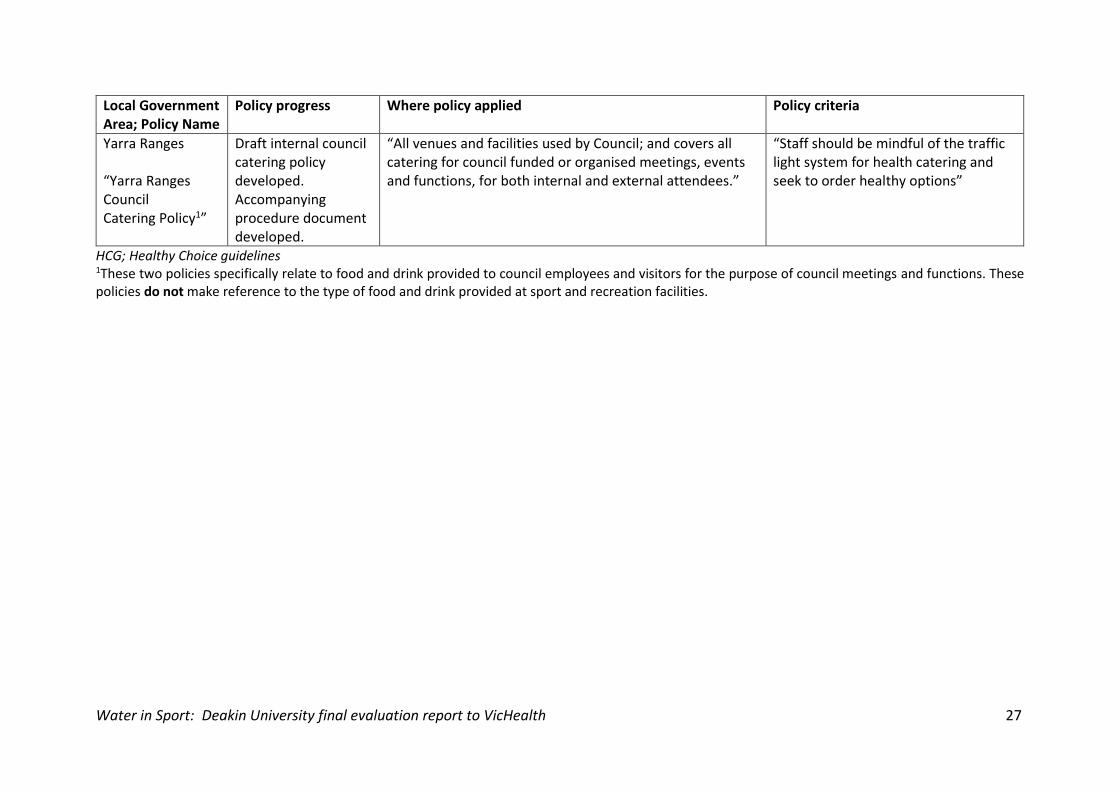
Yarra Ranges “Yarra Ranges Council Catering Policy1”
Draft internal council catering policy developed. Accompanying procedure document developed.
“All venues and facilities used by Council; and covers all catering for council funded or organised meetings, events and functions, for both internal and external attendees.”
“Staff should be mindful of the traffic light system for health catering and seek to order healthy options”
HCG; Healthy Choice guidelines 1These two policies specifically relate to food and drink provided to council employees and visitors for the purpose of council meetings and functions. These policies do not make reference to the type of food and drink provided at sport and recreation facilities.
Water in Sport: Deakin University final evaluation report to VicHealth 28
6. Sales data
6.1. AIM To estimate the effect of the WIS initiative on sales of pre-packaged drinks in sport and recreation and club facilities
6.2. METHODS
6.2.1. STUDY DESIGN Weekly sales data were provided for 32 sport and recreation facilities by 7 of the 8 LGAs from October 2015 to February 2020, where available. No sales data were available from Greater Shepparton facilities or any sporting clubs. Twelve facilities were identified as seasonal (typically outdoor pools or those facilities that exhibited seasonal sales). Eleven of these facilities were closed for part of the year and one facility which was open all year was treated as a seasonal facility because it typically had low sales (<10 drinks sold per week) for months when seasonal facilities were closed. Twenty facilities were open all year round and considered to be non-seasonal. Four of the 12 seasonal facilities were excluded from the analysis: three facilities stopped selling ‘red’ drinks prior to the start of the intervention and one facility did not provide data on the volume of individual drinks for the whole period. Five of the 20 non-seasonal facilities were excluded: one facility provided combined vending machine and drink fridge sales data, three facilities provided insufficient weeks of data prior to the WIS initiative, and one facility appeared to have implemented an a healthy drinks intervention in September 2017 before the start of the WIS initiative in 2018.
6.2.2. PURCHASE DATA Each facility provided electronic weekly sales data for all pre-packaged drinks including type of drink, quantity, volume, and dollar sales value of the purchases. For each facility, we examined: (i) the weekly percentages of ‘red’, ‘amber’ and ‘green’ pre-packaged drinks sold; (ii) the weekly total sales ($) for all pre-packaged drinks; (iii) the percentage of water sold; (iv) free sugar content (g/mL) of each product sold; (v) the total amount of free sugar sold (kg); (vi) percentage volume (L) of all pre-packaged drinks sold; and (vii) total number of units of all pre-packaged drinks sold. Facilities were categorised into: type of facility (canteen, kiosk, and café); size of facility based on the median units of drinks weekly sold during the available data period (<50 drink units, ≥50 drink units per week).
6.2.3. ANALYSIS
6.2.3.1. SEASONAL FACILITIES For the eight seasonal facilities, weekly sales data for the months October to March were included in the analysis. Inside this window, weeks where sales were <5 units per week were also excluded from the analysis. The intervention was assumed to have been implemented between April and October 2018 when the seasonal facilities were closed (i.e. in preparation for the summer season of 2018/19). For each outcome, multilevel linear models were used

Water in Sport: Deakin University final evaluation report to VicHealth 29
to compare the mean weekly sales outcomes before (pre-initiative period: November 2015 to March 2018) and after the start of the initiative (post-initiative period: October 2018 to February 2020. This analysis approach takes into account clustering of weekly data within each facility. All models were adjusted for maximum weekly temperature for each facility and week, obtained from the Bureau of Meteorology website [5]. Percentage outcomes models also adjusted for size of facility.
6.2.3.2. NON-SEASONAL FACILITIES Two approaches were used to estimate the effect of the intervention in non-seasonal facilities: The first approach jointly analysed all 15 included non-seasonal facilities that provided sales data between January 2017 and February 2020. Weeks where unit sales were <5 were excluded from the analysis. A common starting date for the initiative was assumed for all facilities (2 April 2018, as this was before most POs had commenced). The effect of the intervention on each outcome was assessed with a multilevel linear interrupted model, which takes into account clustering of weekly data within facilities, and the autocorrelation over time between weekly sales (a lag of 3 was assumed). The model assumed independent linear trends before and after the initiative start date and allowed for a shift at the time of the initiative start. The evaluation estimated the difference between the actual outcome observed and the predicted outcome that would have been observed if the initiative had not been implemented for the week 24 February - 1 March 2020 (the last week of data available before sales were impacted by COVID-19). In order to isolate the effect of the intervention, the analysis took account of sales trends over time that were unrelated to the Water in Sport initiative, for example whether sales of ‘red’ drinks had been trending down before the intervention started.
The second analysis approach estimated the effect of the intervention on each outcome for each facility separately using a linear interrupted time series model, which takes account of the autocorrelation over time between weekly sales (lag of 3 assumed)1. Five facilities were excluded because they had ≥10 weeks of missing data. For each facility, the intervention was assumed to have started when the project officer was employed by the LGA, with the start date of the intervention varying from 1 March 2018 to 18 June 2018. When the date of PO start date was unknown, it was assumed the initiative started the first week of the following month of employment. All analyses were conducted assuming that every facility that provided data participated in the intervention (‘intention to treat’ approach), regardless of how well the initiative was implemented. All analyses were performed in Stata 16.1.
6.3. RESULTS
6.3.1. SEASONAL FACILITIES
In the analysis, facilities provided an average of 43 weeks of sales data pre-intervention and 29 weeks post-intervention. Five of the seasonal facilities were canteens and three were
Water in Sport: Deakin University final evaluation report to VicHealth 30
kiosks, with five of the facilities selling <50 drink units each week based on the median number of sales in the study period.
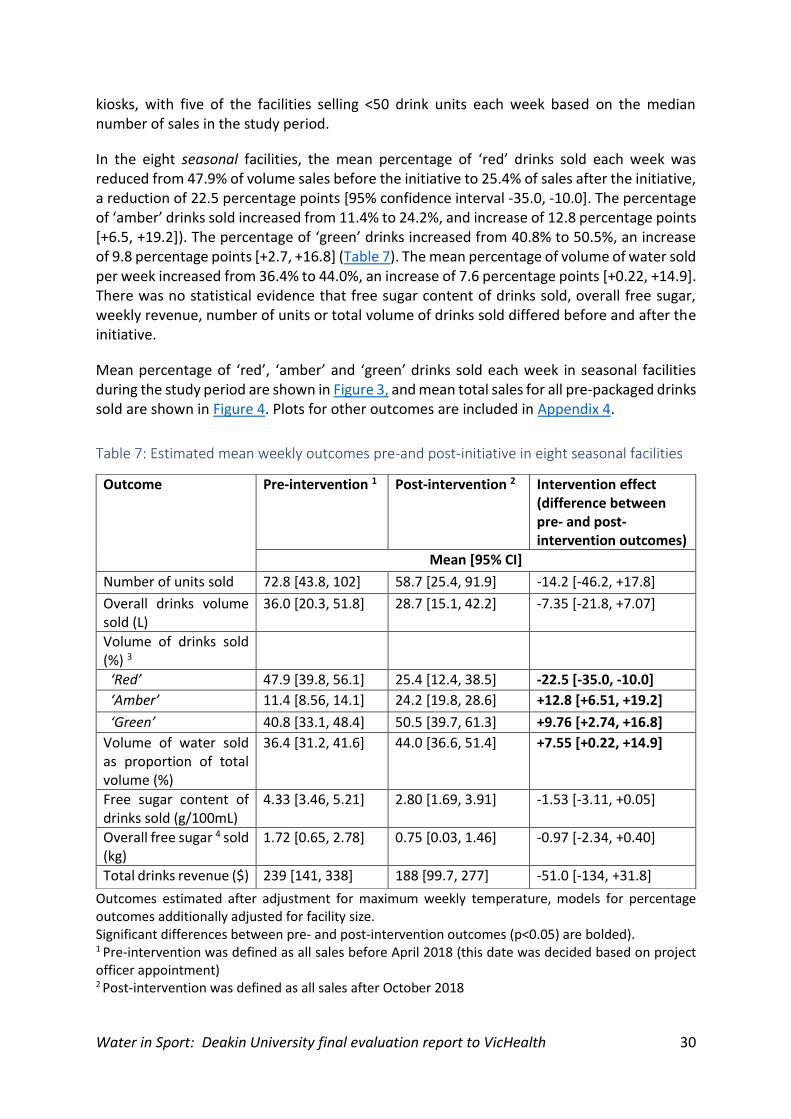
In the eight seasonal facilities, the mean percentage of ‘red’ drinks sold each week was reduced from 47.9% of volume sales before the initiative to 25.4% of sales after the initiative, a reduction of 22.5 percentage points [95% confidence interval -35.0, -10.0]. The percentage of ‘amber’ drinks sold increased from 11.4% to 24.2%, and increase of 12.8 percentage points [+6.5, +19.2]). The percentage of ‘green’ drinks increased from 40.8% to 50.5%, an increase of 9.8 percentage points [+2.7, +16.8] (Table 7). The mean percentage of volume of water sold per week increased from 36.4% to 44.0%, an increase of 7.6 percentage points [+0.22, +14.9]. There was no statistical evidence that free sugar content of drinks sold, overall free sugar, weekly revenue, number of units or total volume of drinks sold differed before and after the initiative.
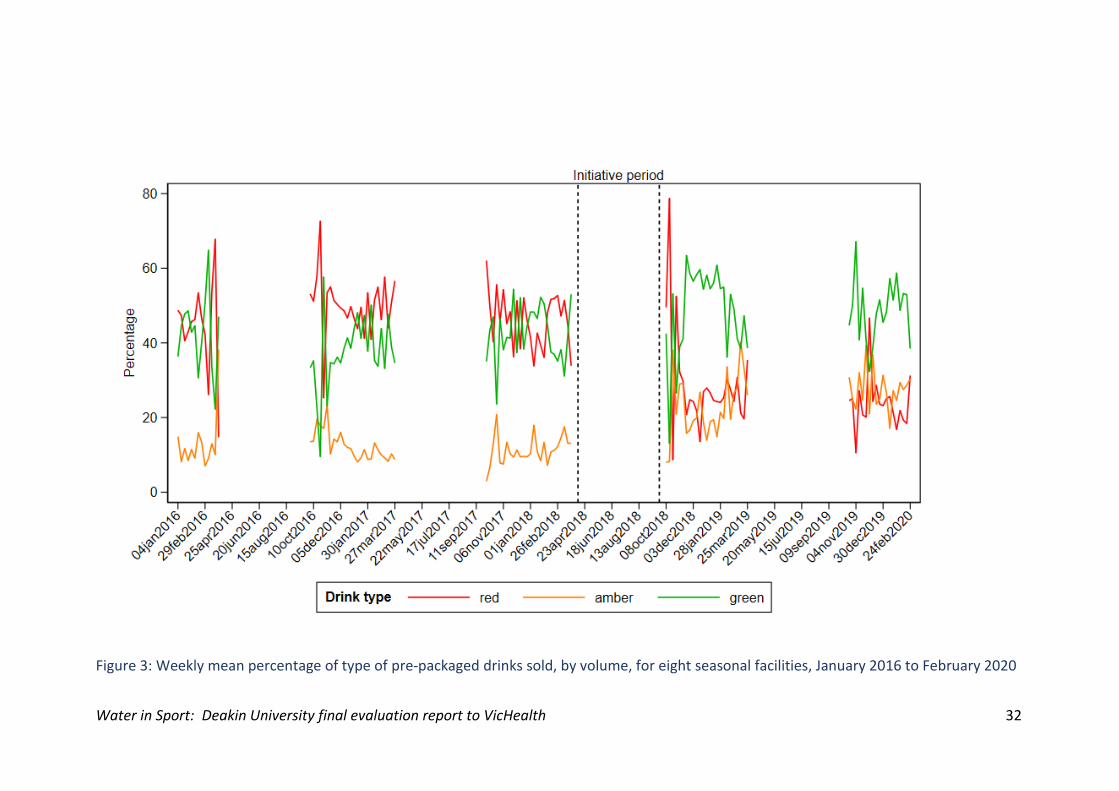
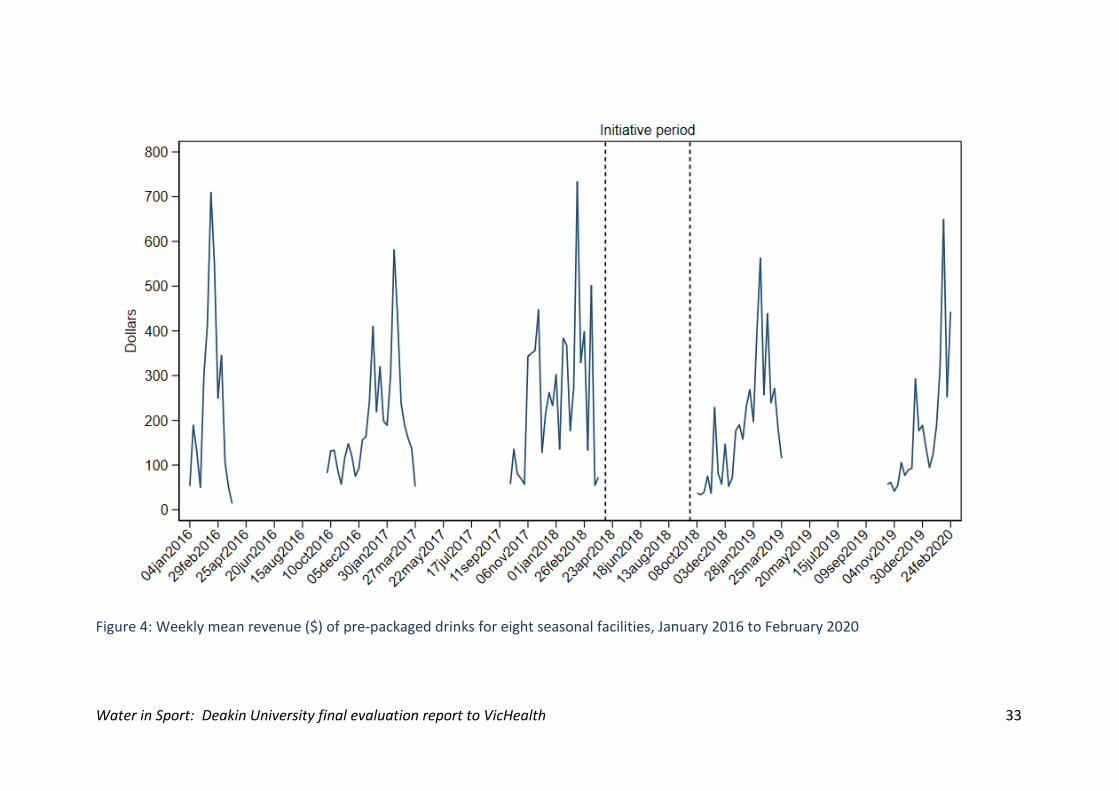
Mean percentage of ‘red’, ‘amber’ and ‘green’ drinks sold each week in seasonal facilities during the study period are shown in Figure 3, and mean total sales for all pre-packaged drinks sold are shown in Figure 4. Plots for other outcomes are included in Appendix 4.
Table 7: Estimated mean weekly outcomes pre-and post-initiative in eight seasonal facilities
Outcomes estimated after adjustment for maximum weekly temperature, models for percentage outcomes additionally adjusted for facility size. Significant differences between pre- and post-intervention outcomes (p<0.05) are bolded). 1 Pre-intervention was defined as all sales before April 2018 (this date was decided based on project officer appointment) 2 Post-intervention was defined as all sales after October 2018
Outcome Pre-intervention 1 Post-intervention 2 Intervention effect (difference between pre- and post-intervention outcomes)
Mean [95% CI]
Number of units sold 72.8 [43.8, 102] 58.7 [25.4, 91.9] -14.2 [-46.2, +17.8]
Overall drinks volume sold (L)
36.0 [20.3, 51.8] 28.7 [15.1, 42.2] -7.35 [-21.8, +7.07]
Volume of drinks sold (%) 3
‘Red’ 47.9 [39.8, 56.1] 25.4 [12.4, 38.5] -22.5 [-35.0, -10.0]
‘Amber’ 11.4 [8.56, 14.1] 24.2 [19.8, 28.6] +12.8 [+6.51, +19.2]
‘Green’ 40.8 [33.1, 48.4] 50.5 [39.7, 61.3] +9.76 [+2.74, +16.8]
Volume of water sold as proportion of total volume (%)
36.4 [31.2, 41.6] 44.0 [36.6, 51.4] +7.55 [+0.22, +14.9]
Free sugar content of drinks sold (g/100mL)
4.33 [3.46, 5.21] 2.80 [1.69, 3.91] -1.53 [-3.11, +0.05]
Overall free sugar 4 sold (kg)
1.72 [0.65, 2.78] 0.75 [0.03, 1.46] -0.97 [-2.34, +0.40]
Total drinks revenue ($) 239 [141, 338] 188 [99.7, 277] -51.0 [-134, +31.8]
Water in Sport: Deakin University final evaluation report to VicHealth 31
3 Drinks were defined as ‘green’ (best choice), ‘amber’ (choose carefully) and ‘red’ (limit) using the Healthy Eating Advisory Service’s FoodChecker tool 4 Free sugar was defined as sugar added to drinks by the manufacturer, plus the sugars that are naturally present in honey, syrups and fruit juices.
Water in Sport: Deakin University final evaluation report to VicHealth 32
Figure 3: Weekly mean percentage of type of pre-packaged drinks sold, by volume, for eight seasonal facilities, January 2016 to February 2020
Water in Sport: Deakin University final evaluation report to VicHealth 33
Figure 4: Weekly mean revenue ($) of pre-packaged drinks for eight seasonal facilities, January 2016 to February 2020
Water in Sport: Deakin University final evaluation report to VicHealth 34
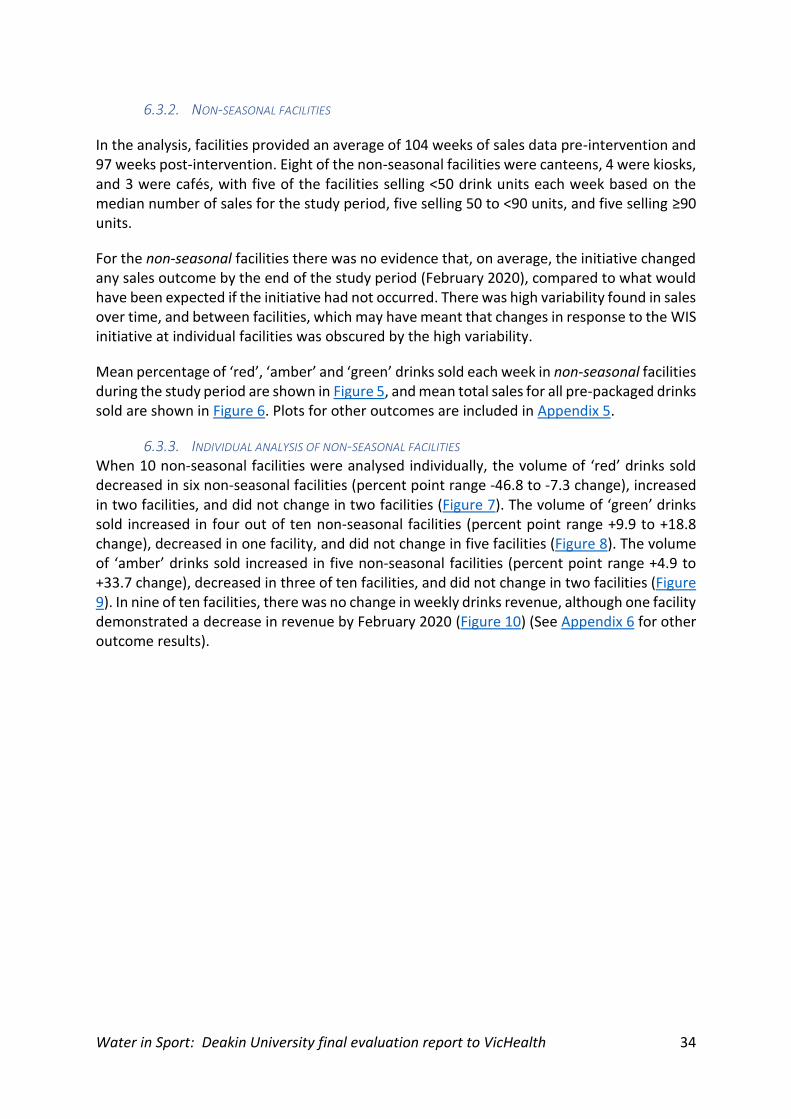
6.3.2. NON-SEASONAL FACILITIES
In the analysis, facilities provided an average of 104 weeks of sales data pre-intervention and 97 weeks post-intervention. Eight of the non-seasonal facilities were canteens, 4 were kiosks, and 3 were cafés, with five of the facilities selling <50 drink units each week based on the median number of sales for the study period, five selling 50 to <90 units, and five selling ≥90 units.
For the non-seasonal facilities there was no evidence that, on average, the initiative changed any sales outcome by the end of the study period (February 2020), compared to what would have been expected if the initiative had not occurred. There was high variability found in sales over time, and between facilities, which may have meant that changes in response to the WIS initiative at individual facilities was obscured by the high variability.
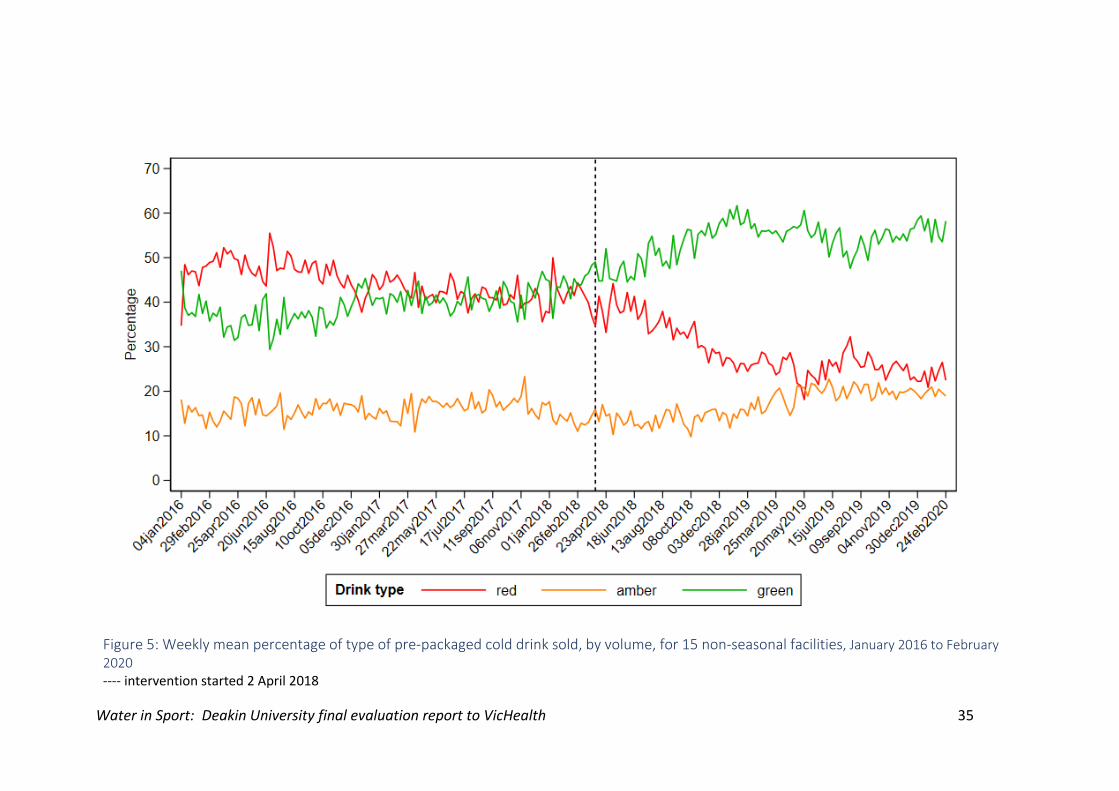
Mean percentage of ‘red’, ‘amber’ and ‘green’ drinks sold each week in non-seasonal facilities during the study period are shown in Figure 5, and mean total sales for all pre-packaged drinks sold are shown in Figure 6. Plots for other outcomes are included in Appendix 5.
6.3.3. INDIVIDUAL ANALYSIS OF NON-SEASONAL FACILITIES When 10 non-seasonal facilities were analysed individually, the volume of ‘red’ drinks sold decreased in six non-seasonal facilities (percent point range -46.8 to -7.3 change), increased in two facilities, and did not change in two facilities (Figure 7). The volume of ‘green’ drinks sold increased in four out of ten non-seasonal facilities (percent point range +9.9 to +18.8 change), decreased in one facility, and did not change in five facilities (Figure 8). The volume of ‘amber’ drinks sold increased in five non-seasonal facilities (percent point range +4.9 to +33.7 change), decreased in three of ten facilities, and did not change in two facilities (Figure 9). In nine of ten facilities, there was no change in weekly drinks revenue, although one facility demonstrated a decrease in revenue by February 2020 (Figure 10) (See Appendix 6 for other outcome results).
Water in Sport: Deakin University final evaluation report to VicHealth 35
Figure 5: Weekly mean percentage of type of pre-packaged cold drink sold, by volume, for 15 non-seasonal facilities, January 2016 to February 2020 ---- intervention started 2 April 2018
Water in Sport: Deakin University final evaluation report to VicHealth 36
Figure 6: Weekly mean revenue ($) of pre-packaged drinks for 15 non-seasonal facilities, January 2016 to February 2020 ---- intervention started 2 April 2018
Water in Sport: Deakin University final evaluation report to VicHealth 37
Figure 7: Percentage point change in ‘red’ pre-packaged drinks sold, by volume, in non-seasonal facilities by February 2020
Figure 8: Percentage point change in ‘amber’ pre-packaged drinks sold, by volume, in non-seasonal facilities by February 2020
Water in Sport: Deakin University final evaluation report to VicHealth 38
Figure 9: Percentage point change in ‘green’ pre-packaged drinks sold, by volume, in non-seasonal facilities by February 2020
Figure 10: Change in pre-packaged drinks revenue ($) in non-seasonal facilities by February
2020
Water in Sport: Deakin University final evaluation report to VicHealth 39
7. Victorian local government survey
7.1. AIM To compare change in policies, attitudes, and practices of WIS and other LGAs in Victoria relating to obesity prevention and the provision of healthy food in their sport and recreation facilities.
7.2. METHODS An online cross‐sectional survey was emailed to all 79 Victorian LGAs in July 2018 and again in July 2020. Questions were informed by a previously developed policy implementation and adoption survey designed for sport and recreation facilities in Canada [6]. Survey questions explored: 1) the types of facilities that sold food or drink owned and/or managed by the LG, and any changes made to improve the healthiness of food and drink provision to date; 2) the priority given to obesity prevention and the removal of sugary drinks from facilities; and 3) barriers and enablers to change. Minor amendment were made to the baseline survey (Appendix 7) for the follow-up survey (Appendix 8).
7.2.1. ANALYSIS The analysis for this report was restricted to the 8 WIS and 18 non-WIS councils (those not involved in the WIS initiative) who completed surveys at both baseline and follow-up to facilitate comparison of changes over time. Questions regarding LGA policies and actions related to healthy food and drinks were different at the baseline and follow-up survey. Therefore, no analysis of change over time in policies and actions is presented. Demographic characteristics and healthy retail actions were compared between WIS and non-WIS councils using Wilcoxon rank-sum test (for ordinal or continuous data) or Pearson chi squared test for categorical data. Changes in the priority given to healthy eating between surveys were assessed using linear regression with clustering at the local government level. This allowed the differences between WIS and non-WIS councils to be compared at each survey timepoint.
7.3. RESULTS Participating council demographic characteristics Participating WIS (n = 8) and non-WIS councils (n = 18) were similar in socioeconomic position by area (SEIFA) decile, population size and rurality (Table 8). They were also reflective of overall Victorian local government characteristics regarding remoteness and SEIFA by area. WIS councils had a higher population compared to non-WIS councils.
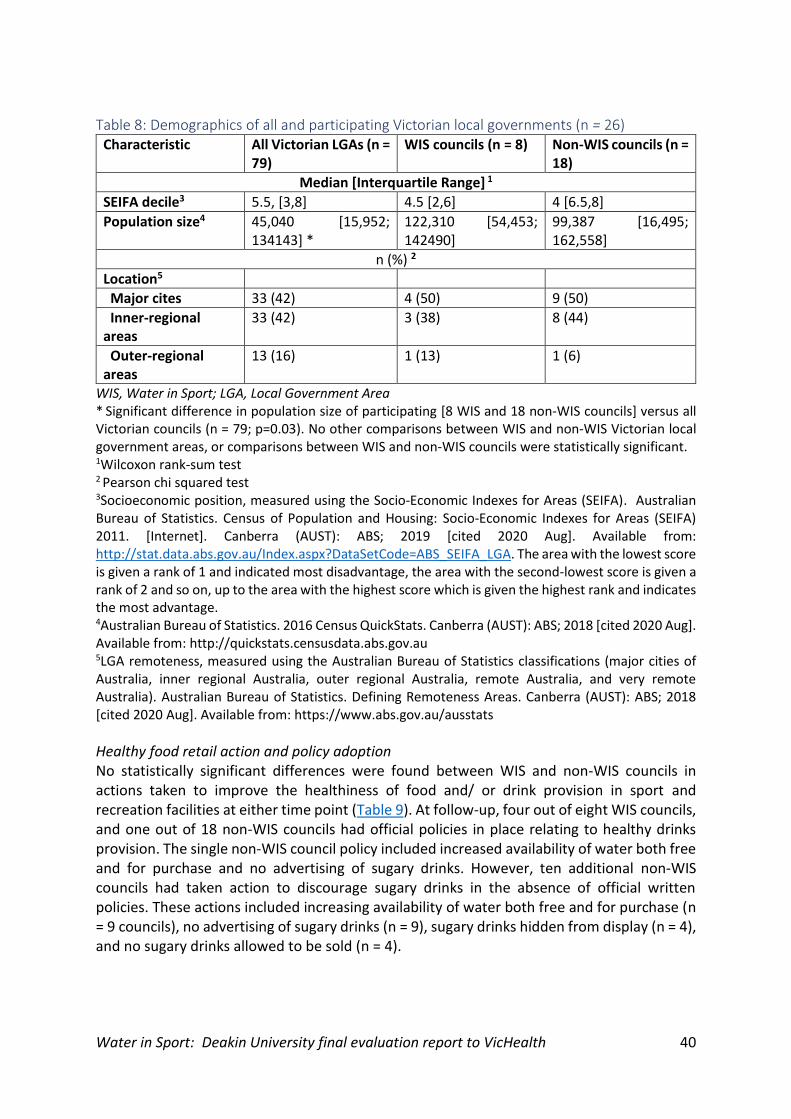
Water in Sport: Deakin University final evaluation report to VicHealth 40
Table 8: Demographics of all and participating Victorian local governments (n = 26) Characteristic All Victorian LGAs (n =
79) WIS councils (n = 8) Non-WIS councils (n =
18)
Median [Interquartile Range] 1
SEIFA decile3 5.5, [3,8] 4.5 [2,6] 4 [6.5,8]
Population size4 45,040 [15,952; 134143] *
122,310 [54,453; 142490]
99,387 [16,495; 162,558]
n (%) 2
Location5
Major cites 33 (42) 4 (50) 9 (50)
Inner-regional areas
33 (42) 3 (38) 8 (44)
Outer-regional areas
13 (16) 1 (13) 1 (6)
WIS, Water in Sport; LGA, Local Government Area * Significant difference in population size of participating [8 WIS and 18 non-WIS councils] versus all Victorian councils (n = 79; p=0.03). No other comparisons between WIS and non-WIS Victorian local government areas, or comparisons between WIS and non-WIS councils were statistically significant. 1Wilcoxon rank-sum test
2 Pearson chi squared test 3Socioeconomic position, measured using the Socio‐Economic Indexes for Areas (SEIFA). Australian Bureau of Statistics. Census of Population and Housing: Socio-Economic Indexes for Areas (SEIFA) 2011. [Internet]. Canberra (AUST): ABS; 2019 [cited 2020 Aug]. Available from: http://stat.data.abs.gov.au/Index.aspx?DataSetCode=ABS_SEIFA_LGA. The area with the lowest score is given a rank of 1 and indicated most disadvantage, the area with the second-lowest score is given a rank of 2 and so on, up to the area with the highest score which is given the highest rank and indicates the most advantage. 4Australian Bureau of Statistics. 2016 Census QuickStats. Canberra (AUST): ABS; 2018 [cited 2020 Aug]. Available from: http://quickstats.censusdata.abs.gov.au 5LGA remoteness, measured using the Australian Bureau of Statistics classifications (major cities of Australia, inner regional Australia, outer regional Australia, remote Australia, and very remote Australia). Australian Bureau of Statistics. Defining Remoteness Areas. Canberra (AUST): ABS; 2018 [cited 2020 Aug]. Available from: https://www.abs.gov.au/ausstats
Healthy food retail action and policy adoption No statistically significant differences were found between WIS and non-WIS councils in actions taken to improve the healthiness of food and/ or drink provision in sport and recreation facilities at either time point (Table 9). At follow-up, four out of eight WIS councils, and one out of 18 non-WIS councils had official policies in place relating to healthy drinks provision. The single non-WIS council policy included increased availability of water both free and for purchase and no advertising of sugary drinks. However, ten additional non-WIS councils had taken action to discourage sugary drinks in the absence of official written policies. These actions included increasing availability of water both free and for purchase (n = 9 councils), no advertising of sugary drinks (n = 9), sugary drinks hidden from display (n = 4), and no sugary drinks allowed to be sold (n = 4).
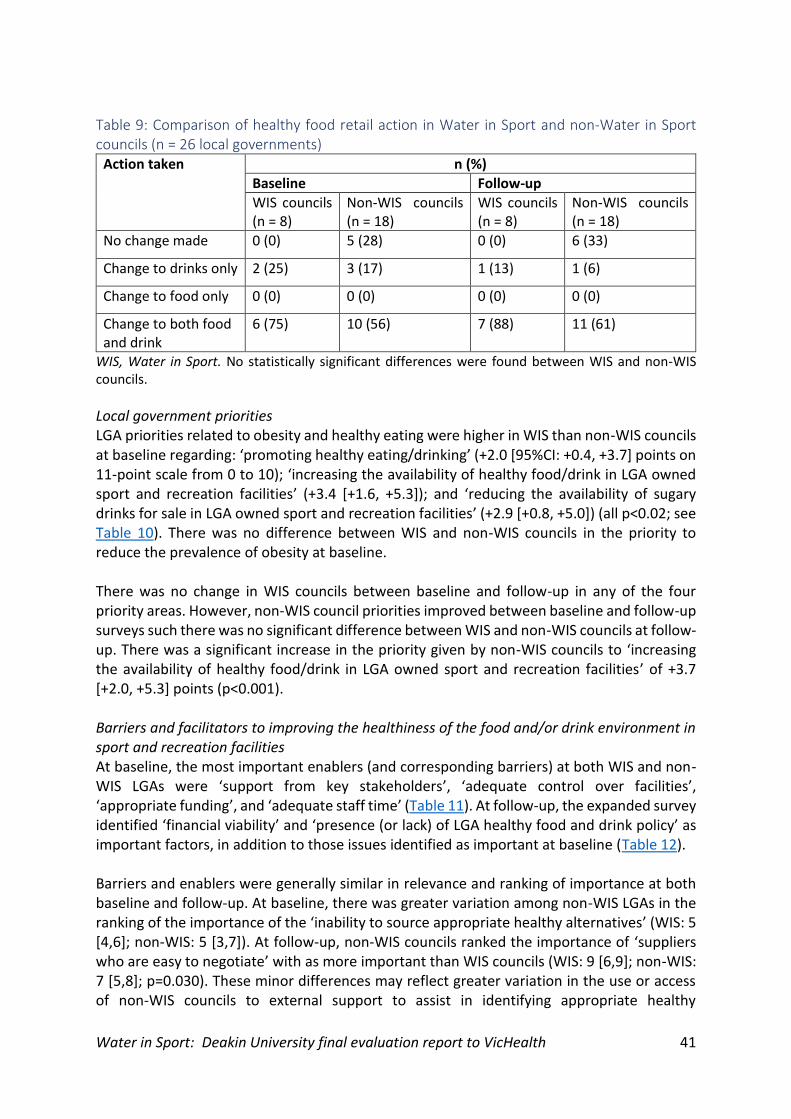
Water in Sport: Deakin University final evaluation report to VicHealth 41
Table 9: Comparison of healthy food retail action in Water in Sport and non-Water in Sport councils (n = 26 local governments)
Action taken n (%)
Baseline Follow-up
WIS councils (n = 8)
Non-WIS councils (n = 18)
WIS councils (n = 8)
Non-WIS councils (n = 18)
No change made 0 (0) 5 (28) 0 (0) 6 (33)
Change to drinks only 2 (25) 3 (17) 1 (13) 1 (6)
Change to food only 0 (0) 0 (0) 0 (0) 0 (0)
Change to both food and drink
6 (75) 10 (56) 7 (88) 11 (61)
WIS, Water in Sport. No statistically significant differences were found between WIS and non-WIS councils.
Local government priorities LGA priorities related to obesity and healthy eating were higher in WIS than non-WIS councils at baseline regarding: ‘promoting healthy eating/drinking’ (+2.0 [95%CI: +0.4, +3.7] points on 11-point scale from 0 to 10); ‘increasing the availability of healthy food/drink in LGA owned sport and recreation facilities’ (+3.4 [+1.6, +5.3]); and ‘reducing the availability of sugary drinks for sale in LGA owned sport and recreation facilities’ (+2.9 [+0.8, +5.0]) (all p<0.02; see Table 10). There was no difference between WIS and non-WIS councils in the priority to reduce the prevalence of obesity at baseline. There was no change in WIS councils between baseline and follow-up in any of the four priority areas. However, non-WIS council priorities improved between baseline and follow-up surveys such there was no significant difference between WIS and non-WIS councils at follow-up. There was a significant increase in the priority given by non-WIS councils to ‘increasing the availability of healthy food/drink in LGA owned sport and recreation facilities’ of +3.7 [+2.0, +5.3] points (p<0.001). Barriers and facilitators to improving the healthiness of the food and/or drink environment in sport and recreation facilities At baseline, the most important enablers (and corresponding barriers) at both WIS and non-WIS LGAs were ‘support from key stakeholders’, ‘adequate control over facilities’, ‘appropriate funding’, and ‘adequate staff time’ (Table 11). At follow-up, the expanded survey identified ‘financial viability’ and ‘presence (or lack) of LGA healthy food and drink policy’ as important factors, in addition to those issues identified as important at baseline (Table 12). Barriers and enablers were generally similar in relevance and ranking of importance at both baseline and follow-up. At baseline, there was greater variation among non-WIS LGAs in the ranking of the importance of the ‘inability to source appropriate healthy alternatives’ (WIS: 5 [4,6]; non-WIS: 5 [3,7]). At follow-up, non-WIS councils ranked the importance of ‘suppliers who are easy to negotiate’ with as more important than WIS councils (WIS: 9 [6,9]; non-WIS: 7 [5,8]; p=0.030). These minor differences may reflect greater variation in the use or access of non-WIS councils to external support to assist in identifying appropriate healthy
Water in Sport: Deakin University final evaluation report to VicHealth 42
alternatives or advise on negotiating with suppliers. Eleven non-WIS councils described having received external support to implement healthy changes: seven facilities had collaborated with or received support from their local primary care partnership or healthcare service, three had received support from their YMCA service provider, and two had received help from dietetics students.
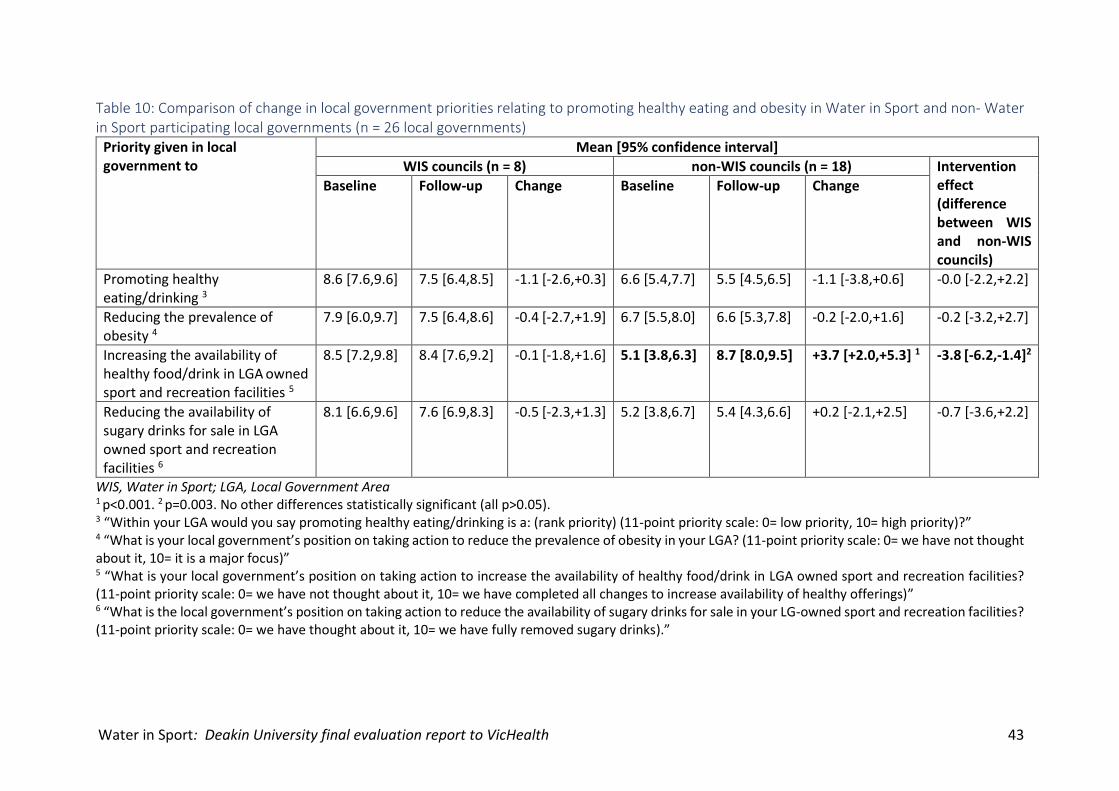
Water in Sport: Deakin University final evaluation report to VicHealth 43
Table 10: Comparison of change in local government priorities relating to promoting healthy eating and obesity in Water in Sport and non- Water in Sport participating local governments (n = 26 local governments)
Priority given in local government to
Mean [95% confidence interval]
WIS councils (n = 8) non-WIS councils (n = 18) Intervention effect (difference between WIS and non-WIS councils)
Baseline Follow-up Change Baseline Follow-up Change
Promoting healthy eating/drinking 3
8.6 [7.6,9.6] 7.5 [6.4,8.5] -1.1 [-2.6,+0.3] 6.6 [5.4,7.7] 5.5 [4.5,6.5] -1.1 [-3.8,+0.6] -0.0 [-2.2,+2.2]
Reducing the prevalence of obesity 4
7.9 [6.0,9.7] 7.5 [6.4,8.6] -0.4 [-2.7,+1.9] 6.7 [5.5,8.0] 6.6 [5.3,7.8] -0.2 [-2.0,+1.6] -0.2 [-3.2,+2.7]
Increasing the availability of healthy food/drink in LGA owned sport and recreation facilities 5
8.5 [7.2,9.8] 8.4 [7.6,9.2] -0.1 [-1.8,+1.6] 5.1 [3.8,6.3] 8.7 [8.0,9.5] +3.7 [+2.0,+5.3] 1 -3.8 [-6.2,-1.4]2
Reducing the availability of sugary drinks for sale in LGA owned sport and recreation facilities 6
8.1 [6.6,9.6] 7.6 [6.9,8.3] -0.5 [-2.3,+1.3] 5.2 [3.8,6.7] 5.4 [4.3,6.6] +0.2 [-2.1,+2.5] -0.7 [-3.6,+2.2]
WIS, Water in Sport; LGA, Local Government Area 1 p<0.001. 2 p=0.003. No other differences statistically significant (all p>0.05). 3 “Within your LGA would you say promoting healthy eating/drinking is a: (rank priority) (11-point priority scale: 0= low priority, 10= high priority)?” 4 “What is your local government’s position on taking action to reduce the prevalence of obesity in your LGA? (11-point priority scale: 0= we have not thought about it, 10= it is a major focus)” 5 “What is your local government’s position on taking action to increase the availability of healthy food/drink in LGA owned sport and recreation facilities? (11-point priority scale: 0= we have not thought about it, 10= we have completed all changes to increase availability of healthy offerings)”
6 “What is the local government’s position on taking action to reduce the availability of sugary drinks for sale in your LG-owned sport and recreation facilities? (11-point priority scale: 0= we have thought about it, 10= we have fully removed sugary drinks).”
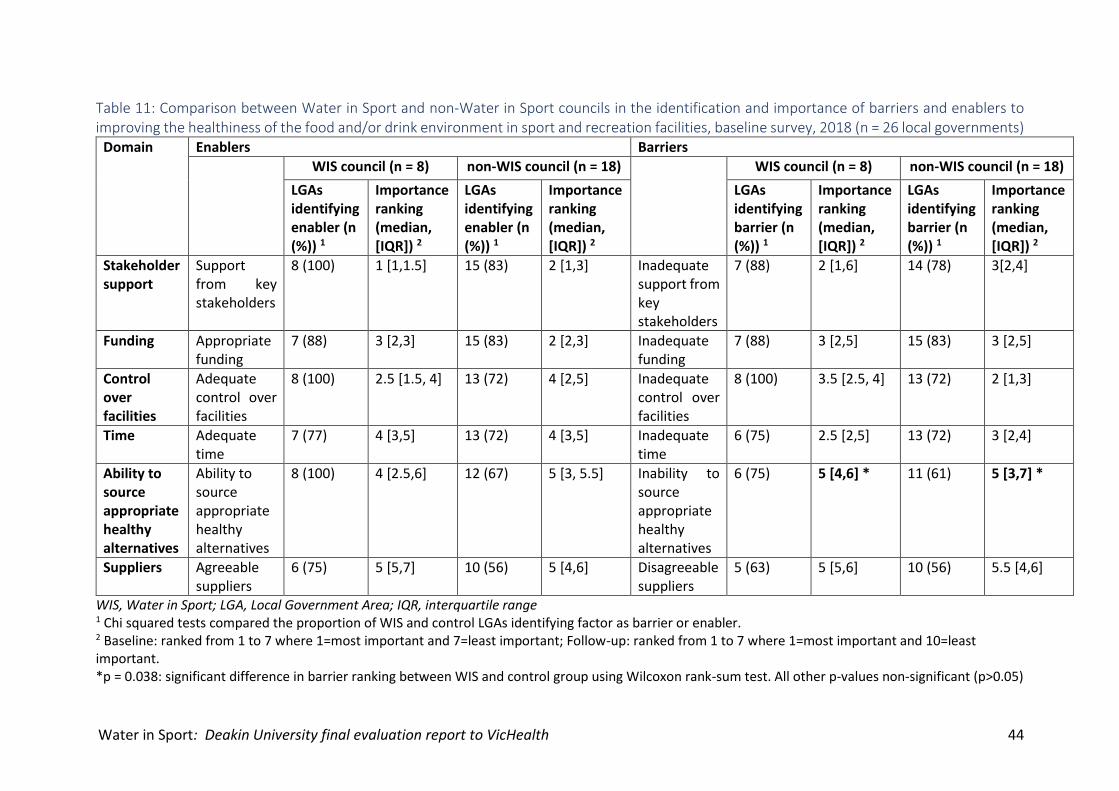
Water in Sport: Deakin University final evaluation report to VicHealth 44
Table 11: Comparison between Water in Sport and non-Water in Sport councils in the identification and importance of barriers and enablers to improving the healthiness of the food and/or drink environment in sport and recreation facilities, baseline survey, 2018 (n = 26 local governments)
Domain Enablers Barriers
WIS council (n = 8) non-WIS council (n = 18) WIS council (n = 8) non-WIS council (n = 18)
LGAs identifying enabler (n (%)) 1
Importance ranking
(median, [IQR]) 2
LGAs identifying enabler (n (%)) 1
Importance ranking
(median, [IQR]) 2
LGAs identifying barrier (n (%)) 1
Importance ranking
(median, [IQR]) 2
LGAs identifying barrier (n (%)) 1
Importance ranking
(median, [IQR]) 2
Stakeholder support
Support from key stakeholders
8 (100) 1 [1,1.5] 15 (83) 2 [1,3] Inadequate support from key stakeholders
7 (88) 2 [1,6] 14 (78) 3[2,4]
Funding Appropriate funding
7 (88) 3 [2,3] 15 (83) 2 [2,3] Inadequate funding
7 (88) 3 [2,5] 15 (83) 3 [2,5]
Control over facilities
Adequate control over facilities
8 (100) 2.5 [1.5, 4] 13 (72) 4 [2,5] Inadequate control over facilities
8 (100) 3.5 [2.5, 4] 13 (72) 2 [1,3]
Time Adequate time
7 (77) 4 [3,5] 13 (72) 4 [3,5] Inadequate time
6 (75) 2.5 [2,5] 13 (72) 3 [2,4]
Ability to source appropriate healthy alternatives
Ability to source appropriate healthy alternatives
8 (100) 4 [2.5,6] 12 (67) 5 [3, 5.5] Inability to source appropriate healthy alternatives
6 (75) 5 [4,6] * 11 (61) 5 [3,7] *
Suppliers Agreeable suppliers
6 (75) 5 [5,7] 10 (56) 5 [4,6] Disagreeable suppliers
5 (63) 5 [5,6] 10 (56) 5.5 [4,6]
WIS, Water in Sport; LGA, Local Government Area; IQR, interquartile range 1 Chi squared tests compared the proportion of WIS and control LGAs identifying factor as barrier or enabler. 2 Baseline: ranked from 1 to 7 where 1=most important and 7=least important; Follow-up: ranked from 1 to 7 where 1=most important and 10=least important. *p = 0.038: significant difference in barrier ranking between WIS and control group using Wilcoxon rank-sum test. All other p-values non-significant (p>0.05)
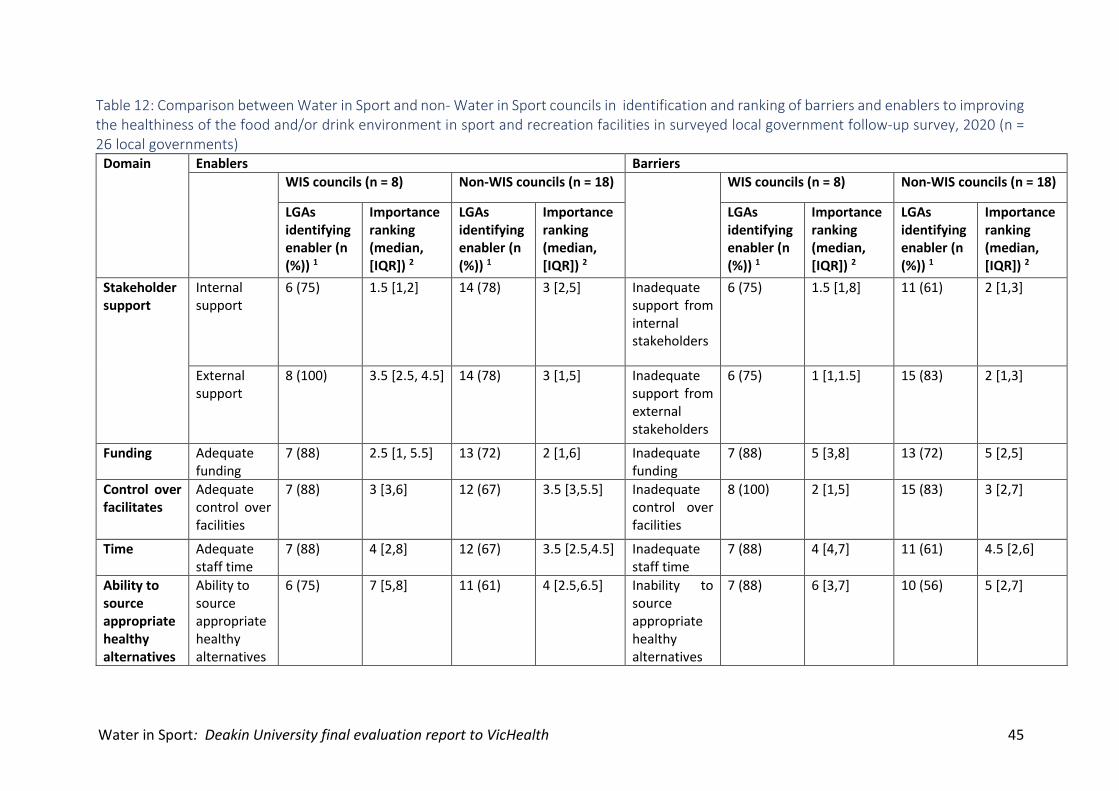
Water in Sport: Deakin University final evaluation report to VicHealth 45
Table 12: Comparison between Water in Sport and non- Water in Sport councils in identification and ranking of barriers and enablers to improving the healthiness of the food and/or drink environment in sport and recreation facilities in surveyed local government follow-up survey, 2020 (n = 26 local governments)
Domain Enablers Barriers
WIS councils (n = 8) Non-WIS councils (n = 18) WIS councils (n = 8) Non-WIS councils (n = 18)
LGAs identifying enabler (n (%)) 1
Importance ranking
(median, [IQR]) 2
LGAs identifying enabler (n (%)) 1
Importance ranking
(median, [IQR]) 2
LGAs identifying enabler (n (%)) 1
Importance ranking
(median, [IQR]) 2
LGAs identifying enabler (n (%)) 1
Importance ranking
(median, [IQR]) 2
Stakeholder support
Internal support
6 (75) 1.5 [1,2] 14 (78) 3 [2,5] Inadequate support from internal stakeholders
6 (75) 1.5 [1,8] 11 (61) 2 [1,3]
External support
8 (100) 3.5 [2.5, 4.5] 14 (78) 3 [1,5] Inadequate support from external stakeholders
6 (75) 1 [1,1.5] 15 (83) 2 [1,3]
Funding Adequate funding
7 (88) 2.5 [1, 5.5] 13 (72) 2 [1,6] Inadequate funding
7 (88) 5 [3,8] 13 (72) 5 [2,5]
Control over facilitates
Adequate control over facilities
7 (88) 3 [3,6] 12 (67) 3.5 [3,5.5] Inadequate control over facilities
8 (100) 2 [1,5] 15 (83) 3 [2,7]
Time Adequate staff time
7 (88) 4 [2,8] 12 (67) 3.5 [2.5,4.5] Inadequate staff time
7 (88) 4 [4,7] 11 (61) 4.5 [2,6]
Ability to source appropriate healthy alternatives
Ability to source appropriate healthy alternatives
6 (75) 7 [5,8] 11 (61) 4 [2.5,6.5] Inability to source appropriate healthy alternatives
7 (88) 6 [3,7] 10 (56) 5 [2,7]
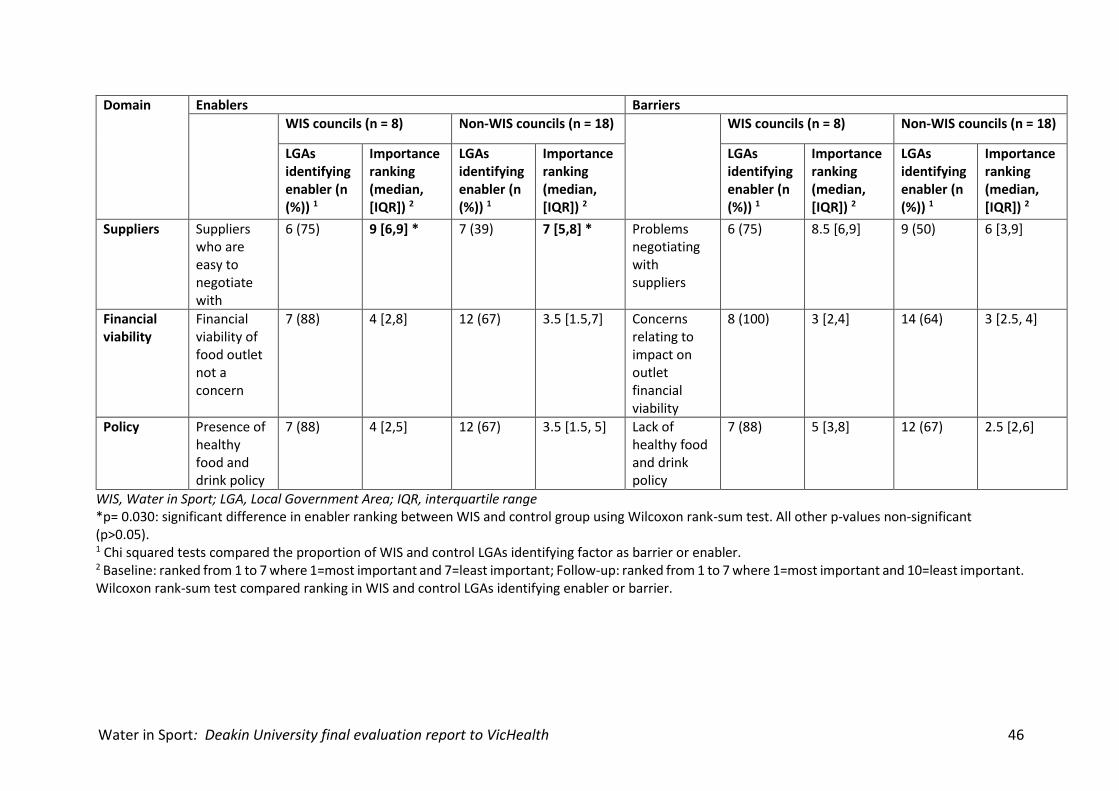
Water in Sport: Deakin University final evaluation report to VicHealth 46
Domain Enablers Barriers
WIS councils (n = 8) Non-WIS councils (n = 18) WIS councils (n = 8) Non-WIS councils (n = 18)
LGAs identifying enabler (n (%)) 1
Importance ranking
(median, [IQR]) 2
LGAs identifying enabler (n (%)) 1
Importance ranking
(median, [IQR]) 2
LGAs identifying enabler (n (%)) 1
Importance ranking
(median, [IQR]) 2
LGAs identifying enabler (n (%)) 1
Importance ranking
(median, [IQR]) 2
Suppliers Suppliers who are easy to negotiate with
6 (75) 9 [6,9] * 7 (39) 7 [5,8] * Problems negotiating with suppliers
6 (75) 8.5 [6,9] 9 (50) 6 [3,9]
Financial viability
Financial viability of food outlet not a concern
7 (88) 4 [2,8] 12 (67) 3.5 [1.5,7] Concerns relating to impact on outlet financial viability
8 (100) 3 [2,4] 14 (64) 3 [2.5, 4]
Policy Presence of healthy food and drink policy
7 (88) 4 [2,5] 12 (67) 3.5 [1.5, 5] Lack of healthy food and drink policy
7 (88) 5 [3,8] 12 (67) 2.5 [2,6]
WIS, Water in Sport; LGA, Local Government Area; IQR, interquartile range *p= 0.030: significant difference in enabler ranking between WIS and control group using Wilcoxon rank-sum test. All other p-values non-significant (p>0.05). 1 Chi squared tests compared the proportion of WIS and control LGAs identifying factor as barrier or enabler. 2 Baseline: ranked from 1 to 7 where 1=most important and 7=least important; Follow-up: ranked from 1 to 7 where 1=most important and 10=least important. Wilcoxon rank-sum test compared ranking in WIS and control LGAs identifying enabler or barrier.
Water in Sport: Deakin University final evaluation report to VicHealth 47
8. Customer surveys The results presented below were included in the 24-month WIS: Deakin University report to VicHealth, however they are also included in the final report for completeness.
8.1. AIM To assess customer awareness of healthy drink changes and perceptions of the need for change.
8.2. METHODS Customer surveys were conducted at baseline (June-September 2018) and follow-up (June-September 2019), and completed by customers frequenting specific sport and recreation facilities at the eight LGAs, noting that nudges were implemented in 2/54 facilities at the baseline time point and 36/54 facilities at the follow-up time point (Appendix 9). The survey investigated the perceived need for healthy drink options, awareness of healthy drinks changes, and customer knowledge related to the healthiness of sugary drinks, as well as customer demographics. To compare responses between the same customers at both baseline and follow-up, a specific survey link was sent at follow-up to those customers that provided their email at baseline. However, the number of customers who completed both surveys was too small (n = 90) to analyse these results separately.
8.2.1. ANALYSIS Customer responses were compared between baseline and follow-up using logistic regression or ordered logistic regression in Stata 15, as appropriate. Comparisons were made for the whole sample, and further sensitivity analyses included i) restricting analysis to only those facilities with no nudges at baseline, ii) where the nudge of limiting sugary drinks (<20%) was implemented at follow-up, and iii) removing responses where the facility was unknown (customers did not select what facility they most frequented on the paper based survey or due survey error in the online survey). The results were also adjusted for LGA and facility. This was done to ensure similar customer profiles at baseline and follow-up. Only statistically significant results between baseline and follow-up are reported on in the text below (p<0.05).
8.3. RESULTS Customer demographic characteristics The customer survey was completed by 1,079 customers at baseline and 1,188 customers at follow-up (based on the number of people who completed the last survey question prior to demographic questions) (Table 13). Three hundred and fifty-seven surveys were excluded from analysis as their location was unknown or their facility was not actively involved in the WIS initiative. At both time points, the majority of customers who completed the survey were female, aged between 25-44 years, and had a university degree or higher or had completed year 12 or a trade certificate. Customers who completed the survey most commonly purchased food or drink 1-4 times per week or never purchased food or drink at the café at the sport and recreation facility (Table 14).
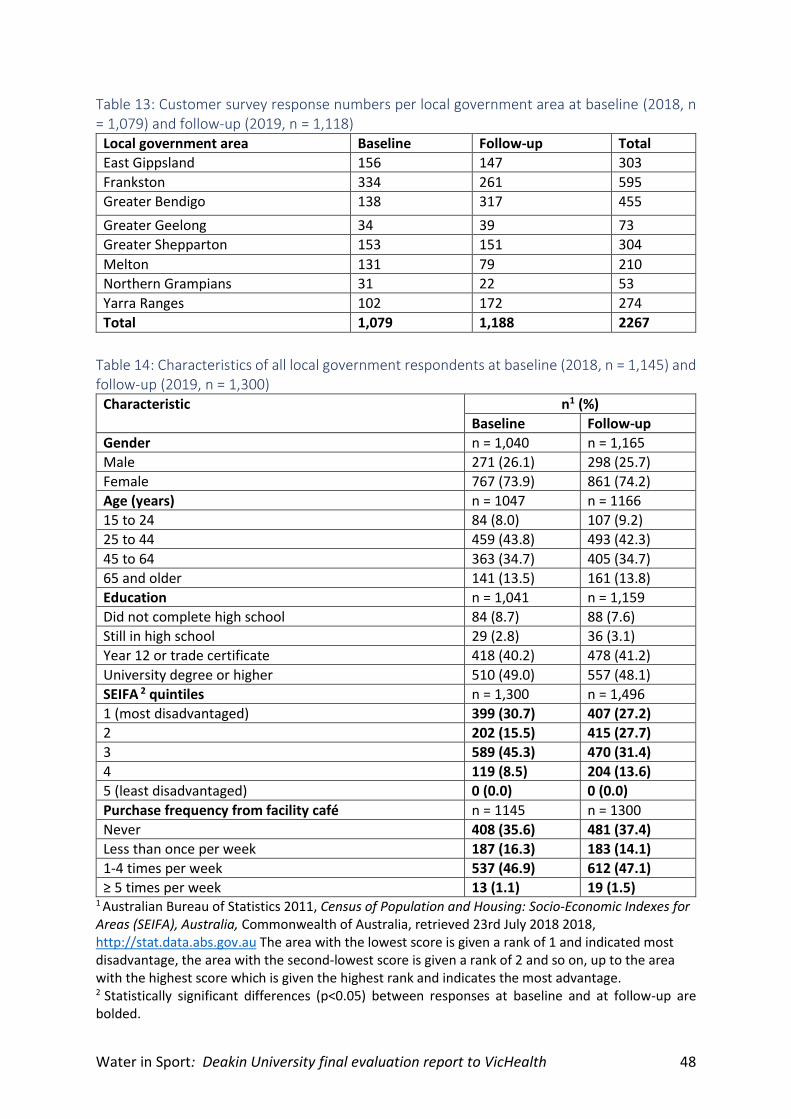
Water in Sport: Deakin University final evaluation report to VicHealth 48
Table 13: Customer survey response numbers per local government area at baseline (2018, n = 1,079) and follow-up (2019, n = 1,118)
Local government area Baseline Follow-up Total
East Gippsland 156 147 303
Frankston 334 261 595
Greater Bendigo 138 317 455
Greater Geelong 34 39 73
Greater Shepparton 153 151 304
Melton 131 79 210
Northern Grampians 31 22 53
Yarra Ranges 102 172 274
Total 1,079 1,188 2267
Table 14: Characteristics of all local government respondents at baseline (2018, n = 1,145) and follow-up (2019, n = 1,300)
Characteristic n1 (%)
Baseline Follow-up
Gender n = 1,040 n = 1,165
Male 271 (26.1) 298 (25.7)
Female 767 (73.9) 861 (74.2)
Age (years) n = 1047 n = 1166
15 to 24 84 (8.0) 107 (9.2)
25 to 44 459 (43.8) 493 (42.3)
45 to 64 363 (34.7) 405 (34.7)
65 and older 141 (13.5) 161 (13.8)
Education n = 1,041 n = 1,159
Did not complete high school 84 (8.7) 88 (7.6)
Still in high school 29 (2.8) 36 (3.1)
Year 12 or trade certificate 418 (40.2) 478 (41.2)
University degree or higher 510 (49.0) 557 (48.1)
SEIFA 2 quintiles n = 1,300 n = 1,496
1 (most disadvantaged) 399 (30.7) 407 (27.2)
2 202 (15.5) 415 (27.7)
3 589 (45.3) 470 (31.4)
4 119 (8.5) 204 (13.6)
5 (least disadvantaged) 0 (0.0) 0 (0.0)
Purchase frequency from facility café n = 1145 n = 1300
Never 408 (35.6) 481 (37.4)
Less than once per week 187 (16.3) 183 (14.1)
1-4 times per week 537 (46.9) 612 (47.1)
≥ 5 times per week 13 (1.1) 19 (1.5) 1 Australian Bureau of Statistics 2011, Census of Population and Housing: Socio-Economic Indexes for Areas (SEIFA), Australia, Commonwealth of Australia, retrieved 23rd July 2018 2018, http://stat.data.abs.gov.au The area with the lowest score is given a rank of 1 and indicated most disadvantage, the area with the second-lowest score is given a rank of 2 and so on, up to the area with the highest score which is given the highest rank and indicates the most advantage. 2 Statistically significant differences (p<0.05) between responses at baseline and at follow-up are bolded.
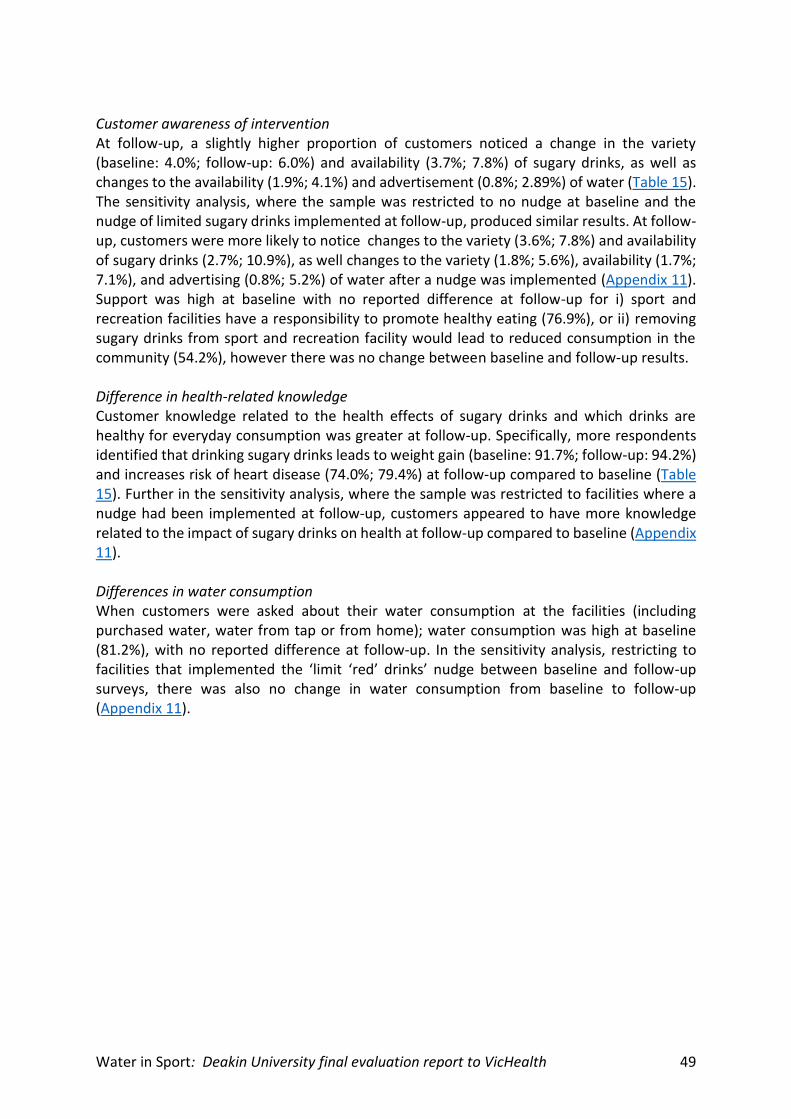
Water in Sport: Deakin University final evaluation report to VicHealth 49
Customer awareness of intervention At follow-up, a slightly higher proportion of customers noticed a change in the variety (baseline: 4.0%; follow-up: 6.0%) and availability (3.7%; 7.8%) of sugary drinks, as well as changes to the availability (1.9%; 4.1%) and advertisement (0.8%; 2.89%) of water (Table 15). The sensitivity analysis, where the sample was restricted to no nudge at baseline and the nudge of limited sugary drinks implemented at follow-up, produced similar results. At follow-up, customers were more likely to notice changes to the variety (3.6%; 7.8%) and availability of sugary drinks (2.7%; 10.9%), as well changes to the variety (1.8%; 5.6%), availability (1.7%; 7.1%), and advertising (0.8%; 5.2%) of water after a nudge was implemented (Appendix 11). Support was high at baseline with no reported difference at follow-up for i) sport and recreation facilities have a responsibility to promote healthy eating (76.9%), or ii) removing sugary drinks from sport and recreation facility would lead to reduced consumption in the community (54.2%), however there was no change between baseline and follow-up results. Difference in health-related knowledge Customer knowledge related to the health effects of sugary drinks and which drinks are healthy for everyday consumption was greater at follow-up. Specifically, more respondents identified that drinking sugary drinks leads to weight gain (baseline: 91.7%; follow-up: 94.2%) and increases risk of heart disease (74.0%; 79.4%) at follow-up compared to baseline (Table 15). Further in the sensitivity analysis, where the sample was restricted to facilities where a nudge had been implemented at follow-up, customers appeared to have more knowledge related to the impact of sugary drinks on health at follow-up compared to baseline (Appendix 11). Differences in water consumption When customers were asked about their water consumption at the facilities (including purchased water, water from tap or from home); water consumption was high at baseline (81.2%), with no reported difference at follow-up. In the sensitivity analysis, restricting to facilities that implemented the ‘limit ‘red’ drinks’ nudge between baseline and follow-up surveys, there was also no change in water consumption from baseline to follow-up (Appendix 11).
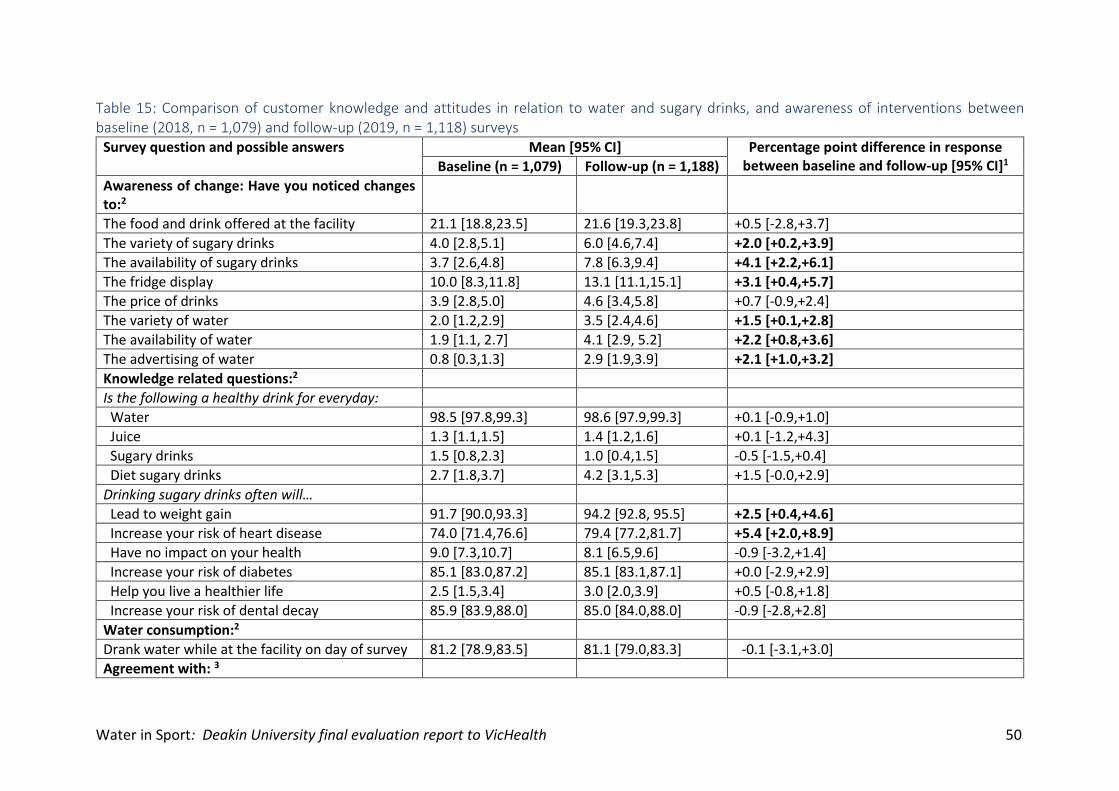
Water in Sport: Deakin University final evaluation report to VicHealth 50
Table 15: Comparison of customer knowledge and attitudes in relation to water and sugary drinks, and awareness of interventions between baseline (2018, n = 1,079) and follow-up (2019, n = 1,118) surveys
Survey question and possible answers Mean [95% CI] Percentage point difference in response between baseline and follow-up [95% CI]1 Baseline (n = 1,079) Follow-up (n = 1,188)
Awareness of change: Have you noticed changes to:2
The food and drink offered at the facility 21.1 [18.8,23.5] 21.6 [19.3,23.8] +0.5 [-2.8,+3.7]
The variety of sugary drinks 4.0 [2.8,5.1] 6.0 [4.6,7.4] +2.0 [+0.2,+3.9]
The availability of sugary drinks 3.7 [2.6,4.8] 7.8 [6.3,9.4] +4.1 [+2.2,+6.1]
The fridge display 10.0 [8.3,11.8] 13.1 [11.1,15.1] +3.1 [+0.4,+5.7]
The price of drinks 3.9 [2.8,5.0] 4.6 [3.4,5.8] +0.7 [-0.9,+2.4]
The variety of water 2.0 [1.2,2.9] 3.5 [2.4,4.6] +1.5 [+0.1,+2.8]
The availability of water 1.9 [1.1, 2.7] 4.1 [2.9, 5.2] +2.2 [+0.8,+3.6]
The advertising of water 0.8 [0.3,1.3] 2.9 [1.9,3.9] +2.1 [+1.0,+3.2]
Knowledge related questions:2
Is the following a healthy drink for everyday:
Water 98.5 [97.8,99.3] 98.6 [97.9,99.3] +0.1 [-0.9,+1.0]
Juice 1.3 [1.1,1.5] 1.4 [1.2,1.6] +0.1 [-1.2,+4.3]
Sugary drinks 1.5 [0.8,2.3] 1.0 [0.4,1.5] -0.5 [-1.5,+0.4]
Diet sugary drinks 2.7 [1.8,3.7] 4.2 [3.1,5.3] +1.5 [-0.0,+2.9]
Drinking sugary drinks often will…
Lead to weight gain 91.7 [90.0,93.3] 94.2 [92.8, 95.5] +2.5 [+0.4,+4.6]
Increase your risk of heart disease 74.0 [71.4,76.6] 79.4 [77.2,81.7] +5.4 [+2.0,+8.9]
Have no impact on your health 9.0 [7.3,10.7] 8.1 [6.5,9.6] -0.9 [-3.2,+1.4]
Increase your risk of diabetes 85.1 [83.0,87.2] 85.1 [83.1,87.1] +0.0 [-2.9,+2.9]
Help you live a healthier life 2.5 [1.5,3.4] 3.0 [2.0,3.9] +0.5 [-0.8,+1.8]
Increase your risk of dental decay 85.9 [83.9,88.0] 85.0 [84.0,88.0] -0.9 [-2.8,+2.8]
Water consumption:2
Drank water while at the facility on day of survey 81.2 [78.9,83.5] 81.1 [79.0,83.3] -0.1 [-3.1,+3.0]
Agreement with: 3
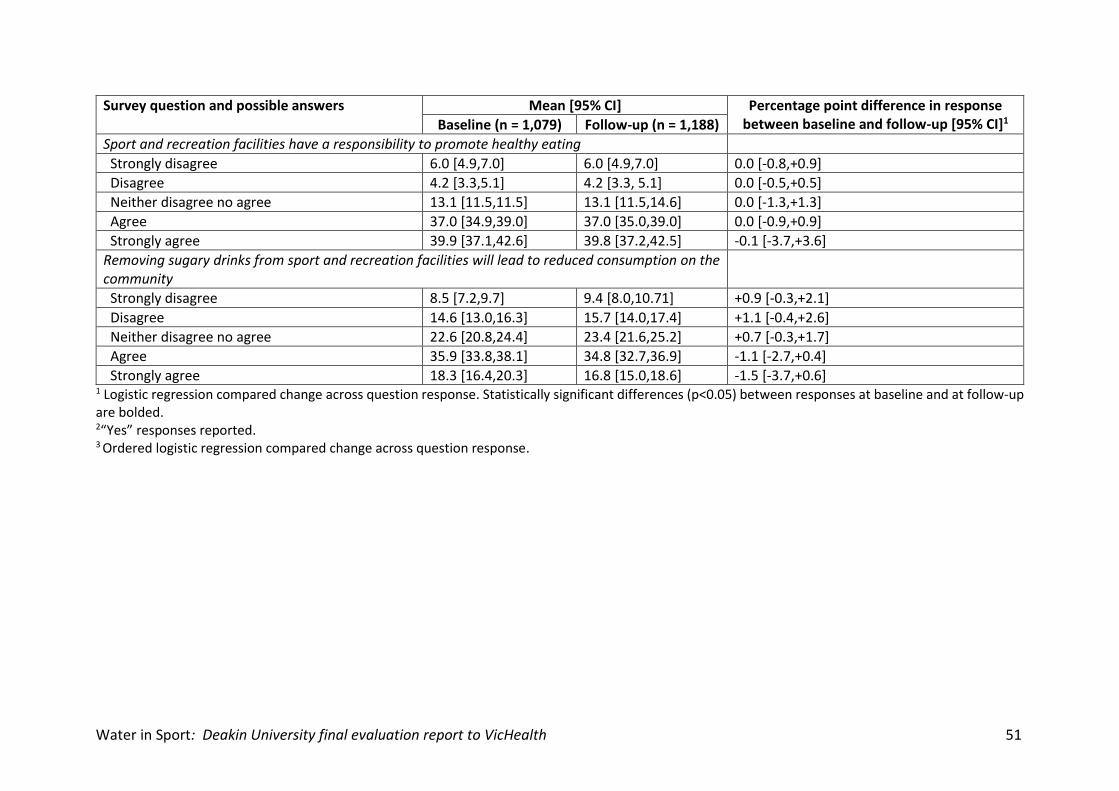
Water in Sport: Deakin University final evaluation report to VicHealth 51
Survey question and possible answers Mean [95% CI] Percentage point difference in response between baseline and follow-up [95% CI]1 Baseline (n = 1,079) Follow-up (n = 1,188)
Sport and recreation facilities have a responsibility to promote healthy eating
Strongly disagree 6.0 [4.9,7.0] 6.0 [4.9,7.0] 0.0 [-0.8,+0.9]
Disagree 4.2 [3.3,5.1] 4.2 [3.3, 5.1] 0.0 [-0.5,+0.5]
Neither disagree no agree 13.1 [11.5,11.5] 13.1 [11.5,14.6] 0.0 [-1.3,+1.3]
Agree 37.0 [34.9,39.0] 37.0 [35.0,39.0] 0.0 [-0.9,+0.9]
Strongly agree 39.9 [37.1,42.6] 39.8 [37.2,42.5] -0.1 [-3.7,+3.6]
Removing sugary drinks from sport and recreation facilities will lead to reduced consumption on the community
Strongly disagree 8.5 [7.2,9.7] 9.4 [8.0,10.71] +0.9 [-0.3,+2.1]
Disagree 14.6 [13.0,16.3] 15.7 [14.0,17.4] +1.1 [-0.4,+2.6]
Neither disagree no agree 22.6 [20.8,24.4] 23.4 [21.6,25.2] +0.7 [-0.3,+1.7]
Agree 35.9 [33.8,38.1] 34.8 [32.7,36.9] -1.1 [-2.7,+0.4]
Strongly agree 18.3 [16.4,20.3] 16.8 [15.0,18.6] -1.5 [-3.7,+0.6] 1 Logistic regression compared change across question response. Statistically significant differences (p<0.05) between responses at baseline and at follow-up are bolded. 2“Yes” responses reported. 3 Ordered logistic regression compared change across question response.
Water in Sport: Deakin University final evaluation report to VicHealth 52
9. Staff surveys The results presented below were included in the 24-month WIS: Deakin University report to VicHealth, however it is included in the final report for completeness.
9.1. AIM To assess staff awareness of healthy drink changes and perceptions of the need for change.
9.2. METHODS Staff surveys were conducted at baseline (June-September 2018) and follow-up (June-September 2019) in the eight participating LGAs and were completed by individuals involved in policy development related to the nudges, the implementation of nudges, and those that the policy would influence (i.e. facility staff) (Appendix 10). Staff were recruited by WIS POs via staff mailing lists. Staff who completed the survey at baseline were not necessarily the same staff who completed the survey at follow-up. The survey investigated the perceived need for healthy drink options, the awareness of healthy drinks policy implementation, staff opinion on organisational intent to improve overall healthiness of offerings, and whether the staff member was personally involved in the healthy retail changes. In an attempt to compare responses between the same staff at both baseline and follow-up, a specific survey link was sent at follow-up to those staff that provided their email at baseline. However, the number of staff who completed both surveys was too small (n = 20) to analyse those results separately.
9.2.1. ANALYSIS Staff responses were compared between baseline and follow-up using logistic regression for binary responses or an ordered logistic regression for scale responses in Stata 15, as appropriate. Comparisons were made for the whole sample, as well a sensitivity analysis where the sample was restricted to only those facilities where the ‘limit red drinks’ nudge was not implemented at baseline and was implemented at follow-up (34/54 facilities). The sensitivity analysis results were adjusted for LGA, the primary analysis was not adjusted for LGA. Only statistically significant results between baseline and follow-up are reported on in the text below (p<0.05).
9.3. RESULTS Staff demographic characteristics The staff survey was completed by 162 staff at baseline and 183 staff at follow-up (Table 16). Six surveys were excluded from the analysis as respondents were not at facilities who were actively involved in the WIS initiative. At baseline and follow-up, most staff responding were employed by council and worked in sport and recreation in a customer service role and had worked at the local government for more than two years. Staff who completed the survey at follow-up were more likely to have been involved in making the healthy retail change (baseline: 35.7%, follow-up: 53.8%). Staff who completed the survey most commonly purchased food or drink 1-4 times per week or never purchased food or drink at the café at the sport and recreation facility (Table 17).
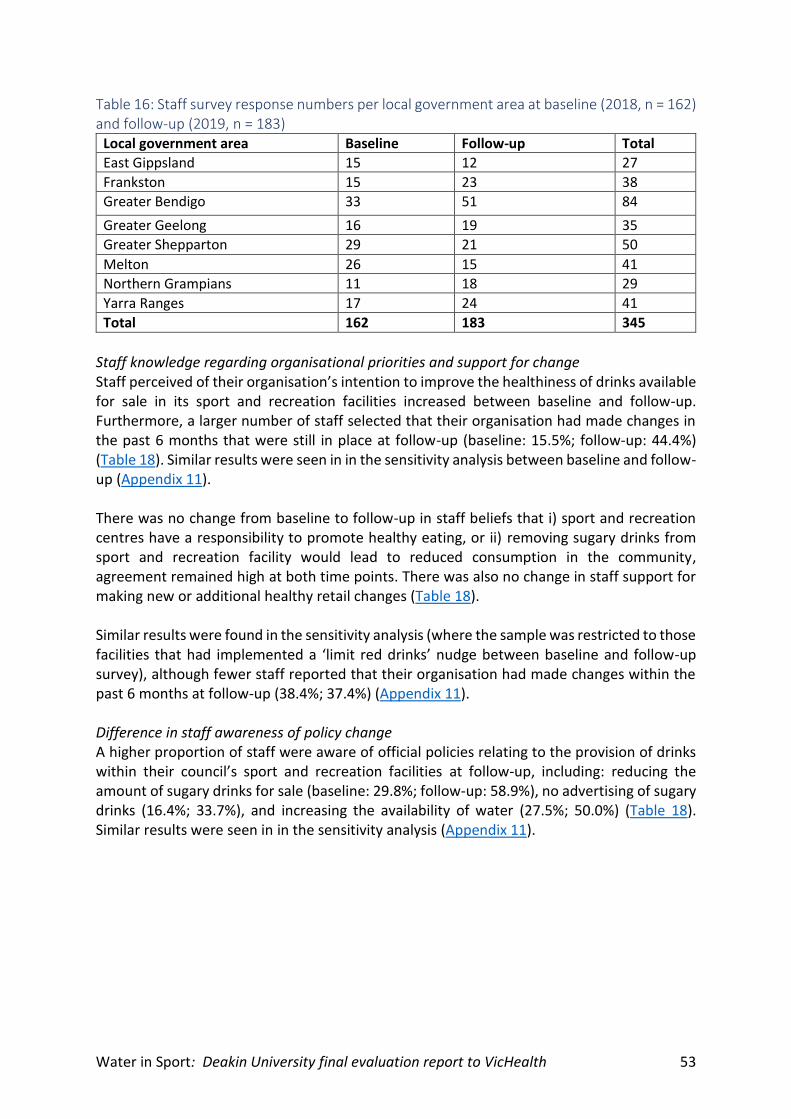
Water in Sport: Deakin University final evaluation report to VicHealth 53
Table 16: Staff survey response numbers per local government area at baseline (2018, n = 162) and follow-up (2019, n = 183)
Local government area Baseline Follow-up Total
East Gippsland 15 12 27
Frankston 15 23 38
Greater Bendigo 33 51 84
Greater Geelong 16 19 35
Greater Shepparton 29 21 50
Melton 26 15 41
Northern Grampians 11 18 29
Yarra Ranges 17 24 41
Total 162 183 345
Staff knowledge regarding organisational priorities and support for change Staff perceived of their organisation’s intention to improve the healthiness of drinks available for sale in its sport and recreation facilities increased between baseline and follow-up. Furthermore, a larger number of staff selected that their organisation had made changes in the past 6 months that were still in place at follow-up (baseline: 15.5%; follow-up: 44.4%) (Table 18). Similar results were seen in in the sensitivity analysis between baseline and follow-up (Appendix 11). There was no change from baseline to follow-up in staff beliefs that i) sport and recreation centres have a responsibility to promote healthy eating, or ii) removing sugary drinks from sport and recreation facility would lead to reduced consumption in the community, agreement remained high at both time points. There was also no change in staff support for making new or additional healthy retail changes (Table 18). Similar results were found in the sensitivity analysis (where the sample was restricted to those facilities that had implemented a ‘limit red drinks’ nudge between baseline and follow-up survey), although fewer staff reported that their organisation had made changes within the past 6 months at follow-up (38.4%; 37.4%) (Appendix 11). Difference in staff awareness of policy change A higher proportion of staff were aware of official policies relating to the provision of drinks within their council’s sport and recreation facilities at follow-up, including: reducing the amount of sugary drinks for sale (baseline: 29.8%; follow-up: 58.9%), no advertising of sugary drinks (16.4%; 33.7%), and increasing the availability of water (27.5%; 50.0%) (Table 18). Similar results were seen in in the sensitivity analysis (Appendix 11).
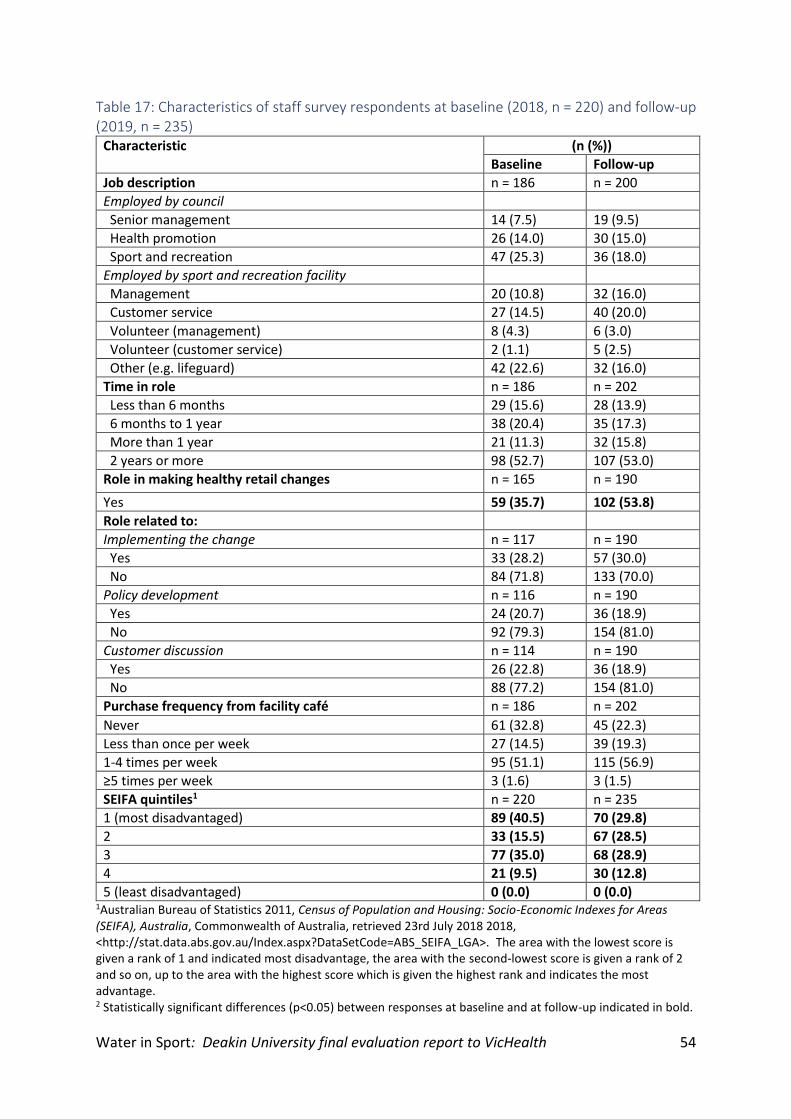
Water in Sport: Deakin University final evaluation report to VicHealth 54
Table 17: Characteristics of staff survey respondents at baseline (2018, n = 220) and follow-up (2019, n = 235)
Characteristic (n (%))
Baseline Follow-up
Job description n = 186 n = 200
Employed by council
Senior management 14 (7.5) 19 (9.5)
Health promotion 26 (14.0) 30 (15.0)
Sport and recreation 47 (25.3) 36 (18.0)
Employed by sport and recreation facility
Management 20 (10.8) 32 (16.0)
Customer service 27 (14.5) 40 (20.0)
Volunteer (management) 8 (4.3) 6 (3.0)
Volunteer (customer service) 2 (1.1) 5 (2.5)
Other (e.g. lifeguard) 42 (22.6) 32 (16.0)
Time in role n = 186 n = 202
Less than 6 months 29 (15.6) 28 (13.9)
6 months to 1 year 38 (20.4) 35 (17.3)
More than 1 year 21 (11.3) 32 (15.8)
2 years or more 98 (52.7) 107 (53.0)
Role in making healthy retail changes n = 165 n = 190
Yes 59 (35.7) 102 (53.8)
Role related to:
Implementing the change n = 117 n = 190
Yes 33 (28.2) 57 (30.0)
No 84 (71.8) 133 (70.0)
Policy development n = 116 n = 190
Yes 24 (20.7) 36 (18.9)
No 92 (79.3) 154 (81.0)
Customer discussion n = 114 n = 190
Yes 26 (22.8) 36 (18.9)
No 88 (77.2) 154 (81.0)
Purchase frequency from facility café n = 186 n = 202
Never 61 (32.8) 45 (22.3)
Less than once per week 27 (14.5) 39 (19.3)
1-4 times per week 95 (51.1) 115 (56.9)
≥5 times per week 3 (1.6) 3 (1.5)
SEIFA quintiles1 n = 220 n = 235
1 (most disadvantaged) 89 (40.5) 70 (29.8)
2 33 (15.5) 67 (28.5)
3 77 (35.0) 68 (28.9)
4 21 (9.5) 30 (12.8)
5 (least disadvantaged) 0 (0.0) 0 (0.0) 1Australian Bureau of Statistics 2011, Census of Population and Housing: Socio-Economic Indexes for Areas (SEIFA), Australia, Commonwealth of Australia, retrieved 23rd July 2018 2018, <http://stat.data.abs.gov.au/Index.aspx?DataSetCode=ABS_SEIFA_LGA>. The area with the lowest score is given a rank of 1 and indicated most disadvantage, the area with the second-lowest score is given a rank of 2 and so on, up to the area with the highest score which is given the highest rank and indicates the most advantage.
2 Statistically significant differences (p<0.05) between responses at baseline and at follow-up indicated in bold.
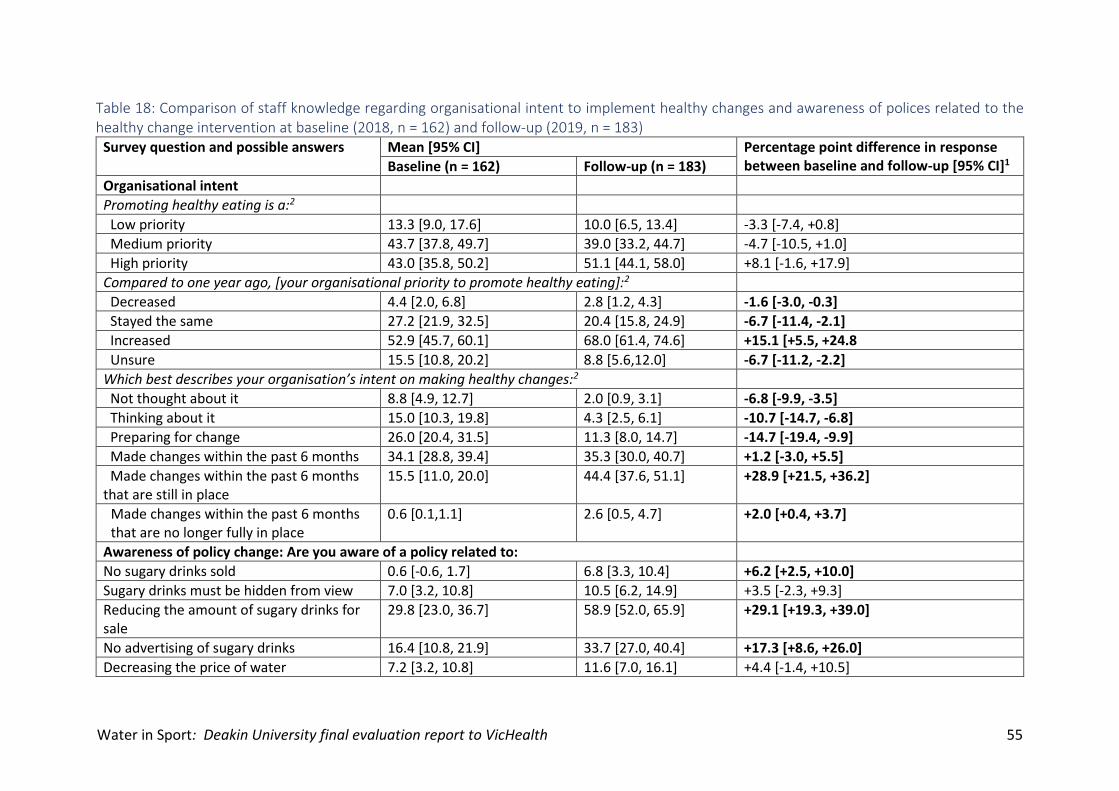
Water in Sport: Deakin University final evaluation report to VicHealth 55
Table 18: Comparison of staff knowledge regarding organisational intent to implement healthy changes and awareness of polices related to the healthy change intervention at baseline (2018, n = 162) and follow-up (2019, n = 183)
Survey question and possible answers Mean [95% CI] Percentage point difference in response between baseline and follow-up [95% CI]1 Baseline (n = 162) Follow-up (n = 183)
Organisational intent
Promoting healthy eating is a:2
Low priority 13.3 [9.0, 17.6] 10.0 [6.5, 13.4] -3.3 [-7.4, +0.8]
Medium priority 43.7 [37.8, 49.7] 39.0 [33.2, 44.7] -4.7 [-10.5, +1.0]
High priority 43.0 [35.8, 50.2] 51.1 [44.1, 58.0] +8.1 [-1.6, +17.9]
Compared to one year ago, [your organisational priority to promote healthy eating]:2
Decreased 4.4 [2.0, 6.8] 2.8 [1.2, 4.3] -1.6 [-3.0, -0.3]
Stayed the same 27.2 [21.9, 32.5] 20.4 [15.8, 24.9] -6.7 [-11.4, -2.1]
Increased 52.9 [45.7, 60.1] 68.0 [61.4, 74.6] +15.1 [+5.5, +24.8
Unsure 15.5 [10.8, 20.2] 8.8 [5.6,12.0] -6.7 [-11.2, -2.2]
Which best describes your organisation’s intent on making healthy changes:2
Not thought about it 8.8 [4.9, 12.7] 2.0 [0.9, 3.1] -6.8 [-9.9, -3.5]
Thinking about it 15.0 [10.3, 19.8] 4.3 [2.5, 6.1] -10.7 [-14.7, -6.8]
Preparing for change 26.0 [20.4, 31.5] 11.3 [8.0, 14.7] -14.7 [-19.4, -9.9]
Made changes within the past 6 months 34.1 [28.8, 39.4] 35.3 [30.0, 40.7] +1.2 [-3.0, +5.5]
Made changes within the past 6 months that are still in place
15.5 [11.0, 20.0] 44.4 [37.6, 51.1] +28.9 [+21.5, +36.2]
Made changes within the past 6 months that are no longer fully in place
0.6 [0.1,1.1] 2.6 [0.5, 4.7] +2.0 [+0.4, +3.7]
Awareness of policy change: Are you aware of a policy related to:
No sugary drinks sold 0.6 [-0.6, 1.7] 6.8 [3.3, 10.4] +6.2 [+2.5, +10.0]
Sugary drinks must be hidden from view 7.0 [3.2, 10.8] 10.5 [6.2, 14.9] +3.5 [-2.3, +9.3]
Reducing the amount of sugary drinks for sale
29.8 [23.0, 36.7] 58.9 [52.0, 65.9] +29.1 [+19.3, +39.0]
No advertising of sugary drinks 16.4 [10.8, 21.9] 33.7 [27.0, 40.4] +17.3 [+8.6, +26.0]
Decreasing the price of water 7.2 [3.2, 10.8] 11.6 [7.0, 16.1] +4.4 [-1.4, +10.5]
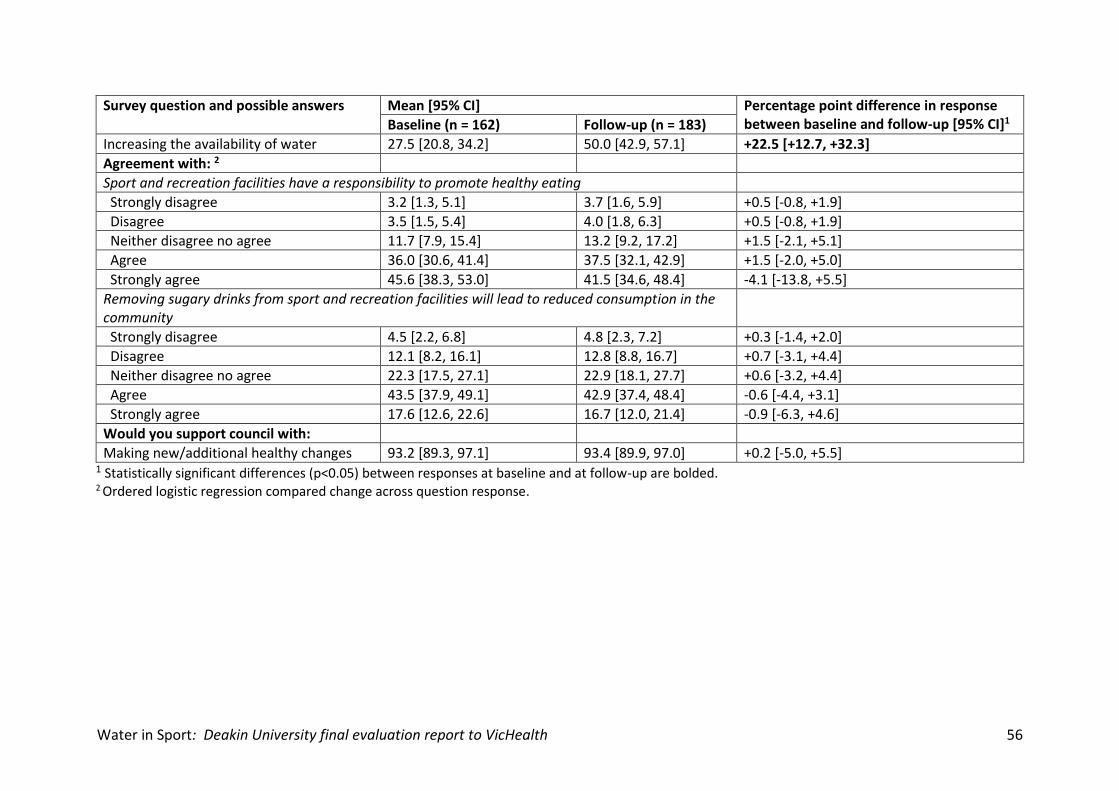
Water in Sport: Deakin University final evaluation report to VicHealth 56
Survey question and possible answers Mean [95% CI] Percentage point difference in response between baseline and follow-up [95% CI]1 Baseline (n = 162) Follow-up (n = 183)
Increasing the availability of water 27.5 [20.8, 34.2] 50.0 [42.9, 57.1] +22.5 [+12.7, +32.3]
Agreement with: 2
Sport and recreation facilities have a responsibility to promote healthy eating
Strongly disagree 3.2 [1.3, 5.1] 3.7 [1.6, 5.9] +0.5 [-0.8, +1.9]
Disagree 3.5 [1.5, 5.4] 4.0 [1.8, 6.3] +0.5 [-0.8, +1.9]
Neither disagree no agree 11.7 [7.9, 15.4] 13.2 [9.2, 17.2] +1.5 [-2.1, +5.1]
Agree 36.0 [30.6, 41.4] 37.5 [32.1, 42.9] +1.5 [-2.0, +5.0]
Strongly agree 45.6 [38.3, 53.0] 41.5 [34.6, 48.4] -4.1 [-13.8, +5.5]
Removing sugary drinks from sport and recreation facilities will lead to reduced consumption in the community
Strongly disagree 4.5 [2.2, 6.8] 4.8 [2.3, 7.2] +0.3 [-1.4, +2.0]
Disagree 12.1 [8.2, 16.1] 12.8 [8.8, 16.7] +0.7 [-3.1, +4.4]
Neither disagree no agree 22.3 [17.5, 27.1] 22.9 [18.1, 27.7] +0.6 [-3.2, +4.4]
Agree 43.5 [37.9, 49.1] 42.9 [37.4, 48.4] -0.6 [-4.4, +3.1]
Strongly agree 17.6 [12.6, 22.6] 16.7 [12.0, 21.4] -0.9 [-6.3, +4.6]
Would you support council with:
Making new/additional healthy changes 93.2 [89.3, 97.1] 93.4 [89.9, 97.0] +0.2 [-5.0, +5.5] 1 Statistically significant differences (p<0.05) between responses at baseline and at follow-up are bolded. 2 Ordered logistic regression compared change across question response.
Water in Sport: Deakin University final evaluation report to VicHealth 57
10. Qualitative analysis
10.1. AIMS To describe and critique the health promotion approaches used to implement the WIS project, to explore whether key implementation narratives varied over time or between local governments, and to identify leverage points and recommendations for local government-facilitated food and drink policy changes.
10.2. METHODS The qualitative evaluation applied a sequential convergent mixed method approach [7] including repeat longitudinal council PO surveys, a group workshop, and stakeholder interviews. Results from each data source were initially analysed separately, and then converged for the report. Results from the three data sources were considered complementary and used to build a comprehensive understanding of the dynamic process of implementing a healthy drink initiative in council-owned sport and recreation clubs and facilities. Details of the purpose and design of each data source are described below. We also provided specific strategy ideas (detailed in Table 20), based on integrated quantitative and qualitative evaluation findings, along with key learnings from the research team and the broader literature. The underlying theoretical framework and participant questions for the qualitative evaluation were informed by a previously developed systems map. The systems map identifies the role of factors affecting the successful implementation of healthy food retail interventions in health promoting settings [8]. This systems map development was based on post-hoc analyses of interviews conducted with retail managers, implementers and other key stakeholders involved in a range of healthy food retail interventions in health-promoting settings. It uses system dynamics [9] to identify potential points of intervention through which community-based organisations can shift to healthier food provision. It additionally captures important feedback loops that could drive potential unintended consequences. We have used the map in this evaluation as a framework with which to analyse and present key narratives that have previously been identified in other food retail initiatives.
10.2.1. COUNCIL PROJECT OFFICER SURVEYS Surveys were completed by LGA POs four times, every 6 months over the 2-year project (2018-2020) (Appendix 12). This survey asked POs to nominate the relevance of pre-identified potential enablers and barriers to completing the project in their LGA. The survey also allowed free text entry of additional barriers, enablers, or contextual factors within the LGA. Note that due to staff turnover, the PO who completed the survey changed for three councils during the survey period, and not all surveys were completed at every timepoint. When a PO was unable to complete the survey a council manager completed it where possible.
10.2.2. GROUP WORKSHOP A group workshop was conducted toward the end of the WIS initiative to gain practical lessons and identify key leverage points to promote healthy retail in sport and recreation settings, and to explore how barriers and enablers to healthy policies changed over the lifespan of the WIS project. POs from seven LGAs, as well as representatives from Nutrition Australia and VicHealth (total, n = 10 participants), attended a 3-hour workshop in November 2019.
The group discussion was structured around the previously developed systems map for healthy food retail change. Based on principles of the Most Significant Change [10] qualitative approach,
Water in Sport: Deakin University final evaluation report to VicHealth 58
participants self-identified their most important experiences during the WIS project in relation to the systems map, to form groups of two to four people for discussions. Participants were also invited to discuss narratives not captured by the systems map. Six small group discussions were followed by a whole group reflection on key narratives, and challenges of WIS implementation. Discussions were audio-recorded (with consent from participants) and transcribed verbatim for analysis.
10.2.3. STAKEHOLDER INTERVIEWS Qualitative interviews with selected stakeholders involved in WIS policy development and/or implementation were used to assess perceptions of stakeholders on the value, and limitations, barriers and enablers of a capacity building approach to increasing healthy drink provision in council-owned sport and recreation facilities and affiliated sporting clubs. Fifteen stakeholders were purposively selected to provide diverse views and provide insights into the application of the WIS model, enablers and barriers in different contexts. Selected stakeholders from four LGAs were invited to participate, as well as representatives from Nutrition Australia and VicHealth. The four LGAs were selected for inclusion in order to provide variety across i) the number of sporting clubs in the LGA; ii) speed of implementation of WIS nudges; iii) extent of WIS implementation; and iv) metropolitan and regional LGAs. It was considered preferable to interview more people at a variety of levels from a smaller number of LGAs rather than to include a smaller number of people from each of the eight participating LGAs. Thirty to sixty-minute semi-structured interviews were conducted over the phone, via video call or face-to-face post implementation from December 2019 to April 2020. Key questions included the process and outcomes of implementation, key barriers and facilitators, and recommendations for future initiatives (see Appendix 13 for interview questions). Interviews were audio recorded (with consent from participants) and transcribed verbatim for analysis.
10.2.4. QUALITATIVE DATA ANALYSIS AND SYNTHESIS Results from each data source were initially analysed separately. Qualitative data from interviews and focus groups was coded using a deductive approach to identify similarities and divergences from the initial systems map. MB, DR and TBR initially created a coding dictionary using a priori identified factors or interest from the systems map, with openness to new factors emerging. MB coded all interviews and workshop groups using this dictionary while maintaining openness to new factors. Half of all interviews were cross coded by DR or TBR. Key themes were identified separately for focus groups and interviews, and then merged to form a coherent narrative through discussion between MB, DR and TBR. These themes were then cross-checked against PO survey results, with minor additions made. We have structured the qualitative findings under key recommendations of the report, to illustrate the participant experiences behind these recommendations. The recommendations are targeted at the convening agency (such as VicHealth), local governments, implementation support agencies (such as the Healthy Eating Advisory Service) and/or other stakeholder groups.
Water in Sport: Deakin University final evaluation report to VicHealth 59
10.3. RESULTS
RECOMMENDATION 1: CREATE STRONG PROJECT GOVERNANCE AND STRATEGIC FUNDING MECHANISMS [CONVENING
AGENCY]
“I’ve always felt in other areas working with VicHealth that they’ve been – you can pick up the phone and talk to them. But particularly in this project I guess I was surprised by the level of coordination and support that they were
involved in.” [Council manager]
Respondents identified that, as the convening agency for WIS, VicHealth provided resourcing, accountability, and funding. The value of funding project officer positions is described below (see ‘Recruit, develop and resource skilled project officers’). The VicHealth interviewee reported that several factors were considered in allocating funds including council socioeconomic and health indicators; demonstrated facility and council support for participation; and council plans for sustaining the project long-term. During the project, additional council contextual factors emerged as important in predicting council achievement of VicHealth deliverables. These included previous implementation (some facilities claiming funding had already fully implemented the nudge prior to funding commencement); internal council relationships and the ability to work across council to achieve project aims; seasonality and operations of food outlets; and adequate requested full time equivalent (FTE) funding for POs to achieve project aims.
The VicHealth project manager was identified as responsible for dealing with issues around progress towards council contracted deliverables, including nudge implementation targets. One council required intensive management by VicHealth and Nutrition Australia after repeatedly missing reporting and implementation deadlines. Stakeholders attributed the issues to council management turnover and difficulties engaging council leadership in change. VicHealth and Nutrition Australia negotiated a workplan with council management and POs, and increased frequency of check-in meetings between VicHealth, Nutrition Australia and the council. These measures were ultimately unsuccessful in restarting council progress. RECOMMENDATION 2: FACILITATE REGULAR AND STRATEGIC EXTERNAL STEERING-GROUP COLLABORATIONS
[CONVENING AGENCY]
“And I think having those clearly defined roles from the beginning, even though coming in half-way, I knew quite clearly Deakin was doing the
evaluation, [VicHealth Project Manager] was looking after X, Y and Z and we were there for, I guess, that project support and regularly checking in with the project officers, so definitely having that clear roles and responsibilities
between all three organisations was really helpful.” [Nutrition Australia project officer]
Frequent communication between the different organisations involved in the project (VicHealth, local governments, Nutrition Australia and Deakin) was key in identifying and addressing issues early. Connections allowed pooling of expertise and resources, including media and communications resources. Steering group meetings became less frequent as the project progressed, with less involvement from senior stakeholders. This may have resulted in
Water in Sport: Deakin University final evaluation report to VicHealth 60
less strategic planning including potential missed opportunities for broader linkages with other external stakeholders for promotion and policy, and translation. RECOMMENDATION 3: RECRUIT, DEVELOP, AND RESOURCE APPROPRIATELY SKILLED PROJECT OFFICERS [CONVENING
AGENCY, IMPLEMENTATION SUPPORT AGENCY, LOCAL GOVERNMENT]
“It was about the [amount of paid project officer time] definitely, especially our larger centres that actually takes quite a lot of work, a bit of hand
holding really to change traditional practises.” [Council manager]
All stakeholders agreed that paid staff were needed to drive the implementation of the WIS initiative, with two to four days per week of paid work on this project needed for stakeholder engagement and policy progress. Several stakeholders noted that POs funded for less than two days per week seemed to struggle to meet both internal council and facility engagement tasks, for example with a minimum base-level of time was required for council policy development. The council prioritisation of the WIS project was also reflected in how much of the allocated Full Time Equivalent (FTE) POs spent carrying out WIS tasks, rather than other council tasks. POs who were enabled by council to be flexible in their allocated workdays and times were noted to be better able to respond to site needs. While many council stakeholders noted they had thought nutrition skills would be important for POs prior to project commencement, not all POs had formal nutrition training. Most respondents did not consider it essential for the role, after witnessing PO contributions towards achieving project deliverables. This was because of the specialised nutrition support provided by Nutrition Australia. However, POs were instrumental in providing nutrition knowledge, sourcing healthy product alternatives, and developing resources and tools for facilities. These resources reduced facility personnel time and resources required for change and included fridge planograms, supermarket shopping lists, and marketing materials. Previous exposure to food retail interventions or professional hospitality experience were considered significant advantages in understanding merchandising approaches (e.g. price, placement, and promotion of food) and creating change within retail settings. PO characteristics that were associated with delivery of the project aims included: an ability to work independently and flexibly, including in areas of project management, time management and problem-solving skills. They used evidence-based sales, auditing, and customer survey tools to monitor progress. They advocated for policy change in council to increase the likelihood changes would be maintained. Public health skills were considered an asset to understand research and outcomes and were beneficial in council policy development. Different skills were recognised by stakeholders as being required by POs as WIS progressed, depending on stages of engagement, implementation, and maintenance. Almost all interviewees discussed the importance of communication skills including stakeholder engagement skills, particularly in the initial project period. The POs who had the most success in delivering project aims were able to work across different settings and with a variety of stakeholders from suppliers to council leadership. High-performing POs thought carefully about motivations of facilities, personnel, and management, and tailored their engagement strategies accordingly. They engaged site managers and personnel by using a variety of techniques including appealing to personal health concerns, promoting competitive advantages of change,
Water in Sport: Deakin University final evaluation report to VicHealth 61
and by implementing contractual requirements for compliance. Most interviewees described stakeholder engagement as an innate rather than learned skill - “you definitely have to be a people person”. RECOMMENDATION 4: PROVIDE PRACTICAL IMPLEMENTATION SUPPORT TO COUNCILS [IMPLEMENTATION SUPPORT
AGENCY]
“I think that the individuals were resources in themselves…We could have all the paper and online resources we want but individuals are sometimes the
best wealth of information on how to navigate those or where we need to go as well.” [Council manager]
Nutrition Australia and VicHealth stakeholders described that Nutrition Australia was contracted to provide support to local government POs at 0.6FTE for the duration of the project. Nutrition Australia advisors provided technical support in use of FoodChecker, and tailored support in advice on facility engagement and policy development. Support was provided face-to-face, or via email or phone. Initial onsite meetings with POs at intervention facilities were considered important for Nutrition Australia to understand intervention context. POs and council staff acknowledged the invaluable support that was provided by Nutrition Australia, as often other council staff lacked specific nutrition knowledge and implementation skills to assist the PO. Peer-to-peer support, including through the Nutrition Australia -facilitated ‘community of practice’ sessions was popular among PO interviewees. Community of practice sessions were structured workshops with Nutrition Australia POs, council POs, Deakin researchers, and VicHealth representatives, and were used to provide formal training in nudge implementation, use of FoodChecker, and policy implementation, as well as a formal setting for PO updates and group problem-solving. Sessions enabled knowledge and resource sharing and provided inspiration and a feeling of solidarity for POs. Over time, as PO skills increased and the project progressed, POs became more independent with less need for intensive support from Nutrition Australia. POs also supported each other outside the scope of the community of practice through email and telephone calls, to share experiences and brainstorm ideas. RECOMMENDATION 5: STRENGTHEN INTERNAL COUNCIL COLLABORATION AND ENGAGE COUNCIL LEADERSHIP IN
HEALTH PROGRAM, AND VISION FOR AND PROCESS OF CHANGE [LOCAL GOVERNMENT]
“I guess the way we approached it was, first of all, municipal public health and wellbeing and senior buy-in to that plan, having a good support network through our executive to actually be able to implement some things that are a little bit challenging, but then also working within our existing network of
the City to try and make health everyone’s business and looking at where are all our touchpoints and what are our highest return on investment options.”
[Council manager]
Interviews indicated that council leadership in healthy food provision was exhibited through policy, procedures, and prioritisation of WIS. Nutrition Australia and VicHealth stakeholders noted that council leadership acceptance generally seemed to have increased over time as a result of WIS participation. Councils demonstrated high levels of support for WIS by including healthy eating or obesity in their council plans. This provided a platform to progress healthy
Water in Sport: Deakin University final evaluation report to VicHealth 62
retail policies in sport and recreation and other settings. Participation of council executives and senior management on project steering committees was useful to progress work and encouraged POs to feel that the work was valued. PO managers could also be an important source of day-to-day oversight of POs. Interviewees identified that where a council was perceived as having a lower prioritisation of the project and high council management turnover, this resulted in inadequate project oversight and stalled progress. Further, some POs had several part time roles within council which sometimes resulted in competing time and capacity priorities.
“my perspective of council is that you have a lot of power at council to make change because you have a lot of core business that have a functional delivery in services for community that can be done in a way that are
conducive to health and wellbeing for community. And that’s a huge benefit of working at council and embedding within council. But things also take a
long time. There’s a number of different people you have to get on side. It’s very much a game of building awareness and understanding internally as
well to make things happen.” [Council manager]
Internal council collaboration was noted to be important for success at several councils. Consultation with council sport and recreation team members contributed to policy development, created an “in” with clubs and facilities, reduced internal council resistance to change, and created a potential avenue for ongoing monitoring and support to facilities from council. Council managers emphasised the value of working laterally across council teams, rather than hierarchically within teams. At one council, openness to negotiation and discussions with other teams allowed what was initially a point of tension between the health and sustainability teams- promotion of bottled water - to become an opportunity for working towards a plan to reduce plastic use in sport and recreation facilities. One interviewee commented that relationship building within councils took much longer than anticipated, and that having more lead-in time to plan and identify potential challenges and roadblocks would offer greater chance of success. RECOMMENDATION 6: CONSIDER CONTEXT IN THE DESIGN AND IMPLEMENTATION OF HEALTHY FOOD AND DRINK
POLICIES [LOCAL GOVERNMENT AND ACCREDITING AGENCIES1]
“knowing some internal work wasn’t received well in the past shapes how we proceed in the future. Knowing that we have certain pockets that have
particular demographics as well shapes where our focus needs to be in the WIS Project as well. You know, the recreation centres – some sat in the eastern corridor, which is our more affluent areas and some sat in the
mountain township area, which was one of our lest affluent areas and has high rates of diabetes and obesity so understanding that we should be
putting a little bit more effort towards that area as opposed to other areas that might be going along fine.” [Council manager]
Many participants described the importance of intervention site and LGA context in determining the ease of implementation and outcomes of WIS. Within both sport and recreation facilities
1 A governing agency to oversee accreditation for example: VicHealth or Department of Health and Human services
Water in Sport: Deakin University final evaluation report to VicHealth 63
and clubs, important contextual factors included infrastructure, organisational structures, and customer demographics. Storage facilities affected ability to store low selling items, and purchase in bulk to reduce costs and workload for sourcing products. Organisational structures supported implementation when there were fewer management levels between those making decisions about participation and site personnel implementing changes. Customer age and type of activity customers were undertaking at the site (e.g. community sport, volunteering, solo exercise, spectating) affected customer purchasing and preferences, for example whether customers were more likely to be seeking fuel for exercise or a treat. This in turn affected customer acceptability of changes (see ‘Recommendation 10’ for further discussion). Food outlets run by sporting clubs, such as basketball or football clubs, were generally considered a more difficult implementation setting than permanent sport and recreation facilities. Clubs frequently had more ad hoc drinks stocking processes, fewer paid staff and more volunteers with limited training and time, were more likely to be operating seasonally only, and food outlet opening hours were less likely to correspond to council PO working hours. Clubs that did implement changes had a greater emphasis on the canteen as a core club function, with longer opening hours, facilitating infrastructure, and higher club committee prioritisation of healthy changes. RECOMMENDATION 7: ENGAGE RETAIL PERSONNEL AND MANAGEMENT EARLY AND OFTEN
RECOMMENDATION 7.1: BRING EVERYONE ALONG FOR THE JOURNEY [LOCAL GOVERNMENT (PROJECT
OFFICER); FACILITY MANAGEMENT] RECOMMENDATION 7.2: ENSURE REGULAR TWO-WAY COMMUNICATION BETWEEN COUNCIL AND SITE
PERSONNEL AND MANAGEMENT [LOCAL GOVERNMENT (PROJECT OFFICER)] RECOMMENDATION 7.3: RECRUIT, TRAIN, AND REINFORCE FACILITY PERSONNEL AND VOLUNTEERS WHO
SUPPORT HEALTHY CHANGES [FACILITY MANAGEMENT]
“It’s the future and we need to very strongly push that forward in what we do. And just take people on the journey with you. Sometimes it’s not about everyone being onboard early. Some people might take a small amount of
time, or a large amount of time, but time will change, and people will see the need for it.” [Facility manager]
Councils that had made previous changes, had previous established relationships with facilities, or that included new facilities designed with HCG compliance in mind often were perceived to have an easier time engaging site managers and personnel. However, previous experiences of unsuccessful changes made personnel more resistant to WIS implementation. At one council, some initial club resistance stemmed from a lack of club understanding before the project started on the level of support and what the project required them to do. The engagement of the PO with facility personnel and management was viewed as a key first step in implementation. For clubs, decision-makers may also include the management committee. This was integral to getting decision-makers and implementors on board with healthy changes, understanding and addressing their concerns, and ensuring the longevity of changes. At the site level, manager willingness was influenced by preference for the status quo, anticipatory and actual profit losses, customer resistance, and personnel engagement. However, it could be increased by engagement with POs, demonstration of customer support, and successful implementation of a small ‘quick win’. For example, this might include using case
Water in Sport: Deakin University final evaluation report to VicHealth 64
studies of profitable interventions, or discussing the alignment between club community development and promoting healthy eating. Customer survey results were used by POs to demonstrate customer support to council and managers. Some retailers used their own anecdotal data to determine if the project was effective, for example perceived changes in order volume from suppliers. Some POs fed back sales results to retailers to address concerns around loss of profit. However, during WIS, the value of sales data to facilities was often lost because feedback was not provided by the research team during the project time frame. Furthermore, many clubs did not collect accurate sales data, which made it difficult to demonstrate the impact of the project on commercial and health behaviour outcomes.
Food outlet personnel are responsible for implementation and are the direct interface with customers. Personnel engagement and understanding of project requirements was therefore considered important for engaging customers (and thereby managers), and in intervention maintenance. Personnel training required PO responsiveness and flexibility in approach. Education of site managers was sometimes sufficient to filter down to personnel, but targeted training for personnel at regular intervals to account for casual personnel and personnel turnover was important.
RECOMMENDATION 8: START BY TRIALLING A SMALL ‘QUICK WIN’ WHICH IS EASY TO IMPLEMENT AND UNLIKELY TO
CAUSE REVENUE LOSS [LOCAL GOVERNMENT (PROJECT OFFICER)]
“Give it a go. Definitely. Do it.” [Facility manager]
A staged implementation approach was universally seen as desirable. A gradual process allowed for learning from, and adapting to, challenges, and for customers and personnel to adjust to the change. At the beginning of project, starting with trialling small and easy-to-implement “quick wins”, such as rearranging the fridge to put ‘green’ drinks at eye-level, was a non-threatening way to engage facility personnel and management. By contrast, full HCG achievement was seen by POs as too challenging a goal to be discussed in initial retailer engagement. Moreover, success in small trials could be used as case studies for engagement of other facilities. RECOMMENDATION 9: ESTABLISH SUPPLY SIDE INITIATIVES TO SUPPORT HEALTHY FOOD RETAIL INTERNALLY AND
EXTERNALLY TO FACILITIES TO IMPROVE THE SUPPLY CHAIN [LOCAL GOVERNMENT (PROJECT OFFICER); IMPLEMENTATION SUPPORT AGENCY]
“I think the support really comes from advocating with suppliers…Healthy eating is just another layer in there for them. And it’s been appreciative the
efforts that they’re going to now, they’ve recognised that and recognised the financial importance of that for their brand to now be able to supply [healthy
alternatives] at [our chain] venues.” [Facility manager]
The ability to source appropriate healthy alternatives was universally noted as key to maintaining customer demand and profitability. Most stakeholders acknowledged that drink suppliers now have a wide range of healthy alternatives to appeal to customers and expected range to continue to increase as population demand for healthy alternatives increased. Healthy food options were still limited but increasing. Even so, PO time was important in exploring supply options and for correctly classifying items as ‘red’, ‘amber’ or ‘green’. For example, while
Water in Sport: Deakin University final evaluation report to VicHealth 65
classic soft drinks were easy to identify as being ‘red’ drinks, some drink types including juices and milk-based products were more challenging for facility personnel to consistently identify correctly. The limited range of alternatives from specific contracted suppliers combined with restrictive supplier agreements, was the major supply barrier for facilities. The engagement of the supplier was one way of encouraging the supplier to source new alternatives. However, local government reported mixed success in engaging suppliers in change and this was frequently perceived as being outside the influence of local government or individual facilities. At one council, the PO worked with Nutrition Australia to deliver a “Healthy Choices Forum” to engage suppliers. This provided education to suppliers on the HCGs as well as demonstrating demand for healthier alternatives. Challenges in accessing and maintaining a supply of healthy alternatives were especially prominent in smaller facilities and clubs due to lower purchasing power, limited storage facilities, and informal stocking practices. In one case where multiple facilities served different consumer groups, excess stock was able to be moved around to meet the needs of the customers. Where this was not possible, excess stock was regarded as a liability. Many clubs purchased stock directly from the supermarket, with different individuals responsible in different weeks. At the supermarket, while there was a large range of options, purchases were usually driven by what was on price special. One PO developed a buyers’ guide for supermarket shopping, to provide a quick reference for ‘green’, ‘amber’, and ‘red’ classifications. RECOMMENDATION 10: FOCUS ON THE CUSTOMER EXPERIENCE [LOCAL GOVERNMENT (PROJECT OFFICER); FACILITY
MANAGEMENT]
“Something that I found is customer surveys for example are really helpful for almost debunking those myths around our customers don’t want that food because then you can go well actually they told us that they do want that
food, here’s the evidence.” [Council Project Officer]
Stakeholders agreed customer engagement was critical to profitability and personnel and manager engagement. Stakeholders reported there was generally low awareness by customers of changes, and most resistance faded to acceptance over time. In some cases, a small but vocal minority of unhappy customers reduced personnel interest and engagement in initiative. There were some instances of serious customer pushback that stalled or even reversed progress. One site reversed some healthy changes due to customers vocalising their resistance to the change. In situations where staff were cautious of the changes and concerned about profit loss, it was usually staff driving resistance against changes, rather than the customers themselves. To alleviate these concerns, POs used customer surveys that identified that most customers were supportive of the changes. Customer demographic characteristics were noted to affect acceptability. Mothers with young children, teenagers, and older persons were specified as being most resistant to change and were more likely to value junk food as a treat in sport. This highlighted the need to engage customers in other ways and provide a variety of food and drink options. Strategies used to increase the appeal of healthy options in store included: promotional posters; digital menus;
Water in Sport: Deakin University final evaluation report to VicHealth 66
traffic light labelling; attractive display cabinets; reduced pricing on healthy foods and drinks; increased pricing on ‘red’ drinks (also increased profit); water giveaways; and healthy meal deals. POs who provided more complementary resources to promote WIS reported better engagement from management. The most successful facilities engaged customers through a variety of techniques and undertook to build a healthy brand. RECOMMENDATION 11: RECOGNISE AND INCENTIVISE IMPLEMENTATION AND MAINTENANCE OF HEALTHY CHANGES
[LOCAL GOVERNMENT AND ACCREDITING AGENCIES1]
“Getting them to fully meet the guidelines often requires them to remove a lot of things. Because usually they’re quite heavily stocked with a lot of
unhealthy food and drinks, so there comes a point where you can’t just keep introducing healthier stuff, they may need to remove some of the unhealthy
stuff to help tip the balance a bit; and often they’re really hesitant to do that, because often that stuff is the best sellers. So that’s when the financial thing
comes into it.” [Nutrition Australia project officer].
In contrast to starting with the quick wins to kick-start momentum for change, stakeholders noted that later changes were often more difficult. For example, they may require removing ‘red’ best-sellers. This could result in manager and personnel “project fatigue” and reluctance to continue with implementation. Retailer engagement techniques (see ‘Recommendation 7’) and strategies to engage customers (see ‘Recommendation 10’) could help to offset potential profit losses of these more difficult changes. However, the additional support required even more time and resourcing from the PO. Some stakeholders commented that once the PO role ended, this would remove the reinforcement for these more difficult changes, reducing maintenance. Some councils considered opportunities for financial incentives to adopt and maintain healthy changes via leasing agreements, and other forms of recognition and reward for compliant facilities. It was unclear if these had been effective at increasing adoption and maintenance to date. While marketing material is available from the Healthy Eating Advisory service to promote compliant facilities, several stakeholders flagged the importance of recognising progress towards the HCGs, even if full implementation had not been reached. RECOMMENDATION 12.1: CREATE COUNCIL STRUCTURES FOR ONGOING SUPPORT AND MAINTENANCE OF HEALTHY
FOOD POLICIES [LOCAL GOVERNMENT] RECOMMENDATION 12.2: ESTABLISH ONGOING COUNCIL REPORTING AND MONITORING SYSTEMS TO MAINTAIN SITE
AND COUNCIL ACCOUNTABILITY [LOCAL GOVERNMENT]
“One thing is having to change, the other thing is sustaining it, and then getting through the road, potholes and the bumps that come along the way
as well. It is a journey, it’s not just a marker in time and then everyone moves on.” [Facility manager]
Participants were generally optimistic that the changes to date would be maintained. However, they identified that further changes to the healthiness of the food and drink environments within participating facilities or expansion to other settings were unlikely once the PO had finished. Considerable time and support were needed to embed practices. While certain resources and tools such as fridge planograms and council policies would encourage adherence,
1 A governing agency to oversee accreditation for example: VicHealth or Department of Health and Human Services
Water in Sport: Deakin University final evaluation report to VicHealth 67
a person or contact was considered necessary. There were further concerns about the loss of knowledge with facility personnel turnover and the need to regularly train new site personnel. Several respondents suggested ongoing site monitoring could increase site accountability and therefore the likelihood of nudge maintenance. However, POs made note of the large amount of time required to collect monitoring data for the WIS initiative evaluations. This included communicating with personnel at the facility to set up at time to complete the environmental and fridge audit and conducting the audit itself. In the absence of a PO, councils were considering using other departments already engaged with facilities for monitoring. The importance of continued organisational resourcing for maintenance was acknowledged by stakeholders at all levels, but no clear source of such funding was identified. RECOMMENDATION 12.3: DEVELOP AND REGULARLY REVISE HEALTHY FOOD AND DRINKS POLICY AND
IMPLEMENTATION PLANS FOR COUNCILS AND INTERVENTION FACILITIES [LOCAL GOVERNMENT]
“How do we actually get in there, and what are our advantages and how do we play to our advantage?” [Council project officer]
Program planning was often reported to have been given insufficient attention at the beginning of WIS. An acknowledgement that healthy retail changes take at least two years to embed necessitated long-term strategic planning and a staged approach. Participants reflected on the need for broader strategic planning about where WIS fits in to the overall council obesity and wellbeing strategies. There was also inconsistent consideration of current barriers, and opportunities for change within council, which may have been exacerbated by the highly focused nature of WIS funding and deliverables. One council WIS used a strategic staged approach beginning with integration of healthy eating priorities into the Municipal Plan, or Health and Wellbeing Plan prior to WIS. The plan acknowledged the resources available for the project, with a planned phased facility engagement process, to allow tailoring to individual facilities, and for learnings to be integrated over time. This approach facilitated ongoing revision of the workplan in reference to the broader goal of promoting healthy eating across council areas of influence.
Water in Sport: Deakin University final evaluation report to VicHealth 68
11. Discussion
Sport and recreation and club facilities are increasingly recognised as key players in promoting health, however the food and drinks provided are often misaligned with their healthy lifestyle messages. The evaluation of the WIS initiative demonstrates that this capacity building approach can support healthy retail change in sport and recreation facilities. The combination of the appointment of a PO and funding of Nutrition Australia appeared to support the implementation of the nudges. A number of stakeholders identified that the PO acted as the ‘champion’ of the program, and that providing these ‘champions’ with practical support from Nutrition Australia filled critical knowledge gaps. Overall, 45 nudges were implemented in 39 facilities or clubs with at least one nudge implemented in each LGA. The WIS initiative had a subsequent effect on the availability of drinks, with a 28% reduction in ‘red’ drinks (baseline: 39%; 18-months: 11%) and an 20% increase in ‘green’ drinks (baseline: 43%; 18-months: 63%) available at the WIS sport and recreation facilities. While the proportion of ‘red’ drinks decreased, the food environment audits demonstrated that a high proportion of foods available continued to be classified as ‘red’ at every timepoint. Making changes to the food available at the facilities was outside the original scope of the WIS project and therefore only a small decrease in ‘red’ item availability (-5%) was observed. Following the implementation of the WIS initiative, in seasonal facilities, the mean percentage volume of ‘red’ drinks sold each week was reduced by 22.5 percentage points. In non-seasonal facilities there was considerable variation and therefore there was no significant overall change. However, there was a decrease in ‘red’ drinks sold in six of ten analysed non-seasonal facilities. There is limited literature on the current food and drink landscape in sport and recreation facilities in Australia or elsewhere, however one Australian study examined the food and drinks purchased by customers at these facilities, finding a high proportion classified as unhealthy [11]. A similar initiative to the WIS initiative, whereby sport and recreation facilities (n = 21) in Canada were provided with training support and resources to improve their food and drink retail environment demonstrated a 10% decrease in availability of unhealthy vending products and a 4% increase in availability of healthy vending products [12]. Facilities which received support and training demonstrated greater improvement, highlighting the importance of support in making healthy changes [12]. Following the implementation of the WIS initiatives, sales volume of ‘red’ drinks decreased in seasonal facilities and in six of the ten analysed non-seasonal facilities. Similarly, a recent study exploring the impact of a sugary drink reduction intervention, whereby facilities reduced the availability of sugary drinks over a one-year period. This intervention, in 16 Victorian sport and recreation facilities, reported that volume sales of ‘red’ drinks decreased by 46.2% one year after implementation [13]. Other studies have demonstrated similar reductions in the sales of targeted unhealthy food and drinks in sport and recreation facilities when availability is reduced [14, 15]. In the WIS initiative, sales of the volume of ‘green’ drinks increased in four non-seasonal facilities. A no ‘red’ healthy eating trial conducted in another Victorian sporting facility also demonstrated that the changes in availability of ‘red’ drinks had positive effect on purchasing behaviour, with sales of ‘red’ items decreasing by around 60% and in increase in ‘green’ and ‘amber’ drinks sold [16]. The relatively smaller change in sales of ‘red’ drinks in WIS facilities may be because the priority to promote healthy drink purchasing was already high prior to the
Water in Sport: Deakin University final evaluation report to VicHealth 69
implementation of the WIS project, demonstrated by applying for WIS funding. As part of the council application to receive funding, council needed to provide letters of support from the participating facilities. Therefore, these facilities may have already undergone small healthy changes meaning that further decrease was unlikely as evidence in the sales data. Surveys conducted at facilities involved in the WIS initiative demonstrated that three-quarters of customers and staff believed that sport and recreation facilities should promote healthy eating. Customer support to healthy change has been demonstrated in similar settings both within Australia [17, 18] and internationally [19]. The changes to drinks availability and displays implemented in the WIS program were selected as nudges based on evidence indicating that eating is largely an automatic behaviour dictated by environmental cues and therefore the availability and display of food can have a large impact on choice [20]. Indicative of this, there was low customer awareness of the change before and after the intervention, however there was a small increase in awareness at follow-up. Similar results of high customer support and low awareness have been seen in another Victorian nudge trial in three sport and recreation facilities discounting the price of healthy options and increasing the price of unhealthy option and discounted healthy bundles [21]. In the WIS initiative, both customers and staff had little confidence that removing sugary drinks would reduce consumption of these items. Coupling availability-based interventions such as the removal of unhealthy drinks with other strategies such as pricing or promotion may increase its effectiveness [21-23]. The LGA food policy and action surveys conducted in 26 LGAs in 2018 and 2020 demonstrated that LGA priorities related to obesity and healthy eating were higher in WIS councils than in non-WIS councils at baseline (including reducing the availability of sugary drinks in sport and recreation facilities). While these priorities did not change at follow-up for WIS councils, non-WIS council priorities for obesity and healthy eating increased from baseline to follow-up. The increase in prioritisation in non-WIS LGAs is reflective of the large amount of work currently occurring to improve the food and drink environment in sport and recreation facilities in Victoria. The lack of change in WIS councils is likely due to these councils already having high prioritisation of obesity and healthy eating, indicated by their application to be a part of the WIS initiative. Barriers and enablers to implementing healthy retail changes were similar between WIS and the non-WIS LGAs, at both baseline and follow-up. A range of barriers and enablers were identified as important by LGA respondents at both timepoints. Both WIS and non-WIS councils reported support from key stakeholders (e.g. LGA members, leadership teams) to be the most important enabler of implementing healthy changes, and lack of key support to be the most important barrier. LGA respondents identified financial viability of a healthy retail change as a barrier and enabler at follow-up (this barrier was not available for selection at baseline). Interviews with WIS stakeholders also revealed that fear around loss of profit was a key concern when implementing healthy changes. These findings align with results of qualitative interviews with Victorian [21] and Canadian [24] sport and recreation managers which identified staff, management and customer support as facilitators [21, 24], and fear of sacrificing short term profitability as a barrier to implementation [24], and reflected the broader literature concerning retailer barriers to implementing healthy changes. WIS stakeholders reported that they benefited from practical implementation support provided by Nutrition Australia and fellow POs, a finding reflected in a systematic review which identified financial and human resources as facilitators to healthy food retail implementation [25]. WIS stakeholders noted the importance of acknowledging retailers for their success in creating
Water in Sport: Deakin University final evaluation report to VicHealth 70
healthier food environments, through central accreditation schemes, such as the Victorian Achievement Program [26]. The Achievement Program is a Victorian Government initiative in partnership with Cancer Council Victoria that supports Victorian workplaces, schools, and early childhood services to create healthy environments. Organisations can register for this free program and can receive recognition once they meet specific standards such as encouraging healthy eating. Limited research exists evaluating the effect of such programs, however one study evaluating a similar accreditation scheme present in Hong Kong schools, demonstrated the effectiveness of this program [27]. The study concluded that schools achieving accreditation had a larger reduction of childhood obesity compared to those without accreditation [27]. An accreditation scheme could be established to support sport and recreation facilities to improve their food and drink environment and could include meeting standards such as offering free water and displaying and promoting healthy drinks. WIS stakeholders identified that lack of staff availability and high staff/volunteer turnover as a key barrier to implementing the WIS initiative. This was often seen in smaller facilities or club facilities. For example, high facility staff turnover made it challenging to provide training to classify drinks according to the HCGs to ensure appropriate drinks were purchased for facilities. It is therefore important to consider organisational structure and build capacity within an organisation so that initiative sustainability is not dependent on one single person [28, 29]. Conclusion The evaluation of the WIS initiative demonstrated that the availability reductions of unhealthy drinks was feasible, created healthier drink environments, and resulted in reduced purchases of targeted drinks by sport and recreation patrons. Qualitative enquiry revealed the perceived importance of the support of the PO for implementation. Further implementation and the ongoing sustainability of the WIS initiative are likely to require financial support for human resourcing from councils or external organisations given the key role of PO throughout the project.
12. Recommendations
Based on the evaluation of the WIS initiative, including reflections from key stakeholders in the qualitative evaluation, along with key learnings from the research team, and the broader literature, several recommendations and suggested implementation strategies are outlined to facilitate and promote the implementation of nudges to create healthier food and drink environments in community retail settings (Table 19). The recommendations are targeted at the convening agency (such as VicHealth), local governments, implementation support agencies (such as the Healthy Eating Advisory Service) and/or other stakeholder groups. The greatest population impact will be supported by different stakeholders taking action to promote healthy food retail within their own spheres of influences.
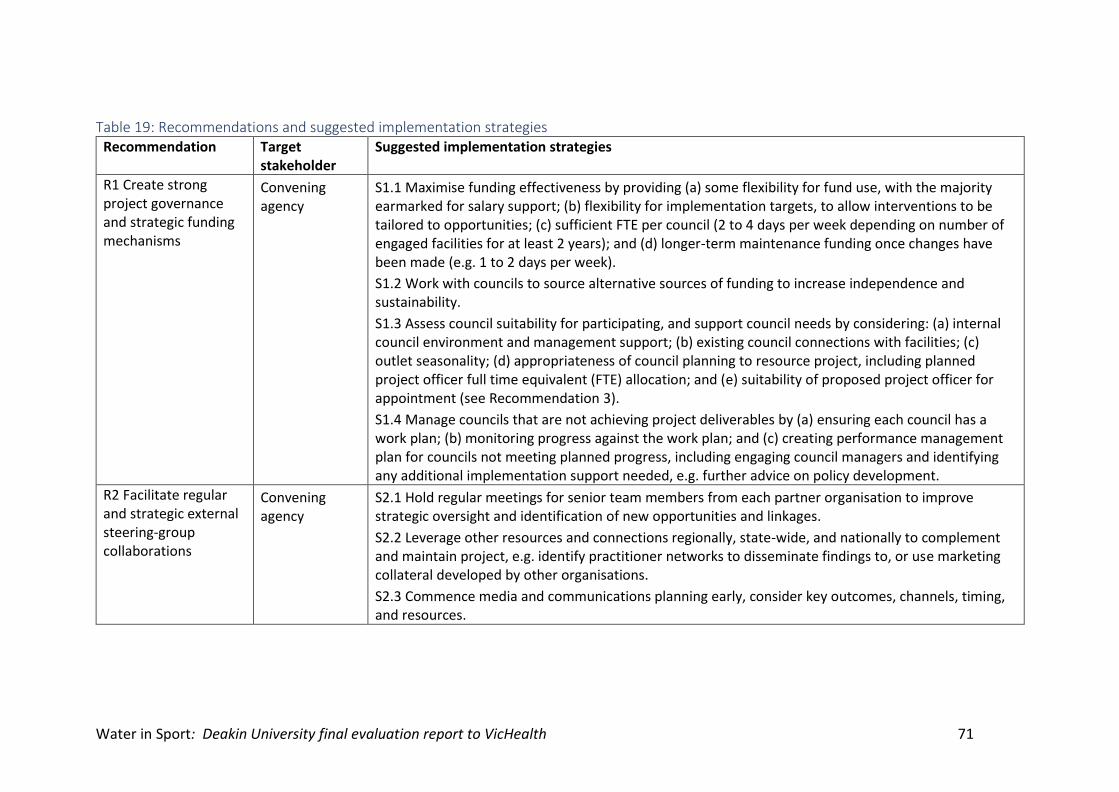
Water in Sport: Deakin University final evaluation report to VicHealth 71
Table 19: Recommendations and suggested implementation strategies Recommendation Target
stakeholder Suggested implementation strategies
R1 Create strong project governance and strategic funding mechanisms
Convening agency
S1.1 Maximise funding effectiveness by providing (a) some flexibility for fund use, with the majority earmarked for salary support; (b) flexibility for implementation targets, to allow interventions to be tailored to opportunities; (c) sufficient FTE per council (2 to 4 days per week depending on number of engaged facilities for at least 2 years); and (d) longer-term maintenance funding once changes have been made (e.g. 1 to 2 days per week).
S1.2 Work with councils to source alternative sources of funding to increase independence and sustainability.
S1.3 Assess council suitability for participating, and support council needs by considering: (a) internal council environment and management support; (b) existing council connections with facilities; (c) outlet seasonality; (d) appropriateness of council planning to resource project, including planned project officer full time equivalent (FTE) allocation; and (e) suitability of proposed project officer for appointment (see Recommendation 3).
S1.4 Manage councils that are not achieving project deliverables by (a) ensuring each council has a work plan; (b) monitoring progress against the work plan; and (c) creating performance management plan for councils not meeting planned progress, including engaging council managers and identifying any additional implementation support needed, e.g. further advice on policy development.
R2 Facilitate regular and strategic external steering-group collaborations
Convening agency
S2.1 Hold regular meetings for senior team members from each partner organisation to improve strategic oversight and identification of new opportunities and linkages.
S2.2 Leverage other resources and connections regionally, state-wide, and nationally to complement and maintain project, e.g. identify practitioner networks to disseminate findings to, or use marketing collateral developed by other organisations.
S2.3 Commence media and communications planning early, consider key outcomes, channels, timing, and resources.
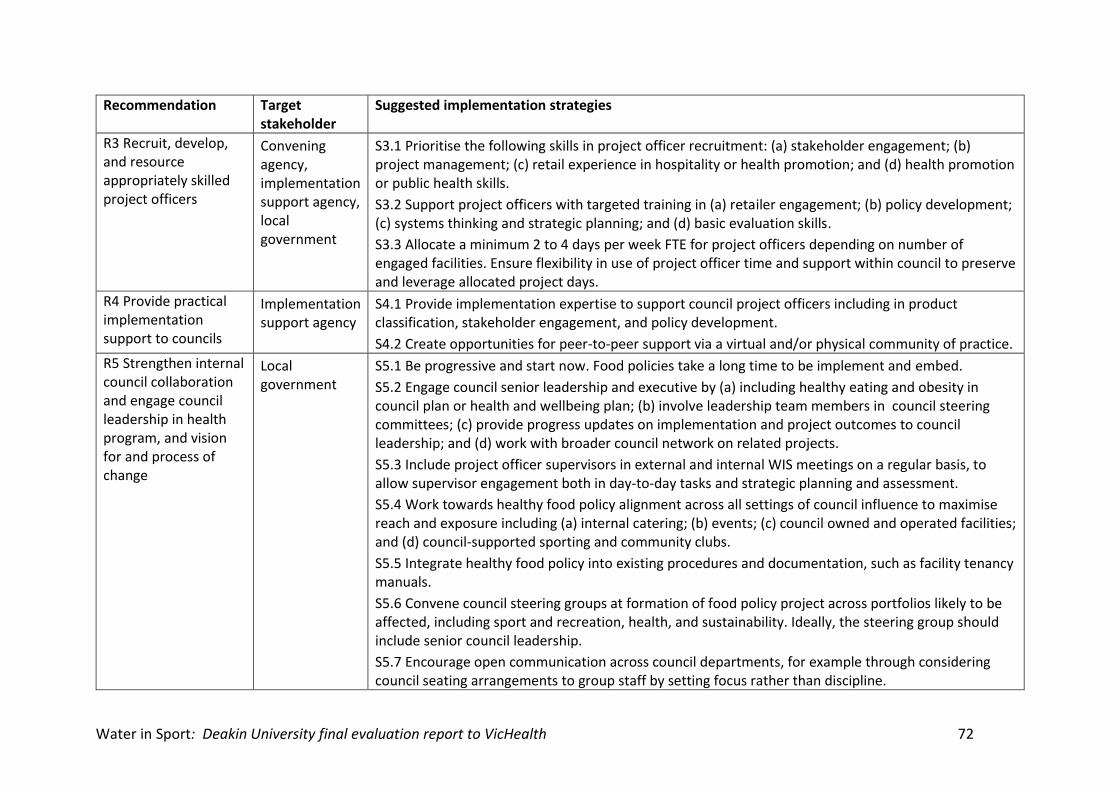
Water in Sport: Deakin University final evaluation report to VicHealth 72
Recommendation Target stakeholder
Suggested implementation strategies
R3 Recruit, develop, and resource appropriately skilled project officers
Convening agency, implementation support agency, local government
S3.1 Prioritise the following skills in project officer recruitment: (a) stakeholder engagement; (b) project management; (c) retail experience in hospitality or health promotion; and (d) health promotion or public health skills.
S3.2 Support project officers with targeted training in (a) retailer engagement; (b) policy development; (c) systems thinking and strategic planning; and (d) basic evaluation skills.
S3.3 Allocate a minimum 2 to 4 days per week FTE for project officers depending on number of engaged facilities. Ensure flexibility in use of project officer time and support within council to preserve and leverage allocated project days.
R4 Provide practical implementation support to councils
Implementation support agency
S4.1 Provide implementation expertise to support council project officers including in product classification, stakeholder engagement, and policy development.
S4.2 Create opportunities for peer-to-peer support via a virtual and/or physical community of practice.
R5 Strengthen internal council collaboration and engage council leadership in health program, and vision for and process of change
Local government
S5.1 Be progressive and start now. Food policies take a long time to be implement and embed.
S5.2 Engage council senior leadership and executive by (a) including healthy eating and obesity in council plan or health and wellbeing plan; (b) involve leadership team members in council steering committees; (c) provide progress updates on implementation and project outcomes to council leadership; and (d) work with broader council network on related projects.
S5.3 Include project officer supervisors in external and internal WIS meetings on a regular basis, to allow supervisor engagement both in day-to-day tasks and strategic planning and assessment.
S5.4 Work towards healthy food policy alignment across all settings of council influence to maximise reach and exposure including (a) internal catering; (b) events; (c) council owned and operated facilities; and (d) council-supported sporting and community clubs.
S5.5 Integrate healthy food policy into existing procedures and documentation, such as facility tenancy manuals.
S5.6 Convene council steering groups at formation of food policy project across portfolios likely to be affected, including sport and recreation, health, and sustainability. Ideally, the steering group should include senior council leadership.
S5.7 Encourage open communication across council departments, for example through considering council seating arrangements to group staff by setting focus rather than discipline.
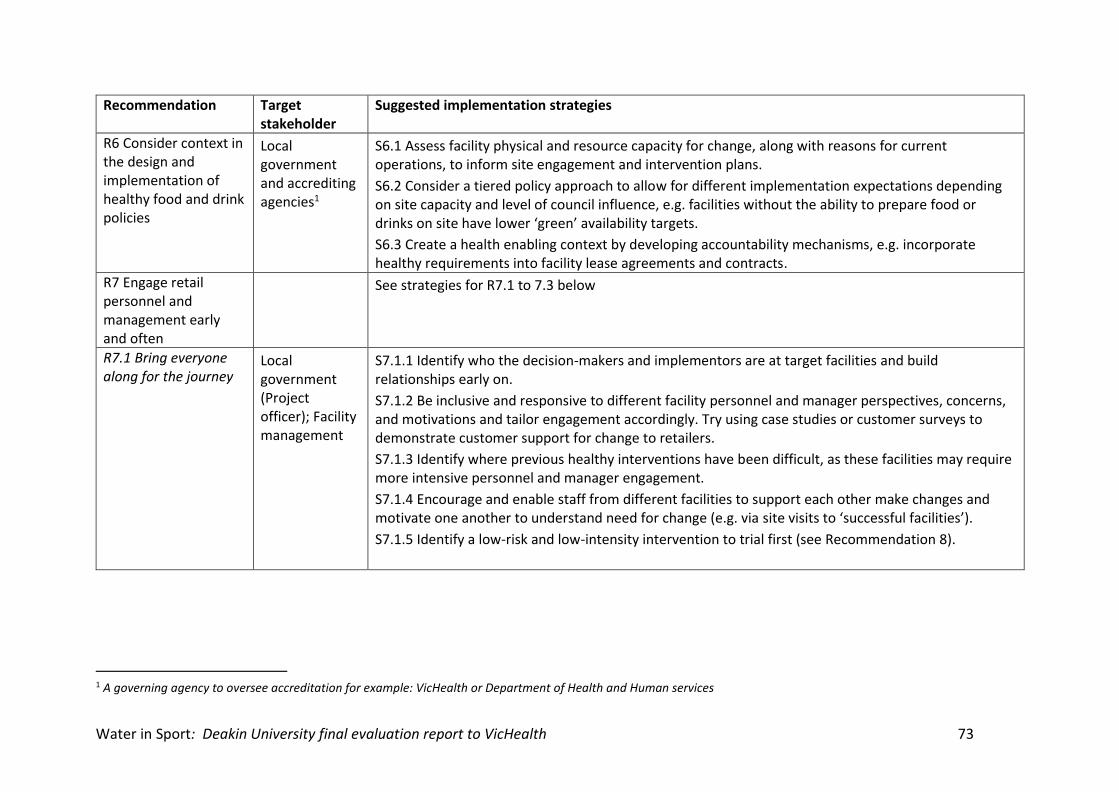
Water in Sport: Deakin University final evaluation report to VicHealth 73
Recommendation Target stakeholder
Suggested implementation strategies
R6 Consider context in the design and implementation of healthy food and drink policies
Local government and accrediting agencies1
S6.1 Assess facility physical and resource capacity for change, along with reasons for current operations, to inform site engagement and intervention plans.
S6.2 Consider a tiered policy approach to allow for different implementation expectations depending on site capacity and level of council influence, e.g. facilities without the ability to prepare food or drinks on site have lower ‘green’ availability targets.
S6.3 Create a health enabling context by developing accountability mechanisms, e.g. incorporate healthy requirements into facility lease agreements and contracts.
R7 Engage retail personnel and management early and often
See strategies for R7.1 to 7.3 below
R7.1 Bring everyone along for the journey
Local government (Project officer); Facility management
S7.1.1 Identify who the decision-makers and implementors are at target facilities and build relationships early on.
S7.1.2 Be inclusive and responsive to different facility personnel and manager perspectives, concerns, and motivations and tailor engagement accordingly. Try using case studies or customer surveys to demonstrate customer support for change to retailers.
S7.1.3 Identify where previous healthy interventions have been difficult, as these facilities may require more intensive personnel and manager engagement.
S7.1.4 Encourage and enable staff from different facilities to support each other make changes and motivate one another to understand need for change (e.g. via site visits to ‘successful facilities’).
S7.1.5 Identify a low-risk and low-intensity intervention to trial first (see Recommendation 8).
1 A governing agency to oversee accreditation for example: VicHealth or Department of Health and Human services
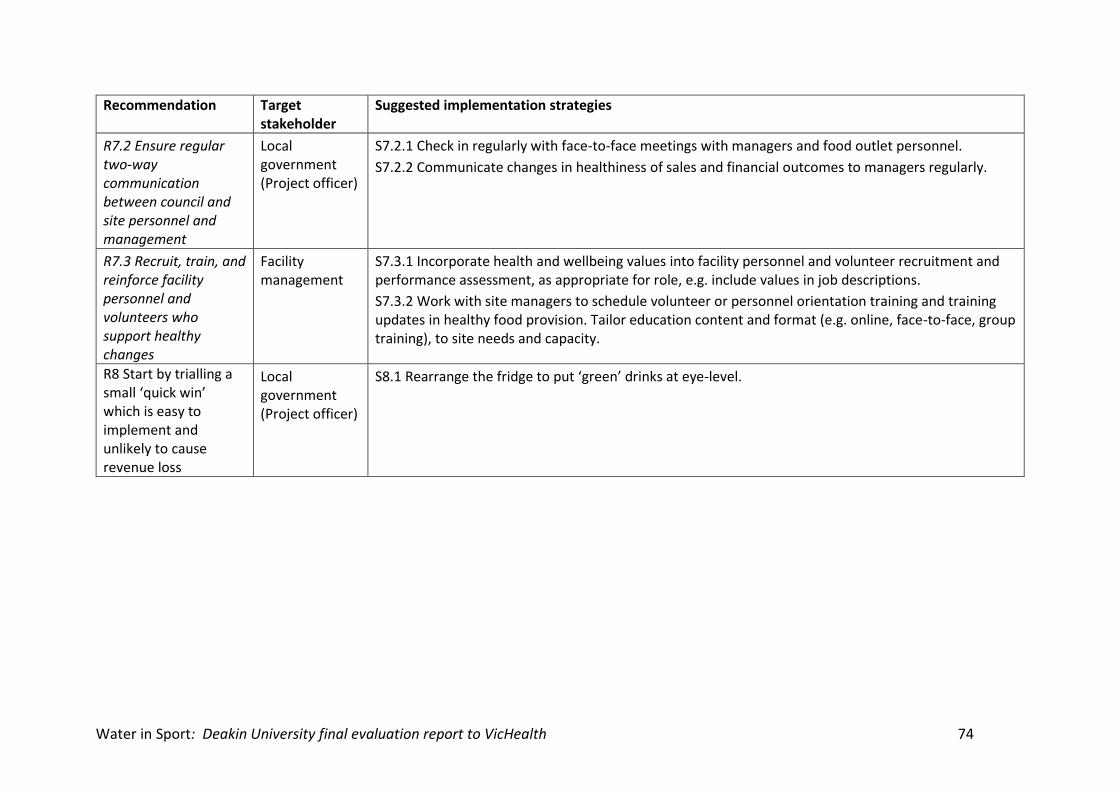
Water in Sport: Deakin University final evaluation report to VicHealth 74
Recommendation Target stakeholder
Suggested implementation strategies
R7.2 Ensure regular two-way communication between council and site personnel and management
Local government (Project officer)
S7.2.1 Check in regularly with face-to-face meetings with managers and food outlet personnel.
S7.2.2 Communicate changes in healthiness of sales and financial outcomes to managers regularly.
R7.3 Recruit, train, and reinforce facility personnel and volunteers who support healthy changes
Facility management
S7.3.1 Incorporate health and wellbeing values into facility personnel and volunteer recruitment and performance assessment, as appropriate for role, e.g. include values in job descriptions.
S7.3.2 Work with site managers to schedule volunteer or personnel orientation training and training updates in healthy food provision. Tailor education content and format (e.g. online, face-to-face, group training), to site needs and capacity.
R8 Start by trialling a small ‘quick win’ which is easy to implement and unlikely to cause revenue loss
Local government (Project officer)
S8.1 Rearrange the fridge to put ‘green’ drinks at eye-level.
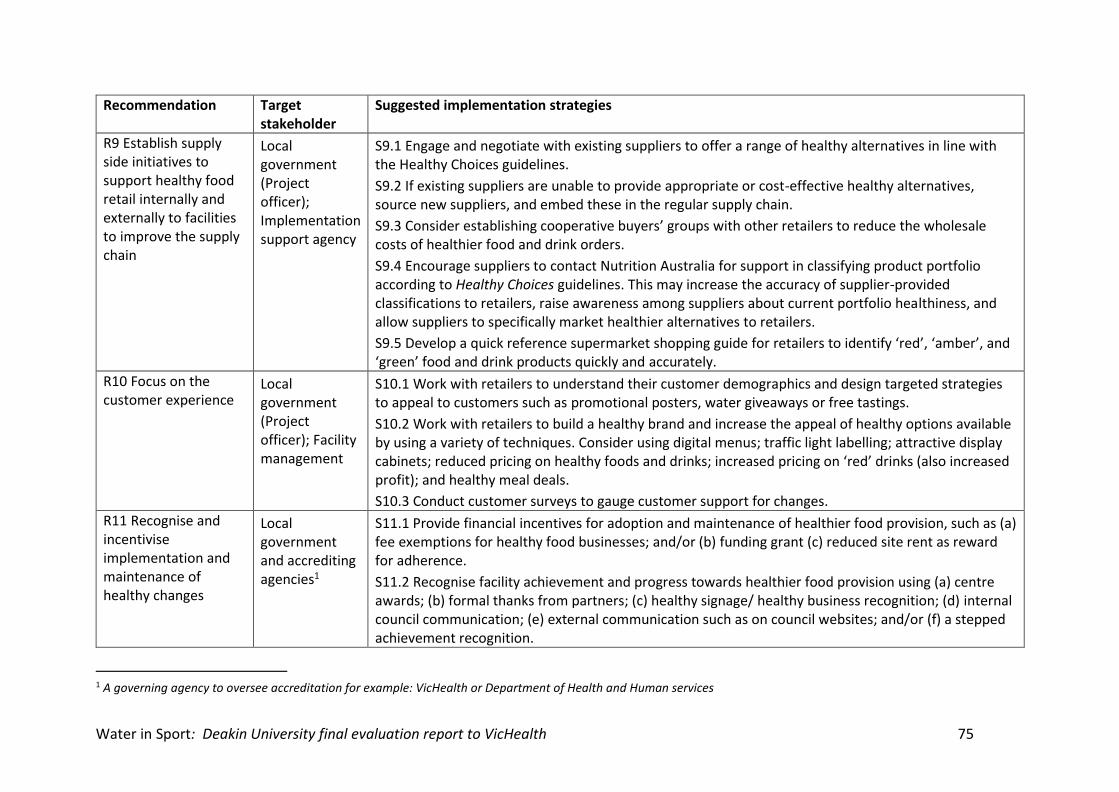
Water in Sport: Deakin University final evaluation report to VicHealth 75
Recommendation Target stakeholder
Suggested implementation strategies
R9 Establish supply side initiatives to support healthy food retail internally and externally to facilities to improve the supply chain
Local government (Project officer); Implementation support agency
S9.1 Engage and negotiate with existing suppliers to offer a range of healthy alternatives in line with the Healthy Choices guidelines.
S9.2 If existing suppliers are unable to provide appropriate or cost-effective healthy alternatives, source new suppliers, and embed these in the regular supply chain.
S9.3 Consider establishing cooperative buyers’ groups with other retailers to reduce the wholesale costs of healthier food and drink orders.
S9.4 Encourage suppliers to contact Nutrition Australia for support in classifying product portfolio according to Healthy Choices guidelines. This may increase the accuracy of supplier-provided classifications to retailers, raise awareness among suppliers about current portfolio healthiness, and allow suppliers to specifically market healthier alternatives to retailers.
S9.5 Develop a quick reference supermarket shopping guide for retailers to identify ‘red’, ‘amber’, and ‘green’ food and drink products quickly and accurately.
R10 Focus on the customer experience
Local government (Project officer); Facility management
S10.1 Work with retailers to understand their customer demographics and design targeted strategies to appeal to customers such as promotional posters, water giveaways or free tastings.
S10.2 Work with retailers to build a healthy brand and increase the appeal of healthy options available by using a variety of techniques. Consider using digital menus; traffic light labelling; attractive display cabinets; reduced pricing on healthy foods and drinks; increased pricing on ‘red’ drinks (also increased profit); and healthy meal deals.
S10.3 Conduct customer surveys to gauge customer support for changes.
R11 Recognise and incentivise implementation and maintenance of healthy changes
Local government and accrediting agencies1
S11.1 Provide financial incentives for adoption and maintenance of healthier food provision, such as (a) fee exemptions for healthy food businesses; and/or (b) funding grant (c) reduced site rent as reward for adherence.
S11.2 Recognise facility achievement and progress towards healthier food provision using (a) centre awards; (b) formal thanks from partners; (c) healthy signage/ healthy business recognition; (d) internal council communication; (e) external communication such as on council websites; and/or (f) a stepped achievement recognition.
1 A governing agency to oversee accreditation for example: VicHealth or Department of Health and Human services
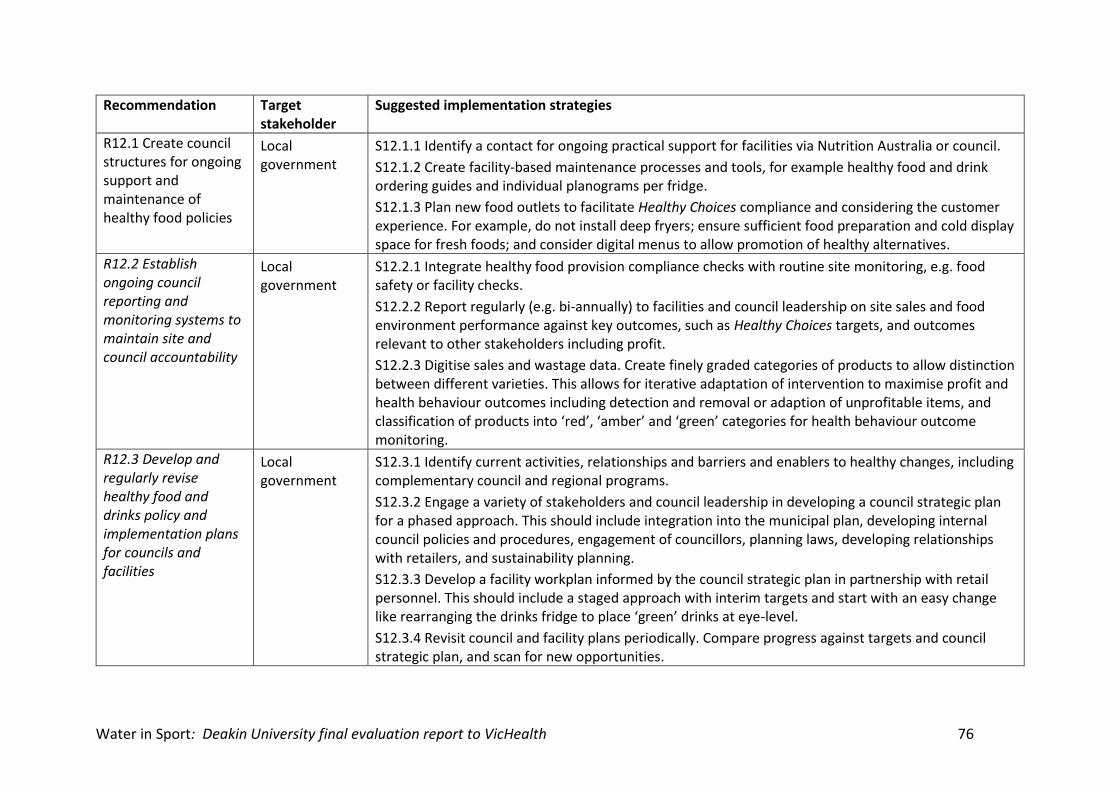
Water in Sport: Deakin University final evaluation report to VicHealth 76
Recommendation Target stakeholder
Suggested implementation strategies
R12.1 Create council structures for ongoing support and maintenance of healthy food policies
Local government
S12.1.1 Identify a contact for ongoing practical support for facilities via Nutrition Australia or council.
S12.1.2 Create facility-based maintenance processes and tools, for example healthy food and drink ordering guides and individual planograms per fridge.
S12.1.3 Plan new food outlets to facilitate Healthy Choices compliance and considering the customer experience. For example, do not install deep fryers; ensure sufficient food preparation and cold display space for fresh foods; and consider digital menus to allow promotion of healthy alternatives.
R12.2 Establish ongoing council reporting and monitoring systems to maintain site and council accountability
Local government
S12.2.1 Integrate healthy food provision compliance checks with routine site monitoring, e.g. food safety or facility checks.
S12.2.2 Report regularly (e.g. bi-annually) to facilities and council leadership on site sales and food environment performance against key outcomes, such as Healthy Choices targets, and outcomes relevant to other stakeholders including profit.
S12.2.3 Digitise sales and wastage data. Create finely graded categories of products to allow distinction between different varieties. This allows for iterative adaptation of intervention to maximise profit and health behaviour outcomes including detection and removal or adaption of unprofitable items, and classification of products into ‘red’, ‘amber’ and ‘green’ categories for health behaviour outcome monitoring.
R12.3 Develop and regularly revise healthy food and drinks policy and implementation plans for councils and facilities
Local government
S12.3.1 Identify current activities, relationships and barriers and enablers to healthy changes, including complementary council and regional programs.
S12.3.2 Engage a variety of stakeholders and council leadership in developing a council strategic plan for a phased approach. This should include integration into the municipal plan, developing internal council policies and procedures, engagement of councillors, planning laws, developing relationships with retailers, and sustainability planning.
S12.3.3 Develop a facility workplan informed by the council strategic plan in partnership with retail personnel. This should include a staged approach with interim targets and start with an easy change like rearranging the drinks fridge to place ‘green’ drinks at eye-level.
S12.3.4 Revisit council and facility plans periodically. Compare progress against targets and council strategic plan, and scan for new opportunities.
Water in Sport: Deakin University final evaluation report to VicHealth 77
13. Acknowledgments
13.1. FUNDING This project was supported through funds from VicHealth. All authors are researchers within the NHMRC funded Centre of Research Excellence in Food Retail Environments for Health (RE-FRESH) (APP1152968). The opinions, analysis, and conclusions in this paper are those of the authors and should not be attributed to the NHMRC. AJC is the recipient of a Heart Foundation Future Leader Fellowship from the National Heart Foundation of Australia (project 102611). MB, LO and HR are supported by Deakin University. TBR is supported by the NHRMC and Deakin University. AP is supported by the NHMRC.
13.2. PARTICIPANTS We would like to extend our thanks all local governments involved in the WIS project, specifically the POs for their part in this evaluation. We would also like to thank all the individuals that participated in the interviews and completed customers and staff surveys.
Water in Sport: Deakin University final evaluation report to VicHealth 78
14. References
1. Schwartz MB, Just DR, Chriqui JF, Ammerman ASJO. Appetite self‐regulation: Environmental and policy influences on eating behaviors. 2017;25:S26-S38. 2. Block JP, Gillman MW, Linakis SK, Goldman RE. "If it tastes good, I'm drinking it": qualitative study of beverage consumption among college students. J Adolesc Health. 2013;52(6):702-6. 3. Department of Health and Human Services. Healthy Choices: policy guidelines for sport and recreation centres 2016. [cited 2020 Feb]. Available from: https://www2.health.vic.gov.au/. 4. Healthy Eating Advisory Service. FoodChecker 2016. [cited 2020 Feb]. Available from: http://foodchecker.heas.health.vic.gov.au. 5. Commonwealth of Australia,Bureau of Meteorology . Climate Data Online. 2020. [cited 2020 Aug]. Available from: http://www.bom.gov.au/climate/data/. 6. Backholer K, Mannan HR, Magliano DJ, Walls HL, Stevenson C, Beauchamp A, Shaw JE, Peeters A. Projected socioeconomic disparities in the prevalence of obesity among Australian adults. Aust N Z J Public Health. 2012 Dec;36(6):557-63. 7. Östlund U, Kidd L, Wengström Y, Rowa-Dewar N. Combining qualitative and quantitative research within mixed method research designs: a methodological review. Int J Nurs Stud. 2011;48(3):369-83. 8. Boelsen-Robinson T, Blake M, editors. Mapping factors associated with shifts towards healthier food retail: a systems approach. World Public Health Nutrition Congress; 2020 31 Mar to 2 Apr; Virtual conference. 9. Richardson GP. Reflections on the foundations of system dynamics. System Dynamics Review. 2011;27(3):219-43. 10. Davies R, Dart J. The ‘most significant change’ (MSC) technique. United Kingdom: CARE International; 2005. 11. Boelsen‐Robinson T, Chung A, Khalil M, Wong E, Kurzeme A, Peeters A. Examining the nutritional quality of food and beverage consumed at Melbourne aquatic and recreation centres. Australian New Zealand Journal of Public Health. 2017;41(2):184-6. 12. Naylor P-J, Olstad DL, Therrien S. An intervention to enhance the food environment in public recreation and sport settings: a natural experiment in British Columbia, Canada. Childhood Obesity. 2015;11(4):364-74. 13. Boelsen-Robinson T, Orellana L, Backholer K, Kurzeme A, Jerebine A, Gilham B, Chung A, Peeters A. Change in drink purchases in 16 Australian recreation centres following a sugar-sweetened beverage reduction initiative: an observational study. BMJ open. 2020;10(3):e029492. 14. McGrath G, Tinney M. Case study: Healthy Choices at Lara Pool. Geelong: State Government of Victoria; 2014. 15. Olstad DL, Goonewardene LA, McCargar LJ, Raine KD. If we offer it, will children buy it? Sales of healthy foods mirrored their availability in a community sport, commercial setting in Alberta, Canada. Child Obes. 2015;11(2):156-64. 16. VicHealth. City of Melbourne sports and recreation centre healthy food retail case study: Evalution Summary.Melbourne (AUST): State Government of Victoria; 2016 [cited 2020 Feb]. Available from: https://www.vichealth.vic.gov.au/. 17. Blake MR, Boelsen-Robinson T, Hanna L, Ryan A, Peeters Implementing a healthy food retail policy: a mixed-methods investigation of change in stakeholders’ perspectives over time. Public Health Nutrtion. [In press].
Water in Sport: Deakin University final evaluation report to VicHealth 79
18. Boelsen-Robinson T & Peeters A. Going Soft Drink Free in YMCA Victoria Aquatic and Recreation Centres: Customer Responses. Report for VicHealth 2017. 2017. Geelong, Australia: Deakin University; [cited 2020 Sept]. Available at https://www.vichealth.vic.gov.au/. 19. Thomas HM, Irwin JD. Food choices in recreation facilities: operators’ and patrons’ perspectives. Canadian Journal of Dietetic Practice Research. 2010;71(4):180-5. 20. Olstad DL, Goonewardene LA, McCargar LJ, Raine KD. Choosing healthier foods in recreational sports settings: a mixed methods investigation of the impact of nudging and an economic incentive. International Journal of Behavioral Nutrition Physical Activity 2014;11(1):6. 21. Huse O, Orellana L, Ferguson M, Palermo C, Jerebine A, Zorbas C, Boelsen-Robinson T, Blake MR, Peeters A, Brimblecombe J. Retailer-led healthy pricing interventions: a pilot study within aquatic and recreation centres in Victoria, Australia. Health Promotion International. 2020. 22. Gittelsohn J, Trude ACB, Kim H. Peer Reviewed: Pricing Strategies to Encourage Availability, Purchase, and Consumption of Healthy Foods and Beverages: A Systematic Review. Preventing Chronic Disease. 2017;14. 23. Thorndike AN, Riis J, Sonnenberg LM, Levy DEJAjopm. Traffic-light labels and choice architecture: promoting healthy food choices. American Journal of Preventive Medicine. 2014;46(2):143-9. 24. Olstad DL, Raine KD, McCargar LJ. Adopting and implementing nutrition guidelines in recreational facilities: tensions between public health and corporate profitability. Public Health Nutrition. 2013;16(5):815-23. 25. Middel CNH, Schuitmaker-Warnaar TJ, Mackenbach JD, Broerse JEW. Systematic review: a systems innovation perspective on barriers and facilitators for the implementation of healthy food-store interventions. The international journal of behavioral nutrition and physical activity. 2019;16(1):108. 26. Jou J, Techakehakij W. International application of sugar-sweetened beverage (SSB) taxation in obesity reduction: factors that may influence policy effectiveness in country-specific contexts. Health Policy. 2012 Sep;107(1):83-90. 27. Fu YCA, To KC, Tao WY, Kwan KMA, Lee YH, Fung YKA, Ching CTR, Chung WHTJGHP. School accreditation scheme reduces childhood obesity in Hong Kong. 2019;26(4):70-8. 28. Casey MM, Payne WR, Eime RMJMl. Building the health promotion capacity of sport and recreation organisations: A case study of Regional Sports Assemblies. Managing Leisure. 2009;14(2):112-24. 29. Global Obesity Centre, Deakin University. Healthy Eating in the West: Economic Evaluation. 2017. [cited 2020 Feb].Available from: http://wordpress-ms.deakin.edu.au/globalobesity/wp-content/uploads/sites/110/2017/10/Healthy-Eating-in-the-West-Melton-Wyndham-evaluation-full-report.pdf.
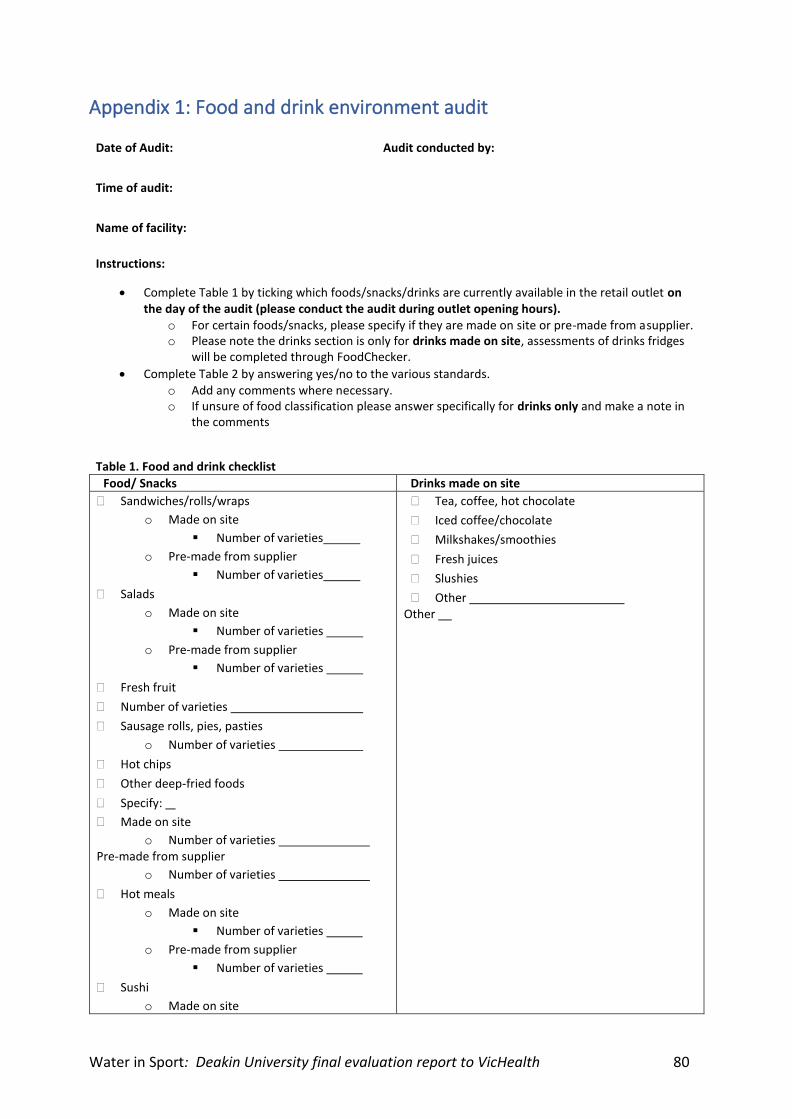
Water in Sport: Deakin University final evaluation report to VicHealth 80
Appendix 1: Food and drink environment audit
Date of Audit: Audit conducted by:
Time of audit:
Name of facility:
Instructions:
• Complete Table 1 by ticking which foods/snacks/drinks are currently available in the retail outlet on the day of the audit (please conduct the audit during outlet opening hours).
o For certain foods/snacks, please specify if they are made on site or pre-made from a supplier. o Please note the drinks section is only for drinks made on site, assessments of drinks fridges
will be completed through FoodChecker.
• Complete Table 2 by answering yes/no to the various standards. o Add any comments where necessary. o If unsure of food classification please answer specifically for drinks only and make a note in
the comments
Table 1. Food and drink checklist
Food/ Snacks Drinks made on site
Sandwiches/rolls/wraps
o Made on site
▪ Number of varieties
o Pre-made from supplier
▪ Number of varieties
Salads
o Made on site
▪ Number of varieties
o Pre-made from supplier
▪ Number of varieties
Fresh fruit
Number of varieties
Sausage rolls, pies, pasties
o Number of varieties
Hot chips
Other deep-fried foods
Specify:
Made on site
o Number of varieties Pre-made from supplier
o Number of varieties
Hot meals
o Made on site
▪ Number of varieties
o Pre-made from supplier
▪ Number of varieties
Sushi
o Made on site
Tea, coffee, hot chocolate
Iced coffee/chocolate
Milkshakes/smoothies
Fresh juices
Slushies
Other Other
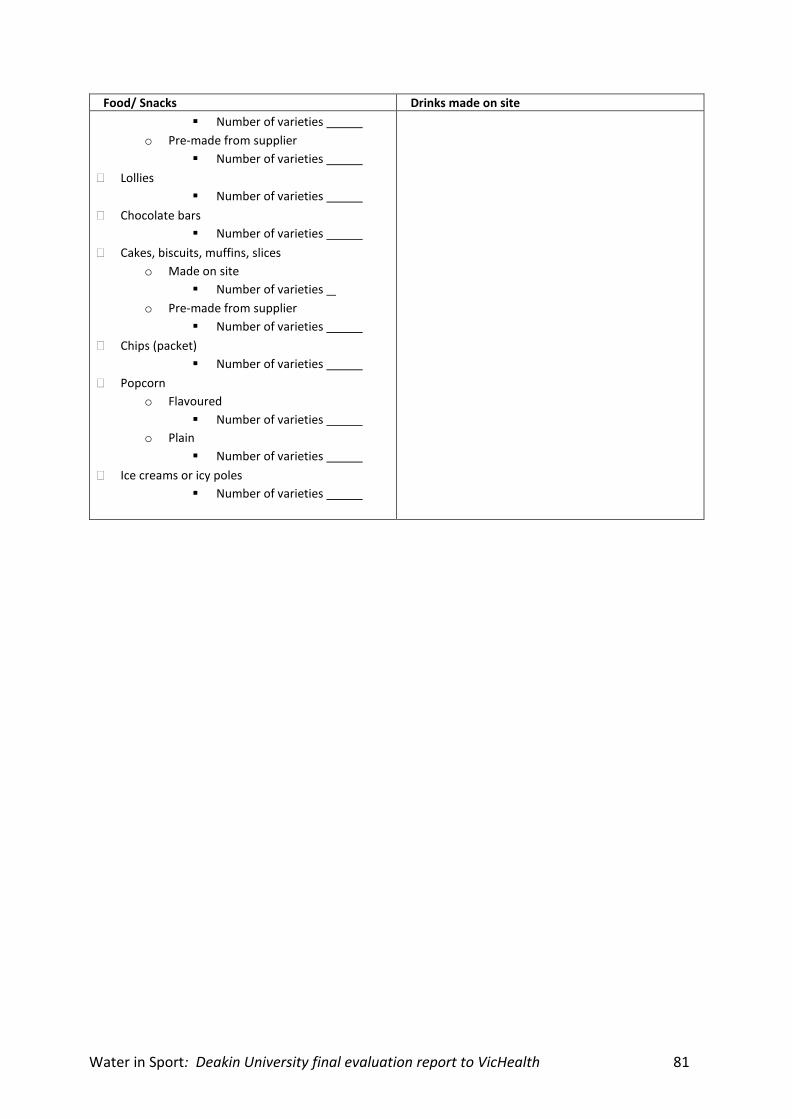
Water in Sport: Deakin University final evaluation report to VicHealth 81
Food/ Snacks Drinks made on site
▪ Number of varieties
o Pre-made from supplier
▪ Number of varieties
Lollies
▪ Number of varieties
Chocolate bars
▪ Number of varieties
Cakes, biscuits, muffins, slices
o Made on site
▪ Number of varieties
o Pre-made from supplier
▪ Number of varieties
Chips (packet)
▪ Number of varieties
Popcorn
o Flavoured
▪ Number of varieties
o Plain
▪ Number of varieties
Ice creams or icy poles
▪ Number of varieties
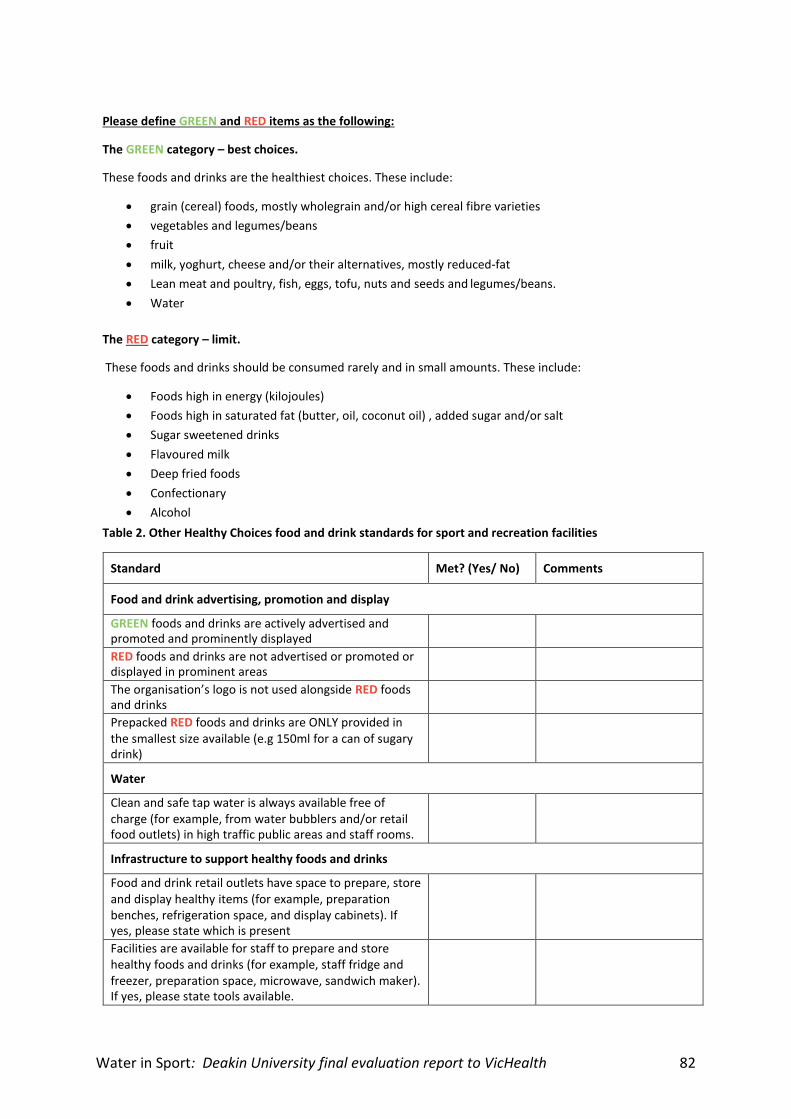
Water in Sport: Deakin University final evaluation report to VicHealth 82
Please define GREEN and RED items as the following:
The GREEN category – best choices.
These foods and drinks are the healthiest choices. These include:
• grain (cereal) foods, mostly wholegrain and/or high cereal fibre varieties
• vegetables and legumes/beans
• fruit
• milk, yoghurt, cheese and/or their alternatives, mostly reduced-fat
• Lean meat and poultry, fish, eggs, tofu, nuts and seeds and legumes/beans.
• Water
The RED category – limit.
These foods and drinks should be consumed rarely and in small amounts. These include:
• Foods high in energy (kilojoules)
• Foods high in saturated fat (butter, oil, coconut oil) , added sugar and/or salt
• Sugar sweetened drinks
• Flavoured milk
• Deep fried foods
• Confectionary
• Alcohol
Table 2. Other Healthy Choices food and drink standards for sport and recreation facilities
Standard Met? (Yes/ No) Comments
Food and drink advertising, promotion and display
GREEN foods and drinks are actively advertised and promoted and prominently displayed
RED foods and drinks are not advertised or promoted or displayed in prominent areas
The organisation’s logo is not used alongside RED foods and drinks
Prepacked RED foods and drinks are ONLY provided in the smallest size available (e.g 150ml for a can of sugary drink)
Water
Clean and safe tap water is always available free of charge (for example, from water bubblers and/or retail food outlets) in high traffic public areas and staff rooms.
Infrastructure to support healthy foods and drinks
Food and drink retail outlets have space to prepare, store and display healthy items (for example, preparation benches, refrigeration space, and display cabinets). If yes, please state which is present
Facilities are available for staff to prepare and store healthy foods and drinks (for example, staff fridge and freezer, preparation space, microwave, sandwich maker). If yes, please state tools available.
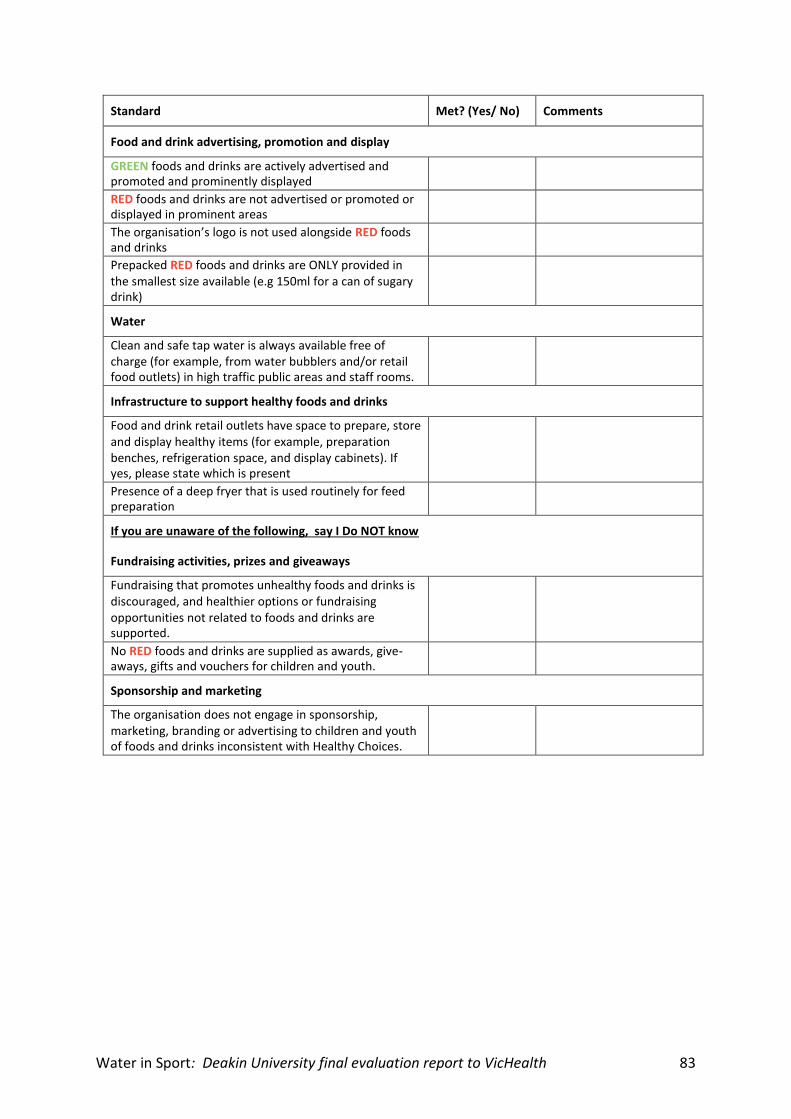
Water in Sport: Deakin University final evaluation report to VicHealth 83
Standard Met? (Yes/ No) Comments
Food and drink advertising, promotion and display
GREEN foods and drinks are actively advertised and promoted and prominently displayed
RED foods and drinks are not advertised or promoted or displayed in prominent areas
The organisation’s logo is not used alongside RED foods and drinks
Prepacked RED foods and drinks are ONLY provided in the smallest size available (e.g 150ml for a can of sugary drink)
Water
Clean and safe tap water is always available free of charge (for example, from water bubblers and/or retail food outlets) in high traffic public areas and staff rooms.
Infrastructure to support healthy foods and drinks
Food and drink retail outlets have space to prepare, store and display healthy items (for example, preparation benches, refrigeration space, and display cabinets). If yes, please state which is present
Presence of a deep fryer that is used routinely for feed preparation
If you are unaware of the following, say I Do NOT know
Fundraising activities, prizes and giveaways
Fundraising that promotes unhealthy foods and drinks is discouraged, and healthier options or fundraising opportunities not related to foods and drinks are supported.
No RED foods and drinks are supplied as awards, give- aways, gifts and vouchers for children and youth.
Sponsorship and marketing
The organisation does not engage in sponsorship, marketing, branding or advertising to children and youth of foods and drinks inconsistent with Healthy Choices.
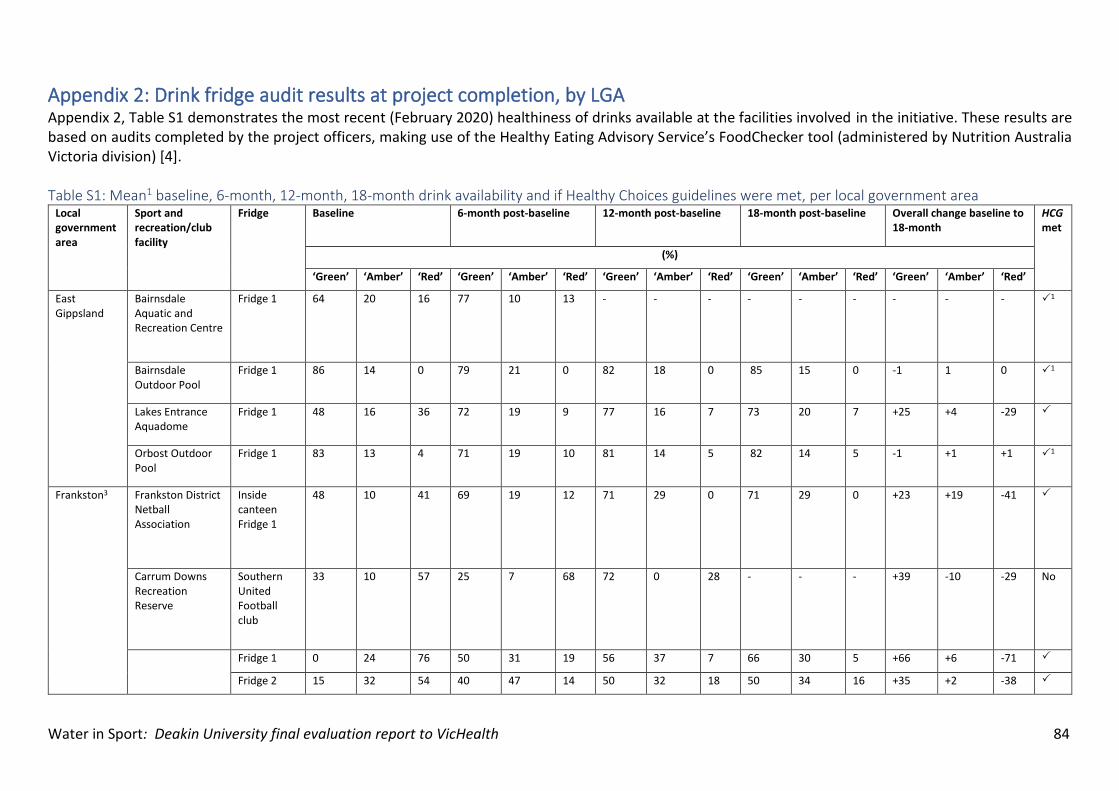
Water in Sport: Deakin University final evaluation report to VicHealth 84
Appendix 2: Drink fridge audit results at project completion, by LGA Appendix 2, Table S1 demonstrates the most recent (February 2020) healthiness of drinks available at the facilities involved in the initiative. These results are based on audits completed by the project officers, making use of the Healthy Eating Advisory Service’s FoodChecker tool (administered by Nutrition Australia Victoria division) [4]. Table S1: Mean1 baseline, 6-month, 12-month, 18-month drink availability and if Healthy Choices guidelines were met, per local government area
Local government area
Sport and recreation/club facility
Fridge Baseline 6-month post-baseline 12-month post-baseline 18-month post-baseline Overall change baseline to 18-month
HCG met
(%)
‘Green’ ‘Amber’ ‘Red’ ‘Green’ ‘Amber’ ‘Red’ ‘Green’ ‘Amber’ ‘Red’ ‘Green’ ‘Amber’ ‘Red’ ‘Green’ ‘Amber’ ‘Red’
East Gippsland
Bairnsdale Aquatic and Recreation Centre
Fridge 1 64 20 16 77 10 13 - - - - - - - - - 1
Bairnsdale Outdoor Pool
Fridge 1 86 14 0 79 21 0 82 18 0 85 15 0 -1 1 0 1
Lakes Entrance Aquadome
Fridge 1 48 16 36 72 19 9 77 16 7 73 20 7 +25 +4 -29
Orbost Outdoor Pool
Fridge 1 83 13 4 71 19 10 81 14 5 82 14 5 -1 +1 +1 1
Frankston3 Frankston District Netball Association
Inside canteen Fridge 1
48 10 41 69 19 12 71 29 0 71 29 0 +23 +19 -41
Carrum Downs Recreation Reserve
Southern United Football club
33 10 57 25 7 68 72 0 28 - - - +39 -10 -29 No
Fridge 1 0 24 76 50 31 19 56 37 7 66 30 5 +66 +6 -71
Fridge 2 15 32 54 40 47 14 50 32 18 50 34 16 +35 +2 -38
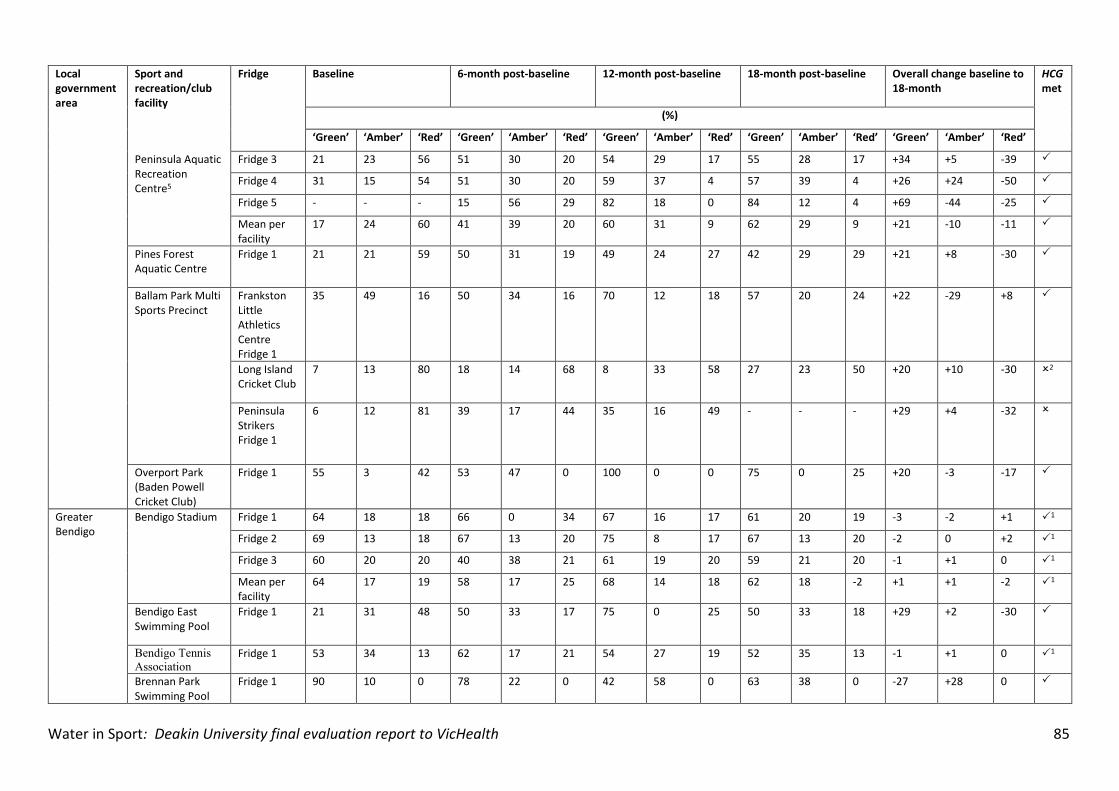
Water in Sport: Deakin University final evaluation report to VicHealth 85
Local government area
Sport and recreation/club facility
Fridge Baseline 6-month post-baseline 12-month post-baseline 18-month post-baseline Overall change baseline to 18-month
HCG met
(%)
‘Green’ ‘Amber’ ‘Red’ ‘Green’ ‘Amber’ ‘Red’ ‘Green’ ‘Amber’ ‘Red’ ‘Green’ ‘Amber’ ‘Red’ ‘Green’ ‘Amber’ ‘Red’
Peninsula Aquatic Recreation Centre5
Fridge 3 21 23 56 51 30 20 54 29 17 55 28 17 +34 +5 -39
Fridge 4 31 15 54 51 30 20 59 37 4 57 39 4 +26 +24 -50
Fridge 5 - - - 15 56 29 82 18 0 84 12 4 +69 -44 -25
Mean per facility
17 24 60 41 39 20 60 31 9 62 29 9 +21 -10 -11
Pines Forest Aquatic Centre
Fridge 1 21 21 59 50 31 19 49 24 27 42 29 29 +21 +8 -30
Ballam Park Multi Sports Precinct
Frankston Little Athletics Centre Fridge 1
35 49 16 50 34 16 70 12 18 57 20 24 +22 -29 +8
Long Island Cricket Club
7 13 80 18 14 68 8 33 58 27 23 50 +20 +10 -30 2
Peninsula Strikers Fridge 1
6 12 81 39 17 44 35 16 49 - - - +29 +4 -32
Overport Park (Baden Powell Cricket Club)
Fridge 1 55 3 42 53 47 0 100 0 0 75 0 25 +20 -3 -17
Greater Bendigo
Bendigo Stadium Fridge 1 64 18 18 66 0 34 67 16 17 61 20 19 -3 -2 +1 1
Fridge 2 69 13 18 67 13 20 75 8 17 67 13 20 -2 0 +2 1
Fridge 3 60 20 20 40 38 21 61 19 20 59 21 20 -1 +1 0 1
Mean per facility
64 17 19 58 17 25 68 14 18 62 18 -2 +1 +1 -2 1
Bendigo East Swimming Pool
Fridge 1 21 31 48 50 33 17 75 0 25 50 33 18 +29 +2 -30
Bendigo Tennis
Association Fridge 1 53 34 13 62 17 21 54 27 19 52 35 13 -1 +1 0 1
Brennan Park Swimming Pool
Fridge 1 90 10 0 78 22 0 42 58 0 63 38 0 -27 +28 0
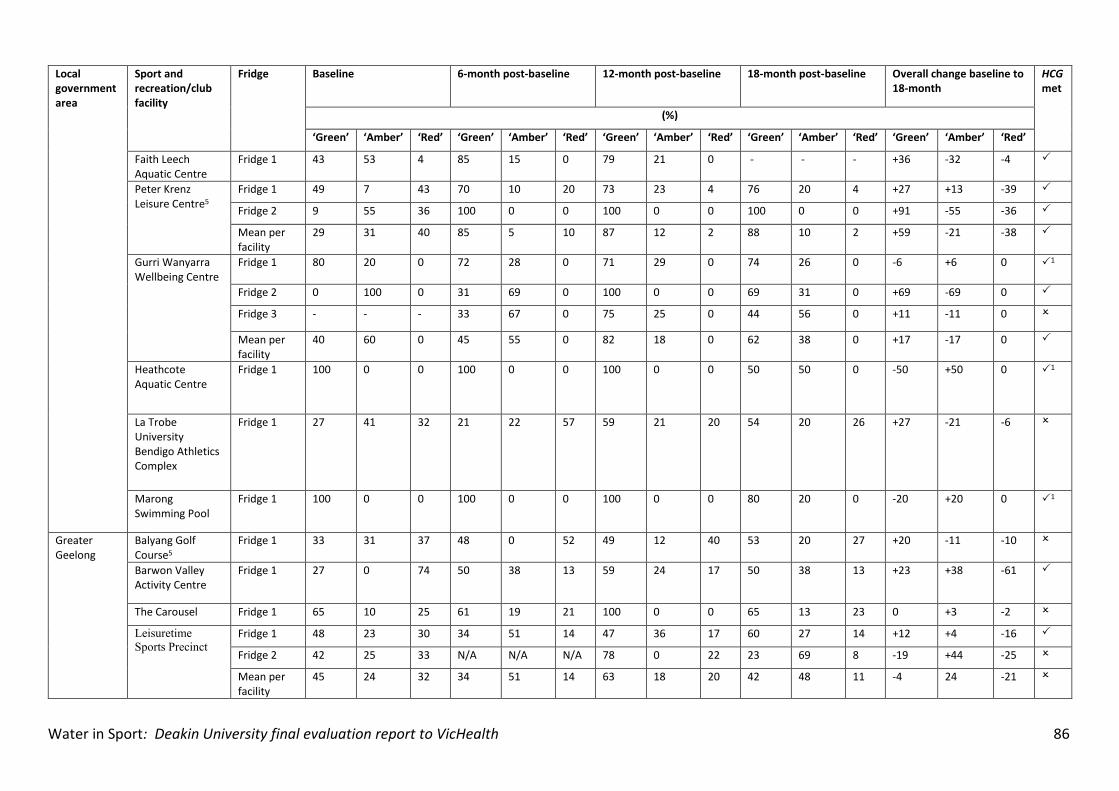
Water in Sport: Deakin University final evaluation report to VicHealth 86
Local government area
Sport and recreation/club facility
Fridge Baseline 6-month post-baseline 12-month post-baseline 18-month post-baseline Overall change baseline to 18-month
HCG met
(%)
‘Green’ ‘Amber’ ‘Red’ ‘Green’ ‘Amber’ ‘Red’ ‘Green’ ‘Amber’ ‘Red’ ‘Green’ ‘Amber’ ‘Red’ ‘Green’ ‘Amber’ ‘Red’
Faith Leech Aquatic Centre
Fridge 1 43 53 4 85 15 0 79 21 0 - - - +36 -32 -4
Peter Krenz Leisure Centre5
Fridge 1 49 7 43 70 10 20 73 23 4 76 20 4 +27 +13 -39
Fridge 2 9 55 36 100 0 0 100 0 0 100 0 0 +91 -55 -36
Mean per facility
29 31 40 85 5 10 87 12 2 88 10 2 +59 -21 -38
Gurri Wanyarra Wellbeing Centre
Fridge 1 80 20 0 72 28 0 71 29 0 74
26 0 -6 +6 0 1
Fridge 2 0 100 0 31 69 0 100 0 0 69 31 0 +69 -69 0
Fridge 3 - - - 33 67 0 75 25 0 44 56 0 +11 -11 0
Mean per facility
40 60 0 45 55 0 82 18 0 62 38 0 +17 -17 0
Heathcote Aquatic Centre
Fridge 1 100 0 0 100 0 0 100 0 0 50 50 0 -50 +50 0 1
La Trobe University Bendigo Athletics Complex
Fridge 1 27 41 32 21 22 57 59 21 20 54 20 26 +27 -21 -6
Marong Swimming Pool
Fridge 1 100 0 0 100 0 0 100 0 0 80 20 0 -20 +20 0 1
Greater Geelong
Balyang Golf Course5
Fridge 1 33 31 37 48 0 52 49 12 40 53 20 27 +20 -11 -10
Barwon Valley Activity Centre
Fridge 1 27 0 74 50 38 13 59 24 17 50 38 13 +23 +38 -61
The Carousel Fridge 1 65 10 25 61 19 21 100 0 0 65 13 23 0 +3 -2
Leisuretime
Sports Precinct Fridge 1 48 23 30 34 51 14 47 36 17 60 27 14 +12 +4 -16
Fridge 2 42 25 33 N/A N/A N/A 78 0 22 23 69 8 -19 +44 -25
Mean per facility
45 24 32 34 51 14 63 18 20 42 48 11 -4 24 -21
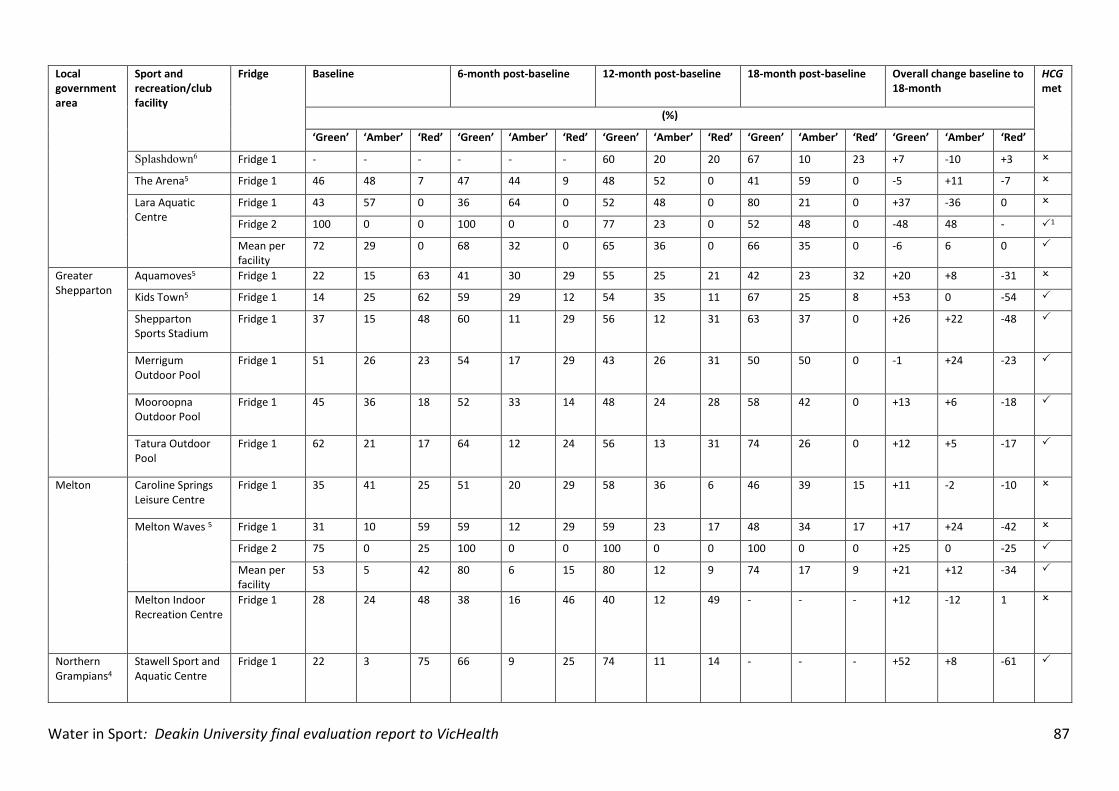
Water in Sport: Deakin University final evaluation report to VicHealth 87
Local government area
Sport and recreation/club facility
Fridge Baseline 6-month post-baseline 12-month post-baseline 18-month post-baseline Overall change baseline to 18-month
HCG met
(%)
‘Green’ ‘Amber’ ‘Red’ ‘Green’ ‘Amber’ ‘Red’ ‘Green’ ‘Amber’ ‘Red’ ‘Green’ ‘Amber’ ‘Red’ ‘Green’ ‘Amber’ ‘Red’
Splashdown6 Fridge 1 - - - - - - 60 20 20 67 10 23 +7 -10 +3
The Arena5 Fridge 1 46 48 7 47 44 9 48 52 0 41 59 0 -5 +11 -7
Lara Aquatic Centre
Fridge 1 43 57 0 36 64 0 52 48 0 80 21 0 +37 -36 0
Fridge 2 100 0 0 100 0 0 77 23 0 52 48 0 -48 48 - 1
Mean per facility
72 29 0 68 32 0 65 36 0 66 35 0 -6 6 0
Greater Shepparton
Aquamoves5 Fridge 1 22 15 63 41 30 29 55 25 21 42 23 32 +20 +8 -31
Kids Town5 Fridge 1 14 25 62 59 29 12 54 35 11 67 25 8 +53 0 -54
Shepparton Sports Stadium
Fridge 1 37 15 48 60 11 29 56 12 31 63 37 0 +26 +22 -48
Merrigum Outdoor Pool
Fridge 1 51 26 23 54 17 29 43 26 31 50 50 0 -1 +24 -23
Mooroopna Outdoor Pool
Fridge 1 45 36 18 52 33 14 48 24 28 58 42 0 +13 +6 -18
Tatura Outdoor Pool
Fridge 1 62 21 17 64 12 24 56 13 31 74 26 0 +12 +5 -17
Melton Caroline Springs Leisure Centre
Fridge 1 35 41 25 51 20 29 58 36 6 46 39 15 +11 -2 -10
Melton Waves 5 Fridge 1 31 10 59 59 12 29 59 23 17 48 34 17 +17 +24 -42
Fridge 2 75 0 25 100 0 0 100 0 0 100 0 0 +25 0 -25
Mean per facility
53 5 42 80 6 15 80 12 9 74 17 9 +21 +12 -34
Melton Indoor Recreation Centre
Fridge 1 28 24 48 38 16 46 40 12 49 - - - +12 -12 1
Northern Grampians4
Stawell Sport and Aquatic Centre
Fridge 1 22 3 75 66 9 25 74 11 14 - - - +52 +8 -61
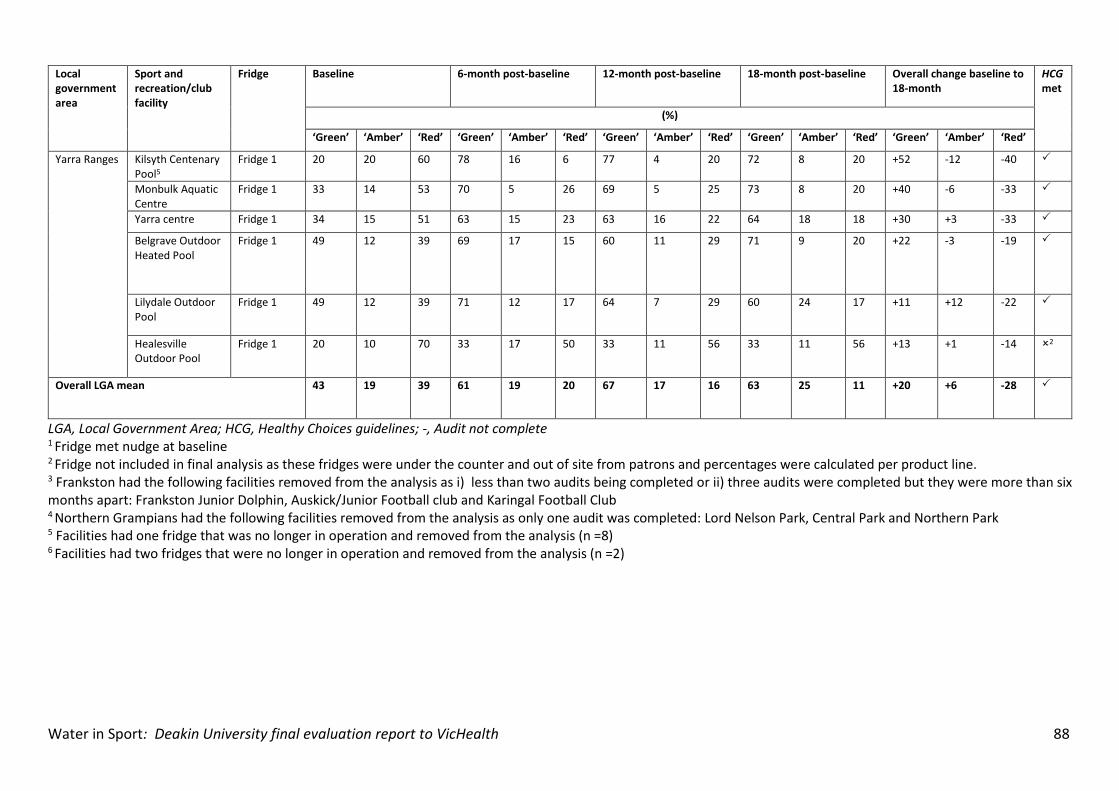
Water in Sport: Deakin University final evaluation report to VicHealth 88
Local government area
Sport and recreation/club facility
Fridge Baseline 6-month post-baseline 12-month post-baseline 18-month post-baseline Overall change baseline to 18-month
HCG met
(%)
‘Green’ ‘Amber’ ‘Red’ ‘Green’ ‘Amber’ ‘Red’ ‘Green’ ‘Amber’ ‘Red’ ‘Green’ ‘Amber’ ‘Red’ ‘Green’ ‘Amber’ ‘Red’
Yarra Ranges Kilsyth Centenary Pool5
Fridge 1 20 20 60 78 16 6 77 4 20 72 8 20 +52 -12 -40
Monbulk Aquatic Centre
Fridge 1 33 14 53 70 5 26 69 5 25 73 8 20 +40 -6 -33
Yarra centre Fridge 1 34 15 51 63 15 23 63 16 22 64 18 18 +30 +3 -33
Belgrave Outdoor Heated Pool
Fridge 1 49 12 39 69 17 15 60 11 29 71 9 20 +22 -3 -19
Lilydale Outdoor Pool
Fridge 1 49 12 39 71 12 17 64 7 29 60 24 17 +11 +12 -22
Healesville Outdoor Pool
Fridge 1 20 10 70 33 17 50 33 11 56 33 11 56 +13 +1 -14 2
Overall LGA mean 43 19 39 61 19 20 67 17 16 63 25 11 +20 +6 -28
LGA, Local Government Area; HCG, Healthy Choices guidelines; -, Audit not complete 1 Fridge met nudge at baseline 2 Fridge not included in final analysis as these fridges were under the counter and out of site from patrons and percentages were calculated per product line. 3 Frankston had the following facilities removed from the analysis as i) less than two audits being completed or ii) three audits were completed but they were more than six months apart: Frankston Junior Dolphin, Auskick/Junior Football club and Karingal Football Club 4 Northern Grampians had the following facilities removed from the analysis as only one audit was completed: Lord Nelson Park, Central Park and Northern Park 5 Facilities had one fridge that was no longer in operation and removed from the analysis (n =8) 6 Facilities had two fridges that were no longer in operation and removed from the analysis (n =2)
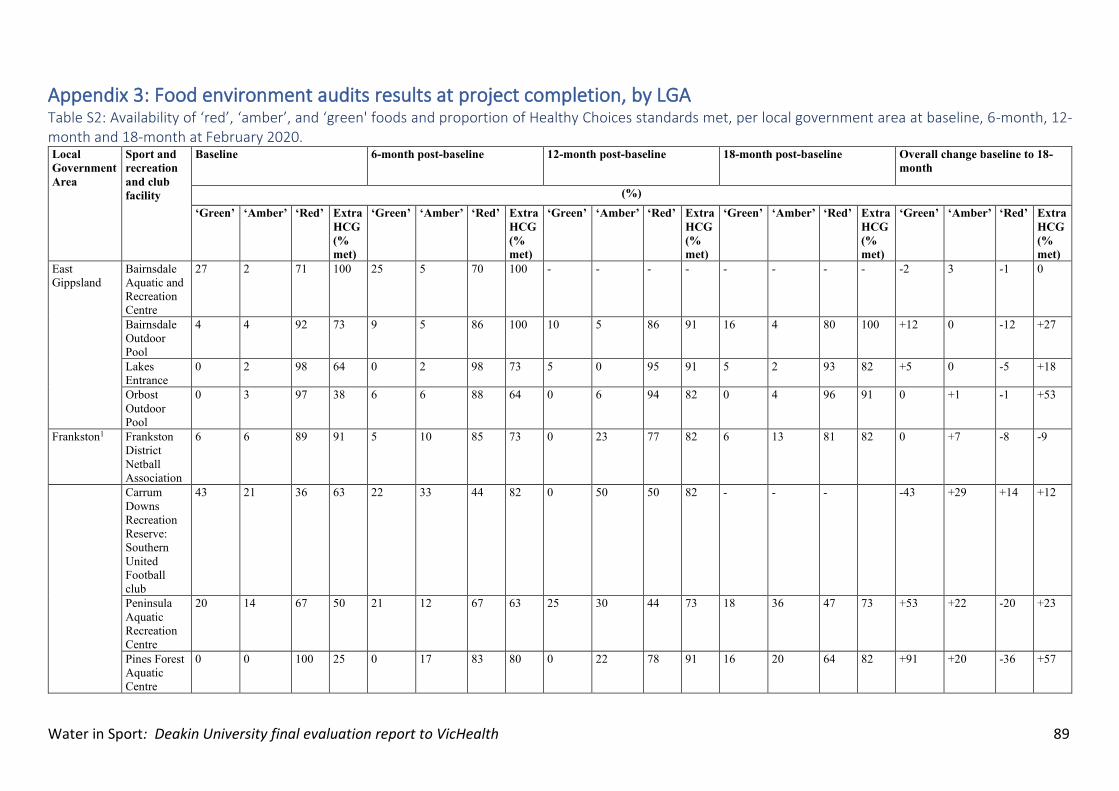
Water in Sport: Deakin University final evaluation report to VicHealth 89
Appendix 3: Food environment audits results at project completion, by LGA Table S2: Availability of ‘red’, ‘amber’, and ‘green' foods and proportion of Healthy Choices standards met, per local government area at baseline, 6-month, 12-month and 18-month at February 2020. Local
Government
Area
Sport and
recreation
and club
facility
Baseline 6-month post-baseline 12-month post-baseline 18-month post-baseline Overall change baseline to 18-
month
(%)
‘Green’ ‘Amber’ ‘Red’ Extra
HCG
(%
met)
‘Green’ ‘Amber’ ‘Red’ Extra
HCG
(%
met)
‘Green’ ‘Amber’ ‘Red’ Extra
HCG
(%
met)
‘Green’ ‘Amber’ ‘Red’ Extra
HCG
(%
met)
‘Green’ ‘Amber’ ‘Red’ Extra
HCG
(%
met) East
Gippsland
Bairnsdale
Aquatic and
Recreation
Centre
27 2 71 100 25 5 70 100 - - - - - - - - -2 3 -1 0
Bairnsdale
Outdoor
Pool
4 4 92 73 9 5 86 100 10 5 86 91 16 4 80 100 +12 0 -12 +27
Lakes
Entrance 0 2 98 64 0 2 98 73 5 0 95 91 5 2 93 82 +5 0 -5 +18
Orbost
Outdoor
Pool
0 3 97 38 6 6 88 64 0 6 94 82 0 4 96 91 0 +1 -1 +53
Frankston1
Frankston
District
Netball
Association
6 6 89 91 5 10 85 73 0 23 77 82 6 13 81 82 0 +7 -8 -9
Carrum
Downs
Recreation
Reserve:
Southern
United
Football
club
43 21 36 63 22 33 44 82 0 50 50 82 - - - -43 +29 +14 +12
Peninsula
Aquatic
Recreation
Centre
20 14 67 50 21 12 67 63 25 30 44 73 18 36 47 73 +53 +22 -20 +23
Pines Forest
Aquatic
Centre
0 0 100 25 0 17 83 80 0 22 78 91 16 20 64 82 +91 +20 -36 +57
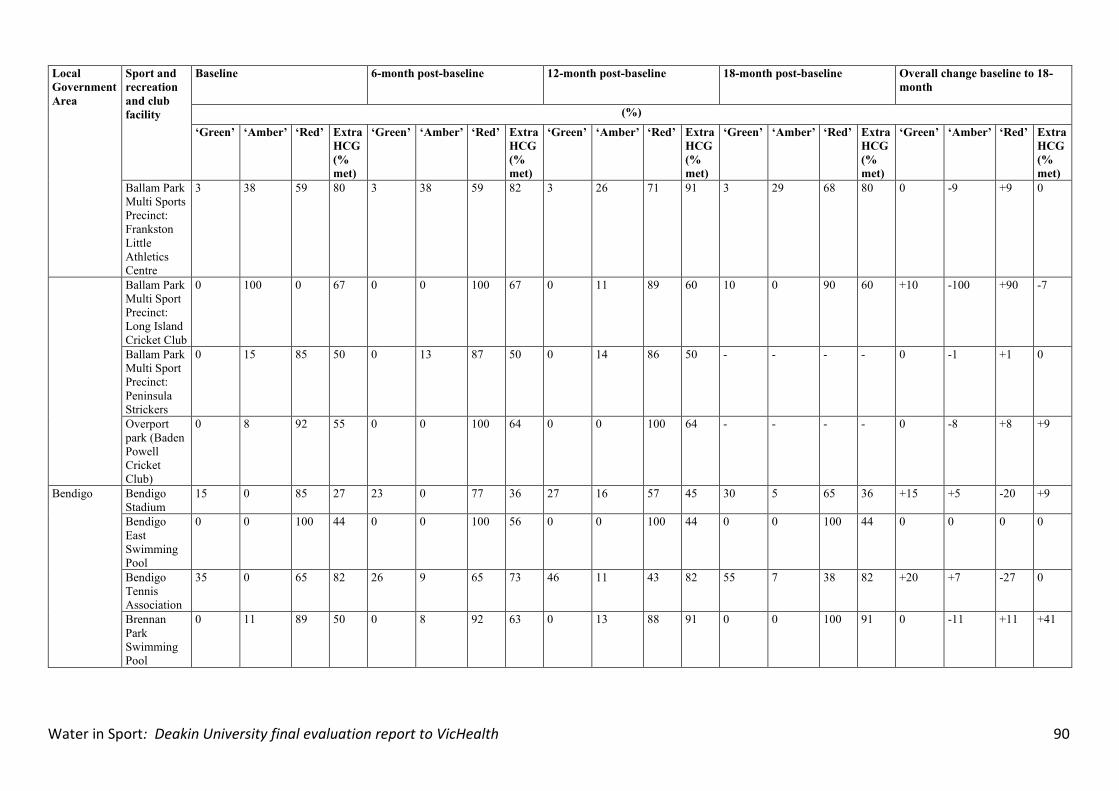
Water in Sport: Deakin University final evaluation report to VicHealth 90
Local
Government
Area
Sport and
recreation
and club
facility
Baseline 6-month post-baseline 12-month post-baseline 18-month post-baseline Overall change baseline to 18-
month
(%)
‘Green’ ‘Amber’ ‘Red’ Extra
HCG
(%
met)
‘Green’ ‘Amber’ ‘Red’ Extra
HCG
(%
met)
‘Green’ ‘Amber’ ‘Red’ Extra
HCG
(%
met)
‘Green’ ‘Amber’ ‘Red’ Extra
HCG
(%
met)
‘Green’ ‘Amber’ ‘Red’ Extra
HCG
(%
met) Ballam Park
Multi Sports
Precinct:
Frankston
Little
Athletics
Centre
3 38 59 80 3 38 59 82 3 26 71 91 3 29 68 80 0 -9 +9 0
Ballam Park
Multi Sport
Precinct:
Long Island
Cricket Club
0 100 0 67 0 0 100 67 0 11 89 60 10 0 90 60 +10 -100 +90 -7
Ballam Park
Multi Sport
Precinct:
Peninsula
Strickers
0 15 85 50 0 13 87 50 0 14 86 50 - - - - 0 -1 +1 0
Overport
park (Baden
Powell
Cricket
Club)
0 8 92 55 0 0 100 64 0 0 100 64 - - - - 0 -8 +8 +9
Bendigo
Bendigo
Stadium 15 0 85 27 23 0 77 36 27 16 57 45 30 5 65 36 +15 +5 -20 +9
Bendigo
East
Swimming
Pool
0 0 100 44 0 0 100 56 0 0 100 44 0 0 100 44 0 0 0 0
Bendigo
Tennis
Association
35 0 65 82 26 9 65 73 46 11 43 82 55 7 38 82 +20 +7 -27 0
Brennan
Park
Swimming
Pool
0 11 89 50 0 8 92 63 0 13 88 91 0 0 100 91 0 -11 +11 +41
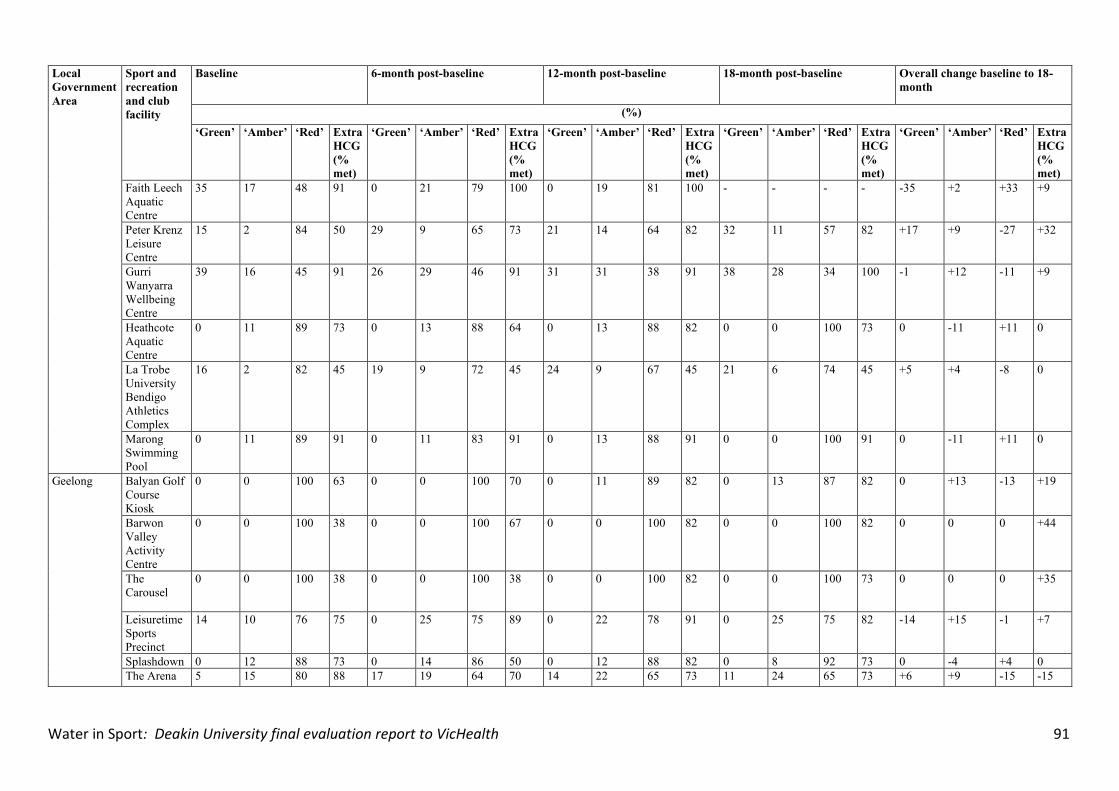
Water in Sport: Deakin University final evaluation report to VicHealth 91
Local
Government
Area
Sport and
recreation
and club
facility
Baseline 6-month post-baseline 12-month post-baseline 18-month post-baseline Overall change baseline to 18-
month
(%)
‘Green’ ‘Amber’ ‘Red’ Extra
HCG
(%
met)
‘Green’ ‘Amber’ ‘Red’ Extra
HCG
(%
met)
‘Green’ ‘Amber’ ‘Red’ Extra
HCG
(%
met)
‘Green’ ‘Amber’ ‘Red’ Extra
HCG
(%
met)
‘Green’ ‘Amber’ ‘Red’ Extra
HCG
(%
met) Faith Leech
Aquatic
Centre
35 17 48 91 0 21 79 100 0 19 81 100 - - - - -35 +2 +33 +9
Peter Krenz
Leisure
Centre
15 2 84 50 29 9 65 73 21 14 64 82 32 11 57 82 +17 +9 -27 +32
Gurri
Wanyarra
Wellbeing
Centre
39 16 45 91 26 29 46 91 31 31 38 91 38 28 34 100 -1 +12 -11 +9
Heathcote
Aquatic
Centre
0 11 89 73 0 13 88 64 0 13 88 82 0 0 100 73 0 -11 +11 0
La Trobe
University
Bendigo
Athletics
Complex
16 2 82 45 19 9 72 45 24 9 67 45 21 6 74 45 +5 +4 -8 0
Marong
Swimming
Pool
0 11 89 91 0 11 83 91 0 13 88 91 0 0 100 91 0 -11 +11 0
Geelong
Balyan Golf
Course
Kiosk
0 0 100 63 0 0 100 70 0 11 89 82 0 13 87 82 0 +13 -13 +19
Barwon
Valley
Activity
Centre
0 0 100 38 0 0 100 67 0 0 100 82 0 0 100 82 0 0 0 +44
The
Carousel 0 0 100 38 0 0 100 38 0 0 100 82 0 0 100 73 0 0 0 +35
Leisuretime
Sports
Precinct
14 10 76 75 0 25 75 89 0 22 78 91 0 25 75 82 -14 +15 -1 +7
Splashdown 0 12 88 73 0 14 86 50 0 12 88 82 0 8 92 73 0 -4 +4 0 The Arena 5 15 80 88 17 19 64 70 14 22 65 73 11 24 65 73 +6 +9 -15 -15
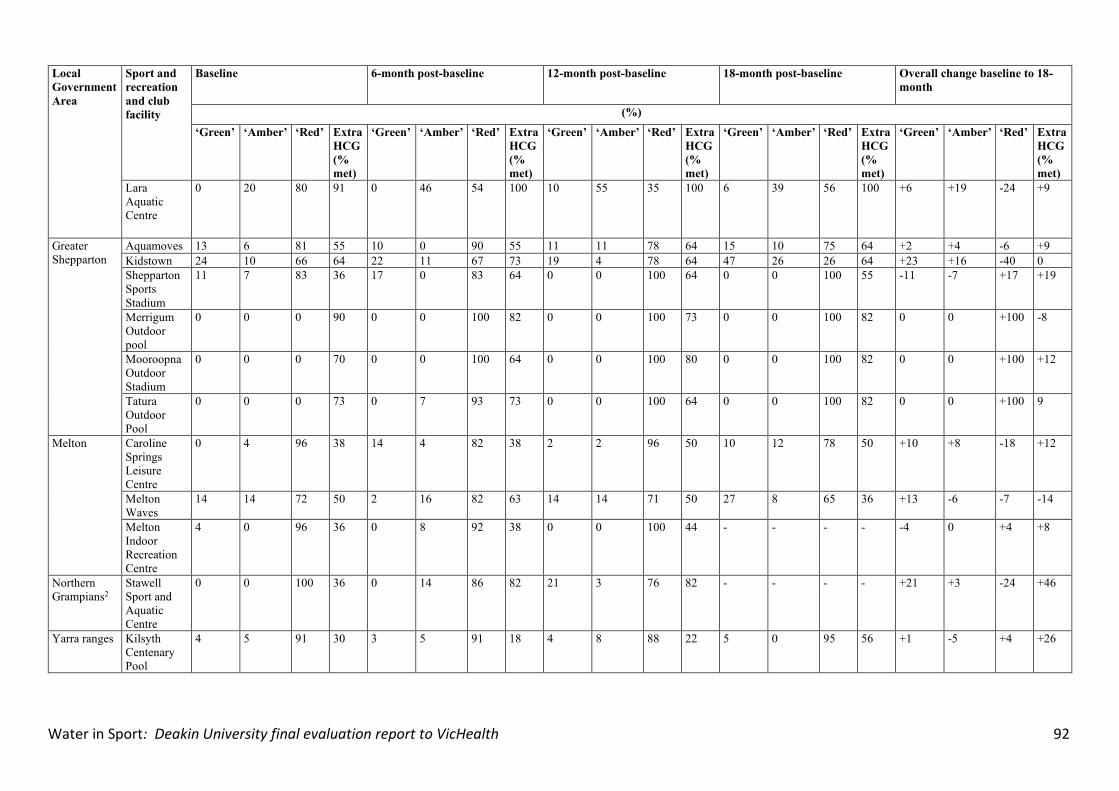
Water in Sport: Deakin University final evaluation report to VicHealth 92
Local
Government
Area
Sport and
recreation
and club
facility
Baseline 6-month post-baseline 12-month post-baseline 18-month post-baseline Overall change baseline to 18-
month
(%)
‘Green’ ‘Amber’ ‘Red’ Extra
HCG
(%
met)
‘Green’ ‘Amber’ ‘Red’ Extra
HCG
(%
met)
‘Green’ ‘Amber’ ‘Red’ Extra
HCG
(%
met)
‘Green’ ‘Amber’ ‘Red’ Extra
HCG
(%
met)
‘Green’ ‘Amber’ ‘Red’ Extra
HCG
(%
met) Lara
Aquatic
Centre
0 20 80 91 0 46 54 100 10 55 35 100 6 39 56 100 +6 +19 -24 +9
Greater
Shepparton
Aquamoves 13 6 81 55 10 0 90 55 11 11 78 64 15 10 75 64 +2 +4 -6 +9
Kidstown 24 10 66 64 22 11 67 73 19 4 78 64 47 26 26 64 +23 +16 -40 0 Shepparton
Sports
Stadium
11 7 83 36 17 0 83 64 0 0 100 64 0 0 100 55 -11 -7 +17 +19
Merrigum
Outdoor
pool
0 0 0 90 0 0 100 82 0 0 100 73 0 0 100 82 0 0 +100 -8
Mooroopna
Outdoor
Stadium
0 0 0 70 0 0 100 64 0 0 100 80 0 0 100 82 0 0 +100 +12
Tatura
Outdoor
Pool
0 0 0 73 0 7 93 73 0 0 100 64 0 0 100 82 0 0 +100 9
Melton
Caroline
Springs
Leisure
Centre
0 4 96 38 14 4 82 38 2 2 96 50 10 12 78 50 +10 +8 -18 +12
Melton
Waves 14 14 72 50 2 16 82 63 14 14 71 50 27 8 65 36 +13 -6 -7 -14
Melton
Indoor
Recreation
Centre
4 0 96 36 0 8 92 38 0 0 100 44 - - - - -4 0 +4 +8
Northern
Grampians2
Stawell
Sport and
Aquatic
Centre
0 0 100 36 0 14 86 82 21 3 76 82 - - - - +21 +3 -24 +46
Yarra ranges
Kilsyth
Centenary
Pool
4 5 91 30 3 5 91 18 4 8 88 22 5 0 95 56 +1 -5 +4 +26
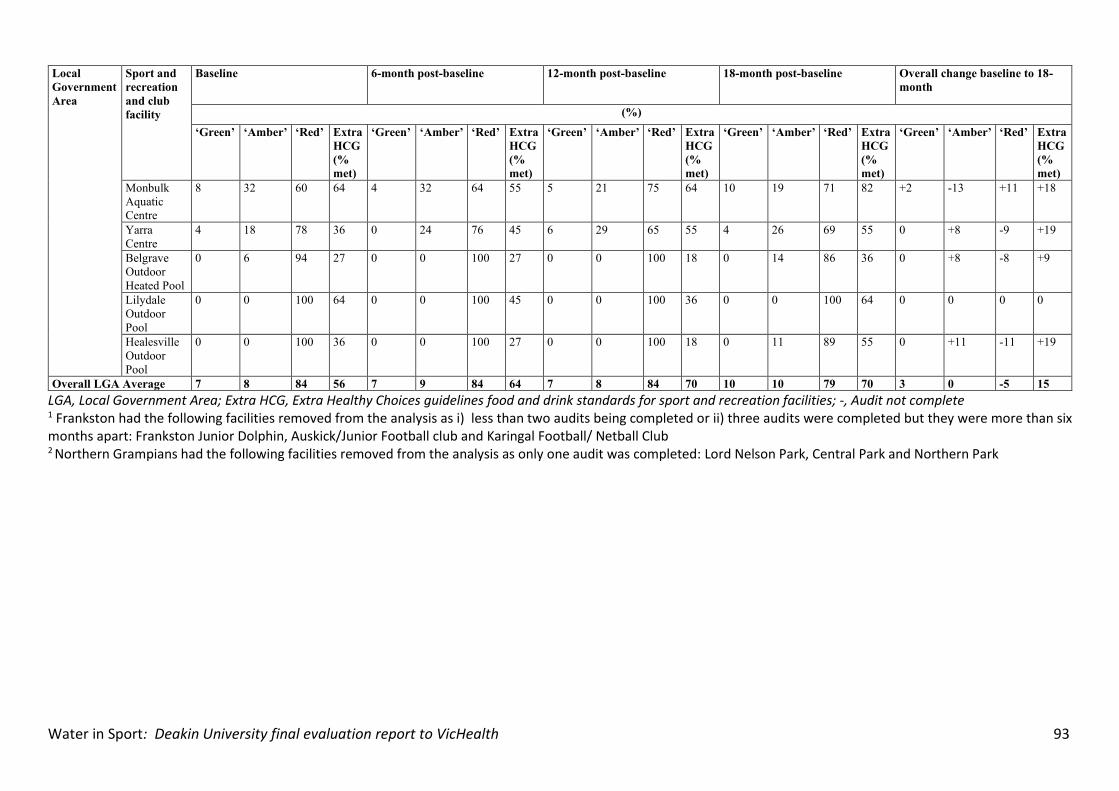
Water in Sport: Deakin University final evaluation report to VicHealth 93
Local
Government
Area
Sport and
recreation
and club
facility
Baseline 6-month post-baseline 12-month post-baseline 18-month post-baseline Overall change baseline to 18-
month
(%)
‘Green’ ‘Amber’ ‘Red’ Extra
HCG
(%
met)
‘Green’ ‘Amber’ ‘Red’ Extra
HCG
(%
met)
‘Green’ ‘Amber’ ‘Red’ Extra
HCG
(%
met)
‘Green’ ‘Amber’ ‘Red’ Extra
HCG
(%
met)
‘Green’ ‘Amber’ ‘Red’ Extra
HCG
(%
met) Monbulk
Aquatic
Centre
8 32 60 64 4 32 64 55 5 21 75 64 10 19 71 82 +2 -13 +11 +18
Yarra
Centre 4 18 78 36 0 24 76 45 6 29 65 55 4 26 69 55 0 +8 -9 +19
Belgrave
Outdoor
Heated Pool
0 6 94 27 0 0 100 27 0 0 100 18 0 14 86 36 0 +8 -8 +9
Lilydale
Outdoor
Pool
0 0 100 64 0 0 100 45 0 0 100 36 0 0 100 64 0 0 0 0
Healesville
Outdoor
Pool
0 0 100 36 0 0 100 27 0 0 100 18 0 11 89 55 0 +11 -11 +19
Overall LGA Average 7 8 84 56 7 9 84 64 7 8 84 70 10 10 79 70 3 0 -5 15
LGA, Local Government Area; Extra HCG, Extra Healthy Choices guidelines food and drink standards for sport and recreation facilities; -, Audit not complete 1 Frankston had the following facilities removed from the analysis as i) less than two audits being completed or ii) three audits were completed but they were more than six months apart: Frankston Junior Dolphin, Auskick/Junior Football club and Karingal Football/ Netball Club 2 Northern Grampians had the following facilities removed from the analysis as only one audit was completed: Lord Nelson Park, Central Park and Northern Park
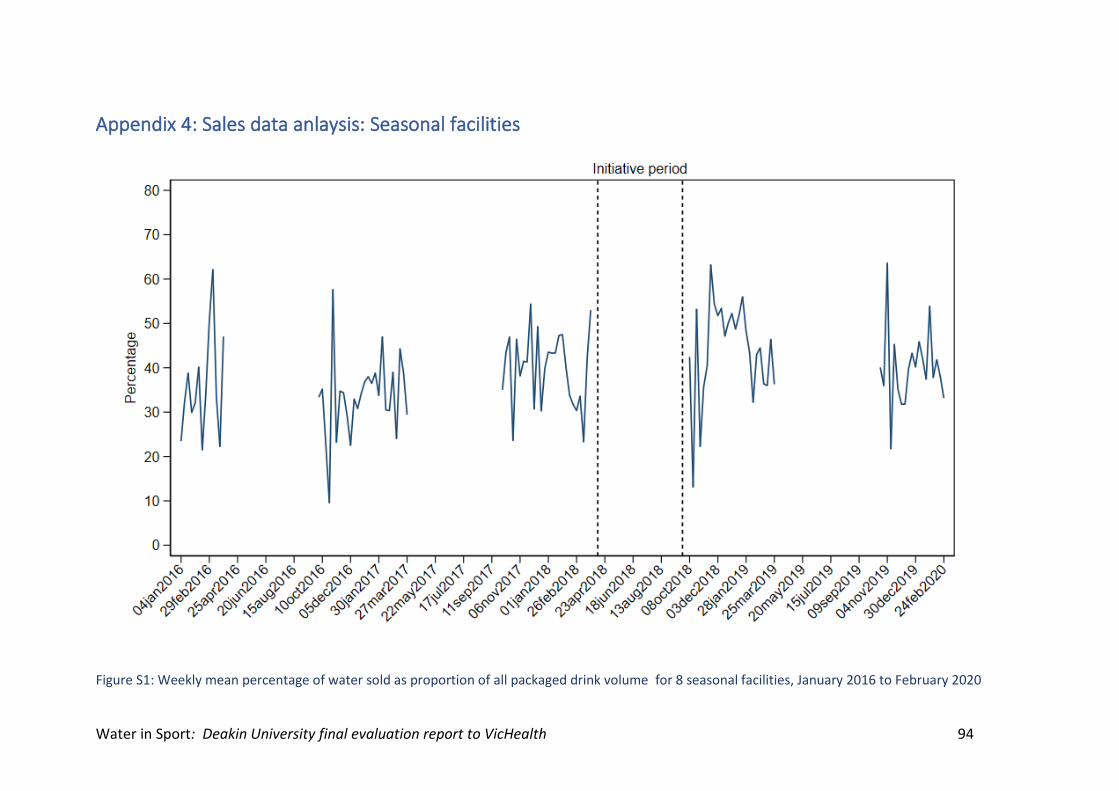
Water in Sport: Deakin University final evaluation report to VicHealth 94
Appendix 4: Sales data anlaysis: Seasonal facilities
Figure S1: Weekly mean percentage of water sold as proportion of all packaged drink volume for 8 seasonal facilities, January 2016 to February 2020
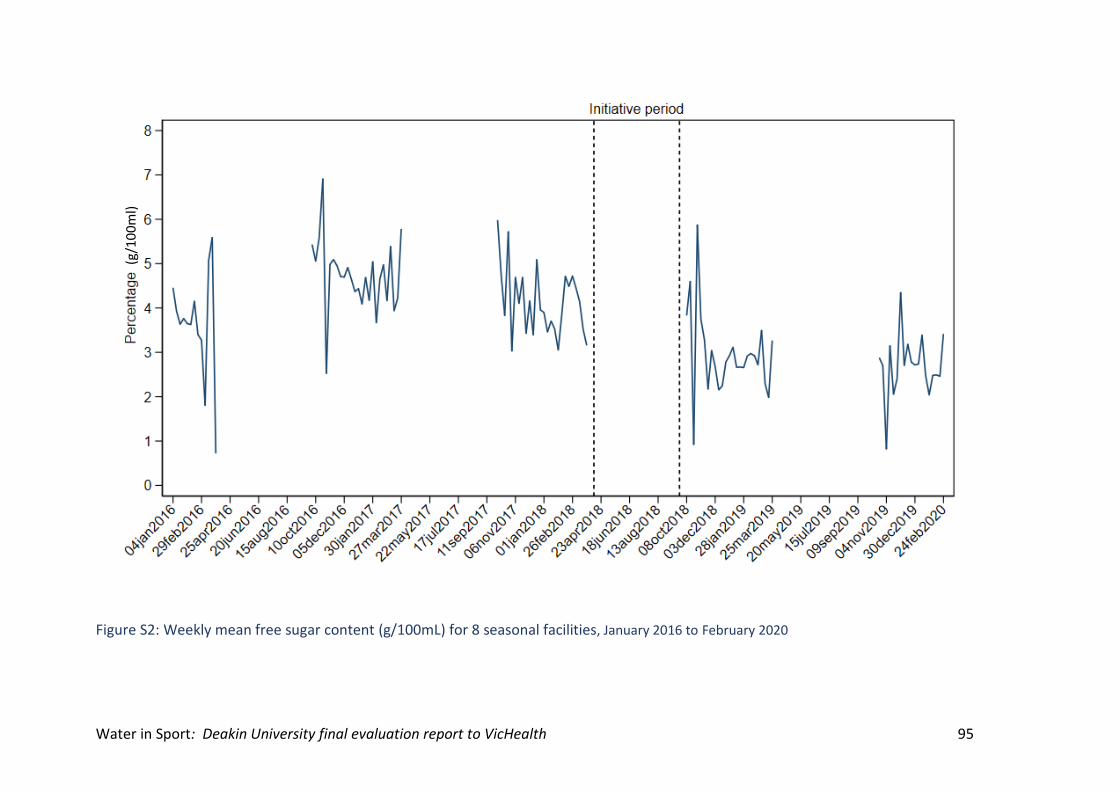
Water in Sport: Deakin University final evaluation report to VicHealth 95
Figure S2: Weekly mean free sugar content (g/100mL) for 8 seasonal facilities, January 2016 to February 2020
(g/1
00
ml)
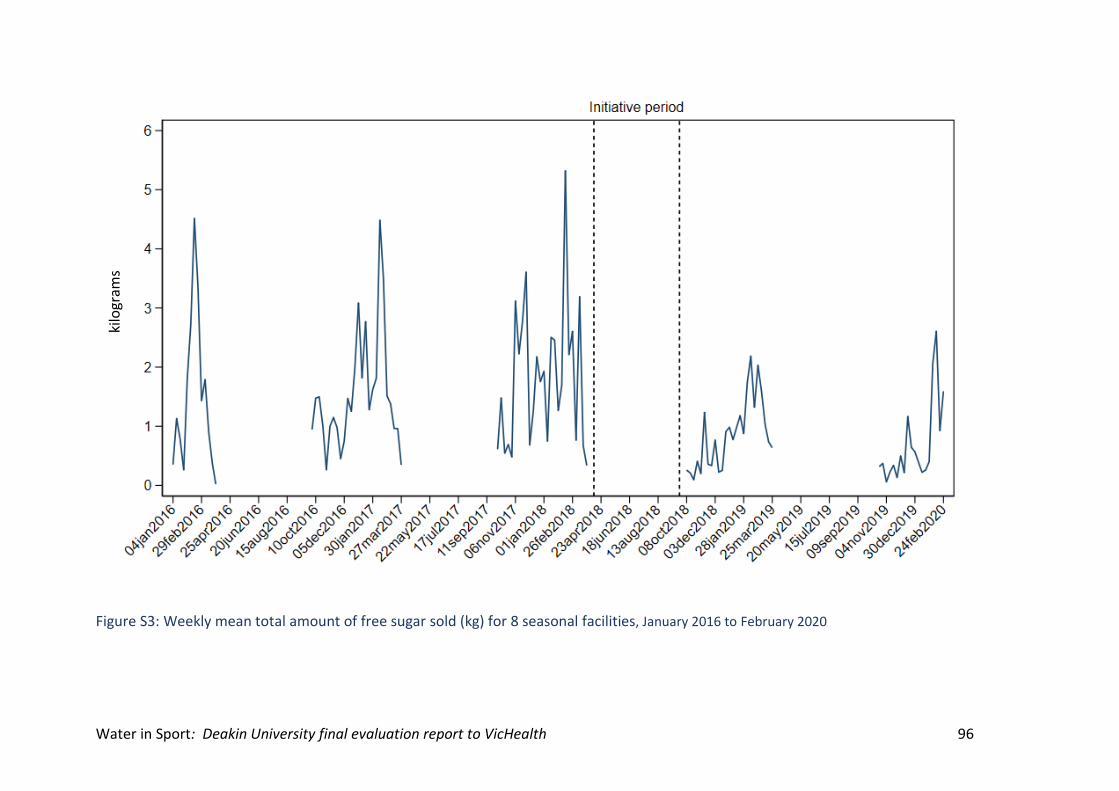
Water in Sport: Deakin University final evaluation report to VicHealth 96
Figure S3: Weekly mean total amount of free sugar sold (kg) for 8 seasonal facilities, January 2016 to February 2020
kilo
gram
s
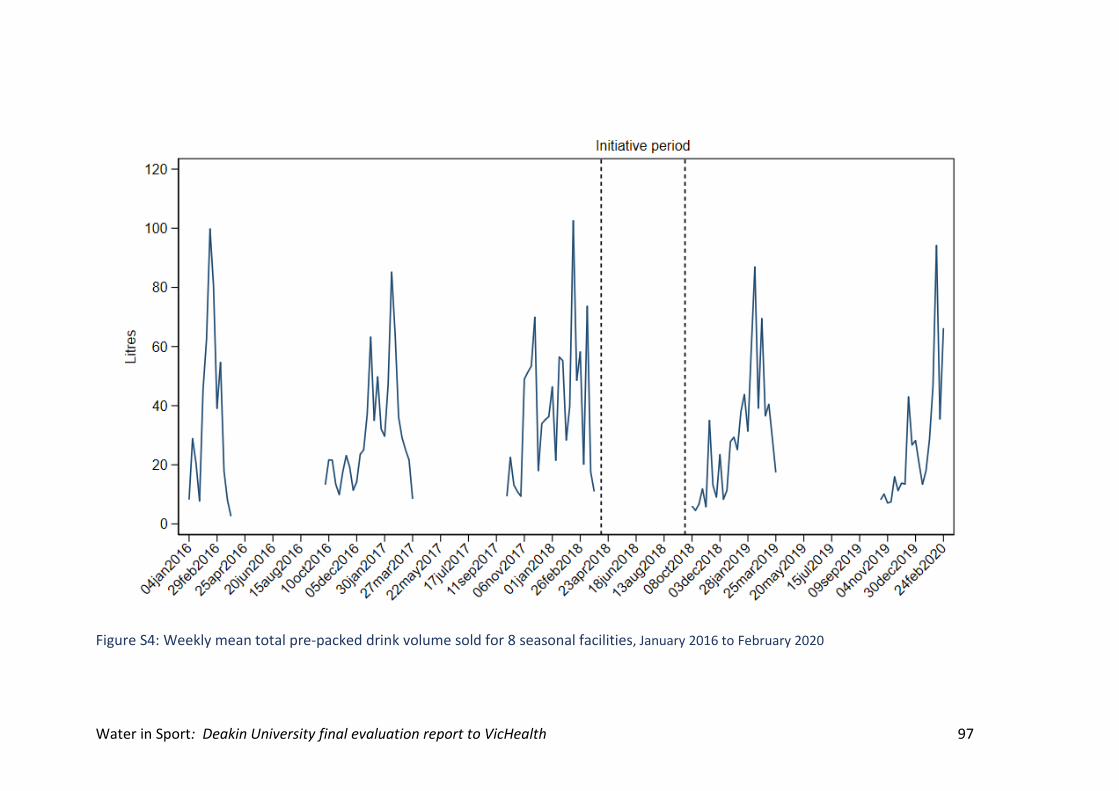
Water in Sport: Deakin University final evaluation report to VicHealth 97
Figure S4: Weekly mean total pre-packed drink volume sold for 8 seasonal facilities, January 2016 to February 2020
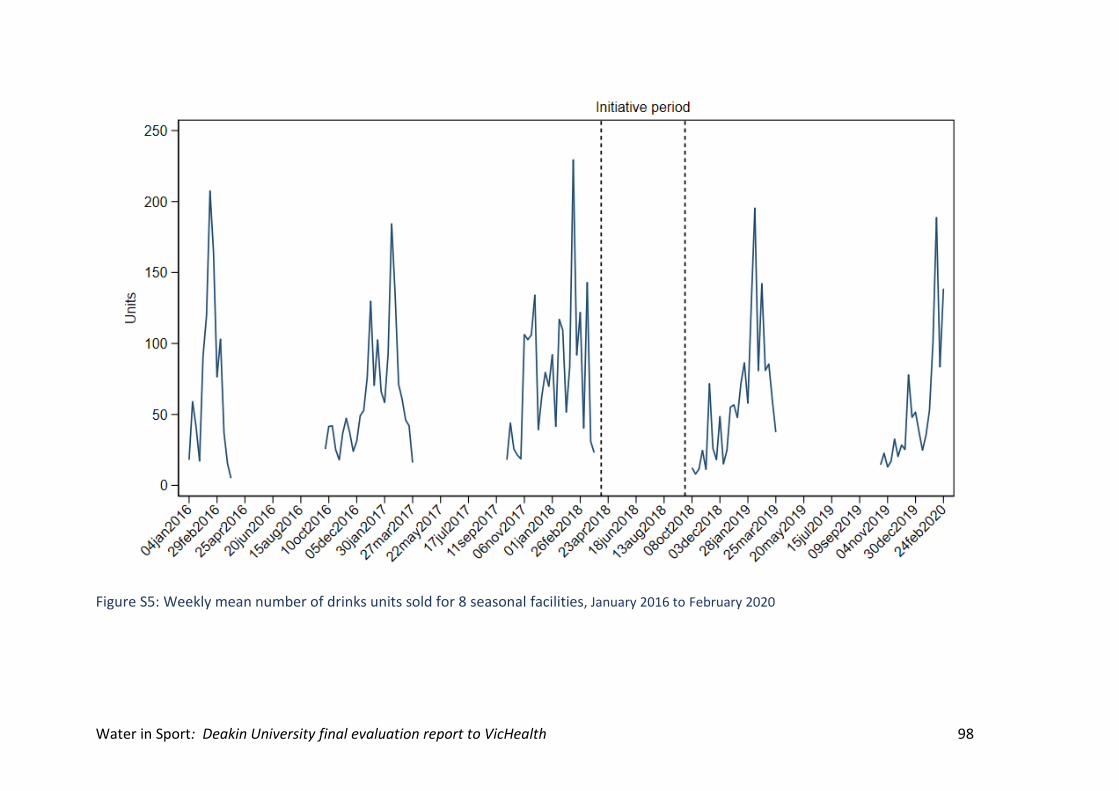
Water in Sport: Deakin University final evaluation report to VicHealth 98
Figure S5: Weekly mean number of drinks units sold for 8 seasonal facilities, January 2016 to February 2020
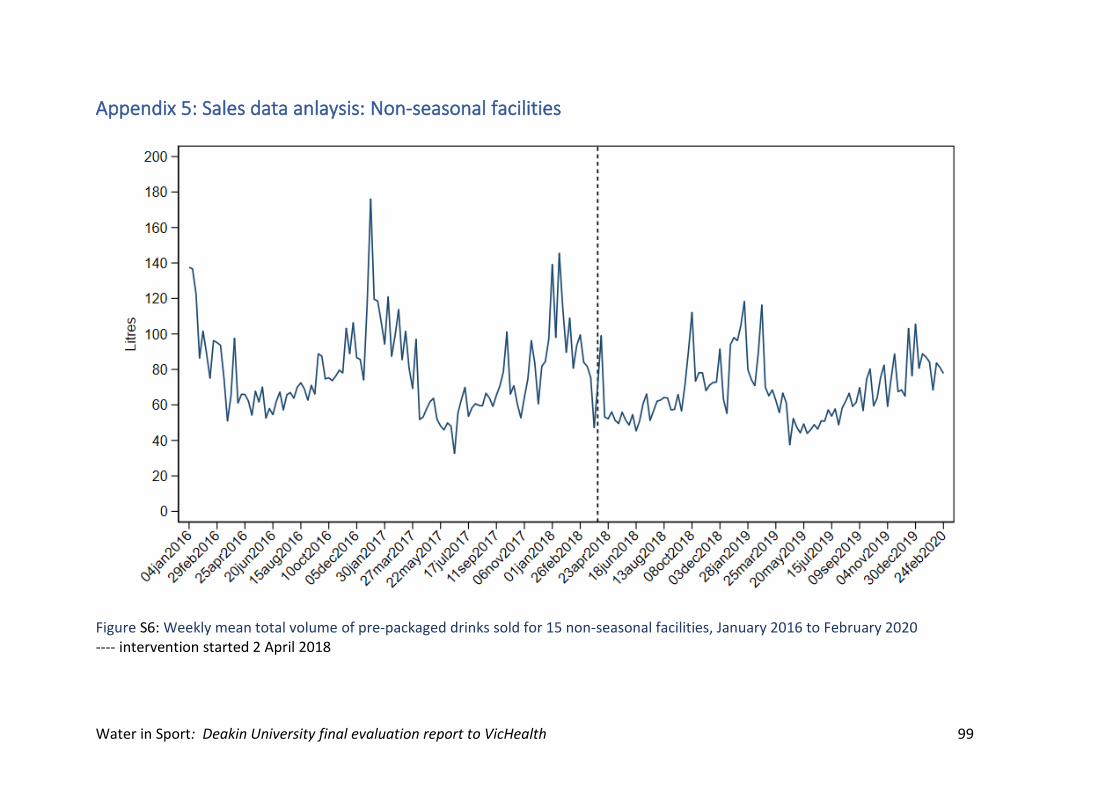
Water in Sport: Deakin University final evaluation report to VicHealth 99
Appendix 5: Sales data anlaysis: Non-seasonal facilities
Figure S6: Weekly mean total volume of pre-packaged drinks sold for 15 non-seasonal facilities, January 2016 to February 2020 ---- intervention started 2 April 2018
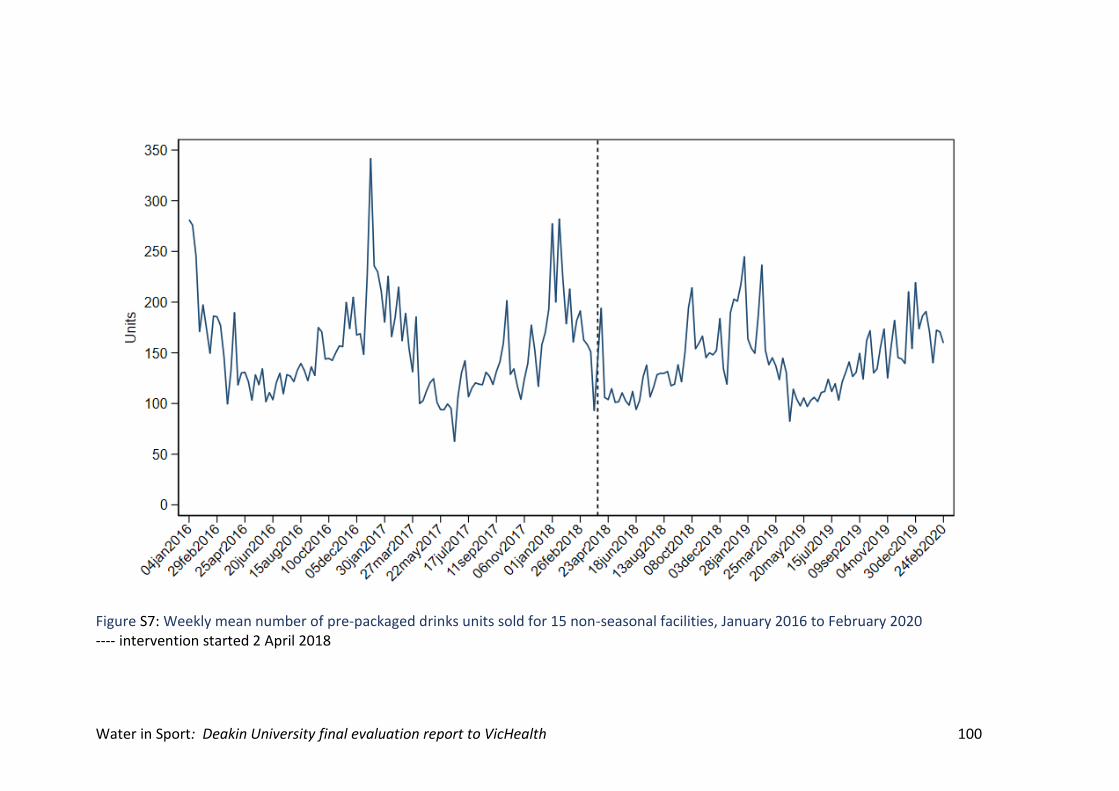
Water in Sport: Deakin University final evaluation report to VicHealth 100
Figure S7: Weekly mean number of pre-packaged drinks units sold for 15 non-seasonal facilities, January 2016 to February 2020 ---- intervention started 2 April 2018
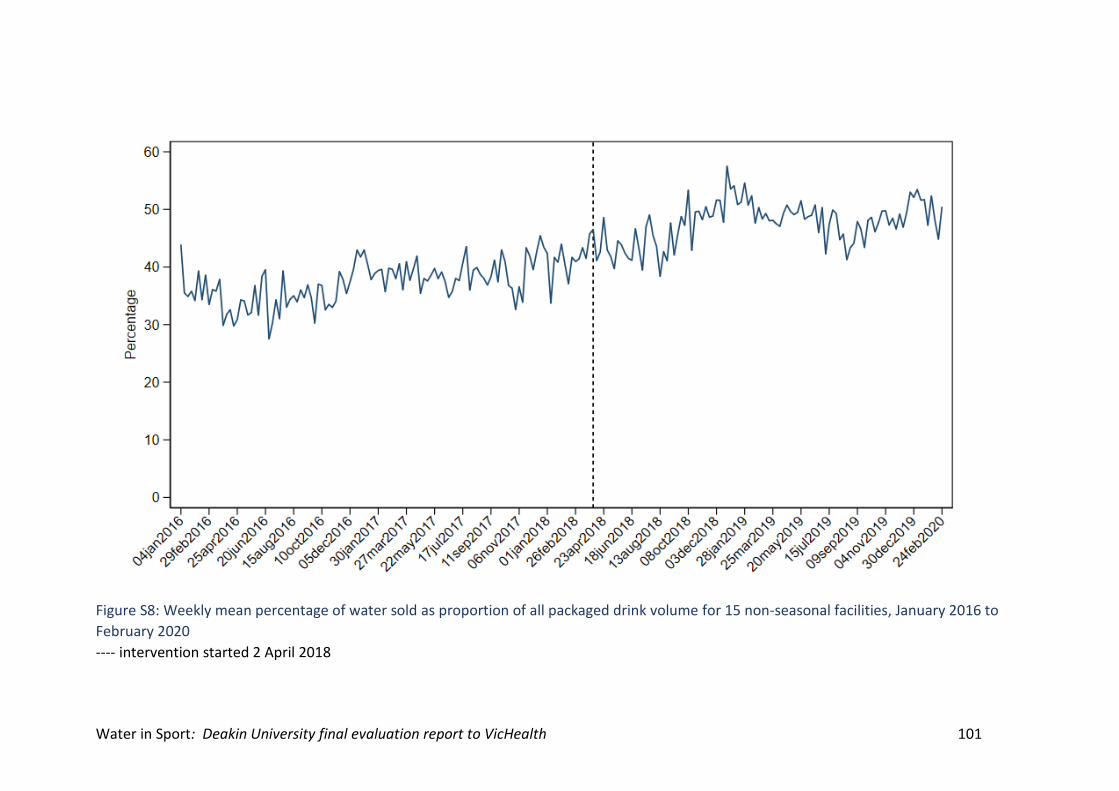
Water in Sport: Deakin University final evaluation report to VicHealth 101
Figure S8: Weekly mean percentage of water sold as proportion of all packaged drink volume for 15 non-seasonal facilities, January 2016 to
February 2020
---- intervention started 2 April 2018
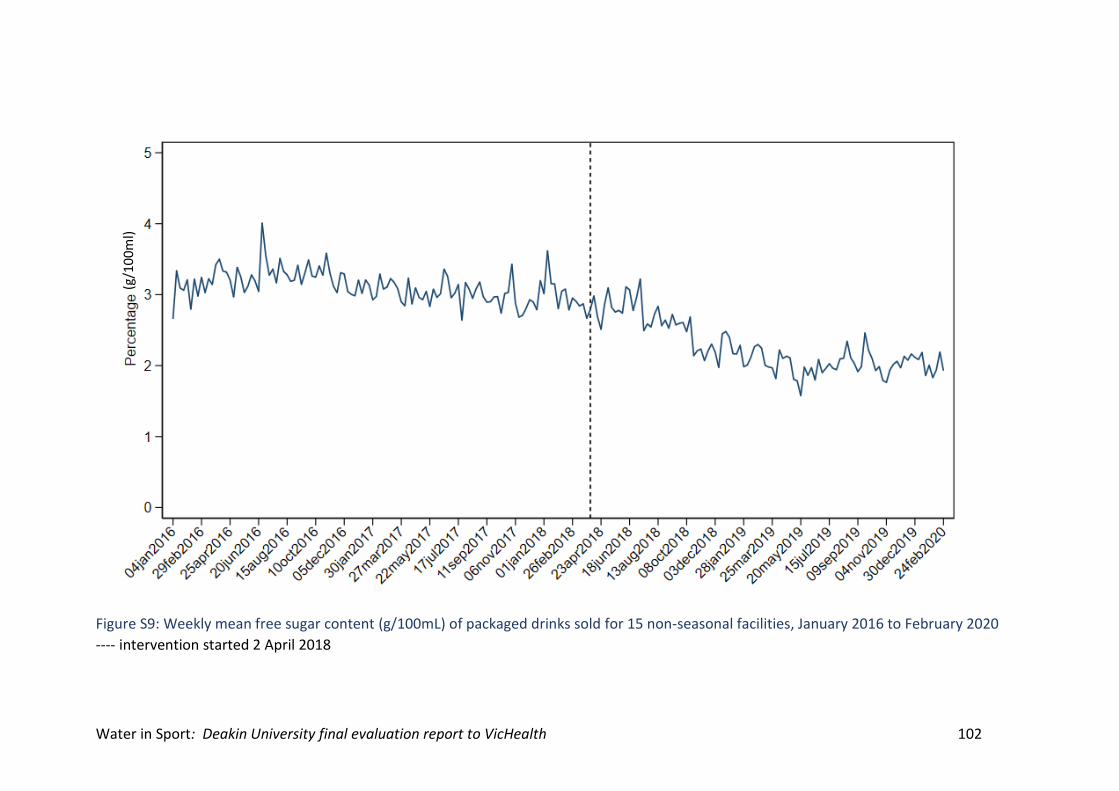
Water in Sport: Deakin University final evaluation report to VicHealth 102
Figure S9: Weekly mean free sugar content (g/100mL) of packaged drinks sold for 15 non-seasonal facilities, January 2016 to February 2020
---- intervention started 2 April 2018
(g/1
00
ml)
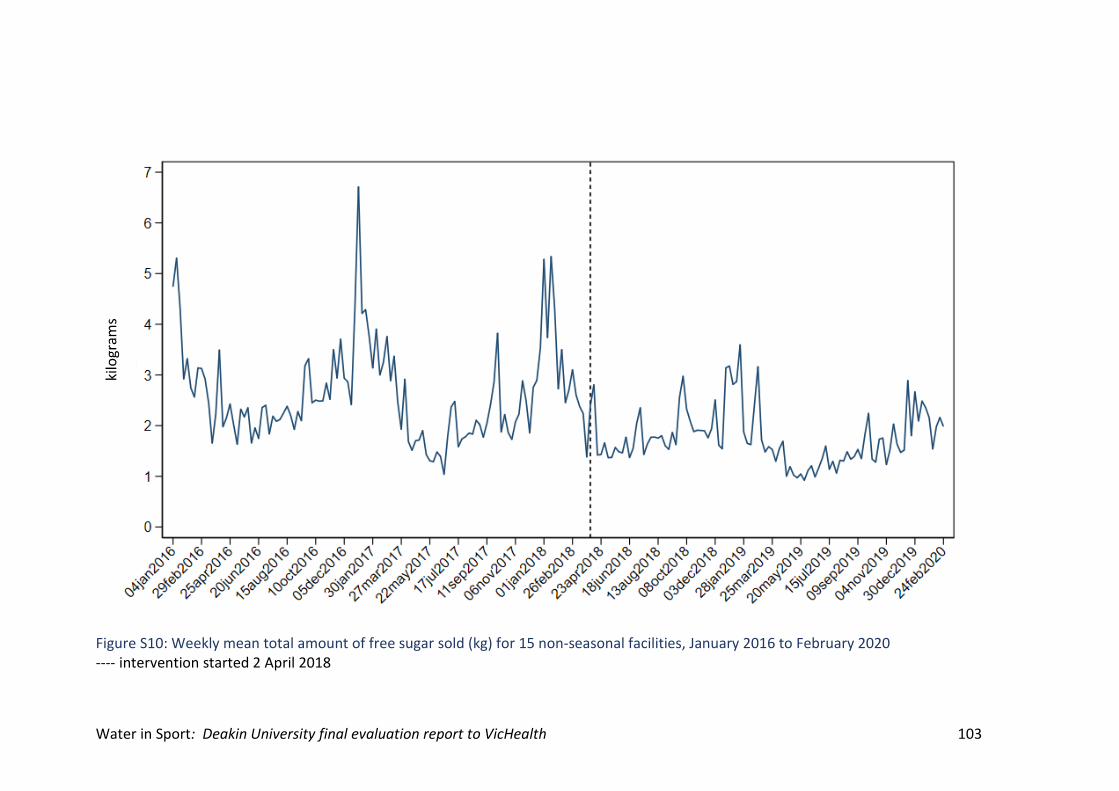
Water in Sport: Deakin University final evaluation report to VicHealth 103
Figure S10: Weekly mean total amount of free sugar sold (kg) for 15 non-seasonal facilities, January 2016 to February 2020 ---- intervention started 2 April 2018
kilo
gram
s
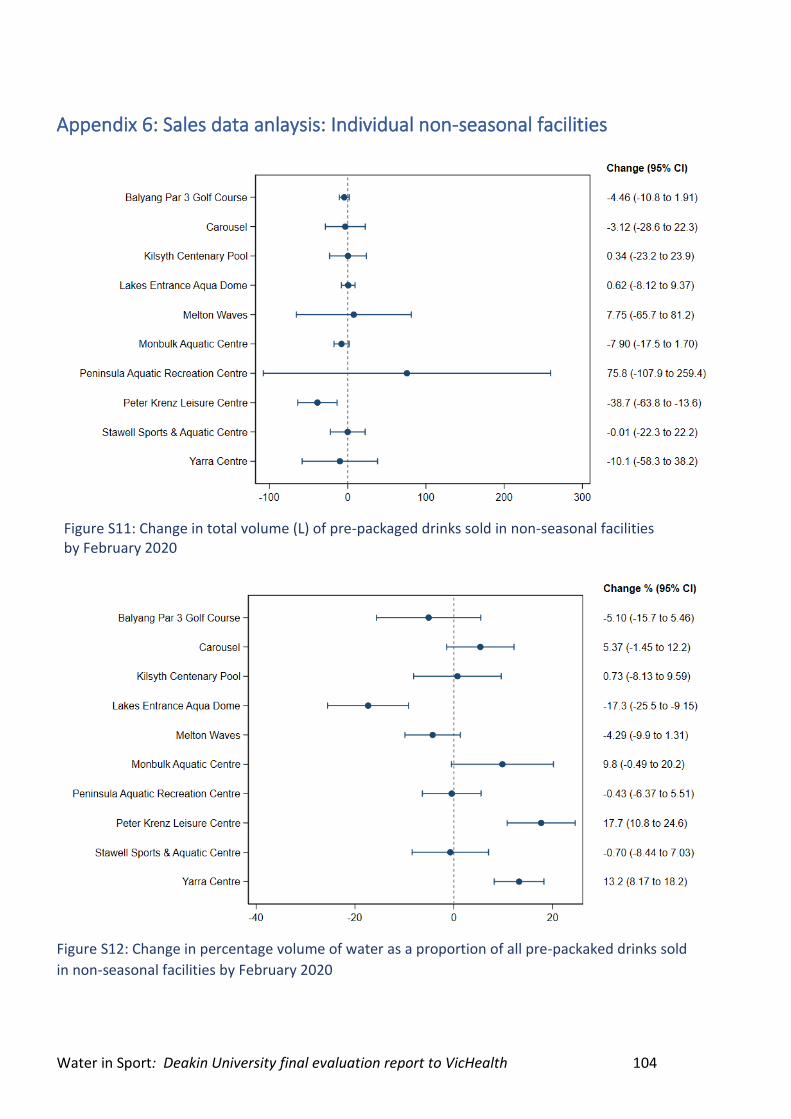
Water in Sport: Deakin University final evaluation report to VicHealth 104
Appendix 6: Sales data anlaysis: Individual non-seasonal facilities
Figure S11: Change in total volume (L) of pre-packaged drinks sold in non-seasonal facilities by February 2020
Figure S12: Change in percentage volume of water as a proportion of all pre-packaked drinks sold
in non-seasonal facilities by February 2020
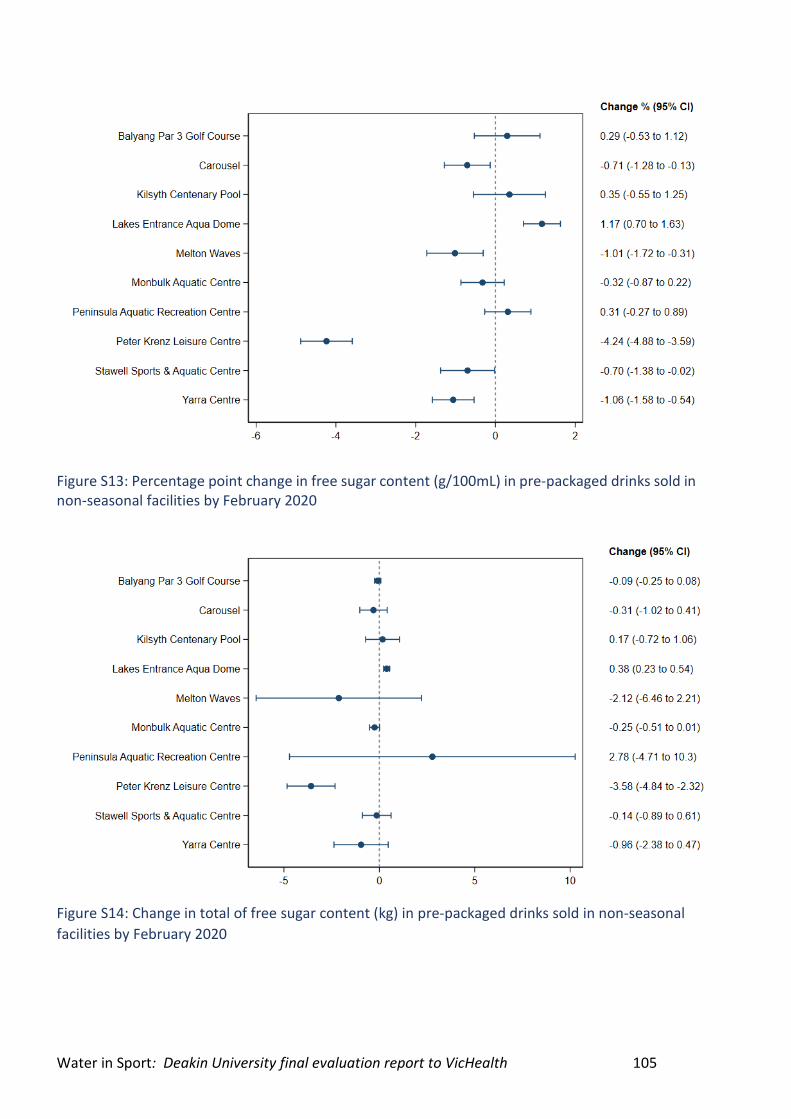
Water in Sport: Deakin University final evaluation report to VicHealth 105
Figure S13: Percentage point change in free sugar content (g/100mL) in pre-packaged drinks sold in non-seasonal facilities by February 2020
Figure S14: Change in total of free sugar content (kg) in pre-packaged drinks sold in non-seasonal
facilities by February 2020
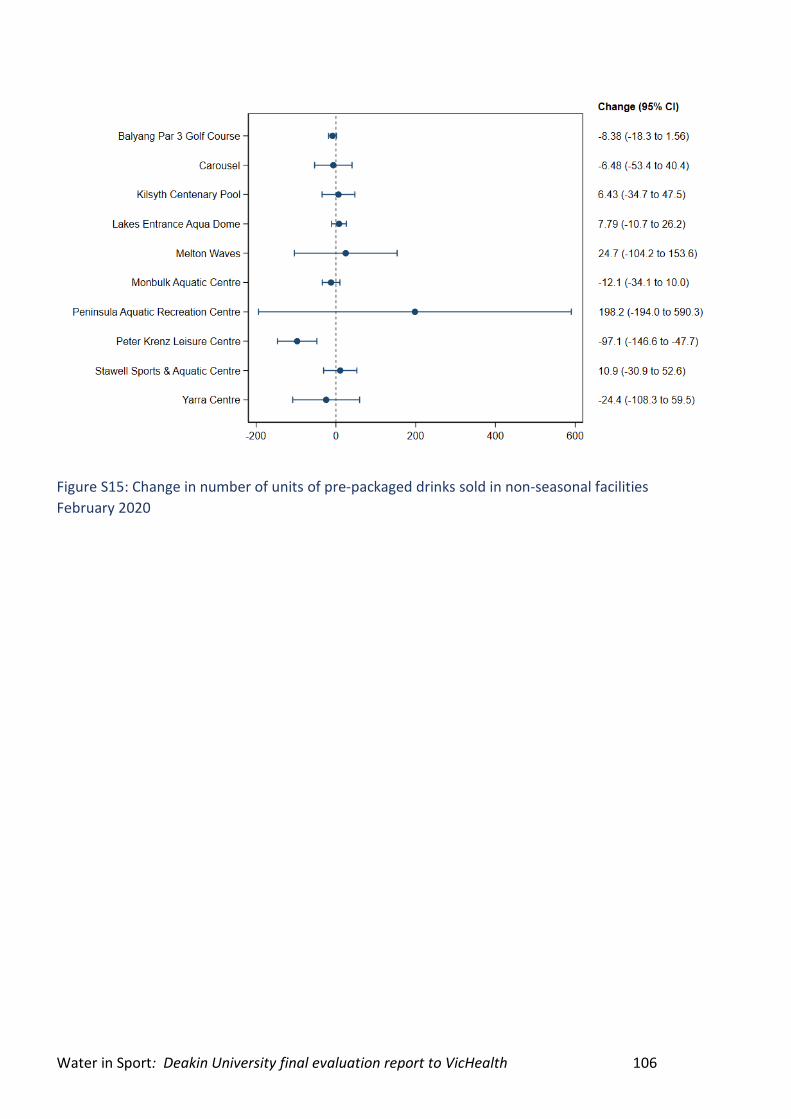
Water in Sport: Deakin University final evaluation report to VicHealth 106
Figure S15: Change in number of units of pre-packaged drinks sold in non-seasonal facilities
February 2020
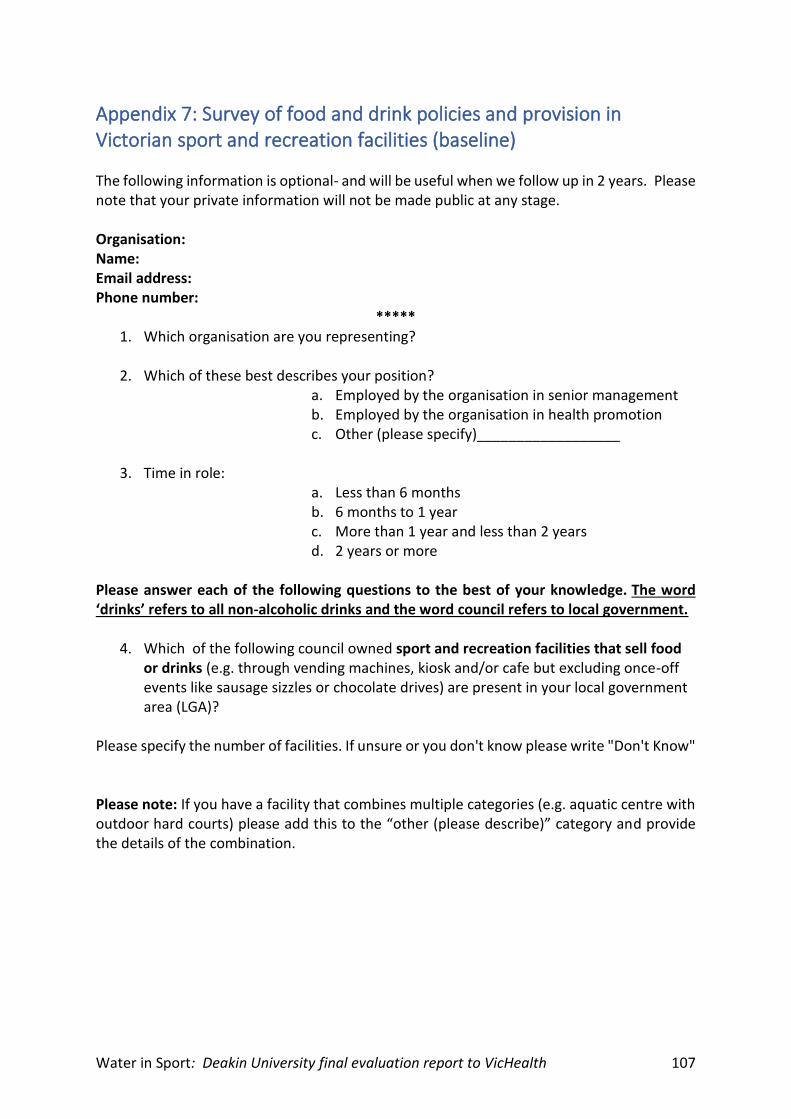
Water in Sport: Deakin University final evaluation report to VicHealth 107
Appendix 7: Survey of food and drink policies and provision in Victorian sport and recreation facilities (baseline)
The following information is optional- and will be useful when we follow up in 2 years. Please note that your private information will not be made public at any stage. Organisation: Name: Email address: Phone number:
***** 1. Which organisation are you representing? 2. Which of these best describes your position?
a. Employed by the organisation in senior management b. Employed by the organisation in health promotion c. Other (please specify)__________________
3. Time in role:
a. Less than 6 months b. 6 months to 1 year c. More than 1 year and less than 2 years d. 2 years or more
Please answer each of the following questions to the best of your knowledge. The word ‘drinks’ refers to all non-alcoholic drinks and the word council refers to local government.
4. Which of the following council owned sport and recreation facilities that sell food or drinks (e.g. through vending machines, kiosk and/or cafe but excluding once-off events like sausage sizzles or chocolate drives) are present in your local government area (LGA)?
Please specify the number of facilities. If unsure or you don't know please write "Don't Know" Please note: If you have a facility that combines multiple categories (e.g. aquatic centre with outdoor hard courts) please add this to the “other (please describe)” category and provide the details of the combination.
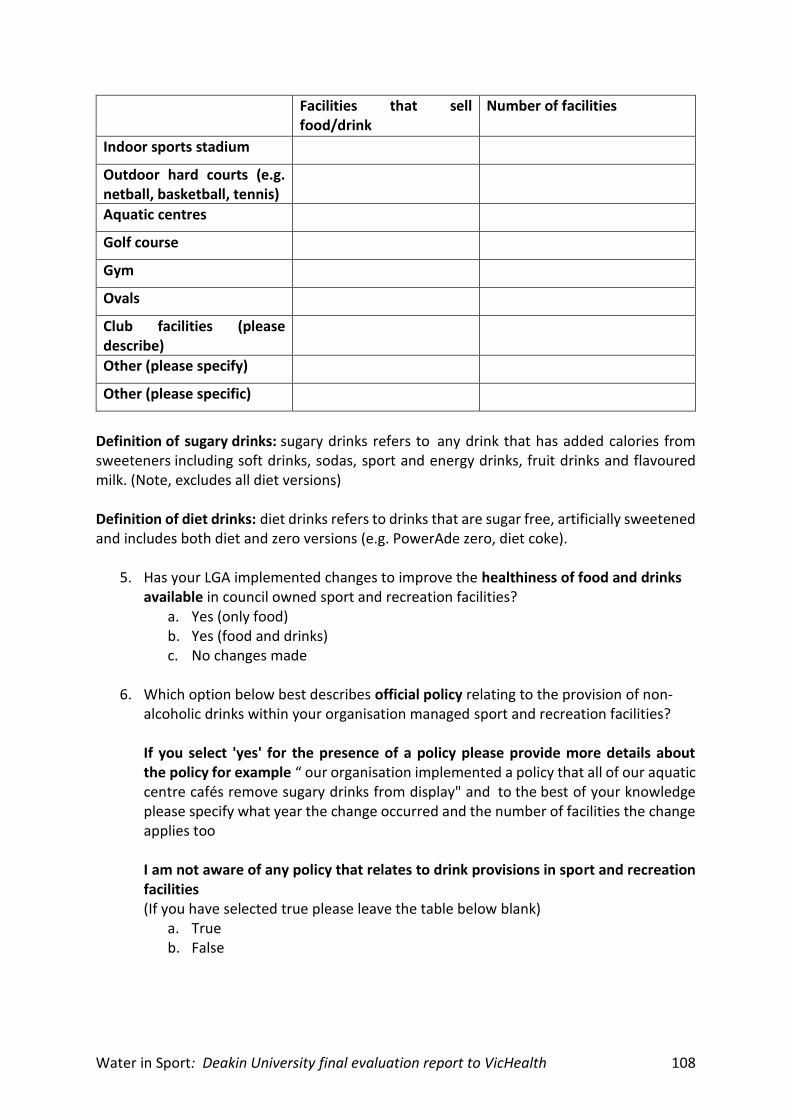
Water in Sport: Deakin University final evaluation report to VicHealth 108
Facilities that sell food/drink
Number of facilities
Indoor sports stadium
Outdoor hard courts (e.g. netball, basketball, tennis)
Aquatic centres
Golf course
Gym
Ovals
Club facilities (please describe)
Other (please specify)
Other (please specific)
Definition of sugary drinks: sugary drinks refers to any drink that has added calories from sweeteners including soft drinks, sodas, sport and energy drinks, fruit drinks and flavoured milk. (Note, excludes all diet versions) Definition of diet drinks: diet drinks refers to drinks that are sugar free, artificially sweetened and includes both diet and zero versions (e.g. PowerAde zero, diet coke).
5. Has your LGA implemented changes to improve the healthiness of food and drinks available in council owned sport and recreation facilities?
a. Yes (only food) b. Yes (food and drinks) c. No changes made
6. Which option below best describes official policy relating to the provision of non-
alcoholic drinks within your organisation managed sport and recreation facilities? If you select 'yes' for the presence of a policy please provide more details about the policy for example “ our organisation implemented a policy that all of our aquatic centre cafés remove sugary drinks from display" and to the best of your knowledge please specify what year the change occurred and the number of facilities the change applies too I am not aware of any policy that relates to drink provisions in sport and recreation facilities (If you have selected true please leave the table below blank)
a. True b. False
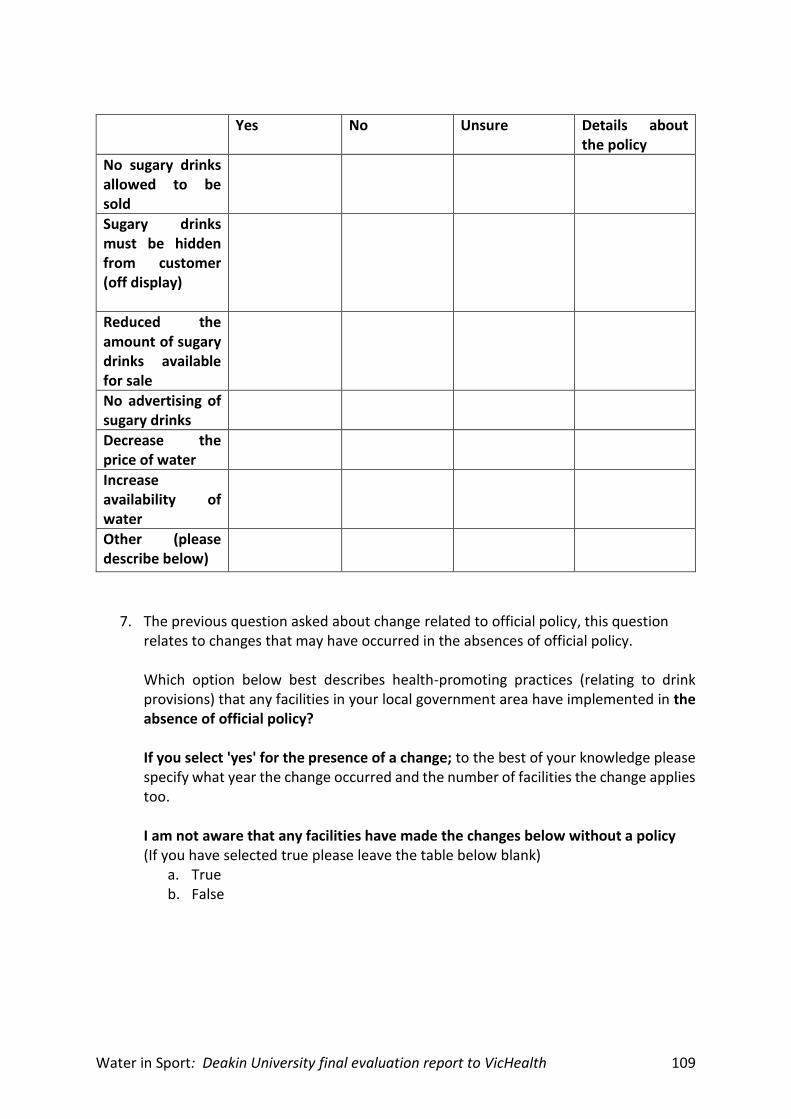
Water in Sport: Deakin University final evaluation report to VicHealth 109
Yes No Unsure Details about the policy
No sugary drinks allowed to be sold
Sugary drinks must be hidden from customer (off display)
Reduced the amount of sugary drinks available for sale
No advertising of sugary drinks
Decrease the price of water
Increase availability of water
Other (please describe below)
7. The previous question asked about change related to official policy, this question relates to changes that may have occurred in the absences of official policy. Which option below best describes health-promoting practices (relating to drink provisions) that any facilities in your local government area have implemented in the absence of official policy? If you select 'yes' for the presence of a change; to the best of your knowledge please specify what year the change occurred and the number of facilities the change applies too.
I am not aware that any facilities have made the changes below without a policy (If you have selected true please leave the table below blank)
a. True b. False
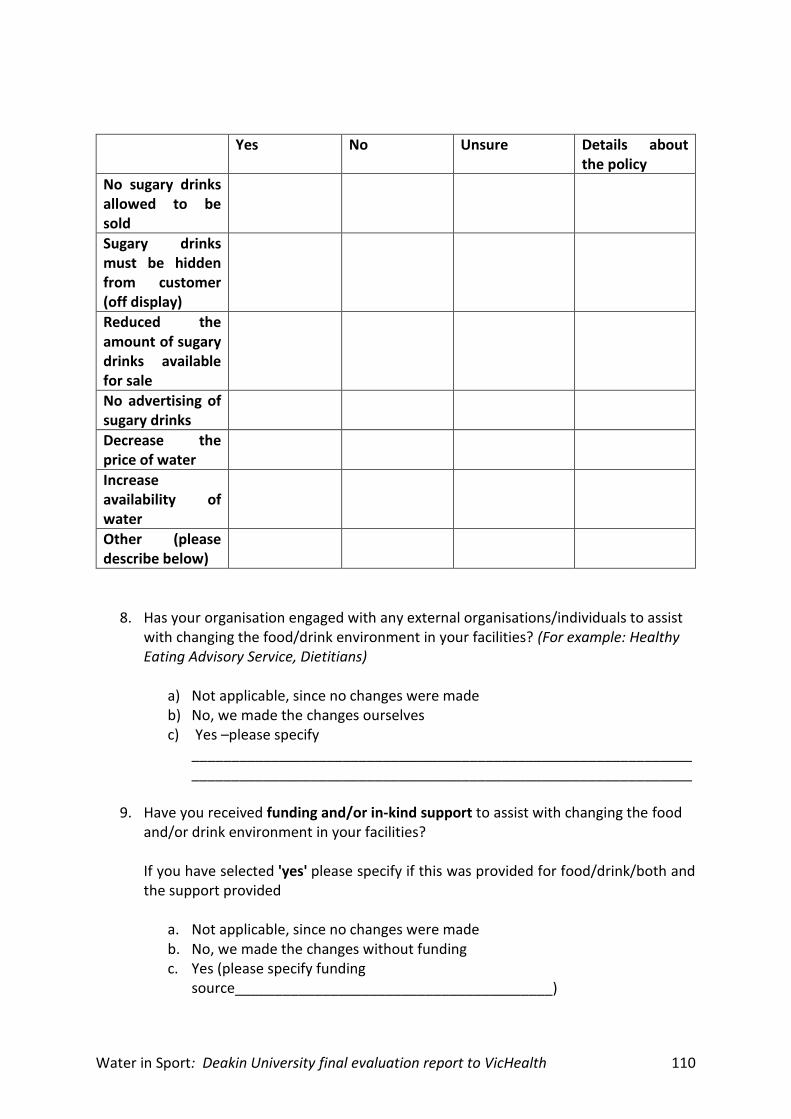
Water in Sport: Deakin University final evaluation report to VicHealth 110
Yes No Unsure Details about the policy
No sugary drinks allowed to be sold
Sugary drinks must be hidden from customer (off display)
Reduced the amount of sugary drinks available for sale
No advertising of sugary drinks
Decrease the price of water
Increase availability of water
Other (please describe below)
8. Has your organisation engaged with any external organisations/individuals to assist with changing the food/drink environment in your facilities? (For example: Healthy Eating Advisory Service, Dietitians)
a) Not applicable, since no changes were made b) No, we made the changes ourselves c) Yes –please specify
______________________________________________________________________________________________________________________________
9. Have you received funding and/or in-kind support to assist with changing the food and/or drink environment in your facilities? If you have selected 'yes' please specify if this was provided for food/drink/both and the support provided
a. Not applicable, since no changes were made b. No, we made the changes without funding c. Yes (please specify funding
source________________________________________)
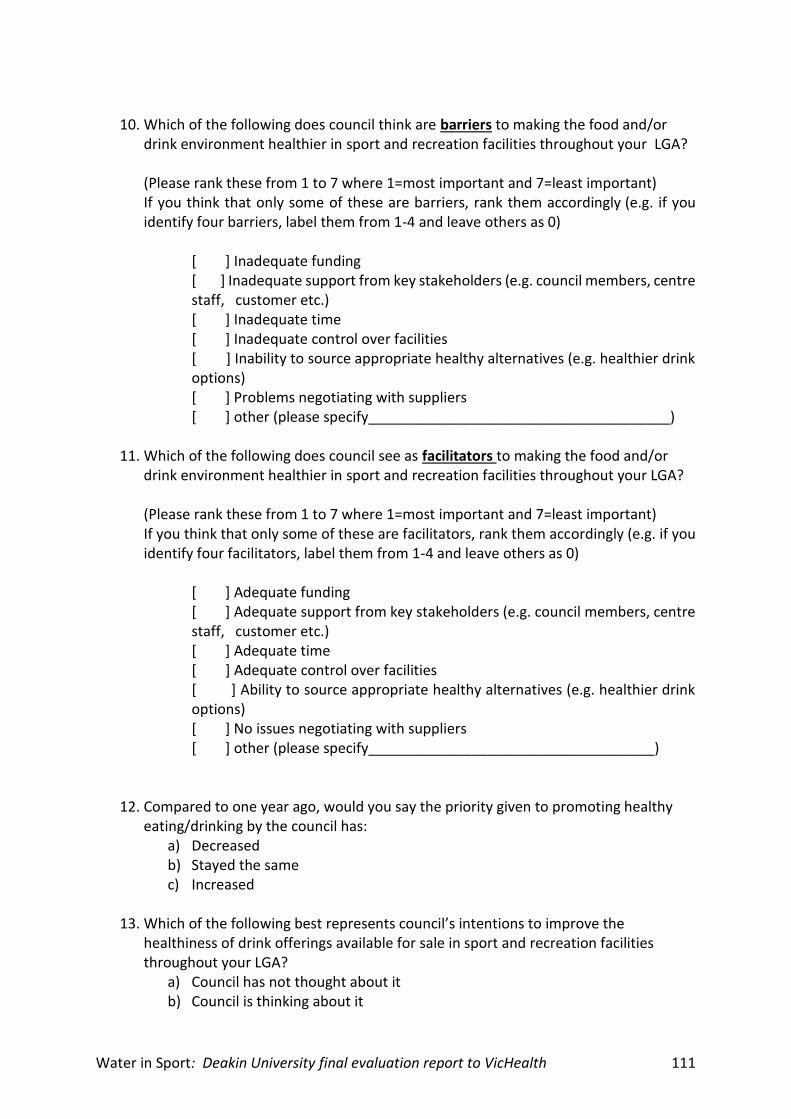
Water in Sport: Deakin University final evaluation report to VicHealth 111
10. Which of the following does council think are barriers to making the food and/or
drink environment healthier in sport and recreation facilities throughout your LGA? (Please rank these from 1 to 7 where 1=most important and 7=least important) If you think that only some of these are barriers, rank them accordingly (e.g. if you identify four barriers, label them from 1-4 and leave others as 0)
[ ] Inadequate funding [ ] Inadequate support from key stakeholders (e.g. council members, centre staff, customer etc.) [ ] Inadequate time [ ] Inadequate control over facilities [ ] Inability to source appropriate healthy alternatives (e.g. healthier drink options) [ ] Problems negotiating with suppliers [ ] other (please specify______________________________________)
11. Which of the following does council see as facilitators to making the food and/or drink environment healthier in sport and recreation facilities throughout your LGA? (Please rank these from 1 to 7 where 1=most important and 7=least important) If you think that only some of these are facilitators, rank them accordingly (e.g. if you identify four facilitators, label them from 1-4 and leave others as 0)
[ ] Adequate funding [ ] Adequate support from key stakeholders (e.g. council members, centre staff, customer etc.) [ ] Adequate time [ ] Adequate control over facilities [ ] Ability to source appropriate healthy alternatives (e.g. healthier drink options) [ ] No issues negotiating with suppliers [ ] other (please specify____________________________________)
12. Compared to one year ago, would you say the priority given to promoting healthy eating/drinking by the council has:
a) Decreased b) Stayed the same c) Increased
13. Which of the following best represents council’s intentions to improve the
healthiness of drink offerings available for sale in sport and recreation facilities throughout your LGA?
a) Council has not thought about it b) Council is thinking about it
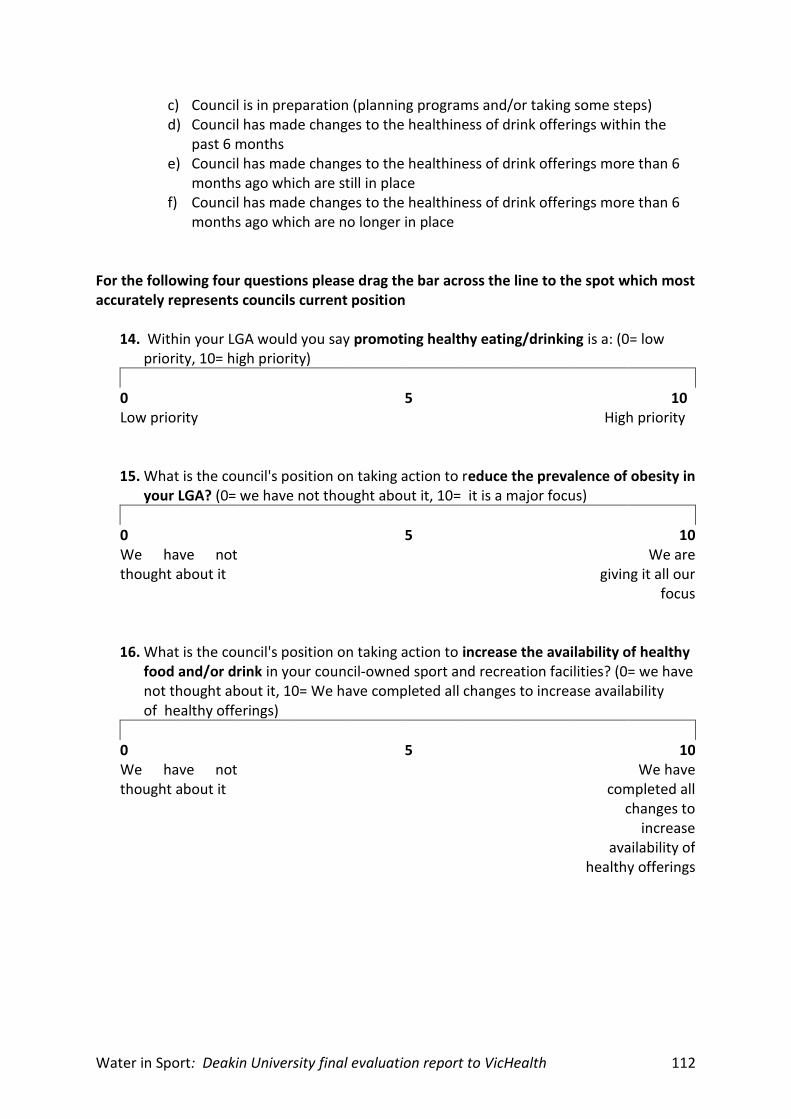
Water in Sport: Deakin University final evaluation report to VicHealth 112
c) Council is in preparation (planning programs and/or taking some steps) d) Council has made changes to the healthiness of drink offerings within the
past 6 months e) Council has made changes to the healthiness of drink offerings more than 6
months ago which are still in place f) Council has made changes to the healthiness of drink offerings more than 6
months ago which are no longer in place For the following four questions please drag the bar across the line to the spot which most accurately represents councils current position
14. Within your LGA would you say promoting healthy eating/drinking is a: (0= low priority, 10= high priority)
0 5 10 Low priority High priority
15. What is the council's position on taking action to reduce the prevalence of obesity in your LGA? (0= we have not thought about it, 10= it is a major focus)
0 5 10 We have not thought about it
We are giving it all our
focus
16. What is the council's position on taking action to increase the availability of healthy
food and/or drink in your council-owned sport and recreation facilities? (0= we have not thought about it, 10= We have completed all changes to increase availability of healthy offerings)
0 5 10 We have not thought about it
We have completed all
changes to increase
availability of healthy offerings
Water in Sport: Deakin University final evaluation report to VicHealth 113
17. What is the council's position on taking action to reduce the availability of sugary drinks for sale in your council-owned sport and recreation facilities? (0= we have thought about it, 10= we have fully removed sugary drinks)
0 5 10 We have not thought about it
We have fully removed sugary
drinks
Please attach any official council policies relating to the provision of food and drinks within any of your council’s sport and recreation facilities? (optional) If you need to upload multiple files please compress all files into a ZIP file before uploading Files uploaded can be up to 100MB. For security reasons, executable files (such as those ending in .exe) are not permitted. Or please enter the weblink below _______________________________________________ Does the council have any other official policies relating to healthy food and drink provision within the community outside the sport and recreation scope? For example: all council events must have free water available
b. Yes c. No d. I don’t know
Please attach any official council policies relating to healthy food and drink provision within the community outside the sport and recreation scope? (optional) If you need to upload multiple files please compress all files into a ZIP file before uploading Files uploaded can be up to 100MB. For security reasons, executable files (such as those ending in .exe) are not permitted. Or please enter the weblink below _____________________________________________________________________ Do you have any other comments you would like to make about health promotion practises throughout your LGA, including how VicHealth and the Department of Health and Human Services can help you achieve your goals in this area?
_________________________________________________________________________________________________________________________________________________________________________________________________________________________________________________________________________________________________________________________________________________________________________________________________________
Water in Sport: Deakin University final evaluation report to VicHealth 114
Do you have any other comment you would like to make regarding the survey?
_________________________________________________________________________________________________________________________________________________________________________________________________________________________________________________________________________________________________________________________________________________________________________________________________________
Water in Sport: Deakin University final evaluation report to VicHealth 115
Appendix 8: Survey of food and drink policies and provision in Victorian sport and recreation facilities (follow- up) The following information is optional- and will be useful when we follow up in 2 years. Please note that your private information will not be made public at any stage. Organisation: Name: Email address: Phone number:
*****
1. Which Local Government Area (LGA) are you representing?
2. Which of these bests describes your position? a. Employed by council in health promotion role b. Employed by council in sport and recreation role c. Employed by council as an environmental health officer d. Employed by council in community development or
planning e. Other (please specify) __________________
3. Time in role:
a. Less than 6 months b. 6 months to 1 year c. More than 1 year and less than 2 years d. 2 years or more
Please answer each of the following questions to the best of your knowledge. The word ‘drinks’ refers to all non-alcoholic drinks and the word ‘council’ refers to local government.
4. Does your council own any sport or recreation facilities? a. Yes b. No
**Skip Logic**
5. Which of the following council-owned sport and recreation facilities sell food or
drinks in your LGA? For example, but not limited to: through vending machines, ice cream freezers, kiosk and/or café but excluding once-off events like sausage sizzles or chocolate fundraisers.
Please specify the number of facilities. If unsure or you don't know please write "Don't Know"
Water in Sport: Deakin University final evaluation report to VicHealth 116
Please note: If you have a facility that combines multiple categories (e.g. aquatic centre with outdoor hard courts) please add this to the “other (please describe)” category and provide the details of the combination.
Facilities that sell food/drink (Yes/No/Unsure)
Number of council-owned and managed facilities (enter 0 if not applicable)
Number of council-owned and externally managed facilities (enter 0 if not applicable)
Indoor sports stadium
Outdoor hard courts (e.g. netball, basketball, tennis)
Aquatic centres
Golf course
Gym
Ovals
Club facilities (please describe)
Other (please specify)
The definitions below will be useful for the remaining questions. Sugary drinks: sugary drinks refer to any non-alcoholic water-based drinks with added sugar, including sugar-sweetened soft drinks and flavoured mineral waters, fortified waters, energy and electrolyte drinks, fruit and vegetable drinks, and cordials. This does not include fruit juice that is 100% fruit. Diet drinks: diet drinks refers to drinks that are sugar free, sweetened with intense sweeteners (artificial or natural) and includes both diet and zero versions (e.g. PowerAde zero, diet coke). Healthy change to drinks: any changes made to the drinks available or promoted such as reducing the amount of sugary drinks available, increasing the availability of healthy options such as water, 100% fruit juice and small flavoured milks, or decreasing marketing of unhealthy drinks. Healthy changes to food: any changes made to the food available and promoted that reduce unhealthy food options and increase healthy food options. Including reducing the availability of deep-fried options and/or high fat and sugar snacks (such as chocolate and ice cream) and increasing the variety of whole grains or fruit or vegetable products, or reducing marketing of unhealthy foods.
6. Are you aware of any written council policy that relates to healthiness of food
and/or drinks available in sport and recreation facilities?
Water in Sport: Deakin University final evaluation report to VicHealth 117
a. Yes (only drinks) b. Yes (only food) c. Yes (food and drinks) d. No policy relating to food or drinks
**Skip Logic**
7. Which of the options below are part of council official policy relating to the
provision of food and non-alcoholic drinks within your council-owned sport and recreation facilities that have been made? If you select 'yes' for the presence of a policy please provide more details about the policy and to the best of your knowledge please specify what year the change occurred (policy was implemented) and the number of facilities to which the change applies. For example “In 2017 our council implemented a policy that all of our aquatic centre cafés remove sugary drinks from display (placed behind counter or covered with poster in fridge)".
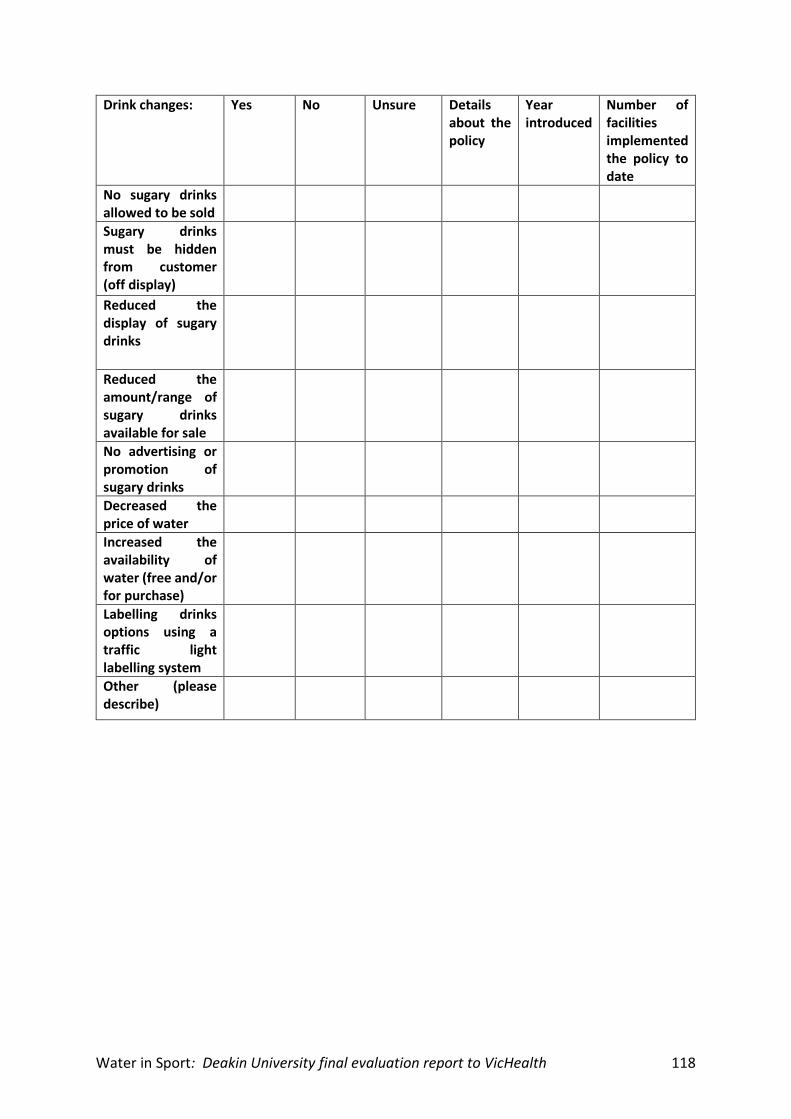
Water in Sport: Deakin University final evaluation report to VicHealth 118
Drink changes: Yes No Unsure Details about the policy
Year introduced
Number of facilities implemented the policy to date
No sugary drinks allowed to be sold
Sugary drinks must be hidden from customer (off display)
Reduced the display of sugary drinks
Reduced the amount/range of sugary drinks available for sale
No advertising or promotion of sugary drinks
Decreased the price of water
Increased the availability of water (free and/or for purchase)
Labelling drinks options using a traffic light labelling system
Other (please describe)
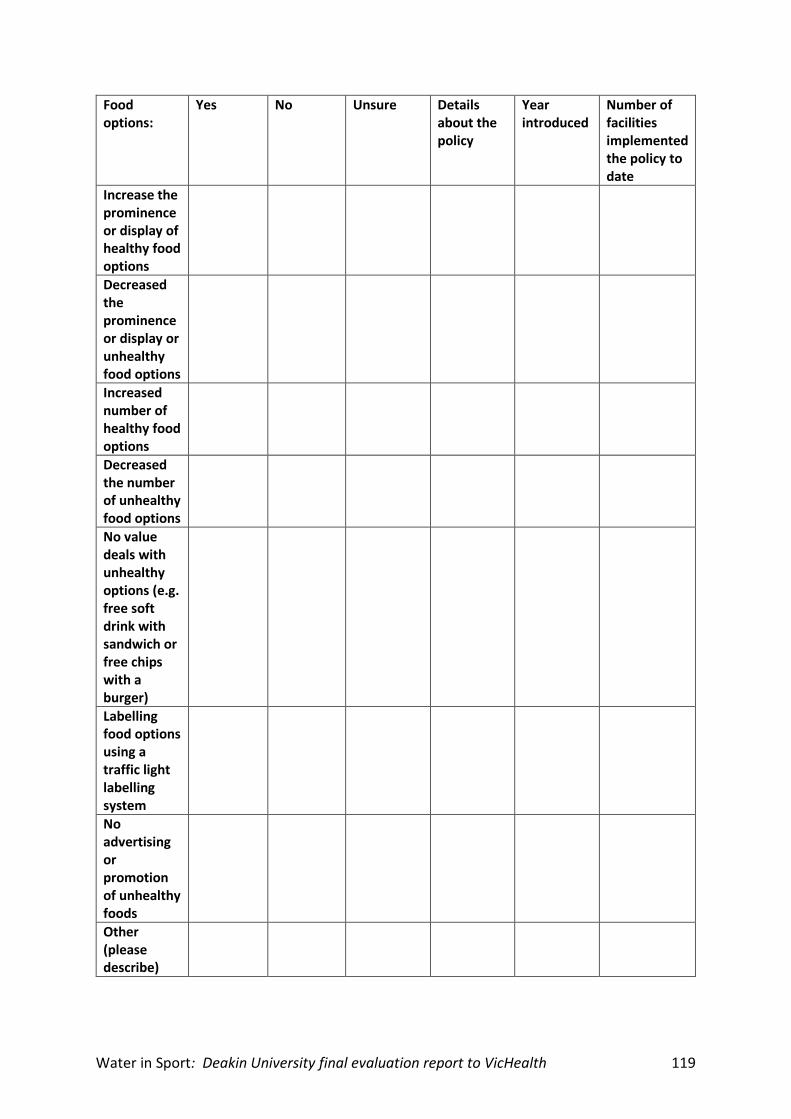
Water in Sport: Deakin University final evaluation report to VicHealth 119
Food options:
Yes No Unsure Details about the policy
Year introduced
Number of facilities implemented the policy to date
Increase the prominence or display of healthy food options
Decreased the prominence or display or unhealthy food options
Increased number of healthy food options
Decreased the number of unhealthy food options
No value deals with unhealthy options (e.g. free soft drink with sandwich or free chips with a burger)
Labelling food options using a traffic light labelling system
No advertising or promotion of unhealthy foods
Other (please describe)
Water in Sport: Deakin University final evaluation report to VicHealth 120
8. The previous question asked about changes related to council official policy, this question relates to changes that may have occurred in the absence of official policy. Has your LGA made changes to improve the healthiness of food and/or drinks available in council-owned sport and recreation facilities in the absence of official policy since November 2018?
a. Yes (only drinks) b. Yes (only food) c. Yes (food and drinks) d. No changes made
**SKIP LOGIC**
If you select 'yes' for the presence of a change; to the best of your knowledge please specify what year the change was implemented and the number of facilities the change applies too.
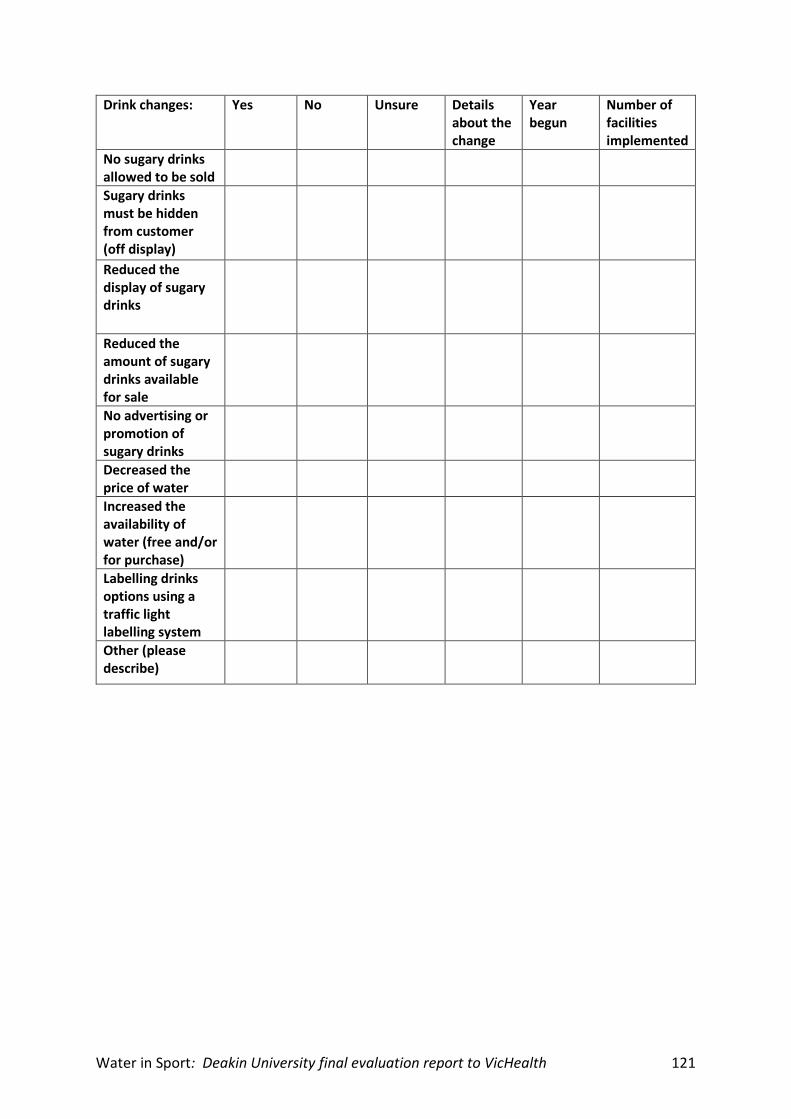
Water in Sport: Deakin University final evaluation report to VicHealth 121
Drink changes: Yes No Unsure Details about the change
Year begun
Number of facilities implemented
No sugary drinks allowed to be sold
Sugary drinks must be hidden from customer (off display)
Reduced the display of sugary drinks
Reduced the amount of sugary drinks available for sale
No advertising or promotion of sugary drinks
Decreased the price of water
Increased the availability of water (free and/or for purchase)
Labelling drinks options using a traffic light labelling system
Other (please describe)
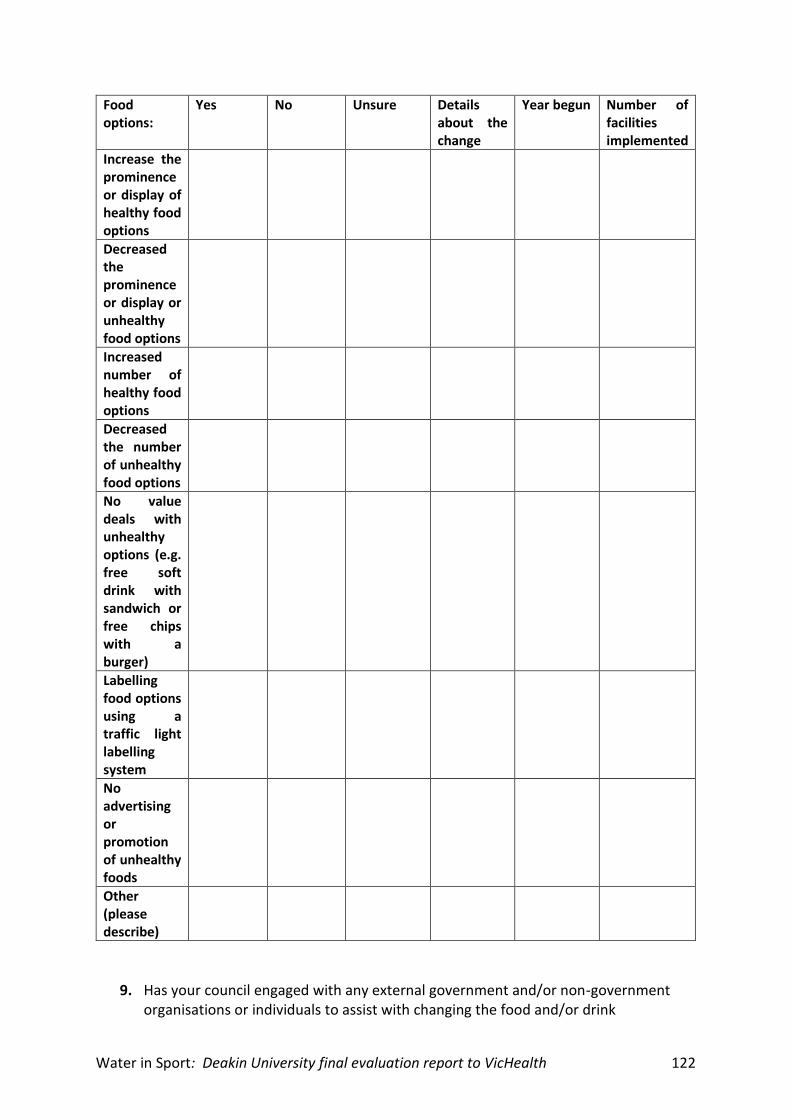
Water in Sport: Deakin University final evaluation report to VicHealth 122
Food options:
Yes No Unsure Details about the change
Year begun Number of facilities implemented
Increase the prominence or display of healthy food options
Decreased the prominence or display or unhealthy food options
Increased number of healthy food options
Decreased the number of unhealthy food options
No value deals with unhealthy options (e.g. free soft drink with sandwich or free chips with a burger)
Labelling food options using a traffic light labelling system
No advertising or promotion of unhealthy foods
Other (please describe)
9. Has your council engaged with any external government and/or non-government organisations or individuals to assist with changing the food and/or drink
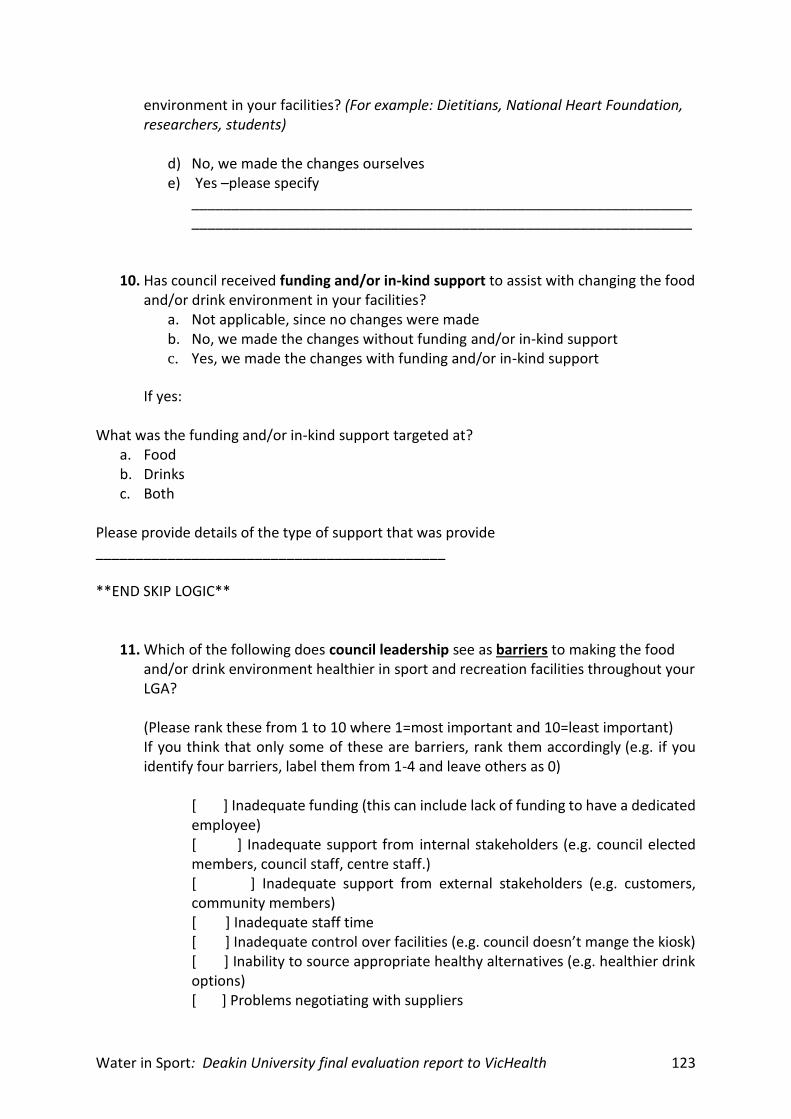
Water in Sport: Deakin University final evaluation report to VicHealth 123
environment in your facilities? (For example: Dietitians, National Heart Foundation, researchers, students)
d) No, we made the changes ourselves e) Yes –please specify
______________________________________________________________________________________________________________________________
10. Has council received funding and/or in-kind support to assist with changing the food and/or drink environment in your facilities?
a. Not applicable, since no changes were made b. No, we made the changes without funding and/or in-kind support c. Yes, we made the changes with funding and/or in-kind support
If yes:
What was the funding and/or in-kind support targeted at? a. Food b. Drinks c. Both
Please provide details of the type of support that was provide ____________________________________________ **END SKIP LOGIC**
11. Which of the following does council leadership see as barriers to making the food and/or drink environment healthier in sport and recreation facilities throughout your LGA? (Please rank these from 1 to 10 where 1=most important and 10=least important) If you think that only some of these are barriers, rank them accordingly (e.g. if you identify four barriers, label them from 1-4 and leave others as 0)
[ ] Inadequate funding (this can include lack of funding to have a dedicated employee) [ ] Inadequate support from internal stakeholders (e.g. council elected members, council staff, centre staff.) [ ] Inadequate support from external stakeholders (e.g. customers, community members) [ ] Inadequate staff time [ ] Inadequate control over facilities (e.g. council doesn’t mange the kiosk) [ ] Inability to source appropriate healthy alternatives (e.g. healthier drink options) [ ] Problems negotiating with suppliers
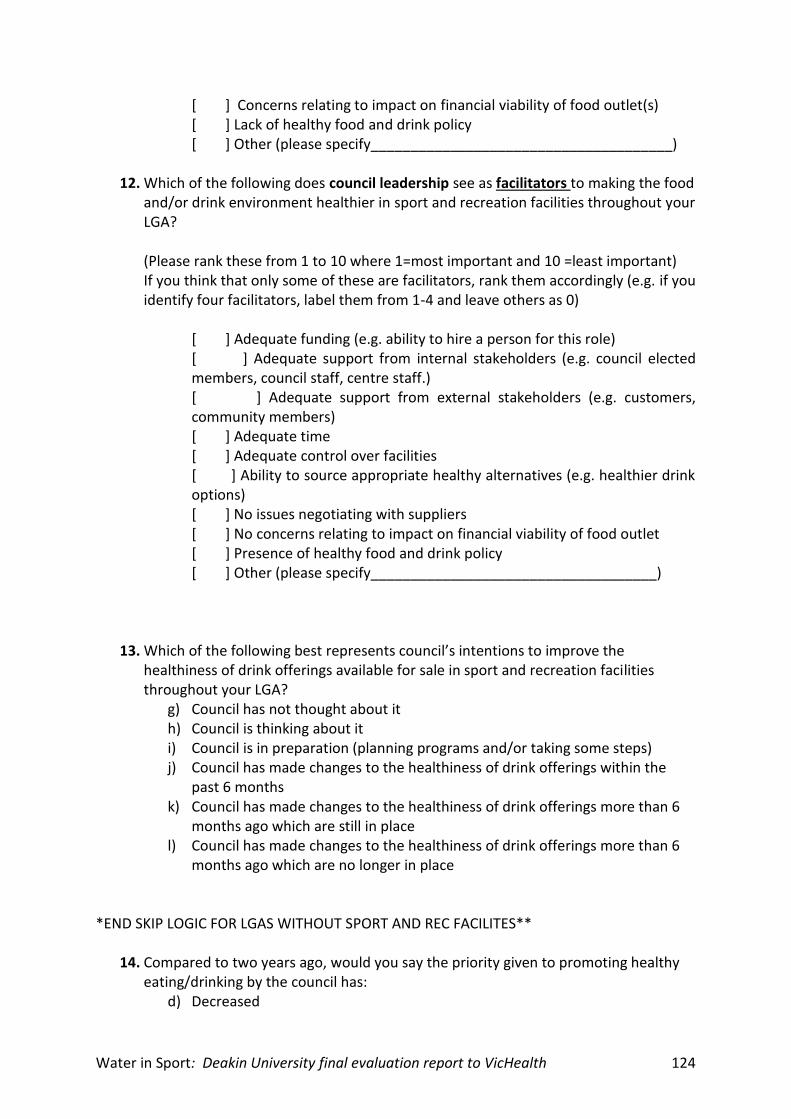
Water in Sport: Deakin University final evaluation report to VicHealth 124
[ ] Concerns relating to impact on financial viability of food outlet(s) [ ] Lack of healthy food and drink policy [ ] Other (please specify______________________________________)
12. Which of the following does council leadership see as facilitators to making the food and/or drink environment healthier in sport and recreation facilities throughout your LGA? (Please rank these from 1 to 10 where 1=most important and 10 =least important) If you think that only some of these are facilitators, rank them accordingly (e.g. if you identify four facilitators, label them from 1-4 and leave others as 0)
[ ] Adequate funding (e.g. ability to hire a person for this role) [ ] Adequate support from internal stakeholders (e.g. council elected members, council staff, centre staff.) [ ] Adequate support from external stakeholders (e.g. customers, community members) [ ] Adequate time [ ] Adequate control over facilities [ ] Ability to source appropriate healthy alternatives (e.g. healthier drink options) [ ] No issues negotiating with suppliers [ ] No concerns relating to impact on financial viability of food outlet [ ] Presence of healthy food and drink policy [ ] Other (please specify____________________________________)
13. Which of the following best represents council’s intentions to improve the
healthiness of drink offerings available for sale in sport and recreation facilities throughout your LGA?
g) Council has not thought about it h) Council is thinking about it i) Council is in preparation (planning programs and/or taking some steps) j) Council has made changes to the healthiness of drink offerings within the
past 6 months k) Council has made changes to the healthiness of drink offerings more than 6
months ago which are still in place l) Council has made changes to the healthiness of drink offerings more than 6
months ago which are no longer in place *END SKIP LOGIC FOR LGAS WITHOUT SPORT AND REC FACILITES**
14. Compared to two years ago, would you say the priority given to promoting healthy eating/drinking by the council has:
d) Decreased
Water in Sport: Deakin University final evaluation report to VicHealth 125
e) Stayed the same f) Increased g) Unsure
15. Has your council collaborated with any local health services to develop and/or
support local promotion of healthy eating and drinks?
a) No b) Yes –please specify including.
i. Support ii. Resourcing
______________________________________________________________________________________________________________________________
For the following four questions please drag the bar across the line to the spot which most accurately represents council leadership’s current position
16. Within your LGA would you say promoting healthy eating/drinking is a: (0= low priority, 5= medium priority, 10= high priority)
0 5 10
Low priority High priority
17. What is the council's position on taking action to reduce the prevalence of obesity in
your LGA? (0= we have not thought about it, 10= it is a major focus)
0 5 10
We have not thought
about it We are
giving it all our focus
18. What is the council's position on taking action to improve public health and wellbeing LGA? (0= we have not thought about it, 10= it is a major focus)
0 5 10
We have not thought
about it We are
giving it all our focus
*Skip Logic*Only council that noted change*
Water in Sport: Deakin University final evaluation report to VicHealth 126
19. What is the council's position on taking action to increase the availability of healthy food and/or drink in your council-owned sport and recreation facilities? (0= we have not thought about it, 10= We have completed all changes to increase availability of healthy offerings)
0 5 10
We have not thought about it
We have completed all changes to increase
availability of healthy offerings
20. What is the council's position on taking action to reduce the availability of sugary
drinks for sale in your council-owned sport and recreation facilities? (0= we have not
thought about it, 10= we have fully removed sugary drinks)
0 5 10 We have not thought about it
We have fully removed sugary drinks
21. What is the council's position on taking action to reduce the availability of unhealthy foods for sale in your council-owned sport and recreation facilities? (0= we have not thought about it, 10= we have fully removed unhealthy food)
0 5 10 We have not thought about it
We have fully unhealthy food
22. Please attach any official council policies relating to the provision of food and drinks
within any of your council’s sport and recreation facilities. If you need to upload multiple files please compress all files into a ZIP file before uploading Files uploaded can be up to 100MB. For security reasons, executable files (such as those ending in .exe) are not permitted. Or please enter the weblink below _______________________________________________ **End skip logic**
Water in Sport: Deakin University final evaluation report to VicHealth 127
23. Does the council have any other official policies relating to healthy food and drink provision within the community outside the sport and recreation scope?
This may include health care services, schools and childcare centres. For example: all council events must have free water available
a. Yes b. No c. I don’t know
24. Please attach any official council policies relating to healthy food and drink provision
within the community outside the sport and recreation scope (optional) For example: Healthy catering policy for staff events If you need to upload multiple files please compress all files into a ZIP file before uploading. Files uploaded can be up to 100MB. For security reasons, executable files (such as those ending in .exe) are not permitted. Or please enter the weblink below _____________________________________________________________________
25. Do you have any other comments you would like to make about public health practises throughout your LGA, including how the state government can help you achieve your goals in this area?
_________________________________________________________________________________________________________________________________________________________________________________________________________________________________________________________________________________________________________________________________________________________________________________________________________
26. Do you have any other comments you would like to make regarding the survey? _________________________________________________________________________________________________________________________________________________________________________________________________________________________________________________________________________________________________________________________________________________________________________________________________________
Water in Sport: Deakin University final evaluation report to VicHealth 128
Appendix 9: Customer Survey You must be 15 years or older to complete this survey
Definition of sugary drinks: sugary drinks refers to any drink that has added calories from
sweeteners including soft drinks, sodas, sport and energy drinks, fruit drinks, flavoured
milk excluding the diet version
Definition of diet drinks: diet drinks refers to drinks that are sugar free, artificially sweetened
and include the diet and zero versions (e.g. PowerAde zero, diet coke).
1. Please select which sport and recreation facilities you are at today? (Please tick one)
2. In the past 6 months, how often would you usually purchase food or drink from the
food outlet at this facility? (Please circle one)
a. Everyday
b. Three or more days a week
c. One or two days a week
d. Less than once a week
e. Less than twice per month
f. Never before
3. What food/s did you purchase from the
food outlet at this facility today?
(Tick all that apply)
o Lollies, chocolate, chips (packet)
o Cakes, biscuits, muffins
o Ice creams or icy poles
o Sandwiches, rolls, wraps
o Fruit, vegetables
o Sausage rolls, hot chips, fried foods
o Hot meals
o Sushi
o Other
Please specify:
________________________________
________________________________
o I didn't purchase food
4. What drink/s did you purchase from the
food outlet at this facility today?
(Tick all that apply)
o Regular soft drink or regular energy
drink
o Diet soft drink or diet energy drink
o Water
o Slushy
o Milkshake/thick shake
o Smoothie
o Coffee/ tea
o hot chocolate
o Other
Please specify:
________________________________
________________________________
o I didn’t purchase drinks
5. Did you drink any water while you were at the facility today?
o Yes
o No
Water in Sport: Deakin University final evaluation report to VicHealth 129
6. If yes, when you drank water did you (tick all relevant):
o purchase water at the facility
o bring water from home
o purchase water from outside the facility
o use the water fountain at the facility
7. What would make you more likely to drink from the water fountain? (tick all that
apply)
o Cleanliness of fountain
o Appearance of the fountain
o Change in water temperature
o Better location
o Water pressure
o Other
Please specify
______________________________________________________________
o I am happy with the water fountains
o No water fountains at this facility
8. Did you consume any food or drinks while you were at the facility today that were
brought from outside the facility?
o Yes
o No
9. If yes, what did you bring from outside the facility? (Tick all relevant)
o Lollies, chocolate, chips (packet)
o Cakes, biscuits, muffins
o Ice creams or icy poles
o Sandwiches, rolls, wraps
o Fruit, vegetables
o Sausage rolls, hot chips, fried foods
o Hot meals
o Sushi
o Regular soft drink or regular energy drink
o Diet soft drink or diet energy drink
o Water
o Slushy
o Milkshake/thick shake
o Smoothie
o Coffee/ tea
o hot chocolate
Water in Sport: Deakin University final evaluation report to VicHealth 130
o Other
Please specify
______________________________________________________________
Definition of sugary drinks: sugary drinks refers to any drink that has added calories from
sweeteners including soft drinks, sodas, sport and energy drinks, fruit drinks, flavoured
milk excluding the diet version
Definition of diet drinks: diet drinks refers to drinks that are sugar free, artificially sweetened
and include the diet and zero versions (e.g. PowerAde zero, diet coke).
o Have you noticed any changes to the food and drink offered at the facility in the
last 6 months?Yes
o No
10. If yes, what have you noticed? (Tick all relevant)
o Changes in the variety of sugary drinks
o Changes to the availability of sugary drink
o Changes to fridge display
o Changes to prices
o Changes in the variety of water
o Changes to the availability of water
o Changes to advertising of water
o Other. Please specify:
_________________________________________________________
11. On how many days in the past week did you drink regular sugary drinks (non- diet
version)?
o None
o 1-2
o 2-4
o 5-6
o 7
12. On how many days in the past week did you drink diet sugary drinks?
o None
o 1-2
o 2-4
o 5-6
o 7
Water in Sport: Deakin University final evaluation report to VicHealth 131
13. Considering your current intake of sugary drinks, would you like to (circle one):
Drink much less drink less drink the same amount drink more drink much more
14. Where is the most common place that your purchase sugary drinks?
o Supermarket
o Convenience store
o Restaurants
o Sport and recreation facilities
o Other. Please specify:
_________________________________________________________
o I don’t purchase sugary drinks
15. Which of the following do you think are healthy drink options for drinking every day?
(Tick all that apply)
o Water
o Juice
o Milk
o Regular soft drinks/regular energy drinks
o Diet soft drinks/diet energy drinks
16. Please select all those statements that apply. Drinking sugary drinks often will…
o Lead you to gain weight
o Increase your risk of heart disease
o Have no impact on your health
o Increase your risk of diabetes
o Help you live a healthier life
o Increase your risk of dental decay
17. Do you believe your community needs to implement changes to reduce sugary drink
consumption? (Circle one)
Definitely yes probably yes probably not definitely not unsure
18. Who do you think is responsible for reducing the consumption of sugary drinks? (Tick
all that apply)
o Me
o Local Government
o Federal Government
o Parents of children
o Primary and secondary schools
o Other. Please specify:
_________________________________________________________
o I don't think the level of consumption needs to be changed
Water in Sport: Deakin University final evaluation report to VicHealth 132
o I don’t know
19. If sugary drinks were removed from sales from your sports facility would you be most
likely to (tick one):
o Buy no drinks
o Buy another sort of drink
o Bring your own sugary drinks (diet and regular) from outside
o Not applicable - I don’t buy sugary drinks
o Other. Please specify:
_________________________________________________________
20. What do you think sport and recreation facilities should do to help reduce the
consumption of sugary drinks? (Tick all that apply)
o Increase the price of sugary drinks
o Reduce the price of water
o Remove all sugary drinks from customer view
o Remove all sugary drinks completely from sale
o Limit the amount of sugary drinks for sale
o Other. Please specify:
_________________________________________________________
o I don’t think they should change anything
21. In general, how much do you agree with the statement: “removing sugary drinks from
sport and recreation facilities will lead to reduced consumption in the community”?
(Circle one)
Strongly disagree Disagree Neither agree nor disagree Agree Strongly Agree
22. How much do you agree with the statement: “Sport and recreation centres have a
responsibility to promote healthy eating”? (Circle one)
Strongly disagree Disagree Neither agree nor disagree Agree Strongly Agree
23. If you have any other feedback you would like to provide about this food outlet,
please provide this below.
___________________________________________________________________________
___________________________________________________________________________
___________________________________________________________________________
About you (demographic questions):
Age (circle one):
15 – 17 18 – 24 25 – 34 35 – 44 45 – 54 55 – 64 65 years or older
Water in Sport: Deakin University final evaluation report to VicHealth 133
Gender (tick one): Female
o Male
o Other
What is your highest level of formal education that you have completed?
o Still in high school
o Did not complete high school
o Year 12 or Trade certificate or diploma
o University degree or higher
Postcode (home): ___________
About your visit today:
No. of adults in your group (tick one):
o 1
o 2
o 3 +
No. of children your group (tick one):
o 0
o 1
o 2
o 3 +
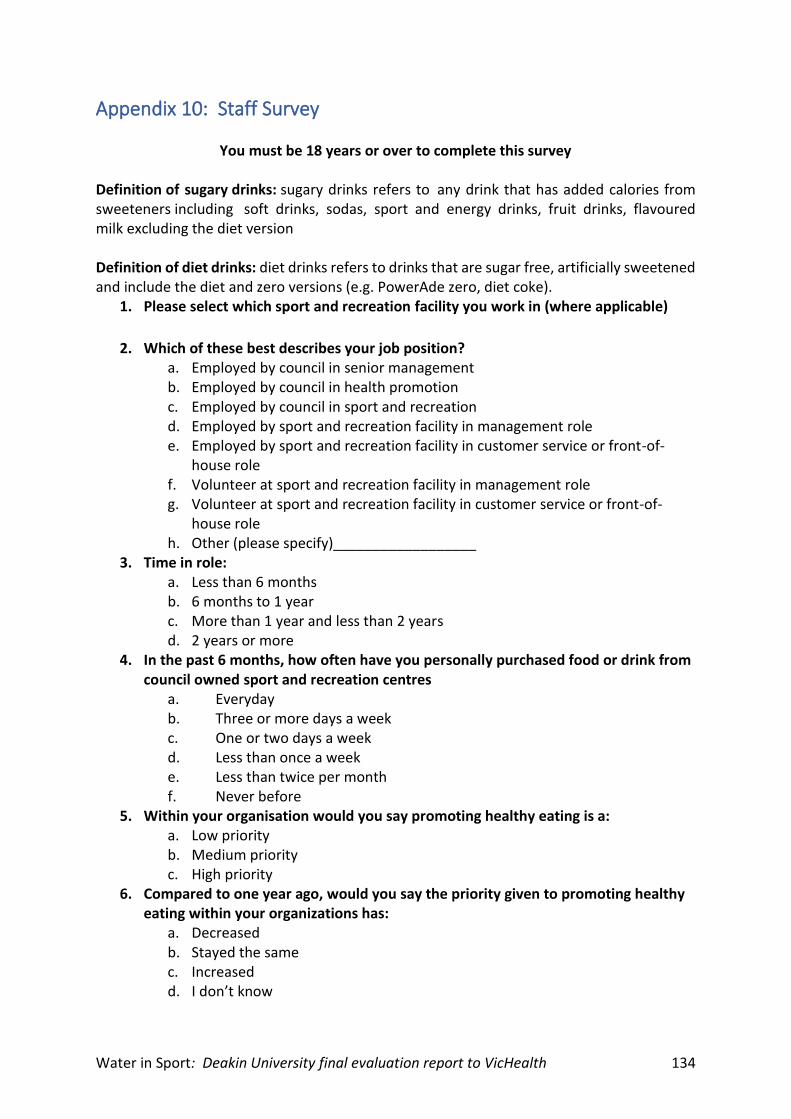
Water in Sport: Deakin University final evaluation report to VicHealth 134
Appendix 10: Staff Survey
You must be 18 years or over to complete this survey Definition of sugary drinks: sugary drinks refers to any drink that has added calories from sweeteners including soft drinks, sodas, sport and energy drinks, fruit drinks, flavoured milk excluding the diet version Definition of diet drinks: diet drinks refers to drinks that are sugar free, artificially sweetened and include the diet and zero versions (e.g. PowerAde zero, diet coke).
1. Please select which sport and recreation facility you work in (where applicable)
2. Which of these best describes your job position? a. Employed by council in senior management b. Employed by council in health promotion c. Employed by council in sport and recreation d. Employed by sport and recreation facility in management role e. Employed by sport and recreation facility in customer service or front-of-
house role f. Volunteer at sport and recreation facility in management role g. Volunteer at sport and recreation facility in customer service or front-of-
house role h. Other (please specify)__________________
3. Time in role: a. Less than 6 months b. 6 months to 1 year c. More than 1 year and less than 2 years d. 2 years or more
4. In the past 6 months, how often have you personally purchased food or drink from council owned sport and recreation centres
a. Everyday b. Three or more days a week c. One or two days a week d. Less than once a week e. Less than twice per month f. Never before
5. Within your organisation would you say promoting healthy eating is a: a. Low priority b. Medium priority c. High priority
6. Compared to one year ago, would you say the priority given to promoting healthy eating within your organizations has:
a. Decreased b. Stayed the same c. Increased d. I don’t know
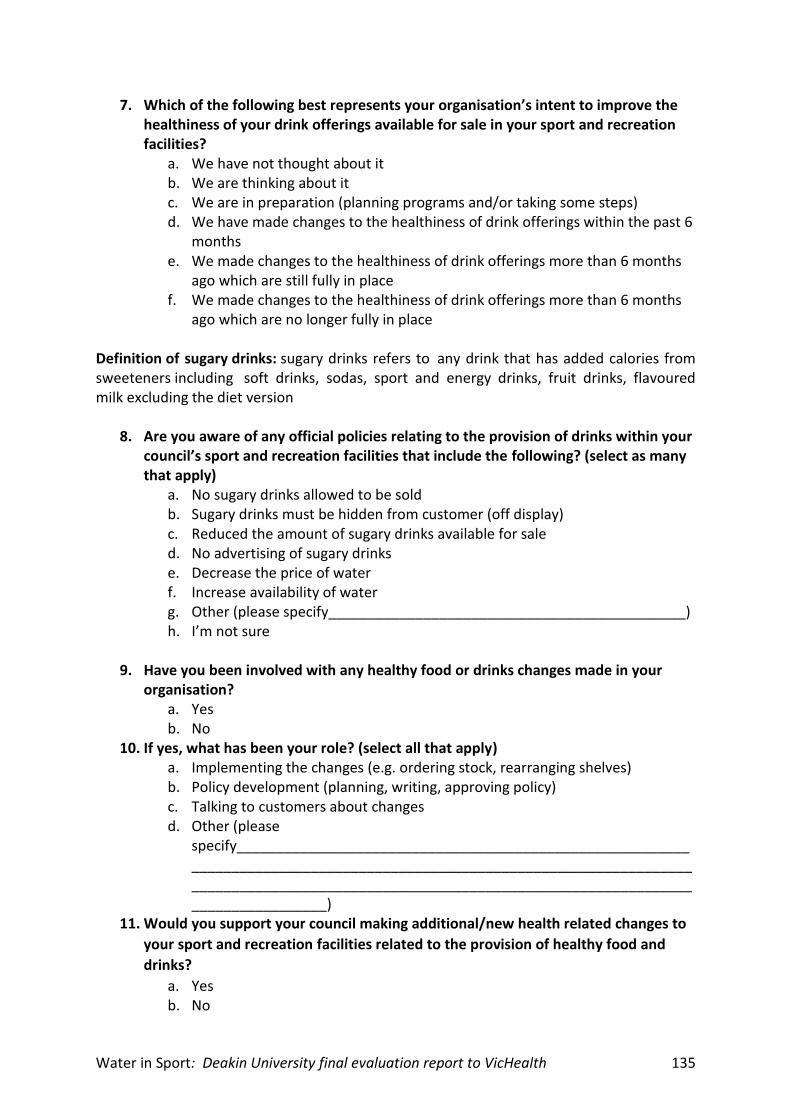
Water in Sport: Deakin University final evaluation report to VicHealth 135
7. Which of the following best represents your organisation’s intent to improve the healthiness of your drink offerings available for sale in your sport and recreation facilities?
a. We have not thought about it b. We are thinking about it c. We are in preparation (planning programs and/or taking some steps) d. We have made changes to the healthiness of drink offerings within the past 6
months e. We made changes to the healthiness of drink offerings more than 6 months
ago which are still fully in place f. We made changes to the healthiness of drink offerings more than 6 months
ago which are no longer fully in place Definition of sugary drinks: sugary drinks refers to any drink that has added calories from sweeteners including soft drinks, sodas, sport and energy drinks, fruit drinks, flavoured milk excluding the diet version
8. Are you aware of any official policies relating to the provision of drinks within your council’s sport and recreation facilities that include the following? (select as many that apply)
a. No sugary drinks allowed to be sold b. Sugary drinks must be hidden from customer (off display) c. Reduced the amount of sugary drinks available for sale d. No advertising of sugary drinks e. Decrease the price of water f. Increase availability of water g. Other (please specify_____________________________________________) h. I’m not sure
9. Have you been involved with any healthy food or drinks changes made in your
organisation? a. Yes b. No
10. If yes, what has been your role? (select all that apply) a. Implementing the changes (e.g. ordering stock, rearranging shelves) b. Policy development (planning, writing, approving policy) c. Talking to customers about changes d. Other (please
specify________________________________________________________________________________________________________________________________________________________________________________________________________)
11. Would you support your council making additional/new health related changes to
your sport and recreation facilities related to the provision of healthy food and
drinks?
a. Yes b. No
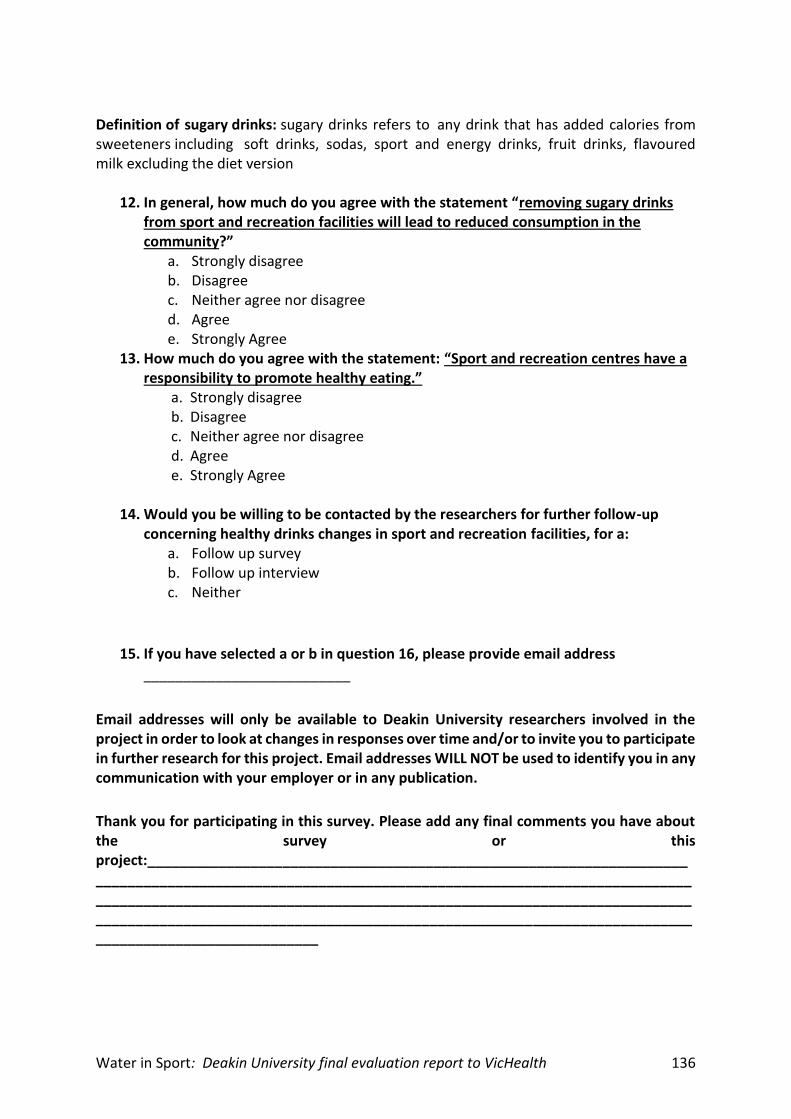
Water in Sport: Deakin University final evaluation report to VicHealth 136
Definition of sugary drinks: sugary drinks refers to any drink that has added calories from sweeteners including soft drinks, sodas, sport and energy drinks, fruit drinks, flavoured milk excluding the diet version
12. In general, how much do you agree with the statement “removing sugary drinks from sport and recreation facilities will lead to reduced consumption in the community?”
a. Strongly disagree b. Disagree c. Neither agree nor disagree d. Agree e. Strongly Agree
13. How much do you agree with the statement: “Sport and recreation centres have a responsibility to promote healthy eating.”
a. Strongly disagree b. Disagree c. Neither agree nor disagree d. Agree e. Strongly Agree
14. Would you be willing to be contacted by the researchers for further follow-up
concerning healthy drinks changes in sport and recreation facilities, for a: a. Follow up survey b. Follow up interview c. Neither
15. If you have selected a or b in question 16, please provide email address
__________________________
Email addresses will only be available to Deakin University researchers involved in the project in order to look at changes in responses over time and/or to invite you to participate in further research for this project. Email addresses WILL NOT be used to identify you in any communication with your employer or in any publication.
Thank you for participating in this survey. Please add any final comments you have about the survey or this project:_________________________________________________________________________________________________________________________________________________________________________________________________________________________________________________________________________________________________________________________________
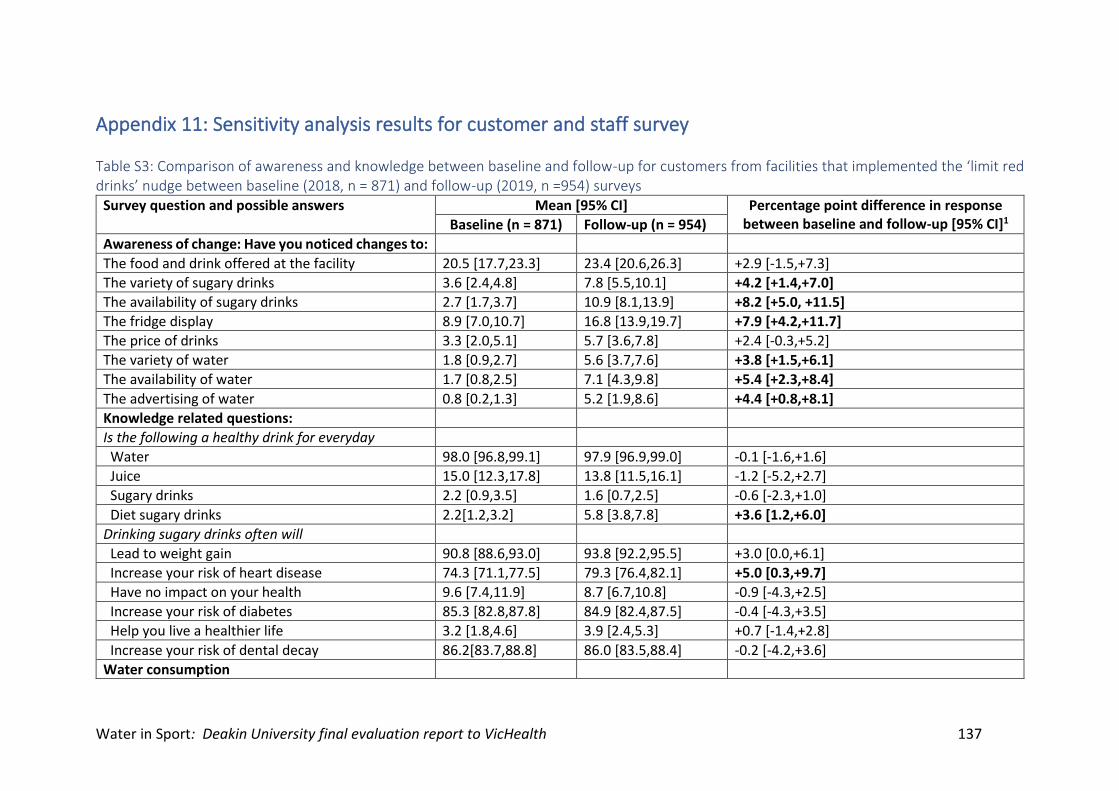
Water in Sport: Deakin University final evaluation report to VicHealth 137
Appendix 11: Sensitivity analysis results for customer and staff survey Table S3: Comparison of awareness and knowledge between baseline and follow-up for customers from facilities that implemented the ‘limit red drinks’ nudge between baseline (2018, n = 871) and follow-up (2019, n =954) surveys
Survey question and possible answers Mean [95% CI] Percentage point difference in response between baseline and follow-up [95% CI]1 Baseline (n = 871) Follow-up (n = 954)
Awareness of change: Have you noticed changes to:
The food and drink offered at the facility 20.5 [17.7,23.3] 23.4 [20.6,26.3] +2.9 [-1.5,+7.3]
The variety of sugary drinks 3.6 [2.4,4.8] 7.8 [5.5,10.1] +4.2 [+1.4,+7.0]
The availability of sugary drinks 2.7 [1.7,3.7] 10.9 [8.1,13.9] +8.2 [+5.0, +11.5]
The fridge display 8.9 [7.0,10.7] 16.8 [13.9,19.7] +7.9 [+4.2,+11.7]
The price of drinks 3.3 [2.0,5.1] 5.7 [3.6,7.8] +2.4 [-0.3,+5.2]
The variety of water 1.8 [0.9,2.7] 5.6 [3.7,7.6] +3.8 [+1.5,+6.1]
The availability of water 1.7 [0.8,2.5] 7.1 [4.3,9.8] +5.4 [+2.3,+8.4]
The advertising of water 0.8 [0.2,1.3] 5.2 [1.9,8.6] +4.4 [+0.8,+8.1]
Knowledge related questions:
Is the following a healthy drink for everyday
Water 98.0 [96.8,99.1] 97.9 [96.9,99.0] -0.1 [-1.6,+1.6]
Juice 15.0 [12.3,17.8] 13.8 [11.5,16.1] -1.2 [-5.2,+2.7]
Sugary drinks 2.2 [0.9,3.5] 1.6 [0.7,2.5] -0.6 [-2.3,+1.0]
Diet sugary drinks 2.2[1.2,3.2] 5.8 [3.8,7.8] +3.6 [1.2,+6.0]
Drinking sugary drinks often will
Lead to weight gain 90.8 [88.6,93.0] 93.8 [92.2,95.5] +3.0 [0.0,+6.1]
Increase your risk of heart disease 74.3 [71.1,77.5] 79.3 [76.4,82.1] +5.0 [0.3,+9.7]
Have no impact on your health 9.6 [7.4,11.9] 8.7 [6.7,10.8] -0.9 [-4.3,+2.5]
Increase your risk of diabetes 85.3 [82.8,87.8] 84.9 [82.4,87.5] -0.4 [-4.3,+3.5]
Help you live a healthier life 3.2 [1.8,4.6] 3.9 [2.4,5.3] +0.7 [-1.4,+2.8]
Increase your risk of dental decay 86.2[83.7,88.8] 86.0 [83.5,88.4] -0.2 [-4.2,+3.6]
Water consumption
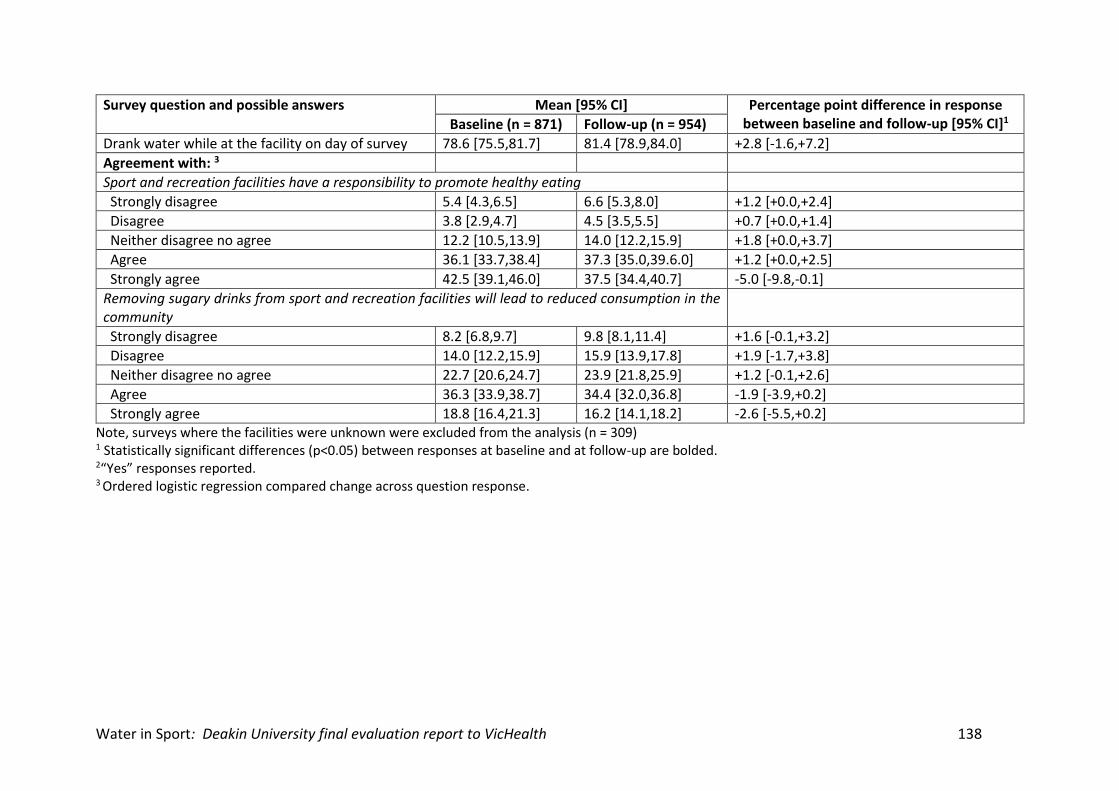
Water in Sport: Deakin University final evaluation report to VicHealth 138
Survey question and possible answers Mean [95% CI] Percentage point difference in response between baseline and follow-up [95% CI]1 Baseline (n = 871) Follow-up (n = 954)
Drank water while at the facility on day of survey 78.6 [75.5,81.7] 81.4 [78.9,84.0] +2.8 [-1.6,+7.2]
Agreement with: 3
Sport and recreation facilities have a responsibility to promote healthy eating
Strongly disagree 5.4 [4.3,6.5] 6.6 [5.3,8.0] +1.2 [+0.0,+2.4]
Disagree 3.8 [2.9,4.7] 4.5 [3.5,5.5] +0.7 [+0.0,+1.4]
Neither disagree no agree 12.2 [10.5,13.9] 14.0 [12.2,15.9] +1.8 [+0.0,+3.7]
Agree 36.1 [33.7,38.4] 37.3 [35.0,39.6.0] +1.2 [+0.0,+2.5]
Strongly agree 42.5 [39.1,46.0] 37.5 [34.4,40.7] -5.0 [-9.8,-0.1]
Removing sugary drinks from sport and recreation facilities will lead to reduced consumption in the community
Strongly disagree 8.2 [6.8,9.7] 9.8 [8.1,11.4] +1.6 [-0.1,+3.2]
Disagree 14.0 [12.2,15.9] 15.9 [13.9,17.8] +1.9 [-1.7,+3.8]
Neither disagree no agree 22.7 [20.6,24.7] 23.9 [21.8,25.9] +1.2 [-0.1,+2.6]
Agree 36.3 [33.9,38.7] 34.4 [32.0,36.8] -1.9 [-3.9,+0.2]
Strongly agree 18.8 [16.4,21.3] 16.2 [14.1,18.2] -2.6 [-5.5,+0.2] Note, surveys where the facilities were unknown were excluded from the analysis (n = 309) 1 Statistically significant differences (p<0.05) between responses at baseline and at follow-up are bolded. 2“Yes” responses reported. 3 Ordered logistic regression compared change across question response.
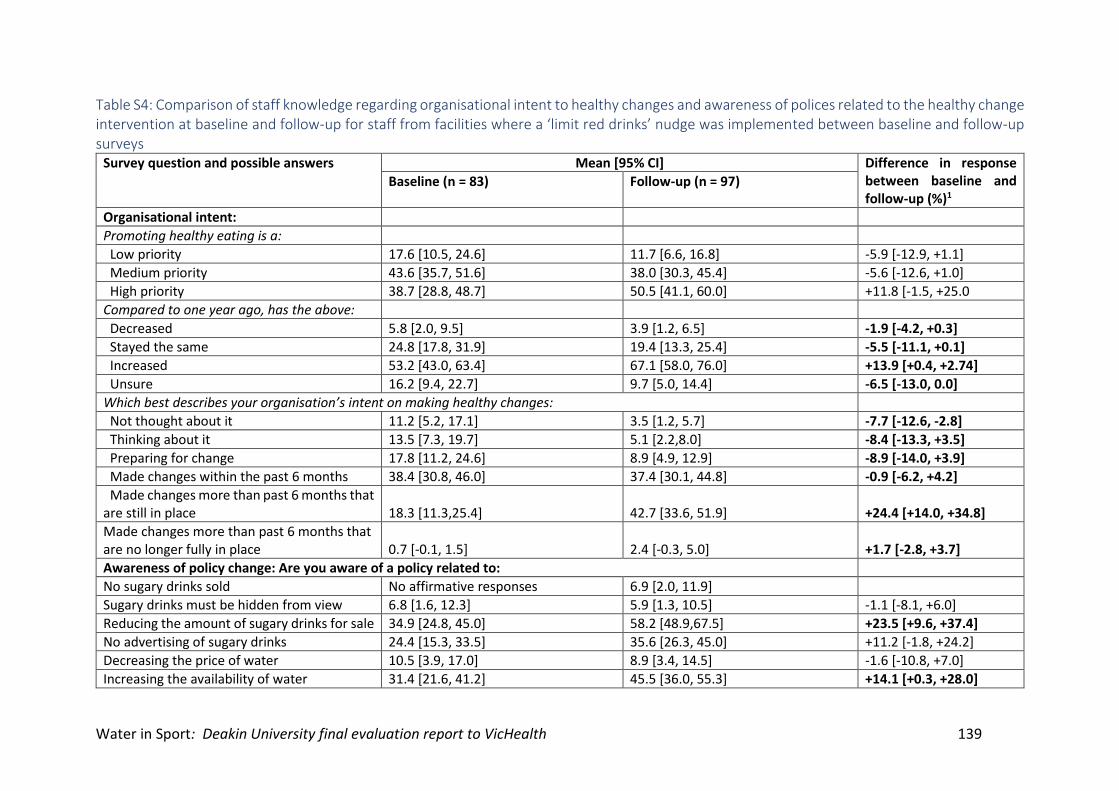
Water in Sport: Deakin University final evaluation report to VicHealth 139
Table S4: Comparison of staff knowledge regarding organisational intent to healthy changes and awareness of polices related to the healthy change intervention at baseline and follow-up for staff from facilities where a ‘limit red drinks’ nudge was implemented between baseline and follow-up surveys
Survey question and possible answers Mean [95% CI] Difference in response between baseline and follow-up (%)1
Baseline (n = 83) Follow-up (n = 97)
Organisational intent:
Promoting healthy eating is a:
Low priority 17.6 [10.5, 24.6] 11.7 [6.6, 16.8] -5.9 [-12.9, +1.1]
Medium priority 43.6 [35.7, 51.6] 38.0 [30.3, 45.4] -5.6 [-12.6, +1.0]
High priority 38.7 [28.8, 48.7] 50.5 [41.1, 60.0] +11.8 [-1.5, +25.0
Compared to one year ago, has the above:
Decreased 5.8 [2.0, 9.5] 3.9 [1.2, 6.5] -1.9 [-4.2, +0.3]
Stayed the same 24.8 [17.8, 31.9] 19.4 [13.3, 25.4] -5.5 [-11.1, +0.1]
Increased 53.2 [43.0, 63.4] 67.1 [58.0, 76.0] +13.9 [+0.4, +2.74]
Unsure 16.2 [9.4, 22.7] 9.7 [5.0, 14.4] -6.5 [-13.0, 0.0]
Which best describes your organisation’s intent on making healthy changes:
Not thought about it 11.2 [5.2, 17.1] 3.5 [1.2, 5.7] -7.7 [-12.6, -2.8]
Thinking about it 13.5 [7.3, 19.7] 5.1 [2.2,8.0] -8.4 [-13.3, +3.5]
Preparing for change 17.8 [11.2, 24.6] 8.9 [4.9, 12.9] -8.9 [-14.0, +3.9]
Made changes within the past 6 months 38.4 [30.8, 46.0] 37.4 [30.1, 44.8] -0.9 [-6.2, +4.2]
Made changes more than past 6 months that are still in place 18.3 [11.3,25.4] 42.7 [33.6, 51.9]
+24.4 [+14.0, +34.8]
Made changes more than past 6 months that are no longer fully in place 0.7 [-0.1, 1.5] 2.4 [-0.3, 5.0] +1.7 [-2.8, +3.7]
Awareness of policy change: Are you aware of a policy related to:
No sugary drinks sold No affirmative responses 6.9 [2.0, 11.9]
Sugary drinks must be hidden from view 6.8 [1.6, 12.3] 5.9 [1.3, 10.5] -1.1 [-8.1, +6.0]
Reducing the amount of sugary drinks for sale 34.9 [24.8, 45.0] 58.2 [48.9,67.5] +23.5 [+9.6, +37.4]
No advertising of sugary drinks 24.4 [15.3, 33.5] 35.6 [26.3, 45.0] +11.2 [-1.8, +24.2]
Decreasing the price of water 10.5 [3.9, 17.0] 8.9 [3.4, 14.5] -1.6 [-10.8, +7.0]
Increasing the availability of water 31.4 [21.6, 41.2] 45.5 [36.0, 55.3] +14.1 [+0.3, +28.0]
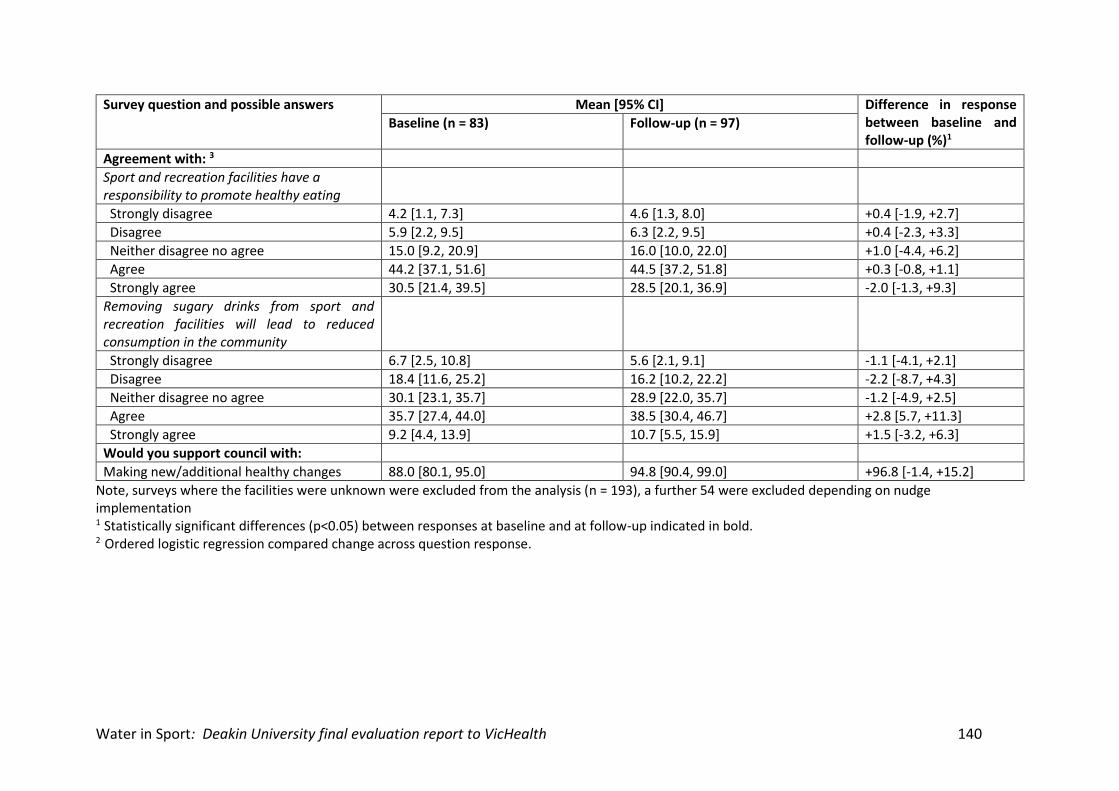
Water in Sport: Deakin University final evaluation report to VicHealth 140
Survey question and possible answers Mean [95% CI] Difference in response between baseline and follow-up (%)1
Baseline (n = 83) Follow-up (n = 97)
Agreement with: 3
Sport and recreation facilities have a responsibility to promote healthy eating
Strongly disagree 4.2 [1.1, 7.3] 4.6 [1.3, 8.0] +0.4 [-1.9, +2.7]
Disagree 5.9 [2.2, 9.5] 6.3 [2.2, 9.5] +0.4 [-2.3, +3.3]
Neither disagree no agree 15.0 [9.2, 20.9] 16.0 [10.0, 22.0] +1.0 [-4.4, +6.2]
Agree 44.2 [37.1, 51.6] 44.5 [37.2, 51.8] +0.3 [-0.8, +1.1]
Strongly agree 30.5 [21.4, 39.5] 28.5 [20.1, 36.9] -2.0 [-1.3, +9.3]
Removing sugary drinks from sport and recreation facilities will lead to reduced consumption in the community
Strongly disagree 6.7 [2.5, 10.8] 5.6 [2.1, 9.1] -1.1 [-4.1, +2.1]
Disagree 18.4 [11.6, 25.2] 16.2 [10.2, 22.2] -2.2 [-8.7, +4.3]
Neither disagree no agree 30.1 [23.1, 35.7] 28.9 [22.0, 35.7] -1.2 [-4.9, +2.5]
Agree 35.7 [27.4, 44.0] 38.5 [30.4, 46.7] +2.8 [5.7, +11.3]
Strongly agree 9.2 [4.4, 13.9] 10.7 [5.5, 15.9] +1.5 [-3.2, +6.3]
Would you support council with:
Making new/additional healthy changes 88.0 [80.1, 95.0] 94.8 [90.4, 99.0] +96.8 [-1.4, +15.2]
Note, surveys where the facilities were unknown were excluded from the analysis (n = 193), a further 54 were excluded depending on nudge implementation 1 Statistically significant differences (p<0.05) between responses at baseline and at follow-up indicated in bold. 2 Ordered logistic regression compared change across question response.
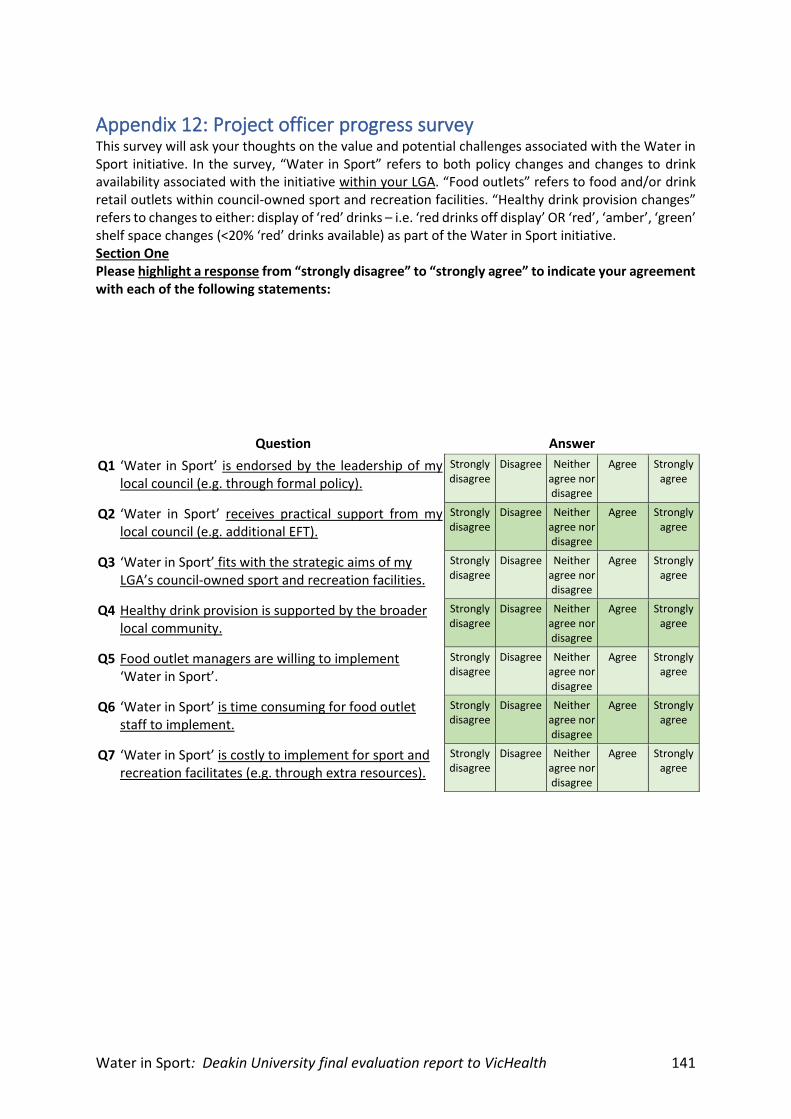
Water in Sport: Deakin University final evaluation report to VicHealth 141
Appendix 12: Project officer progress survey This survey will ask your thoughts on the value and potential challenges associated with the Water in Sport initiative. In the survey, “Water in Sport” refers to both policy changes and changes to drink availability associated with the initiative within your LGA. “Food outlets” refers to food and/or drink retail outlets within council-owned sport and recreation facilities. “Healthy drink provision changes” refers to changes to either: display of ‘red’ drinks – i.e. ‘red drinks off display’ OR ‘red’, ‘amber’, ‘green’ shelf space changes (<20% ‘red’ drinks available) as part of the Water in Sport initiative. Section One Please highlight a response from “strongly disagree” to “strongly agree” to indicate your agreement with each of the following statements:
Question Answer
Q1 ‘Water in Sport’ is endorsed by the leadership of my local council (e.g. through formal policy).
Strongly disagree
Disagree Neither agree nor disagree
Agree Strongly agree
Q2 ‘Water in Sport’ receives practical support from my local council (e.g. additional EFT).
Strongly disagree
Disagree Neither agree nor disagree
Agree Strongly agree
Q3 ‘Water in Sport’ fits with the strategic aims of my LGA’s council-owned sport and recreation facilities.
Strongly disagree
Disagree Neither agree nor disagree
Agree Strongly agree
Q4 Healthy drink provision is supported by the broader local community.
Strongly disagree
Disagree Neither agree nor disagree
Agree Strongly agree
Q5 Food outlet managers are willing to implement ‘Water in Sport’.
Strongly disagree
Disagree Neither agree nor disagree
Agree Strongly agree
Q6 ‘Water in Sport’ is time consuming for food outlet staff to implement.
Strongly disagree
Disagree Neither agree nor disagree
Agree Strongly agree
Q7 ‘Water in Sport’ is costly to implement for sport and recreation facilitates (e.g. through extra resources).
Strongly disagree
Disagree Neither agree nor disagree
Agree Strongly agree
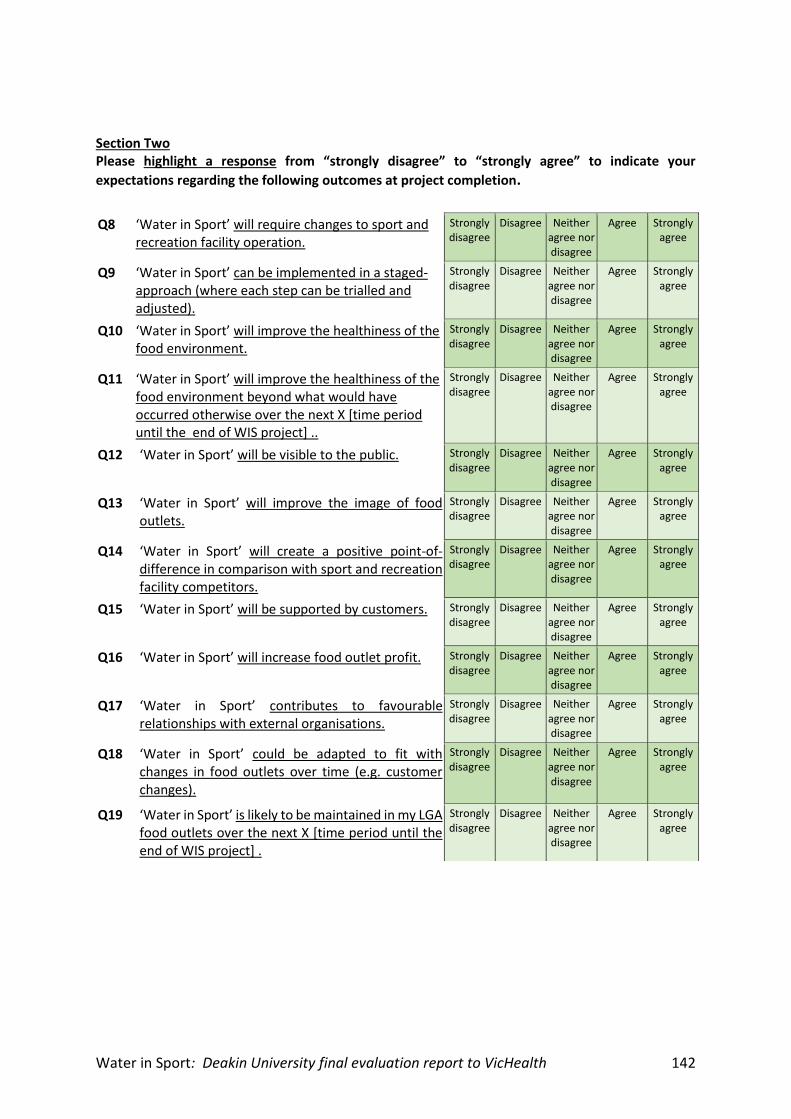
Water in Sport: Deakin University final evaluation report to VicHealth 142
Section Two Please highlight a response from “strongly disagree” to “strongly agree” to indicate your
expectations regarding the following outcomes at project completion.
Q8 ‘Water in Sport’ will require changes to sport and recreation facility operation.
Strongly disagree
Disagree Neither agree nor disagree
Agree Strongly agree
Q9 ‘Water in Sport’ can be implemented in a staged-approach (where each step can be trialled and adjusted).
Strongly disagree
Disagree Neither agree nor disagree
Agree Strongly agree
Q10 ‘Water in Sport’ will improve the healthiness of the food environment.
Strongly disagree
Disagree Neither agree nor disagree
Agree Strongly agree
Q11 ‘Water in Sport’ will improve the healthiness of the food environment beyond what would have occurred otherwise over the next X [time period until the end of WIS project] ..
Strongly disagree
Disagree Neither agree nor disagree
Agree Strongly agree
Q12 ‘Water in Sport’ will be visible to the public. Strongly disagree
Disagree Neither agree nor disagree
Agree Strongly agree
Q13 ‘Water in Sport’ will improve the image of food outlets.
Strongly disagree
Disagree Neither agree nor disagree
Agree Strongly agree
Q14 ‘Water in Sport’ will create a positive point-of-difference in comparison with sport and recreation facility competitors.
Strongly disagree
Disagree Neither agree nor disagree
Agree Strongly agree
Q15 ‘Water in Sport’ will be supported by customers. Strongly disagree
Disagree Neither agree nor disagree
Agree Strongly agree
Q16 ‘Water in Sport’ will increase food outlet profit. Strongly disagree
Disagree Neither agree nor disagree
Agree Strongly agree
Q17 ‘Water in Sport’ contributes to favourable relationships with external organisations.
Strongly disagree
Disagree Neither agree nor disagree
Agree Strongly agree
Q18 ‘Water in Sport’ could be adapted to fit with changes in food outlets over time (e.g. customer changes).
Strongly disagree
Disagree Neither agree nor disagree
Agree Strongly agree
Q19 ‘Water in Sport’ is likely to be maintained in my LGA food outlets over the next X [time period until the end of WIS project] .
Strongly disagree
Disagree Neither agree nor disagree
Agree Strongly agree
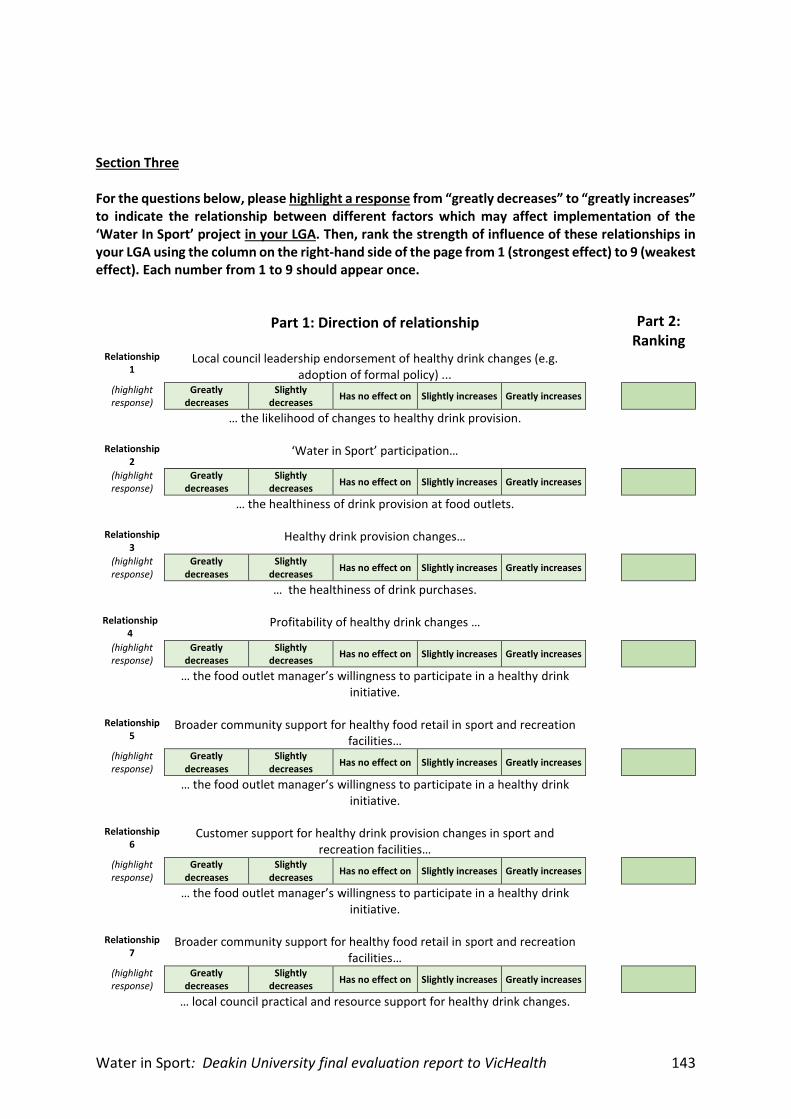
Water in Sport: Deakin University final evaluation report to VicHealth 143
Section Three For the questions below, please highlight a response from “greatly decreases” to “greatly increases” to indicate the relationship between different factors which may affect implementation of the ‘Water In Sport’ project in your LGA. Then, rank the strength of influence of these relationships in your LGA using the column on the right-hand side of the page from 1 (strongest effect) to 9 (weakest effect). Each number from 1 to 9 should appear once.
Part 1: Direction of relationship
Part 2: Ranking
Relationship 1
Local council leadership endorsement of healthy drink changes (e.g. adoption of formal policy) ...
(highlight response)
Greatly decreases
Slightly decreases
Has no effect on Slightly increases Greatly increases
… the likelihood of changes to healthy drink provision.
Relationship 2
‘Water in Sport’ participation…
(highlight response)
Greatly decreases
Slightly decreases
Has no effect on Slightly increases Greatly increases
… the healthiness of drink provision at food outlets.
Relationship 3
Healthy drink provision changes…
(highlight response)
Greatly decreases
Slightly decreases
Has no effect on Slightly increases Greatly increases
… the healthiness of drink purchases.
Relationship 4
Profitability of healthy drink changes …
(highlight response)
Greatly decreases
Slightly decreases
Has no effect on Slightly increases Greatly increases
… the food outlet manager’s willingness to participate in a healthy drink initiative.
Relationship
5 Broader community support for healthy food retail in sport and recreation
facilities…
(highlight response)
Greatly decreases
Slightly decreases
Has no effect on Slightly increases Greatly increases
… the food outlet manager’s willingness to participate in a healthy drink initiative.
Relationship
6 Customer support for healthy drink provision changes in sport and
recreation facilities…
(highlight response)
Greatly decreases
Slightly decreases
Has no effect on Slightly increases Greatly increases
… the food outlet manager’s willingness to participate in a healthy drink initiative.
Relationship
7 Broader community support for healthy food retail in sport and recreation
facilities…
(highlight response)
Greatly decreases
Slightly decreases
Has no effect on Slightly increases Greatly increases
… local council practical and resource support for healthy drink changes.
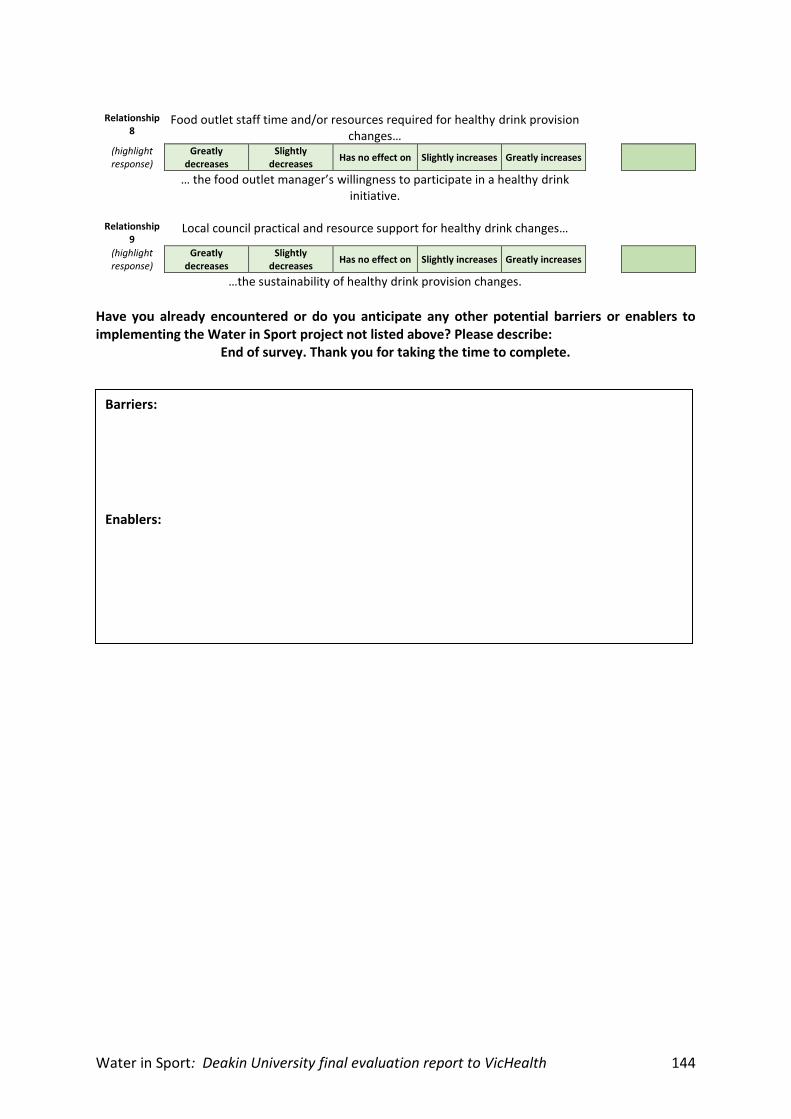
Water in Sport: Deakin University final evaluation report to VicHealth 144
Relationship
8 Food outlet staff time and/or resources required for healthy drink provision
changes…
(highlight response)
Greatly decreases
Slightly decreases
Has no effect on Slightly increases Greatly increases
… the food outlet manager’s willingness to participate in a healthy drink initiative.
Relationship
9 Local council practical and resource support for healthy drink changes…
(highlight response)
Greatly decreases
Slightly decreases
Has no effect on Slightly increases Greatly increases
…the sustainability of healthy drink provision changes.
Have you already encountered or do you anticipate any other potential barriers or enablers to implementing the Water in Sport project not listed above? Please describe:
End of survey. Thank you for taking the time to complete.
Barriers:
Enablers:
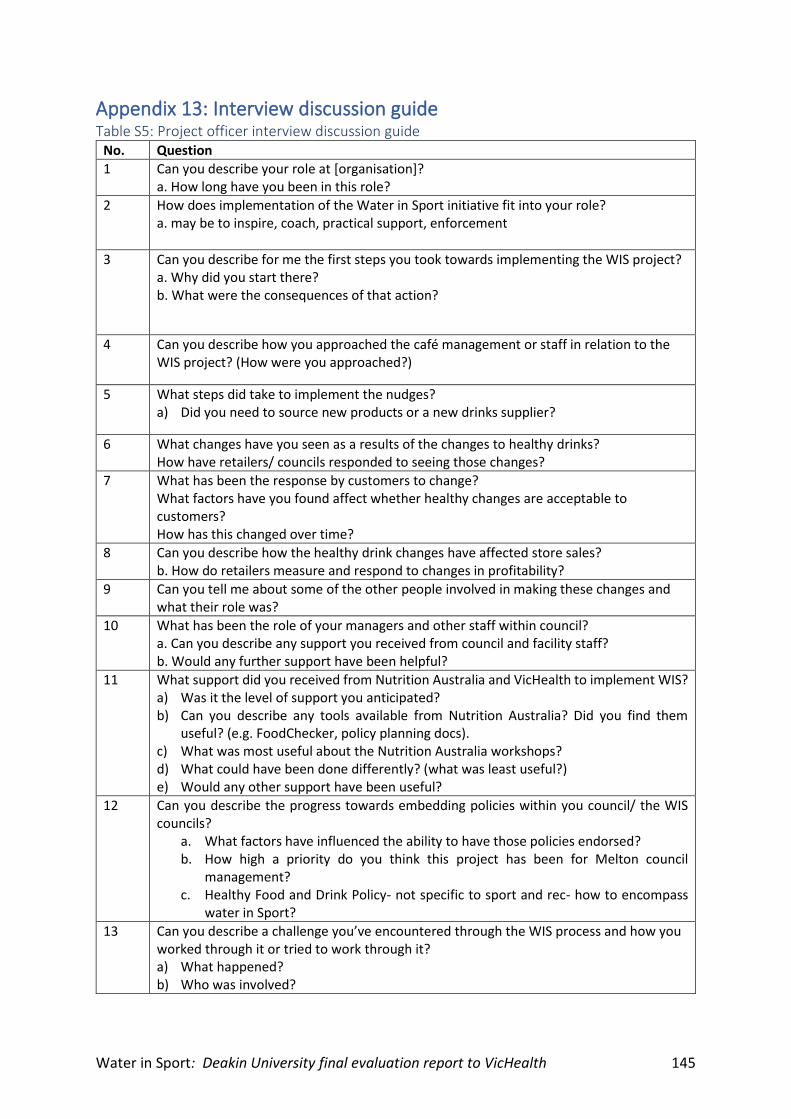
Water in Sport: Deakin University final evaluation report to VicHealth 145
Appendix 13: Interview discussion guide Table S5: Project officer interview discussion guide
No. Question
1 Can you describe your role at [organisation]? a. How long have you been in this role?
2 How does implementation of the Water in Sport initiative fit into your role? a. may be to inspire, coach, practical support, enforcement
3 Can you describe for me the first steps you took towards implementing the WIS project? a. Why did you start there? b. What were the consequences of that action?
4 Can you describe how you approached the café management or staff in relation to the WIS project? (How were you approached?)
5 What steps did take to implement the nudges? a) Did you need to source new products or a new drinks supplier?
6 What changes have you seen as a results of the changes to healthy drinks? How have retailers/ councils responded to seeing those changes?
7 What has been the response by customers to change? What factors have you found affect whether healthy changes are acceptable to customers? How has this changed over time?
8 Can you describe how the healthy drink changes have affected store sales? b. How do retailers measure and respond to changes in profitability?
9 Can you tell me about some of the other people involved in making these changes and what their role was?
10 What has been the role of your managers and other staff within council? a. Can you describe any support you received from council and facility staff? b. Would any further support have been helpful?
11 What support did you received from Nutrition Australia and VicHealth to implement WIS? a) Was it the level of support you anticipated? b) Can you describe any tools available from Nutrition Australia? Did you find them
useful? (e.g. FoodChecker, policy planning docs). c) What was most useful about the Nutrition Australia workshops? d) What could have been done differently? (what was least useful?) e) Would any other support have been useful?
12 Can you describe the progress towards embedding policies within you council/ the WIS councils?
a. What factors have influenced the ability to have those policies endorsed? b. How high a priority do you think this project has been for Melton council
management? c. Healthy Food and Drink Policy- not specific to sport and rec- how to encompass
water in Sport?
13 Can you describe a challenge you’ve encountered through the WIS process and how you worked through it or tried to work through it? a) What happened? b) Who was involved?
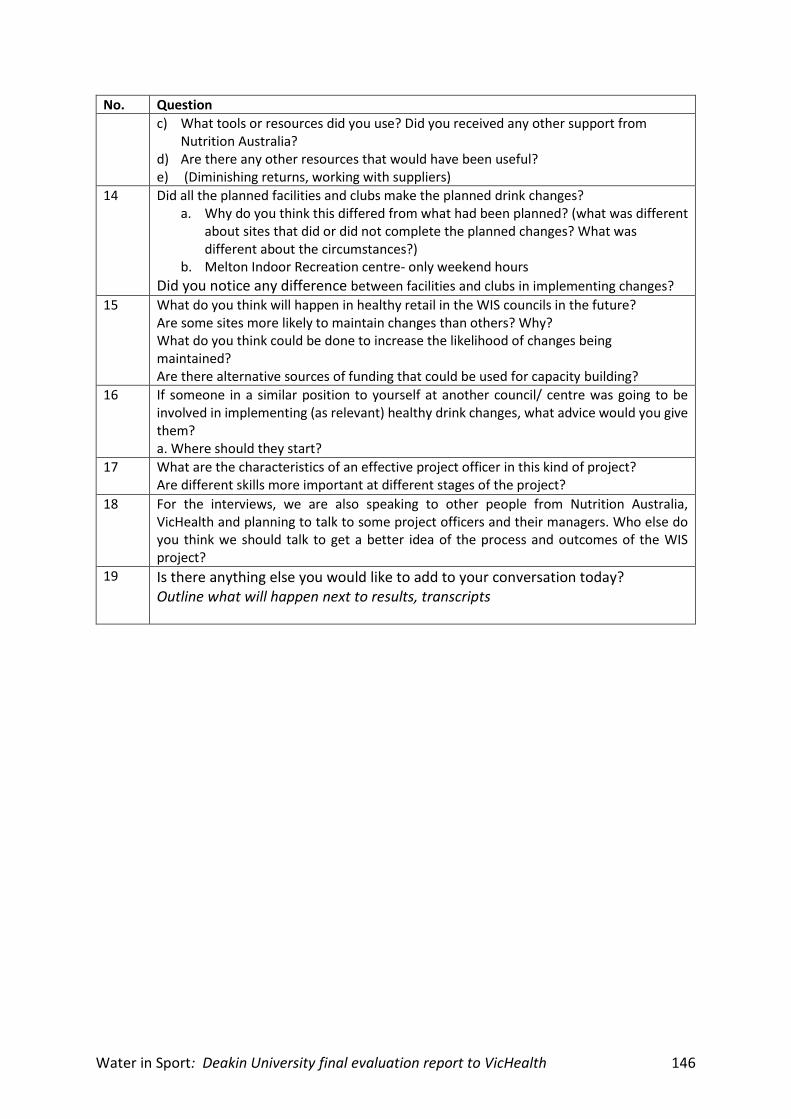
Water in Sport: Deakin University final evaluation report to VicHealth 146
No. Question
c) What tools or resources did you use? Did you received any other support from Nutrition Australia?
d) Are there any other resources that would have been useful? e) (Diminishing returns, working with suppliers)
14 Did all the planned facilities and clubs make the planned drink changes? a. Why do you think this differed from what had been planned? (what was different
about sites that did or did not complete the planned changes? What was different about the circumstances?)
b. Melton Indoor Recreation centre- only weekend hours
Did you notice any difference between facilities and clubs in implementing changes?
15 What do you think will happen in healthy retail in the WIS councils in the future? Are some sites more likely to maintain changes than others? Why? What do you think could be done to increase the likelihood of changes being maintained? Are there alternative sources of funding that could be used for capacity building?
16 If someone in a similar position to yourself at another council/ centre was going to be involved in implementing (as relevant) healthy drink changes, what advice would you give them? a. Where should they start?
17 What are the characteristics of an effective project officer in this kind of project? Are different skills more important at different stages of the project?
18 For the interviews, we are also speaking to other people from Nutrition Australia, VicHealth and planning to talk to some project officers and their managers. Who else do you think we should talk to get a better idea of the process and outcomes of the WIS project?
19 Is there anything else you would like to add to your conversation today? Outline what will happen next to results, transcripts
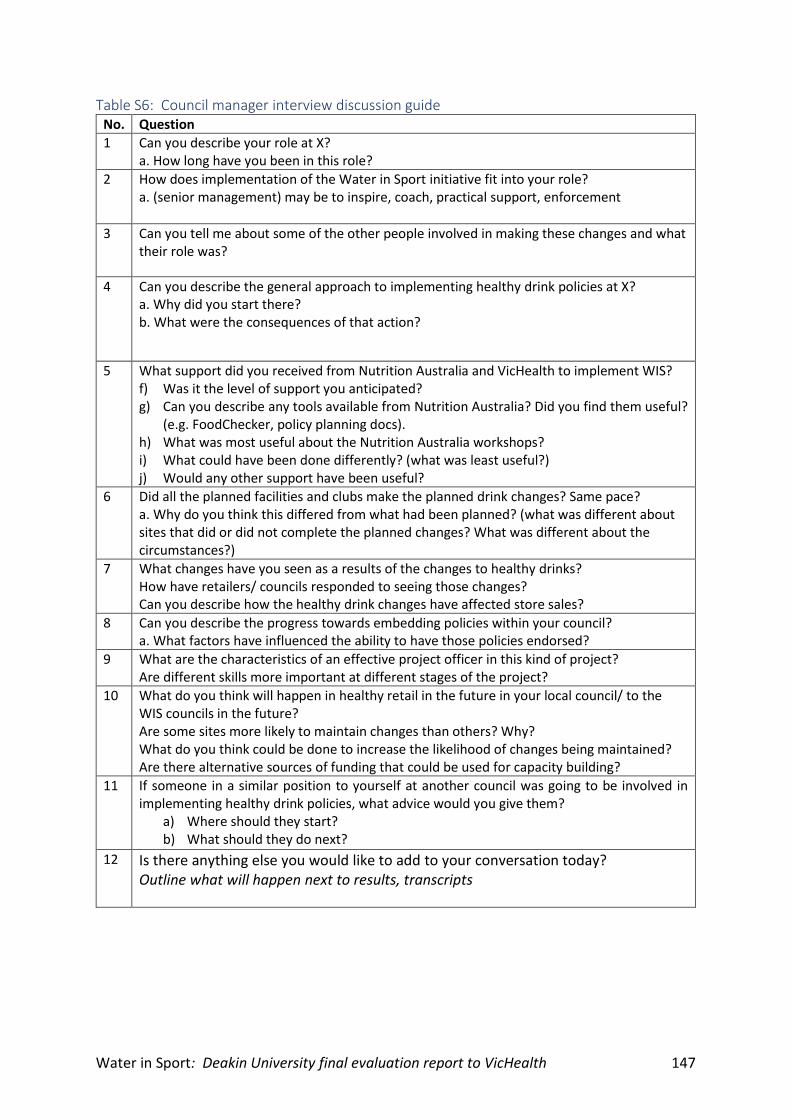
Water in Sport: Deakin University final evaluation report to VicHealth 147
Table S6: Council manager interview discussion guide No. Question
1 Can you describe your role at X? a. How long have you been in this role?
2 How does implementation of the Water in Sport initiative fit into your role? a. (senior management) may be to inspire, coach, practical support, enforcement
3 Can you tell me about some of the other people involved in making these changes and what their role was?
4 Can you describe the general approach to implementing healthy drink policies at X? a. Why did you start there? b. What were the consequences of that action?
5 What support did you received from Nutrition Australia and VicHealth to implement WIS? f) Was it the level of support you anticipated? g) Can you describe any tools available from Nutrition Australia? Did you find them useful?
(e.g. FoodChecker, policy planning docs). h) What was most useful about the Nutrition Australia workshops? i) What could have been done differently? (what was least useful?) j) Would any other support have been useful?
6 Did all the planned facilities and clubs make the planned drink changes? Same pace? a. Why do you think this differed from what had been planned? (what was different about sites that did or did not complete the planned changes? What was different about the circumstances?)
7 What changes have you seen as a results of the changes to healthy drinks? How have retailers/ councils responded to seeing those changes? Can you describe how the healthy drink changes have affected store sales?
8 Can you describe the progress towards embedding policies within your council? a. What factors have influenced the ability to have those policies endorsed?
9 What are the characteristics of an effective project officer in this kind of project? Are different skills more important at different stages of the project?
10 What do you think will happen in healthy retail in the future in your local council/ to the WIS councils in the future? Are some sites more likely to maintain changes than others? Why? What do you think could be done to increase the likelihood of changes being maintained? Are there alternative sources of funding that could be used for capacity building?
11 If someone in a similar position to yourself at another council was going to be involved in implementing healthy drink policies, what advice would you give them?
a) Where should they start? b) What should they do next?
12 Is there anything else you would like to add to your conversation today? Outline what will happen next to results, transcripts

Water in Sport: Deakin University final evaluation report to VicHealth 148
Related Documents